sorption and transport of gases and organic … · sorption and transport of gases and organic...
TRANSCRIPT
The Dissertation Committee for Sushil Naresh Dhoot certifies that this is the approved
version of the following dissertation:
SORPTION AND TRANSPORT OF GASES AND ORGANIC
VAPORS IN POLY(ETHYLENE TEREPHTHALATE)
Committee:
Benny D. Freeman, Supervisor
Donald R. Paul
Isaac C. Sanchez
R. Bruce Eldridge
Mark E. Stewart

SORPTION AND TRANSPORT OF GASES AND ORGANIC
VAPORS IN POLY(ETHYLENE TEREPHTHALATE)
by
Sushil Naresh Dhoot, B.S., M.S.
Dissertation
Presented to the Faculty of the Graduate School of
The University of Texas at Austin
In Partial Fulfillment
Of the Requirements
For the Degree of
Doctor of Philosophy
The University of Texas at Austin
May 2004
DEDICATION
This dissertation is dedicated to my parents, Sudha and Naresh Dhoot, and
to the rest of my family for their constant love, encouragement, and support.
iv
ACKNOWLEDGMENTS
I wish to thank my advisor, Dr. Benny Freeman, my industrial mentor at Eastman
Chemicals, Dr. Mark Stewart, and the other committee members: Dr. Donald Paul, Dr.
Isaac Sanchez, and Dr. Bruce Eldridge, for assistance over the course of my graduate
studies at North Carolina State University and The University of Texas at Austin.
In addition, I would like to thank the Eastman Chemical Analytical Laboratories
for performing some characterization experiments, and in particular, Dr. Craig Sass and
Rick McGill, for their assistance with the wide angle X-ray diffraction measurements. I
would also like to thank Dr. Anita Hill at CSIRO in Australia for performing the positron
annihilation lifetime spectroscopy experiments reported in this dissertation.
The past and present graduate students of the Freeman Polymer Research Group
are also thanked for their technical assistance, support, and patience: Rajeev Prabhakar,
Haiqing Lin, George Serad, Dr. Timothy Merkel, Sabrina Dixon-Garrett, Nikunj Patel,
Conor Braman, Scott Kelman, Scott Matteuci, Roy Raharjo; and the group’s post-
doctoral researchers: Dr. Kazukiyo Nagai, Dr. Hyuck Jai Lee and Dr. Teruhiko Kai. I am
especially thankful to three colleagues and friends, who were always available as a
supportive ear during the highs and lows of research and ready to engage in endless
discussions about anything on our minds: Dr. Lora Toy, Dr. Michelle Arnold, and Anna
Iwasinska.
Finally, I would like to thank my family for their love, support, and understanding
during my graduate studies.
v
SORPTION AND TRANSPORT OF GASES AND ORGANIC
VAPORS IN POLY(ETHYLENE TEREPHTHALATE)
Publication No.
Sushil Naresh Dhoot, Ph.D.
The University of Texas at Austin, 2004
Supervisor: Benny D. Freeman
Poly(ethylene terephthalate) (PET) is one of the most widely used barrier
polymers for food and beverage packaging. The sorption and transport of organic
molecules in PET are important considerations in flavor scalping, carryover,
contamination, and therefore, container shelf life. However, literature data on transport
properties of large flavor and aroma compounds in PET are limited due to their extremely
low vapor pressures and long experimental timescales. The goal of this research project is
to develop a systematic database of sorption and transport properties of large organic
compounds in PET by overcoming these technical challenges.
Ultra-thin (0.9 µm thick) biaxially oriented PET films were used to overcome the
drawback of long experimental timescales. Several model flavor compounds (i.e., low
molecular weight analogs of common flavor compounds) were selected from various
classes of non-polar and polar organic compounds to study the effect of penetrant size,
shape, and thermodynamic properties on solubility and diffusivity in PET. For example,
vi
n-butane, i-butane, n-pentane, and i-pentane were selected to study the effect of chain
length and branching in non-polar alkane hydrocarbons; acetone, methyl ethyl ketone
(MEK), methyl n-propyl ketone (MnPK), and methyl i-propyl ketone (MiPK) from the
family of ketones, and methyl acetate and ethyl acetate from the family of esters, were
also studied to provide a similar series of data for polar organic model flavor compounds.
To overcome the drawback of extremely low vapor pressures of large organic
compounds, a new experimental sorption technique was developed. It is estimated that
penetrants with vapor pressures as low as 10-7 mmHg might be studied using this
technique. It could be useful in industrial applications involving polymer membrane-
based gas/vapor separations and food packaging. The solubility and diffusion coefficients
of toluene vapor in PET were obtained using this technique.
Interestingly, the solubility difference between n-pentane and i-pentane is 10
times larger in glassy PET than in rubbery low-density polyethylene. Among the ketones
and esters studied, both solubility and diffusivity decrease in the following order, acetone
> MEK > MnPK > MiPK and methyl acetate > ethyl acetate. The diffusion coefficients
of MiPK and i-pentane are among the lowest ever reported for PET. Surprisingly,
diffusion coefficients of acetone and methyl acetate, and MEK and ethyl acetate are quite
similar despite the esters being somewhat larger than ketones. For all penetrants studied,
solubility and diffusion coefficients correlate well with penetrant critical temperature and
critical volume, respectively. By extending these correlations, it might be possible to
predict the sorption and transport properties of large flavor compounds in PET with
reasonable accuracy.
vii
TABLE OF CONTENTS
Page
LIST OF TABLES………………………………………………………………….xii
LIST OF FIGURES………………………………………………………………... xv
CHAPTER 1 INTRODUCTION………………………………………………... 1
1.1 Glassy Poly(ethylene terephthalate)…………………………………. 2
1.2 Overview of Sorption and Transport of Small Molecules in
Polymers…………………………..………..………………………… 4
1.2.1 Solubility……………………………………………………... 4
1.2.2 Effect of Penetrant Partial Pressure on Solubility……………. 5
1.2.3 Diffusivity……………………………………………………. 7
1.3 Overview of Fickian and non-Fickian Kinetics……………………….9
1.4 Goals and Organization of This Research……………………………10
CHAPTER 2 BARRIER POLYMERS…………………………………………22
2.1 Summary……………………………………………………………..23
2.2 Introduction…………………………………………………………..24
2.3 Fundamentals of Permeation in Polymers……………………………25
2.4 Mechanism of Penetrant Transport in Dense Polymers……………...29
2.5 Factors Affecting Permeability, Diffusivity, and Solubility…………32
2.5.1 Free Volume…………………………………………………..32
2.5.2 Temperature…………………………………………………...35
2.5.3 Chemical Structure……………………………………………37
2.5.4 Crystallinity…………………………………………………...39
2.5.5 Chain Orientation……………………………………………..42
2.5.6 Penetrant Concentration (or Partial Pressure)………………...44
2.5.7 Humidity………………………………………………………45
viii
Page
2.6 Techniques for Measuring Transport Properties……………………..46
2.6.1 Oxygen and Carbon Dioxide Permeation……………………..48
2.6.2 Water Vapor Permeation……………………………………...49
2.6.3 Flavor and Aroma Compounds………………………………..50
2.7 Techniques for Predicting Transport Properties……………………...52
2.7.1 Modeling Transport Properties of Gases and
Condensable Vapors in Polymers……………………………..52
2.7.2 ‘Migration Modeling’ of Polymer Additives into
Packaged Foods and Beverages……………………………….59
2.8 Chemical Structures and Properties of Barrier Polymers…………… 62
2.8.1 High Barrier Polymers……………………………………….. 62
2.8.2 Moderate Barrier Polymers…………………………………...73
2.9 Improving Barrier Properties of Polymers………………………….. 82
2.9.1 Barrier Structures…………………………………………….. 82
2.9.2 Oxygen-Scavenging Systems…………………………………92
2.10 Conclusions…………………………………………………………..95
CHAPTER 3 EXPERIMENTAL TECHNIQUES AND SAMPLE
CHARACTERIZATION RESULTS…………………………...143
3.1 Materials…………………………………………………………….144
3.2 Gravimetric Sorption………………………………………………..144
3.3 Dual Volume Pressure Decay Sorption……………………………. 146
3.4 Polymer Characterization Techniques……………………………... 147
3.4.1 Nuclear Magnetic Resonance Spectroscopy………………... 147
3.4.2 Inherent Viscosity……………………………………………147
3.4.3 Thermal and Physical Characterization……………………...147
3.4.4 Positron Annihilation Lifetime Spectroscopy……………….148
3.4.5 Profilometry………………………………………………….149
ix
Page
3.5 Polymer Characterization Results and Discussion………………….150
3.5.1 Inherent Viscosity, Nuclear Magnetic Resonance, and
Profilometry………………………………………………….150
3.5.2 Sample Morphology…………………………………………150
CHAPTER 4 NOVEL EXPERIMENTAL TECHNIQUE FOR KINETIC
GRAVIMETRIC SORPTION OF LOW VOLATILITY
GASES AND ORGANIC VAPORS IN POLYMERS…………165
4.1 Summary……………………………………………………………166
4.2 Introduction…………………………………………………………166
4.3 Principle of Operation………………………………………………169
4.4 Experimental Results………………………………………………. 172
4.5 Discussion…………………………………………………………..179
4.6 Acknowledgments…………………………………………………..180
CHAPTER 5 SORPTION AND TRANSPORT OF LINEAR ALKANE
HYDROCARBONS IN BIAXIALLY ORIENTED
POLY(ETHYLENE TEREPHTHALATE)…………………….189
5.1 Summary……………………………………………………………190
5.2 Experimental………………………………………………………..190
5.2.1 Materials……………………………………………………..190
5.2.2 Gravimetric Sorption………………………………………...191
5.3 Results and Discussion……………………………………………...191
5.3.1 Equilibrium n-Butane and n-Pentane Uptake………………..191
5.3.2 n-Butane and n-Pentane Sorption Kinetics…………………..196
5.4 Conclusions…………………………………………………………202
x
Page
CHAPTER 6 SORPTION AND TRANSPORT OF LINEAR AND
BRANCHED KETONES IN BIAXIALLY ORIENTED
POLY(ETHYLENE TEREPHTHALATE)…………………….214
6.1 Summary……………………………………………………………215
6.2 Experimental………………………………………………………..215
6.2.1 Materials……………………………………………………..215
6.2.2 Gravimetric Sorption………………………………………...216
6.3 Results and Discussion……………………………………………...216
6.3.1 Equilibrium Uptake of Ketones in PET……………………...216
6.3.2 Sorption Kinetics of Ketones in PET………………………...221
6.4 Conclusions…………………………………………………………227
CHAPTER 7 SORPTION AND TRANSPORT OF LINEAR ESTERS
AND BRANCHED ALKANES IN BIAXIALLY
ORIENTED POLY(ETHYLENE TEREPHTHALATE)………245
7.1 Summary……………………………………………………………246
7.2 Experimental………………………………………………………..247
7.2.1 Materials……………………………………………………..247
7.2.2 Gravimetric Sorption………………………………………...247
7.3 Results and Discussion……………………………………………...248
7.3.1 Equilibrium Uptake of Alkanes in PET……………………...248
7.3.2 Equilibrium Uptake of Esters in PET………………………..252
7.3.3 Sorption Kinetics of Alkanes and Esters in PET…………….256
7.4 Conclusions…………………………………………………………261
Appendix 7A………………………………………………………..263
xi
Page
CHAPTER 8 SORPTION AND DIFFUSION OF TOLUENE AND
CO2 IN BIAXIALLY ORIENTED POLY(ETHYLENE
TEREPHTHALATE)…………………………………………...283
8.1 Summary…………………………………………………………....284
8.2 Introduction…………………………………………………………284
8.3 Experimental………………………………………………………..286
8.3.1 Materials……………………………………………………..286
8.3.2 Gravimetric Sorption………………………………………...287
8.3.3 Dual Volume Pressure Decay Sorption……………………...287
8.4 Results and Discussion……………………………………………...287
8.4.1 Equilibrium Uptake and Sorption Kinetics of Toluene
in PET………………………………………………………..287
8.4.2 Equilibrium Uptake and Sorption Kinetics of CO2 in PET….290
8.5 Conclusions…………………………………………………………297
8.6 Acknowledgments…………………………………………………..298
CHAPTER 9 CONCLUSIONS AND RECOMMENDATIONS…………….. 311
9.1 Summary of Conclusions…………………………………………...312
9.2 Recommendations for Future Work………………………………...316
9.2.1 Solubility and Diffusivity Correlations……………………...316
9.2.2 New Gravimetric Sorption Technique for Low Volatility
Organic Vapors……………………………………………... 317
9.2.3 Solvent-Induced Crystallization of Amorphous PET………..318
9.2.4 Effect of Processing Conditions on Sorption and
Transport Properties of PET…………………………………319
BIBLIOGRAPHY…………………………………………………………………322
VITA………………………………………………………………………………..345
xii
LIST OF TABLESPage
CHAPTER 1
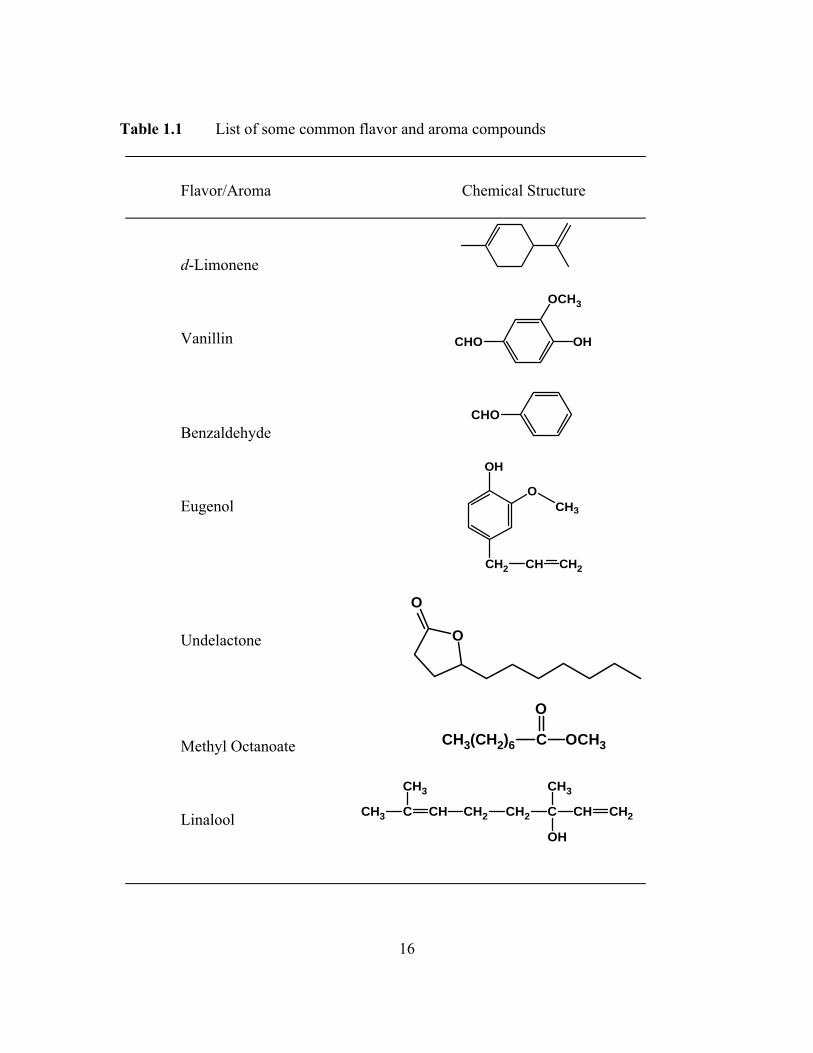
Table 1.1 List of some common flavor and aroma compounds………………...16
CHAPTER 2
Table 2.1 Table of common gas permeability units with conversionfactors………………………………………………………………...97
Table 2.2 Table of common water vapor transmission rate (WVTR) unitswith conversion factors………………………………………………99
Table 2.3 Effect of orientation on oxygen permeability characteristics ofsemicrystalline and amorphous barrier resins…………………..…..100
Table 2.4 Physical, mechanical, optical, and chemical properties of somecommonly used barrier polymers…………………………………...102
Table 2.5 Oxygen and carbon dioxide permeabilities of various high andmoderate barrier polymers……………………………………. ……103
Table 2.6 Water vapor transmission rates of various high and moderatebarrier polymers…………………………………………………….105
Table 2.7 Permeability, diffusivity, and solubility coefficients of flavorand aroma compounds in various high and moderate barrierpolymers at 25°C and 0% RH………………………………………106
Table 2.8 Compositions of commercial, high barrier nitrile copolymers……..109
Table 2.9 Comparison of properties of biaxially oriented LCP and PETfilms…………………………………………………………………110
Table 2.10 Gas permeabilities of LCP-PET blends……………………………. 111
CHAPTER 3
Table 3.1 Positron annihilation lifetime spectroscopy (PALS) parametersfor biaxially oriented PET (BPET) and amorphous PET(APET) samples……………………………………………….……159
xiii
PageCHAPTER 4
Table 4.1 Gas chromatograph settings………………………………………...181
Table 4.2 Mass flow rates, total pressures, and corresponding toluenevapor mole fractions in mixtures with nitrogen at 25°C………..…..182
CHAPTER 5
Table 5.1 Positron annihilation lifetime spectroscopy (PALS) parametersfor BPET and APET samples…………………………………..…...203
Table 5.2 Dual-mode model parameters for n-butane and n-pentanesorption in BPET and n-butane sorption in APET at 35°C…….…...204
CHAPTER 6
Table 6.1 Chemical structures, critical properties, solubility parameters,and saturation vapor pressures at 35°C of acetone, MEK,MiPK, and MnPK…………………………………………………...228
Table 6.2 Dual-mode model parameters for acetone, MEK, MnPK, andMiPK sorption in BPET and acetone sorption in solvent-castPET (SPET) at 35°C………………………………………………...229
Table 6.3 D∞ and w values for acetone, MEK, MnPK, and MiPK at 35°C.…...230
CHAPTER 7
Table 7.1 Chemical structure, critical properties, solubility parameters,and saturation vapor pressures at 35°C of linear and branchedalkane hydrocarbons and esters………………………………...…...265
Table 7.2 Dual-mode and Flory-Huggins model parameters for linear andbranched alkane hydrocarbons and esters in BPET at 35°C.The model parameters for n-butane and n-pentane wereobtained from the literature……………………………………..…..266
Table 7.3 Hansen solubility parameters, critical volumes, and dipolemoments of acetone, methyl ethyl ketone, methyl acetate, andethyl acetate…………………………………………………….…...267
xiv
PageTable 7.4 D∞ and w values for linear and branched alkane hydrocarbons
and esters at 35°C. The values for n-butane and n-pentane wereobtained from the literature……………………………………..…..268
CHAPTER 8
Table 8.1 Dual-mode sorption model parameters for toluene and CO2 inPET……………………………………………………………..…...299
Table 8.2 Comparison of estimated amorphous phase CO2 permeability(Pa) and Henry’s Law mode diffusion coefficients (DD,a) at25°C in a thin BPET film from this study with literature datafor much thicker films…………………………………………..…..300
xv
LIST OF FIGURESPage
CHAPTER 1
Figure 1.1 Timescale for sorption experiments based on Fickian diffusion.Diffusion coefficients are expressed in cm2/s…………………..……17
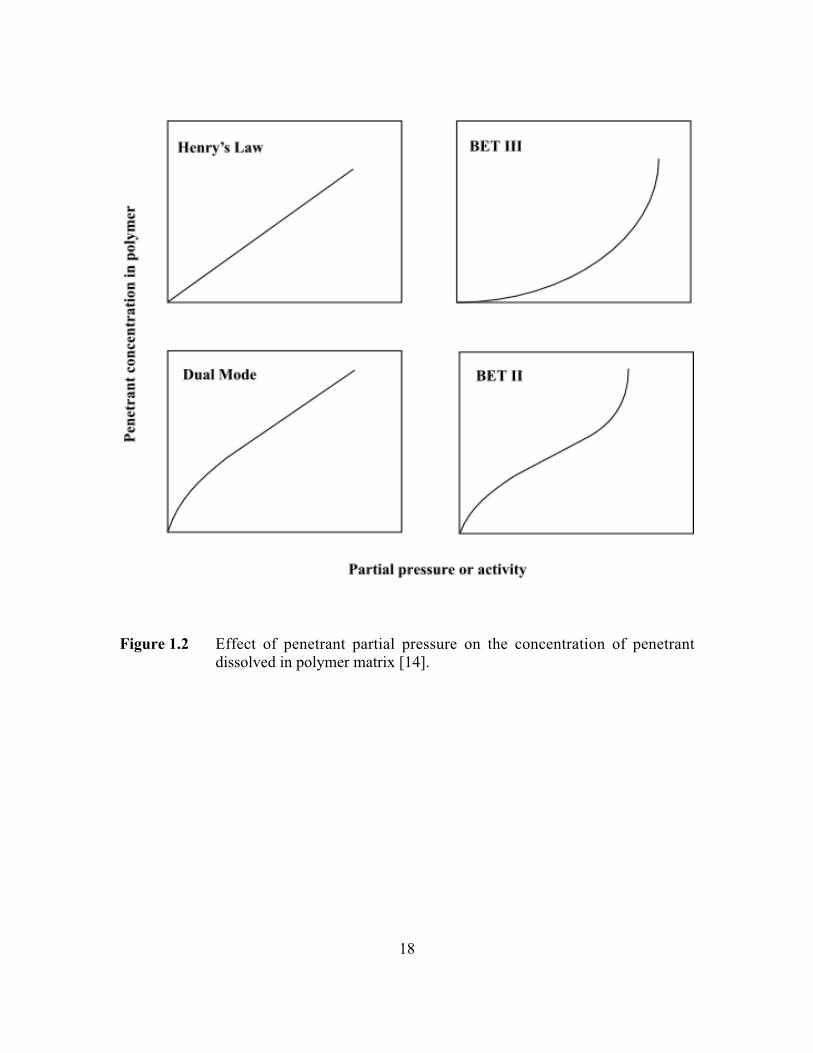
Figure 1.2 Effect of penetrant partial pressure on the concentration ofpenetrant dissolved in polymer matrix………………………….……18
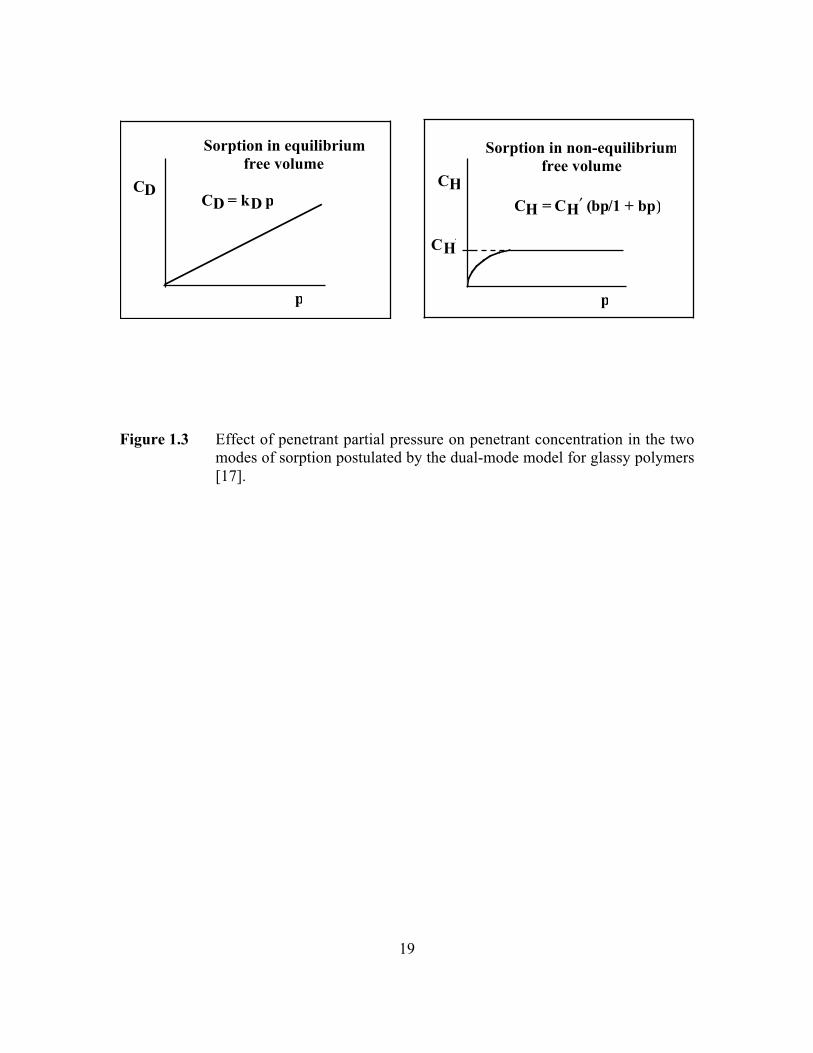
Figure 1.3 Effect of penetrant partial pressure on penetrant concentrationin the two modes of sorption postulated by the dual-modemodel for glassy polymers……………………………………...……19
Figure 1.4 An example of Fickian sorption kinetics…………………………… .20
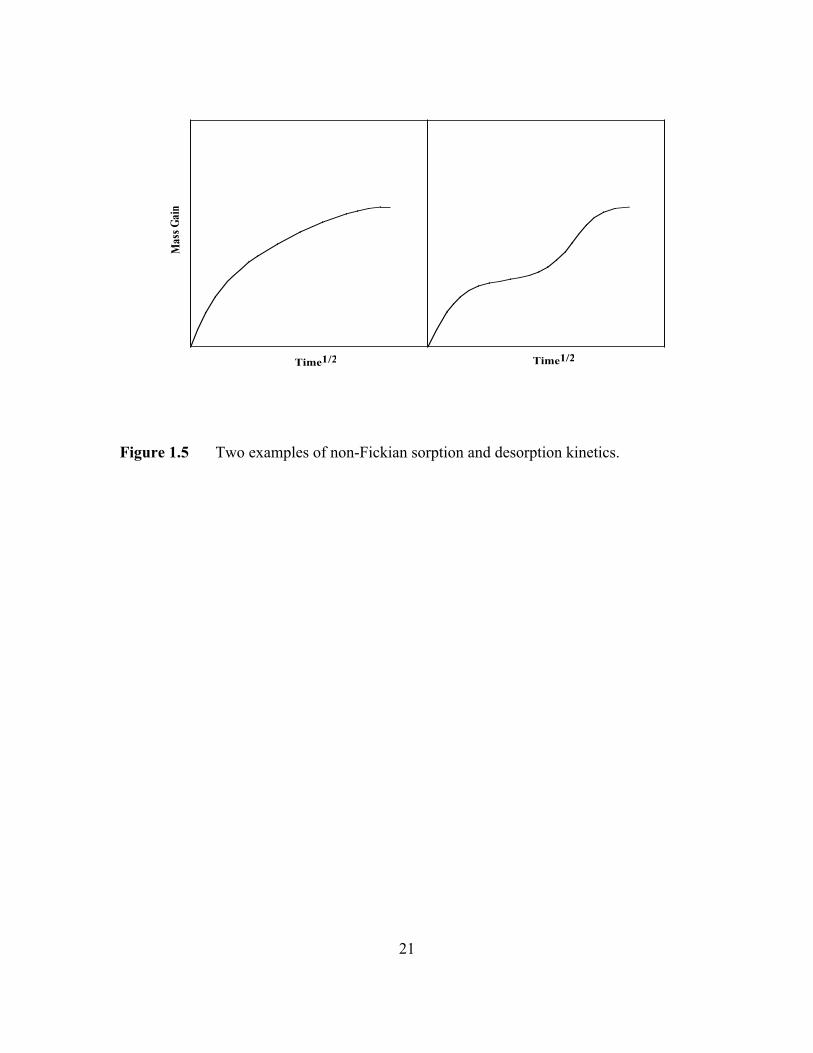
Figure 1.5 Two examples of non-Fickian sorption and desorption kinetics. ……21
CHAPTER 2
Figure 2.1 Cartoon depicting mechanism of penetrant transport inpolymers………………………………………………………….…112
Figure 2.2 Cartoon depicting polymer chain position before, during, andafter a diffusion step by a penetrant molecule………………….…...113
Figure 2.3 Crankshaft Motion – An example of local segmental dynamicsin polyolefins. Each ball represents, for example, a methylene(i.e., CH2) unit in polyethylene and the solid lines represent thecovalent chemical bonds between neighboring CH2 groups.Such molecular motions are believed to be important inproviding pathways for diffusion of small molecules inpolymers. The crankshaft motion requires the simultaneousrotation of several contiguous methylene units about bonds 1and 7 or 1 and 5……………………………………………………...114
Figure 2.4 Computer simulation of the displacement of an oxygenmolecule in poly(2,6-dimethyl-1,4-phenylene oxide) as afunction of time……………………………………………………...115
xvi
PageFigure 2.5 Computer simulation of the displacement of a nitrogen
molecule in poly(2,6-dimethyl-1,4-phenylene oxide) as afunction of time……………………………………………………..116
Figure 2.6 Correlation of gas diffusion coefficients with inverse ofpolymer fractional free volume in a series of substitutedpolysulfones…………………………………………… …………...117
Figure 2.7 Correlation of oxygen permeability with inverse of polymerfractional free volume for several families of amorphous,glassy polymers and liquid crystalline polymers. (B )Polystyrene (35°C), (C) Polycarbonates (35°C), (J) Polyesters(30°C), (G ) Polyamides (25°C), (F ) Liquid CrystallinePolymers (35°C)………………………………………………..…...118
Figure 2.8 Effect of temperature on oxygen permeability at 75% relativehumidity. PET is poly(ethylene terephthalate), AN is anacrylonitrile-styrene copolymer, PVDC is vinylidene chloride-vinyl chloride copolymer (coextrusion resin grade), and EVOH27 is ethylene vinyl alcohol copolymer containing 27 mol%ethylene……………………………………………………………..119
Figure 2.9 Correlation of Do with ED/RT for glassy polymers. (E )Poly(ethylene terephthalate), (J) Bisphenol-A Polycarbonate(PC), (G) Tetramethyl Bisphenol-A PC (TMPC)…………………..120
Figure 2.10 Effect of cohesive energy density (CED) on oxygenpermeability for six barrier polymers: Polyethylene (PE),Polystyrene (PS), Poly(vinyl acetate) (PVA), Poly(vinylchloride) (PVC), Polyacrylonitrile (PAN), Poly(vinyl alcohol)(PVOH)……………………………………………………………...121
Figure 2.11 Effect of crystalline content on gas permeability inpolyethylene at 25°C………………………………………………...122
Figure 2.12 Typical permeability-pressure dependence in rubbery andglassy polymers. (A) Hydrogen in polyethylene (PE) at 30°C,(B) Carbon dioxide in polycarbonate (PC) at 35°C, (C)Propane in polyethylene at 20°C, (D) Acetone in ethylcellulose (EC) at 40°C. The permeability values have units of(cm3 mil/ (100 in2 day atm))………………………………………...123
xvii
PageFigure 2.13 Effect of relative humidity on oxygen permeability of
hydrophilic barrier polymers. AmNY is amorphous nylon(Selar‚), BON is biaxially oriented nylon 6, MXD-6 is oriented
poly(metaxylylenediamine-adipic acid), EVOH 44 and 32 areethylene vinyl alcohol copolymers containing 32 and 44 mol%ethylene……………………………………………………………..124
Figure 2.14 (A) Mass of permeating penetrant per unit film area (q) as afunction of time (providing a measure of time lag, tL)(B) Normalized penetrant flux (NA) as a function of time(providing a measure of half time, t1/2). tSS is time required toachieve steady state……………………………………………..…..125
Figure 2.15 A schematic of a permeation cell in the Ox-Tran‚ (MOCON,
Inc.) oxygen transmission rate measurement system……………….126
Figure 2.16 A schematic of the McBain spring balance apparatus formeasuring sorption and desorption of organic vapors in barrierpolymers…………………………………………………………….127
Figure 2.17 Correlation of infinite dilution penetrant solubility withpenetrant critical temperature in poly(ethylene terephthalate)(PET). (J) non-polar penetrants, (E) polar and quadrupolarpenetrants, (F) aromatic penetrants. The slope, M = 0.019 ±0.001 K-1 and intercept, N = -9.6 ± 0.4……………………………...128
Figure 2.18 Effect of penetrant size on infinite dilution, amorphous phasediffusion coefficients in poly(ethylene terephthalate) at 25°C.The best-fit parameters of Equation 2.31 are: t = 5.7 ± 1.2 ¥108 (cm2/s) (cm3/mol)9.1, h = 9.1 ± 0.9………………………… …..129
Figure 2.19 Effect of ethylene content on oxygen permeability and watervapor transmission rates (WVTR) of ethylene vinyl alcoholcopolymer (EVOH). The figure also shows data for poly(vinylalcohol) (PVOH) and high density polyethylene (HDPE) forcomparison……………………………………………………...…..130
Figure 2.20 A comparison of oxygen and water vapor barrier properties ofvarious high and moderate barrier polymers at 23°C………….. …..131
xviii
PageFigure 2.21 Typical effect of density on various properties of polyethylene.
LTI is low temperature impact strength and ESCR isenvironmental stress crack resistance…………………………..…...132
Figure 2.22 Diffusion coefficients in unplasticized and plasticizedpoly(vinyl chloride) (PVC) as a function of penetrantmolecular diameter……………………………………………...…..133
Figure 2.23 Effect of thickness of barrier layer on permeability of ahypothetical two-layer barrier composite structure…………….…...134
Figure 2.24 A comparison of processing temperatures of variouscommercially used barrier polymers………………………………..135
Figure 2.25 An example of a typical symmetrical nine-layer coextrudedbarrier composite structure……………………………………..…...136
Figure 2.26 Effect of plasma-deposited silica coating thickness on steadystate oxygen transmission rates of poly(ethylene terephthalate)films that have an uncoated thickness of 13 mm………………..…..137
Figure 2.27 Influence of ORMOCER‚ coatings on oxygen transmission
rates (OTR) of SiOx-coated oriented polypropylene (OPP)(OTR measured at 23°C and 70% RH)……………………...………138
Figure 2.28 A comparison of oxygen and water vapor transmission rates ofvarious barrier polymer composite structures. BOPP (met) isbiaxially oriented, metallized polypropylene, PET (met.) ismetallized poly(ethylene terephthalate), PEN (met) ismetallized poly(ethylene naphthalate), Al composites arealuminum composites………………………………………….. …..139
Figure 2.29 Typical examples of heterogeneous, immiscible blends. (A)Random spheres in a dispersed phase, (B) Aggregated spheresin a dispersed phase, (C) Oriented platelets in a dispersedphase, (D) Oriented rods in a dispersed phase…………………...…140
Figure 2.30 Effect of EVOH content on oxygen permeability of PE-EVOHblends that exhibit (a) discontinuous morphology and (b) co-continuous lamellar morphology……………………… …………...141
xix
PageFigure 2.31 Reduction in oxygen transmission rates due to oxygen
scavenging in blends of PET and nylon MXD-6. Themeasurements were made at 23°C and 50% RH. (A): 4 wt.%MXD-6 and 50 ppm cobalt (as metal), (B): 4 wt.% MXD-6 and200 ppm cobalt (as metal)…………………………………………..142
CHAPTER 3
Figure 3.1 Schematic of McBain quartz spring balance for gravimetricsorption……………………………………………………………...160
Figure 3.2 Schematic of a dual volume pressure decay sorption system…..…...161
Figure 3.3 Wide angle X-ray diffraction spectrum of biaxially orientedPET (BPET)…………………………………………………….…..162
Figure 3.4a Variation of oPs intensity (normalized to an amorphous basis)in PET with degree of crystallinity……………………………..…...163
Figure 3.4b Variation of oPs lifetime (normalized to an amorphous basis)in PET with degree of crystallinity……………………………..…...164
CHAPTER 4
Figure 4.1 Vapor pressures of linear alkanes at 25°C as a function ofnumber of carbon atoms……………………………………….. …..183
Figure 4.2 Schematic diagram of modified spring balance system………...…..184
Figure 4.3 Sorption isotherms of toluene in poly(dimethyl siloxane) at25°C determined from pure and mixed vapor sorptionexperiments. The saturation vapor pressure of toluene at 25°Cis 2.9 cmHg. The experimental data were fit using the Flory-Huggins sorption model (c = 1.14 ± 0.05)…………………….. …..185
Figure 4.4a Comparison of kinetic sorption data from pure and mixedvapor sorption experiments at 25°C and vapor activityincreasing from 0 to 0.5 (J pure vapor: M∞ = 7.3 ± 0.1 gtoluene/100g PDMS and D = 1.3 ± 0.1 ¥ 10-6 cm2/s; A mixed
vapor: M∞ = 7.1 ± 0.2 g toluene/100g PDMS and D = 1.1± 0.1 ¥ 10-6 cm2/s)……………………………………………… ….186

xx
PageFigure 4.4b Comparison of kinetic sorption data from mixed vapor sorption
experiments at 25°C using nitrogen and helium carrier gasesand vapor activity increasing from 0 to 0.35 (J helium: M∞ =4.1 ± 0.1 g toluene/100g PDMS and D = 1.9 ± 0.3 ¥ 10-6
cm2/s; A nitrogen: M∞ = 4.1 ± 0.1 g toluene/100g PDMS andD = 1.2 ± 0.2 ¥ 10-6 cm2/s)……………………………………. …..187
Figure 4.5 Comparison of diffusion coefficients of toluene inpoly(dimethyl siloxane) at 25°C from pure and mixed vaporsorption experiments………………………………………………...188
CHAPTER 5
Figure 5.1a Sorption isotherm of n-butane in BPET at 35°C. The saturationvapor pressure of n-butane at 35°C is 245.8 cmHg…………….…...205
Figure 5.1b Sorption isotherm of n-pentane in BPET at 35°C. Thesaturation vapor pressure of n-pentane at 35°C is 72.7 cmHg….…..206
Figure 5.2 Correlation of infinite dilution, amorphous phase solubilitycoefficients in PET with critical temperature. The slope, M ofthe least squares line is 0.019 ± 0.001 K-1 and the intercept, Nis –9.6 ± 0.4…………………………………………………….…...207
Figure 5.3a Fickian sorption of n-butane in BPET at 35°C. Psat = 245.8cmHg, pi =36.8 cmHg, pf = 67.5 cmHg, M∞ = 0.15 ± 0.006g/100g, D = 1.5 ± 0.5 ¥ 10-12 cm2/s………………………………..208
Figure 5.3b Non-Fickian sorption of n-butane in BPET at 35°C.Psat = 245.8 cmHg, pi = 11.5 cmHg, pf = 59.6 cmHg,M∞ = 0.43 ± 0.04 g/100g, D = 1.3 ± 0.4 ¥ 10-12 cm2/s,
aR = 0.32 ± 0.04, tR = 115 ± 5 min., tF = 115 ± 41 min.,
tD = 74 ± 9 min………………………………………………….…..209
Figure 5.3c Fickian sorption of n-pentane in BPET at 35°C. Psat = 72.7cmHg, pi = 0 cmHg, pf = 14.5 cmHg, M∞ = 0.41 ± 0.007g/100g, D = 4.8 ± 0.8 ¥ 10-14 cm2/s………………………………..210
xxi
PageFigure 5.3d Non-Fickian desorption of n-pentane in BPET at 35°C.
Psat = 72.7 cmHg, pi = 10.4 cmHg, pf = 2.7 cmHg,M∞ = 0.22 ± 0.006 g/100g, D = 5 ± 3 ¥ 10-13 cm2/s,
aR = 0.47 ± 0.06, tR = 389 ± 13 min., tF = 330 ± 220 min.,
tD = 145 ± 16 min……………………………………………….…..211
Figure 5.4 Effect of concentration on n-butane and n-pentane diffusioncoefficients in BPET at 35°C…………………………………...…..212
Figure 5.5 Effect of penetrant size on estimated infinite dilution,amorphous phase diffusion coefficients in PET at 25°C. Thebest-fit parameters of Equation 5.15 are: h = 9.1 ± 0.9, t = 5.7
± 1.2 ¥ 108 (cm2/s (cm3/mol)9.1)……………………………….. …..213
CHAPTER 6
Figure 6.1 Sorption isotherms of acetone (B), MEK (J), MnPK (G), andMiPK (E) in biaxially oriented PET (BPET) at 35°C as afunction of pressure……………………………………………..…..231
Figure 6.2 Sorption isotherms of acetone in biaxially oriented PET(BPET) and solvent-cast PET (SPET) at 35°C as a function ofrelative pressure………………………………………………... …..232
Figure 6.3 Correlation of infinite dilution, estimated amorphous phasesolubility coefficients in PET with penetrant criticaltemperature. For most penetrants, the data have beenextrapolated to infinite dilution. For MEK, MiPK, and MnPK,the data are reported at a relative pressure of 0.1…………………...233
Figure 6.4 Sorption isotherms of acetone (B), MEK (J), MnPK (G), andMiPK (E) in BPET at 35°C as a function of relative pressure……...234
Figure 6.5a Sorption isotherms of MEK and n-butane in BPET at 35°C as afunction of relative pressure…………………………………….…..235
Figure 6.5b Sorption isotherms of MnPK and n-pentane in BPET at 35°Cas a function of relative pressure……………………………….…...236
xxii
PageFigure 6.6a Non-Fickian sorption kinetics of acetone in BPET at 35°C.
pi = 0 cmHg, pf = 0.9 cmHg, M∞ = 0.31 ± 0.02 g/100g,D = 1.1 ± 0.2 ¥ 10-12 cm2/s, aR = 0.21 ± 0.04, tR = 340 ± 20
min., tF = 140 ± 30 min, tD = 0 min.……………………...………...237
Figure 6.6b Fickian sorption kinetics of MEK in BPET at 35°C.pi = 0 cmHg, pf = 2.3 cmHg, M∞ = 0.94 ± 0.003 g/100g,D = 4.4 ± 1.8 ¥ 10-13 cm2/s……………………………………. ….238
Figure 6.6c Fickian sorption kinetics of MnPK in BPET at 35°C.pi = 0 cmHg, pf = 0.3 cmHg, M∞ = 0.61 ± 0.001 g/100g,D = 5.1 ± 0.7 ¥ 10-14 cm2/s……………………………………. ….239
Figure 6.7a Non-Fickian desorption kinetics of MEK from BPET at 35°C.pi = 1.6 cmHg, pf = 0 cmHg, M∞ = 0.98 ± 0.03 g/100g,D = 2.3 ± 0.4 ¥ 10-13 cm2/s, aR = 0.24 ± 0.01, tR = 1075 ± 70
min., tF = 650 ± 160 min., tD = 0 min …………….…………...…...240
Figure 6.7b Non-Fickian desorption kinetics of MiPK from BPET at 35°C.pi = 3.3 cmHg, pf = 0.3 cmHg, M∞ = 0.8 ± 0.04 g/100g,D = 2.5 ± 0.4 ¥ 10-14 cm2/s, aR = 0.29 ± 0.01, tR = 5360 ± 380
min., tF = 6020 ± 1360 min., tD = 0 min…………………. ………..241
Figure 6.7c Non-Fickian desorption kinetics of MnPK from BPET at 35°C.pi = 1.7 cmHg, pf = 0.4 cmHg, M∞ = 0.49 ± 0.01 g/100g,D = 1.9 ± 0.3 ¥ 10-13 cm2/s, aR = 0.43 ± 0.003, tR = 3900 ± 70
min., tF = 790 ± 330 min., tD = 0 min…………………………..…..242
Figure 6.8 Effects of average concentration on apparent diffusioncoefficients of acetone, MEK, MnPK, and MiPK in BPET at35°C……………………………………………………………. …..243
Figure 6.9 Effect of penetrant size on infinite dilution, estimatedamorphous phase diffusion coefficients in PET at 25°C……….…...244

xxiii
PageCHAPTER 7
Figure 7.1a Sorption isotherms of n-butane and i-butane in biaxiallyoriented PET (BPET) at 35°C as a function of penetrantpressure……………………………………………………………...269
Figure 7.1b Sorption isotherms of n-pentane and i-pentane in BPET at35°C as a function of penetrant pressure………………………. …..270
Figure 7.2 Sorption isotherms of n-butane, i-butane, n-pentane, andi-pentane in low density polyethylene (LDPE) at 25°C………..…...271
Figure 7.3 Sorption isotherms of methyl acetate and ethyl acetate in BPETat 35°C as a function of penetrant pressure……………………. …..272
Figure 7.4 Correlation of infinite dilution, estimated amorphous phasesolubility coefficients in PET with penetrant criticaltemperature. The data for methyl acetate and ethyl acetate fromthis study and for methyl ethyl ketone (MEK), methyl i-propylketone (MiPK), and methyl n-propyl ketone (MnPK) from anearlier study are reported at a relative pressure of 0.1…………. …..273
Figure 7.5 Sorption isotherms of methyl acetate (B), ethyl acetate (J),n-butane (H), n-pentane (A), i-butane (C), and i-pentane (F) inBPET at 35°C as a function of relative pressure……………….…...274
Figure 7.6a Sorption isotherms of methyl acetate and acetone in BPET at35°C as a function of relative pressure. The saturation vaporpressures of methyl acetate and acetone at 35°C are 32.9 and34.7 cmHg, respectively………………………………………..…...275
Figure 7.6b Sorption isotherms of ethyl acetate and methyl ethyl ketone(MEK) in BPET at 35°C as a function of relative pressure. Thesaturation vapor pressures of ethyl acetate and MEK at 35°Care 14.9 and 14.2 cmHg, respectively…………………………..…..276
Figure 7.7a Fickian sorption kinetics of i-butane in BPET at 35°C.pi = 0 cmHg, pf = 31.1 cmHg, M∞ = 0.16 ± 0.01 g/100g,D = 1.0 ± 0.2 ¥ 10-14 cm2/s……………………………………. ….277
xxiv
PageFigure 7.7b Non-Fickian sorption kinetics of methyl acetate in BPET at
35°C.pi = 2.5 cmHg, pf = 5.0 cmHg, M∞ = 0.32 ± 0.02 g/100g,D = 6.0 ± 1.0 ¥ 10-12 cm2/s, aR = 0.53 ± 0.06,
tR = 240 ± 20 min., tF = 25 ± 6 min., tD = 32 ± 3 min……………...278
Figure 7.8 Effect of average concentration on apparent diffusioncoefficients of linear and branched alkane hydrocarbons inBPET at 35°C…………………………………………………...…..279
Figure 7.9 Infinite-dilution, estimated amorphous phase diffusioncoefficients of linear and branched alkane hydrocarbons in PETas a function of carbon number……………………………………..280
Figure 7.10 Effect of average concentration on apparent diffusioncoefficients of methyl acetate (B) and ethyl acetate (E) inBPET at 35°C. The literature data for acetone (C) and MEK(P) are included for comparison………………………………..…..281
Figure 7.11 Effect of penetrant size on infinite-dilution, estimatedamorphous phase diffusion coefficients in PET at 35°C. Thebest-fit parameters of Equation 7.11 are h = 8.4 ± 1.0, t = 4.4
± 1.2 ¥ 107 (cm2/s (cm3/mol)8.4)………………………………...…..282
CHAPTER 8
Figure 8.1 Sorption isotherm of toluene in PET at 35°C…………………..…...301
Figure 8.2 Correlation of infinite-dilution, estimated amorphous phasesolubility coefficients in PET with penetrant criticaltemperature. The solubility coefficient of toluene (highlighted)is reported at an activity of 0.1……………………………..…..…...302
Figure 8.3a Fickian sorption kinetics of toluene in BPET at 35°C.pi = 0 cmHg, pf = 0.8 cmHg, M∞ = 1.7 ± 0.02 g/100g,D = 1.3 ± 0.2 ¥ 10-13 cm2/s……………………………………..…..303
Figure 8.3b Non-Fickian sorption kinetics of toluene in BPET at 35°C.pi = 0 cmHg, pf = 0.07 cmHg, M∞ = 0.52 ± 0.04 g/100g,D = 4.8 ± 0.8 ¥ 10-14 cm2/s, aR = 0.18 ± 0.01, tR = 775 ± 33
min., tD = 980 ± 42 min………………………………………… ….304
xxv
PageFigure 8.4 Diffusion coefficients of toluene in PET at 35°C as a function
of average penetrant concentration……………………………..…...305
Figure 8.5 Correlation of infinite-dilution, estimated amorphous phasediffusion coefficients in PET with penetrant critical volume…..…...306
Figure 8.6 Sorption isotherm of CO2 in PET at 25°C……………………...…...307
Figure 8.7 Comparison of CO2 sorption isotherms in PET at 25°C. (J)This study (dual volume pressure decay sorption experiments),(E) This study (gravimetric sorption experiments)…………….…...308
Figure 8.8 Comparison of CO2 sorption isotherms on an amorphous basisin PET at 25°C. (J) This study (dual volume pressure decaysorption experiments), (E) This study (gravimetric sorptionexperiments)…………………………………………………….…..309
Figure 8.9 Average diffusion coefficients of CO2 in BPET at 25°C as afunction of CO2 pressure at the end of the experiment. Thecurve-fit is based on the dual mobility model (Equation 8.8)…..…..310
CHAPTER 9
Figure 9.1 Differential Scanning Calorimetry thermograms of amorphousand solvent-crystallized PET films……………………………..…...320
Figure 9.2 Wide Angle X-ray Diffraction spectra of amorphous andsolvent-crystallized PET films………………………………….…..321

1
CHAPTER 1
Introduction
2
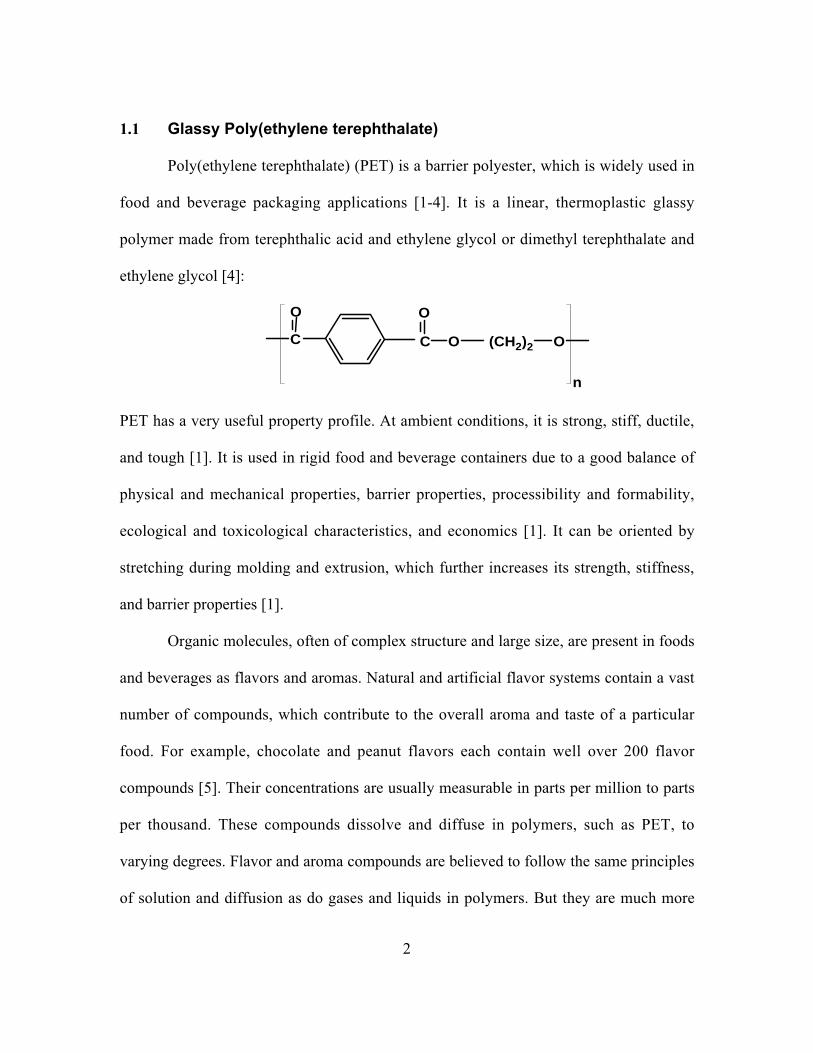
1.1 Glassy Poly(ethylene terephthalate)
Poly(ethylene terephthalate) (PET) is a barrier polyester, which is widely used in
food and beverage packaging applications [1-4]. It is a linear, thermoplastic glassy
polymer made from terephthalic acid and ethylene glycol or dimethyl terephthalate and
ethylene glycol [4]:
C
O
C
O
O
n
(CH2)2 O
PET has a very useful property profile. At ambient conditions, it is strong, stiff, ductile,
and tough [1]. It is used in rigid food and beverage containers due to a good balance of
physical and mechanical properties, barrier properties, processibility and formability,
ecological and toxicological characteristics, and economics [1]. It can be oriented by
stretching during molding and extrusion, which further increases its strength, stiffness,
and barrier properties [1].
Organic molecules, often of complex structure and large size, are present in foods
and beverages as flavors and aromas. Natural and artificial flavor systems contain a vast
number of compounds, which contribute to the overall aroma and taste of a particular
food. For example, chocolate and peanut flavors each contain well over 200 flavor
compounds [5]. Their concentrations are usually measurable in parts per million to parts
per thousand. These compounds dissolve and diffuse in polymers, such as PET, to
varying degrees. Flavor and aroma compounds are believed to follow the same principles
of solution and diffusion as do gases and liquids in polymers. But they are much more

3
likely than light gases (e.g., O2, N2) to interact strongly with polymers and, hence, their
solubility and diffusivity can depend strongly on activity or concentration. Some
important issues in flavor and aroma migration in packaging materials are [6]: (1) the
capacity of the package material to sorb flavor compounds, (2) the kinetics of flavor
sorption, and (3) the total loss of flavor components during the expected shelf life of the
product. Sorption capacity is determined by the equilibrium solubility coefficient,
whereas the rate of sorption and total loss depend on both the solubility and diffusion
coefficient.
Much of the design of barrier packaging involves controlling the exchange of
gaseous components (e.g., O2, CO2) between the external environment and the internal
package contents. However, flavor scalping (i.e., the sorption of flavor components into
the package walls) is also important [7,8]. Literature data on transport properties of flavor
and aroma compounds in PET are extremely limited and not as extensive as the data for
moisture and other light gases [8,9]. The very low diffusion coefficients of large organic
flavor molecules in PET contribute to the lack of data. Low diffusion coefficients, which
may be of the order of 10-15 cm2/s or less, coupled with typical film thicknesses (of the
order of several tens of micrometers), result in experimentally inaccessible timescales to
attain sorption equilibrium. If Fickian diffusion controls penetrant uptake in a polymer
film of uniform thickness (whose length and width are substantially larger than the
thickness), the time, teq, required to reach sorption equilibrium is [8]:
t
Deq ª l2
(1.1)
4
where l is film thickness, and D is the penetrant diffusion coefficient. Figure 1.1 shows
the timescale for sorption experiments as a function of film thickness for various
diffusion coefficient values. As an example, for a diffusion coefficient of 10-14 cm2/s and
a 10 µm thick PET film, this timescale would be approximately 3 years! To address this
inherent limitation, very thin films (less than 1 µm thick) have been used in this study.
1.2 Overview of Sorption and Transport of Small Molecules in Polymers
1.2.1 Solubility
Penetrant solubility, S, in a polymer matrix is defined as:
SC
p= (1.2)
where C is the equilibrium concentration of penetrant dissolved in the polymer, and p is
the partial pressure of penetrant in the phase contiguous to the polymer. For condensable
organic vapors or liquid penetrants, partial pressure is often replaced by penetrant activity
or relative pressure, p/psat, where psat is the penetrant saturation vapor pressure.
PET is a glassy polymer that typically contains significant levels of crystallinity,
and the amount of crystallinity depends sensitively on the thermal processing history.
Crystalline regions of most polymers preclude penetrant sorption, and the effect of
crystallinity on solubility is often described using the following simple two-phase model
[10]:
S Sa a= f (1.3)

5
where Sa is the amorphous phase penetrant solubility, and fa is the amorphous phase
volume fraction of the polymer. Although it is widely used, this relation should be
regarded as a first approximation [11]. Being a non-equilibrium glassy polymer,
properties of PET, such as amorphous phase density, depend on the processing history of
the polymer [12,13]. The above equation does not account for changes in the amorphous
phase solubility that might accompany changes in the amorphous phase density for
samples with varying levels of crystallinity. It also does not account for the trapping of
amorphous regions in the crystalline regions of the polymer.
1.2.2 Effect of Penetrant Partial Pressure or Activity on Solubility
The effect of penetrant partial pressure on the penetrant concentration dissolved in
the polymer matrix is qualitatively presented in Figure 1.2. The sorption of light gases in
rubbery polymers is similar to the sorption of gases in low molecular weight liquids, and
gas concentration in the polymer, C, often obeys Henry’s law [14]:
C k pD= (1.4)
where kD is the Henry’s law constant, and p is the gas pressure in contact with the
polymer.
For highly sorbing penetrants, such as organic vapors, or gases at high pressures,
penetrant concentration in the polymer may deviate from Henry’s law (BET III). Under
these conditions, penetrant concentration in the polymer can often be satisfactorily
represented by the Flory-Huggins equation [15]:
ln ln ( ) ( )a = + - + -f f c f1 1 2 (1.5)
6
where a is penetrant activity, f is the volume fraction of penetrant dissolved in the
polymer, and c is the Flory-Huggins interaction parameter.
Differences between sorption and transport properties of rubbery and glassy
polymers can arise from the non-equilibrium nature of glassy polymers [16]. Unlike
rubbers, which are equilibrium materials, the physical properties, including sorption and
transport properties, of glassy polymers drift over time towards a seemingly unattainable
equilibrium. This phenomenon is closely related to the existence of non-equilibrium
excess volume in glassy polymers [16,17]. This excess volume results from the inability
of the polymer chains to undergo conformation rearrangement sufficiently rapidly to
attain equilibrium below the glass transition temperature.
Sorption isotherms for gases in glassy polymers are typically concave to the
pressure axis at low pressure and linear at high pressures [8,9]. Such isotherms are often
modeled successfully by the dual-mode model (cf. Figure 1.2) [17]. In this model,
penetrant molecules are viewed as being partitioned between the dense equilibrium
structure of the polymer (dissolved mode) and the non-equilibrium excess volume of the
glassy polymer (so-called hole filling or Langmuir mode). The model is given by [18]:
C C CD H= + (1.6)
where C is the total concentration of penetrant in the polymer, CD is the dissolved mode
penetrant concentration, and CH is the penetrant concentration in the Langmuir mode. As
shown in Figure 1.3, CD is a linear function of pressure, and CH is expressed as a
Langmuir isotherm to give [18]:

7
C k pC bp
bpDH= +
¢+1
(1.7)
where CH¢ is the Langmuir sorption capacity, and b is the Langmuir affinity parameter.
Sorption isotherms of organic vapors in glassy polymers over a wide activity
range may be sigmoidal in shape, exhibiting dual-mode behavior at low activities, and
Flory-Huggins behavior at high activities (BET II) [19]. An inflection marks the
transition from glassy to rubbery behavior. The position of the inflection is determined by
the glass transition temperature of the polymer and the plasticizing effectiveness of the
penetrant [19].
1.2.3 Diffusivity
Crystallites typically act as impenetrable barriers to penetrant diffusion in
polymers. Michaels et al. described the effect of crystallinity on diffusivity as [20]:
DDa=tb
(1.8)
where Da is the amorphous phase diffusion coefficient, t is a geometric impedance factor,
and b is a chain immobilization factor. Crystallites force penetrants to follow a tortuous
path through amorphous regions. The geometric impedance factor, which is the ratio of
the average distance traveled by a penetrant molecule in traversing a sample to the
sample thickness, accounts for this effect. Crystallites can also restrict segmental mobility
by acting as physical crosslinks. The chain immobilization factor accounts for this effect.
8
The reduction in amorphous phase chain mobility due to crystallites can be
pronounced in flexible rubbery polymers such as polyethylene [21]. In glassy polymers,
such as PET, the inherent rigidity of the chain backbone can impose more impedance to
chain mobility than the crystallites, and b is often taken to be approximately one [20],
whereas for rubbery polymers, b is greater than one. The geometric impedance factor
may be a complex function of crystallite amount, shape, size, and orientation [22]. A
simple empirical model describing the effect of crystallinity on impedance factor in PET
is given as [20]:
tf
= 1
a
(1.9)
With this result, Equation 1.8 becomes:
D Da a= f (1.10)
Thus, based on this simple model, penetrant diffusivity, like solubility, is directly
proportional to the polymer amorphous phase volume fraction.
In oriented glassy polymers like PET, diffusivity is also affected by orientation
[23]. Hence, the effective diffusivity of an oriented, semicrystalline polymer would
usually be lower than that estimated based on Equation 1.10, if Da were taken to be the
amorphous phase diffusivity of unoriented polymer. For example, oxygen permeability in
PET is reduced by a factor of approximately two when an initially unoriented film is
subject to 4 ¥ 4 biaxial orientation [24]. The effect of orientation on sorption and

9
diffusion of larger molecules (e.g., flavor components) in PET has not been
systematically investigated.
1.3 Overview of Fickian and non-Fickian Kinetics
Penetrant diffusion through rubbery polymers is typically well described by the
Fickian transport model [25]. This behavior is also observed in glassy polymers at low
penetrant activity. The signature of Fickian diffusion in a thin, non-porous polymer film
contacted with a penetrant is a weight increase in the polymer, due to penetrant
absorption, which initially increases with square root of the contact time before
approaching a fixed equilibrium value [25], as shown in Figure 1.4.
In glassy polymers, deviations from this ideal Fickian behavior are often
observed. These deviations are generally believed to arise as a consequence of the finite
rate of polymer structure reorganization in response to penetrant-induced swelling during
the sorption-diffusion process [26]. The penetrant may sorb in the polymer in two stages,
an initial Fickian-like stage followed by a protracted drift towards a final equilibrium
value [27]. In another departure from Fickian sorption kinetics, the penetrant weight
uptake may be a linear function of contact time until equilibrium is reached [28]. This
behavior is called as ‘Case II’ sorption to distinguish it from Fickian or ‘Case I’ sorption
[25,29,30]. When penetrant sorption is accompanied by significant swelling of the
polymer, any time dependent resistance to changes in the volume of the polymer can lead
to non-Fickian sorption kinetics. It is commonly observed when organic vapors sorb into
glassy polymers [29]. As the penetrant swells the polymer, local stresses are built up
10
when the chains disentangle from each other. These stresses can be quite high, and can, in
fact, cause mechanical failure in the polymer [31]. Two examples of non-Fickian sorption
kinetics are shown in Figure 1.5.
If the polymer chains do not deform significantly upon penetrant sorption or if the
chains reorganize very quickly relative to the rate of penetrant diffusion, Fickian behavior
is observed [32]. Between the bounds of no response and infinitely fast response by the
polymer chains to the presence of penetrant molecules, there is a regime where the rates
of polymer deformation and swelling to accommodate the penetrant molecules and rate of
penetrant diffusion occur over similar timescales. Non-Fickian behavior is commonly
understood to occur in this regime.
1.4 Goals and Organization of This Research
As discussed earlier, sorption and transport properties of flavor molecules in PET
are important considerations in flavor scalping, carryover, and contamination. Several
examples of common flavor and aroma compounds are provided in Table 1.1. The major
roadblock to obtaining this information is the extremely long experimental timescales
with conventional polymer samples. These considerations lead to the following question:
Based on experimental data for lower molecular weight “model” flavor molecules, is it
possible to estimate sorption and transport properties of large flavor molecules in PET?
There is some indication that it may be possible to develop systematic correlations for
solubility and diffusivity in PET. For example, the logarithm of infinite dilution,
amorphous phase solubility in rubbery and glassy polymers increases approximately
11
linearly with critical temperature, as demonstrated in the literature for PET [9]. The
infinite dilution, amorphous phase diffusion coefficients decrease strongly with
increasing penetrant size, as characterized by penetrant critical volume. In this case, a
simple empirical power law model was used to describe the data for PET [9]. These
experimental results suggest that sorption and transport properties of large flavor
molecules in PET can be estimated, albeit crudely, based on their critical properties.
However, the penetrants included in the solubility and diffusivity correlation plots based
on available literature data [9] do not include even low molecular weight analogs of many
classes of flavor and aroma compounds.
There is a need to develop a more systematic database of sorption and transport
properties of organic molecules in PET to better understand effects of penetrant size,
shape, and polarity on solubility and diffusion coefficients of such molecules. Apart from
filling a significant void in the literature, these results would provide a valuable database
for quantifying the effects of penetrant backbone length, branching, and chemical
structure on transport properties of large flavor molecules in PET.
This research project focused on an experimental study of sorption and transport
of large organic molecules (model flavor molecules) in PET. The difficulty of very long
experimental timescales has been addressed by using extremely thin (less than 1 µm
thick) biaxially-oriented PET (henceforth referred to as BPET) films. The use of such
thin, uniform films permits the study of sorption and transport of large penetrants over
experimentally-accessible timescales.
12
Current experimental techniques in our laboratory are limited to the sorption
study of gases and volatile (or high vapor pressure) organic liquids in polymers. The
vapor pressures of several classes of flavor compounds are extremely low. For example,
vapor pressures of d-limonene, benzyl alcohol, and benzaldehyde at 25°C are 1.5, 0.1,
and 1.3 mmHg, respectively [33]. Hence, there is a need to develop experimental tools
for measuring solubility and diffusivity of low volatility organic liquids in polymers over
a wide range of activity. The latter part of this research project focused on developing an
experimental technique for this purpose, and it represents one of the very few techniques
[34-37] of its kind for studying sorption and transport properties of low volatility organic
liquids at low activity in a barrier polymer like PET.
This dissertation comprises nine chapters, including this introductory chapter,
which provides background information, underlying motivation, and overall goals of this
research. Chapter 2 provides a broad overview of various types of barrier polymers and
structures, their permeability characteristics (including the underlying principles
involved), measurement techniques, methods to predict and improve barrier properties,
and current as well as potential future applications for barrier polymers. This chapter is
adapted from a review paper published in the Encyclopedia of Polymer Science and
Technology.
Chapter 3 describes the biaxially oriented polyester films used in this research
project. The films were characterized using differential scanning calorimetry, wide-angle
X-ray diffraction, positron annihilation lifetime spectroscopy, and other techniques. The
experimental procedures and characterization results are described in this chapter. This
13
chapter also describes the low-pressure gravimetric sorption technique and high-pressure
dual volume pressure decay sorption technique used for collecting the data presented in
Chapters 5, 6, 7, and 8 of this dissertation.
Chapter 4 describes a new experimental technique for kinetic gravimetric sorption
of low volatility (or highly condensable) gases and organic vapors in polymers over a
wide range of activity. Sorption and transport data for toluene vapor in poly(dimethyl
siloxane) at 25°C are provided to illustrate the method. Penetrants with vapor pressures
as low as 10-7 mmHg might be studied using this new technique, as compared with
traditional gravimetric sorption methods (such as the one described in Chapter 3) that
have only been used for studying penetrants with vapor pressures as low as 0.1 mmHg.
Chapter 5 describes results from a kinetic gravimetric sorption study of linear
alkane hydrocarbons in BPET films at 35°C. The solubility and diffusivity data for
n-butane and n-pentane in 0.9 µm BPET films are presented. n-Pentane has higher
solubility and lower diffusivity than n-butane, consistent with critical temperatures and
critical volumes of these penetrants. The infinite dilution, amorphous phase solubility of
n-butane in semicrystalline BPET is approximately two times higher than that in
microtomed, amorphous PET (APET) [9] primarily due to the presence of higher non-
equilibrium excess volume in BPET.
Chapter 6 presents results from a kinetic gravimetric sorption study of four linear
and branched ketones, namely acetone, methyl ethyl ketone (MEK), methyl n-propyl
ketone (MnPK), and methyl i-propyl ketone (MiPK), in BPET films at 35°C. The
14
diffusion coefficients and equilibrium solubility at fixed relative pressure decrease in the
following order:
acetone > MEK > MnPK > MiPK.
Solubility of polar ketones in BPET is approximately two times higher than that of non-
polar alkanes having the same number of carbon atoms and a similar carbon skeleton.
Chapter 7 presents results from a kinetic gravimetric sorption study of two
branched alkane hydrocarbons, i-butane and i-pentane, and two linear esters, methyl
acetate and ethyl acetate, in BPET films at 35°C. The equilibrium solubility of i-butane
and i-pentane is lower than that of the corresponding linear alkanes (presented in Chapter
5), most likely due to restricted access of the branched penetrants to the non-equilibrium
excess volume of PET. Interestingly, the solubility difference between n-pentane and i-
pentane is approximately 10 times higher in PET than in low density polyethylene
(LDPE). At constant relative pressure, the solubility of methyl acetate is higher than that
of ethyl acetate, consistent with solubility trends of esters in other polymers and polar
liquids, and the solubility of esters in PET is higher than that of ketones having the same
number of carbon atoms. Surprisingly, the diffusion coefficients of esters (methyl acetate
and ethyl acetate) are quite similar to those of ketones (acetone and methyl ethyl ketone)
with the same number of carbon atoms despite the esters being somewhat larger than the
ketones. This result suggests that penetrant diffusion coefficients in PET, which are
primarily dependent on penetrant size and shape, are influenced by polarity effects as
well.
15
Chapter 8 presents equilibrium solubility and diffusivity values of toluene vapor
in BPET films at 35°C using the new experimental technique described in Chapter 4.
This chapter also presents a comparison of CO2 sorption in BPET films at 25°C and
pressures up to approximately 10 atm with literature data for thicker PET films. Diffusion
coefficients of CO2 in BPET obtained from low-pressure (less than 1 atm) gravimetric
sorption experiments have also been presented. The so-called dual mobility model was
used to estimate CO2 permeability coefficients in BPET. On an amorphous basis, the
estimated CO2 solubility and permeability coefficients in the 0.9 mm BPET films are in
good agreement with some literature values for much thicker films.
The solubility and diffusivity correlation plots, previously reported by Serad et al.
[9], appear in chapters 5, 6, 7, and 8, with the data from each chapter being progressively
added to these plots. Finally, chapter 9 summarizes the results from this research and
provides recommendations for future work in this area.
16
Table 1.1 List of some common flavor and aroma compounds
Flavor/Aroma Chemical Structure
d-Limonene
Vanillin CHO OH
OCH3
BenzaldehydeCHO
Eugenol
OH
O
CH2 CH CH2
CH3
Undelactone
O
O
Methyl Octanoate
CH3(CH2)6 C
O
OCH3
Linalool
CH3 C
CH3
CH CH2 CH2 C CH
OH
CH3
CH2

17
0.01
0.1
1
10
100
1000
0.1 1 10 100
[mmmmm] l
t eq [
day
s]
10-10
10-9
10-11
10-12
10-13
10-14
D = 10-15
Figure 1.1 Timescale for sorption experiments based on Fickian diffusion. Diffusioncoefficients are expressed in cm2/s.
18
Figure 1.2 Effect of penetrant partial pressure on the concentration of penetrantdissolved in polymer matrix [14].
19
Sorption in equilibriumfree volume
Sorption in non-equilibriumfree volume
CD CH
p
CD = kD p CH = CH¢ (bp/1 + bp)
CH¢
p
Figure 1.3 Effect of penetrant partial pressure on penetrant concentration in the twomodes of sorption postulated by the dual-mode model for glassy polymers[17].

20
Mas
s G
ain
Time1/2
Figure 1.4 An example of Fickian sorption kinetics [25].
21
Time1/2Time1/2
Mas
s Gai
n
Figure 1.5 Two examples of non-Fickian sorption and desorption kinetics.
22
CHAPTER 2
Barrier Polymers
This chapter has been adapted with permission from a review article published under the
same title in Encyclopedia of Polymer Science and Technology, 3rd ed., v.5, pp. 198-263,
2003. Copyright” 2003 John Wiley & Sons.
23
2.1 Summary
Although broadly defined as a macromolecule having the ability to restrict the
passage of gases, vapors, and liquids, the definition of a barrier polymer varies from
application to application and a material that provides sufficient barrier for a particular
end use can be considered to be a barrier polymer. They are widely used in food,
beverage, and other packaging industries. Some of the advantages that they offer over
traditional packaging materials like glass, paper, and metals are flexibility, light weight,
toughness, versatility, and printability. However, unlike glass and metals, no polymer
offers an infinite gas barrier. Combinations of different polymers, or polymers with
inorganic materials, in the form of multilayer structures or blends, can provide sufficient
barrier for the intended shelf life of most products. Inorganic materials such as silicon &
aluminum oxides and nanoclays can significantly enhance barrier and other mechanical
properties of polymers. Other approaches for improving barrier properties such as
oxygen-scavenging systems have also received considerable attention in recent years.
This chapter discusses various types of barrier polymers and structures, their permeability
characteristics (including the underlying principles involved), measurement techniques,
ways to predict and improve barrier properties, and current as well as potential future
applications for barrier polymers.
24
2.2 Introduction
Barrier polymers can be broadly defined as macromolecules having the ability to
significantly restrict the passage of gases, vapors, and liquids. Since all polymers restrict
the transport of penetrants to some degree and the barrier performance of polymers to
different penetrants depends on a variety of factors, it is difficult to provide a concise,
objective definition. In a practical sense, however, the definition of a barrier polymer
depends upon the end use requirements, and a material that provides sufficient barrier for
a particular application can be considered to be a barrier polymer for that purpose. In the
present discussion, polymers that have resistance to transport of gases, vapors, and
liquids as one of their key attributes will be considered to be barrier polymers.
Polymers have found wide acceptance as alternatives to traditional materials like
glass, paper, and metals, in food, beverage, and other packaging industries. A key
characteristic of glass and metals as packaging materials is their total barrier to transport
of gases and vapors. While polymers can provide an attractive balance of properties such
as flexibility, toughness, light weight, formability, and printability, they do allow the
transport of gases and vapors to some extent. Unfortunately, an inexpensive, recyclable
polymeric material possessing high barrier properties to every gas or vapor in addition to
good mechanical, thermal, and optical properties is not available. For this reason, the
selection of a barrier polymer for a particular application typically involves tradeoffs
between permeation, mechanical, and aesthetic properties as well as economic and
recycling considerations. Additionally, there is an ongoing interest in optimizing property
25
sets of barrier polymers to provide an efficient and economical method for packaging and
for extending the shelf life of packaged foods and beverages.
This chapter discusses various types of barrier polymers and structures, their
permeability characteristics and the underlying phenomena involved, measurement
techniques, ways to predict and improve barrier properties, and current as well as
potential future applications for barrier polymers.
2.3 Fundamentals of Permeation in Polymers
The permeability coefficient, or simply permeability, characterizes the steady
state rate of mass transport of penetrant molecules through polymers. In a dense polymer
film, the permeability, P, is defined as the molar flux of penetrant through the polymer
relative to a fixed coordinate system, NA, normalized by the film thickness, L, and the
difference between the upstream (p2) and downstream (p1) partial pressures [14]:
PN L
p pA=-( )2 1
(2.1)
Accordingly, permeability has dimensions of quantity of penetrant (either mass or
moles) times thickness divided by area, time, and pressure. Several units have been used
to report permeability of gases and water vapor in the literature. In the US, a commonly
used unit for permeability of gases in barrier polymers is cm3(STP) mil/(100 in2 day atm).
Table 2.1 provides conversion factors for several permeability units, including the SI unit
mol m/(m2 s Pa), which is typically preferred in technical encyclopedias.
26
The steady-state transport properties of water vapor in barrier polymers are
characterized by water vapor transmission rate (WVTR). The dimensions of WVTR are
quantity of water transmitted through a film times thickness divided by area and time,
and a common unit for WVTR is gm mil/(100 in2 day). Table 2.2 provides conversion
factors for some WVTR units, including the SI unit mol m/(m2 s). WVTR can be
converted to water vapor permeability by dividing by the water partial pressure difference
(which can be calculated from the specified relative humidity and temperature).
Penetrant transport through polymers is described by the so-called solution-
diffusion model [14]. According to this model, permeation through a flat sheet or film
occurs in three steps: penetrant dissolves into the upstream (i.e., the high partial pressure
or high thermodynamic activity) side of the film, diffuses through the film, and desorbs
from the downstream (i.e., the low partial pressure or low thermodynamic activity) side
of the film. The rate-limiting step in this process is diffusion through the film. In one
dimension, penetrant diffusion through a polymer typically follows Fick’s law:
N DdC
dxA = - (2.2)
where D is the effective diffusion coefficient for the penetrant in the polymer and dC/dx
is the local concentration gradient of the penetrant.
When the downstream side penetrant partial pressure and concentration are
negligible relative to those on the upstream face of the film, using the Fick’s law of
diffusion (Equation 2.2), permeability can be expressed as product of the effective
diffusion coefficient, D, and the solubility coefficient, S, which is the ratio of the

27
equilibrium penetrant concentration in the polymer at the upstream side of the film
divided by the penetrant partial pressure or activity in the contiguous phase [14]:
P D S= ¥ (2.3)
According to Equation 2.2, the diffusion coefficient is a kinetic term characterizing the
mass flux of penetrant through a polymer film in response to a concentration gradient
[14]. Diffusion coefficients have units of (length)2/time, and are often expressed in cm2/s.
The solubility or partition coefficient is a thermodynamic factor that links the equilibrium
penetrant concentration in the polymer, C, with the penetrant partial pressure contiguous
to the polymer surface, p [14]:
C S p= ¥ (2.4)
When the penetrants of interest are vapors, liquids, or solids, the partial pressure is often
replaced by penetrant activity. For an ideal gas, penetrant activity is equal to the ratio of
penetrant partial pressure to its saturation vapor pressure [14]. For non-ideal systems
thermodynamic models must be used to estimate penetrant activity [38].
The diffusion process of penetrants in polymers can be broadly classified into two
categories, Fickian (which obeys the Fick’s law of diffusion), and non-Fickian.
Penetrants in rubbery polymers and at low activities in glassy polymers typically exhibit
Fickian behavior [39]. The signature of Fickian diffusion in a thin polymer film contacted
on both faces with a constant partial pressure (or activity) of penetrant is a weight
increase due to penetrant absorption that is initially a linear function of the square root of
the contact time and then asymptotically approaches a fixed equilibrium value [39]. For
Fickian diffusion-controlled kinetics of penetrant transport in a plane film whose
28
thickness (l ) is much smaller than its width or length, the time required to reach steady
state in a permeation experiment, tSS, is given by [39]:
tDss =l2
(2.5)
The diffusion coefficients of large penetrants (e.g., flavor and aroma compounds) in
barrier polymers, which can be of the order of 10-14 cm2/s or less, coupled with a typical
film thickness of 10 µm result in extremely large timescales (over 3 years) to reach
steady state transport. Hence, over the shelf life of packaged products (typically of the
order of several months), flavor and aroma compounds may never achieve equilibrium or
steady state conditions. In such cases, the steady-state permeability does not provide
sufficient information to predict package shelf life. As discussed later, more detailed
knowledge of penetrant solubility and diffusivity is required to accurately predict
migration of such compounds.
In glassy polymers, deviations from Fickian behavior can occur. These deviations
are generally believed to arise as a consequence of the finite rate of polymer structure
reorganization in response to penetrant-induced swelling during the sorption-diffusion
process [26]. An example of so-called non-Fickian diffusion behavior is the penetrant
sorbing into the polymer in two stages, an initial Fickian-like stage followed by a
protracted, slow drift towards the final equilibrium sorption value [27]. In such cases, the
time required to achieve steady state transport may be much higher than that predicted
based on Equation 2.5. This type of diffusion behavior is often observed when organic
vapors at relatively high activity sorb into amorphous glassy polymers [29]. For example,
29
toluene vapors exhibit Fickian diffusion behavior in amorphous poly(vinyl chloride)
(PVC) films at activities up to 0.4 and show increasingly non-Fickian behavior at higher
activities [40].
2.4 Mechanism of Penetrant Transport in Dense Polymers
The rate limiting step for penetrant diffusion is the creation of transient “gaps” in
the polymer matrix via local scale polymer segmental dynamics involving several
polymer chains [41]. Penetrant molecules vibrate inside local cavities in the polymer
matrix at frequencies much higher than the frequency of polymer chain motion required
to open a gap of sufficient size to accommodate the penetrant. These steps are shown
schematically in Figure 2.1. In Figure 2.1a, a penetrant molecule is shown dissolved in a
polymer matrix. The penetrant vibrates inside a gap or molecular scale cavity in the
polymer matrix at very high frequency (ca. 1012 vibrations/sec or 1 vibration per
picosecond) [41]. The polymer molecules do not occupy the entire volume of the polymer
sample. Due to packing inefficiencies and polymer chain molecular motion, some of the
volume in the polymer matrix is empty or “free” and this so-called free volume is
redistributed continuously as a result of the random, thermally stimulated molecular
motion of the polymer segments [14].
In Figure 2.1b, local polymer segmental motion has opened a connecting channel
between two free volume elements in the polymer matrix and the penetrant molecule can,
as a result of its own Brownian motion, explore the entire corridor between the initial free
volume element which it occupied and the second free volume element which is
30
connected to it via the opening of a transient gap in the polymer matrix. Eventually, local
segmental motion of the polymer segments closes the connection between the two free
volume elements and if the penetrant happens to be away from its original position, as
shown in Figure 2.1c, when the gap in the polymer matrix is closed, the penetrant will be
trapped in another free volume element in the polymer matrix and will have executed a
diffusion step. The process shown in Figure 2.1 has been called the “Red Sea”
mechanism of penetrant transport in polymers [41].
Figure 2.2 shows a cartoon of two polymer chains undergoing coordinated local
segmental motion as a result of random, thermally-stimulated movements of the polymer
chains to open a gap between the polymer chains of sufficient size to permit passage of a
penetrant molecule from one free volume element to another [42]. This cartoon
emphasizes that the polymer segmental motion is the rate-controlling step in penetrant
diffusion.
Figure 2.3 provides a very simplistic cartoon of the molecular processes involved
in the local segmental motions of polymers that contribute to the formation of transient
gaps in the polymer matrix important for penetrant diffusion. This figure shows what is
believed to be a typical example of intramolecular cooperative local segmental motion of
the polymer backbone of a polyethylene chain. This so-called crankshaft motion requires
the cooperation of several adjacent ethylene units and can act to create gaps in the
polymer matrix of sufficient size to accommodate small penetrant molecules. It should be
emphasized that the detailed understanding of the molecular level motions in polymers
that contribute to diffusion is evolving rapidly as a result of more detailed atomistic
31
simulation of penetrant transport in polymers. As a result, more realistic descriptions of
the important molecular processes for penetrant diffusion in polymers should be expected
in the near future.
The motion of polymer segments to produce a gap of sufficient size to
accommodate a penetrant molecule is much slower than the vibration of the penetrant in a
gap in the polymer matrix. For example, Hofman’s computer simulations of oxygen
diffusion in a polyimide reveal that the oxygen molecules execute a diffusion step
approximately once every nanosecond (1000ps=1ns) [43]. The rate of production of gaps
of sufficient size to accommodate penetrant molecules decreases with increasing size of
the penetrant. That is, there are fewer gaps produced per unit time in a polymer matrix of
sufficient size to accommodate methane (kinetic diameter=3.8Å), for example, than there
are for hydrogen (kinetic diameter=2.89Å).
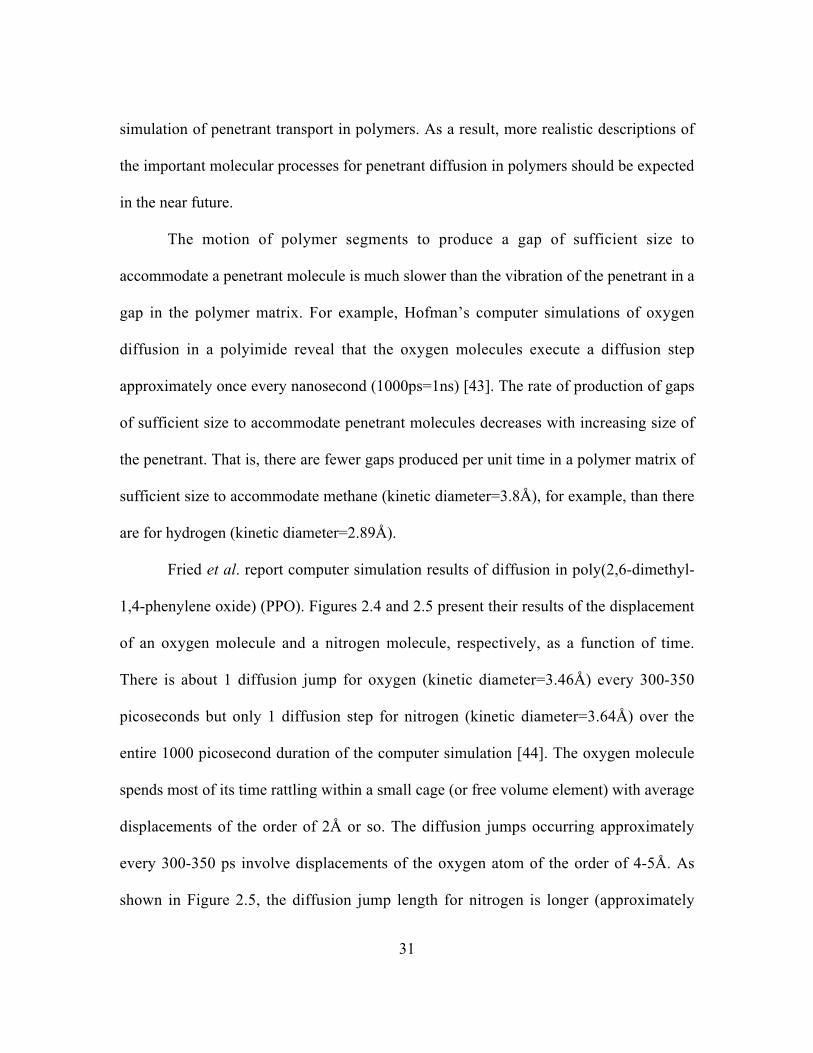
Fried et al. report computer simulation results of diffusion in poly(2,6-dimethyl-
1,4-phenylene oxide) (PPO). Figures 2.4 and 2.5 present their results of the displacement
of an oxygen molecule and a nitrogen molecule, respectively, as a function of time.
There is about 1 diffusion jump for oxygen (kinetic diameter=3.46Å) every 300-350
picoseconds but only 1 diffusion step for nitrogen (kinetic diameter=3.64Å) over the
entire 1000 picosecond duration of the computer simulation [44]. The oxygen molecule
spends most of its time rattling within a small cage (or free volume element) with average
displacements of the order of 2Å or so. The diffusion jumps occurring approximately
every 300-350 ps involve displacements of the oxygen atom of the order of 4-5Å. As
shown in Figure 2.5, the diffusion jump length for nitrogen is longer (approximately
32
10Å) and the jumps occur less frequently. However, these results are obtained for very
short periods of time due to computational limitations, and very long simulations would
be required to generate precise estimates of jump lengths and jump frequencies. Due to
the extremely demanding computational resources required for such molecular-level
simulations, they are only now becoming possible for small molecule migration in
relatively permeable polymers. As yet, computers are not fast enough to provide realistic
simulations of phenomena such as migration of large flavor molecules in high barrier
polymers.
2.5 Factors Affecting Permeability, Diffusivity, and Solubility
2.5.1 Free Volume
The dependence of penetrant transport properties on chain packing in polymers is
often described using correlations involving the fractional free volume (FFV) of
polymers. FFV is the fraction of volume in a polymer that is available to assist in
penetrant transport. FFV does not include volume occupied by polymer molecules and
volume in the polymer matrix that is otherwise unavailable for penetrant transport. FFV
is often estimated using group contribution methods. One popular method for estimating
FFV is based on the following expression [14]:
FFVV V
Vo=
-(2.6)
where V is the polymer specific molar volume, and Vo is the so-called occupied volume
that is not available to assist in penetrant transport. The occupied volume is usually
estimated by Bondi’s method as follows [45]:
33
V Vw0 1 3= . (2.7)
where Vw is van der Waals volume of the molecule. A good estimate of Vw can be
obtained from bond radii, van der Waals radii of constituent atoms, and geometric
factors. Bond radii are nearly constant from one molecule to another since the same
chemical bond will always have the same radius. The most complete list of Vw values is
available in the compilation by van Krevelen [46]. The dependence of diffusion
coefficients on FFV can be expressed as [47]:
D AB
FFV=
-ÊËÁ
ˆ¯̃exp (2.8)
where A and B are empirical constants. The higher the FFV, the larger the diffusion
coefficient. Figure 2.6 shows the effect of free volume on gas diffusion coefficients in a
series of substituted polysulfones [48].
The dependence of solubility on FFV is usually weaker than that of diffusivity
especially in amorphous polymers [22]. Therefore, permeability often follows a similar
dependence on free volume as penetrant diffusivity. Attempts have been made to
correlate FFV of polymers with gas permeability [49,50]. As shown in Figure 2.7 [49], a
nearly linear correlation was found to exist between the logarithm of oxygen permeability
coefficients and the inverse of FFV in several families of amorphous, glassy polymers
and high barrier liquid crystalline polymers. Many barrier polymers are glassy materials,
since their use temperature is below their glass transition temperature. In glassy
polymers, which are non-equilibrium materials, free volume can be altered to some extent
by the processing history of the sample [51]. For instance, higher rates of cooling create
34
higher free volume in the glassy state, and vice versa. A more effective way to alter free
volume is to vary the chemical structure by, for example, adding or removing pendant
groups on the polymer backbone [51]. The presence of polar groups with low specific
volumes can reduce the free volume (and hence, penetrant diffusion coefficients) by
facilitating more efficient packing of the polymer chains due to stronger interactions
between them [51]. For example, barrier polymers like polyacrylonitrile (PAN) and
poly(vinyl alcohol) (PVOH) have polar pendant groups, which lead to strong energetic
interactions between the polymer chains, efficient polymer chain packing, low free
volume and, in turn, low permeability coefficients.
Free volume in polymers can be measured using probes such as electrochromic,
photochromic, and fluoroscent probes, as well as xenon nuclear magnetic resonance,
small angle X-ray scattering, density measurements, and positron annihilation lifetime
spectroscopy (PALS) [52]. Each method has its strengths and limitations, and a simple,
direct measure of FFV is not available. The PALS technique has, however, emerged in
the past several years as a valuable non-destructive probe of free volume in polymers
[52,53]. PALS uses orthoPositronium (oPs) as a probe of free volume in the polymer
matrix. oPs resides in regions of reduced electron density, such as free volume elements,
that typically range in radius from 0.2 to 0.4 nm. This range of cavity radii compares well
with non-bonded interatomic distances in polymers and molecular radii of diffusing
penetrants [52]. PALS permits an estimate of both the size and concentration of free
volume elements in the polymer matrix. Transport properties of barrier polymers,

35
copolymers, and polymer blends have been well correlated with FFV as measured by
PALS [52-58].
2.5.2 Temperature
The temperature dependence of permeability and diffusivity are usually modeled
using Arrhenius equations of the following forms [14]:
P PE
RTop=
-ÊËÁ
ˆ¯̃
exp (2.9)
D DE
RToD=
-ÊËÁ
ˆ¯̃exp (2.10)
where Ep and ED are activation energies for permeation and diffusion, and Po and Do are
pre-exponential factors. The effect of temperature on solubility is usually expressed by a
van’t Hoff relationship [14]:
S SH
RTos=
-ÊËÁ
ˆ¯̃exp
D(2.11)
where So is a pre-exponential factor, and ∆Hs is the heat of sorption of penetrant in the
polymer. Since steady-state permeability is the product of diffusivity and solubility, the
activation energy of permeation can be defined as the sum of activation energy of
diffusion and the heat of sorption [14]:
E E Hp d s= + D (2.12)
Ed is always positive, and ∆Hs can be positive or negative for light gases (such as H2, O2,
N2 etc.) as well as larger, more soluble penetrants (such as C3H8, C4H10 etc.). For
polymers like low density polyethylene (LDPE) and poly(vinyl chloride) (PVC), Ep is
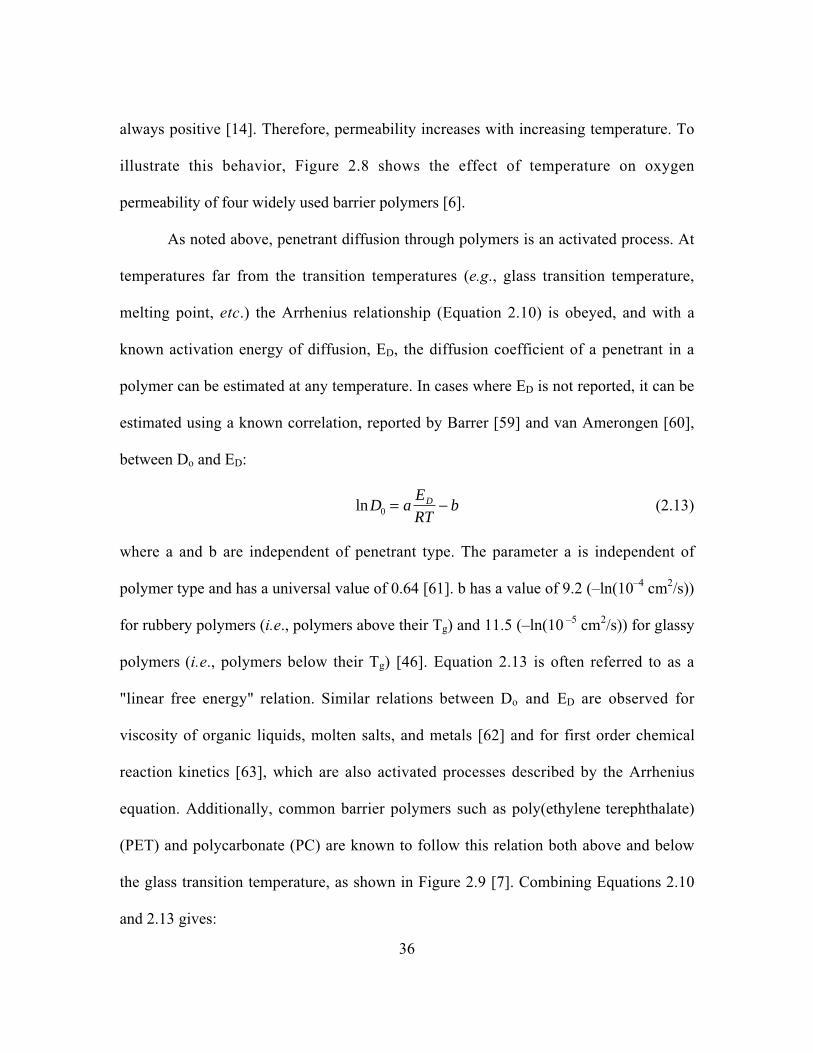
36
always positive [14]. Therefore, permeability increases with increasing temperature. To
illustrate this behavior, Figure 2.8 shows the effect of temperature on oxygen
permeability of four widely used barrier polymers [6].
As noted above, penetrant diffusion through polymers is an activated process. At
temperatures far from the transition temperatures (e.g., glass transition temperature,
melting point, etc.) the Arrhenius relationship (Equation 2.10) is obeyed, and with a
known activation energy of diffusion, ED, the diffusion coefficient of a penetrant in a
polymer can be estimated at any temperature. In cases where ED is not reported, it can be
estimated using a known correlation, reported by Barrer [59] and van Amerongen [60],
between Do and ED:
lnD aE
RTbD
0 = - (2.13)
where a and b are independent of penetrant type. The parameter a is independent of
polymer type and has a universal value of 0.64 [61]. b has a value of 9.2 (–ln(10–4 cm2/s))
for rubbery polymers (i.e., polymers above their Tg) and 11.5 (–ln(10 –5 cm2/s)) for glassy
polymers (i.e., polymers below their Tg) [46]. Equation 2.13 is often referred to as a
"linear free energy" relation. Similar relations between Do and ED are observed for
viscosity of organic liquids, molten salts, and metals [62] and for first order chemical
reaction kinetics [63], which are also activated processes described by the Arrhenius
equation. Additionally, common barrier polymers such as poly(ethylene terephthalate)
(PET) and polycarbonate (PC) are known to follow this relation both above and below
the glass transition temperature, as shown in Figure 2.9 [7]. Combining Equations 2.10
and 2.13 gives:
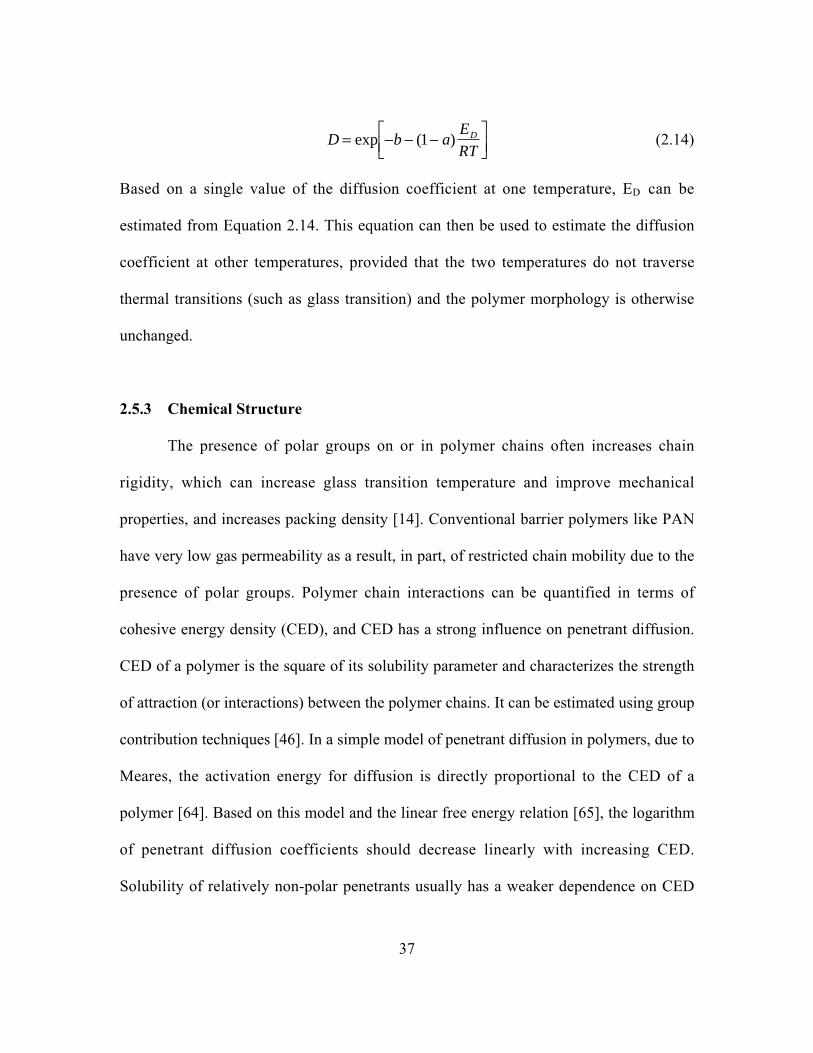
37
D b aE
RTD= - - -È
Î͢˚̇
exp ( )1 (2.14)
Based on a single value of the diffusion coefficient at one temperature, ED can be
estimated from Equation 2.14. This equation can then be used to estimate the diffusion
coefficient at other temperatures, provided that the two temperatures do not traverse
thermal transitions (such as glass transition) and the polymer morphology is otherwise
unchanged.
2.5.3 Chemical Structure
The presence of polar groups on or in polymer chains often increases chain
rigidity, which can increase glass transition temperature and improve mechanical
properties, and increases packing density [14]. Conventional barrier polymers like PAN
have very low gas permeability as a result, in part, of restricted chain mobility due to the
presence of polar groups. Polymer chain interactions can be quantified in terms of
cohesive energy density (CED), and CED has a strong influence on penetrant diffusion.
CED of a polymer is the square of its solubility parameter and characterizes the strength
of attraction (or interactions) between the polymer chains. It can be estimated using group
contribution techniques [46]. In a simple model of penetrant diffusion in polymers, due to
Meares, the activation energy for diffusion is directly proportional to the CED of a
polymer [64]. Based on this model and the linear free energy relation [65], the logarithm
of penetrant diffusion coefficients should decrease linearly with increasing CED.
Solubility of relatively non-polar penetrants usually has a weaker dependence on CED

38
than diffusivity, and hence, the logarithm of permeability should decrease linearly with
increasing CED. As shown in Figure 2.10, a nearly linear correlation was found between
oxygen permeability and CED of barrier polymers with permeability values ranging over
5 orders of magnitude [66,67].
Penetrant diffusivity, and hence permeability, can also be decreased by adding
substituents to the polymer chain that reduce chain flexibility. Bulky side groups or rigid
linkages such as aromatic groups decrease chain flexibility and hence, reduce penetrant
diffusion coefficients. Flexible linkages, such as ether or methylene groups, produce the
opposite effect [14]. Several methods are used to characterize chain flexibility [14]. The
glass transition temperature is a measure of long range or bulk molecular motion, and
high Tg materials are usually rigid and inflexible. Sub-Tg relaxations are another
indication of molecular motion and correlations of O2 and CO2 permeability with sub-Tg
relaxations have been observed within a family of amorphous polyesters and copolyesters
[68]. However, the exact nature of molecular motions which control penetrant diffusion
are complex and unclear, and hence Tg and sub-Tg relaxations do not, in general, provide
predictive correlations with penetrant diffusivity [14].
Changes in molecular structure of the polymer often affect more than one factor
influencing permeability and the net effect can be difficult to anticipate. For example,
addition of bulky side groups can stiffen the polymer chains, which is expected to reduce
the diffusion coefficients. However, the same modification could also decrease chain
packing in the amorphous phase and reduce the level of crystallinity in the polymer,
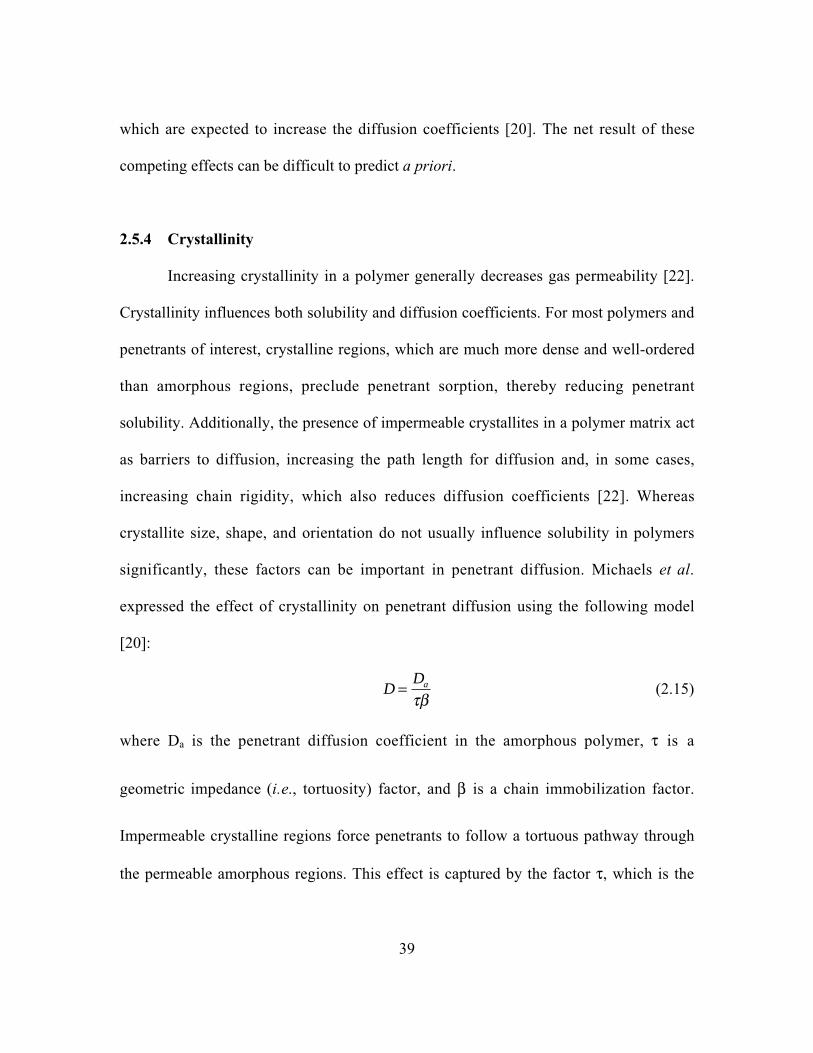
39
which are expected to increase the diffusion coefficients [20]. The net result of these
competing effects can be difficult to predict a priori.
2.5.4 Crystallinity
Increasing crystallinity in a polymer generally decreases gas permeability [22].
Crystallinity influences both solubility and diffusion coefficients. For most polymers and
penetrants of interest, crystalline regions, which are much more dense and well-ordered
than amorphous regions, preclude penetrant sorption, thereby reducing penetrant
solubility. Additionally, the presence of impermeable crystallites in a polymer matrix act
as barriers to diffusion, increasing the path length for diffusion and, in some cases,
increasing chain rigidity, which also reduces diffusion coefficients [22]. Whereas
crystallite size, shape, and orientation do not usually influence solubility in polymers
significantly, these factors can be important in penetrant diffusion. Michaels et al.
expressed the effect of crystallinity on penetrant diffusion using the following model
[20]:
DDa=tb
(2.15)
where Da is the penetrant diffusion coefficient in the amorphous polymer, t is a
geometric impedance (i.e., tortuosity) factor, and b is a chain immobilization factor.
Impermeable crystalline regions force penetrants to follow a tortuous pathway through
the permeable amorphous regions. This effect is captured by the factor t, which is the
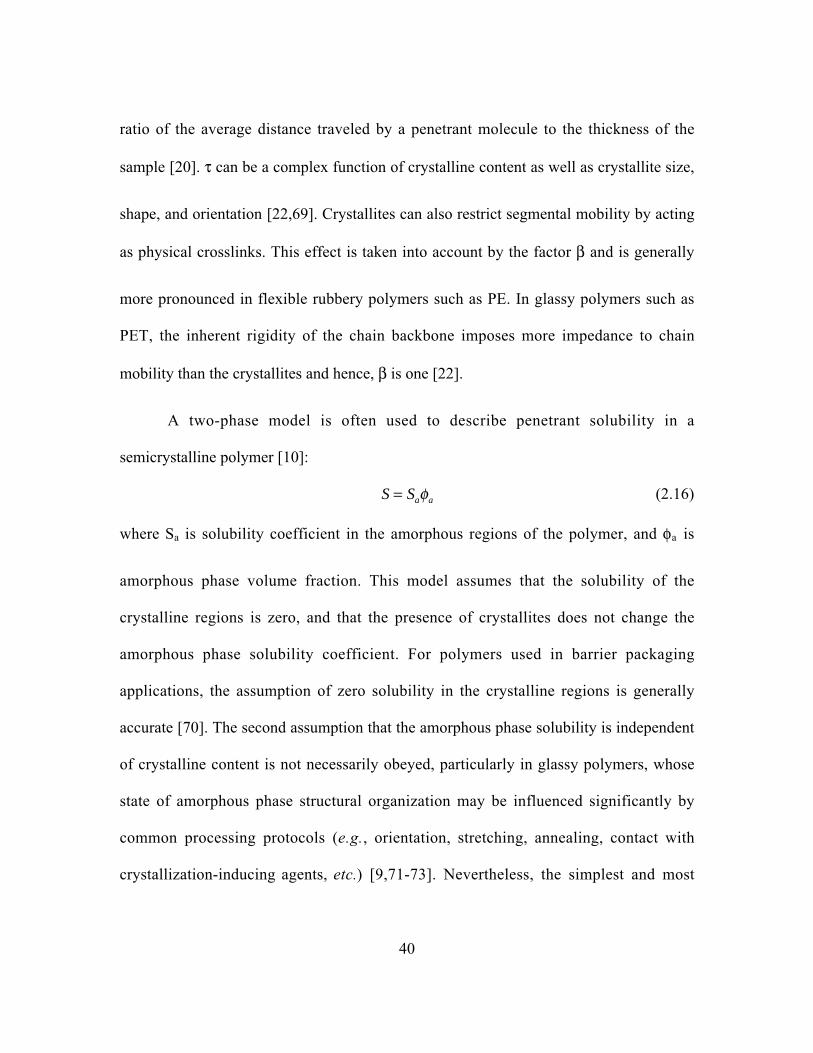
40
ratio of the average distance traveled by a penetrant molecule to the thickness of the
sample [20]. t can be a complex function of crystalline content as well as crystallite size,
shape, and orientation [22,69]. Crystallites can also restrict segmental mobility by acting
as physical crosslinks. This effect is taken into account by the factor b and is generally
more pronounced in flexible rubbery polymers such as PE. In glassy polymers such as
PET, the inherent rigidity of the chain backbone imposes more impedance to chain
mobility than the crystallites and hence, b is one [22].
A two-phase model is often used to describe penetrant solubility in a
semicrystalline polymer [10]:
S Sa a= f (2.16)
where Sa is solubility coefficient in the amorphous regions of the polymer, and fa is
amorphous phase volume fraction. This model assumes that the solubility of the
crystalline regions is zero, and that the presence of crystallites does not change the
amorphous phase solubility coefficient. For polymers used in barrier packaging
applications, the assumption of zero solubility in the crystalline regions is generally
accurate [70]. The second assumption that the amorphous phase solubility is independent
of crystalline content is not necessarily obeyed, particularly in glassy polymers, whose
state of amorphous phase structural organization may be influenced significantly by
common processing protocols (e.g., orientation, stretching, annealing, contact with
crystallization-inducing agents, etc.) [9,71-73]. Nevertheless, the simplest and most
41
commonly used model for the effect of crystallinity on steady-state permeability is based
on these assumptions and is expressed by the following relationship:
P SD
a aa=
ÊËÁ
ˆ¯̃
( )ftb
(2.17)
Figure 2.11 shows the effect of crystallinity on gas permeability in polyethylene at 25°C.
Permeability decreases with increasing crystallinity primarily due to decreasing diffusion
coefficients. The effect of crystallinity is more pronounced on the tortuosity factor, t than
the chain immobilization factor, b [74]. In glassy polymers, the most widely used
approximations for t and b are t = fa-1 and b = 1. Introducing these values into the above
equation yields, P = Pafa2, where Pa is the amorphous phase permeability.
In certain polymers, the simple assumptions of the two-phase model do not hold.
For example, poly(4-methyl-1-pentene) (PMP), which is a highly permeable polymer, has
a very low density crystal structure and hence, penetrant molecules can sorb into its
crystalline phase [70]. In PET, Michaels et al. observed that the presence of crystalline
regions increased the concentration of sorption sites in the amorphous regions remaining
in the polymer after crystallization [10]. Others have recently examined this phenomenon
in PET in more detail [75,76]. Serad et al. [9] reported that exposing amorphous PET to a
strongly sorbing penetrant at high activity results in penetrant-induced crystallization.
This process affects the amorphous phase penetrant solubility of PET resulting in a
marked increase in overall solubility with increasing crystallinity. For example,
acetaldehyde solubility in PET increased by more than 300% as a result of penetrant-

42
induced crystallinity of about 36 wt% [9]. This effect was attributed to the creation of
microvoids in the polymer as a by-product of penetrant-induced crystallization [9].
Evidence for microvoid formation in PET due to exposure to strongly sorbing penetrants
has been presented in studies investigating solvent treatments to improve the dyeability of
PET yarns [71], and in studies investigating the effect of crystallizing liquids on the
morphology of PET [72,73]. For example, Weigmann et al. reported that dye uptake in
PET fibers exposed to dimethylformamide (DMF) was four to five times higher than the
unexposed fibers [71]. The dye diffusion coefficient was also more than two orders of
magnitude higher in the DMF-exposed samples than in the unexposed samples [77].
2.5.5 Chain Orientation
Stretching or drawing of polymer films can improve mechanical properties, and
under certain conditions, barrier properties. The degree of chain orientation achieved is
dependent on the draw ratio and other process conditions [22]. Orientation is usually
characterized by birefringence and quantified by the Herman’s orientation function, f
[78]:
f = -( )12
3 12cos q (2.18)
where q is the average angle between the polymer chain axis and the draw direction.
Depending on the mode of deformation and the physical processes that occur
during orientation, permeability may either increase or decrease with increasing
orientation [22]. Impermeable polymer crystallites may become oriented into plate-like
43
structures during deformation, and this process generally decreases penetrant diffusivity
by increasing tortuosity [22]. In addition, drawing of semicrystalline polymers can
improve barrier properties through stress-induced crystallization and orientation of the
remaining amorphous phase. Hence, the reduction in permeability caused by orientation
of crystallizable polymers can be greater than that in non-crystallizable polymers [22].
The dramatic effect of orientation is supported by oxygen permeability data for PET in
the literature. A 4X biaxial orientation (i.e., draw ratio = 4 in each axis) decreased the
permeability of oxygen in PET by a factor of about two [24]. For other systems, however,
increases in permeability upon biaxial orientation have also been reported. A vinylidene
chloride/vinyl chloride (VDC) copolymer, for example, showed an increase in oxygen
permeability from 0.2 cm3 mil / (100 in2 day atm) to 0.3 cm3 mil / (100 in2 day atm) upon
2.5X biaxial orientation [79]. The permeability increase was attributed to microvoid
development during orientation of the polymer chains after crystallinity was fully
developed. Table 2.3 shows the effect of orientation on oxygen permeability of
semicrystalline and amorphous barrier polymers [79]. In semicrystalline VDC copolymer
and nylon MXD-6 polymers, under the conditions studied, the orientation process results
in a slight increase in oxygen permeability with chain orientation, whereas the reverse is
true for amorphous Selar‚ 3426 and polyacrylic-imide barrier polymers.
44
2.5.6 Penetrant Concentration (or Partial Pressure)
The influence of penetrant concentration on solubility, diffusivity and, in turn
permeability varies depending on the penetrant-polymer system. Rubbery and glassy
polymers typically show little or no concentration dependence for solubility, diffusivity,
and permeability of light gases such as H2, N2, O2, etc. Consistent with this notion, Figure
2.12a shows essentially no influence of pressure on H2 permeability in PE [51]. Gases
such as CO2, which are more soluble than light gases, typically have a permeability-
presssure response in glassy polymers similar to that shown in Figure 2.12b. Permeability
decreases monotonically with increasing pressure as predicted by the dual-mode sorption
model [18]. The magnitude of the permeability decrease depends upon the amount of so-
called non-equilibrium excess volume in the polymer, which can increase with increasing
Tg, the affinity of the penetrant for the non-equilibrium excess volume, and the mobility
of the penetrant in the non-equilibrium excess volume relative to its mobility in the
equilibrium free volume [14]. The permeability of a rubbery polymer to an organic vapor
often exhibits the behavior shown in Figure 2.12c. The monotonic increase in
permeability is often due to increases in penetrant solubility with increasing pressure
coupled with increases in diffusivity with increasing pressure [14]. The response shown
in Figure 2.12d is typical for strongly interacting penetrants (e.g., organic vapors) in
glassy polymers at sufficiently high penetrant partial pressures. It can be viewed as a
superposition of the behaviors in Figures 2.12b and 2.12c [14]. The sharp increase in
permeability begins as the penetrant plasticizes the polymer. Plasticization occurs when
penetrant molecules dissolve in the polymer matrix at sufficient concentration to force
45
polymer chain segment separation, thereby increasing the free volume, and in turn,
facilitating polymer segmental motion. This increase in segmental mobility, which may
be observed by the depression in Tg, results in an increase in penetrant diffusion
coefficients and, in turn, permeability [14].
2.5.7 Humidity
The absorption of water can increase, decrease, or have no effect on gas
permeability of barrier polymers [6]. Increasing the relative humidity (RH) from 0 to
50% increases the oxygen permeability of cellophane (regenerated cellulose) by an order
of magnitude, and exposure to 90% RH removes it from the class of high barriers by
further increasing the permeability by more than an order of magnitude [6]. For
packaging of foods that require protection against oxygen ingress, cellophane is coated or
laminated with water barriers such as polyolefins [6]. Other hydrophilic barrier polymers,
with the exception of certain amorphous polyamides, also lose their barrier properties
with increasing RH as shown in Figure 2.13. This is because water acts as a plasticizer
and increases the free volume of the polymer [80]. However, at low to moderate RH,
amorphous polyamides and poly(ethylene terephthalate) show slightly improved barrier
properties with increasing RH [6]. This behavior has been explained as the water
molecules not swelling the polymer, but occupying some the polymer free volume sites
instead, resulting in reduction in permeability of other gases [81]. Vinylidene chloride
copolymers, acrylonitrile copolymers, and polyolefins show essentially no effect of RH
on gas permeability [82].
46
2.6 Techniques for Measuring Transport Properties
The determination of permeability, solubility, and diffusivity requires direct or
indirect measurement of mass transfer under controlled conditions. The permeability of
barrier polymers can be determined directly by measuring the pressure change or other
physical evidence of transfer or indirectly by using an indicator of permeation, such as
chemical reaction of the transferring gas with another substance. The preferred methods
of measurement differ for different classes of penetrants: light gases, water vapor,
condensable vapors, and food flavor and aroma compounds.
There are two basic methods for measuring permeability: isostatic and quasi-
isostatic [80]. Isostatic methods employ a continuous flow on both sides of the polymer
film to provide constant penetrant concentrations. Quasi-isostatic methods use a
continuous flow to maintain constant penetrant concentration only on the upstream side
and allow penetrant accumulation on the downstream side of the film. However, this
accumulation is limited to a very low concentration, and hence the penetrant partial
pressure difference can be approximated as a constant [80]. Figure 2.14a typically shows
the course of an isostatic permeability experiment for a barrier polymer film of uniform
thickness exposed to constant penetrant partial pressure, p, on the upstream side and
constant removal of penetrant that has permeated through the film to the downstream
side. Using a specified initial condition (concentration in the film uniformly equal to
zero) and boundary conditions (constant penetrant concentration, C, at the upstream side
and zero penetrant concentration at the downstream side), this situation can be described
by the following mathematical expression [83]:
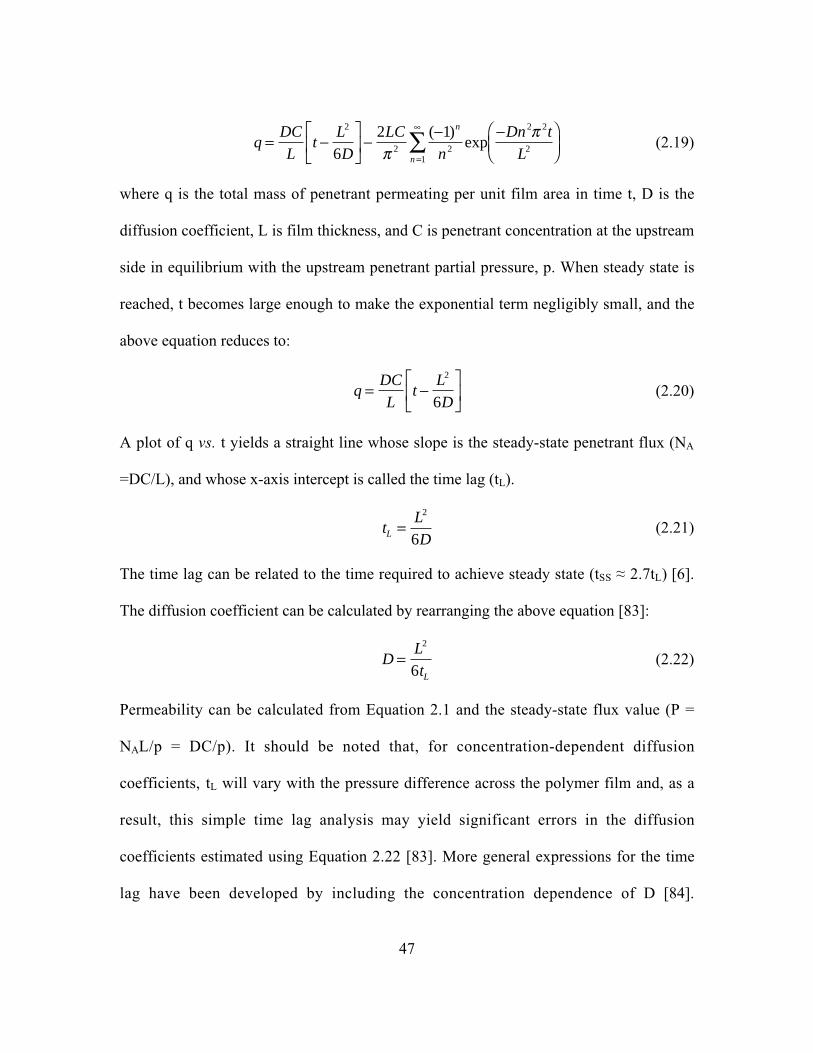
47
qDC
Lt
L
D
LC
n
Dn t
L
n
n
= -È
ÎÍ
˘
˚˙ -
- -ÊËÁ
ˆ¯̃=
•
Â2
2 2
2 2
216
2 1p
p( )exp (2.19)
where q is the total mass of penetrant permeating per unit film area in time t, D is the
diffusion coefficient, L is film thickness, and C is penetrant concentration at the upstream
side in equilibrium with the upstream penetrant partial pressure, p. When steady state is
reached, t becomes large enough to make the exponential term negligibly small, and the
above equation reduces to:
qDC
Lt
L
D= -
È
ÎÍ
˘
˚˙
2
6(2.20)
A plot of q vs. t yields a straight line whose slope is the steady-state penetrant flux (NA
=DC/L), and whose x-axis intercept is called the time lag (tL).
tL
DL =2
6(2.21)
The time lag can be related to the time required to achieve steady state (tSS ≈ 2.7tL) [6].
The diffusion coefficient can be calculated by rearranging the above equation [83]:
DL
tL=
2
6(2.22)
Permeability can be calculated from Equation 2.1 and the steady-state flux value (P =
NAL/p = DC/p). It should be noted that, for concentration-dependent diffusion
coefficients, tL will vary with the pressure difference across the polymer film and, as a
result, this simple time lag analysis may yield significant errors in the diffusion
coefficients estimated using Equation 2.22 [83]. More general expressions for the time
lag have been developed by including the concentration dependence of D [84].

48
Alternatively, a ‘concentration-averaged’ diffusion coefficient can be obtained by
plotting normalized penetrant flux (i.e., flux at any time t divided by the steady-state flux)
as a function of time (Figure 2.14b). The diffusion coefficient can be estimated using the
following relationship [85]:
DL
t=
2
1 27 2. /
(2.23)
where t1/2 is the half time (i.e., time required for the penetrant flux to reach half of its
steady-state value). Thus, permeability, diffusivity, and hence solubility (S = P/D), can be
determined from a single experiment. Given the ready availability of computing power, it
is now possible to use any of a variety of numerical techniques to fit the entire response
and extract the desired parameters and, when applicable, their concentration dependence.
2.6.1 Oxygen and Carbon Dioxide Permeation
The most widely used commercial instrument for measuring oxygen transmission
rates of flat films and packages is the Ox-Tran® (Modern Controls Inc., Minneapolis,
MN), and measurements are made in accordance with ASTM method D 3985 [86]. In this
isostatic coulometric method, flat film samples are clamped into a diffusion cell, which is
then purged of residual oxygen using an oxygen-free carrier gas such as N2. The carrier
gas is routed to the instrument sensor until a stable zero has been established. Pure
oxygen is then introduced into the outside chamber of the diffusion cell (see Figure 2.15)
[87]. Oxygen molecules diffusing through the film to the inside chamber are conveyed to
the sensor by the carrier gas. The Ox-Tran‚ system uses a patented coulometric sensor
49
(Coulox®) to detect oxygen transmission through both flat films and packages. This
sensor provides parts-per-billion sensitivity to oxygen even in the presence of water
vapor. Digital pressure and flow controls allow for RH control. Alternative instruments
for measuring oxygen transmission rates include Oxygen Permeation Analyzers from
Illinois Instruments Inc. (Ingleside, IL).
Modern Controls, Inc. (MOCON) also makes instruments for measuring carbon
dioxide permeation. Their Permatran-C® line of instruments use an infrared detector to
detect carbon dioxide that permeates through the test film.
2.6.2 Water Vapor Permeation
Water vapor transmission rates (WVTR) can either be measured by the traditional
gravimetric ‘cup’ method [2], or by newer electronic instruments. The newer method
(e.g., ASTM method F 1249 [88]) uses infrared detection to measure water vapor
transmission through barrier films. One of the most widely used commercial WVTR
systems is Permatran-W® (Modern Controls Inc., Minneapolis, MN). The newest model
of this system (Permatran-W 3/31®) uses a patented modulated infrared sensor to detect
water vapor transmission through flat films and packages. It provides sensitivity in the
range of parts-per-million. Various models are available with different temperature and
RH capabilities.
Lyssy AG (Zollikon, Switzerland) also manufactures automatic water vapor
permeability testers designated as the L80 line of instruments. The L80-5000 is the
newest member and the fifth generation in this series.
50
In the traditional method (ASTM method E 96) [6], a sample cell containing
either a desiccant or distilled water is covered with the sample film and placed in a
controlled atmosphere. Typical conditions for the desiccant method are 100°F (37.8°C)
and an external RH of 90%, although the standard also allows for temperatures between
70 and 90°F (21 and 32°C) at 50 ± 2% RH. The cell assembly is weighed periodically
until steady state is reached. WVTR can be calculated from the steady-state rate of
change in the weight of the cell.
2.6.3 Flavor and Aroma Compounds
Measurement of transport rates of flavor and aroma vapors in plastics is more
complicated than that of either water vapor or light gases. Elaborate equipment and
sensitive analytical devices are required to obtain reliable results. Since the transport
behavior of these compounds is often strongly concentration dependent, measurements
must be made in the activity range in which the compounds are present in practice. Thus,
some of the major complexities include providing precisely mixed quantities of the
condensable vapor in an inert carrier like nitrogen or argon at very low concentrations,
typically a few parts-per-million, and assuring that the concentration is maintained.
Temperature must also be carefully controlled to prevent condensation on equipment
surfaces [6].
As such, no single instrument has gained the widespread acceptance noted above
for instruments for O2, CO2, and water vapor, though several methods have been used to
measure transport properties of flavor and aroma compounds in barrier polymers. These
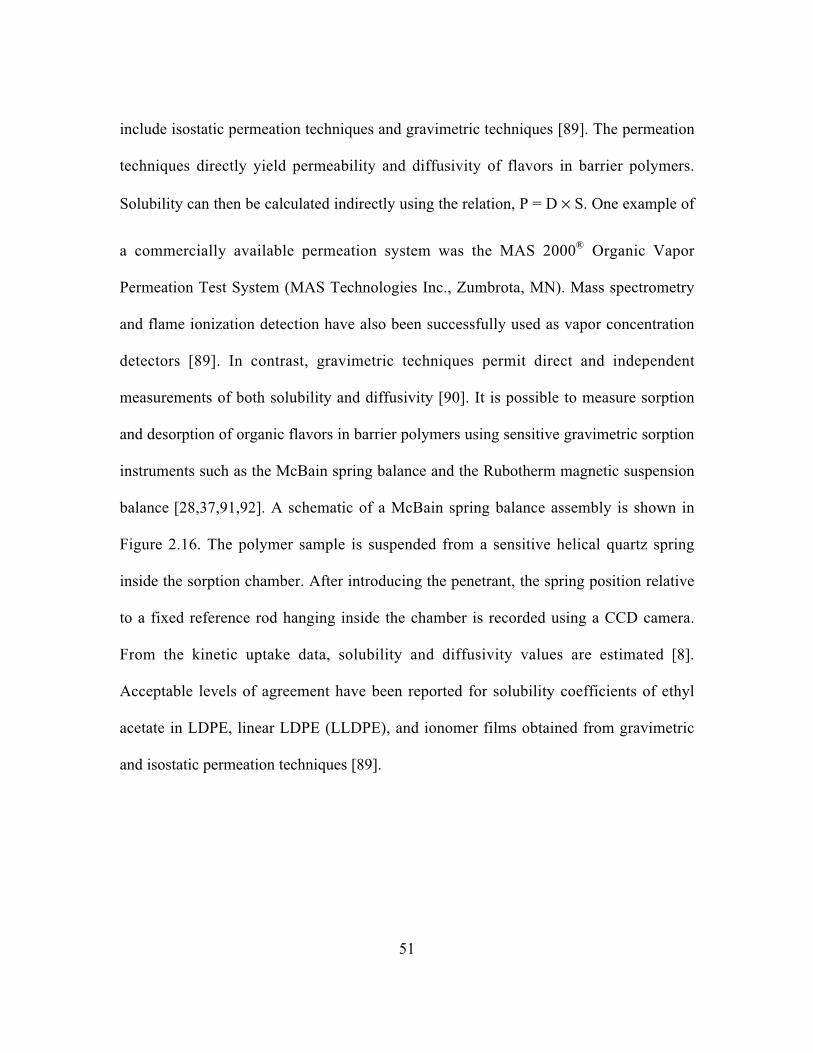
51
include isostatic permeation techniques and gravimetric techniques [89]. The permeation
techniques directly yield permeability and diffusivity of flavors in barrier polymers.
Solubility can then be calculated indirectly using the relation, P = D ¥ S. One example of
a commercially available permeation system was the MAS 2000® Organic Vapor
Permeation Test System (MAS Technologies Inc., Zumbrota, MN). Mass spectrometry
and flame ionization detection have also been successfully used as vapor concentration
detectors [89]. In contrast, gravimetric techniques permit direct and independent
measurements of both solubility and diffusivity [90]. It is possible to measure sorption
and desorption of organic flavors in barrier polymers using sensitive gravimetric sorption
instruments such as the McBain spring balance and the Rubotherm magnetic suspension
balance [28,37,91,92]. A schematic of a McBain spring balance assembly is shown in
Figure 2.16. The polymer sample is suspended from a sensitive helical quartz spring
inside the sorption chamber. After introducing the penetrant, the spring position relative
to a fixed reference rod hanging inside the chamber is recorded using a CCD camera.
From the kinetic uptake data, solubility and diffusivity values are estimated [8].
Acceptable levels of agreement have been reported for solubility coefficients of ethyl
acetate in LDPE, linear LDPE (LLDPE), and ionomer films obtained from gravimetric
and isostatic permeation techniques [89].
52
2.7 Techniques for Predicting Transport Properties
2.7.1 Modeling Transport Properties of Gases and Condensable Vapors in
Polymers
The permeation of low molecular weight gases such as O2, N2, CO2 as well as
large flavor and aroma compounds is an essential consideration in the selection and
design of food packages and containers. Predictive models for permeation would
minimize the number of experiments required in package material selection and
development. Perhaps, more importantly, they also provide an insight into the underlying
factors controlling permeation in barrier polymers.
The permachor method has been used to predict permeabilities of low molecular
weight penetrants in barrier polymers [93]. Although originally developed for O2, N2, and
CO2, this method can be extended to other gases and vapors, provided there is no specific
interaction between the penetrant and the polymer. It has been successfully used for over
60 different polymers [93]. In this method, numerical values (i.e., group contributions)
are assigned to polymer segments. An average numerical value can then be obtained for
the polymer, which is referred to as the permachor value of the polymer. A simple
equation is used to relate gas permeability, P, to polymer permachor value, p:
P Ae s= - p (2.24)
where A and s are temperature-dependent constants. This method also takes into account
the reduction in permeability caused due to orientation of crystalline polymers using the
following expressions:

53
PA
eo
s=ÊËÁ
ˆ¯̃
-
tp (2.25)
tfo
a
ª1 13.
(2.26)
where to is tortuosity related to crystallite orientation, and fa is the amorphous phase
volume fraction. A good agreement has been reported between experimental and model
predictions of O2, N2, and CO2 permeability values in a variety of polymers [93]. This
method has also been modified for predicting liquid permeation through polymers [2].
The permachor method works well for polymers and copolymers, but is not applicable to
polymer blends [6]. As with any group contribution method, care should be exercised
when attempting to perform predictions which are outside the data set used to generate
the correlation.
Other methods for correlating gas permeability in barrier polymers with polymer
molecular structure have been developed using free volume theory [49,50,94]. Group
contribution techniques can be used to estimate polymer free volume from densities and
intrinsic volumes of various polymer components. In the method proposed by Lee et al.
[50], polymer specific free volume was used, which was defined as, (V-V0)/M, where V
is specific volume, V0 is specific occupied volume, and M is polymer molecular weight.
Vo can be calculated according to Bondi’s method from van der Waals volumes of the
various groups in the polymer structure [50]. In this model, free volume was defined on a
unit weight basis so that various molecular structures could be compared on the same
weight basis. The model predicts a linear relationship between logarithm of gas

54
permeability and the reciprocal of polymer specific free volume. Other improvements to
this model have been suggested [49,94]. Gas permeability has often been correlated with
fractional free volume (FFV) (as defined in Equation 2.6) using the following relation
[94]:
P AB
FFV=
-ÊËÁ
ˆ¯̃exp (2.27)
where A and B are constants for a particular gas. It has been observed that when this
model is limited to a specific family of polymers, e.g., polyesters, polyamides, etc. [49], a
reasonably good correlation can be obtained. However, when the correlation is broadened
to include a wider range of polymer types, there is considerable scatter in the data,
particularly at low values of gas permeabilities. Even though these free volume-based
models have some fundamental basis for correlating transport properties, they have the
following limitations [50,94]: (i) the assumption of solubility being independent of free
volume and polymer structure is clearly an approximation, (ii) the concept of free volume
cannot capture all the factors affecting gas permeability (such as chain flexibility, CED,
etc.), and (iii) there may be errors in values of van der Waals volumes available in the
literature. Attempts have been made to refine these models by introducing more empirical
parameters and making them more predictive, and these efforts have resulted in
significant improvements in the accuracy of the correlations [94].
Larger and more condensable penetrants, e.g., flavor and aroma compounds, can
have extremely low diffusion coefficients in common barrier polymers resulting in
extremely large timescales to achieve steady state. For example, d-limonene has diffusion
55
coefficients of the order of 10-14 cm2/s in PET [35]. When coupled with a typical film
thickness of 10 µm, this leads to timescale to reach steady state of more than 3 years.
Hence, as noted before, over the shelf life of the packaged product (typically of the order
of several months), flavor and aroma compounds may never reach steady-state transport.
Therefore, independent predictions of their diffusion and solubility coefficients become
necessary. Several methods have been proposed for predicting solubility coefficients. A
widely used method is based on a thermodynamic approach that relates penetrant sorption
to solubility parameters of the penetrant and the polymer [95]. This dependence can be
expressed as follows:
S S H H RT
H
o vap mix
mix
= -( )[ ]= -( )exp /D D
D n f d d1 2 1 2
2(2.28)
where So is a constant for a particular polymer, n1 is partial molar volume of the
penetrant, f2 is volume fraction of polymer in the mixture, d1 and d 2 are solubility
parameters of penetrant and polymer respectively, and ∆Hmix is enthalpy change on
mixing of penetrant molecules with polymer segments. The values of n1, d1, and d2 can be
obtained from the literature [66]. The enthalpy change on vaporization of the penetrant
(DHvap) can be calculated from the penetrant boiling point using available correlations
[38]. Reasonably good agreements have been reported between model-predicted and
experimentally observed solubility coefficients of several penetrants in vinylidene
chloride/vinyl chloride copolymers and LDPE at 85°C and 30°C, respectively [96].

56
For penetrants that interact with the polymer matrix primarily via dispersion (i.e.,
van der Waals) forces, penetrant solubility scales with measures of penetrant
condensability such as penetrant boiling point, critical temperature, or the force constant
in the Lennard-Jones potential model [9]. The following relation between penetrant
critical temperature and penetrant solubility has been derived using a classical
thermodynamics model [46,97]:
lnS N MTa c= + (2.29)
In this expression, N is a parameter that depends primarily on polymer-penetrant
interactions and polymer free volume. Tc is the penetrant critical temperature, which is
widely tabulated for many penetrants of interest [38]. M is constant and has a value of
approximately 0.016 K-1 for gas dissolution in liquids and in rubbery and glassy polymers
[46]. While N varies from polymer to polymer, van Krevelen recommends average values
of -9.7 and -8.7 for rubbery and glassy polymers at 35°C, respectively, when solubility is
expressed in cm3(STP)/(cm3 cmHg) [46]. Penetrants with strong dipole or quadrupole
moments may be more soluble in a polar polymer matrix, such as PET, than predicted
based on Equation 2.29 [8]. Although Equation 2.29 is strictly valid for penetrant
sorption in equilibrium matrices, such as liquids or rubbery polymers, it also provides an
excellent description of equilibrium solubility in glassy polymers [8]. Figure 2.17 shows
the correlation of penetrant solubility in PET with penetrant critical temperature [8]. Non-
polar penetrants show excellent agreement with the model presented in Equation 2.29 and
polar or quadrupolar penetrants exhibit significant scatter around the correlation line.

57
Over wider ranges of critical temperature, Stern has suggested that penetrant
solubility coefficients may be better correlated with the square of reciprocal reduced
temperature, (Tc/T)2 [98]:
lnS n mT
Tac= + Ê
ËÁˆ¯̃
2
(2.30)
where T is the temperature of the experiment, and m and n are the slope and intercept of
the correlation line, respectively. This equation may also be derived from fundamental
thermodynamic considerations [9]. Other semi-empirical methods, e.g., UNIFAC group
contribution model, have also been proposed for predicting penetrant solubility in
polymers [99,100].
Several predictive and correlative methods have been developed for diffusion
coefficients of penetrants in polymers. An empirical relationship has been developed for
correlating diffusion coefficients with penetrant critical volume [101]:
DVa
c
=t
h (2.31)
where Da is amorphous phase diffusion coefficient, Vc is penetrant critical volume, and t,
h are adjustable constants. This equation has been proposed based on analogy with
correlations of diffusion coefficients with critical volume of small molecules in liquids.
For larger penetrants (e.g., long chain hydrocarbons), diffusion steps may occur via
motion of only part of the molecule, and critical volume is not expected to capture the
effective size of a penetrant unit participating in a diffusion step [9]. In such cases,
diffusion coefficients would be less sensitive to penetrant size than indicated in the above
58
equation. Also, critical volume fails to capture the effect of penetrant shape on diffusion
coefficients [8]. Figure 2.18 shows a plot of D vs. Vc for PET at 25°C. Diffusion
coefficients of penetrants (up to molecular weights of 100 Daltons) in PVC, PS, and
PMMA have been correlated empirically with other measures of penetrant size, such as
molecular diameter [102].
A theoretical model based on polymer free volume, temperature, and penetrant
size and shape has been developed [103]. According to this model, diffusion coefficients
of large penetrants in amorphous rubbery polymers are given by:
DV eRT
M Ac Ac Ac
E
RTf D= Ê
ËÁˆ¯̃ + +
ÊËÁ
ˆ¯̃
-ÊËÁ
ˆ¯̃
2 1 2
1 12
2 22
3 326
1 1 1/
expl l l
(2.32)
where Vf is average free volume per polymer chain segment, e is the base of natural
logarithm, M is penetrant molecular weight, l i is length of penetrant molecule along a
given direction i (taken as the principal axis of inertia), Aci is effective penetrant
molecular cross-sectional area perpendicular to the direction i, and ED is the activation
energy of diffusion. Vf can be calculated from the following equation [103]:
V V T T kwf f g= + - +[ ]0 025 2 1. ( )a (2.33)
where V is the total volume per mole of the polymer repeat unit, af is temperature
coefficient of free volume expansion, Tg2 is glass transition temperature of the polymer, k
is plasticizing efficiency of the penetrant for the polymer, and w1 is weight fraction of the
penetrant in the polymer. Equation 2.32 is strictly valid for large penetrants satisfying the
size criterion, Vs>>Vf, where Vs is effective steric volume of the penetrant [103]. The
penetrant molecular shape dependence is represented by the three-termed expression
59
within the parenthesis of Equation 2.32. The equation can be applied to penetrants of a
wide variety of molecular shapes [103]. This model has been tested using data for
diffusion of plasticizers in PVC [103].
2.7.2 ‘Migration Modeling’ of Polymer Additives into Packaged Foods and
Beverages
One of the key applications of barrier polymers is food and beverage packaging.
Several low molecular weight components, e.g., monomers and oligomers, as well as
additives such as lubricants, stabilizers, and plasticizers, which are necessary for
processing and stability, can be present in polymers used for packaging. Hence, there
exists a potential for permeation (or migration) of these additives into the food or
beverage with subsequent contamination [104-106]. To ensure the safety of packaged
food components, the US Food and Drug Administration (FDA) established a ‘Threshold
of Regulation’ approach which sets upper limits on the additive concentrations in the
food [104]. Since traditional migration testing methods are time-consuming, expensive,
and the analysis can be difficult (especially at low penetrant concentrations), the FDA has
developed models for predicting the additive concentration in the food simulant and rate
of transport of additives [104]:
q CD t
op= 2 r
p(2.34)
where q is total mass of permeating species per unit surface area, Co is initial additive
concentration in the polymer, r is polymer density, Dp is additive diffusion coefficient,

60
and t is the package shelf life. This equation assumes that [104]: (i) permeation is
diffusion-controlled and follows Fick’s law, (ii) no solubility-limited partitioning occurs
between the polymer and the food, and (iii) other external phase mass transfer resistances
(e.g., mixing, reaction with food) are negligible. The following empirical equation has
been developed for predicting diffusion coefficients [104]:
D A a MW bTp p= ¥ - ¥ - Ê
ËÁˆ¯̃
ÊËÁ
ˆ¯̃
1014 exp (2.35)
where Dp is additive diffusion coefficient (cm2/s), Ap is constant for a particular polymer,
MW is additive molecular weight (g/mol), and a, b are correlation constants with values
of 0.01 mol/g and 10,450 K, respectively. The Ap values are 9 for LDPE, -3 for PET, and
5 for HDPE and PP [104]. A semi-empirical model for predicting diffusion coefficients
has also been developed [107]:
ln ln ( )( )/
/
D A MWK MW
Tp = + -a 1 21 3
(2.36)
where A, a, and K are constants determined from experimental data. The diffusion
coefficients follow Arrhenius type behavior and are taken to be independent of penetrant
concentration [104]. These models do not explicitly account for the effect of polymer
crystallinity or orientation on additive diffusion coefficients.
The approach of the European Commission (EC), on the other hand, has been to
assign ‘specific migration limits’ to different substances with adverse toxicological
properties [106]. A Fickian diffusion-based model, called the Piringer migration model,
61
which uses the ‘Migratest Lite’ program, has been used [105,106], and its mathematical
form is given below:
M C L qD tq
L
K
V
Vq q
t o np n
n
F
pn n
=+
ÊËÁ
ˆ¯̃ - + + +
-Ê
ËÁˆ
¯̃
È
ÎÍÍ
˘
˚˙˙
= = -
=
•
Âr aa
a a a a
a a
11 2 1 1
1
2 22
21
( )( )exp
, tan
(2.37)
where L is film thickness, K is partition coefficient, and VF & Vp are the volumes of food
and polymer, respectively. The diffusion coefficient can be estimated from Equation
2.35.
The sorption and transport of flavor and aroma compounds from the food
simulant into the packaging walls can affect the migration of additives from the walls into
the food simulant. Neither approach (FDA or EC) takes this effect into account. In
general, these migration models provide conservative estimates (from a safety viewpoint)
of additive concentrations in the food simulant and their diffusion coefficients. However,
there are certain cases when they can fail [104] (e.g., in cases where the flavor and aroma
compounds from the food simulant plasticize the polymer, or if the additive reacts either
with the polymer or with the food simulant to produce a species that is not detectable),
and attempts are being made to improve them.
62
2.8 Chemical Structures and Properties of Barrier Polymers
Barrier polymers can be broadly classified as high barrier, and moderate to low
barrier polymers, depending on the degree to which they restrict the passage of gases like
O2 or CO2 and water vapor. The boundaries between these classifications, while
somewhat arbitrary, are based on the effect of the barrier properties of the polymer on the
shelf life of the packaged products. In this section, we will discuss various properties of
different classes of barrier polymers. The selection of a barrier polymer for a particular
packaging application depends not only on its barrier properties but also on other
physical properties and a comparison of physical, mechanical, and optical properties of
some commonly used barrier polymers is, therefore, presented in Table 2.4 [108].
Permeabilities of light gases (O2 and CO2) and water vapor are presented in Tables 2.5
and 2.6, respectively [6], and Table 2.7 presents permeability, diffusivity, and solubility
of flavor and aroma compounds in various high and moderate barrier polymers [2].
Permeability data of light gases and water vapor in barrier polymers [109-113] are more
widely available than those of flavor and aroma compounds [114-116]. Proper care
should be exercised when using or comparing data from different sources since, as
discussed in the previous sections, polymer permeability values depend on a wide variety
of factors.
2.8.1 High Barrier Polymers
High barrier polymers are generally understood to be those polymers which offer
a high resistance to gas transmission. There are no specific limits for the gas transmission
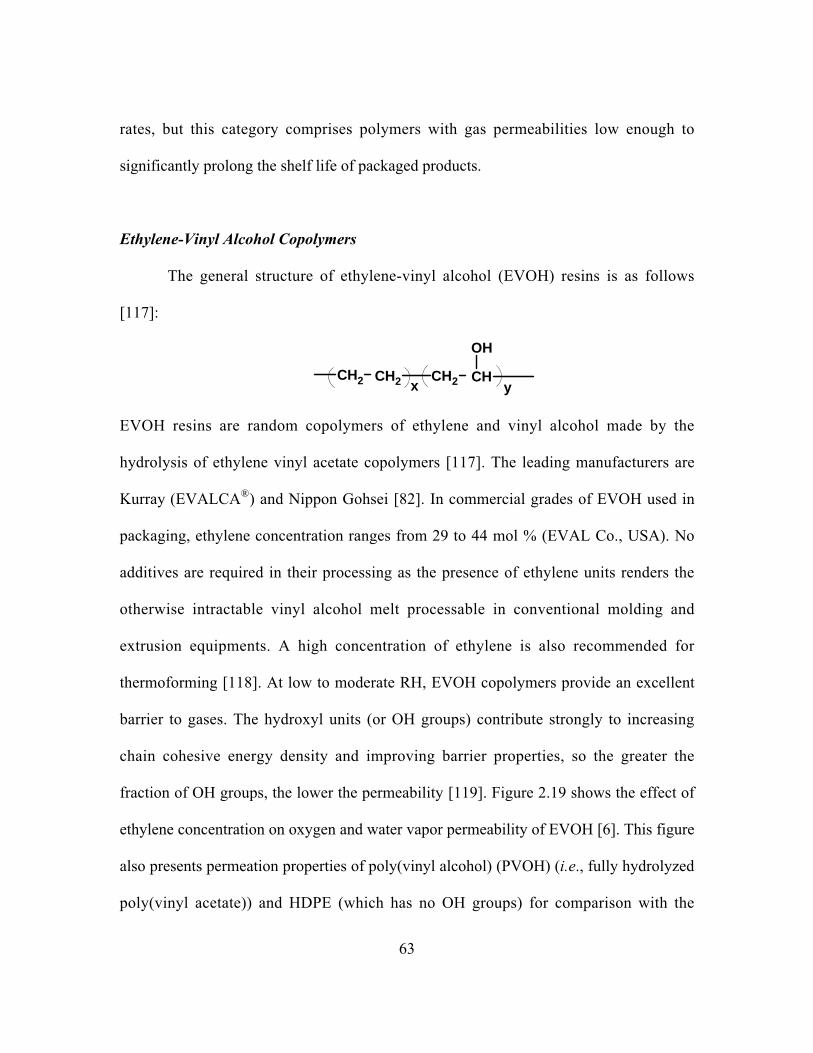
63
rates, but this category comprises polymers with gas permeabilities low enough to
significantly prolong the shelf life of packaged products.
Ethylene-Vinyl Alcohol Copolymers
The general structure of ethylene-vinyl alcohol (EVOH) resins is as follows
[117]:
CH2 CH2 CH2 x CH
OH
y
EVOH resins are random copolymers of ethylene and vinyl alcohol made by the
hydrolysis of ethylene vinyl acetate copolymers [117]. The leading manufacturers are
Kurray (EVALCA®) and Nippon Gohsei [82]. In commercial grades of EVOH used in
packaging, ethylene concentration ranges from 29 to 44 mol % (EVAL Co., USA). No
additives are required in their processing as the presence of ethylene units renders the
otherwise intractable vinyl alcohol melt processable in conventional molding and
extrusion equipments. A high concentration of ethylene is also recommended for
thermoforming [118]. At low to moderate RH, EVOH copolymers provide an excellent
barrier to gases. The hydroxyl units (or OH groups) contribute strongly to increasing
chain cohesive energy density and improving barrier properties, so the greater the
fraction of OH groups, the lower the permeability [119]. Figure 2.19 shows the effect of
ethylene concentration on oxygen and water vapor permeability of EVOH [6]. This figure
also presents permeation properties of poly(vinyl alcohol) (PVOH) (i.e., fully hydrolyzed
poly(vinyl acetate)) and HDPE (which has no OH groups) for comparison with the
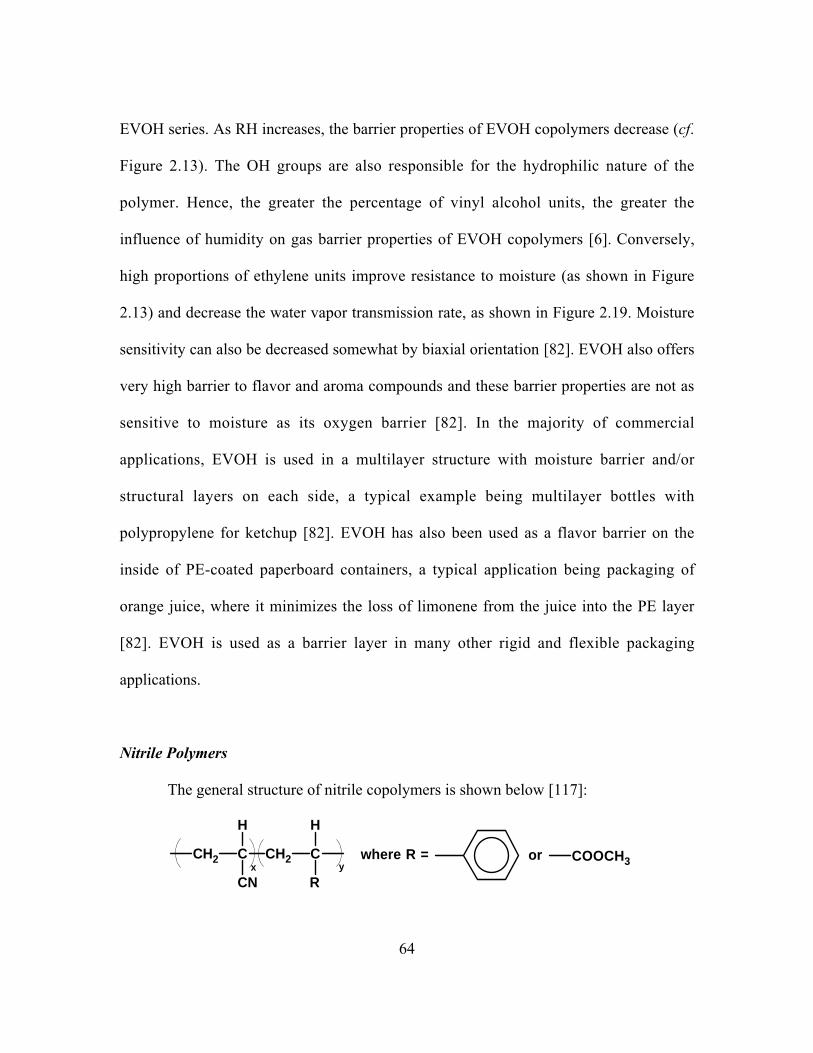
64
EVOH series. As RH increases, the barrier properties of EVOH copolymers decrease (cf.
Figure 2.13). The OH groups are also responsible for the hydrophilic nature of the
polymer. Hence, the greater the percentage of vinyl alcohol units, the greater the
influence of humidity on gas barrier properties of EVOH copolymers [6]. Conversely,
high proportions of ethylene units improve resistance to moisture (as shown in Figure
2.13) and decrease the water vapor transmission rate, as shown in Figure 2.19. Moisture
sensitivity can also be decreased somewhat by biaxial orientation [82]. EVOH also offers
very high barrier to flavor and aroma compounds and these barrier properties are not as
sensitive to moisture as its oxygen barrier [82]. In the majority of commercial
applications, EVOH is used in a multilayer structure with moisture barrier and/or
structural layers on each side, a typical example being multilayer bottles with
polypropylene for ketchup [82]. EVOH has also been used as a flavor barrier on the
inside of PE-coated paperboard containers, a typical application being packaging of
orange juice, where it minimizes the loss of limonene from the juice into the PE layer
[82]. EVOH is used as a barrier layer in many other rigid and flexible packaging
applications.
Nitrile Polymers
The general structure of nitrile copolymers is shown below [117]:
CH2 C
H
CN
CH2 C
H
R x y
where R = or COOCH3

65
Application of polyacrylonitrile (PAN) in packaging started in the 1960s. Despite
processing difficulties, PAN was used due to its excellent barrier properties. A group of
copolymers were developed in the 1970s employing methyl acrylate or styrene as
comonomers at concentrations up to 20 mol% [119]. They are efficient oxygen barriers
and have high grease and oil resistance, strength, and stiffness. Lopac® (Monsanto Co.),
Barex® (Sohio), and Cycopac® (Borg-Warner Chemicals) are three commercial nitrile
copolymers used in packaging applications. Their compositions are shown in Table 2.8.
Barex® and Cycopac® are rubber-modified for improved mechanical properties, and the
barrier properties of these copolymers are relatively insensitive to moisture. Concerns
about the possible migration of acrylonitrile monomer, a toxic compound [82], have
limited the use of nitrile polymers in food contact applications.
Vinylidene Chloride Copolymers
Copolymers of vinylidene chloride (VDC) with vinyl chloride and acrylonitrile
were among the first high barrier polymers to be widely used. During their commercial
appearance in the late 1930s, they had the lowest permeabilities among plastics to gases
and water vapor [119]. Poly(vinylidene chloride) (PVDC) homopolymer is soluble only
in hot dichlorobenzene (among common solvents) and has a melting point only a few
degrees below its decomposition temperature [119]. These characteristics make it
difficult to fabricate by melt processing techniques. Copolymers were synthesized to
overcome these drawbacks. Acrylates were found to be among the most useful
comonomers, along with vinyl chloride and acrylonitrile [119]. By adding comonomers,
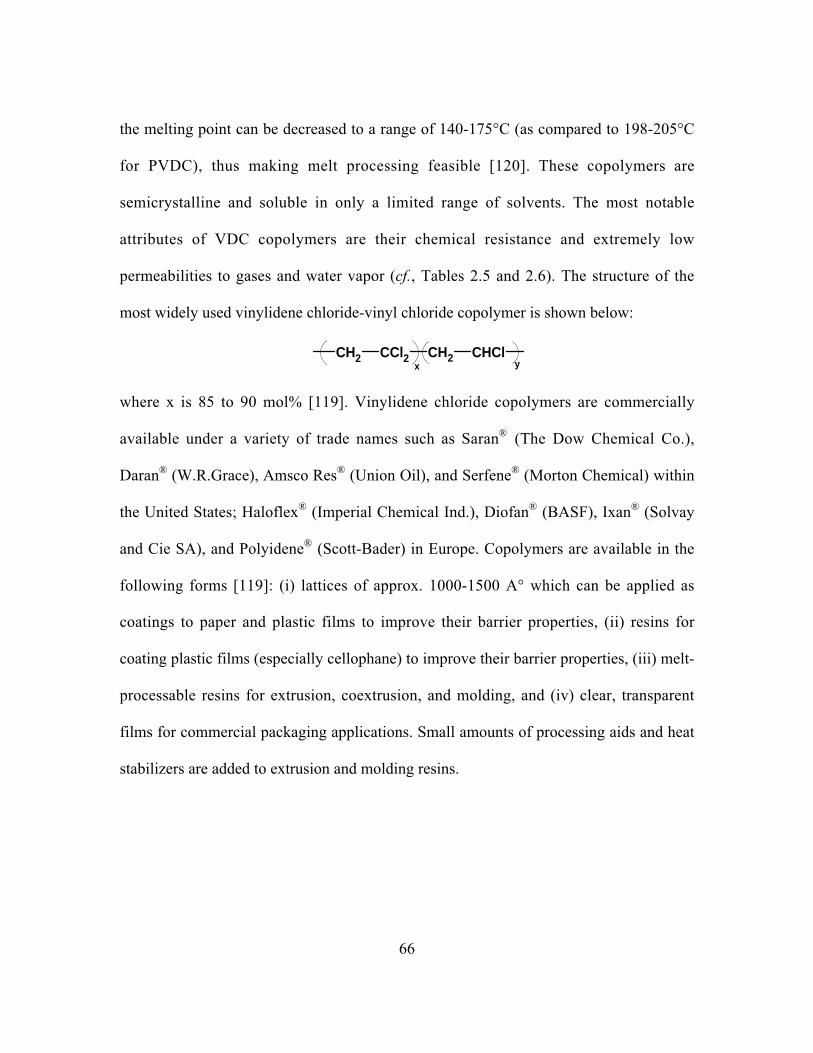
66
the melting point can be decreased to a range of 140-175°C (as compared to 198-205°C
for PVDC), thus making melt processing feasible [120]. These copolymers are
semicrystalline and soluble in only a limited range of solvents. The most notable
attributes of VDC copolymers are their chemical resistance and extremely low
permeabilities to gases and water vapor (cf., Tables 2.5 and 2.6). The structure of the
most widely used vinylidene chloride-vinyl chloride copolymer is shown below:
CH2 CCl2 CH2 CHCl x y
where x is 85 to 90 mol% [119]. Vinylidene chloride copolymers are commercially
available under a variety of trade names such as Saran® (The Dow Chemical Co.),
Daran® (W.R.Grace), Amsco Res® (Union Oil), and Serfene® (Morton Chemical) within
the United States; Haloflex® (Imperial Chemical Ind.), Diofan® (BASF), Ixan® (Solvay
and Cie SA), and Polyidene® (Scott-Bader) in Europe. Copolymers are available in the
following forms [119]: (i) lattices of approx. 1000-1500 A° which can be applied as
coatings to paper and plastic films to improve their barrier properties, (ii) resins for
coating plastic films (especially cellophane) to improve their barrier properties, (iii) melt-
processable resins for extrusion, coextrusion, and molding, and (iv) clear, transparent
films for commercial packaging applications. Small amounts of processing aids and heat
stabilizers are added to extrusion and molding resins.

67
Polyamides
The standard semicrystalline polyamides (PA) (nylon 6, nylon 66, etc.) used in
packaging have medium gas barrier properties, and their barrier properties are affected by
humidity [117]. However, specialty grades of polyamides with higher gas barrier
properties are available. Commercial grades of Selar® amorphous polyamides (AmPA)
(E.I. du Pont de Nemours & Co., DE), for example, exhibit good O2 barrier and reduced
dependence of gas barrier properties on RH. In fact, their gas barrier properties improve
with increasing RH (cf. Figure 2.13). At a RH of 80% or more, their O2 barrier is similar
to that of PAN [118]. Moreover, at 95-100% RH, the O2 barrier is equivalent to that of
EVOH at similar conditions, and substantially better than that of nylon 6. The amorphous
nature of Selar® results in a much broader range of processing conditions than those of
semicrystalline nylon 6 [121]. The mechanical and barrier properties of AmPA can be
improved by orientation.
Another high barrier polyamide is MXD-6 resin (Mitsubishi Co., Japan), which
was developed in the 1970s. It is made from the reaction of meta-xylylenediamine and
adipic acid [82]:
n
N
H
C
O
C4H8 C
O
OHCH2CH2N
H
H
It provides improved clarity, mechanical, thermal, and barrier properties relative to
standard nylons. It has better gas barrier properties than nylon 6 and poly(ethylene
terephthalate) at all humidities, and is better than EVOH at 100% RH. The barrier
properties of MXD-6 are relatively unaffected by moisture up to a RH of 70% [82].
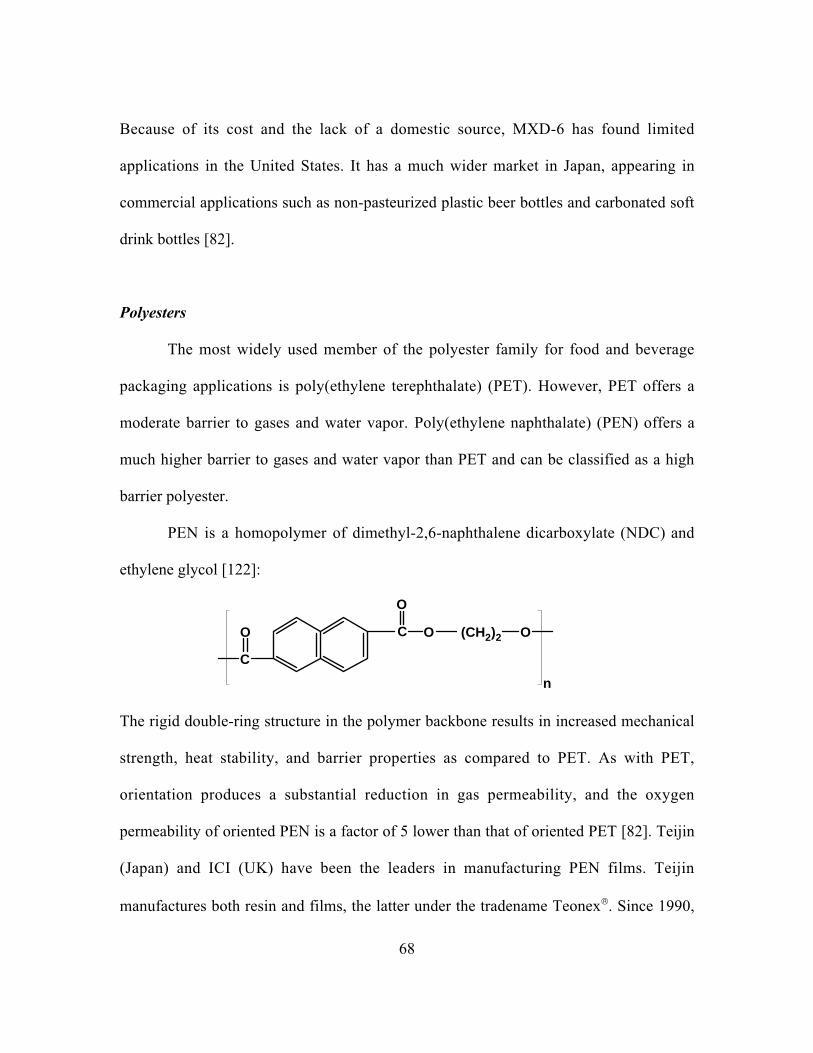
68
Because of its cost and the lack of a domestic source, MXD-6 has found limited
applications in the United States. It has a much wider market in Japan, appearing in
commercial applications such as non-pasteurized plastic beer bottles and carbonated soft
drink bottles [82].
Polyesters
The most widely used member of the polyester family for food and beverage
packaging applications is poly(ethylene terephthalate) (PET). However, PET offers a
moderate barrier to gases and water vapor. Poly(ethylene naphthalate) (PEN) offers a
much higher barrier to gases and water vapor than PET and can be classified as a high
barrier polyester.
PEN is a homopolymer of dimethyl-2,6-naphthalene dicarboxylate (NDC) and
ethylene glycol [122]:
C
O C O
O
(CH2)2 O
n
The rigid double-ring structure in the polymer backbone results in increased mechanical
strength, heat stability, and barrier properties as compared to PET. As with PET,
orientation produces a substantial reduction in gas permeability, and the oxygen
permeability of oriented PEN is a factor of 5 lower than that of oriented PET [82]. Teijin
(Japan) and ICI (UK) have been the leaders in manufacturing PEN films. Teijin
manufactures both resin and films, the latter under the tradename Teonex‚. Since 1990,
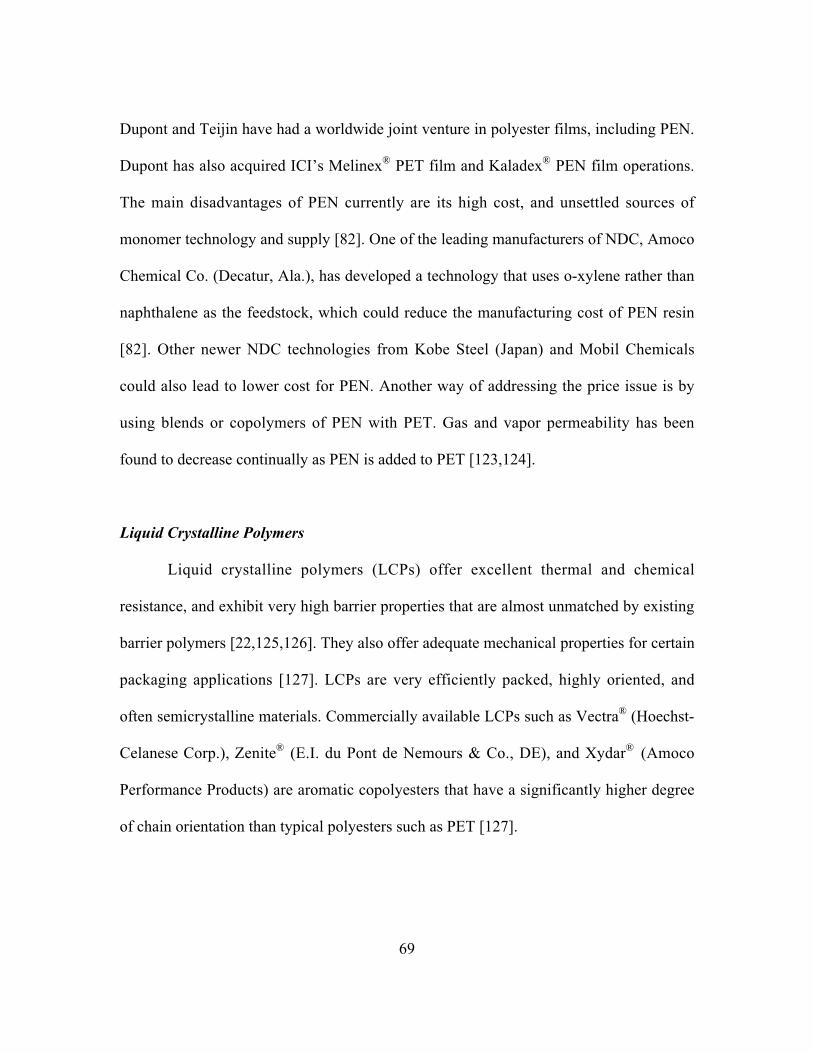
69
Dupont and Teijin have had a worldwide joint venture in polyester films, including PEN.
Dupont has also acquired ICI’s Melinex® PET film and Kaladex® PEN film operations.
The main disadvantages of PEN currently are its high cost, and unsettled sources of
monomer technology and supply [82]. One of the leading manufacturers of NDC, Amoco
Chemical Co. (Decatur, Ala.), has developed a technology that uses o-xylene rather than
naphthalene as the feedstock, which could reduce the manufacturing cost of PEN resin
[82]. Other newer NDC technologies from Kobe Steel (Japan) and Mobil Chemicals
could also lead to lower cost for PEN. Another way of addressing the price issue is by
using blends or copolymers of PEN with PET. Gas and vapor permeability has been
found to decrease continually as PEN is added to PET [123,124].
Liquid Crystalline Polymers
Liquid crystalline polymers (LCPs) offer excellent thermal and chemical
resistance, and exhibit very high barrier properties that are almost unmatched by existing
barrier polymers [22,125,126]. They also offer adequate mechanical properties for certain
packaging applications [127]. LCPs are very efficiently packed, highly oriented, and
often semicrystalline materials. Commercially available LCPs such as Vectra® (Hoechst-
Celanese Corp.), Zenite® (E.I. du Pont de Nemours & Co., DE), and Xydar® (Amoco
Performance Products) are aromatic copolyesters that have a significantly higher degree
of chain orientation than typical polyesters such as PET [127].

70
O C O
O
C
O
0.7 3
0.2 7
Structure of Vectra‚
LCPs of this kind were first introduced to the market in the 1980s. Table 2.9 shows a
comparison of properties of biaxially oriented LCP films with those of PET films [128].
Figure 2.20 compares barrier properties of LCPs with other barrier polymers. LCPs offer
the best combination of water vapor and O2 barrier properties among all known classes of
polymers. They also offer excellent barrier to CO2, N2, and other gases and vapors [127].
However, commercial applications of LCPs have been limited primarily because of their
high cost, lack of transparency, and processing characteristics [127]. One key to
unlocking the potential of LCPs in barrier packaging is to be able to process thin uniform
layers in coextruded multilayer structures. Recently, three-layered structures (PET-tie
layer-LCP) have been coextruded (Superex Polymer, Inc. Waltham, MA) with a total
thickness of 25-50 µm and 10-30% LCP layer thickness. This multilayer film is claimed
to offer a high performance-cost ratio [127].
Poly(hydroxy amino ethers)
Poly(hydroxy amino ethers) (PHAE) are a new family of high barrier epoxy-
based thermoplastics. The general chemical structure of amide-containing PHAE, which
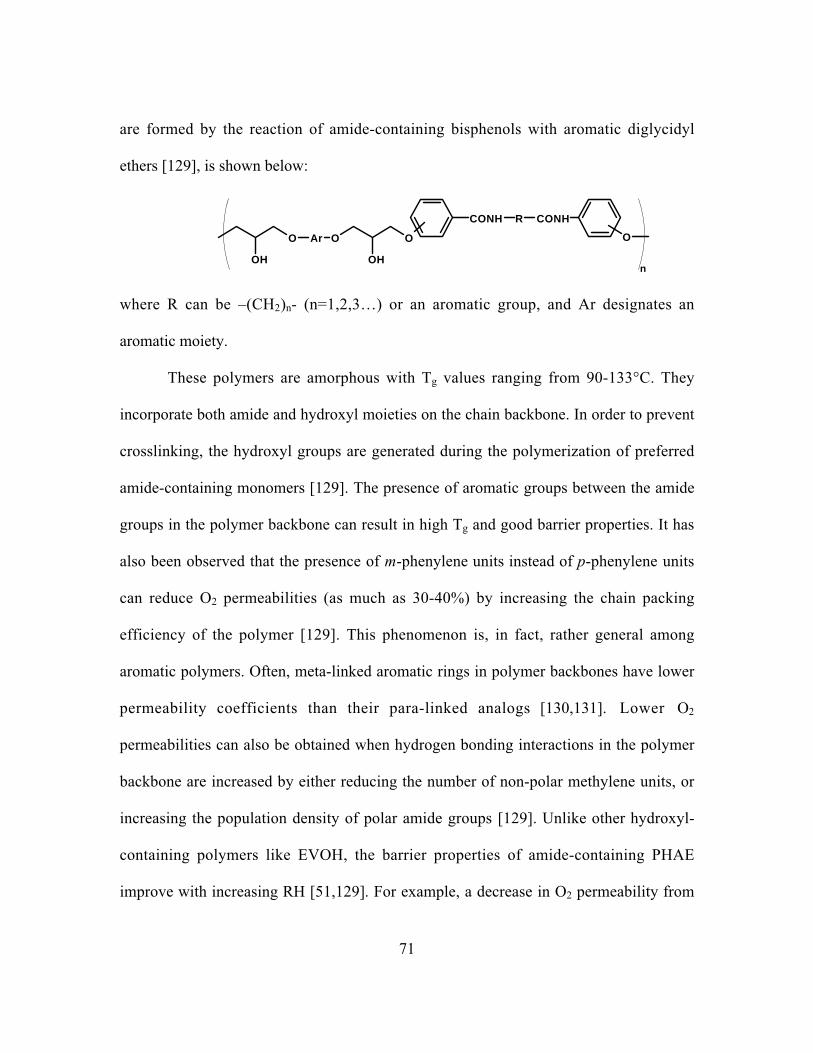
71
are formed by the reaction of amide-containing bisphenols with aromatic diglycidyl
ethers [129], is shown below:
OH
O Ar O
OH
O
CONH R CONH
O
n
where R can be –(CH2)n- (n=1,2,3…) or an aromatic group, and Ar designates an
aromatic moiety.
These polymers are amorphous with Tg values ranging from 90-133°C. They
incorporate both amide and hydroxyl moieties on the chain backbone. In order to prevent
crosslinking, the hydroxyl groups are generated during the polymerization of preferred
amide-containing monomers [129]. The presence of aromatic groups between the amide
groups in the polymer backbone can result in high Tg and good barrier properties. It has
also been observed that the presence of m-phenylene units instead of p-phenylene units
can reduce O2 permeabilities (as much as 30-40%) by increasing the chain packing
efficiency of the polymer [129]. This phenomenon is, in fact, rather general among
aromatic polymers. Often, meta-linked aromatic rings in polymer backbones have lower
permeability coefficients than their para-linked analogs [130,131]. Lower O2
permeabilities can also be obtained when hydrogen bonding interactions in the polymer
backbone are increased by either reducing the number of non-polar methylene units, or
increasing the population density of polar amide groups [129]. Unlike other hydroxyl-
containing polymers like EVOH, the barrier properties of amide-containing PHAE
improve with increasing RH [51,129]. For example, a decrease in O2 permeability from
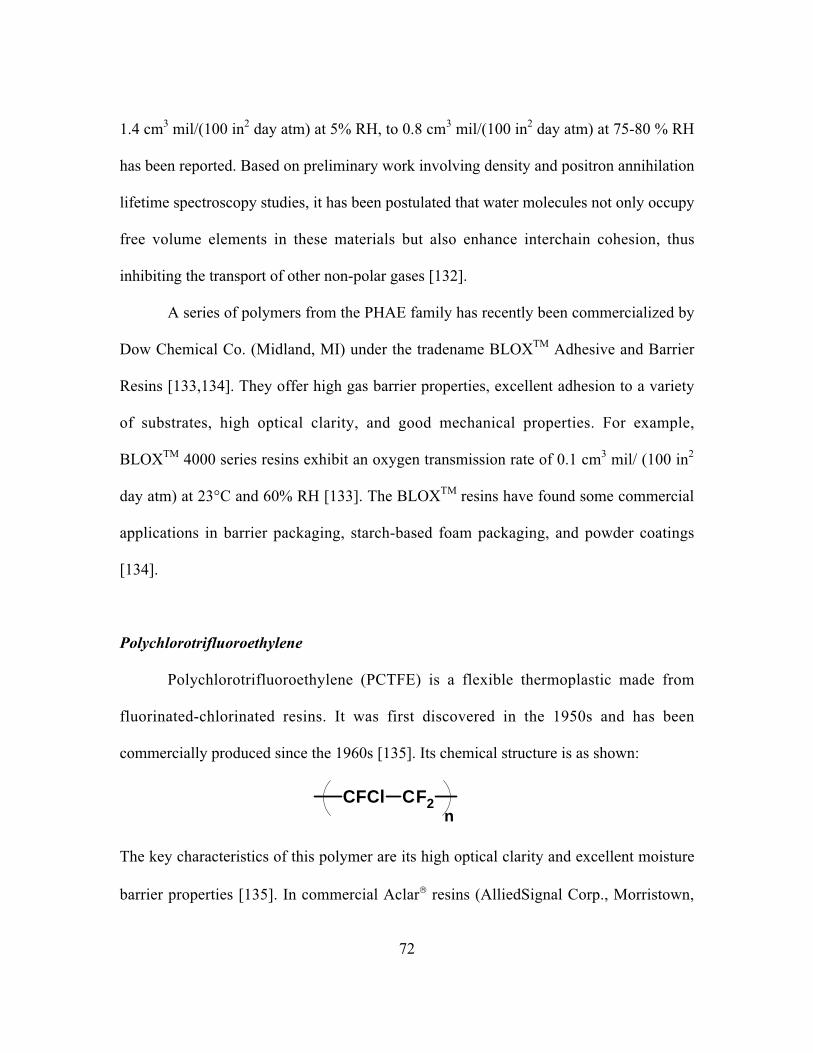
72
1.4 cm3 mil/(100 in2 day atm) at 5% RH, to 0.8 cm3 mil/(100 in2 day atm) at 75-80 % RH
has been reported. Based on preliminary work involving density and positron annihilation
lifetime spectroscopy studies, it has been postulated that water molecules not only occupy
free volume elements in these materials but also enhance interchain cohesion, thus
inhibiting the transport of other non-polar gases [132].
A series of polymers from the PHAE family has recently been commercialized by
Dow Chemical Co. (Midland, MI) under the tradename BLOXTM Adhesive and Barrier
Resins [133,134]. They offer high gas barrier properties, excellent adhesion to a variety
of substrates, high optical clarity, and good mechanical properties. For example,
BLOXTM 4000 series resins exhibit an oxygen transmission rate of 0.1 cm3 mil/ (100 in2
day atm) at 23°C and 60% RH [133]. The BLOXTM resins have found some commercial
applications in barrier packaging, starch-based foam packaging, and powder coatings
[134].
Polychlorotrifluoroethylene
Polychlorotrifluoroethylene (PCTFE) is a flexible thermoplastic made from
fluorinated-chlorinated resins. It was first discovered in the 1950s and has been
commercially produced since the 1960s [135]. Its chemical structure is as shown:
CFCl CF2 n
The key characteristics of this polymer are its high optical clarity and excellent moisture
barrier properties [135]. In commercial Aclar‚ resins (AlliedSignal Corp., Morristown,
73
NJ), the polymer is generally modified by copolymerization, resulting in a
semicrystalline material with Tg of about 45°C, and melting point of about 190°C [120].
It shows excellent thermal and chemical stability, and high water vapor and O2 barrier
properties [136] (cf., Tables 2.5 and 2.6). For example, Aclar® films typically have water
vapor transmission rates less than 0.04 gm mil/(100 in2 day) (23°C) and oxygen
transmission rates less than 14 cm3 mil/ (100 in2 day) (25°C) [136]. PCTFE is most
widely used for producing blister packs in pharmaceutical applications [135]. The
moisture barrier properties can be tailored by varying the PCTFE layer thickness in
coextruded multilayer structures, thereby adjusting the performance-to-cost ratio. An
example of a commercial coextruded structure is Aclar® NT AE-1 (AlliedSignal Corp.,
Morristown, NJ), which is 33 µm thick, and contains about 8.4 µm of PCTFE [135].
PCTFE can also be laminated with PP, PAN, PET, HDPE, LDPE, and PVC and then
formed into blister packs. Other applications of the same technology include electronic
component packaging where lower moisture barrier may be acceptable resulting in more
favorable economics [135].
2.8.2 Moderate Barrier Polymers
Polymers in this category include polyesters, polyolefins, polyvinyl chloride
(PVC), polystyrene (PS), and certain semicrystalline polyamides. The polymers included
in this section are typically more widely available, have more manufacturers, and are less
expensive than the specialty barrier resins described in the previous section.
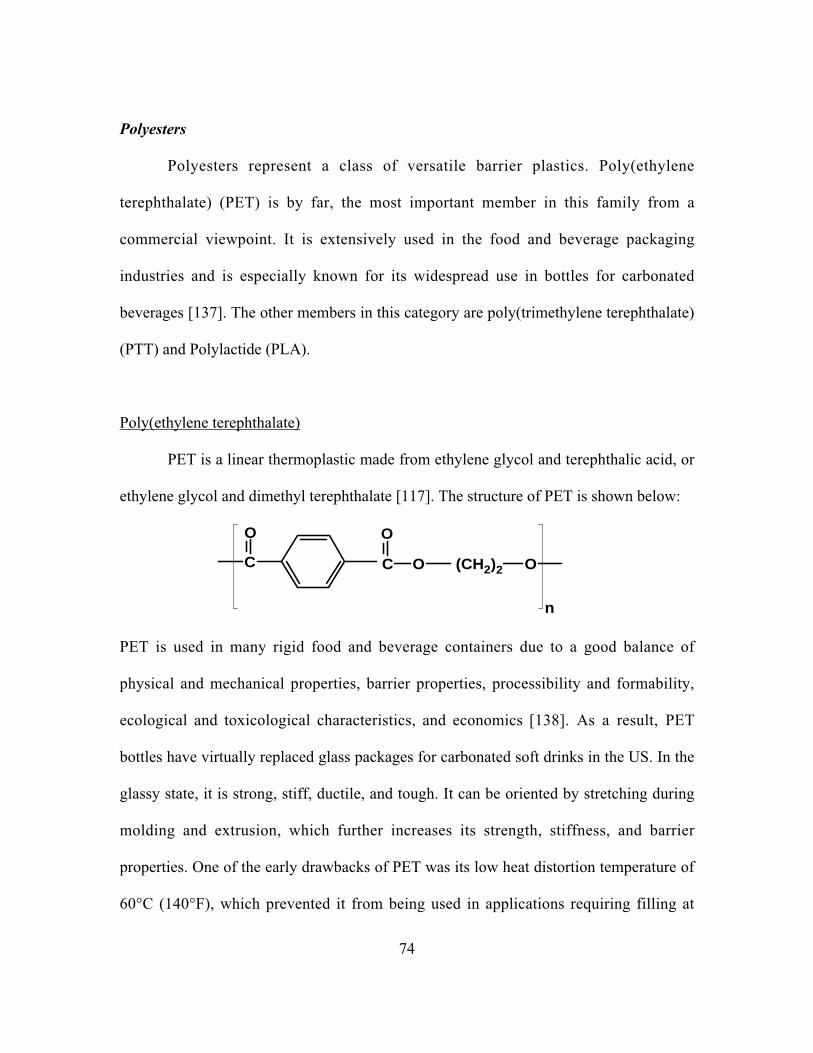
74
Polyesters
Polyesters represent a class of versatile barrier plastics. Poly(ethylene
terephthalate) (PET) is by far, the most important member in this family from a
commercial viewpoint. It is extensively used in the food and beverage packaging
industries and is especially known for its widespread use in bottles for carbonated
beverages [137]. The other members in this category are poly(trimethylene terephthalate)
(PTT) and Polylactide (PLA).
Poly(ethylene terephthalate)
PET is a linear thermoplastic made from ethylene glycol and terephthalic acid, or
ethylene glycol and dimethyl terephthalate [117]. The structure of PET is shown below:
C
O
C
O
O
n
(CH2)2 O
PET is used in many rigid food and beverage containers due to a good balance of
physical and mechanical properties, barrier properties, processibility and formability,
ecological and toxicological characteristics, and economics [138]. As a result, PET
bottles have virtually replaced glass packages for carbonated soft drinks in the US. In the
glassy state, it is strong, stiff, ductile, and tough. It can be oriented by stretching during
molding and extrusion, which further increases its strength, stiffness, and barrier
properties. One of the early drawbacks of PET was its low heat distortion temperature of
60°C (140°F), which prevented it from being used in applications requiring filling at
75
elevated temperatures [138]. However, careful heat-treatment increases the heat
distortion temperature of crystalline PET containers and recently commercialized
processes claim resistance to temperatures of up to 90-92°C (194 to 196°F) [138]. It has
moderate barrier properties for light gases, but is a good barrier for flavors and aroma
compounds. Its barrier properties can be improved by increasing crystallinity and
orientation [138]. A 4X biaxial orientation of amorphous PET at temperatures near 100°C
produces significant strain-induced crystallization and decreases the permeability of O2
and CO2 by a factor of about two [8].
Oriented and heat-set PET films have also found use in a broad range of flexible
packaging applications due to their high strength, good barrier, high clarity, heat
resistance, and good metalizability. There are more than 50 specific application areas for
PET films [139]. Manufacturers have met the product requirements of each of the diverse
end-use markets by tailoring formulations and process conditions. For example, in the
food and beverage packaging industries, many types of PET films have been developed,
including metallized PET films for packaging of coffee, wine, and meats, poly(vinylidene
chloride)-coated PET films for meat and cheese packaging, and coextruded multilayer
PET films for heat-sealable packaging [139]. Commercial manufacturers of PET films
include DuPont Teijin Films (Mylar®, Melinex®, Tetoron®) and Mitsubishi Polyester
Film, LLC. (Diafoil®, Hostaphan‚).
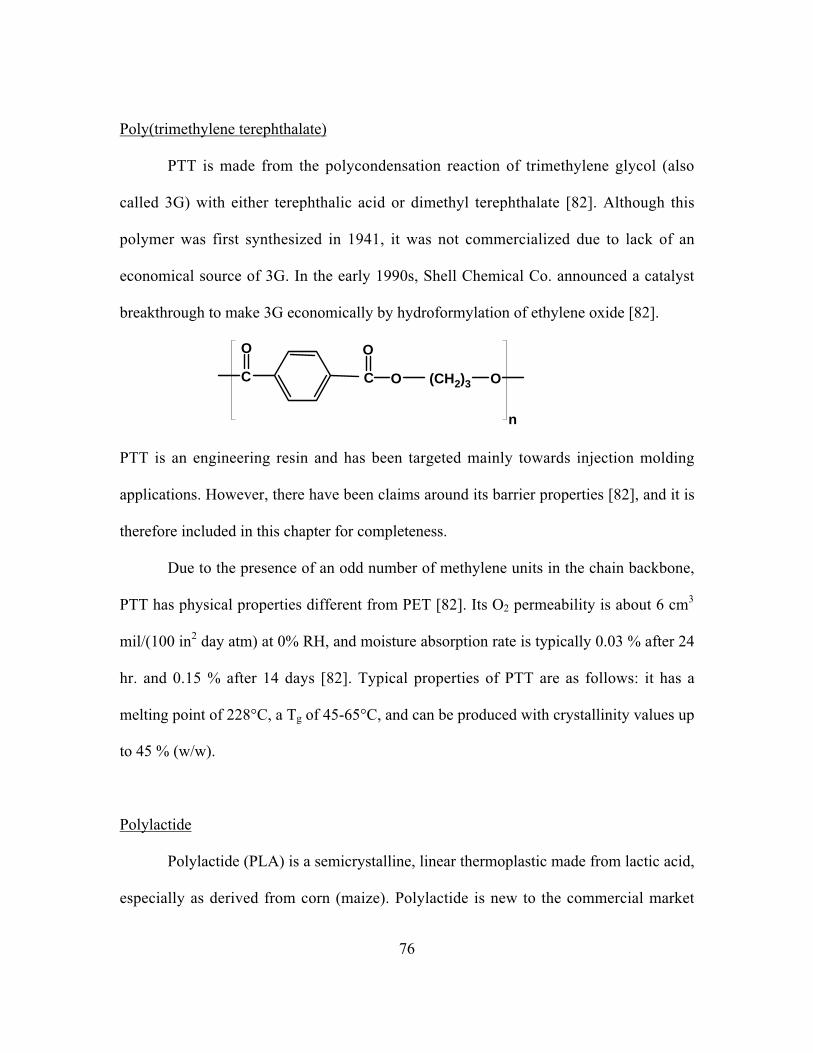
76
Poly(trimethylene terephthalate)
PTT is made from the polycondensation reaction of trimethylene glycol (also
called 3G) with either terephthalic acid or dimethyl terephthalate [82]. Although this
polymer was first synthesized in 1941, it was not commercialized due to lack of an
economical source of 3G. In the early 1990s, Shell Chemical Co. announced a catalyst
breakthrough to make 3G economically by hydroformylation of ethylene oxide [82].
C
O
C O
O
n
(CH2)3 O
PTT is an engineering resin and has been targeted mainly towards injection molding
applications. However, there have been claims around its barrier properties [82], and it is
therefore included in this chapter for completeness.
Due to the presence of an odd number of methylene units in the chain backbone,
PTT has physical properties different from PET [82]. Its O2 permeability is about 6 cm3
mil/(100 in2 day atm) at 0% RH, and moisture absorption rate is typically 0.03 % after 24
hr. and 0.15 % after 14 days [82]. Typical properties of PTT are as follows: it has a
melting point of 228°C, a Tg of 45-65°C, and can be produced with crystallinity values up
to 45 % (w/w).
Polylactide
Polylactide (PLA) is a semicrystalline, linear thermoplastic made from lactic acid,
especially as derived from corn (maize). Polylactide is new to the commercial market
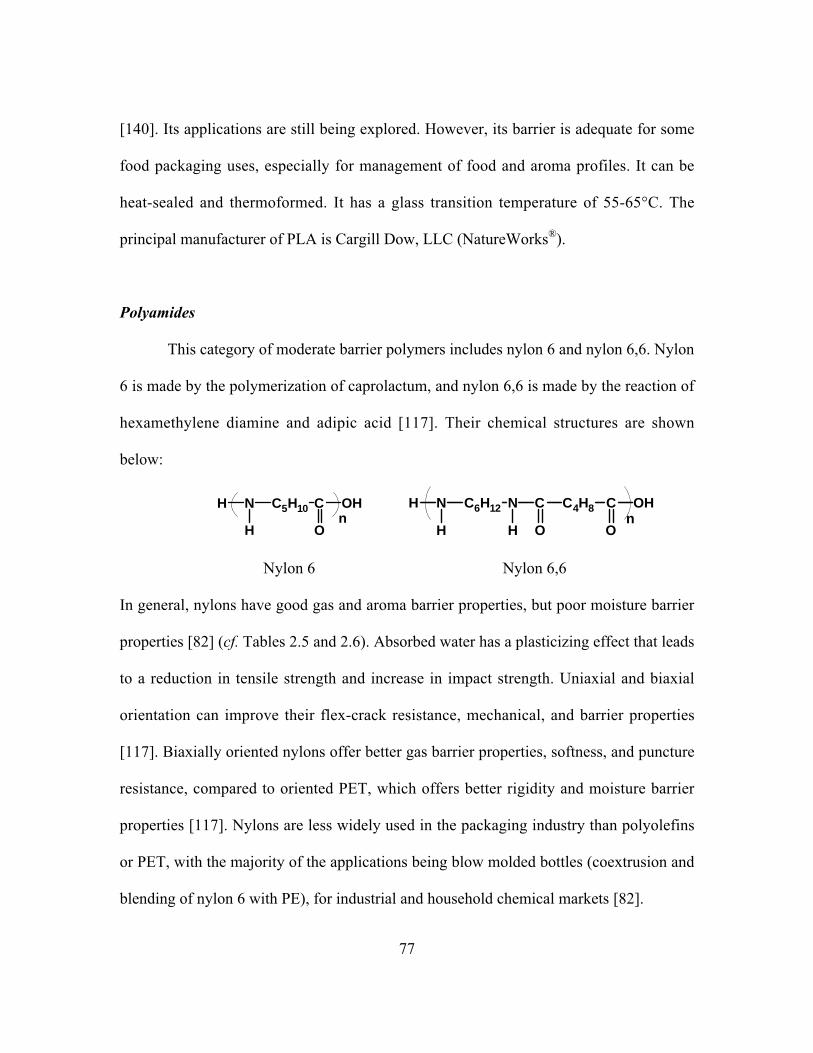
77
[140]. Its applications are still being explored. However, its barrier is adequate for some
food packaging uses, especially for management of food and aroma profiles. It can be
heat-sealed and thermoformed. It has a glass transition temperature of 55-65°C. The
principal manufacturer of PLA is Cargill Dow, LLC (NatureWorks®).
Polyamides
This category of moderate barrier polymers includes nylon 6 and nylon 6,6. Nylon
6 is made by the polymerization of caprolactum, and nylon 6,6 is made by the reaction of
hexamethylene diamine and adipic acid [117]. Their chemical structures are shown
below:
C5H10 CN
H O
OHH n
C6H12 NN
H
H
H
C
O
C4H8 C
O
OH n
Nylon 6 Nylon 6,6
In general, nylons have good gas and aroma barrier properties, but poor moisture barrier
properties [82] (cf. Tables 2.5 and 2.6). Absorbed water has a plasticizing effect that leads
to a reduction in tensile strength and increase in impact strength. Uniaxial and biaxial
orientation can improve their flex-crack resistance, mechanical, and barrier properties
[117]. Biaxially oriented nylons offer better gas barrier properties, softness, and puncture
resistance, compared to oriented PET, which offers better rigidity and moisture barrier
properties [117]. Nylons are less widely used in the packaging industry than polyolefins
or PET, with the majority of the applications being blow molded bottles (coextrusion and
blending of nylon 6 with PE), for industrial and household chemical markets [82].

78
Polyolefins
Polyethylene (PE) and polypropylene (PP) are two of the most widely used
polymers in the food and beverage packaging industry. These polymers find use as films,
moldings, coatings, adhesives, and closures [141]. They are available in a wide variety of
types and grades. While they have much higher permeabilities to gases than many other
barrier polymers, they are very good moisture barriers (cf., Tables 2.5 and 2.6).
PE, whose structure is shown below, was one of the first olefinic polymers to be
used commercially in the packaging industry:
CH2 CH2 n
It is classified on the basis of density. Figure 2.21 shows the effect of density on various
properties of PE [141]. A branched structure for low density PE (LDPE) results from
exceptionally high temperature and pressure during its manufacture. It is tough, flexible,
can be easily melt-processed, and has good moisture barrier properties. It is a
semicrystalline polymer with crystallinity typically in the range of 40%. Medium density
PE (MDPE) is stronger, stiffer, and has better barrier properties than LDPE. High density
PE (HDPE) is essentially unbranched and is the strongest and most rigid polymer in this
family. It offers barrier properties to moisture and gases that are superior to those of
LDPE and MDPE.
If unsaturated comonomers such as butene, hexene, or octene are added to the
HDPE polymerization process in the presence of a stereo-specific catalyst, it results in the
formation of a linear polymer with short branch-like pendant groups [120]. Its density is
in the same range as LDPE, but the degree of branching is greatly reduced. This polymer

79
is called linear LDPE (LLDPE) and its density depends on the amount of comonomer
added. The larger the amount of the comonomer, the lower the density of the copolymer
[120]. LLDPE combines the clarity and excellent heat-seal properties of LDPE with the
strength and toughness of HDPE. It is often blended with LDPE in order to optimize the
benefit obtained from both materials [120].
PP, whose chemical structure is shown below, can be made by the catalytic
polymerization of propylene at high temperature and pressure [141]:
CH2 CH
CH3
n
Isotactic PP (with all methyl groups on same side of the polymer chain) is the
commercially desired form for packaging applications [141]. The concentration of atactic
PP (with irregular arrangement of methyl groups) is kept low by suitable catalysts and
polymerization conditions [141]. PP offers high resistance to water vapor permeation and
is widely used in rigid as well as flexible food packaging applications. PP films can be
oriented, which improves their barrier properties, mechanical strength, and optical
properties. For example, oriented PP has about three times higher resistance to water
vapor transmission than unoriented PP [6]. These properties can be varied over a wide
range by the choice of the manufacturing process.
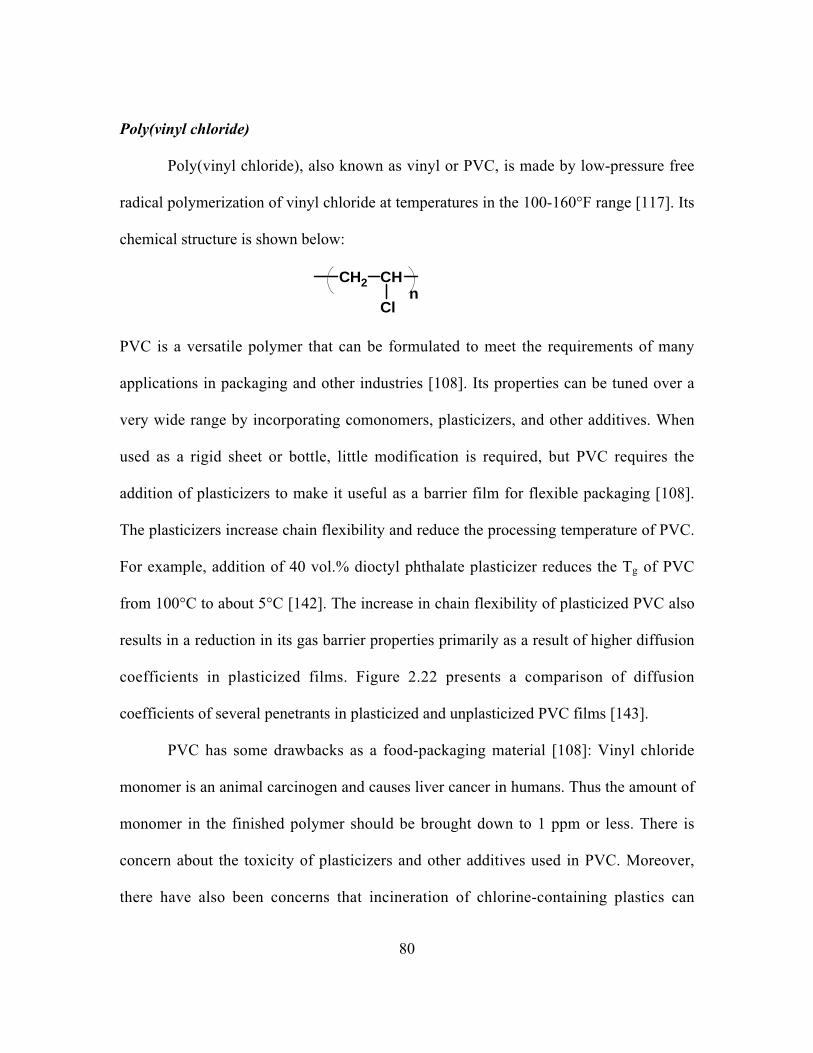
80
Poly(vinyl chloride)
Poly(vinyl chloride), also known as vinyl or PVC, is made by low-pressure free
radical polymerization of vinyl chloride at temperatures in the 100-160°F range [117]. Its
chemical structure is shown below:
CH2 CH
Cl n
PVC is a versatile polymer that can be formulated to meet the requirements of many
applications in packaging and other industries [108]. Its properties can be tuned over a
very wide range by incorporating comonomers, plasticizers, and other additives. When
used as a rigid sheet or bottle, little modification is required, but PVC requires the
addition of plasticizers to make it useful as a barrier film for flexible packaging [108].
The plasticizers increase chain flexibility and reduce the processing temperature of PVC.
For example, addition of 40 vol.% dioctyl phthalate plasticizer reduces the Tg of PVC
from 100°C to about 5°C [142]. The increase in chain flexibility of plasticized PVC also
results in a reduction in its gas barrier properties primarily as a result of higher diffusion
coefficients in plasticized films. Figure 2.22 presents a comparison of diffusion
coefficients of several penetrants in plasticized and unplasticized PVC films [143].
PVC has some drawbacks as a food-packaging material [108]: Vinyl chloride
monomer is an animal carcinogen and causes liver cancer in humans. Thus the amount of
monomer in the finished polymer should be brought down to 1 ppm or less. There is
concern about the toxicity of plasticizers and other additives used in PVC. Moreover,
there have also been concerns that incineration of chlorine-containing plastics can
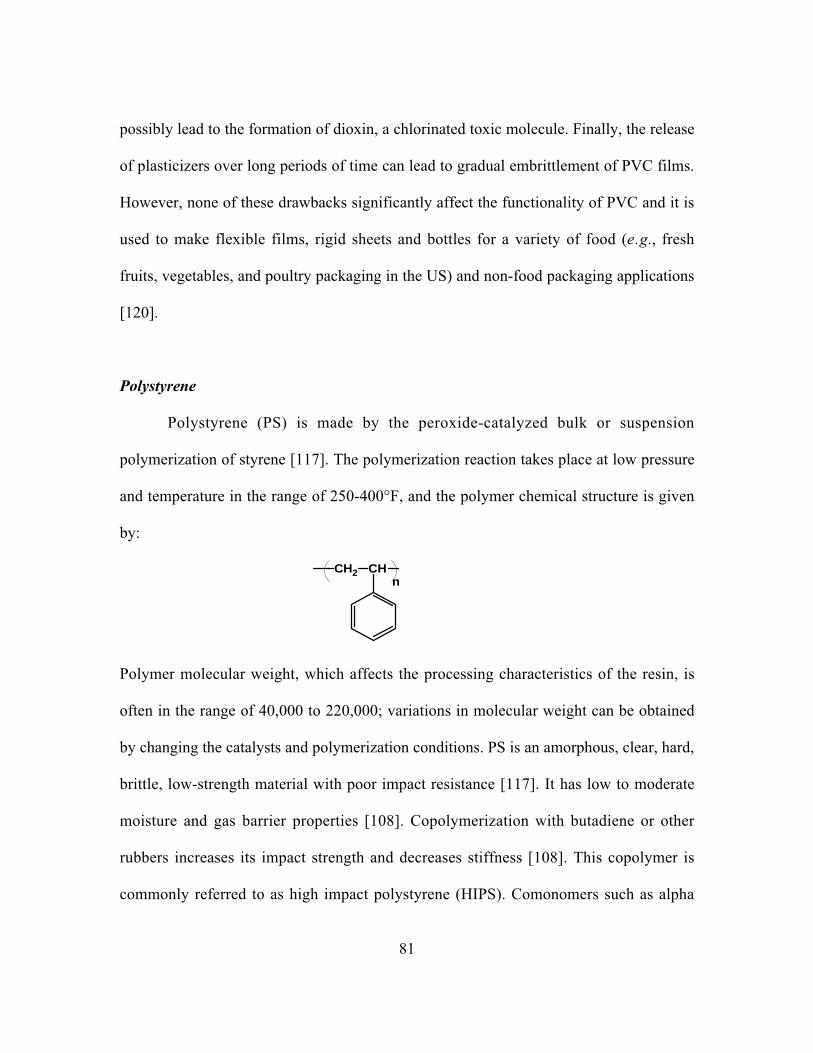
81
possibly lead to the formation of dioxin, a chlorinated toxic molecule. Finally, the release
of plasticizers over long periods of time can lead to gradual embrittlement of PVC films.
However, none of these drawbacks significantly affect the functionality of PVC and it is
used to make flexible films, rigid sheets and bottles for a variety of food (e.g., fresh
fruits, vegetables, and poultry packaging in the US) and non-food packaging applications
[120].
Polystyrene
Polystyrene (PS) is made by the peroxide-catalyzed bulk or suspension
polymerization of styrene [117]. The polymerization reaction takes place at low pressure
and temperature in the range of 250-400°F, and the polymer chemical structure is given
by:
nCH2 CH
Polymer molecular weight, which affects the processing characteristics of the resin, is
often in the range of 40,000 to 220,000; variations in molecular weight can be obtained
by changing the catalysts and polymerization conditions. PS is an amorphous, clear, hard,
brittle, low-strength material with poor impact resistance [117]. It has low to moderate
moisture and gas barrier properties [108]. Copolymerization with butadiene or other
rubbers increases its impact strength and decreases stiffness [108]. This copolymer is
commonly referred to as high impact polystyrene (HIPS). Comonomers such as alpha
82
methyl styrene can improve the heat resistance of PS by increasing the heat distortion
temperature to 100°C or higher [108]. PS can be foamed by adding foaming agents such
as hexane to the reaction mixture during the suspension polymerization. This so-called
expanded polystyrene (EPS) is a very low density, yet highly rigid material that is used
for making egg cartons, and trays for meat, poultry and other products [108]. However,
EPS has poor gas barrier properties.
2.9 Improving Barrier Properties of Polymers
2.9.1 Barrier Structures
As mentioned in the previous sections, the principal application of barrier
polymers is in the food and beverage packaging industries. Combining two or more
polymers, or other materials, can achieve performance advantages not available in any of
the materials taken alone. In many cases, to achieve better barrier performance, it is more
efficient and economical to use a thin layer of an expensive high barrier polymer (e.g.,
EVOH) sandwiched between layers of less expensive, moderate barrier, structural
polymers (e.g., PP, PET) than to increase the monolayer thickness of the moderate barrier
polymer. Multilayer structures can be obtained by coextrusion, lamination, and coating.
Barrier polymers may also be combined to form miscible and immiscible blends.
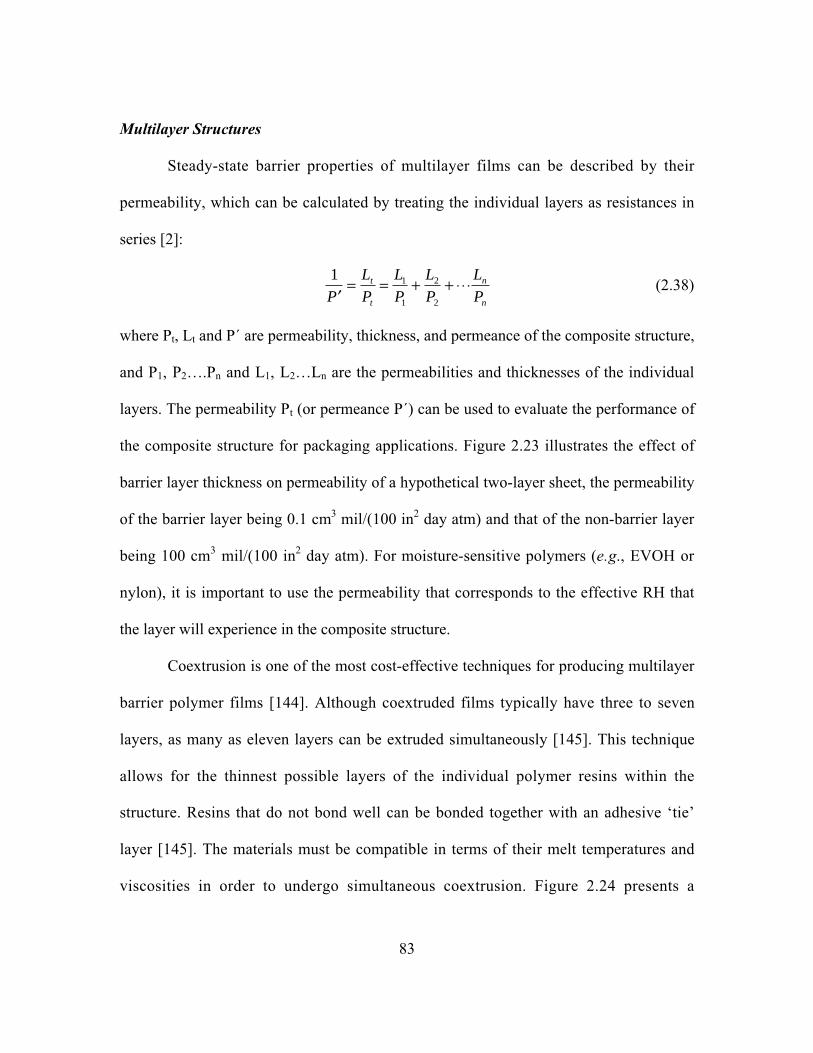
83
Multilayer Structures
Steady-state barrier properties of multilayer films can be described by their
permeability, which can be calculated by treating the individual layers as resistances in
series [2]:
1 1
1
2
2¢= = + + ◊ ◊ ◊
P
L
P
L
P
L
P
L
Pt
t
n
n
(2.38)
where Pt, Lt and P´ are permeability, thickness, and permeance of the composite structure,
and P1, P2….Pn and L1, L2…Ln are the permeabilities and thicknesses of the individual
layers. The permeability Pt (or permeance P´) can be used to evaluate the performance of
the composite structure for packaging applications. Figure 2.23 illustrates the effect of
barrier layer thickness on permeability of a hypothetical two-layer sheet, the permeability
of the barrier layer being 0.1 cm3 mil/(100 in2 day atm) and that of the non-barrier layer
being 100 cm3 mil/(100 in2 day atm). For moisture-sensitive polymers (e.g., EVOH or
nylon), it is important to use the permeability that corresponds to the effective RH that
the layer will experience in the composite structure.
Coextrusion is one of the most cost-effective techniques for producing multilayer
barrier polymer films [144]. Although coextruded films typically have three to seven
layers, as many as eleven layers can be extruded simultaneously [145]. This technique
allows for the thinnest possible layers of the individual polymer resins within the
structure. Resins that do not bond well can be bonded together with an adhesive ‘tie’
layer [145]. The materials must be compatible in terms of their melt temperatures and
viscosities in order to undergo simultaneous coextrusion. Figure 2.24 presents a

84
comparison of processing temperatures of various commonly used barrier polymers
[146]. Figure 2.25 shows a cartoon of a typical nine-layer coextruded structure. A
coextrusion line will have several different extruders, each extruder responsible for
supplying individual polymer resins [144].
Coating and lamination are two additional processes for producing multilayer
structures and are especially useful in applications where a non-polymeric material is part
of the structure. Coatings can be melt extrusions of a polymer onto a base film or can be
made by applying solutions or dispersions of polymers to the base film [145]. Barrier
polymers that resist water vapor and provide gas barrier are often laminated to paper and
paperboard. Cellophane, a flexible transparent gas barrier polymer, can also be made
‘moisture-proof’ by coating or laminating with other polymer films [6]. A commercial
application of solvent coating with barrier polymers is vinylidene chloride resin dissolved
in a polar solvent and coated onto cellophane or PET [2]. Water-based emulsion coatings
of vinylidene chloride are used for plastic PET beer bottles, primarily in the United
Kingdom. They can typically lower O2 permeability of PET bottles by nearly 60% [82].
Several companies produce PVDC emulsions for coating films such as nylon, PE, PP,
and PET to improve their O2 and moisture barrier properties [82]. In the mid-1990s, PPG
Industries, Inc. introduced BairocadeTM external epoxy-amine organic coatings for
improving barrier properties of PET bottles [147,148]. It is claimed that these coatings
can reduce O2 permeability of PET bottles by a factor of 6 or more with the level of
barrier improvement depending on the thickness and formulation used, and that coated
85
bottles extend the shelf life of carbonated beverages by a factor of 3, and beer by a factor
of 20 relative to uncoated bottles [148].
Another way of improving barrier properties of polymers is by coating them with
thin inorganic layers [82,149,150]. This can typically improve barrier properties by a
factor of 100, whereas the thickness of the barrier coating applied is less than 0.5% of the
base film [82]. Laminations and coatings of aluminum foil or aluminum oxide on barrier
polymers can provide significant improvements in gas barrier properties [82]. These
metallized films contain an extremely thin layer of aluminum, which not only enhances
the barrier properties of the base film, but also provides a shiny metallic appearance.
Because the layer is very thin, it does not appreciably affect the strength and flexibility of
the base film [151]. The barrier properties of metallized films can approach those of pure
aluminum foil. However, unlike aluminum foil, metallized films are not subject to flex-
cracking and hence, are better at maintaining their barrier properties [151]. Barrier
polymers that have been successfully metallized include PP, nylons, PET, and
unplasticized PVC. As an example, 99% decrease in oxygen permeability and 98.5%
decrease in water vapor permeability have been reported for metallized PET films as
compared to unmetallized PET films [152]. Metallized films are widely used in the
flexible packaging industry, an example being potato chip packages consisting of
multilayer structures of oriented PP, PE, and metallized PP [153].
However, one of the main disadvantages of metallized structures is that they may
not be transparent – a desirable feature for many packaging applications. In part to
address this shortcoming, several alternative high barrier coating technologies, typically
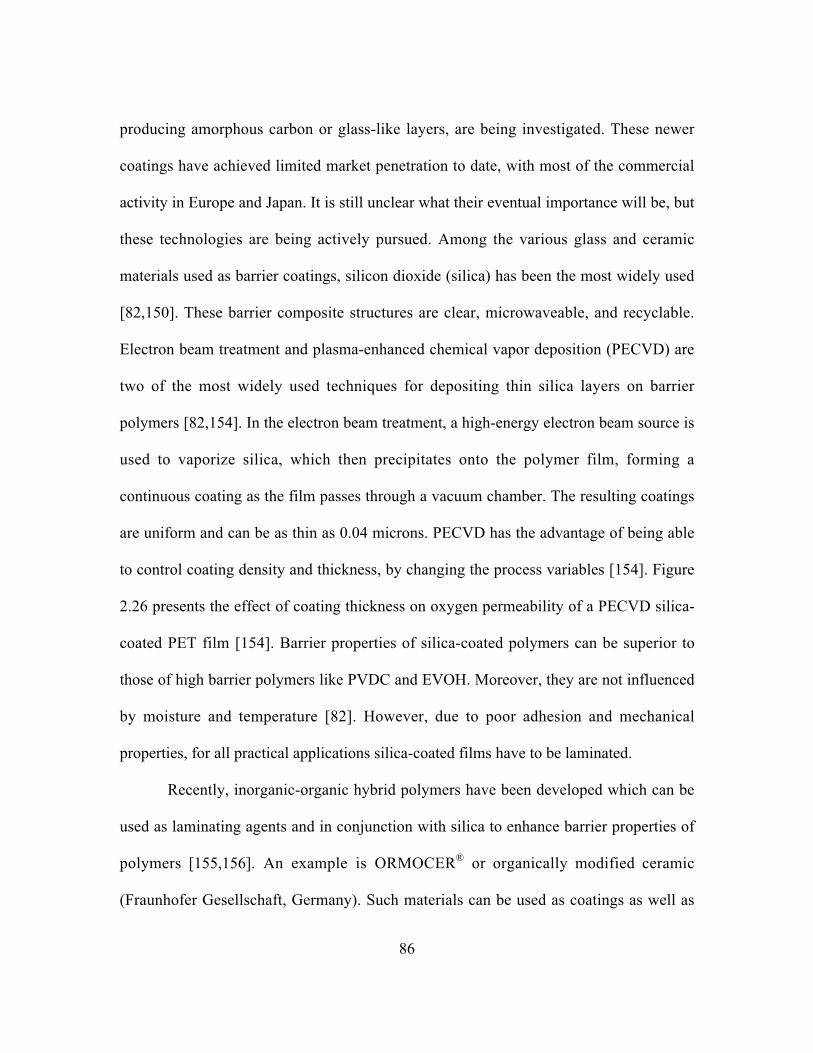
86
producing amorphous carbon or glass-like layers, are being investigated. These newer
coatings have achieved limited market penetration to date, with most of the commercial
activity in Europe and Japan. It is still unclear what their eventual importance will be, but
these technologies are being actively pursued. Among the various glass and ceramic
materials used as barrier coatings, silicon dioxide (silica) has been the most widely used
[82,150]. These barrier composite structures are clear, microwaveable, and recyclable.
Electron beam treatment and plasma-enhanced chemical vapor deposition (PECVD) are
two of the most widely used techniques for depositing thin silica layers on barrier
polymers [82,154]. In the electron beam treatment, a high-energy electron beam source is
used to vaporize silica, which then precipitates onto the polymer film, forming a
continuous coating as the film passes through a vacuum chamber. The resulting coatings
are uniform and can be as thin as 0.04 microns. PECVD has the advantage of being able
to control coating density and thickness, by changing the process variables [154]. Figure
2.26 presents the effect of coating thickness on oxygen permeability of a PECVD silica-
coated PET film [154]. Barrier properties of silica-coated polymers can be superior to
those of high barrier polymers like PVDC and EVOH. Moreover, they are not influenced
by moisture and temperature [82]. However, due to poor adhesion and mechanical
properties, for all practical applications silica-coated films have to be laminated.
Recently, inorganic-organic hybrid polymers have been developed which can be
used as laminating agents and in conjunction with silica to enhance barrier properties of
polymers [155,156]. An example is ORMOCER® or organically modified ceramic
(Fraunhofer Gesellschaft, Germany). Such materials can be used as coatings as well as
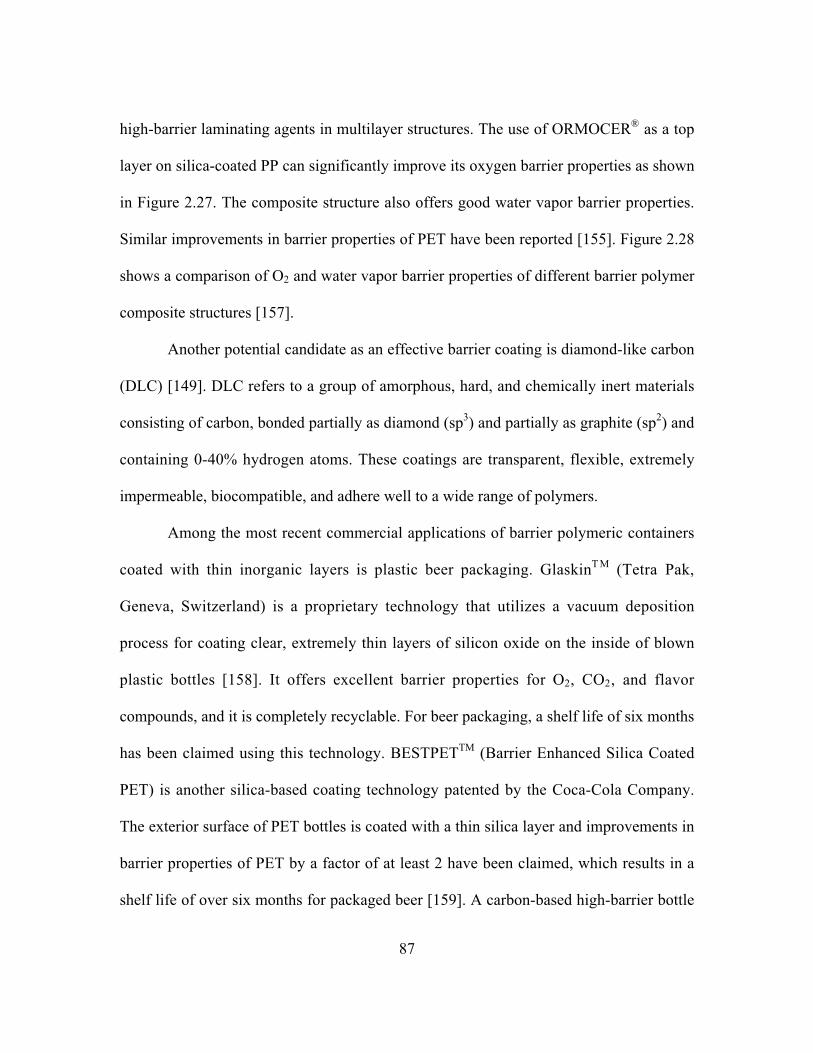
87
high-barrier laminating agents in multilayer structures. The use of ORMOCER® as a top
layer on silica-coated PP can significantly improve its oxygen barrier properties as shown
in Figure 2.27. The composite structure also offers good water vapor barrier properties.
Similar improvements in barrier properties of PET have been reported [155]. Figure 2.28
shows a comparison of O2 and water vapor barrier properties of different barrier polymer
composite structures [157].
Another potential candidate as an effective barrier coating is diamond-like carbon
(DLC) [149]. DLC refers to a group of amorphous, hard, and chemically inert materials
consisting of carbon, bonded partially as diamond (sp3) and partially as graphite (sp2) and
containing 0-40% hydrogen atoms. These coatings are transparent, flexible, extremely
impermeable, biocompatible, and adhere well to a wide range of polymers.
Among the most recent commercial applications of barrier polymeric containers
coated with thin inorganic layers is plastic beer packaging. GlaskinT M (Tetra Pak,
Geneva, Switzerland) is a proprietary technology that utilizes a vacuum deposition
process for coating clear, extremely thin layers of silicon oxide on the inside of blown
plastic bottles [158]. It offers excellent barrier properties for O2, CO2, and flavor
compounds, and it is completely recyclable. For beer packaging, a shelf life of six months
has been claimed using this technology. BESTPETTM (Barrier Enhanced Silica Coated
PET) is another silica-based coating technology patented by the Coca-Cola Company.
The exterior surface of PET bottles is coated with a thin silica layer and improvements in
barrier properties of PET by a factor of at least 2 have been claimed, which results in a
shelf life of over six months for packaged beer [159]. A carbon-based high-barrier bottle
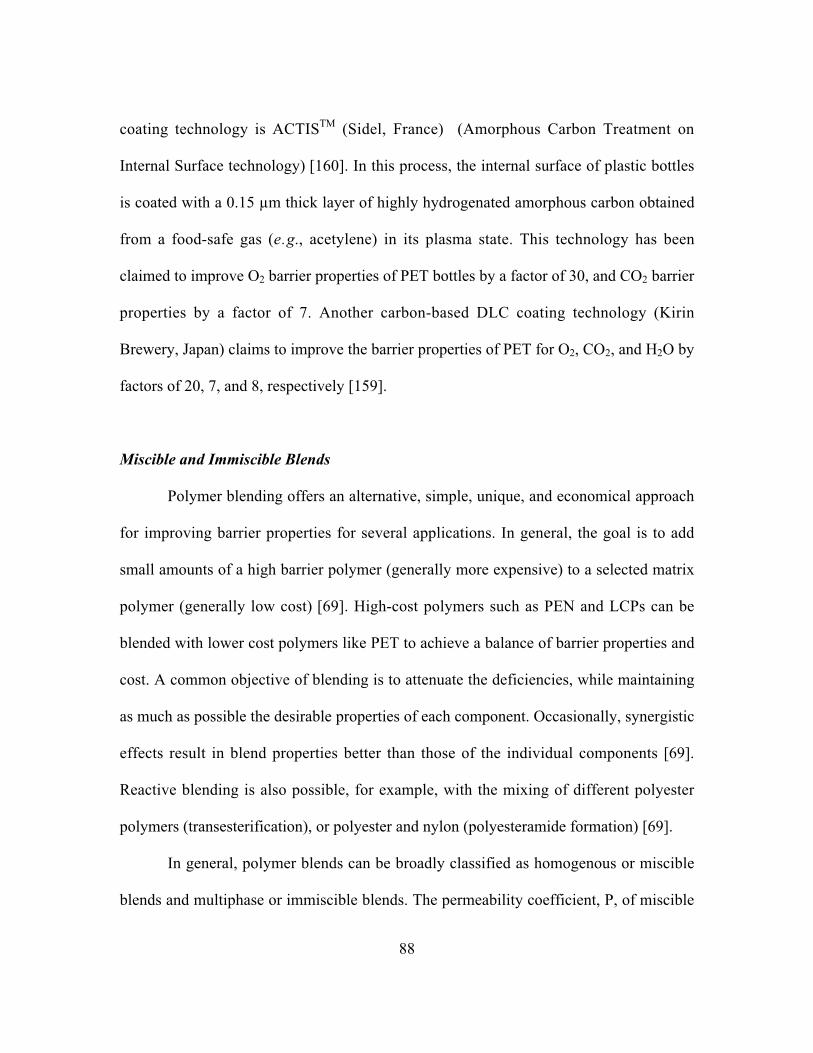
88
coating technology is ACTISTM (Sidel, France) (Amorphous Carbon Treatment on
Internal Surface technology) [160]. In this process, the internal surface of plastic bottles
is coated with a 0.15 µm thick layer of highly hydrogenated amorphous carbon obtained
from a food-safe gas (e.g., acetylene) in its plasma state. This technology has been
claimed to improve O2 barrier properties of PET bottles by a factor of 30, and CO2 barrier
properties by a factor of 7. Another carbon-based DLC coating technology (Kirin
Brewery, Japan) claims to improve the barrier properties of PET for O2, CO2, and H2O by
factors of 20, 7, and 8, respectively [159].
Miscible and Immiscible Blends
Polymer blending offers an alternative, simple, unique, and economical approach
for improving barrier properties for several applications. In general, the goal is to add
small amounts of a high barrier polymer (generally more expensive) to a selected matrix
polymer (generally low cost) [69]. High-cost polymers such as PEN and LCPs can be
blended with lower cost polymers like PET to achieve a balance of barrier properties and
cost. A common objective of blending is to attenuate the deficiencies, while maintaining
as much as possible the desirable properties of each component. Occasionally, synergistic
effects result in blend properties better than those of the individual components [69].
Reactive blending is also possible, for example, with the mixing of different polyester
polymers (transesterification), or polyester and nylon (polyesteramide formation) [69].
In general, polymer blends can be broadly classified as homogenous or miscible
blends and multiphase or immiscible blends. The permeability coefficient, P, of miscible
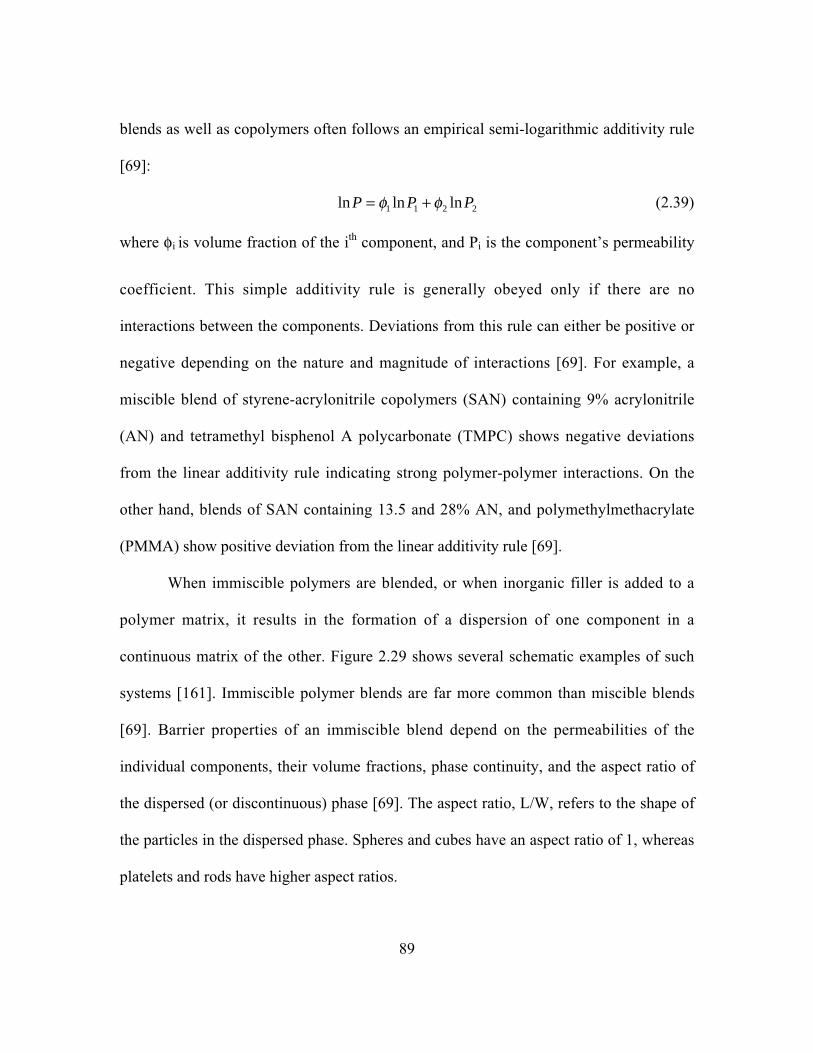
89
blends as well as copolymers often follows an empirical semi-logarithmic additivity rule
[69]:
ln ln lnP P P= +f f1 1 2 2 (2.39)
where fi is volume fraction of the ith component, and Pi is the component’s permeability
coefficient. This simple additivity rule is generally obeyed only if there are no
interactions between the components. Deviations from this rule can either be positive or
negative depending on the nature and magnitude of interactions [69]. For example, a
miscible blend of styrene-acrylonitrile copolymers (SAN) containing 9% acrylonitrile
(AN) and tetramethyl bisphenol A polycarbonate (TMPC) shows negative deviations
from the linear additivity rule indicating strong polymer-polymer interactions. On the
other hand, blends of SAN containing 13.5 and 28% AN, and polymethylmethacrylate
(PMMA) show positive deviation from the linear additivity rule [69].
When immiscible polymers are blended, or when inorganic filler is added to a
polymer matrix, it results in the formation of a dispersion of one component in a
continuous matrix of the other. Figure 2.29 shows several schematic examples of such
systems [161]. Immiscible polymer blends are far more common than miscible blends
[69]. Barrier properties of an immiscible blend depend on the permeabilities of the
individual components, their volume fractions, phase continuity, and the aspect ratio of
the dispersed (or discontinuous) phase [69]. The aspect ratio, L/W, refers to the shape of
the particles in the dispersed phase. Spheres and cubes have an aspect ratio of 1, whereas
platelets and rods have higher aspect ratios.
90
The presence of an impermeable dispersed phase lowers the permeability by
increasing tortuosity. The Maxwell model can be used to calculate the permeability of a
polymer blend, P, with impermeable spherical particles dispersed in a continuous phase
[69]:
PPm d
d
=-
+( )
/1
1 2f
f(2.40)
where Pm is permeability of the continuous polymer phase, and fd is volume fraction of
the dispersed phase. Barrer reviewed different models for permeation in a heterogeneous
media wherein the dispersed phase is impermeable and represented by different
geometrical shapes [161]. Several modifications to the Maxwell model have been made
to describe permeation behavior in platelets and ellipsoid-shaped particles dispersed in a
more permeable continuous phase [69]. For example, oxygen barrier properties of blends
of oriented PET and EVOH have been successfully modeled with one such modification
(Fricke model) [162]. Robeson extended the Maxwell model by applying it to blends in
which both the polymers contribute to the continuous phase [69]. This model considers
the practical implications of attempts to increase the barrier performance of a moderate
barrier polymer by adding small amounts of a high barrier polymer to it. According to
this model, a multilayer structure provides the highest barrier followed by a blend in
which the high barrier polymer is the continuous phase [69].
Figure 2.30 shows the improvement in O2 barrier properties of PE-EVOH blends
as a function of EVOH volume fraction. Blends of PET with MXD-6 nylon (Mitsubishi
Gas Chemical Co.) have shown significant reduction in O2 and CO2 permeability
91
coefficients relative to those of PET and are being investigated for use in plastic
containers [69]. PET-EVOH blends have been promoted (Kuraray Co.) for potential
applications in the beverage industry [82]. The transport properties of PET-LCP blends
have also been studied and Table 2.10 shows the reductions in permeabilities of O2, N2,
and CO2 that have been reported for blown films containing 2, 10, and 30 wt.% LCP
[163].
Polymer Nanocomposites
Polymer nanocomposites are immiscible blends made by adding nanometer-size
particles to barrier polymers. Since nanometer-size grains, fibers, and plates have
dramatically increased surface area compared to conventional-size materials, the
chemistry of nanosized materials is different from other conventional materials. Polymers
filled with nanometer-size particles have significantly different properties than those
filled with conventional inorganic materials [164]. Properties of nanocomposites such as
high tensile strength can be achieved by using higher conventional filler loading, but
other properties such as improved clarity cannot be duplicated by filled resins at any
loading [165].
Polymer nanocomposites were developed in the late 1980s, and were first
commercialized by Toyota, which used nanocomposite parts in one of its car models for
several years [82]. Initial developments focussed on the use of nylon resins and very fine
smectite clay particles, with surface area of about 750 m2/g, as fillers [82]. Ube Industries
developed its first nylon nanocomposite in 1989 for an automotive timing belt cover.
92
They have also developed other nylon nanocomposites called nylon clay hybrids (NCH)
[82]. More recently, novel nanocomposite nylon 6 resins developed by Honeywell
Engineered Applications and Solutions (Morristown, NJ) have been claimed to improve
O2 and CO2 barrier properties by a factor of three to four [166]. It has also been claimed
that these nanocomposites double the heat resistance of nylon 6 and improve other
mechanical properties by 30 to 50% [166]. Others such as Nanocor, Inc. [167] are also
actively developing nanocomposites for enhanced barrier performance. Commercial
products are available for PP and fluoropolymers. Some of the other potential candidate
polymers for nanocomposites include polyesters, PS, and ethylene vinyl acetate
copolymers [82]. Several polymer nanocomposites, including amorphous nylon and
EVOH matrices, intended for high barrier applications are in various stages of
development.
2.9.2 Oxygen-Scavenging Systems
Another strategy for improving the barrier properties of polymers is the
introduction of reactive groups in the polymer. These groups can reduce the transmission
of penetrants like oxygen and water vapor and the term “active barrier” is often used to
describe this approach to distinguish it from “passive barrier” packages that rely on
reduced permeability to decrease gas transmission. By using an oxygen-scavenger, which
absorbs the residual oxygen after packaging, quality changes of oxygen-sensitive foods
can be minimized [168-170]. Although oxygen-scavenging technology is rapidly
evolving and encompasses a wide variety of chemistries, the majority of current
93
commercial oxygen-scavenger packages probably still employ sachets that remove
oxygen from the headspace via iron oxidation. Ageless® (Mitsubishi Gas Chemical Co.,
Japan) oxygen absorbers are the most commonly used sachets that are placed inside the
food package [82]. If the initial oxygen concentration and oxygen permeability of the
packaging polymer is known, then an oxygen-scavenger can be chosen with a higher
capacity than the theoretically needed capacity, and near total absence of oxygen can be
maintained during the expected shelf life of the product [168]. Other iron-based oxygen-
scavenger sachets are ATCO® (Standa Ind., France), Freshilizer® (Toppan Printing Co.,
Japan), Vitalon® (Toagosei Chem. Ind., Japan), Freshpax® (Multisorb Technologies Inc.,
USA), and Sanso-cut® (Finetec Co., Japan) [168].
An alternative to sachets is the incorporation of the oxygen-scavenger into the
barrier polymer structure itself [168]. An example of this strategy is OxbarTM (Crown
Cork And Seal, UK), which involves cobalt-catalyzed oxidation of nylon MXD-6
polymer used in multilayer PET bottles for packaging of beverages. Another example of
a polymer-based absorber is Amosorb® (Amoco Chemicals, USA), which can reportedly
be incorporated into various rigid and flexible packaging structures [168]. This is a
rapidly evolving field and several other companies have also introduced or announced
oxygen-scavenging resins. Among those active in this area are: EVAL Co., USA,
Kuraray Co. Ltd., Japan, and Darex Co., USA with DarEval® [171], Owens-
Illinois/Continental PET Technologies with CPTX-312, Honeywell International, Inc.
with scavenging nylon resin [172], Cryovac with OS 1000, and Chevron Phillips
Chemical Co. with their OSP scavengers [173]. While the speed and capacity of oxygen-

94
scavenging films are considerably lower than iron-based oxygen-scavenger sachets [168],
oxygen ingress into the package can be reduced to very low levels with appropriately
designed scavenger structures. Figure 2.31 presents an example of the reduction in
oxygen transmission rate due to oxygen scavenging in blends of PET and nylon MXD-6
[174]. Scavengers can also be incorporated into the liner of bottle closures where they
can significantly reduce the ingress of oxygen into the package through the closure liner
[175].
A recent study by Cussler et al. [176] has shown that incorporation of inorganic
fillers as well as reactive groups in barrier polymer films can significantly improve the
shelf life of packages. According to their theory, the presence of immobile reactive
groups dramatically increases the time lag (i.e., the time required to achieve steady-state
permeability), but do not affect steady-state transport of penetrants across barrier polymer
films. For example, in LDPE and PVDC films containing 10% flakes of mica or clay and
linolenic acid as the oxygen-scavenging species, the time lag for permeation of O2
dramatically increased by about three orders of magnitude to 40 hours and 3 years,
respectively [176].

95
2.10 Conclusions
Barrier polymers are widely used in food, beverage, and other packaging
industries. Some of the their advantages over traditional packaging materials like glass,
paper, and metals are flexibility, light weight, toughness, versatility, and printability. The
selection of a polymer for a particular packaging application depends on its barrier as
well as other physical properties. A comparison of these properties and current as well as
potential future applications for different types of barrier polymers has been presented.
Additionally, important factors governing permeability (e.g., penetrant size, polymer
chemical structure, temperature, humidity, etc.) as well as ways to measure and predict
permeability have also been discussed.
Unlike glass and metals, no polymer offers an infinite gas barrier. Despite this
limitation, monolayer polymer structures in many instances satisfy the barrier
requirements for a package. In other situations, combinations of different polymers, or
polymers with inorganic materials, in the form of multilayer structures or blends, can
provide cost-effective barrier for the intended shelf life of packaged products. As a result,
plastic packaging is ubiquitous. Market pressures, however, drive the need for continual
improvements in packaging materials. Hence, there is an ongoing interest in improving
the barrier properties of polymers used in packaging, and the search for improved barrier
polymers and structures is ongoing. Inorganic materials such as silicon & aluminum
oxides and clays can be used to significantly enhance gas barrier and other mechanical
properties of polymers. One area of recent activity is polymer nanocomposites, which
involves dispersion of nanoscale barrier particles in a polymer matrix. A considerable
96
amount of research is also being focussed on techniques for developing thin layers of
inorganic coatings on barrier polymer films and containers. In addition, work in the field
of oxygen-scavenging technologies (so-called ‘active packaging systems’) has resulted in
several developments. While advances in these newer barrier technologies have recently
opened up several commercial applications, with plastic beer packaging being perhaps
the most publicized, it is much too early to accurately predict their eventual success in the
market place. Constructions with established “passive” barrier polymers currently
dominate the barrier packaging market, and these materials are expected to be
commercially important for many years to come.
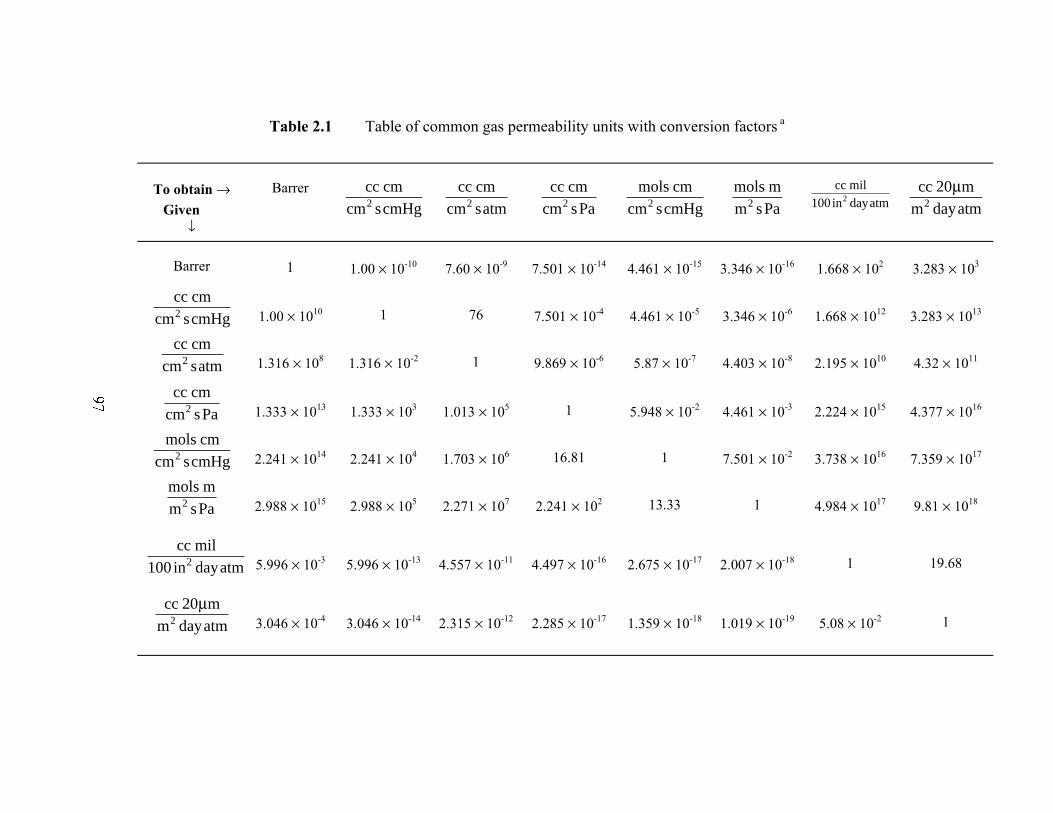
Table 2.1 Table of common gas permeability units with conversion factors a
To obtain Æ Given
Ø
Barrer cc cmcm scmHg2
cc cmcm satm2
cc cmcm sPa2
mols cmcm scmHg2
mols mm sPa2
cc milin dayatm100 2
cc mm dayatm
202
m
Barrer 1 1.00 ¥ 10-10 7.60 ¥ 10-9 7.501 ¥ 10-14 4.461 ¥ 10-15 3.346 ¥ 10-16 1.668 ¥ 102 3.283 ¥ 103
cc cmcm scmHg2 1.00 ¥ 1010 1 76 7.501 ¥ 10-4 4.461 ¥ 10-5 3.346 ¥ 10-6 1.668 ¥ 1012 3.283 ¥ 1013
cc cmcm satm2 1.316 ¥ 108 1.316 ¥ 10-2 1 9.869 ¥ 10-6 5.87 ¥ 10-7 4.403 ¥ 10-8 2.195 ¥ 1010 4.32 ¥ 1011
cc cmcm sPa2 1.333 ¥ 1013 1.333 ¥ 103 1.013 ¥ 105 1 5.948 ¥ 10-2 4.461 ¥ 10-3 2.224 ¥ 1015 4.377 ¥ 1016
mols cmcm scmHg2 2.241 ¥ 1014 2.241 ¥ 104 1.703 ¥ 106 16.81 1 7.501 ¥ 10-2 3.738 ¥ 1016 7.359 ¥ 1017
mols mm sPa2 2.988 ¥ 1015 2.988 ¥ 105 2.271 ¥ 107 2.241 ¥ 102 13.33 1 4.984 ¥ 1017 9.81 ¥ 1018
cc milin dayatm100 2 5.996 ¥ 10-3 5.996 ¥ 10-13 4.557 ¥ 10-11 4.497 ¥ 10-16 2.675 ¥ 10-17 2.007 ¥ 10-18 1 19.68
cc mm dayatm
202
m3.046 ¥ 10-4 3.046 ¥ 10-14 2.315 ¥ 10-12 2.285 ¥ 10-17 1.359 ¥ 10-18 1.019 ¥ 10-19 5.08 ¥ 10-2 1

a Given permeability in the units shown in one element of the first column, convert it to the units shown in one element of the first row by multiplying the original permeability by the factor at the intersection of the row and column of interest. For example, a value of 2 cc 20mm/(m2 day atm) is equal to (2 ¥ 0.0508) or 0.1 cc mil/(100 in2 day atm).
In this table and throughout the chapter, cc (or cm3) has been used to denote cubic centimeters of gas as measured at standard temperature and pressure (STP) conditions, which are 0°C and 1 atmosphere.
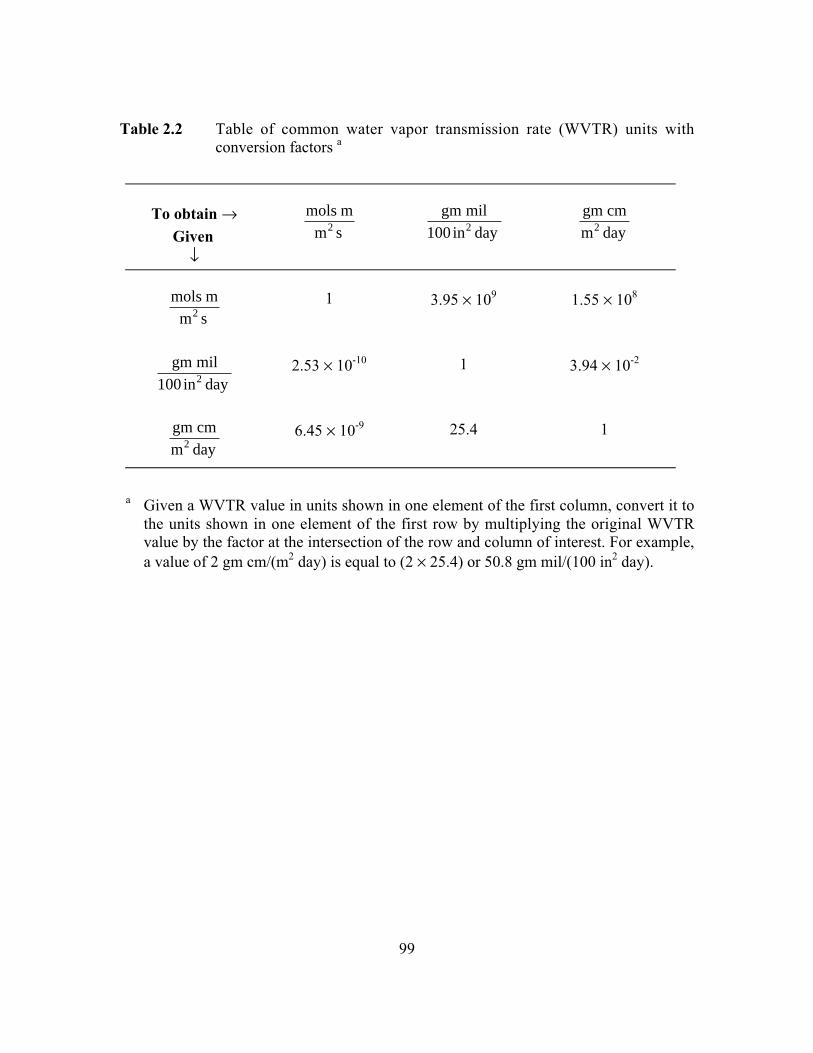
99
Table 2.2 Table of common water vapor transmission rate (WVTR) units withconversion factors a
To obtain Æ Given
Ø
mols mm s2
gm milin day100 2
gm cmm day2
mols mm s2
1 3.95 ¥ 109 1.55 ¥ 108
gm milin day100 2
2.53 ¥ 10-10 1 3.94 ¥ 10-2
gm cmm day2
6.45 ¥ 10-9 25.4 1
a Given a WVTR value in units shown in one element of the first column, convert it tothe units shown in one element of the first row by multiplying the original WVTRvalue by the factor at the intersection of the row and column of interest. For example,a value of 2 gm cm/(m2 day) is equal to (2 ¥ 25.4) or 50.8 gm mil/(100 in2 day).
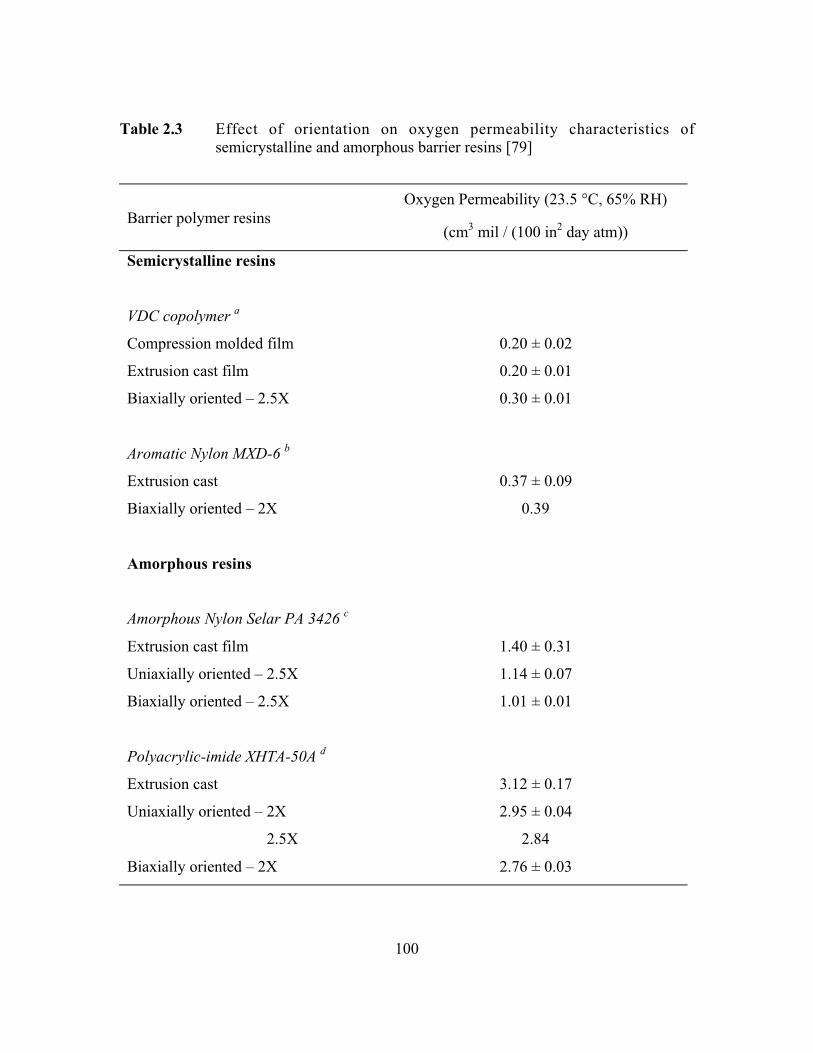
100
Table 2.3 Effect of orientation on oxygen permeability characteristics ofsemicrystalline and amorphous barrier resins [79]
Barrier polymer resinsOxygen Permeability (23.5 °C, 65% RH)
(cm3 mil / (100 in2 day atm))
Semicrystalline resins
VDC copolymer a
Compression molded film
Extrusion cast film
Biaxially oriented – 2.5X
Aromatic Nylon MXD-6 b
Extrusion cast
Biaxially oriented – 2X
0.20 ± 0.02
0.20 ± 0.01
0.30 ± 0.01
0.37 ± 0.09
0.39
Amorphous resins
Amorphous Nylon Selar PA 3426 c
Extrusion cast film
Uniaxially oriented – 2.5X
Biaxially oriented – 2.5X
Polyacrylic-imide XHTA-50A d
Extrusion cast
Uniaxially oriented – 2X
2.5X
Biaxially oriented – 2X
1.40 ± 0.31
1.14 ± 0.07
1.01 ± 0.01
3.12 ± 0.17
2.95 ± 0.04
2.84
2.76 ± 0.03

101
a The Dow Chemical Company’s Vinylidene chloride/vinyl chloride copolymer (experimental grade XU 32009.02)b Trademark of Mitsubishi Gas Chemical Co., Japanc Trademark of E.I. du Pont de Nemours & Co.d Trademark of Rohm & Haas
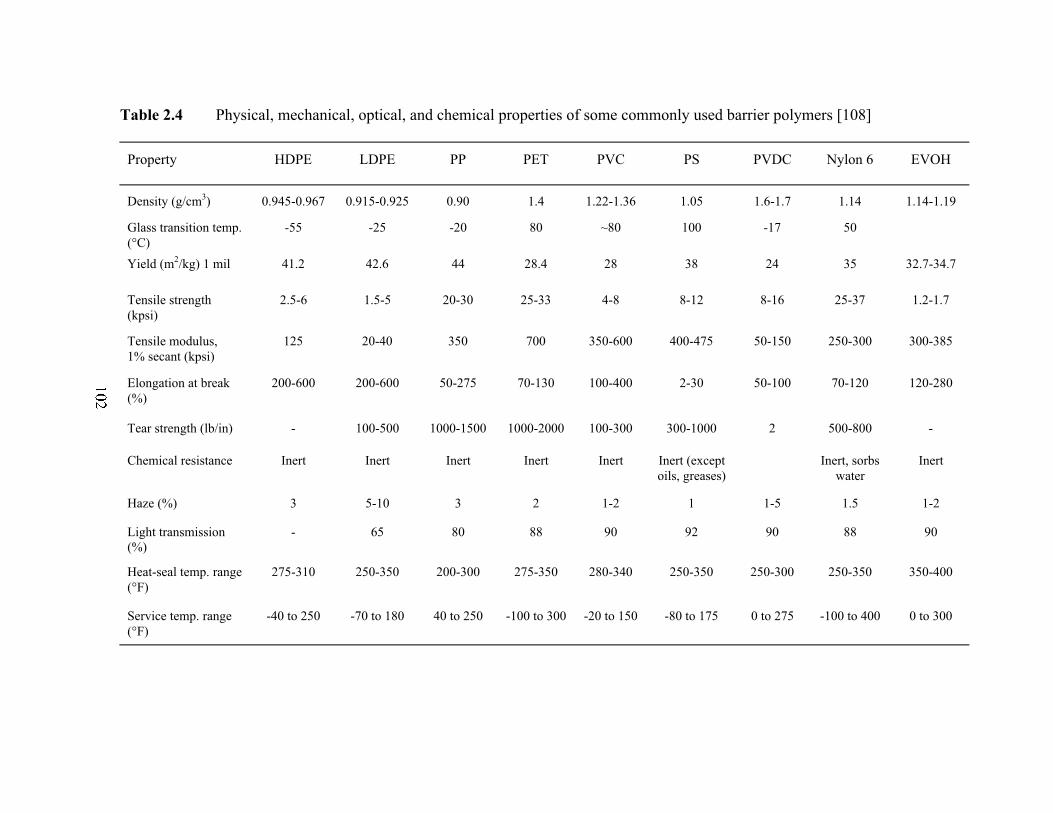
Table 2.4 Physical, mechanical, optical, and chemical properties of some commonly used barrier polymers [108]
Property HDPE LDPE PP PET PVC PS PVDC Nylon 6 EVOH
Density (g/cm3) 0.945-0.967 0.915-0.925 0.90 1.4 1.22-1.36 1.05 1.6-1.7 1.14 1.14-1.19
Glass transition temp.(°C)
-55 -25 -20 80 ~80 100 -17 50
Yield (m2/kg) 1 mil 41.2 42.6 44 28.4 28 38 24 35 32.7-34.7
Tensile strength(kpsi)
2.5-6 1.5-5 20-30 25-33 4-8 8-12 8-16 25-37 1.2-1.7
Tensile modulus,1% secant (kpsi)
125 20-40 350 700 350-600 400-475 50-150 250-300 300-385
Elongation at break(%)
200-600 200-600 50-275 70-130 100-400 2-30 50-100 70-120 120-280
Tear strength (lb/in) - 100-500 1000-1500 1000-2000 100-300 300-1000 2 500-800 -
Chemical resistance Inert Inert Inert Inert Inert Inert (exceptoils, greases)
Inert, sorbswater
Inert
Haze (%) 3 5-10 3 2 1-2 1 1-5 1.5 1-2
Light transmission(%)
- 65 80 88 90 92 90 88 90
Heat-seal temp. range(°F)
275-310 250-350 200-300 275-350 280-340 250-350 250-300 250-350 350-400
Service temp. range(°F)
-40 to 250 -70 to 180 40 to 250 -100 to 300 -20 to 150 -80 to 175 0 to 275 -100 to 400 0 to 300
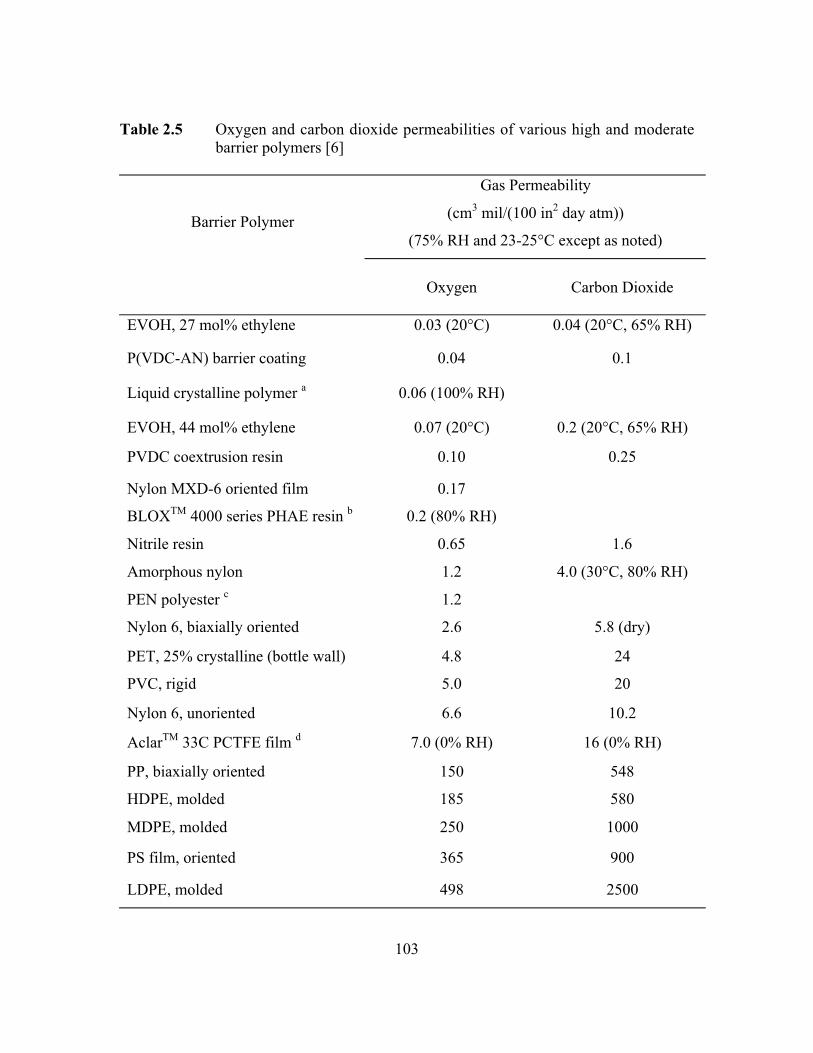
103
Table 2.5 Oxygen and carbon dioxide permeabilities of various high and moderatebarrier polymers [6]
Gas Permeability
(cm3 mil/(100 in2 day atm))
(75% RH and 23-25°C except as noted)Barrier Polymer
Oxygen Carbon Dioxide
EVOH, 27 mol% ethylene 0.03 (20°C) 0.04 (20°C, 65% RH)
P(VDC-AN) barrier coating 0.04 0.1
Liquid crystalline polymer a 0.06 (100% RH)
EVOH, 44 mol% ethylene 0.07 (20°C) 0.2 (20°C, 65% RH)
PVDC coextrusion resin 0.10 0.25
Nylon MXD-6 oriented film 0.17
BLOXTM 4000 series PHAE resin b 0.2 (80% RH)
Nitrile resin 0.65 1.6
Amorphous nylon 1.2 4.0 (30°C, 80% RH)
PEN polyester c 1.2
Nylon 6, biaxially oriented 2.6 5.8 (dry)
PET, 25% crystalline (bottle wall) 4.8 24
PVC, rigid 5.0 20
Nylon 6, unoriented 6.6 10.2
AclarTM 33C PCTFE film d 7.0 (0% RH) 16 (0% RH)
PP, biaxially oriented 150 548
HDPE, molded 185 580
MDPE, molded 250 1000
PS film, oriented 365 900
LDPE, molded 498 2500
104
a Vectra® A950 LCP film (Hoechst AG) [177]b [133] BLOXTM is a trademark of The Dow Chemical Co. (Midland, MI)c Ref [82]d [178] AclarTM is a trademark of Allied Signal Corp. (Morristown, NJ)

105
Table 2.6 Water vapor transmission rates of various high and moderate barrierpolymers [6]
Barrier Polymer
Water Vapor Transmission Rate
(gm mil/(100 in2 day))
(90% RH, 37.8°C)
P(VDC-AN) barrier coating 0.02
AclarTM 33C PCTFE film a 0.025
PVDC coextrusion resin 0.09
Liquid crystalline polymer b 0.15 (100% RH)
PP, biaxially oriented 0.25
HDPE, molded 0.3
MDPE, molded 0.7
PVC, rigid 0.9
LDPE, molded 1.0
Nylon MXD-6 oriented film 1.2
EVOH, 44 mol% ethylene 1.4
PET, 25% crystalline (bottle wall) 1.8
Nitrile resin 4.0
EVOH, 27 mol% ethylene 5.7
PS film, oriented 7.1
Nylon 6, biaxially oriented 10
Amorphous nylon 10
Nylon 6, unoriented 15
a [178] AclarTM is a trademark of Allied Signal Corp. (Morristown, NJ)b [177] Vectra‚ A950 LCP film (Hoechst AG)
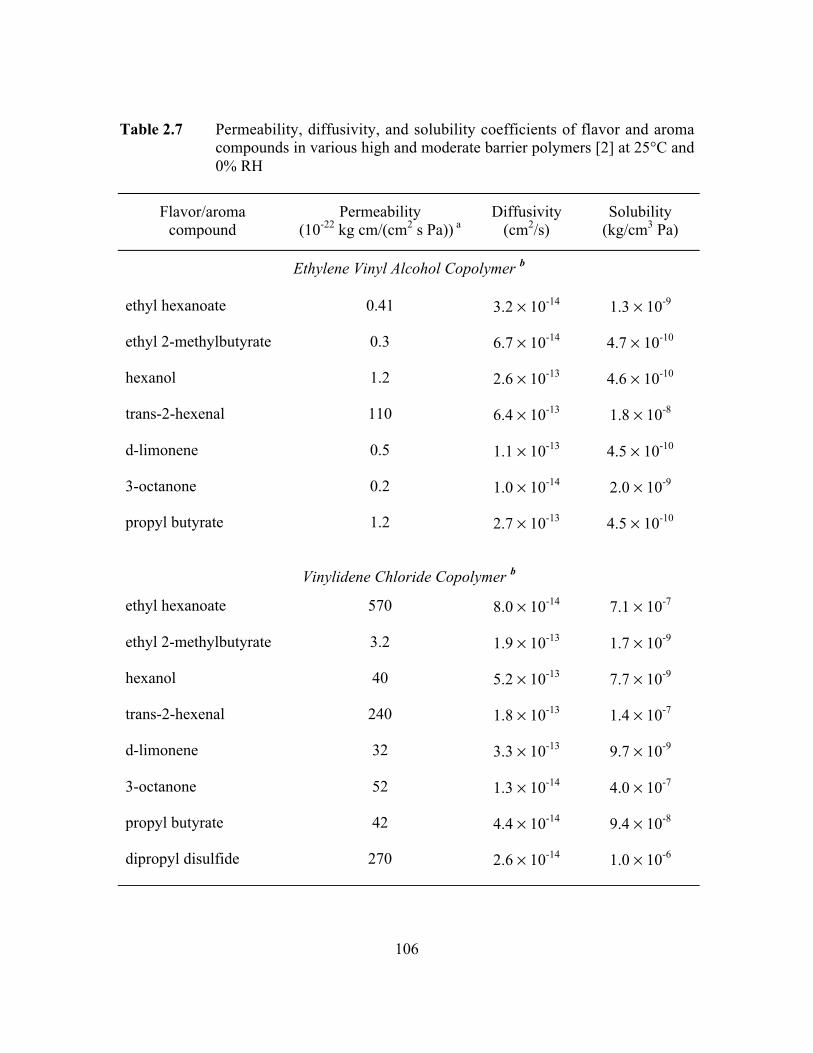
106
Table 2.7 Permeability, diffusivity, and solubility coefficients of flavor and aromacompounds in various high and moderate barrier polymers [2] at 25°C and0% RH
Flavor/aromacompound
Permeability(10-22 kg cm/(cm2 s Pa)) a
Diffusivity(cm2/s)
Solubility(kg/cm3 Pa)
Ethylene Vinyl Alcohol Copolymer b
ethyl hexanoate 0.41 3.2 ¥ 10-14 1.3 ¥ 10-9
ethyl 2-methylbutyrate 0.3 6.7 ¥ 10-14 4.7 ¥ 10-10
hexanol 1.2 2.6 ¥ 10-13 4.6 ¥ 10-10
trans-2-hexenal 110 6.4 ¥ 10-13 1.8 ¥ 10-8
d-limonene 0.5 1.1 ¥ 10-13 4.5 ¥ 10-10
3-octanone 0.2 1.0 ¥ 10-14 2.0 ¥ 10-9
propyl butyrate 1.2 2.7 ¥ 10-13 4.5 ¥ 10-10
Vinylidene Chloride Copolymer b
ethyl hexanoate 570 8.0 ¥ 10-14 7.1 ¥ 10-7
ethyl 2-methylbutyrate 3.2 1.9 ¥ 10-13 1.7 ¥ 10-9
hexanol 40 5.2 ¥ 10-13 7.7 ¥ 10-9
trans-2-hexenal 240 1.8 ¥ 10-13 1.4 ¥ 10-7
d-limonene 32 3.3 ¥ 10-13 9.7 ¥ 10-9
3-octanone 52 1.3 ¥ 10-14 4.0 ¥ 10-7
propyl butyrate 42 4.4 ¥ 10-14 9.4 ¥ 10-8
dipropyl disulfide 270 2.6 ¥ 10-14 1.0 ¥ 10-6

107
Table 2.7 (continued)
Flavor/aromacompound
Permeability(10-22 kg cm/(cm2 s Pa)) a
Diffusivity(cm2/s)
Solubility(kg/cm3 Pa)
Low Density Polyethylene
ethyl hexanoate 4.1 ¥ 106 5.2 ¥ 10-9 7.8 ¥ 10-8
ethyl 2-methylbutyrate 4.9 ¥ 105 2.4 ¥ 10-9 2.3 ¥ 10-8
hexanol 9.7 ¥ 105 4.6 ¥ 10-9 2.3 ¥ 10-8
trans-2-hexenal 8.1 ¥ 105
d-limonene 4.3 ¥ 106
3-octanone 6.8 ¥ 106 5.6 ¥ 10-9 1.2 ¥ 10-7
propyl butyrate 1.5 ¥ 106 5.0 ¥ 10-9 3.0 ¥ 10-8
dipropyl disulfide 6.8 ¥ 106 7.3 ¥ 10-10 9.3 ¥ 10-7
High Density Polyethylened-limonene 3.5 ¥ 106 1.7 ¥ 10-9 2.5 ¥ 10-7
menthone 5.2 ¥ 106 9.1 ¥ 10-9 4.7 ¥ 10-7
methyl salicylate 1.1 ¥ 107 8.7 ¥ 10-10 1.6 ¥ 10-6
Polypropylene
2-butanone 8.5 ¥ 103 2.1 ¥ 10-11 4.0 ¥ 10-8
ethyl butyrate 9.5 ¥ 103 1.8 ¥ 10-11 5.3 ¥ 10-8
ethyl hexanoate 8.7 ¥ 104 3.1 ¥ 10-11 2.8 ¥ 10-7
d-limonene 1.6 ¥ 104 7.4 ¥ 10-12 2.1 ¥ 10-7
Poly(ethylene terephthalate) c
d-limonene 1.5 6.0 ¥ 10-13
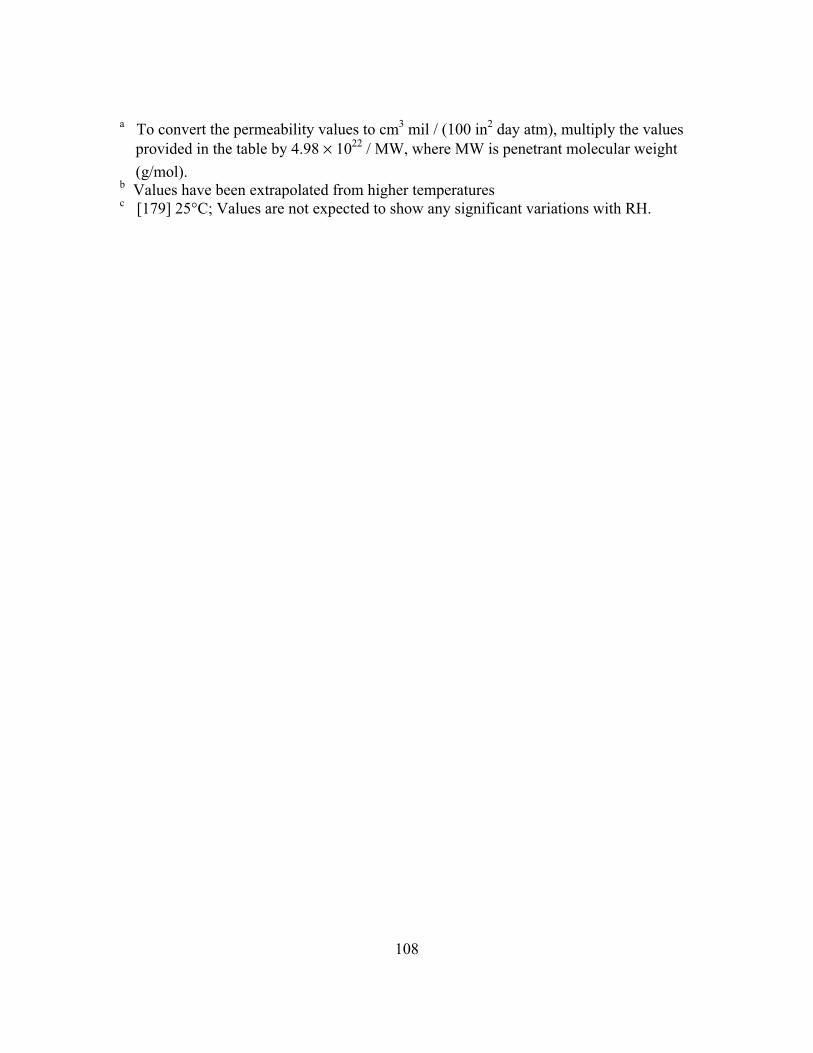
108
a To convert the permeability values to cm3 mil / (100 in2 day atm), multiply the values provided in the table by 4.98 ¥ 1022 / MW, where MW is penetrant molecular weight
(g/mol).b Values have been extrapolated from higher temperaturesc [179] 25°C; Values are not expected to show any significant variations with RH.

109
Table 2.8 Compositions of commercial, high barrier nitrile copolymers [2]
Polymer Manufacturer Chemical Composition a
LopacTM
BarexTM
CycopacTM
Monsanto Co.
Sohio
Borg-Warner Chemicals
70% acrylonitrile + 30% styrene
74% acrylonitrile + 26% methyl
methacrylate + 10% butadiene graft rubber
74% acrylonitrile + 26% styrene + 10%
butadiene graft rubber
a Data from FDA regulations for corresponding materials
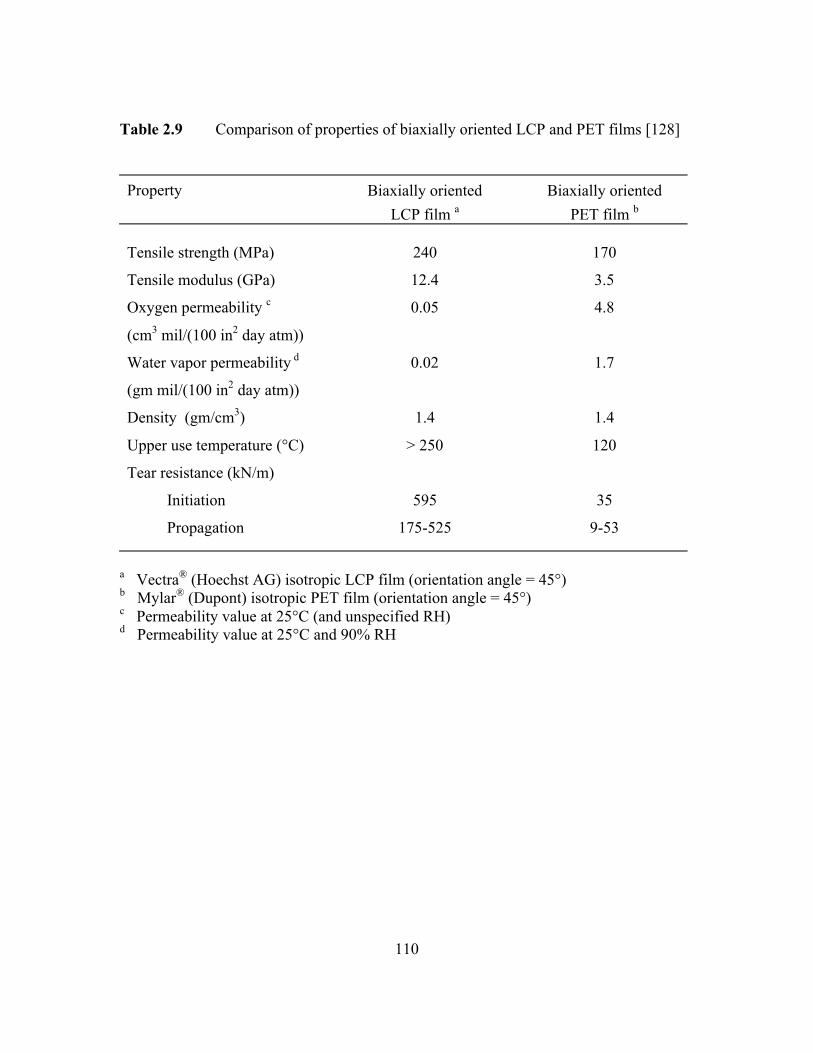
110
Table 2.9 Comparison of properties of biaxially oriented LCP and PET films [128]
Property Biaxially oriented
LCP film aBiaxially oriented
PET film b
Tensile strength (MPa)
Tensile modulus (GPa)
Oxygen permeability c
(cm3 mil/(100 in2 day atm))
Water vapor permeability d
(gm mil/(100 in2 day atm))
Density (gm/cm3)
Upper use temperature (°C)
Tear resistance (kN/m)
Initiation
Propagation
240
12.4
0.05
0.02
1.4
> 250
595
175-525
170
3.5
4.8
1.7
1.4
120
35
9-53
a Vectra® (Hoechst AG) isotropic LCP film (orientation angle = 45°)b Mylar® (Dupont) isotropic PET film (orientation angle = 45°)c Permeability value at 25°C (and unspecified RH)d Permeability value at 25°C and 90% RH

111
Table 2.10 Gas permeabilities of LCP-PET blends [69]
%LCP a in PET CO2 permeability b O2 permeability b N2 permeability b
0
2
10
30
114.5
78.1
65.8
34.5
21.3
14.9
12.0
5.5
5.1
2.6
3.1
2.0
a Rodrun® LC3000 LCPb Units are (cm3 mil/(100 in2 day atm))
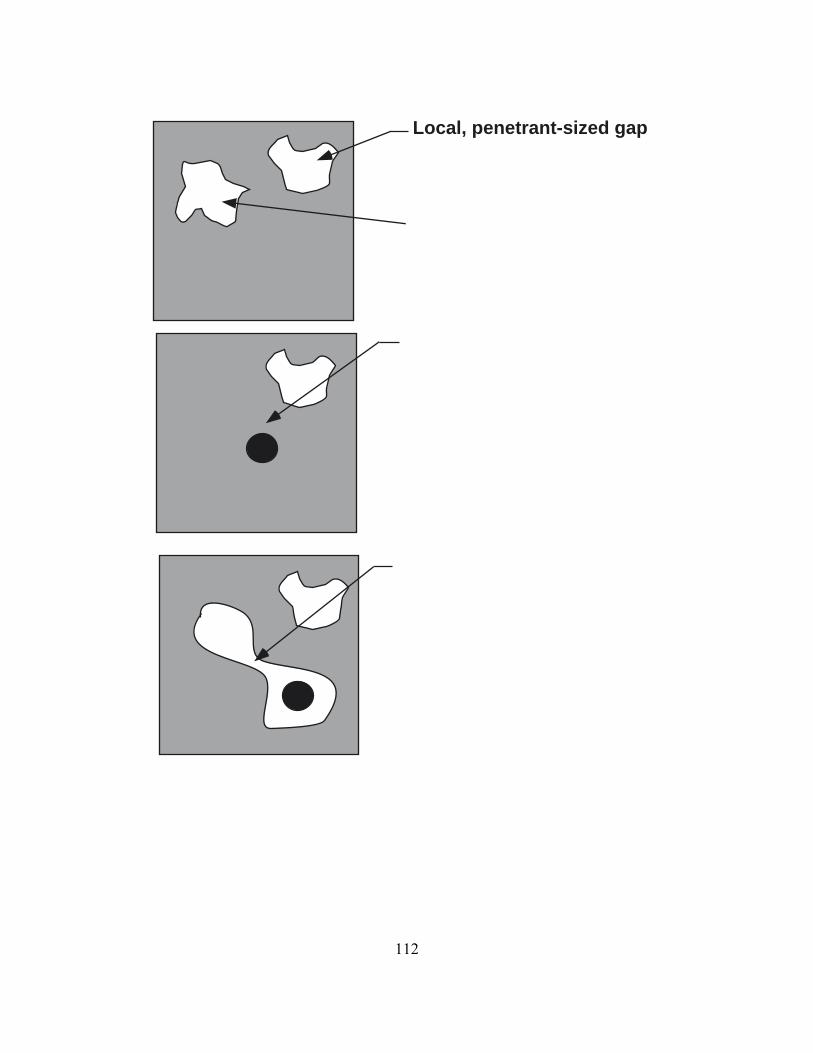
112
Local, penetrant-sized gap�in polymer due to chain�motion
Penetrant dissolved in�polymer matrix
Opening of transient,�penetrant-sized gap in�polymer matrix due to�cooperative segmental�motion
Gap closes behind penetrant,�which has executed a�diffusion step to a new region�of polymer matrix
A:
B:
C:
Figure 2.1 Cartoon depicting mechanism of penetrant transport in polymers [41].

113
Prior to jump Penetrant
Polymer Chain
Activated state
After jump completed ld
ld
Figure 2.2 Cartoon depicting polymer chain position before, during, and after adiffusion step by a penetrant molecule [42].
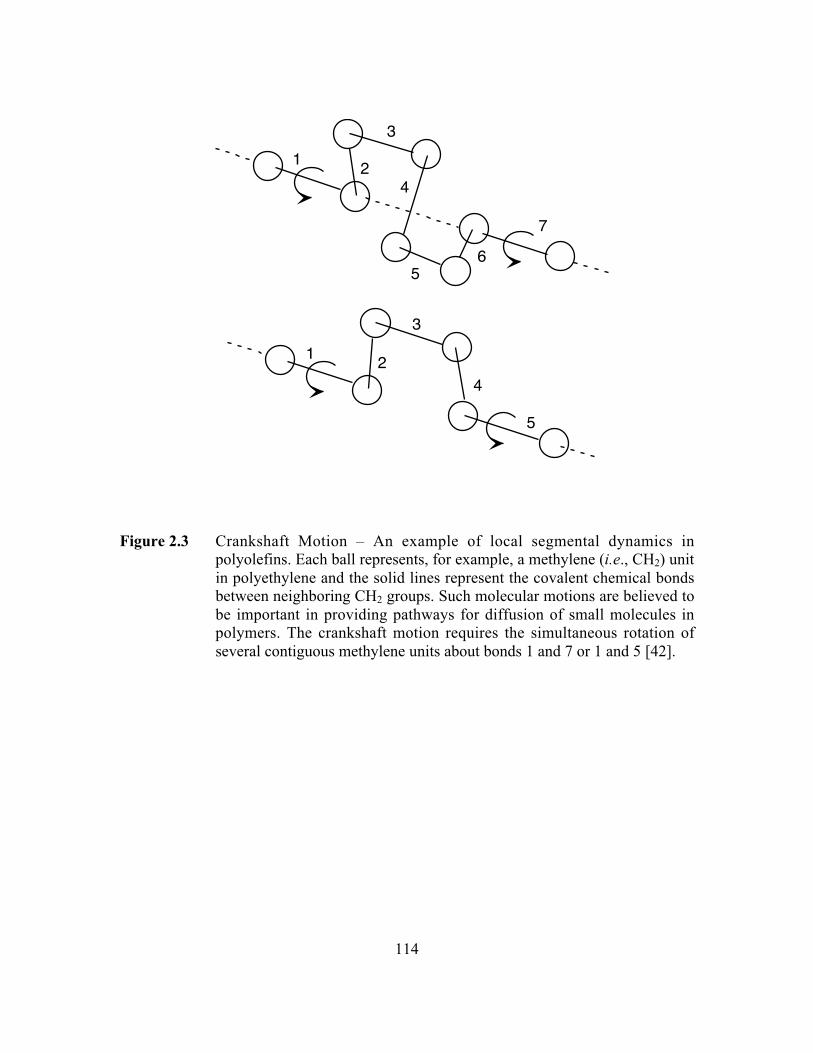
114
12
3
4
56
7
12
3
4
5
Figure 2.3 Crankshaft Motion – An example of local segmental dynamics inpolyolefins. Each ball represents, for example, a methylene (i.e., CH2) unitin polyethylene and the solid lines represent the covalent chemical bondsbetween neighboring CH2 groups. Such molecular motions are believed tobe important in providing pathways for diffusion of small molecules inpolymers. The crankshaft motion requires the simultaneous rotation ofseveral contiguous methylene units about bonds 1 and 7 or 1 and 5 [42].
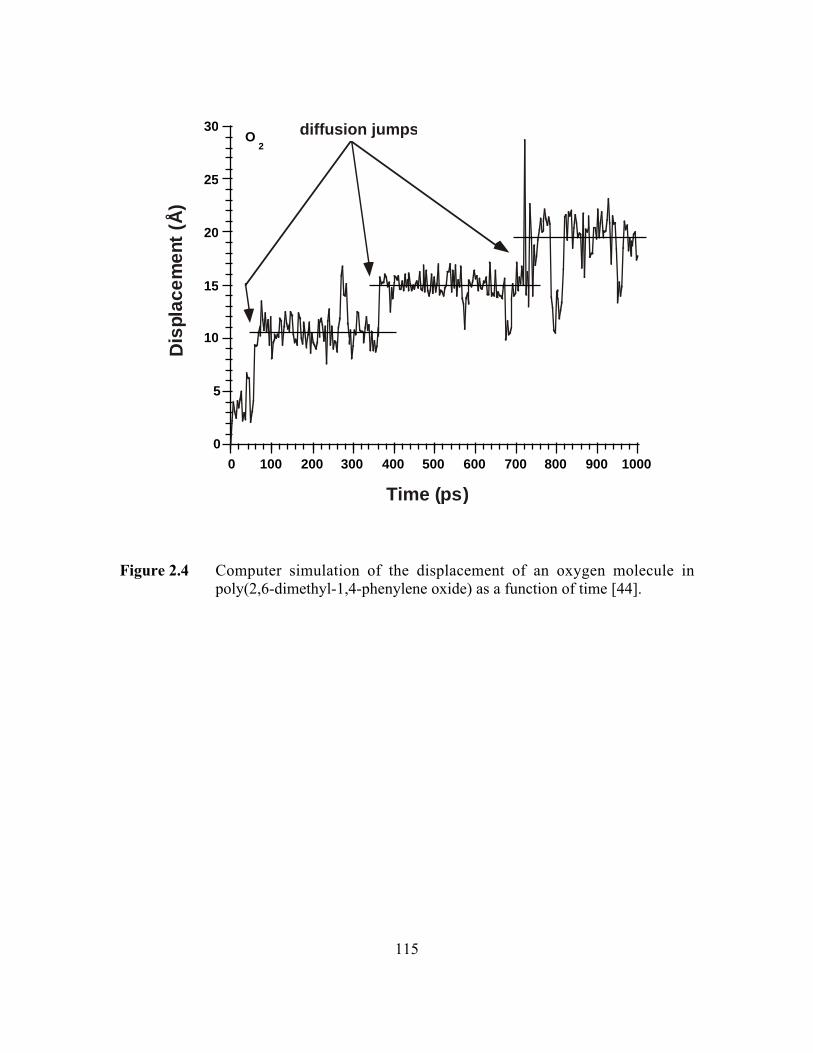
115
0
5
10
15
20
25
30
0 100 200 300 400 500 600 700 800 900 1000
O2
diffusion jump s
Dis
plac
emen
t (Å
)
Time (ps)
Figure 2.4 Computer simulation of the displacement of an oxygen molecule inpoly(2,6-dimethyl-1,4-phenylene oxide) as a function of time [44].

116
0
5
10
15
20
25
30
0 100 200 300 400 500 600 700 800 900 1000
N2
diffusio njump
Dis
plac
emen
t (Å
)
Time (ps)
Figure 2.5 Computer simulation of the displacement of a nitrogen molecule inpoly(2,6-dimethyl-1,4-phenylene oxide) as a function of time [44].
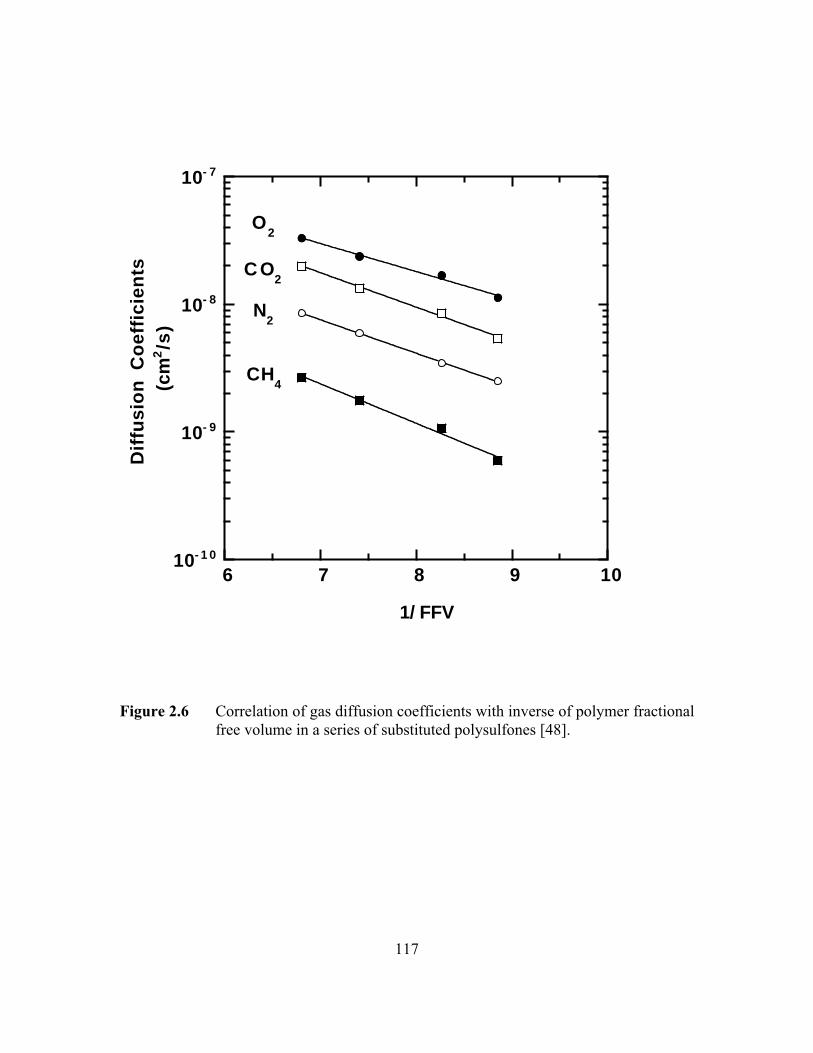
117
10- 1 0
10- 9
10- 8
10- 7
6 7 8 9 10
Diff
usio
n C
oeff
icie
nts
(cm
2/s
)
1/ FFV
C O2
CH4
O2
N2
Figure 2.6 Correlation of gas diffusion coefficients with inverse of polymer fractionalfree volume in a series of substituted polysulfones [48].
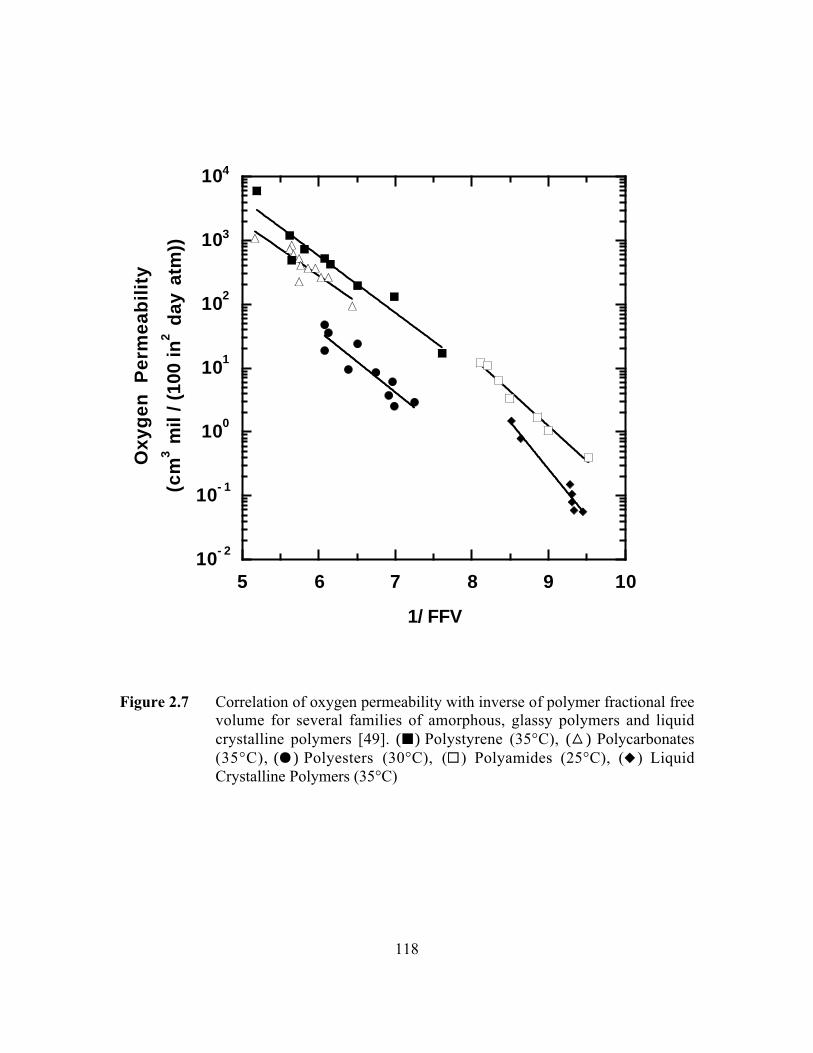
118
10- 2
10- 1
100
101
102
103
104
5 6 7 8 9 10
Oxy
gen
Per
mea
bilit
y
(cm
3 m
il / (
100
in2 d
ay a
tm))
1/ FFV
Figure 2.7 Correlation of oxygen permeability with inverse of polymer fractional freevolume for several families of amorphous, glassy polymers and liquidcrystalline polymers [49]. (B) Polystyrene (35°C), (C ) Polycarbonates(35°C), (J ) Polyesters (30°C), (G) Polyamides (25°C), (F) LiquidCrystalline Polymers (35°C)
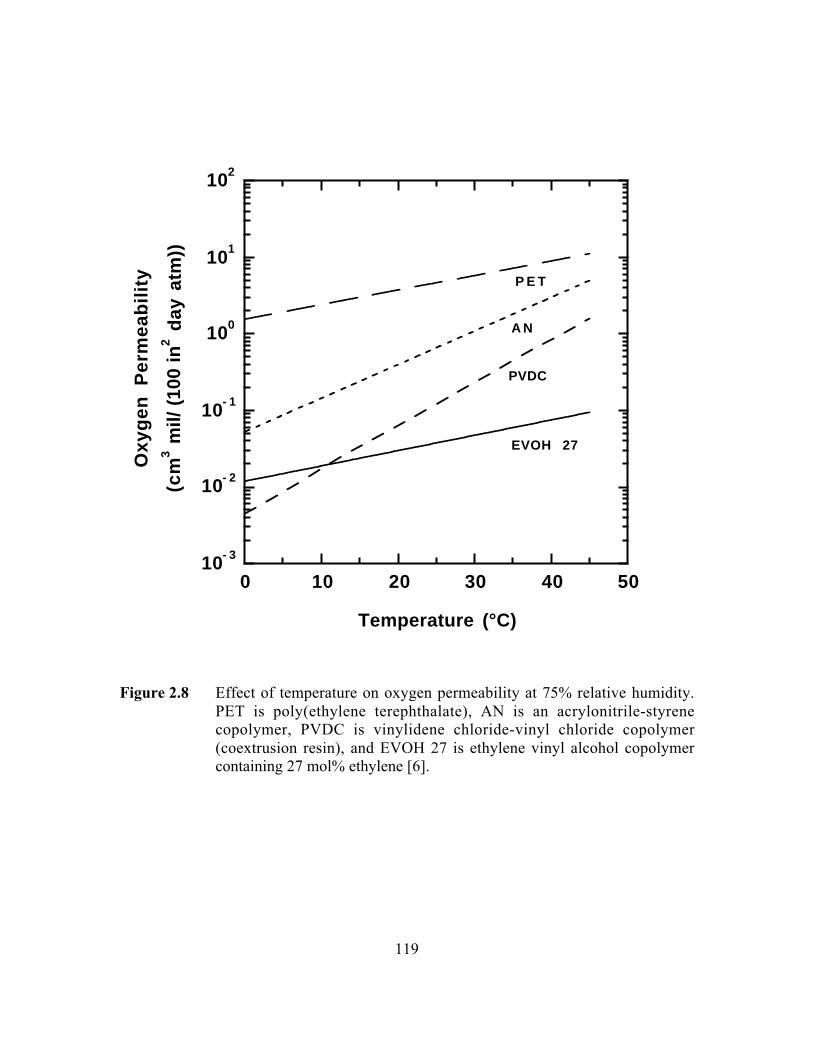
119
10- 3
10- 2
10- 1
100
101
102
0 10 20 30 40 50
Oxy
gen
Per
mea
bilit
y
(cm
3 m
il/ (
100
in2 d
ay a
tm))
Temperature (°C)
P E T
A N
PVDC
EVOH 27
Figure 2.8 Effect of temperature on oxygen permeability at 75% relative humidity.PET is poly(ethylene terephthalate), AN is an acrylonitrile-styrenecopolymer, PVDC is vinylidene chloride-vinyl chloride copolymer(coextrusion resin), and EVOH 27 is ethylene vinyl alcohol copolymercontaining 27 mol% ethylene [6].
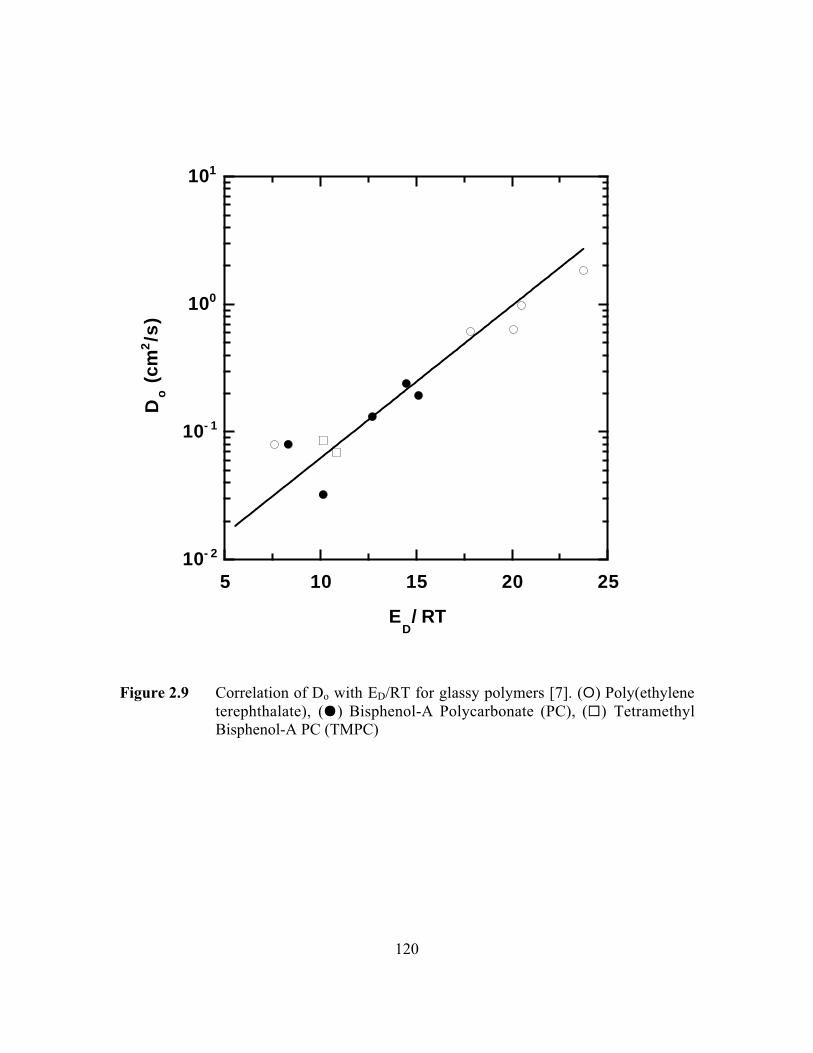
120
10- 2
10- 1
100
101
5 10 15 20 25
Do (
cm2/s
)
ED/ RT
Figure 2.9 Correlation of Do with ED/RT for glassy polymers [7]. (E) Poly(ethyleneterephthalate), (J) Bisphenol-A Polycarbonate (PC), (G) TetramethylBisphenol-A PC (TMPC)
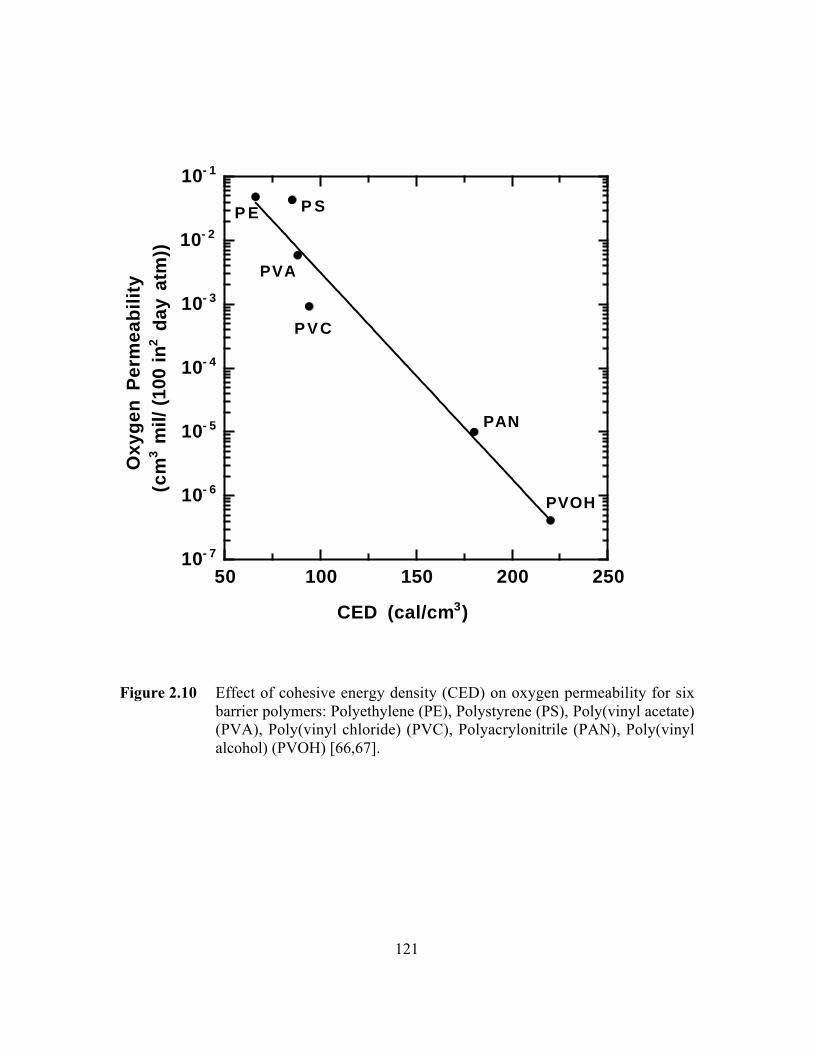
121
10- 7
10- 6
10- 5
10- 4
10- 3
10- 2
10- 1
50 100 150 200 250
Oxy
gen
Per
mea
bilit
y (c
m3 m
il/ (
100
in2 d
ay a
tm))
CED (cal/cm 3)
P E P S
PVA
PVC
PAN
PVOH
Figure 2.10 Effect of cohesive energy density (CED) on oxygen permeability for sixbarrier polymers: Polyethylene (PE), Polystyrene (PS), Poly(vinyl acetate)(PVA), Poly(vinyl chloride) (PVC), Polyacrylonitrile (PAN), Poly(vinylalcohol) (PVOH) [66,67].
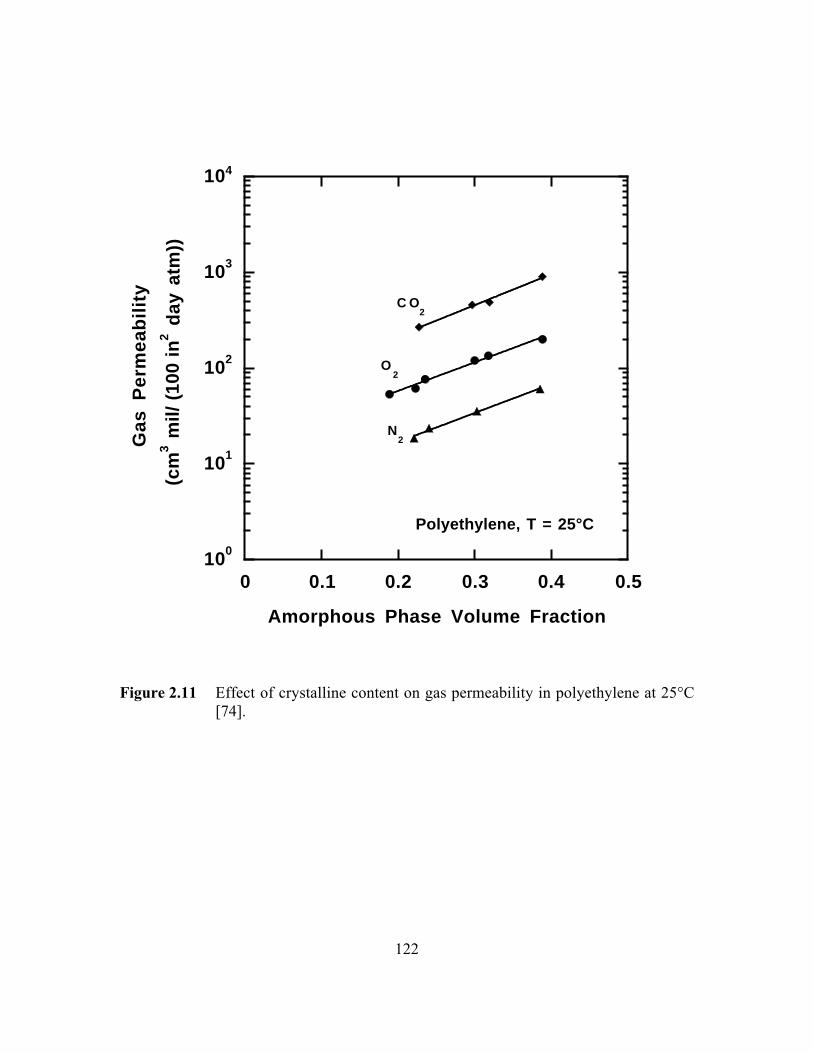
122
100
101
102
103
104
0 0.1 0.2 0.3 0.4 0.5
Gas
Per
mea
bilit
y
(cm
3 m
il/ (
100
in2 d
ay a
tm))
Amorphous Phase Volume Fraction
C O2
O2
N2
Polyethylene, T = 25°C
Figure 2.11 Effect of crystalline content on gas permeability in polyethylene at 25°C[74].
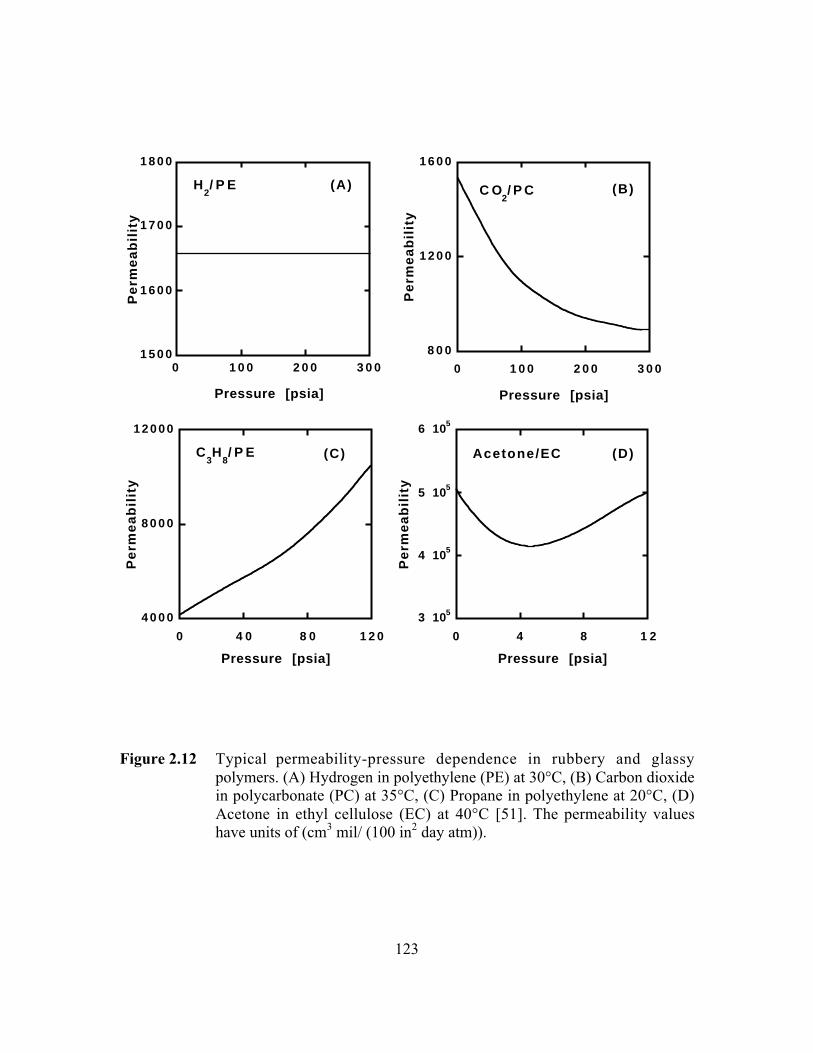
123
1 5 0 0
1 6 0 0
1 7 0 0
1 8 0 0
0 1 0 0 2 0 0 3 0 0
Pe
rme
ab
ility
Pressure [psia]
(A) (B)
(C) (D)
H2/ P E C O
2/ P C
C3H
8/ P E Acetone/EC
4 0 0 0
8 0 0 0
12000
0 4 0 8 0 1 2 0
Pe
rme
ab
ility
Pressure [psia]
3 105
4 105
5 105
6 105
0 4 8 1 2
Pe
rme
ab
ility
Pressure [psia]
8 0 0
1 2 0 0
1 6 0 0
0 1 0 0 2 0 0 3 0 0
Pe
rme
ab
ility
Pressure [psia]
Figure 2.12 Typical permeability-pressure dependence in rubbery and glassypolymers. (A) Hydrogen in polyethylene (PE) at 30°C, (B) Carbon dioxidein polycarbonate (PC) at 35°C, (C) Propane in polyethylene at 20°C, (D)Acetone in ethyl cellulose (EC) at 40°C [51]. The permeability valueshave units of (cm3 mil/ (100 in2 day atm)).

124
10- 3
10- 2
10- 1
100
101
102
0 20 40 60 80 100
Oxy
gen
Per
mea
bilit
y
(cm
3 m
il/ (
100
in2 d
ay a
tm))
Relative Humidity (%)
AmNY
B O N
MXD-6
EVOH 44
EVOH 32
T = 20°C
Figure 2.13 Effect of relative humidity on oxygen permeability of hydrophilic barrierpolymers. AmNY is amorphous nylon (Selar®), BON is biaxially orientednylon 6, MXD-6 is oriented poly(metaxylylenediamine-adipic acid),EVOH 44 and 32 are ethylene vinyl alcohol copolymers containing 32 and44 mol% ethylene [6].
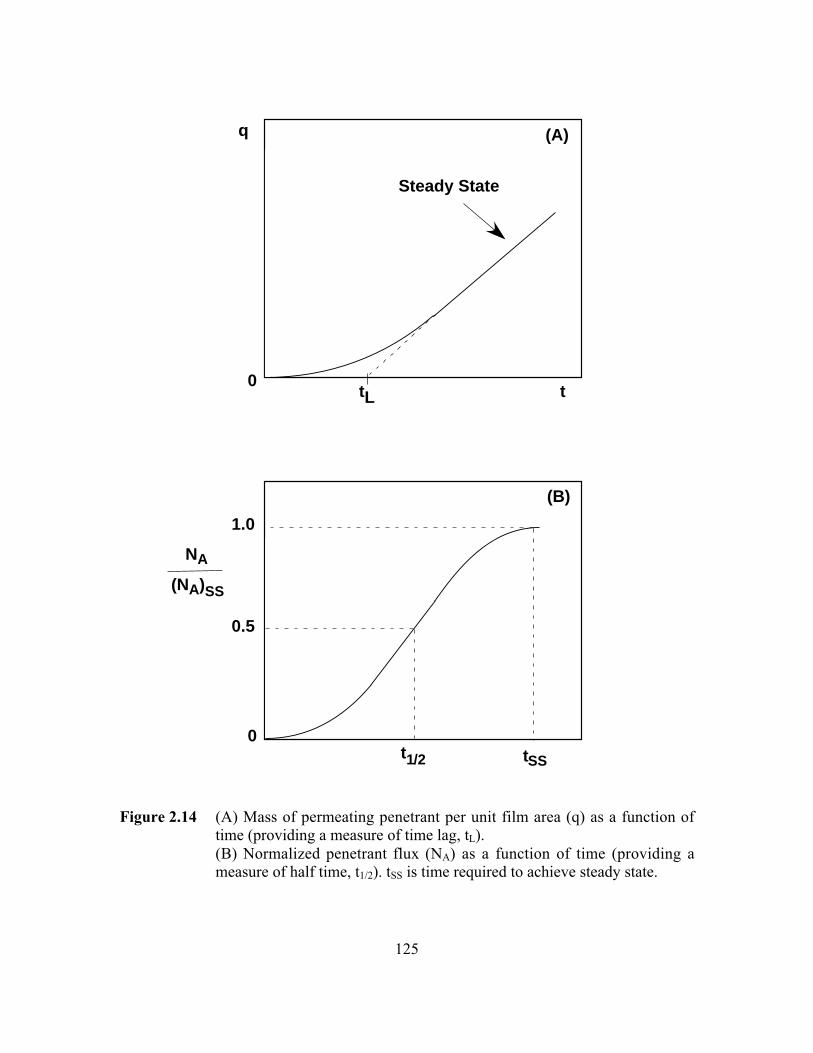
125
tL
Steady State
0t
q
NA
(NA)SS
1.0
0.5
t1/2 tSS
0
(A)
(B)
Figure 2.14 (A) Mass of permeating penetrant per unit film area (q) as a function oftime (providing a measure of time lag, tL).(B) Normalized penetrant flux (NA) as a function of time (providing ameasure of half time, t1/2). tSS is time required to achieve steady state.
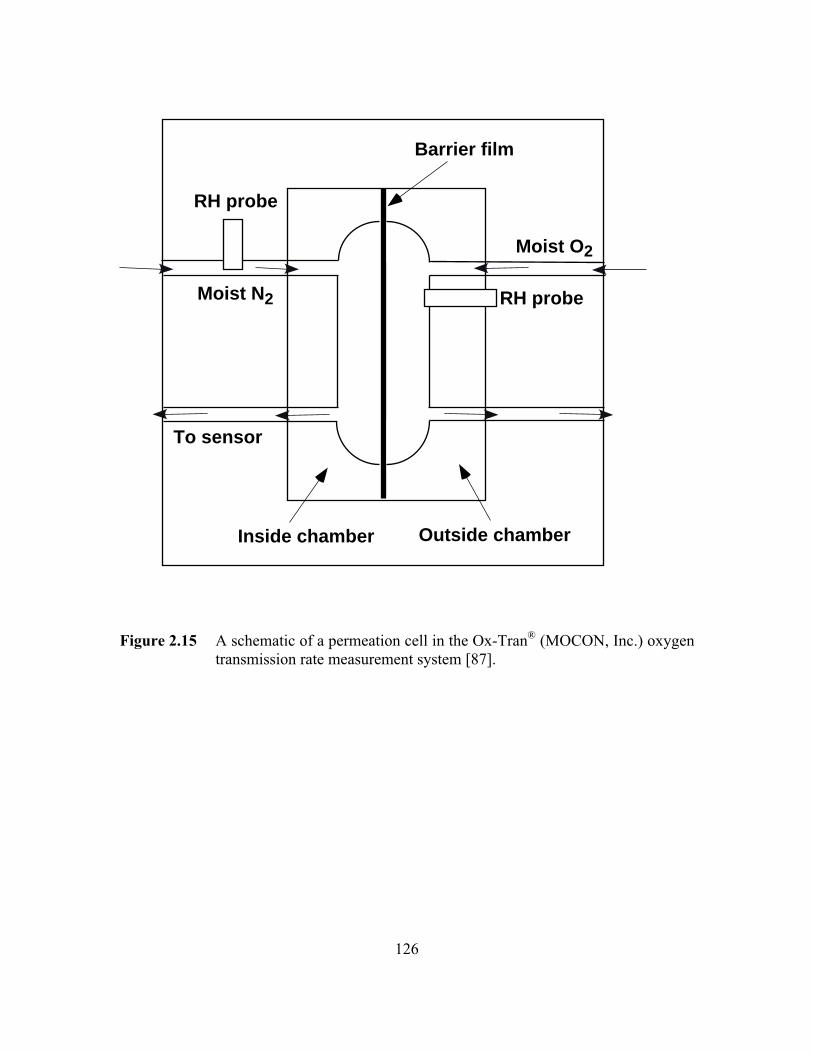
126
Moist N 2
Moist O 2
Inside chamber Outside chamber
Barrier film
RH probe
RH probe
To sensor
Figure 2.15 A schematic of a permeation cell in the Ox-Tran® (MOCON, Inc.) oxygentransmission rate measurement system [87].
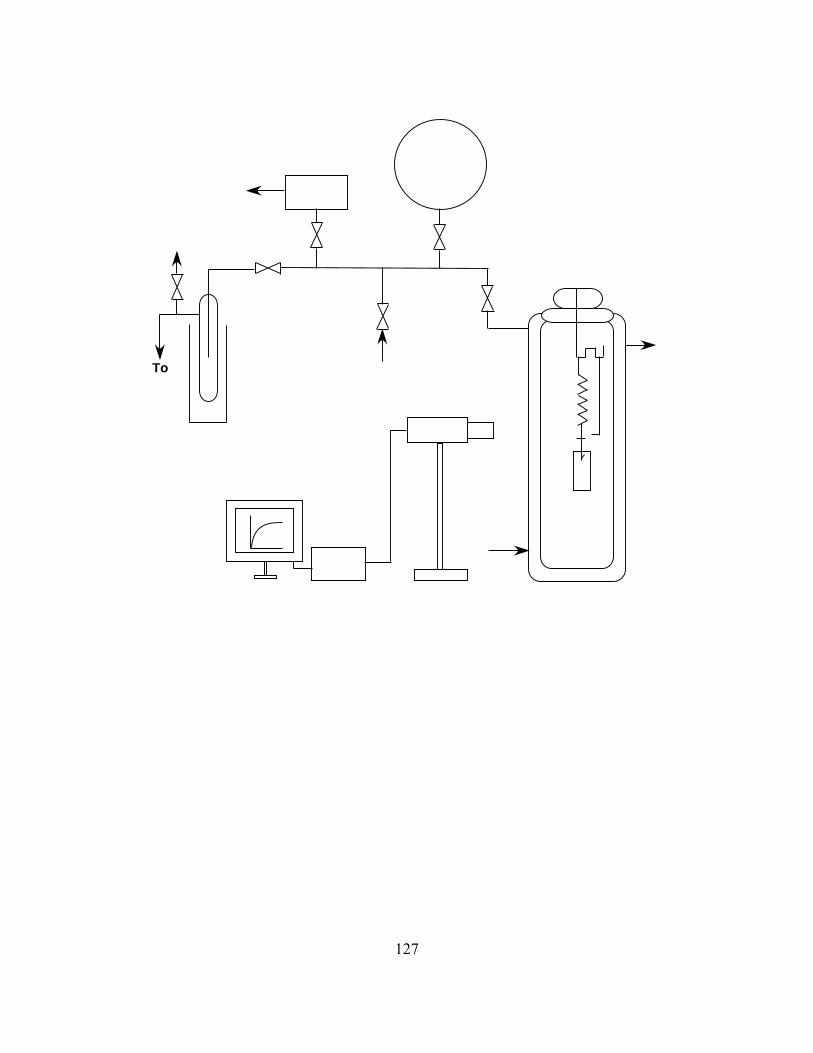
127
To�vacuum
Vent
Liquid nitrogen�cold trap
Penetrantgas/vapor�
inlet
To pressure read-out�and power supply
Transducer�(0-1000 torr)
12-L�gas/vapor�reservoir
CCD camera
Water In
Water Out
Quartz spring
Referencerod
Polymersample
Water-jacketed�sorption cell
Computer
Figure 2.16 A schematic of the McBain spring balance apparatus for measuringsorption and desorption of organic vapors in barrier polymers [90].
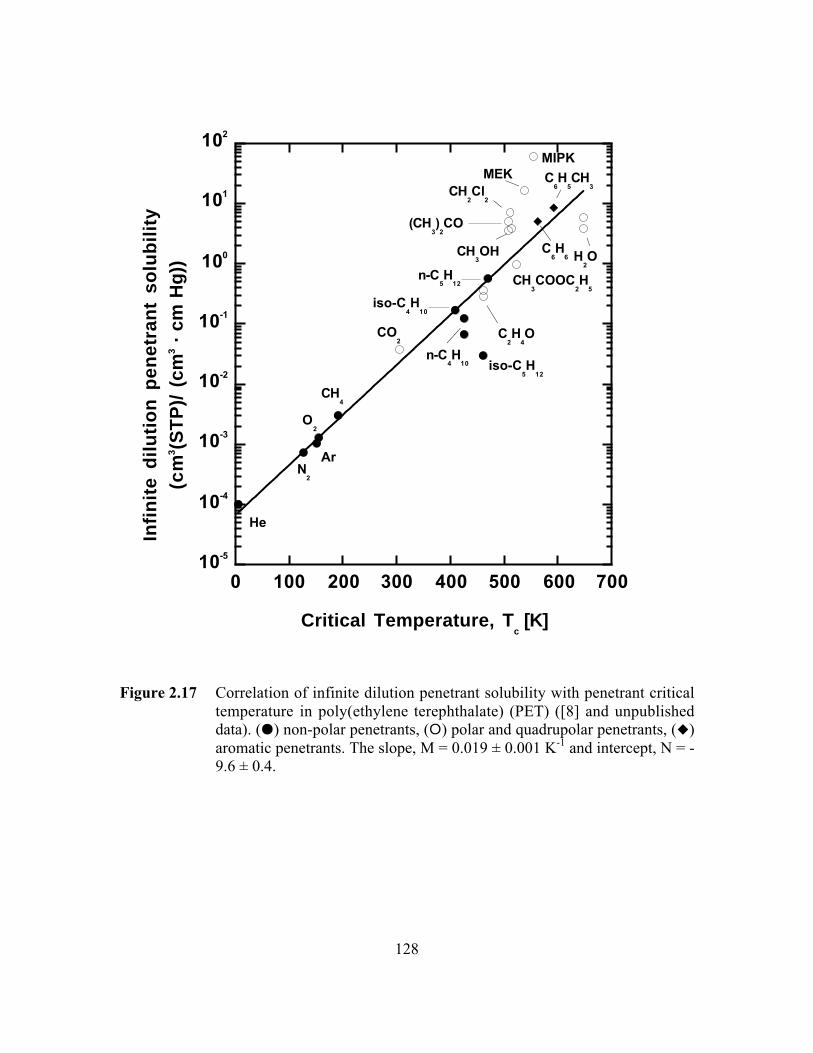
128
10-5
10-4
10-3
10-2
10-1
100
101
102
0 100 200 300 400 500 600 700
Infin
ite d
ilutio
n pe
netr
ant
solu
bilit
y(c
m3(S
TP
)/ (
cm3 ·
cm
Hg)
)
Critical Temperature, Tc [K]
He
Ar
C6H
5CH
3
C6H
6
O2
N2
CO2
CH4
n-C4H
10
CH3OH
CH3COOC
2H
5
CH2Cl
2
H2O
C2H
4O
n-C5H
12
MEK
(CH3)
2CO
MIPK
iso-C4H
10
iso-C5H
12
Figure 2.17 Correlation of infinite dilution penetrant solubility with penetrant criticaltemperature in poly(ethylene terephthalate) (PET) ([8] and unpublisheddata). (J) non-polar penetrants, (E) polar and quadrupolar penetrants, (F)aromatic penetrants. The slope, M = 0.019 ± 0.001 K-1 and intercept, N = -9.6 ± 0.4.

129
10-16
10-14
10-12
10-10
10-8
10-6
0 100 200 300 400 500
Branched penetrants
Infin
ite d
ilutio
n pe
netr
ant
diffu
sivi
ty (
cm
2 /s
)
Critical volume, Vc ( cm 3/mol )
T = 25°CHe
O2
N2
CO2
CH4
H2O
Ar
CH2Cl
2
C3H
8
CH2Cl
2
C6H
6
C6H
5CH
3
n-C4H
10
n-C5H
12
(CH3)
2CO
MEK
iso-C5H
12
MIPK
Figure 2.18 Effect of penetrant size on infinite dilution, amorphous phase diffusioncoefficients in poly(ethylene terephthalate) at 25°C ([8] and unpublisheddata). The best-fit parameters of Equation 2.31 are: t = 5.7 ± 1.2 ¥ 108
(cm2/s) (cm3/mol)9.1, h = 9.1 ± 0.9.
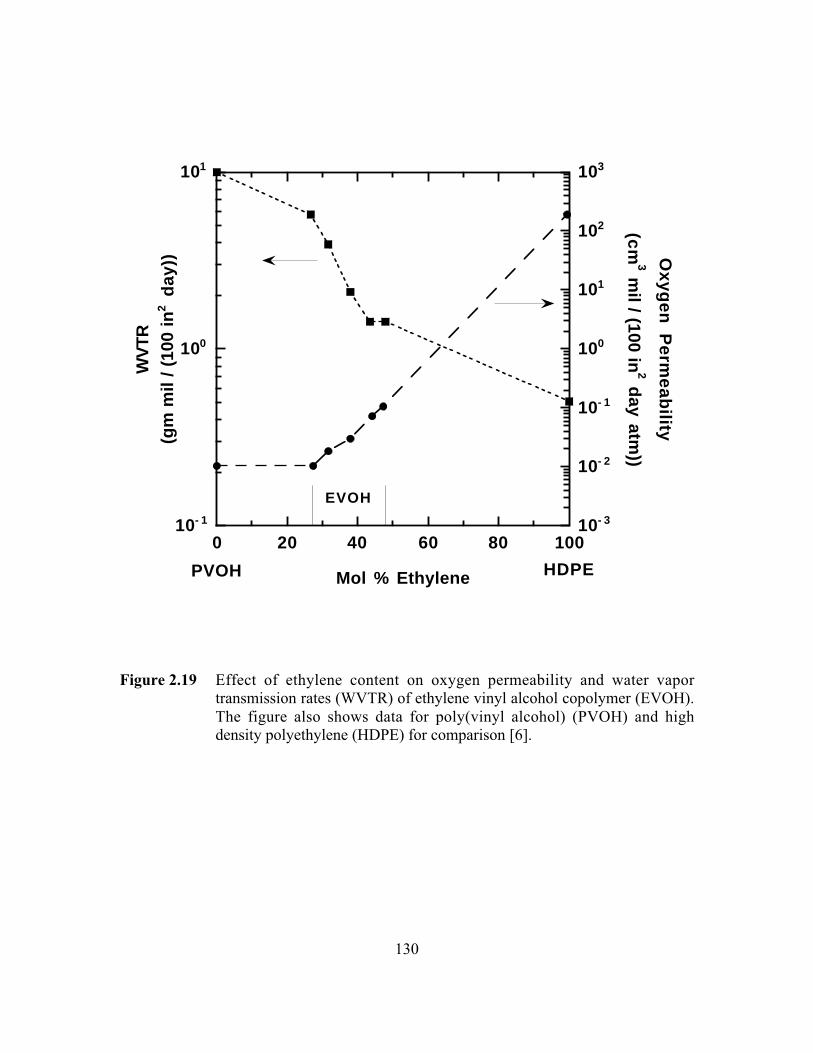
130
10- 1
100
101
10- 3
10- 2
10- 1
100
101
102
103
0 20 40 60 80 100
WV
TR(g
m m
il / (
100
in2 d
ay)) O
xygen Perm
eability
(cm3 m
il / (100 in2 day atm
))
Mol % EthylenePVOH HDPE
EVOH
Figure 2.19 Effect of ethylene content on oxygen permeability and water vaportransmission rates (WVTR) of ethylene vinyl alcohol copolymer (EVOH).The figure also shows data for poly(vinyl alcohol) (PVOH) and highdensity polyethylene (HDPE) for comparison [6].

131
Figure 2.20 A comparison of oxygen and water vapor barrier properties of varioushigh and moderate barrier polymers at 23°C [127].

132
Density HighLow
Property
Low
High
Stiffness�Tensile strength�Chemical resistance
Gas and vapor transmission�Elongation at break�LTI�ESCR
Figure 2.21 Typical effect of density on various properties of polyethylene. LTI is lowtemperature impact strength and ESCR is environmental stress crackresistance [141].
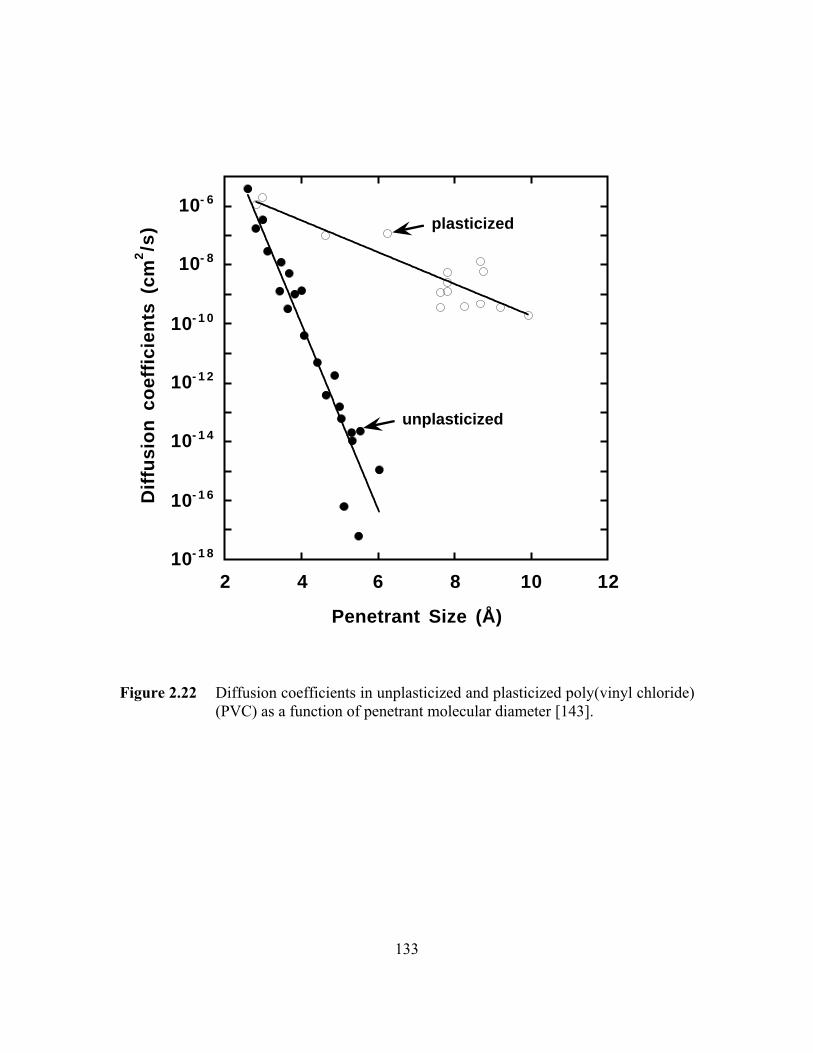
133
10- 1 8
10- 1 6
10- 1 4
10- 1 2
10- 1 0
10- 8
10- 6
2 4 6 8 10 12
Diff
usio
n co
effic
ient
s (c
m2/s
)
Penetrant Size (Å)
unplasticized
plasticized
Figure 2.22 Diffusion coefficients in unplasticized and plasticized poly(vinyl chloride)(PVC) as a function of penetrant molecular diameter [143].
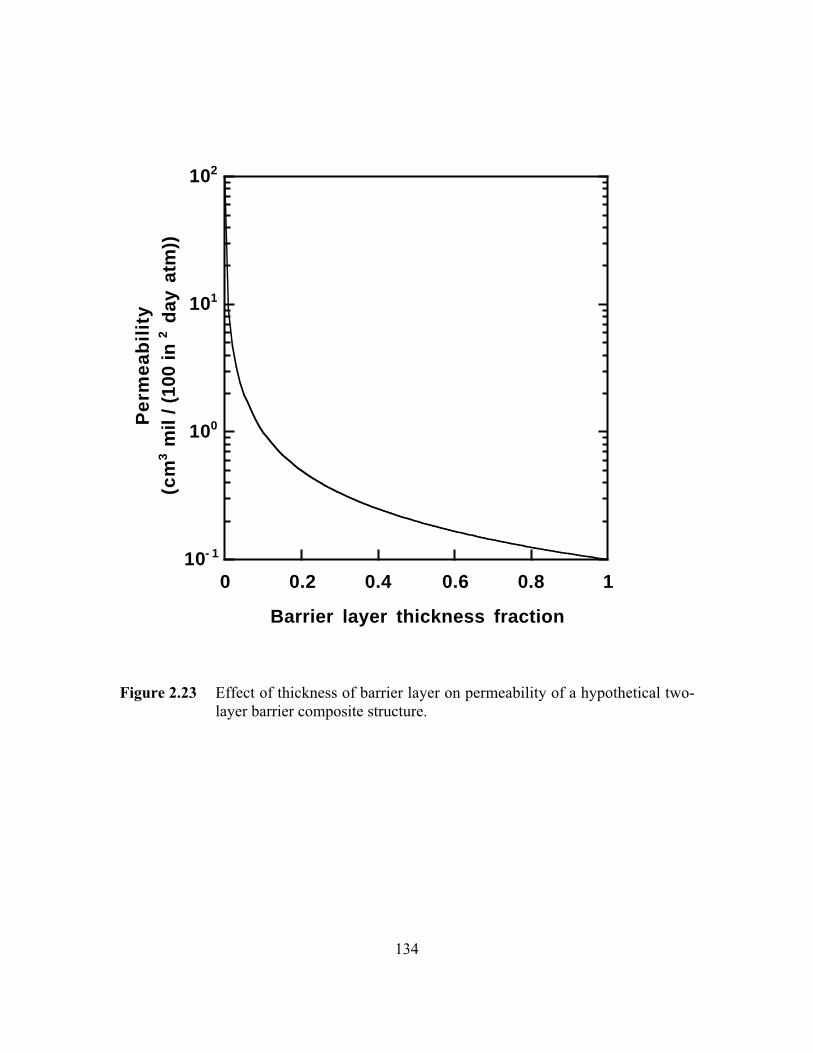
134
10- 1
100
101
102
0 0.2 0.4 0.6 0.8 1
Per
mea
bilit
y(c
m3 m
il / (
100
in 2
day
atm
))
Barrier layer thickness fraction
Figure 2.23 Effect of thickness of barrier layer on permeability of a hypothetical two-layer barrier composite structure.
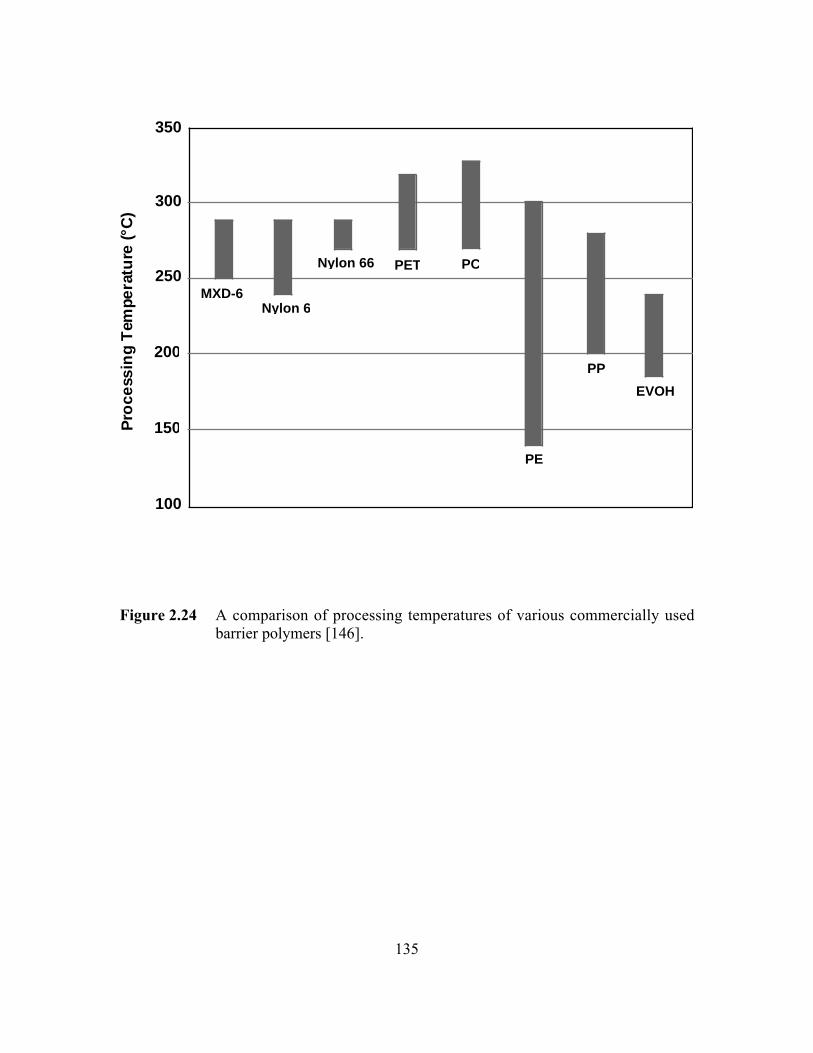
135
100
150
200
250
300
350P
roce
ssin
g T
empe
ratu
re (°
C)
MXD-6Nylon 6
Nylon 6 6 PET PC
PE
PP
EVOH
Figure 2.24 A comparison of processing temperatures of various commercially usedbarrier polymers [146].
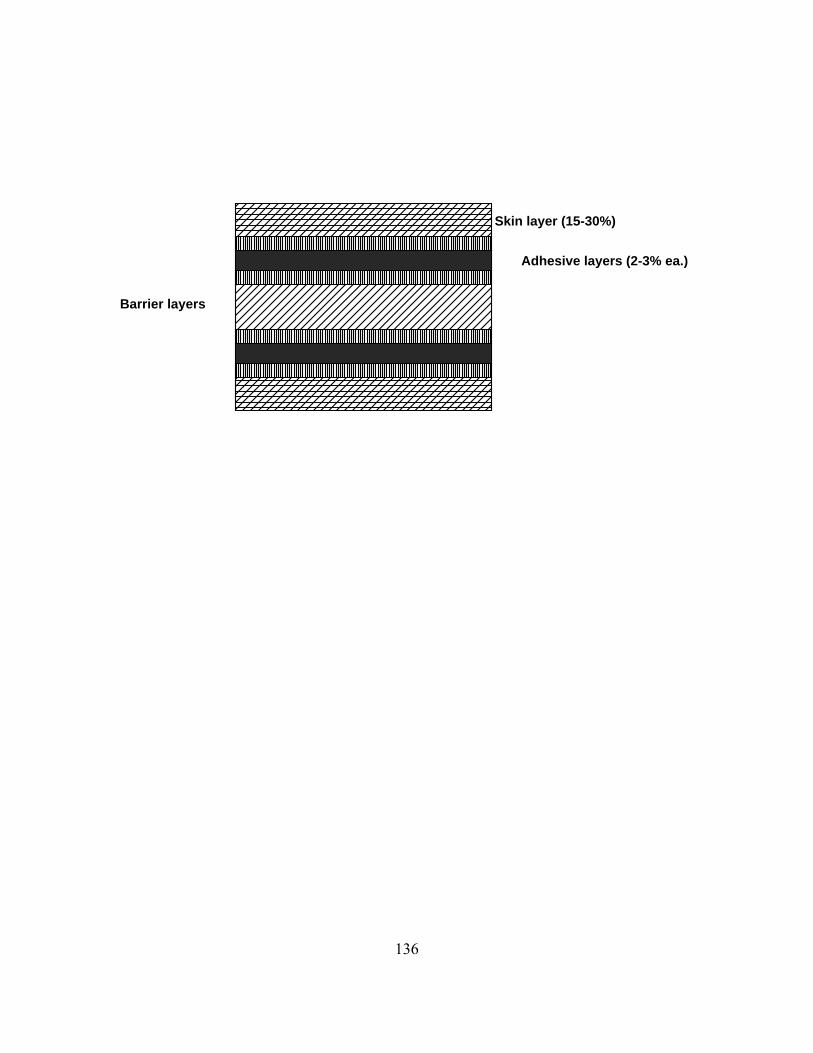
136
Skin layer (15-30%)
Adhesive layers (2-3% ea.)
Barrier layers�(5-15%)
Adhesive layers
Recycle layer (30-50%)
Skin layer (15-30%)
Figure 2.25 An example of a typical symmetrical nine-layer coextruded barriercomposite structure [145].
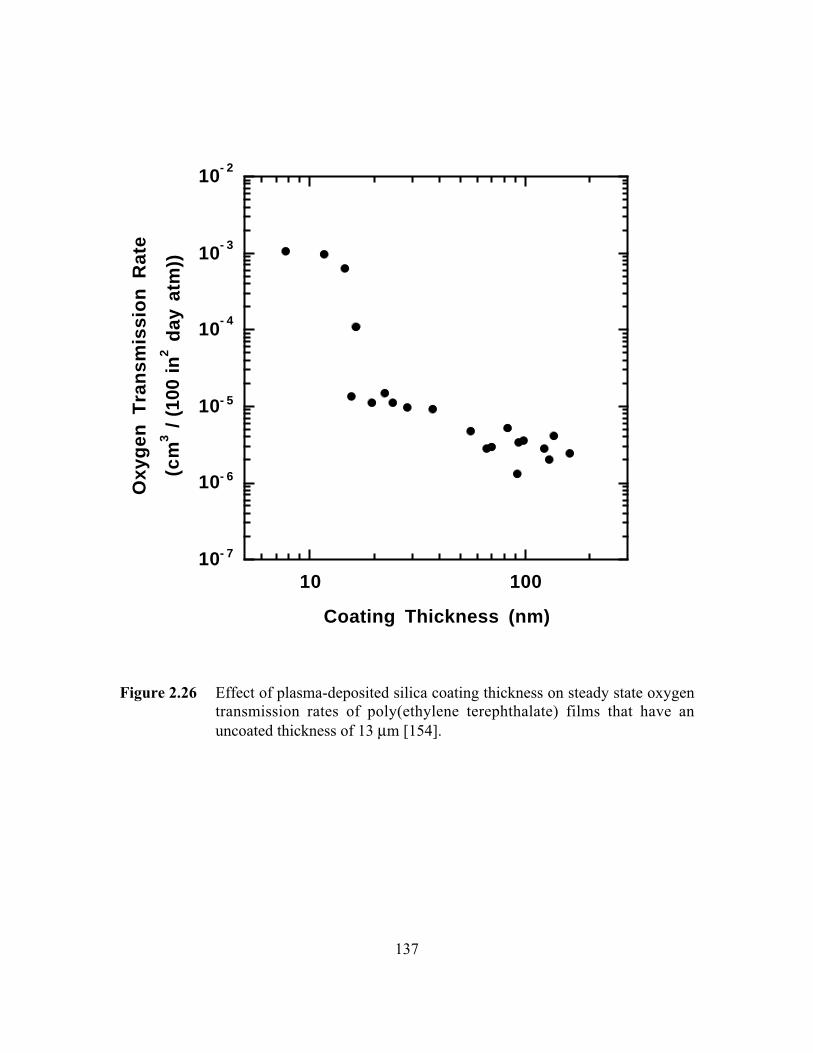
137
10- 7
10- 6
10- 5
10- 4
10- 3
10- 2
10 100
Oxy
gen
Tra
nsm
issi
on R
ate
(cm
3 /
(10
0 in
2 d
ay a
tm))
Coating Thickness (nm)
Figure 2.26 Effect of plasma-deposited silica coating thickness on steady state oxygentransmission rates of poly(ethylene terephthalate) films that have anuncoated thickness of 13 mm [154].

138
Figure 2.27 Influence of ORMOCER® coatings on oxygen transmission rates (OTR)of SiOx-coated oriented polypropylene (OPP) (OTR measured at 23°C and70% RH) [155].
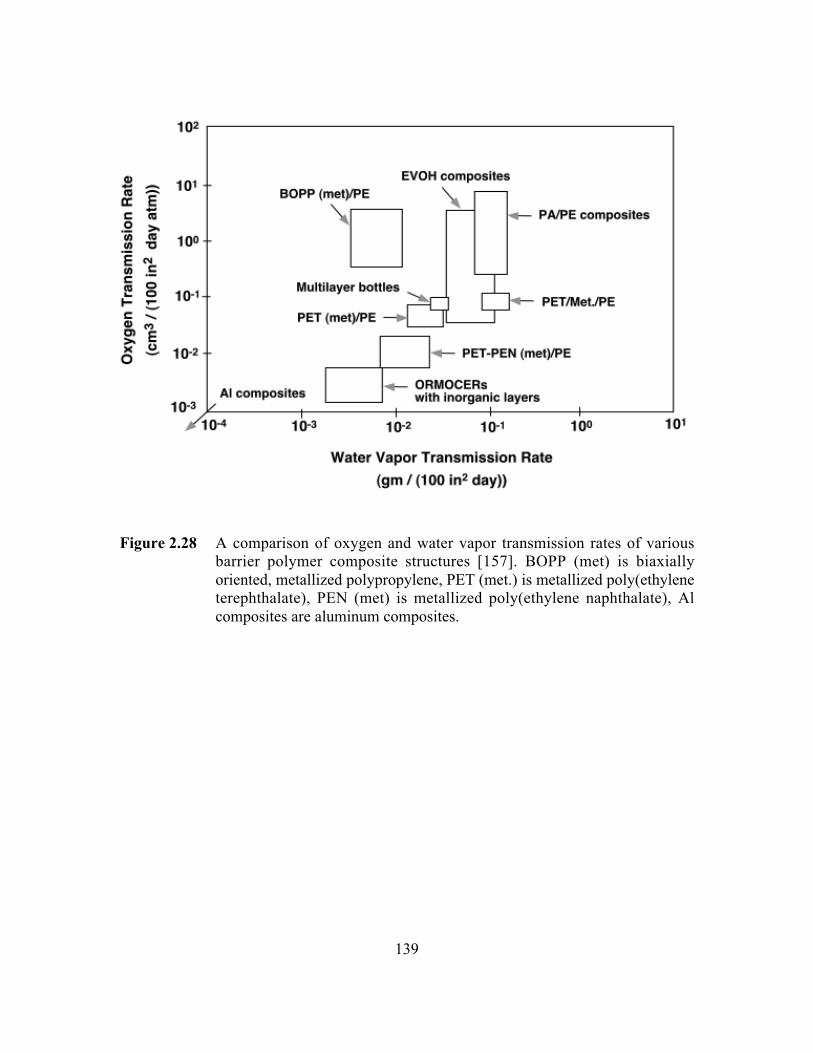
139
Figure 2.28 A comparison of oxygen and water vapor transmission rates of variousbarrier polymer composite structures [157]. BOPP (met) is biaxiallyoriented, metallized polypropylene, PET (met.) is metallized poly(ethyleneterephthalate), PEN (met) is metallized poly(ethylene naphthalate), Alcomposites are aluminum composites.

140
Figure 2.29 Typical examples of heterogeneous, immiscible blends. (A) Randomspheres in a dispersed phase, (B) Aggregated spheres in a dispersed phase,(C) Oriented platelets in a dispersed phase, (D) Oriented rods in adispersed phase [161].

141
10- 2
10- 1
100
101
102
103
0 0.1 0.2 0.3 0.4 0.5
Oxy
gen
Per
mea
bilit
y
(cm
3 m
il / (
100
in2 d
ay a
tm))
EVOH Volume Fraction
a
b
Figure 2.30 Effect of EVOH content on oxygen permeability of PE-EVOH blends thatexhibit (a) discontinuous morphology and (b) co-continuous lamellarmorphology [69].

142
0
0.05
0.1
0.15
0.2
0 100 200 300
Bot
tle W
all
Oxy
gen
Per
mea
nce
(cm
3 /
(10
0 in
2 d
ay a
tm))
Time (days)
no scavenger
(A) 50 ppm Co
(B) 200 ppm Co
Figure 2.31 Reduction in oxygen transmission rates due to oxygen scavenging inblends of PET and nylon MXD-6 [174]. The measurements were made at23°C and 50% RH. (A): 4 wt.% MXD-6 and 50 ppm cobalt (as metal);(B): 4 wt.% MXD-6 and 200 ppm cobalt (as metal). For comparison, thedotted line indicates oxygen permeance in the absence of cobalt catalyst(no scavenging).
143
CHAPTER 3
Experimental Techniques and Sample
Characterization Results
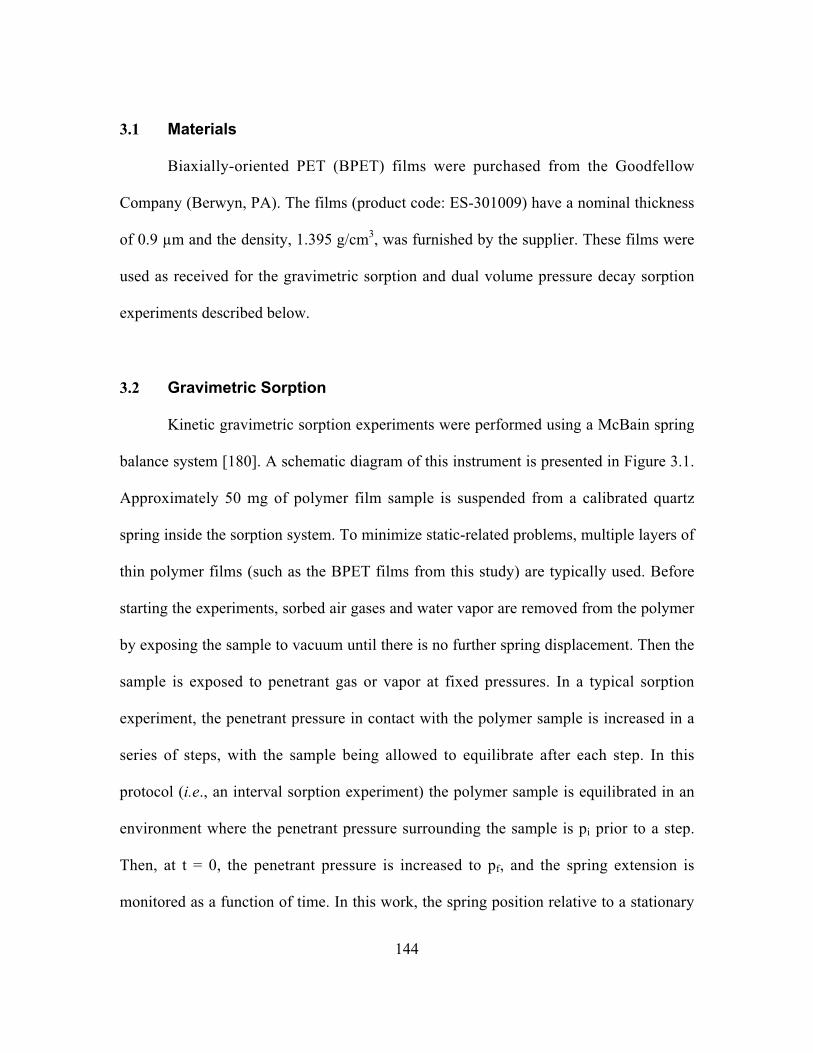
144
3.1 Materials
Biaxially-oriented PET (BPET) films were purchased from the Goodfellow
Company (Berwyn, PA). The films (product code: ES-301009) have a nominal thickness
of 0.9 µm and the density, 1.395 g/cm3, was furnished by the supplier. These films were
used as received for the gravimetric sorption and dual volume pressure decay sorption
experiments described below.
3.2 Gravimetric Sorption
Kinetic gravimetric sorption experiments were performed using a McBain spring
balance system [180]. A schematic diagram of this instrument is presented in Figure 3.1.
Approximately 50 mg of polymer film sample is suspended from a calibrated quartz
spring inside the sorption system. To minimize static-related problems, multiple layers of
thin polymer films (such as the BPET films from this study) are typically used. Before
starting the experiments, sorbed air gases and water vapor are removed from the polymer
by exposing the sample to vacuum until there is no further spring displacement. Then the
sample is exposed to penetrant gas or vapor at fixed pressures. In a typical sorption
experiment, the penetrant pressure in contact with the polymer sample is increased in a
series of steps, with the sample being allowed to equilibrate after each step. In this
protocol (i.e., an interval sorption experiment) the polymer sample is equilibrated in an
environment where the penetrant pressure surrounding the sample is pi prior to a step.
Then, at t = 0, the penetrant pressure is increased to pf, and the spring extension is
monitored as a function of time. In this work, the spring position relative to a stationary
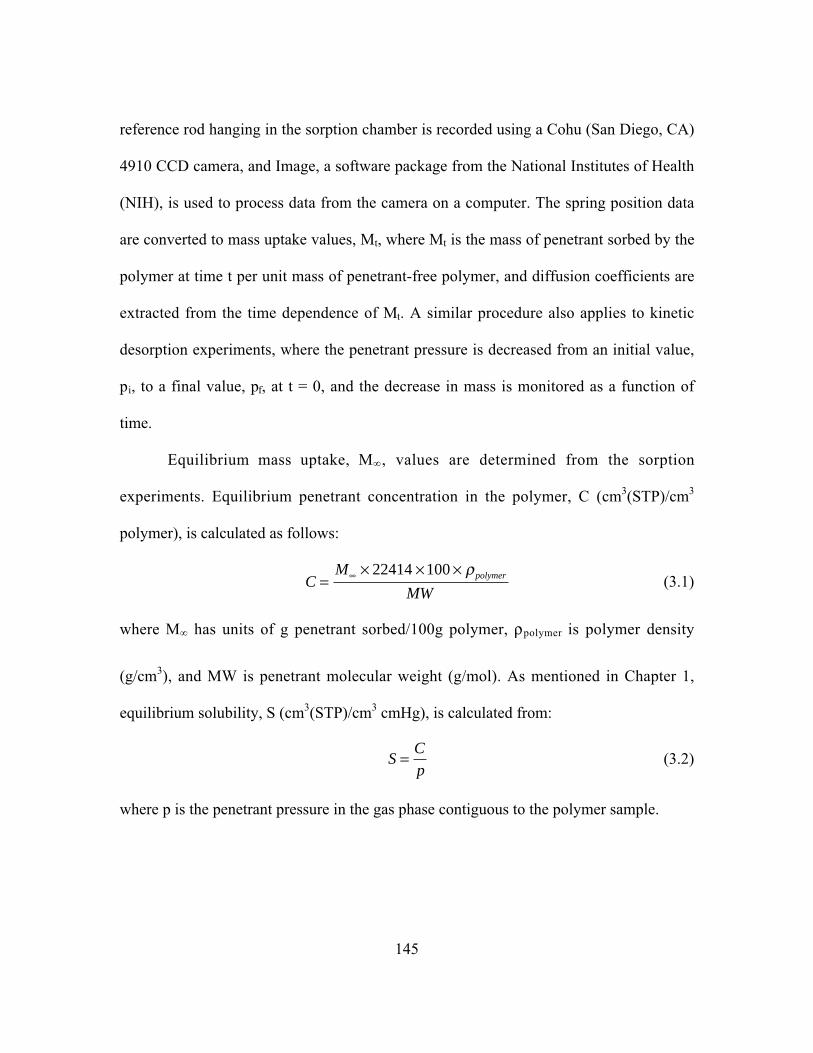
145
reference rod hanging in the sorption chamber is recorded using a Cohu (San Diego, CA)
4910 CCD camera, and Image, a software package from the National Institutes of Health
(NIH), is used to process data from the camera on a computer. The spring position data
are converted to mass uptake values, Mt, where Mt is the mass of penetrant sorbed by the
polymer at time t per unit mass of penetrant-free polymer, and diffusion coefficients are
extracted from the time dependence of Mt. A similar procedure also applies to kinetic
desorption experiments, where the penetrant pressure is decreased from an initial value,
pi, to a final value, pf, at t = 0, and the decrease in mass is monitored as a function of
time.
Equilibrium mass uptake, M∞, values are determined from the sorption
experiments. Equilibrium penetrant concentration in the polymer, C (cm3(STP)/cm3
polymer), is calculated as follows:
CM
MWpolymer=
¥ ¥ ¥• 22414 100 r(3.1)
where M∞ has units of g penetrant sorbed/100g polymer, rpolymer is polymer density
(g/cm3), and MW is penetrant molecular weight (g/mol). As mentioned in Chapter 1,
equilibrium solubility, S (cm3(STP)/cm3 cmHg), is calculated from:
SC
p= (3.2)
where p is the penetrant pressure in the gas phase contiguous to the polymer sample.
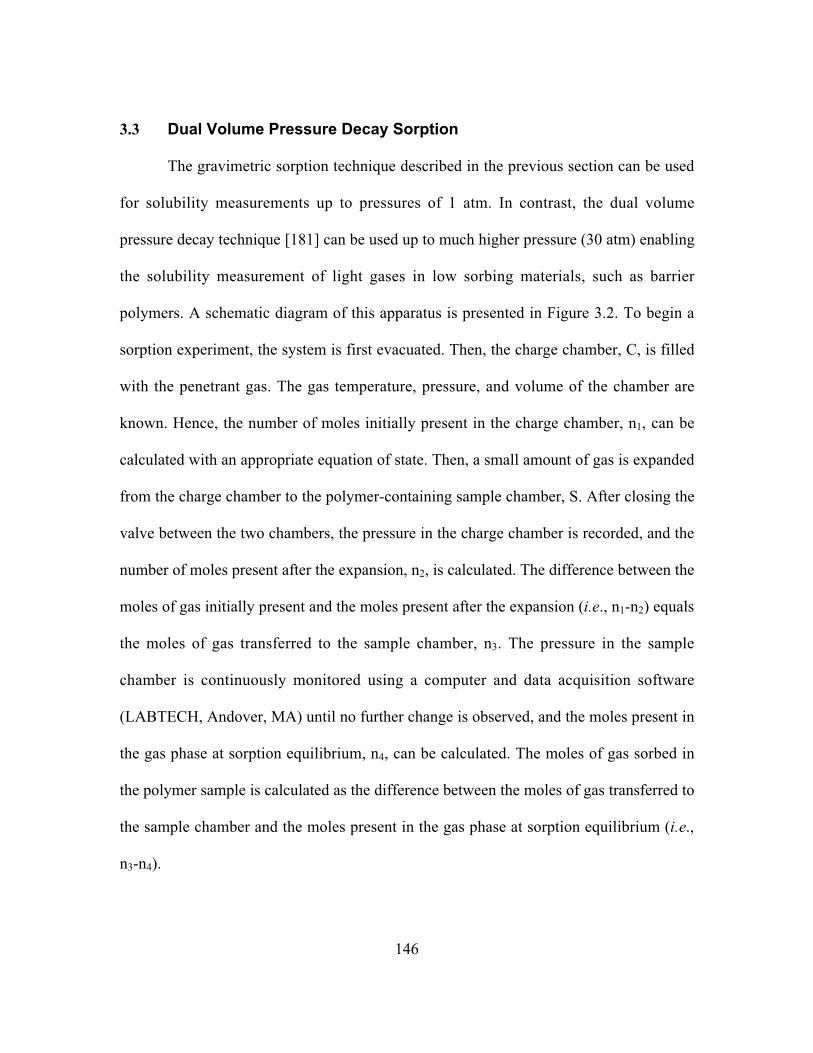
146
3.3 Dual Volume Pressure Decay Sorption
The gravimetric sorption technique described in the previous section can be used
for solubility measurements up to pressures of 1 atm. In contrast, the dual volume
pressure decay technique [181] can be used up to much higher pressure (30 atm) enabling
the solubility measurement of light gases in low sorbing materials, such as barrier
polymers. A schematic diagram of this apparatus is presented in Figure 3.2. To begin a
sorption experiment, the system is first evacuated. Then, the charge chamber, C, is filled
with the penetrant gas. The gas temperature, pressure, and volume of the chamber are
known. Hence, the number of moles initially present in the charge chamber, n1, can be
calculated with an appropriate equation of state. Then, a small amount of gas is expanded
from the charge chamber to the polymer-containing sample chamber, S. After closing the
valve between the two chambers, the pressure in the charge chamber is recorded, and the
number of moles present after the expansion, n2, is calculated. The difference between the
moles of gas initially present and the moles present after the expansion (i.e., n1-n2) equals
the moles of gas transferred to the sample chamber, n3. The pressure in the sample
chamber is continuously monitored using a computer and data acquisition software
(LABTECH, Andover, MA) until no further change is observed, and the moles present in
the gas phase at sorption equilibrium, n4, can be calculated. The moles of gas sorbed in
the polymer sample is calculated as the difference between the moles of gas transferred to
the sample chamber and the moles present in the gas phase at sorption equilibrium (i.e.,
n3-n4).
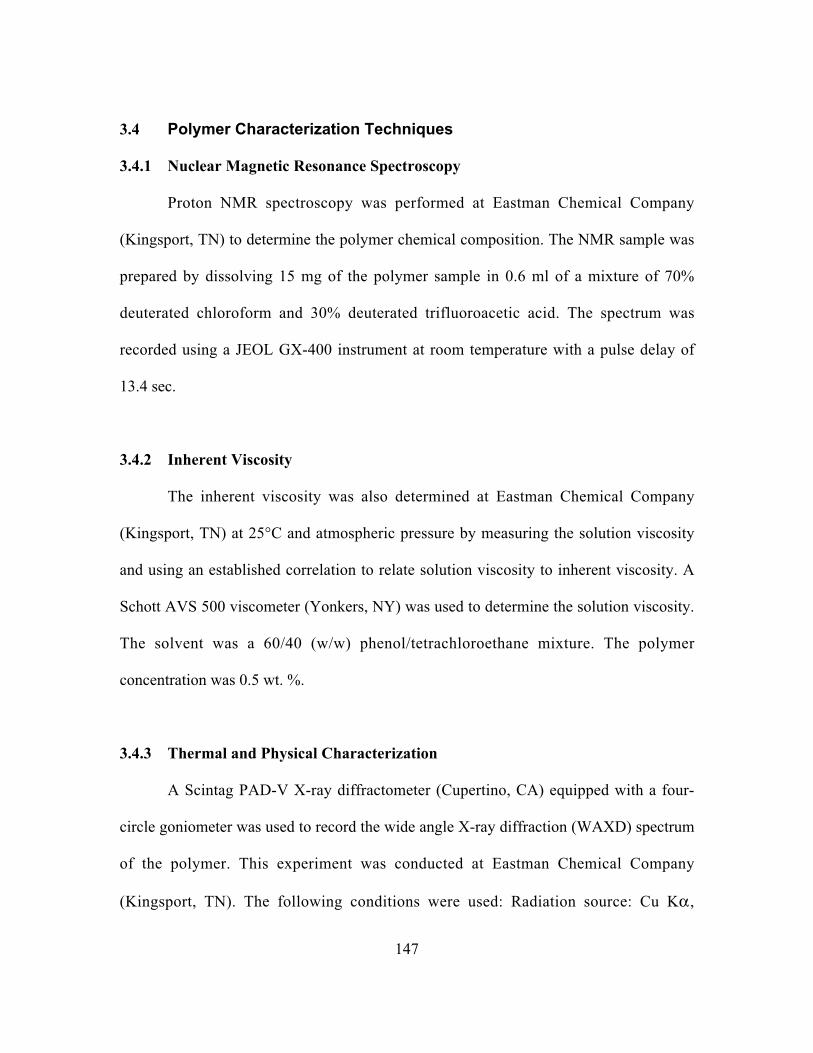
147
3.4 Polymer Characterization Techniques
3.4.1 Nuclear Magnetic Resonance Spectroscopy
Proton NMR spectroscopy was performed at Eastman Chemical Company
(Kingsport, TN) to determine the polymer chemical composition. The NMR sample was
prepared by dissolving 15 mg of the polymer sample in 0.6 ml of a mixture of 70%
deuterated chloroform and 30% deuterated trifluoroacetic acid. The spectrum was
recorded using a JEOL GX-400 instrument at room temperature with a pulse delay of
13.4 sec.
3.4.2 Inherent Viscosity
The inherent viscosity was also determined at Eastman Chemical Company
(Kingsport, TN) at 25°C and atmospheric pressure by measuring the solution viscosity
and using an established correlation to relate solution viscosity to inherent viscosity. A
Schott AVS 500 viscometer (Yonkers, NY) was used to determine the solution viscosity.
The solvent was a 60/40 (w/w) phenol/tetrachloroethane mixture. The polymer
concentration was 0.5 wt. %.
3.4.3 Thermal and Physical Characterization
A Scintag PAD-V X-ray diffractometer (Cupertino, CA) equipped with a four-
circle goniometer was used to record the wide angle X-ray diffraction (WAXD) spectrum
of the polymer. This experiment was conducted at Eastman Chemical Company
(Kingsport, TN). The following conditions were used: Radiation source: Cu Ka ,
148
Accelerating potential: 45 kV, Emission current: 40 µA, Scan mode: continuous, Step:
0.05°, Count time: 3s, Scan rate: 1°/min. For this study, samples were cut into 2 ¥ 2 inch
squares and five films were stacked onto aluminum thin-film mounting plates for
examination. To determine the Hermans crystalline orientation function, intensity as a
function of scattering angle, f, was recorded for the primary reflections of interest.
Thermal transitions were determined by differential scanning calorimetry (DSC).
Samples were analyzed using a TA Instruments 2920 DSC (New Castle, DE) at Eastman
Chemical Company (Kingsport, TN). First and second scan thermograms were recorded
at a heating rate of 20°C per minute over a temperature range of 50 to 290°C. From the
first scan thermogram, the areas under the cold crystallization and melting peaks were
used to estimate the weight percent crystallinity [124]. The second scan thermogram was
used to determine cold crystallization temperature, melting point temperature, and glass
transition temperature.
3.4.4 Positron Annihilation Lifetime Spectroscopy
Positron annihilation lifetime spectroscopy (PALS) was used to characterize the
amount of orthoPositronium-accessible free volume in the PET films. These experiments
were performed at CSIRO (Melbourne, Australia). Measurements were made in air at
room temperature (22.5 ± 1 °C) using an automated EG&G Ortec fast-fast coincidence
system. The timing resolution of the system was 275 ps determined using the prompt
curve from a 60Co source with the energy windows set to 22Na events. The polymer films
149
were stacked up to a total thickness of 1.5 mm on either side of the 30 µCi 22Na-Ti foil
source. Ten spectra were collected over a period of 10 hours, and the results reported are
the mean values of these spectra. The spectra were modeled as a sum of three decaying
exponentials using the computer program PFPOSFIT [182]. The shortest lifetime was
fixed at 125 ps characteristic of paraPositronium self-annihilation. No source corrections
were used in the analysis based on a fit for pure Al standards of 169 ± 2 ps, 99.3 ± 0.3 %;
820 ps, 0.7%. Only the orthoPositronium (oPs) component (the longest lifetime, t3 and its
intensity, I3) is reported as it is this component that is most sensitive to penetrant
accessible free volume in glassy polymers [53].
3.4.5 Profilometry
A Tencor Alpha-Step stylus surface profiler (San Jose, CA) was used to measure
the thickness and surface uniformity of the samples. Samples were tested over a length of
1000-1700 µm at a speed of 20-50 µm/sec. The force applied to the stylus was 10 mg.
Each reported measurement is the average of 3 scans. An average value of thickness was
obtained from five measurements on different portions of the film sample used for the
sorption experiments.
150
3.5 Polymer Characterization Results and Discussion
3.5.1 Inherent Viscosity, Nuclear Magnetic Resonance, and Profilometry
The inherent viscosity of the BPET polymer samples was 0.473 dL/g. The 1H
NMR spectrum indicated that the sample was PET containing 1.8 mole % diethylene
glycol repeat units. The tencor profilometry study yielded an average thickness of 0.95 ±
0.076 µm. This thickness value was used for all subsequent calculations.
3.5.2 Sample Morphology
We used four independent techniques (DSC, density, WAXD and PALS) to
characterize the morphology of the polymer film sample and extracted estimates of
crystallinity from DSC, density and WAXD results. Using typical simplifying
assumptions to characterize crystallinity via these three techniques, the apparent
crystalline content from WAXD was much lower than the crystallinity values obtained
from the other two methods. Therefore, it seemed appropriate to review the assumptions
and basis for crystallinity estimates using these techniques. As will be discussed, we
prefer the crystallinity estimate based on the DSC technique, when there is a discrepancy
between the values obtained using different techniques [183].
Differential Scanning Calorimetry
The second scan DSC thermogram revealed a glass transition temperature, Tg, of
76.6°C (mid point of the endothermic shift observed in the temperature range of 70-
80°C), cold crystallization temperature, Tc, of 130.3°C (maximum peak height of the
exotherm at approximately 130°C), and melting point temperature, Tm, of 256.9°C
151
(minimum in the endotherm at approximately 257°C). The transition temperatures are in
good agreement with those previously reported for highly amorphous, unoriented PET
(APET) [9]: Tg (78°C), Tc (137°C) and Tm (249°C). The weight percent of crystallites,
wc, in BPET was estimated by subtracting the enthalpy of cold crystallization, DHc, from
the enthalpy of melting, DHm, and dividing by the heat of fusion of PET [9]:
wH H
Hcm c
f= -Ê
ËÁˆ¯̃
¥*D D
D100 (3.3)
DH*f is the reported heat of fusion of PET, 126.3 J/g [183]. The value of wc was 42%.
Volume percent crystallinity, fc, was calculated from wc using the following relationship
[184]:
f r rc c cw= ¥( / ) (3.4)
where r is polymer density, and rc is the reported crystal density of PET, 1.515 g/cm3
[12]. From Equation 3.4, fc was 39%.
PET cannot be prepared as a single crystal material, so estimates of DH*f are
usually based on extrapolating enthalpy of fusion data for semicrystalline samples to the
completely crystalline state. This procedure leads to some uncertainty in the value of the
enthalpy of fusion [183]. The enthalpy of fusion is also typically assumed to be
independent of sample processing history. In drawn PET, processing history has been
reported to have a pronounced effect on crystallite density, but little effect on enthalpy of
fusion [183]. Equation 3.3 neglects the effect of crystal size (i.e., the contribution of the
152
surface energy to the overall enthalpy of fusion). This effect is believed to be of the order
of a few J/g and is therefore, in the range of the typical uncertainty in DH*f [183]. During
the DSC run of an oriented, drawn polymer, the sample undergoes shrinkage and
disorientation. The influence of these processes on the measured heat of fusion of PET is
not known. However, in polyethylene, only small effects have been reported. The
difference between experimentally measured heats of fusion of polyethylene with free
and restrained ends (i.e., with and without shrinkage) was reported to be 2.5 to 6.3 J/g,
which are almost similar, given that the uncertainty in the measurement was ± 2.0 J/g
[185].
The phenomena discussed in the previous paragraph may influence the value of
crystallinity estimated from DSC. However, for drawn PET, such phenomena are
believed to make a minor contribution to the enthalpy of fusion [183]. The crystallinity
estimate for our BPET samples, based on DSC, is in excellent agreement with the DSC
estimate reported by Fischer et al. [186] (44 wt. %) for drawn PET having a density of
1.396 g/cm3, which is very close to the density of our sample (1.395 g/cm3). Also, similar
levels of crystallinity have been reported for other biaxially oriented PET films [187].
Based on these composite factors and the higher level of uncertainty associated with the
procedures required to extract crystallinity values from other techniques (density and
WAXD), we use the DSC crystallinity value in all sorption and diffusion calculations.
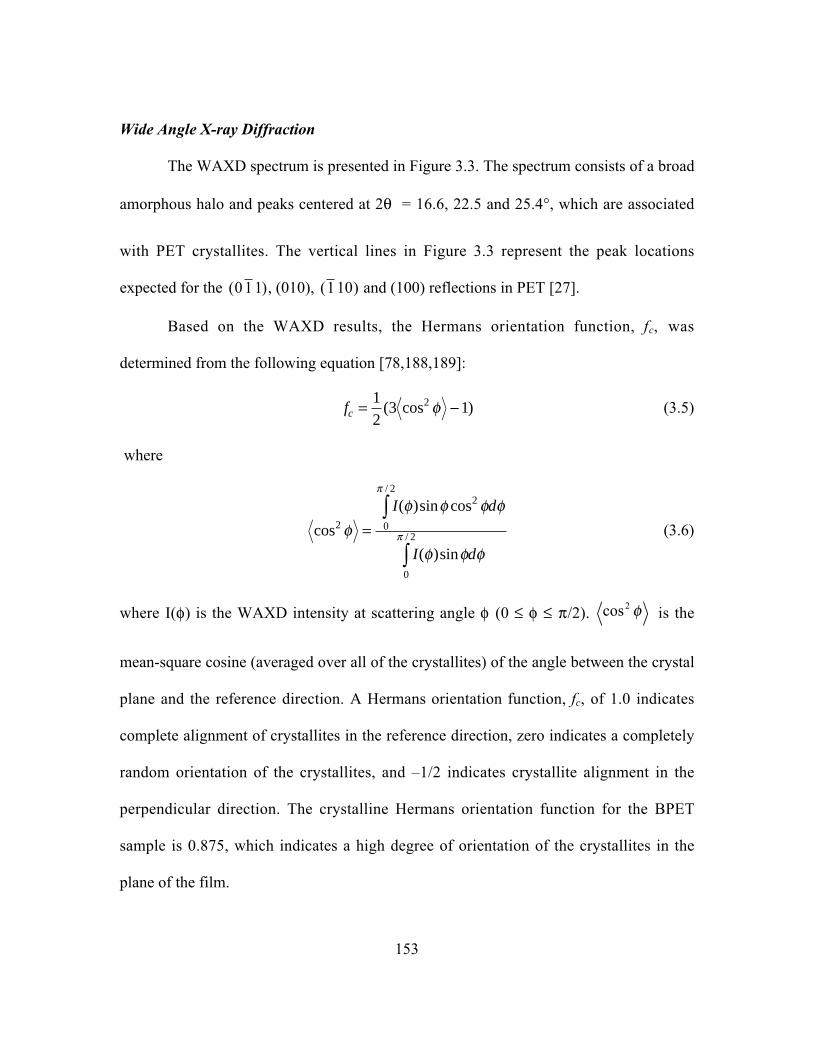
153
Wide Angle X-ray Diffraction
The WAXD spectrum is presented in Figure 3.3. The spectrum consists of a broad
amorphous halo and peaks centered at 2q = 16.6, 22.5 and 25.4°, which are associated
with PET crystallites. The vertical lines in Figure 3.3 represent the peak locations
expected for the ( )011 , (010), ( )110 and (100) reflections in PET [27].
Based on the WAXD results, the Hermans orientation function, fc, was
determined from the following equation [78,188,189]:
fc = -12
3 12( cos )f (3.5)
where
cos
( )sin cos
( )sin
/
/2
2
0
2
0
2ff f f f
f f f
p
p=Ú
Ú
I d
I d
(3.6)
where I(f) is the WAXD intensity at scattering angle f (0 £ f £ p/2). f2cos is the
mean-square cosine (averaged over all of the crystallites) of the angle between the crystal
plane and the reference direction. A Hermans orientation function, fc, of 1.0 indicates
complete alignment of crystallites in the reference direction, zero indicates a completely
random orientation of the crystallites, and –1/2 indicates crystallite alignment in the
perpendicular direction. The crystalline Hermans orientation function for the BPET
sample is 0.875, which indicates a high degree of orientation of the crystallites in the
plane of the film.
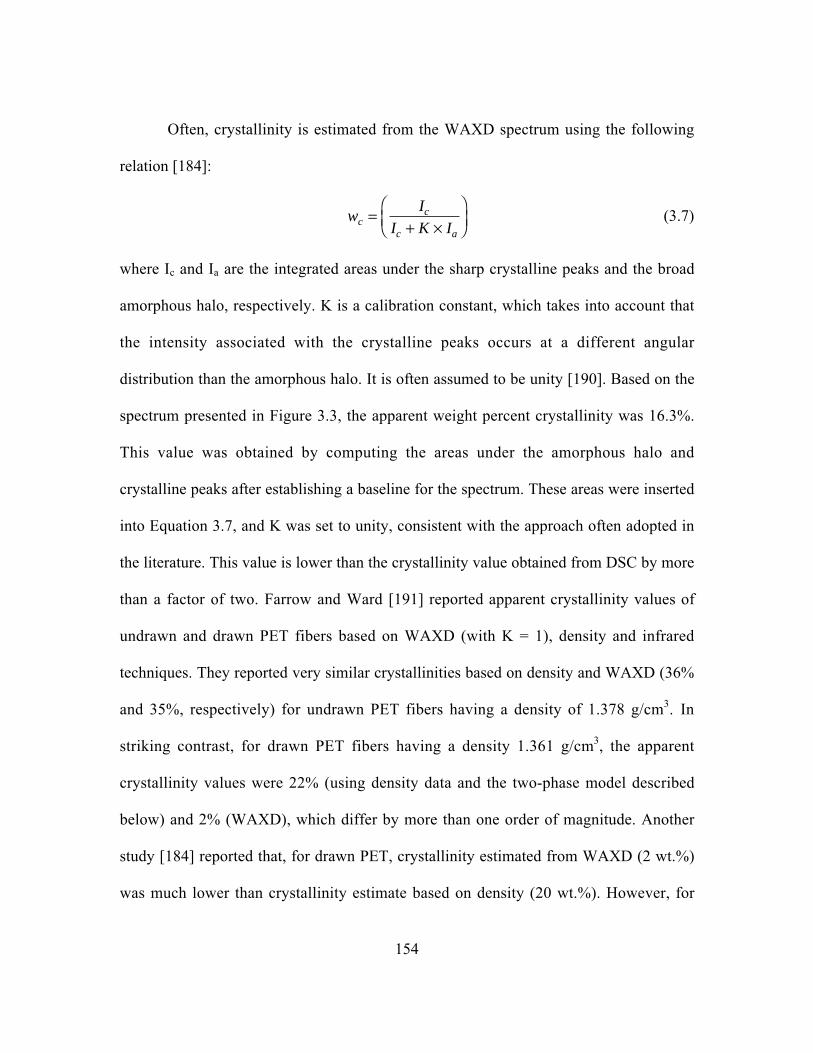
154
Often, crystallinity is estimated from the WAXD spectrum using the following
relation [184]:
wI
I K Icc
c a
=+ ¥
ÊËÁ
ˆ¯̃
(3.7)
where Ic and Ia are the integrated areas under the sharp crystalline peaks and the broad
amorphous halo, respectively. K is a calibration constant, which takes into account that
the intensity associated with the crystalline peaks occurs at a different angular
distribution than the amorphous halo. It is often assumed to be unity [190]. Based on the
spectrum presented in Figure 3.3, the apparent weight percent crystallinity was 16.3%.
This value was obtained by computing the areas under the amorphous halo and
crystalline peaks after establishing a baseline for the spectrum. These areas were inserted
into Equation 3.7, and K was set to unity, consistent with the approach often adopted in
the literature. This value is lower than the crystallinity value obtained from DSC by more
than a factor of two. Farrow and Ward [191] reported apparent crystallinity values of
undrawn and drawn PET fibers based on WAXD (with K = 1), density and infrared
techniques. They reported very similar crystallinities based on density and WAXD (36%
and 35%, respectively) for undrawn PET fibers having a density of 1.378 g/cm3. In
striking contrast, for drawn PET fibers having a density 1.361 g/cm3, the apparent
crystallinity values were 22% (using density data and the two-phase model described
below) and 2% (WAXD), which differ by more than one order of magnitude. Another
study [184] reported that, for drawn PET, crystallinity estimated from WAXD (2 wt.%)
was much lower than crystallinity estimate based on density (20 wt.%). However, for
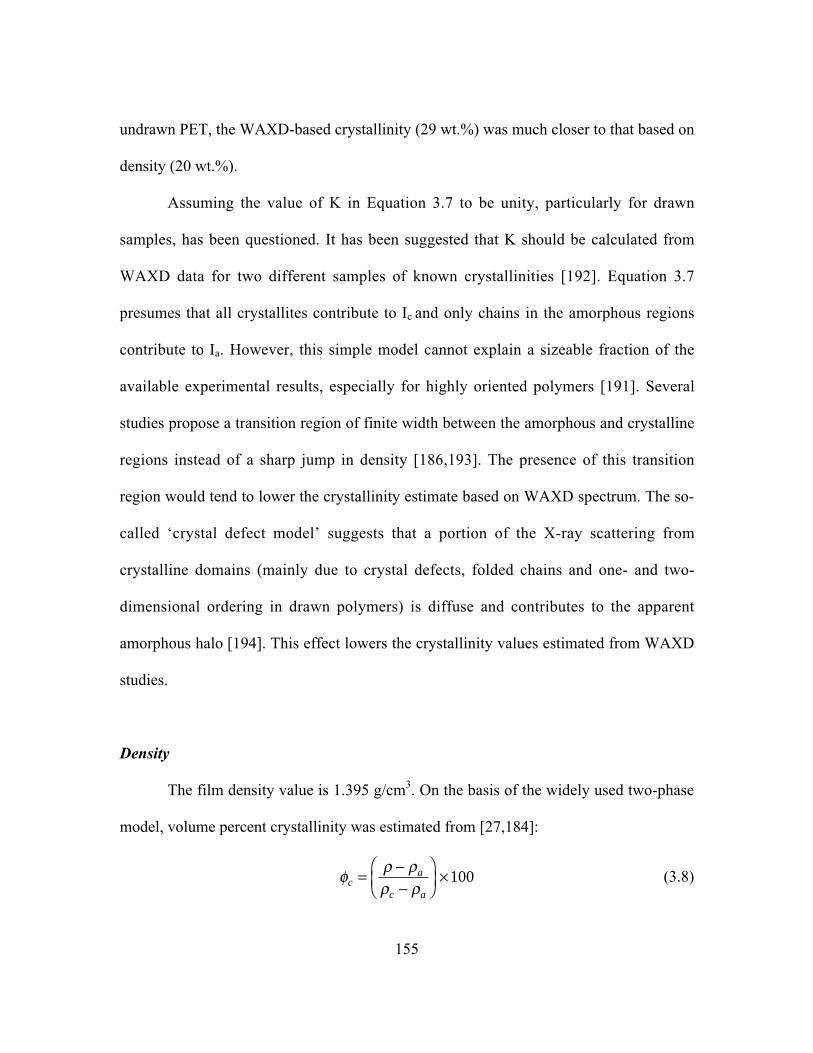
155
undrawn PET, the WAXD-based crystallinity (29 wt.%) was much closer to that based on
density (20 wt.%).
Assuming the value of K in Equation 3.7 to be unity, particularly for drawn
samples, has been questioned. It has been suggested that K should be calculated from
WAXD data for two different samples of known crystallinities [192]. Equation 3.7
presumes that all crystallites contribute to Ic and only chains in the amorphous regions
contribute to Ia. However, this simple model cannot explain a sizeable fraction of the
available experimental results, especially for highly oriented polymers [191]. Several
studies propose a transition region of finite width between the amorphous and crystalline
regions instead of a sharp jump in density [186,193]. The presence of this transition
region would tend to lower the crystallinity estimate based on WAXD spectrum. The so-
called ‘crystal defect model’ suggests that a portion of the X-ray scattering from
crystalline domains (mainly due to crystal defects, folded chains and one- and two-
dimensional ordering in drawn polymers) is diffuse and contributes to the apparent
amorphous halo [194]. This effect lowers the crystallinity values estimated from WAXD
studies.
Density
The film density value is 1.395 g/cm3. On the basis of the widely used two-phase
model, volume percent crystallinity was estimated from [27,184]:
f r rr rc
a
c a
= --
ÊËÁ
ˆ¯̃
¥ 100 (3.8)
156
where r, rc and ra are densities of the semicrystalline polymer sample, wholly crystalline
PET and wholly amorphous PET, respectively. If we use the constant and widely
reported amorphous and crystalline density values of 1.335 g/cm3 and 1.515 g/cm3
respectively [12,76,195], Equation 3.8 yields an apparent crystallinity of 36 wt. % or 33
vol. %. These values are similar to those estimated from the DSC results.
For undrawn PET, Equation 3.8 provides crystallinity estimates that are consistent
with those obtained from WAXD and DSC results [9,27]. However, for drawn polymers,
including PET, crystallinity estimates based on density often do not agree with the
estimates based on other techniques [76,183,186,191,192]. The two-phase model
(Equation 3.8) with constant crystalline and amorphous densities has been reported to fail
for drawn PET [186,191]. Farrow and Ward [191] suggested that the amorphous PET
density is not constant but rather, directly proportional to the draw ratio in oriented fiber
samples. In other words, higher overall density is accompanied by higher amorphous
phase density as well. In contrast, Sekelik et al. [76] report that amorphous PET density
decreases with increasing overall density in oriented film samples. These composite and
seemingly contradictory observations can be rationalized since, in drawn samples, the
amorphous phase density is affected by two competing factors: it increases as a result of
chain orientation and decreases due to the formation of microscopic voids during the
orientation process [191].
In summary, our crystallinity results are in agreement with other reports of wide
variations, depending on the measurement technique, particularly for drawn or highly
oriented samples [184,191,192,196-198]. The literature suggests good agreement

157
between density, DSC, and WAXD estimates of crystallinity for undrawn PET
[184,186,191]. For undrawn samples, thermal annealing results in almost perfect crystals,
consistent with earlier reports for solvent-cast PET [27] and microtomed amorphous PET
[9]. However, for drawn PET, there is often wide disagreement between crystallinity
values estimated by these techniques when the typical simplifying assumptions described
previously are used to interpret the results. In this regard, the assumptions required to
obtain crystallinity estimates from DSC data appear to be less severe than those required
to estimate crystallinity using the other techniques. Therefore, we use the DSC estimate
of crystallinity of BPET for all sorption and diffusion calculations.
Positron Annihilation Lifetime Spectroscopy
Density provides a measure of static free volume related to chain packing, but not
dynamic or sub-Tg mobility-related free volume. Both types of free volumes influence
penetrant diffusion in polymers and can be characterized by PALS [199]. PALS probes
dynamic and static free volume cavity size and the relative concentrations of free volume
cavities accessible to ortho-Positronium (oPs). t3, the average lifetime of oPs in the
polymer matrix, is a measure of the mean size of the cavity in which oPs localizes in the
polymer. I3, the relative number of oPs annihilations, is a measure of the relative
concentration of the free volume cavities. Table 3.1 provides a list of PALS parameter
values for our BPET sample along with those obtained by Serad et al. [9] for highly
amorphous, unoriented PET (APET). Based on these results, the free volume elements in
BPET are larger than in APET. However, the concentration of free volume elements,
158
characterized by I3, is lower in BPET. This indicates a difference in the free volume
distribution of the two samples, presumably due to different processing histories. Other
studies of the effects of biaxial orientation and crystallinity on PALS parameters of PET
and a copolymer of PET and poly(cyclohexyldimethylene terephthalate) (PCT) also
indicate that increasing degree of crystallinity via biaxial stretching increases t3 and
decreases I3. It should also be noted from Table 3.1 that the estimated amorphous phase
fractional free volume based on PALS ( t f33
3I a/ ) is significantly higher for BPET than
for APET.
The decrease in I3 is consistent with the presence of fewer oPs-accessible free
volume sites due to the higher level of crystallinity in the BPET sample than in the APET
material. However, I3 does not decrease strictly due to volume filling (i.e., replacement of
oPs-accessible amorphous regions with inaccessible crystalline ones), as shown in Figure
3.4a. Moreover, t3 increases with increasing crystallinity, as shown in Figure 3.4b. These
results suggest that either the crystal-amorphous interphase region is poorly packed or
that the crystals place a dilational constraint on the nearby amorphous regions, which
influences the free volume distribution in the amorphous regions [24,200-202].
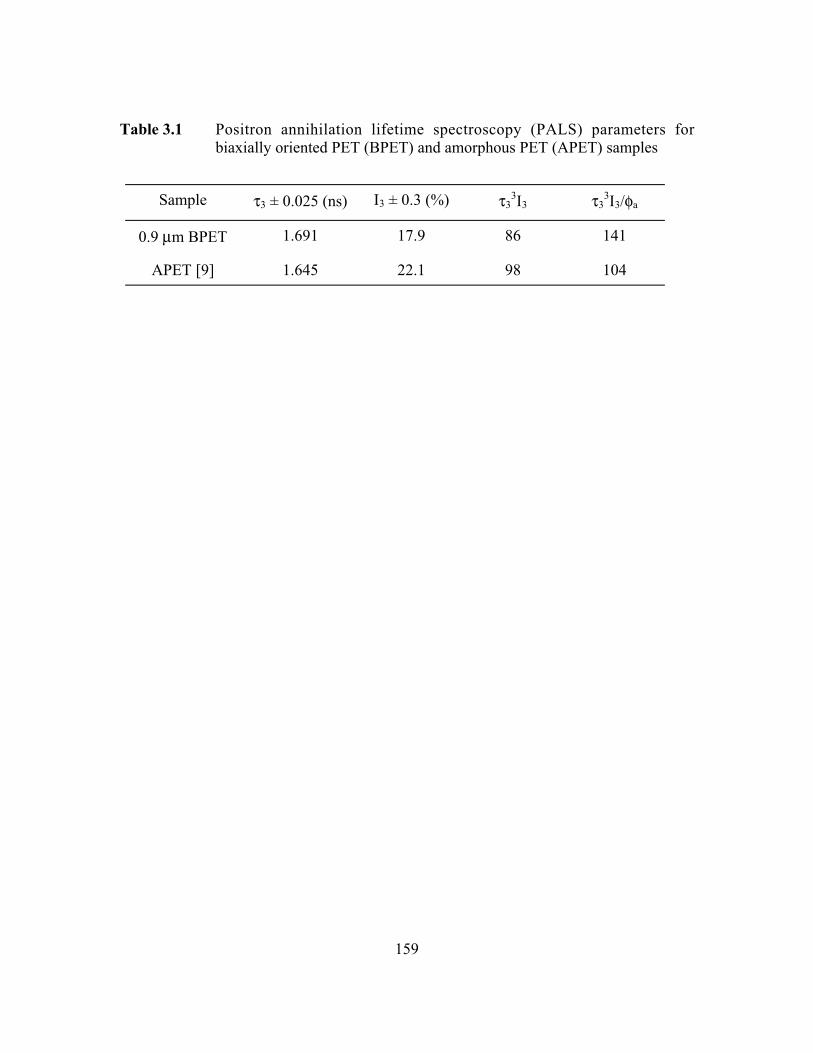
159
Table 3.1 Positron annihilation lifetime spectroscopy (PALS) parameters forbiaxially oriented PET (BPET) and amorphous PET (APET) samples
Sample t3 ± 0.025 (ns) I3 ± 0.3 (%) t33I3 t3
3I3/fa
0.9 mm BPET 1.691 17.9 86 141
APET [9] 1.645 22.1 98 104

160
Figure 3.1 Schematic of McBain quartz spring balance for gravimetric sorption.
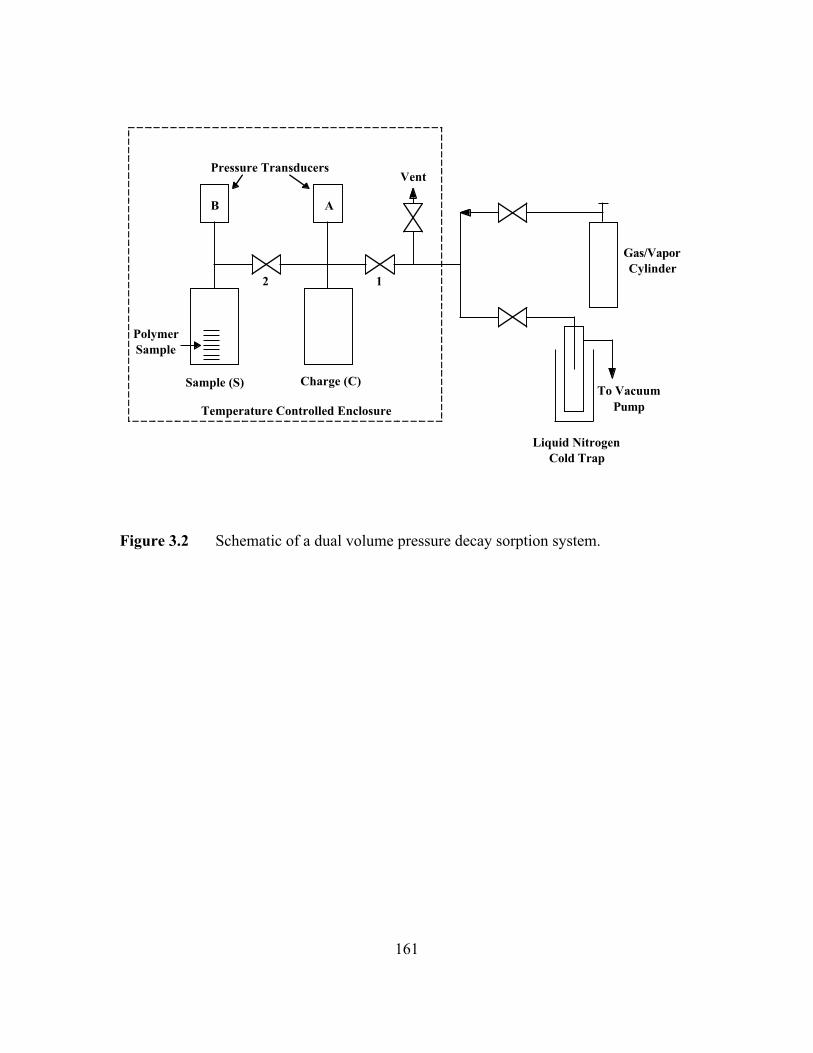
161
To Vacuum Pump
Gas/Vapor Cylinder
Pressure Transducers
PolymerSample
Charge (C)
Liquid NitrogenCold Trap
Vent
12
AB
Temperature Controlled Enclosure
Sample (S)
Figure 3.2 Schematic of a dual volume pressure decay sorption system.
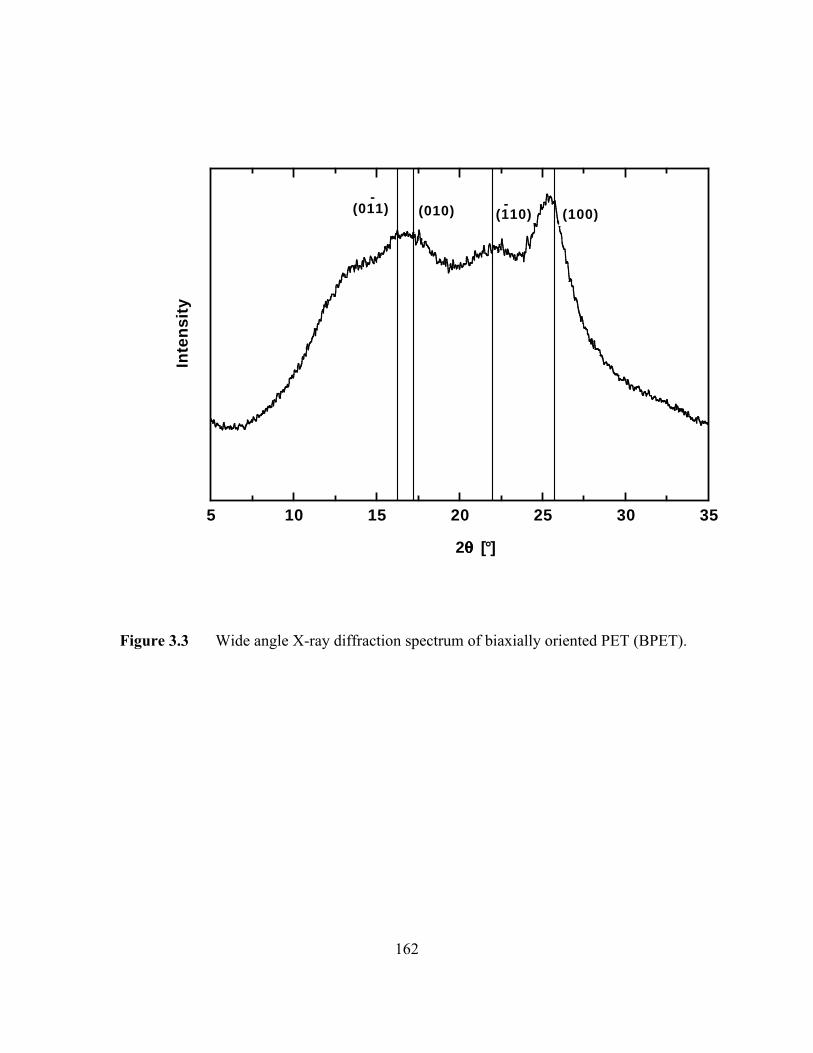
162
5 10 15 20 25 30 35
2
Inte
nsity
qqqq [°]
(011)-
(010) (110) (100)-
Figure 3.3 Wide angle X-ray diffraction spectrum of biaxially oriented PET (BPET).
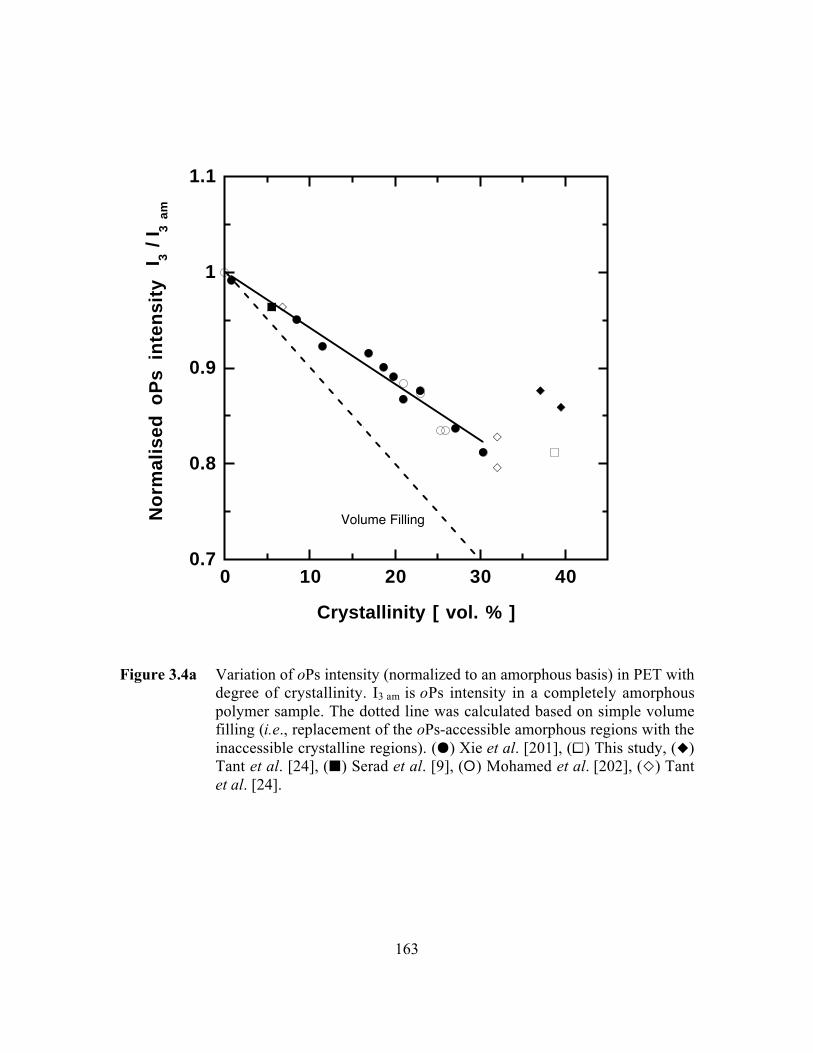
163
0.7
0.8
0.9
1
1.1
0 10 20 30 40
Nor
mal
ised
oP
s in
tens
ity
Crystallinity [ vol. % ]
Volume Filling
I 3 /
I 3 am
Figure 3.4a Variation of oPs intensity (normalized to an amorphous basis) in PET withdegree of crystallinity. I3 am is oPs intensity in a completely amorphouspolymer sample. The dotted line was calculated based on simple volumefilling (i.e., replacement of the oPs-accessible amorphous regions with theinaccessible crystalline regions). (J) Xie et al. [201], (W) This study, (F)Tant et al. [24], (B) Serad et al. [9], (E) Mohamed et al. [202], (A) Tantet al. [24].
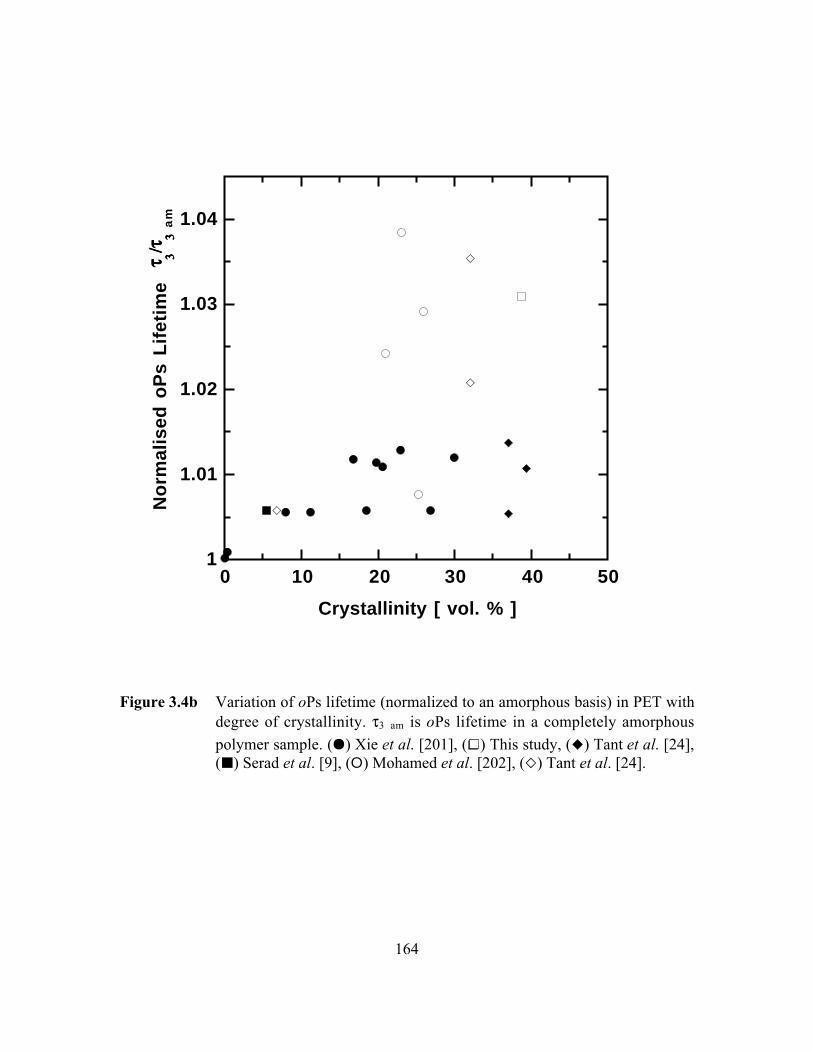
164
1
1.01
1.02
1.03
1.04
0 10 20 30 40 50
Nor
mal
ised
oP
s Li
fetim
e
Crystallinity [ vol. % ]
tttt 3333//// tttt3333
am
Figure 3.4b Variation of oPs lifetime (normalized to an amorphous basis) in PET withdegree of crystallinity. t3 am is oPs lifetime in a completely amorphous
polymer sample. (J) Xie et al. [201], (W) This study, (F) Tant et al. [24],(B) Serad et al. [9], (E) Mohamed et al. [202], (A) Tant et al. [24].
165
CHAPTER 4
Novel Experimental Technique for
Kinetic Gravimetric Sorption of Low Volatility
Gases and Vapors in Polymers
This chapter has been adapted with permission from an article published in
Review of Scientific Instruments, 74 (12), pp. 5173-5178, 2003.
Copyright„ 2003 American Institute of Physics.
166
4.1 Summary
A kinetic gravimetric sorption apparatus for measuring solubility and diffusivity
of low vapor pressure gases and vapors in polymers and other sorbents is described.
Sorption and transport data for toluene vapor in poly(dimethyl siloxane) at 25°C are
provided to illustrate the method. These data were obtained by measuring the kinetic
uptake of a mixture of carrier gas and toluene vapor and, for comparison, pure toluene
vapor at the same thermodynamic activity. Excellent agreement was observed between
toluene solubility and diffusivity values obtained from these two different experiments. In
the mixture sorption experiments, the type of carrier gas (helium or nitrogen) had no
effect on measured toluene solubility and diffusion coefficients.
4.2 Introduction
The sorption and transport of gases and organic vapors in polymeric materials are
important in applications such as food packaging and membrane-based separations
[4,14]. Several experimental techniques have been developed to characterize solubility
and diffusivity of gases and vapors in polymers. The McBain spring balance is one of the
most widely used methods to perform kinetic gravimetric sorption experiments in thin,
uniform sheets of polymers [180]. This method provides independent measurements of
penetrant solubility and diffusivity in a single experiment. It is often practiced as follows:
A thin, uniform polymer film is suspended from a sensitive quartz spring and exposed to
vacuum to remove all mobile and volatile species (e.g., air gases). Then, the sample is
contacted with a gas or vapor at fixed pressure. The time dependent spring extension
167
resulting from penetrant uptake in the polymer is monitored to determine mass uptake as
a function of time. These data are readily deconvoluted to determine penetrant diffusion
coefficients from the rate of uptake and solubility coefficients from the equilibrium
uptake.
Due to the limited sensitivity of the pressure measuring devices commonly used
in such systems, the sorption measurements are typically restricted to penetrants having
substantial vapor pressures, especially at low penetrant activity (or relative pressure). To
the best of our knowledge, 0.1 mmHg is the lowest vapor pressure penetrant for which
gravimetric sorption experiments at low activity have been reported [203] using a highly
sensitive pressure transducer.
The vapor pressures of gases and vapors typically decrease strongly with
increasing size and condensability [204] (cf., Figure 4.1). The sorption and transport of
large, relatively low volatility penetrant molecules (e.g., higher hydrocarbons,
benzaldehyde, benzyl alcohol, benzophenone, benzyl acetate, etc.) in polymers are
important considerations in food packaging applications [4,33]. However, due to the
limitations mentioned earlier, kinetic gravimetric sorption experiments using such large
and condensable penetrants at low thermodynamic activities (i.e., low relative pressures)
have been inconvenient. For this reason, data are often reported for such species based on
experiments performed by exposing samples to saturated vapors or immersing them in
liquid penetrant and weighing the samples at regular time intervals, effectively yielding
sorption and transport measurements at very high activity [23]. Since penetrant solubility
and diffusivity are often strongly dependent on concentration (or activity), these data may
168
not reflect practical conditions, where the penetrant solubility and diffusivity data at
concentrations well below saturation are of interest [4].
For example, it has been proposed to reuse plastic packaging such as bottles by
simply washing and then refilling them with a second product, possibly a beverage for
human consumption. One concern with this approach is the possibility that low levels of
organics sorbed in the package walls might be carried over from prior use of the package
and potentially contaminate the second product by desorbing into it. In this regard, Miltz
et al. reported sorption and transport data for liquid toluene and benzyl alcohol in
poly(ethylene terephthalate) (PET) to characterize the migration of such contaminants
into the polymer structure, and hence evaluate the migration of these components in post-
consumer used PET [205]. Even though their study possibly represents the ‘worst-case’
contamination scenario, the sorption and transport data at much lower activities might be
of more practical importance.
This chapter describes an experimental technique to extend the measurement
capability of a McBain spring balance to perform kinetic gravimetric sorption studies of
low volatility vapors over a wide range of activity. In this method, a carrier gas/vapor
mixture is generated by bubbling an essentially non-sorbing carrier gas (e.g., helium)
through liquid penetrant and diluting the resulting gas/vapor mixture to the desired
concentration using a second stream of pure carrier gas. The resulting vapor
concentrations, which are accurately measured by a gas chromatograph, can be varied to
cover the activity range of interest. Such a vapor generation/dilution scheme has
previously been used for measuring mixed gas/vapor permeation properties of polymers
169
[206,207]. However, to the best of our knowledge, there are no reports of using such a
system to control vapor activity for McBain spring balance experiments.
4.3 Principle of Operation
Figure 4.2 presents a schematic of the gravimetric sorption system. A constant
vapor concentration is generated by bubbling a carrier gas (nitrogen or helium) through a
standard washing bottle (labeled “organic liquid bubbler” in Figure 4.2) containing the
organic liquid. The carrier gas is selected so that it sorbs to a negligible extent in the
polymer sample at the pressure and temperature of interest. In this regard, gases such as
nitrogen or helium, with low critical temperatures, are ideal for this purpose when used at
ambient temperatures and low pressures (e.g., at or below one atmosphere). The resulting
gas/vapor mixture is mixed with another stream of carrier gas to produce the desired final
concentration of the low volatility penetrant in the gas stream. The flow rates of these
streams are controlled using mass flow controllers MFC 1 (0-1000 cm3/min.), and MFC 2
(0-100 cm3/min.), respectively. The mass flow controllers (Type 1259) and the mass flow
readout unit (Type 247C) were from MKS Instruments (Andover, MA). Alphagaz 1
grade nitrogen and helium gases, obtained from Air Liquide (Houston, TX), are used as
carrier gases. Check valves CV 1 and CV 2 (Model 53 series), obtained from Swagelok
Co. (Solon, OH), prevent the organic vapors from contaminating the mass flow
controllers. The gas bubbler is a 500 ml. washing bottle fitted with a coarse fritted disc-
type gas dispersion tube purchased from Fisher Scientific International (Fair Lawn, NJ).
A glass reservoir (12 liters) and glass manifold are used as penetrant reservoir. The entire

170
vapor generation/dilution apparatus and the penetrant reservoir are inside a temperature-
controlled chamber. A sampling port for the gas chromatograph is provided on the glass
manifold through valve B, and valve C connects the system to a vacuum pump used for
sample degassing and system evacuation. Valve A connects the penetrant reservoir to a
water-jacketed glass chamber. The polymer sample (typically 5-50 mg) is suspended
from a sensitive quartz spring placed inside the chamber. The spring (Model 4501.3),
supplied by Ruska Industries (Houston, TX), has a spring constant of 0.21 mg/mm. The
water-jacketed glass chamber provides temperature control for the polymer sample
environment by circulating water through the jacket and through an external circulation
bath (not shown). The CCD camera and computer record spring extension as a function
of time, as described in Chapter 3 [90].
Before beginning a sorption experiment, the sample is exposed to vacuum until
there is no further spring displacement. This step removes previously sorbed air gases and
water vapor from the polymer. The carrier gas/vapor mixture is initially routed through
the purge valve for approximately 30 min. to produce a stream of gas containing a
constant and reproducible vapor concentration. The mixture is then diverted through the
inlet valve to fill the penetrant reservoir to the desired pressure. This mixture is then
allowed to equilibrate inside the reservoir; the timescale for this step is a function of
temperature and the dimensions and overall volume of the penetrant reservoir. A small
injection volume (10-50 µL) is withdrawn from the system through the GC sampling port
using a gas-tight syringe (Model #1705) supplied by Supelco Sigma Aldrich Co. (St.
Louis, MO) and injected into an HP 5890 Series II gas chromatograph equipped with
171
flame ionization detector (FID). The operating parameters for the gas chromatograph are
recorded in Table 4.1. The vapor concentration can be determined directly from standard
calibration curves prepared prior to these measurements [208]. The polymer sample is
then exposed to the penetrant vapor mixture by opening valve A, and the spring position
is recorded as a function of time using the CCD camera and computer, as described
previously [90]. The spring position data are converted to mass uptake data using the
spring constant. Penetrant diffusion coefficients and equilibrium mass uptakes are
extracted from these kinetic sorption data as described in the next section. Penetrant
activity is calculated from the vapor phase concentration and total pressure using the
following equation:
a
cP
Psat
=
ÊËÁ
ˆ¯̃ ¥
106
(4.1)
where a is penetrant activity, c is penetrant vapor concentration in parts per million
(moles/moles), P is total pressure (mmHg), and Psat is penetrant saturation vapor pressure
(mmHg) at the temperature of the sorption experiment. This expression presumes that the
vapor behaves as an ideal gas.
The following procedure is used for preparing the standard vapor calibration
curve. A small but known amount of liquid penetrant is injected into a sealed container
using a liquid syringe and the liquid/vapor system is allowed to reach equilibrium at a
fixed temperature, T. A known volume of saturated vapor, v (cm3), is withdrawn from the
headspace of the container using a gas-tight syringe and injected into a glass vial of
known volume, V (cm3). The vapor phase concentration in the vial, c, in parts per million

172
(moles/moles) can be calculated from the vapor pressure of the liquid penetrant using the
following equation:
cP v
Vsat T=
¥¥
ÊËÁ
ˆ¯̃ ¥,
760106 (4.2)
where Psat,T is vapor pressure of liquid penetrant (mmHg) at temperature T, which can be
calculated using standard equations [204]. A series of samples of varying vapor
concentration are prepared by repeating this procedure. Aliquots of these standard
samples ranging from 5-50 µL are injected into the gas chromatograph using a gas-tight
syringe, and a calibration curve is prepared by plotting FID area response versus vapor
concentration.
4.4 Experimental Results
The sorption and transport data for toluene in crosslinked poly(dimethyl siloxane)
(PDMS) were determined at 25°C and vapor activity ranging from 0 to 0.7. The polymer
and crosslinking agent were supplied by Wacker Silicones Corp. (Adrian, MI) and a film,
251 ± 1 µm thick, was cast using a procedure described in the literature [207]. We
selected this polymer and penetrant as a model system for several reasons. First, the
sorption and diffusion characteristics of rubbery PDMS are well known [209-211].
Second, PDMS is a well-behaved polymer in the sense that it does not exhibit any
penetrant induced hysteresis or other time-dependent changes in penetrant solubility or
diffusion coefficients. Third, it has very high diffusion coefficients so that, even for
relatively large penetrants, such as toluene, the experiments are rapid. Finally, toluene is
173
sufficiently volatile (vapor pressure = 28.8 mmHg at 25°C [212]) to permit this study
using conventional methods (i.e., without resorting to the gas/vapor generation system),
and it is sufficiently condensable (i.e., it is a liquid at ambient conditions) that it is
amenable to study using the gas/vapor generation system. Thus, PDMS and toluene
represent a good polymer/penetrant combination for testing the method being developed
in this study.
Table 4.2 presents a compilation of carrier gas flow rates, total pressures, and
corresponding toluene vapor phase mole fractions in mixtures with nitrogen at 25°C.
These vapor/gas mixtures were used in the sorption experiments described below. The
volume of liquid toluene in the washing bottle at the beginning of the sorption experiment
is given as percentage of the total volume of the washing bottle (500 cm3) in Table 4.2.
For similar values of mass flow rates and total pressures, the vapor mole fraction
increases with increasing liquid volume in the washing bottle because the contact time of
the carrier gas with toluene increases as the liquid volume increases, so the carrier gas
absorbs more toluene vapor as the liquid volume increases.
Figure 4.3 presents experimental sorption data as a function of gas phase
penetrant activity calculated using Equation 4.1. The figure presents data obtained from
three independent sets of experiments. The mixed vapor data were obtained using two
different carrier gases (nitrogen and helium) and the experimental set-up and procedure
described in the previous section. These data are compared with pure vapor sorption data
obtained using the spring balance and the more traditional procedure, which does not
involve the use of a carrier gas [8]. The mixed vapor data in Figure 4.3 were fit using the
174
Flory-Huggins equation, which is commonly used to describe penetrant sorption in
rubbery polymers such as PDMS [15]:
l ln a n= + - + -( )f f c f( )1 12
(4.3)
where a is penetrant activity, f is penetrant volume fraction in the polymer, and c is
Flory-Huggins interaction parameter. The penetrant volume fraction is related to mass
uptake (the ordinate in Figure 4.3) as follows:
f
r J
r J=
¥ ¥¥
ÊËÁ
ˆ¯̃
+¥ ¥¥
ÊËÁ
ˆ¯̃
•
•
M
MWM
MW
100
1100
(4.4)
where M∞ is the equilibrium uptake (g toluene sorbed/100g polymer), r is polymer
density (0.98 g/cm3) [207], J is penetrant liquid molar volume at 25°C (106.8 cm3/mol)
[213], and MW is toluene molecular weight (92 g/mol). The equilibrium mass uptakes of
toluene in PDMS, presented in Figure 4.3, obtained from the mixed vapor sorption
experiments are in excellent agreement with the data obtained from pure vapor sorption
experiments. Also, the results from mixed vapor sorption experiments are independent of
the carrier gas used. Both carrier gases, nitrogen and helium, have extremely low
solubility in PDMS relative to toluene. For example, the ratios of solubilities at infinite
dilution in PDMS at 25°C are approximately 6,000 and 23,500 for toluene/N2 and
toluene/He, respectively [214]. The Flory-Huggins interaction parameter, c, resulting
from the curve-fit in Figure 4.3 was 1.14 ± 0.05. It is in good agreement with the values
175
(ranging from 1.1-0.9 over an activity range of 0.3-0.6) reported in the literature for
toluene in PDMS [211].
Figure 4.4a presents a comparison of kinetic sorption results from pure toluene
and toluene/N2 mixture sorption experiments in PDMS at an activity of 0.5. In this figure,
the mass uptake at time t, Mt, normalized by the mass uptake at equilibrium, M∞, is
presented as a function of square root of the time since the sorption experiment began.
The data collected during the initial stages of the experiment were not included due to
vibration of the spring at the start of the experiment (in response to having the pressure
increased from vacuum to the final total pressure of the experiment). These vibrations,
which compromise the initial mass uptake data, decay over timescales of the order of one
minute or less, and afterwards, the spring displacement accurately reflects mass uptake.
The data in Figure 4.4a can be modeled by the following equation, which describes
Fickian penetrant diffusion into a semi-infinite plane sheet [25]:
M
M n
D n tt
n• =
•
= -+
- +ÊËÁ
ˆ¯̃Â1
8 12 1
2 12 2
2 2
20p
p( )
exp( )
l(4.5)
where D is effective, concentration averaged diffusion coefficient and l is sample
thickness (251 ± 1 µm). D and M∞ were estimated from a least-squares fit of the
experimental data to Equation 4.5. The values of D and M∞ determined from both pure
vapor and mixed vapor sorption experiments in Figure 4.4a are in excellent agreement
with each other. The diffusion coefficients of toluene from pure and mixed vapor sorption
experiments are 1.3 ± 0.1 ¥ 10-6 and 1.1 ± 0.1 ¥ 10-6 cm2/s, respectively. The equilibrium
176
mass uptakes of toluene are 7.3 ± 0.1 and 7.1 ± 0.2 g toluene/100g PDMS from pure and
mixed vapor sorption experiments, respectively.
Figure 4.4b presents a comparison of kinetic sorption results from mixed vapor
sorption experiments with two different carrier gases and a toluene vapor activity of 0.35.
The estimated diffusion coefficients of toluene are 1.2 ± 0.2 ¥ 10-6 and 1.9 ± 0.3 ¥ 10-6
cm2/s for nitrogen and helium carrier gas, respectively, and equilibrium mass uptake is
4.1 ± 0.1 g toluene/100g PDMS for both carrier gases. Thus, both toluene diffusion
coefficients and equilibrium toluene uptake values are independent of the type of carrier
gas used, as expected.
Figure 4.5 presents a comparison of toluene diffusion coefficients determined
from pure vapor and mixed vapor sorption in PDMS at 25°C. There is excellent
agreement between the diffusion coefficients obtained by the two experimental
techniques. The diffusion coefficients decrease with increasing penetrant activity or
concentration, which is in qualitative agreement with the concentration dependence of
diffusion coefficients of ethyl benzene [210], toluene [211], and xylene [211] in PDMS.
Sun et al. have reported a decrease in toluene diffusion coefficients from 8.2 ¥ 10-7 to 5.5
¥ 10-7 cm2/s with increasing activity from 0.3 to 0.6 at 25°C [211]. Their values are
systematically lower than the diffusion coefficients obtained in this study. This difference
might be due to the fact that the PDMS sample used in this study was filler-free whereas
the sample used by Sun et al. had 32.3 wt% silica resin filler, and such fillers usually
reduce penetrant diffusion coefficients [4].

177
The analysis presented above is valid if the rate-controlling step is Fickian
diffusion through the polymer film rather than diffusion of toluene in the gas phase
surrounding the film. One concern is the effect of a so-called film or boundary layer
resistance near the polymer surface arising from a concentration gradient of sorbing
vapor in the gas phase surrounding the polymer. As the polymer film absorbs penetrant,
fresh penetrant vapor must be transported via diffusion and/or convection to the polymer
film surface. If the rate of penetrant transport in the gas phase is slow relative to the rate
of penetrant uptake by diffusion into the polymer, the penetrant concentration at the
polymer surface could be depleted, which would influence the kinetics of penetrant
uptake in the polymer [25]. The relative importance of this effect can be assessed from
the mass transfer Biot number (Bim), which is the ratio of the mass transfer resistance due
to diffusion inside the polymer film to the mass transfer resistance due to transport in the
gas phase near the polymer film surface [215]:
Bik
D S Pmm= ¥
ÊËÁ
ˆ¯̃
l
222414
(4.6)
where km is the mass transfer coefficient of toluene in a binary mixture with nitrogen or
helium (mol/cm2.s), l is polymer film thickness (cm), D is the diffusion coefficient of
toluene in the polymer film (cm2/s), S is the solubility of toluene in the polymer film
(cm3(STP)/cm3.cmHg), and P is total pressure (cmHg). Conservative values of km are
estimated from:
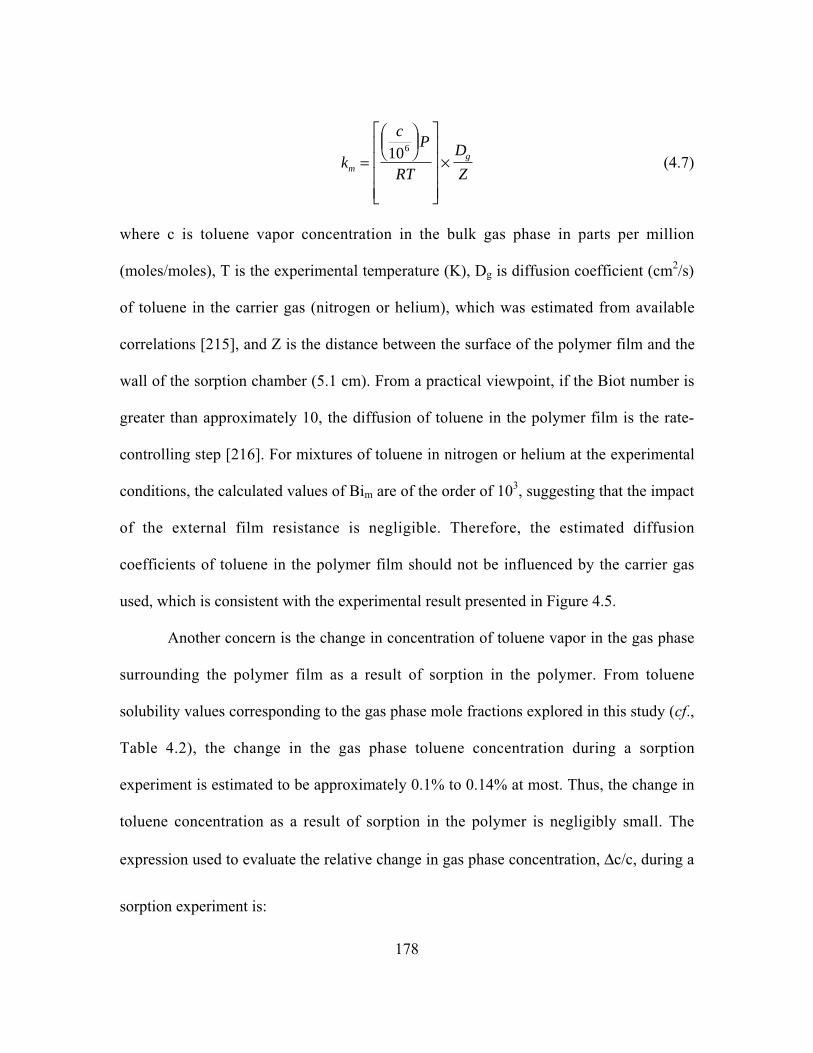
178
k
cP
RT
D
Zmg=
ÊËÁ
ˆ¯̃
È
Î
ÍÍÍÍ
˘
˚
˙˙˙˙
¥106
(4.7)
where c is toluene vapor concentration in the bulk gas phase in parts per million
(moles/moles), T is the experimental temperature (K), Dg is diffusion coefficient (cm2/s)
of toluene in the carrier gas (nitrogen or helium), which was estimated from available
correlations [215], and Z is the distance between the surface of the polymer film and the
wall of the sorption chamber (5.1 cm). From a practical viewpoint, if the Biot number is
greater than approximately 10, the diffusion of toluene in the polymer film is the rate-
controlling step [216]. For mixtures of toluene in nitrogen or helium at the experimental
conditions, the calculated values of Bim are of the order of 103, suggesting that the impact
of the external film resistance is negligible. Therefore, the estimated diffusion
coefficients of toluene in the polymer film should not be influenced by the carrier gas
used, which is consistent with the experimental result presented in Figure 4.5.
Another concern is the change in concentration of toluene vapor in the gas phase
surrounding the polymer film as a result of sorption in the polymer. From toluene
solubility values corresponding to the gas phase mole fractions explored in this study (cf.,
Table 4.2), the change in the gas phase toluene concentration during a sorption
experiment is estimated to be approximately 0.1% to 0.14% at most. Thus, the change in
toluene concentration as a result of sorption in the polymer is negligibly small. The
expression used to evaluate the relative change in gas phase concentration, Dc/c, during a
sorption experiment is:
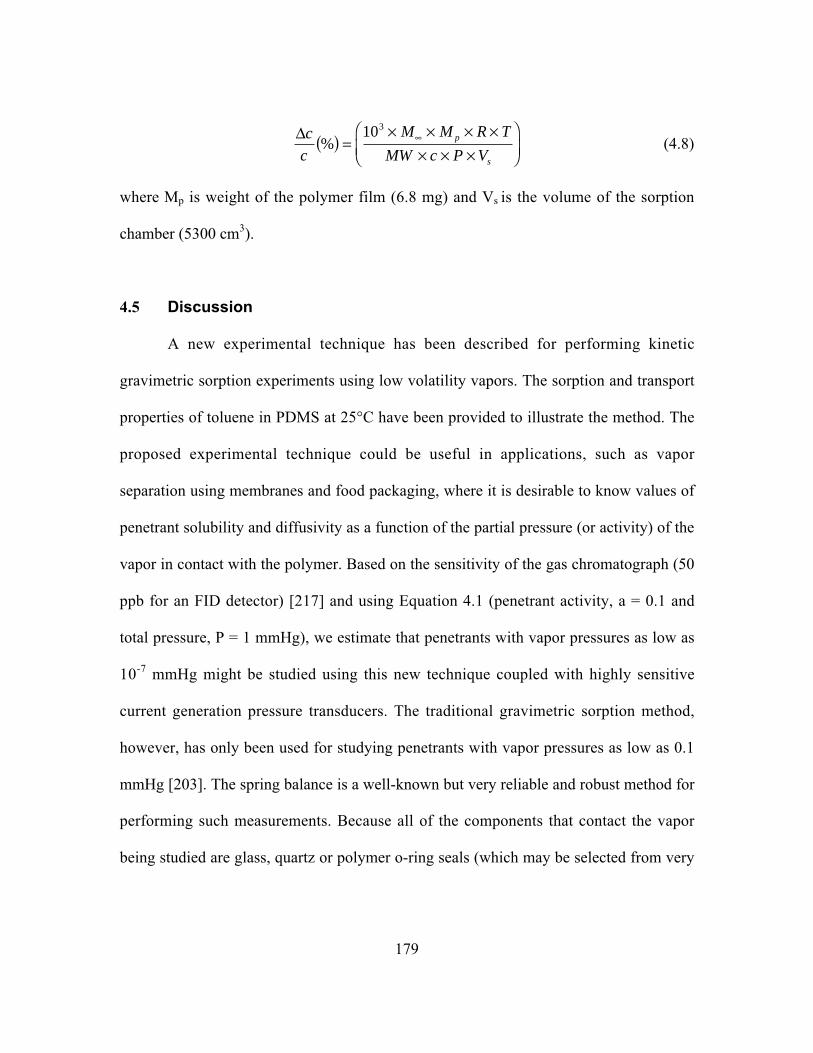
179
Dc
c
M M R T
MW c P Vp
s
%( ) =¥ ¥ ¥ ¥
¥ ¥ ¥Ê
ËÁˆ
¯̃•103
(4.8)
where Mp is weight of the polymer film (6.8 mg) and Vs is the volume of the sorption
chamber (5300 cm3).
4.5 Discussion
A new experimental technique has been described for performing kinetic
gravimetric sorption experiments using low volatility vapors. The sorption and transport
properties of toluene in PDMS at 25°C have been provided to illustrate the method. The
proposed experimental technique could be useful in applications, such as vapor
separation using membranes and food packaging, where it is desirable to know values of
penetrant solubility and diffusivity as a function of the partial pressure (or activity) of the
vapor in contact with the polymer. Based on the sensitivity of the gas chromatograph (50
ppb for an FID detector) [217] and using Equation 4.1 (penetrant activity, a = 0.1 and
total pressure, P = 1 mmHg), we estimate that penetrants with vapor pressures as low as
10-7 mmHg might be studied using this new technique coupled with highly sensitive
current generation pressure transducers. The traditional gravimetric sorption method,
however, has only been used for studying penetrants with vapor pressures as low as 0.1
mmHg [203]. The spring balance is a well-known but very reliable and robust method for
performing such measurements. Because all of the components that contact the vapor
being studied are glass, quartz or polymer o-ring seals (which may be selected from very
180
chemically resistant materials), this method is useful for measuring the uptake of even
corrosive or highly condensable vapors in polymers.
4.6 Acknowledgments
The author gratefully acknowledges partial support for this work from Eastman
Chemical Co. (Kingsport, TN). The author also thanks Dr. Lora Toy (RTI International,
Research Triangle Park, NC) for providing the PDMS film sample and Ms. Anna
Iwasinska (University of Texas at Austin, Austin, TX) for helpful discussions regarding
gas chromatography.
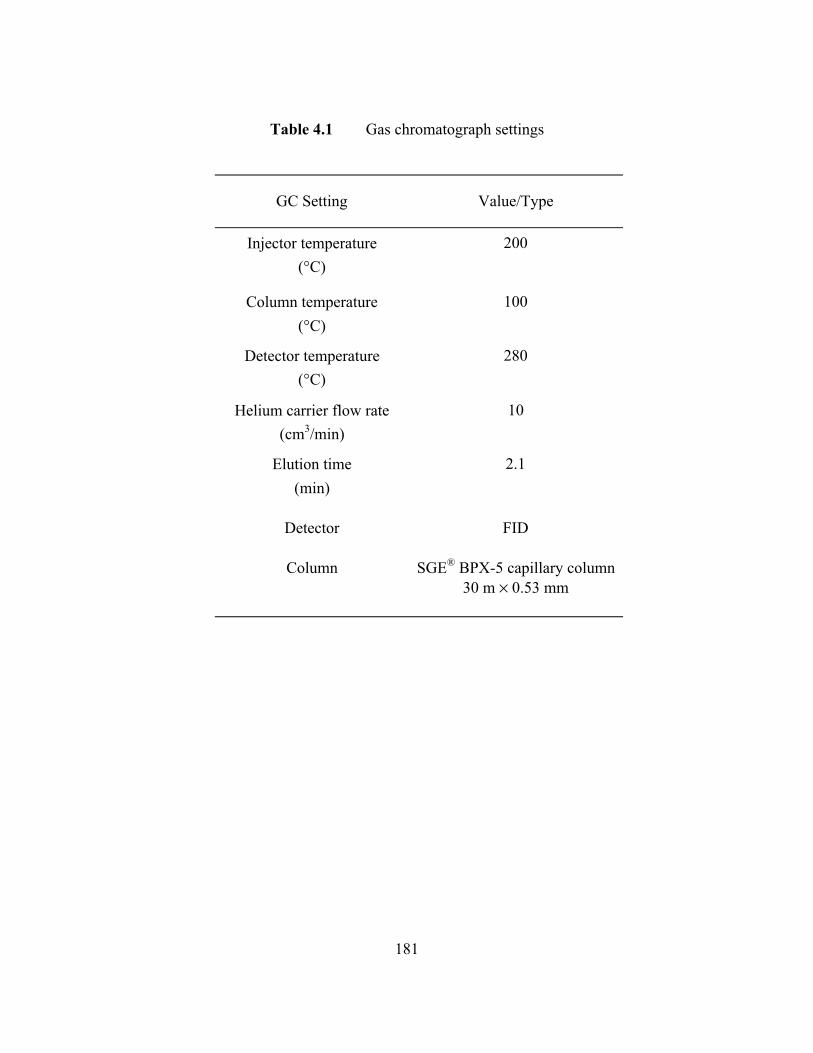
181
Table 4.1 Gas chromatograph settings
GC Setting Value/Type
Injector temperature
(°C)
200
Column temperature
(°C)
100
Detector temperature
(°C)
280
Helium carrier flow rate
(cm3/min)
10
Elution time
(min)
2.1
Detector FID
Column SGE® BPX-5 capillary column30 m ¥ 0.53 mm
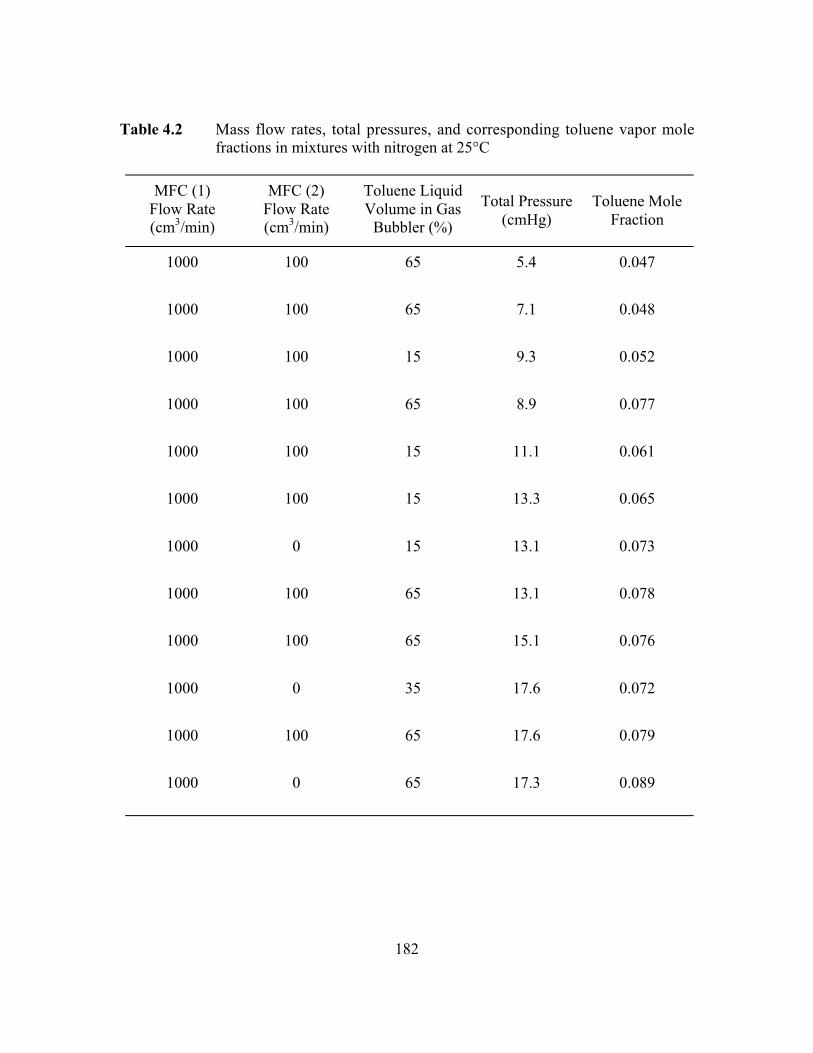
182
Table 4.2 Mass flow rates, total pressures, and corresponding toluene vapor molefractions in mixtures with nitrogen at 25°C
MFC (1)Flow Rate(cm3/min)
MFC (2)Flow Rate(cm3/min)
Toluene LiquidVolume in Gas
Bubbler (%)
Total Pressure(cmHg)
Toluene MoleFraction
1000 100 65 5.4 0.047
1000 100 65 7.1 0.048
1000 100 15 9.3 0.052
1000 100 65 8.9 0.077
1000 100 15 11.1 0.061
1000 100 15 13.3 0.065
1000 0 15 13.1 0.073
1000 100 65 13.1 0.078
1000 100 65 15.1 0.076
1000 0 35 17.6 0.072
1000 100 65 17.6 0.079
1000 0 65 17.3 0.089
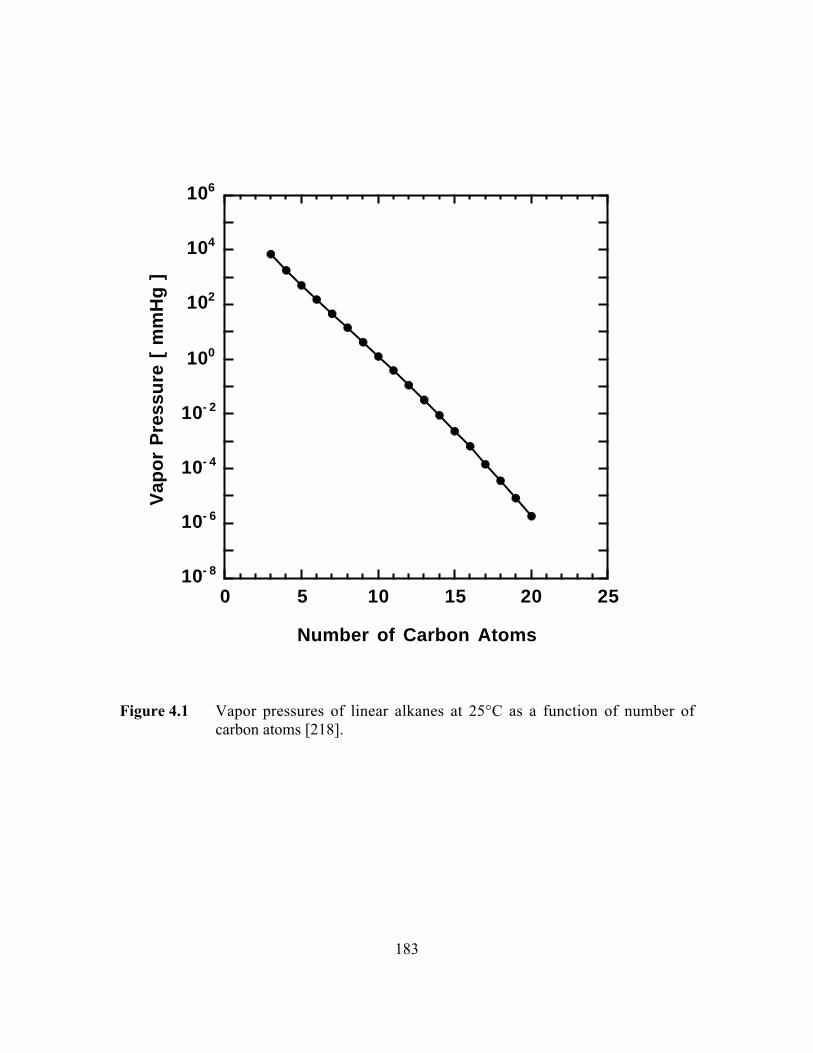
183
10- 8
10- 6
10- 4
10- 2
100
102
104
106
0 5 10 15 20 25
Vap
or P
ress
ure
[ m
mH
g ]
Number of Carbon Atoms
Figure 4.1 Vapor pressures of linear alkanes at 25°C as a function of number ofcarbon atoms [218].

Pressure Transducer12L
GlassReservoir
GC Sampling Port
Water Out
Water In
CCD Camera
Computer
PolymerSample
Reference Rod
QuartzSpring
Vent
ToVacuum
Pump
CA
Purge Valve
Inlet ValveMFC 2
MFC 1 CV 1CV 2
Carrier
Carrier
Mass Flow ControllerReadout
B
To Pressure Readout
Temperature Controlled Chamber
Organic LiquidBubbler
Liquid NitrogenCold Trap
Figure 4.2 Schematic diagram of modified spring balance system.
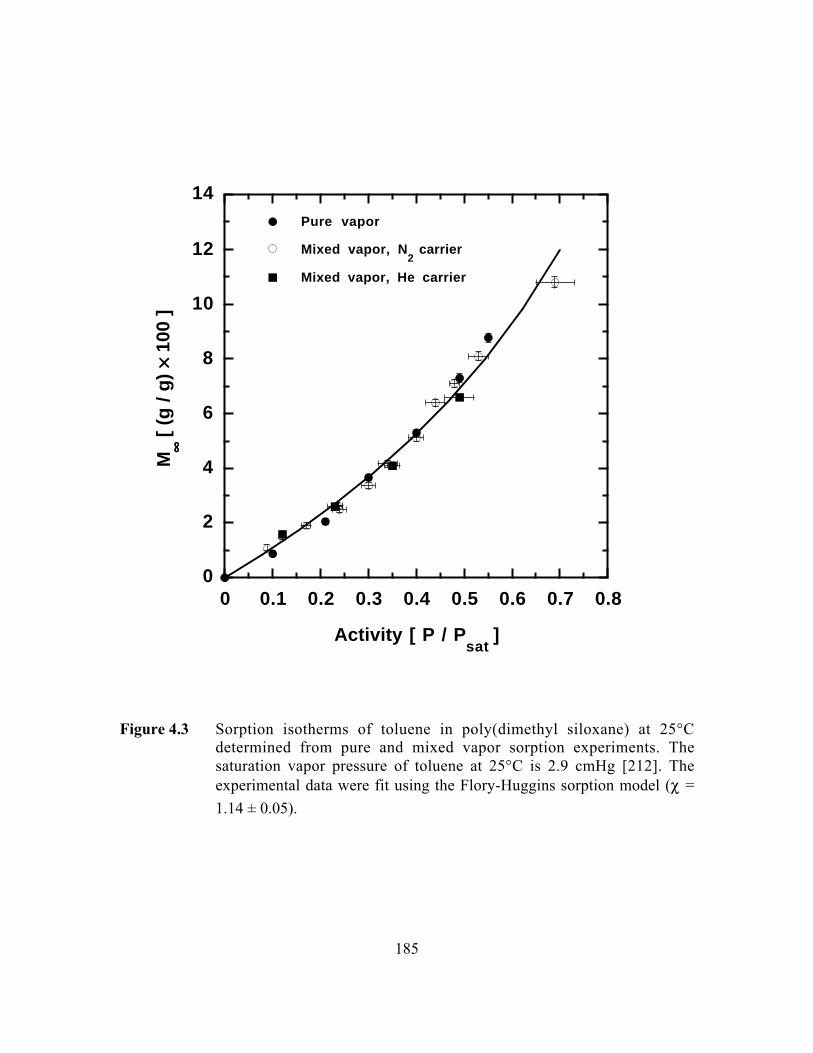
185
0
2
4
6
8
10
12
14
0 0.1 0.2 0.3 0.4 0.5 0.6 0.7 0.8
Pure vapor
Mixed vapor, N2 carrier
Mixed vapor, He carrier
M•••• [
(g /
g) ¥¥¥¥
100
]
Activity [ P / Psat
]
Figure 4.3 Sorption isotherms of toluene in poly(dimethyl siloxane) at 25°Cdetermined from pure and mixed vapor sorption experiments. Thesaturation vapor pressure of toluene at 25°C is 2.9 cmHg [212]. Theexperimental data were fit using the Flory-Huggins sorption model (c =
1.14 ± 0.05).
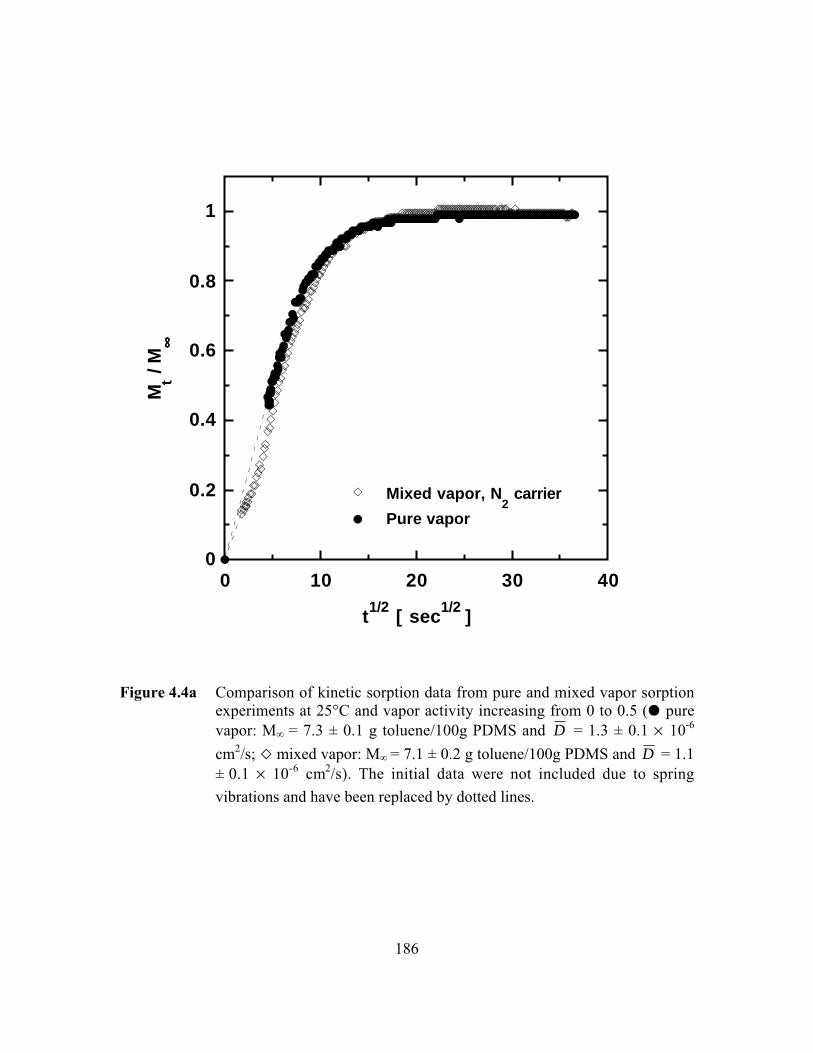
186
0
0.2
0.4
0.6
0.8
1
0 10 20 30 40
Mixed vapor, N2 carrier
Pure vapor
Mt /
M••••
t1/2 [ sec 1/2 ]
Figure 4.4a Comparison of kinetic sorption data from pure and mixed vapor sorptionexperiments at 25°C and vapor activity increasing from 0 to 0.5 (J purevapor: M∞ = 7.3 ± 0.1 g toluene/100g PDMS and D = 1.3 ± 0.1 ¥ 10-6
cm2/s; A mixed vapor: M∞ = 7.1 ± 0.2 g toluene/100g PDMS and D = 1.1± 0.1 ¥ 10-6 cm2/s). The initial data were not included due to spring
vibrations and have been replaced by dotted lines.

187
0
0.2
0.4
0.6
0.8
1
0 10 20 30 40
Nitrogen carrier
Helium carrier
Mt /
M••••
t1/2 [ sec 1/2 ]
Figure 4.4b Comparison of kinetic sorption data from mixed vapor sorptionexperiments at 25°C using nitrogen and helium carrier gases and vaporactivity increasing from 0 to 0.35 (J helium: M∞ = 4.1 ± 0.1 gtoluene/100g PDMS and D = 1.9 ± 0.3 ¥ 10-6 cm2/s; A nitrogen: M∞ = 4.1
± 0.1 g toluene/100g PDMS and D = 1.2 ± 0.2 ¥ 10-6 cm2/s). The initial
data were not included due to spring vibrations and have been replaced bydotted line.

188
0
10
20
30
40
50
0 0.2 0.4 0.6 0.8
Pure vapor
Mixed vapor, He carrier
Mixed vapor, N 2 carrier
D [
10-7
cm
2 /s ]
Activity [ P / Psat
]
Figure 4.5 Comparison of diffusion coefficients of toluene in poly(dimethyl siloxane)at 25°C from pure and mixed vapor sorption experiments.

189
CHAPTER 5
Sorption and Transport of Linear Alkane
Hydrocarbons in Biaxially Oriented
Poly(ethylene terephthalate)
This chapter has been adapted with permission from an article published under the same
title in Journal of Polymer Science (Physics), 39 (11), pp. 1160-1172, 2001.
Copyright„ 2001 John Wiley & Sons.
190
5.1 Summary
Equilibrium sorption and kinetics of n-butane and n-pentane uptake in uniform,
biaxially oriented, semicrystalline poly(ethylene terephthalate) (BPET) films are reported
at 35°C and for pressures ranging from 0 to approximately 76 cmHg. Sorption isotherms
are well described by the dual-mode sorption model. Sorption kinetics are described
either by Fickian diffusion or a two-stage model incorporating Fickian diffusion at short
times and protracted polymer structural relaxation at long times. Diffusion coefficients
increase with increasing penetrant concentration. n-Butane solubility is lower than that of
n-pentane, consistent with the more condensable nature of n-pentane. However, n-butane
diffusion coefficients are higher than those of n-pentane. Infinite dilution, estimated
amorphous phase diffusion coefficients are well correlated with penetrant critical volume,
and infinite dilution, estimated amorphous phase penetrant solubility, with penetrant
critical temperature.
5.2 Experimental
5.2.1 Materials
Biaxially oriented PET films having a nominal thickness of 0.9 µm and purchased
from Goodfellow Co. (Berwyn, PA) were used as received. The film density, 1.395
g/cm3, was furnished by the supplier. The complete details of sample characterization
techniques and corresponding results and discussion were presented earlier in Chapter 3.
n-Butane (99.5% purity) was purchased from Scott Specialty Gases (Durham, NC). High
performance liquid chromatographic (HPLC) grade (99.7% purity) n-pentane was
191
purchased from Fisher Scientific International (Fair Lawn, NJ). It was subjected to
several freeze-thaw cycles to remove dissolved gases and other impurities before use.
5.2.2 Gravimetric Sorption
Interval kinetic gravimetric sorption experiments were performed using a
traditional McBain spring balance system, which was described in Chapter 3. The quartz
spring was supplied by Ruska Industries, Inc. (Houston, TX) and had a spring constant of
2.94 mm/mg.
5.3 Results and Discussion
5.3.1 Equilibrium n-Butane and n-Pentane Uptake
Interval kinetic gravimetric sorption experiments were used to determine sorption
isotherms of n-butane and n-pentane in BPET at 35°C, and the results are presented in
Figures 5.1a and 5.1b. Both isotherms are concave to the pressure axis and are well
described by the dual-mode sorption model, which is typically used for sorption of gases
and vapors in both amorphous and semicrystalline glassy polymers, such as PET [18].
According to this model, penetrants sorb into the equilibrium densified polymer matrix
(Henry’s Law sites) and into the so-called non-equilibrium excess volume of the glassy
polymer (Langmuir sites). The total penetrant concentration is the algebraic sum of the
concentration in each mode:
C k p Cbp
bpD H= + ¢+
ÊËÁ
ˆ¯̃1
(5.1)

192
where kD is the Henry’s Law coefficient, CH´ is the Langmuir capacity parameter, a
measure of the sorption capacity in the non-equilibrium excess volume of the glassy
polymer, and b is the Langmuir affinity parameter, a measure of the penetrant’s affinity
for the Langmuir sites. The Langmuir capacity has been associated with frozen
microvoids in non-equilibrium glassy polymers [16,17]. Restriction of the backbone
chain motions of polymers below the glass transition temperature kinetically limits chain
relaxation, presumably resulting in trapped excess free volume or so-called frozen
microvoids [16]. While the dual-mode sorption model is the most widely used model for
penetrant sorption in glassy polymers, other models, such as the non Equilibrium Lattice
Fluid (NELF) model, have also been proposed in the literature [219].
The curves in Figures 5.1a and 5.1b represent least-square fits of the experimental
sorption data to Equation 5.1. The dual-mode parameters obtained in this study for BPET
are presented in Table 5.2. The dual-mode parameters obtained by Serad et al. [9] for
n-butane sorption in amorphous PET (APET) are also included in Table 5.2. Based on the
values in Table 5.2, the infinite dilution, estimated amorphous phase solubility coefficient
of n-butane, (kD + CH´ b) / fa, is higher for our semicrystalline BPET sample (0.126
cm3(STP)/(cm3•cmHg)) than for APET (0.052 cm3(STP)/(cm3•cmHg)), suggesting that
the penetrant-accessible amorphous phase in the oriented BPET sample has considerably
higher solubility than that in the highly amorphous APET sample. This result is contrary
to the conventional notion that crystallinity decreases penetrant solubility [10]. In this
regard, the Henry’s Law parameter, kD, is somewhat lower in the crystalline BPET
sample than in the largely amorphous APET sample. However, the higher value of CH´ in
193
BPET indicates the presence of higher non-equilibrium excess volume in the oriented,
semicrystalline sample. Since most of the penetrant sorption occurs into the non-
equilibrium excess volume at infinite dilution, the infinite dilution solubility is
particularly sensitive to the distribution of the non-equilibrium excess volume sites in the
amorphous phase. The amorphous phase, fractional free volume estimates, based on
PALS (cf., Table 5.1), are consistent with the solubility results.
The effect of crystallinity and chain orientation on sorption and diffusion has been
studied [76,79,220]. Sekelik et al. [76] determined the effect of crystallinity on
amorphous phase solubility of oxygen in PET. They reported an increase in oxygen
solubility in the amorphous phase of PET as a result of crystallization. This was due to a
decrease in density of the amorphous phase with increasing crystallinity, indicating an
appearance of additional free volume. As an example, the apparent amorphous phase
oxygen solubility increased from approximately 0.02 cm3/(cm3•atm) to 0.06
cm3/(cm3•atm) as the density of the amorphous phase decreased from 1.37 to 1.35 g/cm3.
The authors concluded that hole-filling (i.e., sorption in the Langmuir sites) is the major
process by which oxygen sorbs into PET. Our results of n-butane sorption in PET are in
good qualitative agreement with their results. Shastri et al. [79] studied the effect of
orientation on oxygen permeability in vinylidene chloride/vinyl chloride (VDC)
copolymer and in aromatic nylon. They reported an increase in permeability upon biaxial
orientation. For example, the VDC copolymer showed oxygen permeability of 0.3 cm3-
mil / (100 in2 24 hr. atm) upon 2.5X biaxial orientation. The permeability of an
unoriented, extrusion cast film was reported to be 0.2 cm3-mil / (100 in2 24 hr. atm). They
194
attributed the permeability increase to microvoid development during orientation of the
polymer chains after crystallinity was fully developed. However, cyclohexane sorption
studies in PET [220] suggest a linear decrease in Langmuir capacity parameter (from 0.06
to 0.005 cm3(STP)/cm3) with increasing orientation factor (from 0.022 to 0.124). This
trend was ascribed to a stronger decrease in amorphous free volume as a result of chain
orientation than the increase in free volume due to microvoid formation.
The Langmuir sorption capacity parameter has been related to the amount of non-
equilibrium excess volume in a glassy polymer as follows [221]:
¢ =-
=CV V
V
V
VHg l
g
ex
g
r r* * (5.2)
where Vg is the specific volume of the polymer, Vl is the specific volume of the densified
polymer matrix, and r* is the condensed penetrant density, often estimated as the
saturated liquid density of the penetrant at the temperature of the experiment. The
densities of n-butane and n-pentane at 35°C were calculated using the Hankinson-Brobst-
Thomson correlation [222]. The values are 216.3 cm3(STP)/cm3 and 189.6 cm3(STP)/cm3
for n-butane and n-pentane, respectively. Thus, if the excess free volume characterized by
CH´ is equally accessible to both n-butane and n-pentane, then CH´ should be higher for
n-pentane than for n-butane, since the density of n-pentane is higher. In agreement with
this prediction, CH´ is 2.53 cm3(STP)/cm3 for n-pentane and 2.16 cm3(STP)/cm3 for
n-butane. Consistent with Equation 5.2, the CH´/ r* values for n-butane and n-pentane are
similar (0.010 and 0.013, respectively).
195
The logarithm of infinite dilution, amorphous phase penetrant solubility, Sa, in
rubbery and glassy polymers increases linearly with critical temperature if dispersion
forces are the dominant contribution to the interaction energy between polymer segments
and penetrant molecules [97,223]. The mathematical form of this correlation is given by:
ln S N MTa c= + (5.3)
Figure 5.2 presents the infinite dilution solubility of n-butane, n-pentane, and other
literature data for PET as a function of critical temperature [9]. The infinite dilution
solubility values reported in this figure have been adjusted to an amorphous basis using
the following relation [9]:
SS
aa
=f
(5.4)
where S is the infinite dilution penetrant solubility, and fa is the amorphous phase
volume fraction. Although it is widely used, this relation should be regarded as a first
approximation, because it does not account for effects of crystallinity (and, in turn, the
processing protocols used to vary crystallinity) on the non-crystalline phase morphology,
which, as discussed above, can influence solubility levels. A more refined adjustment of
solubility values to account for variations in morphology would require a better model of
such effects and additional information about the PET samples from the literature, neither
of which are presently available. Infinite dilution solubility values were obtained by
extrapolating the reported solubility values to zero concentration. Solubilities of nonpolar
penetrants increase linearly with Tc, as predicted by the model, while the solubilities of
polar or quadrupolar penetrants exhibit somewhat greater scatter around the correlation
196
line. The n-butane and n-pentane solubility coefficients obtained in this study are in
excellent agreement with this model.
5.3.2 n-Butane and n-Pentane Sorption Kinetics
Figures 5.3(a-d) present results from four representative n-butane and n-pentane
kinetic sorption experiments in BPET at 35°C. Before beginning a kinetic sorption
experiment, the polymer sample is equilibrated in an environment where the penetrant
pressure surrounding the polymer sample is pi. At t = 0, the penetrant pressure is
increased to pf, and the sorption experiment begins. Mt is the mass of penetrant sorbed by
the polymer at time t, and M∞ is the equilibrium mass uptake. Penetrant concentration in
the polymer at equilibrium, C, can be calculated from the equilibrium mass uptake using
the following relation:
CM
MWpolymer=
¥ ¥ ¥• 22414 100 r(5.5)
where M∞ is equilibrium penetrant uptake (g/100g), rpolymer is polymer density (g/cm3),
and MW is penetrant molecular weight (g/mol).
In each case, the fractional mass uptake Mt / M∞ increases linearly with t1/2 for
short times. This behavior is characteristic of sorption kinetics controlled by Fickian
diffusion [27] (see, for example, Figures 5.3a, 5.3c and the dotted curves in Figures 5.3b,
5.3d). At longer times, however, the fractional mass uptake may exhibit a protracted,
asymptotic approach towards equilibrium [224] (see, for example, the solid curves in
Figures 5.3b, 5.3d). This behavior is ascribed to mass uptake kinetics limited by polymer
197
swelling and structural rearrangement to accommodate the penetrant (rather than Fickian
diffusion). Such two-stage kinetics has been observed for organic vapor sorption in
glassy polymers such as benzene in PET [225], acetone in PET [27], ethyl benzene in
polystyrene [226], and benzene in polystyrene [227]. These sorption kinetics are often
described using the following empirical model [27]:
M
M n
D n t
l
t tH tt
Rn
RD
RD
• =
•
= - -+
- +ÊËÁ
ˆ¯̃
ÏÌÓ
¸˝˛
+ ¥- -Ê
ËÁˆ¯̃
¥ ( )Â1 18 1
2 12 1
2 2
2 2
20
( )( )
exp( )
exp( )a
pp a
t(5.6)
where D is the average diffusion coefficient (as defined below), l is polymer film
thickness, aR is the fraction of weight uptake occurring during the protracted, non-
Fickian approach to equilibrium, tR is the time constant associated with the long time
drift in mass uptake, tD is a delay factor accounting for a delay in the beginning of
structural relaxation, and H(tD) is the Heaviside unit step function [253]. Typical values
of tD range from zero to l2/ D , which corresponds to the end of Fickian diffusion. D is
approximately equal to the average diffusion coefficient over the concentration interval
of the Fickian portion of the uptake curve [25].
Figures 5.3b and 5.3d present least-squares fits of Equation 5.6 to the
experimental data for n-butane and n-pentane sorption in BPET at 35°C over the pressure
interval from 11.5 to 59.6 cmHg and from 10.4 to 2.7 cmHg, respectively. The initial
mass uptake, which is controlled by Fickian diffusion (dotted curves), can be modeled as
follows [27]:
M M
n
D n t
lt
R n
/( ) ( )
exp( )•
=
•
-= -
+- +Ê
ËÁˆ¯̃Â1
18 1
2 12 1
2 2
2 2
20a p
p(5.7)
198
The protracted non-Fickian approach to equilibrium (solid curves) can be modeled as
[27]:
M
M
t ttR
D
R•= - - -Ê
ËÁˆ¯̃
1 at
exp( )
(5.8)
Equation 5.8 and the relaxation contribution to Equation 5.6 are valid only for t > tD. The
lines through the experimental data in Figures 5.3b and 5.3d are composite curves based
on the best fits of Equation 5.7 and 5.8 to the short and long time data, respectively. The
dotted curve indicates the fraction of mass uptake controlled by Fickian diffusion,
whereas the solid curve indicates the fraction controlled by polymer chain relaxation.
Initially, when the mass uptake is controlled by Fickian diffusion, the time for half of the
total mass uptake by Fickian diffusion to occur is given by [9]:
tl
DF
1 2
2
20 20/ = = t(5.9)
where tF is the characteristic timescale for diffusion, defined as l2/ D . The ratio tR/tF is
called as the Deborah number. This dimensionless parameter characterizes the timescale
for mass uptake due to structural relaxation relative to the timescale for Fickian diffusion.
The following procedure was adopted for calculating the average diffusion
coefficients [9]: For data sets containing significant structural relaxation (e.g., Figures
5.3b and 5.3d), the parameters to be determined are M∞, D , aR, tR and tD. M∞ was
determined from the mass uptake at very long times. Once the value of aR is set (from the
199
plateaus in Figures 5.3b and 5.3d), D (and hence, tF) was calculated from the slope of
the initial kinetic data, which is linear in t1/2, using the following relation:
M M Dt
lt
R
/( )
/•
-= È
Î͢˚̇1
4 2
1 2
a p(5.10)
The parameters tR and tD were determined by fitting the long time kinetic data to the
following form of Equation 5.8:
ln ln1 -ÊËÁ
ˆ¯̃
= +ÊËÁ
ˆ¯̃
-•
M
M
t ttR
D
R R
at t
(5.11)
In a previous study of n-butane diffusion in PET [9], a distinct plateau in the mass
uptake kinetic profile was not clearly seen for all experiments. In this study, distinct
plateaus were observed at intermediate times during the mass uptake profiles, and these
plateaus served as a clear demarcation of the transition from Fickian diffusion to polymer
structural relaxation. Hence, the value of fractional mass uptake at the plateau can be set
equal to (1-aR).
For the uptake plots similar to Figures 5.3a and 5.3c, no polymer structural
relaxation was observed. In these cases, D was calculated using Equation 5.7 with aR=0.
Figure 5.4 presents the diffusion coefficients of n-butane and n-pentane in BPET
as a function of average penetrant concentration. The average penetrant concentration
was defined as follows:
CC Ci f=
+2
(5.12)

200
where Ci and Cf are the penetrant concentrations at the beginning of the sorption
experiment (i.e., the equilibrium penetrant concentration in the polymer at pressure pi)
and end of the Fickian portion of the uptake curve (i.e., the equilibrium penetrant
concentration in the polymer at pressure pf). The majority of the uncertainty in the
diffusion coefficients was due to the uncertainty in film thickness. For both penetrants,
the logarithm of diffusion coefficient increases approximately linearly with penetrant
concentration, consistent with other reports of the concentration dependence of organic
vapor diffusion coefficients in glassy [9,27] and rubbery polymers [228]. The following
empirical model was used [9]:
D D C= • exp( )w (5.13)
where D∞, the infinite dilution diffusion coefficient, is 6.7 ± 2.2 ¥ 10-13 cm2/s and 3.1 ±
5.6 ¥ 10-14 cm2/s for n-butane and n-pentane in BPET, respectively. The slope, w, is 0.47
± 0.22 and 1.32 ± 0.97 cm3(polymer)•s/ (cm3(STP)•cm3) for n-butane and n-pentane,
respectively. Thus, over the penetrant concentration range considered, the dependence of
D on C is approximately three times as strong for n-pentane as for n-butane. The
infinite-dilution diffusion coefficients can be adjusted to an amorphous basis using the
following relation [20]:
DD
aa
= •
f(5.14)
This relation has been shown to be valid for light gases and water vapor in
semicrystalline PET [20]. Roughly speaking, it seeks to account for the effect of
tortuosity (due to the presence of impermeable crystallites in the polymer matrix) on
201
diffusion coefficients. It does not account for effects of chain immobilization on
crystallinity. Such effects are not important for light gas transport in PET, but they cannot
be ruled out for larger penetrants. Therefore, this relation is used here as a first
approximation. The infinite-dilution, estimated amorphous phase diffusion coefficients of
n-butane and n-pentane are 1.1 ¥ 10-12 and 5.1 ¥ 10-14 cm2/s, respectively.
The infinite dilution, estimated amorphous phase diffusion coefficient for
n-pentane in BPET is more than an order of magnitude lower than that for n-butane,
consistent with the larger size of n-pentane. Penetrant diffusion coefficients generally
decrease with increasing penetrant size. Critical volume is a convenient measure of
penetrant size, since it is reported for a wide variety of penetrants. The diffusion
coefficients of n-butane and n-pentane scale with critical volume as shown in Figure 5.5.
Since the diffusion coefficient values in this study were obtained at 35°C, they were
corrected to 25°C using a procedure described in the literature [9]. The correlation is
good for the diffusion coefficient values of n-butane and n-pentane. As penetrant size
increases from helium to benzene, the diffusion coefficients decrease by more than 8
orders of magnitude.
The infinite dilution, amorphous phase diffusion coefficients in PET may be
roughly correlated with critical volume using the following simple power law model [9]:
DVa
c
= th (5.15)
where t and h are adjustable parameters. The exponent, h, in Equation 5.15 is a measure
of the strength of dependence of diffusion coefficients on penetrant size. Polymers with
202
larger values of h will have stronger dependence of D on Vc than polymers with low h
values. For PET, the value of h obtained from the correlation plot is 9.1 ± 0.9 [9].
Equation 5.15 may be used to predict diffusion coefficients of various other molecules of
interest, such as flavor molecules in PET, whose critical volumes are either known or can
be estimated.
5.4 Conclusions
Equilibrium sorption and uptake kinetics of n-butane and n-pentane in
semicrystalline, biaxially oriented PET films at 35°C are reported. The sorption isotherms
are well described by the dual-mode sorption model. Sorption kinetics are well described
by a model incorporating Fickian diffusion with protracted polymer structural relaxation.
Diffusion coefficients appear to increase with increasing penetrant concentration. The
infinite dilution, estimated amorphous phase diffusion coefficient of n-pentane in BPET
was observed to be more than an order of magnitude lower than that of n-butane at 35°C.
The infinite dilution, estimated amorphous phase solubility of n-butane in BPET is a
factor of two higher than that in APET, due to the presence of higher non-equilibrium
excess volume in BPET (as characterized by CH´).
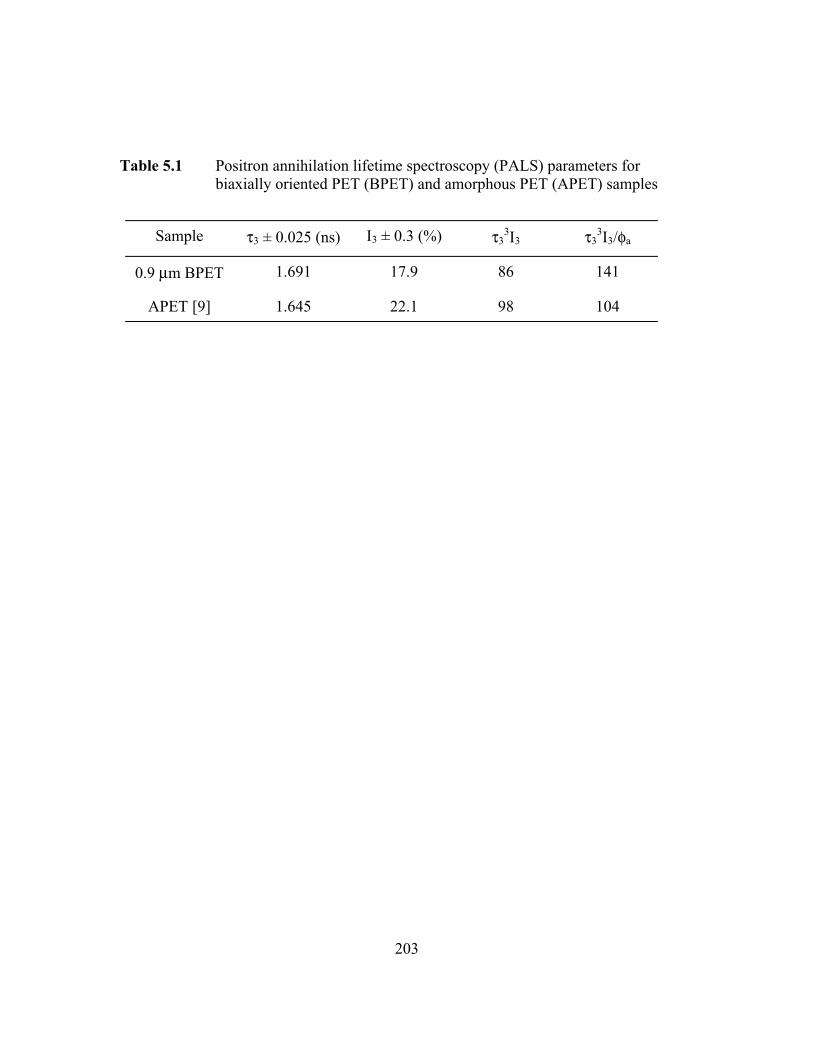
203
Table 5.1 Positron annihilation lifetime spectroscopy (PALS) parameters for biaxially oriented PET (BPET) and amorphous PET (APET) samples
Sample t3 ± 0.025 (ns) I3 ± 0.3 (%) t33I3 t3
3I3/fa
0.9 mm BPET 1.691 17.9 86 141
APET [9] 1.645 22.1 98 104
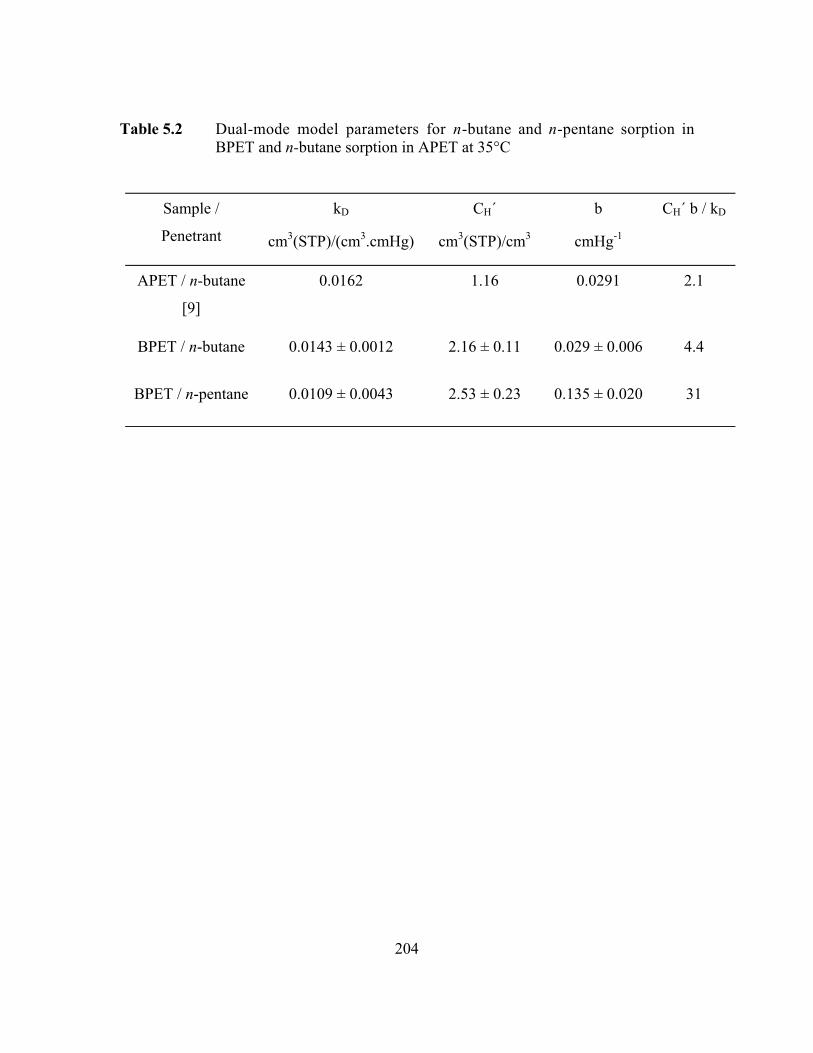
204
Table 5.2 Dual-mode model parameters for n-butane and n-pentane sorption inBPET and n-butane sorption in APET at 35°C
Sample /
Penetrant
kD
cm3(STP)/(cm3.cmHg)
CH´
cm3(STP)/cm3
b
cmHg-1
CH´ b / kD
APET / n-butane
[9]
0.0162 1.16 0.0291 2.1
BPET / n-butane 0.0143 ± 0.0012 2.16 ± 0.11 0.029 ± 0.006 4.4
BPET / n-pentane 0.0109 ± 0.0043 2.53 ± 0.23 0.135 ± 0.020 31
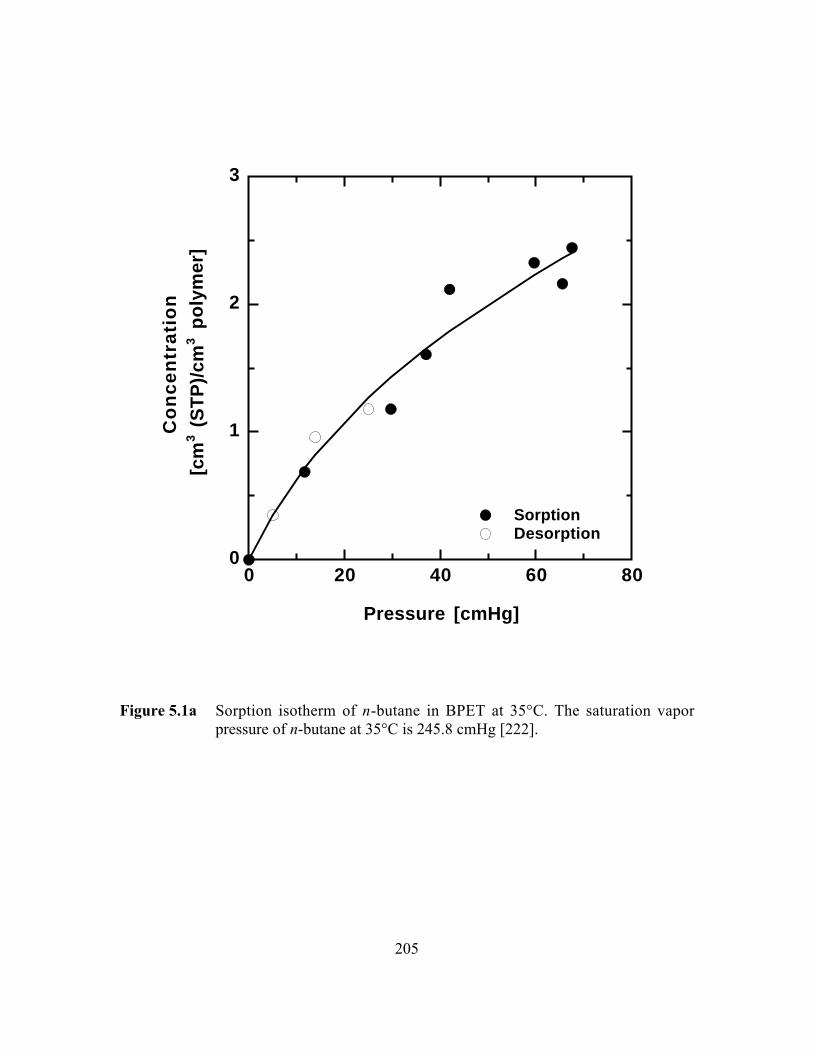
205
0
1
2
3
0 20 40 60 80
Sorption Desorption
Co
nce
ntr
ati
on
[cm
3 (
ST
P)/
cm3 p
olym
er]
Pressure [cmHg]
Figure 5.1a Sorption isotherm of n-butane in BPET at 35°C. The saturation vaporpressure of n-butane at 35°C is 245.8 cmHg [222].
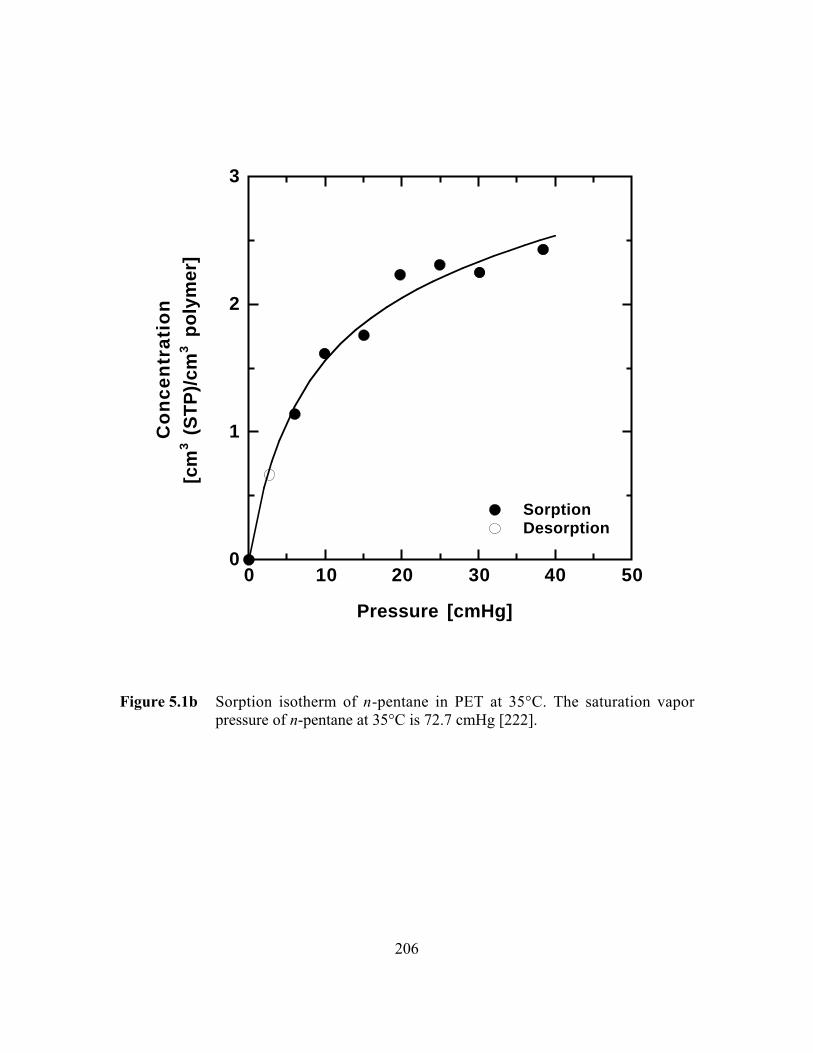
206
0
1
2
3
0 10 20 30 40 50
SorptionDesorption
Co
nce
ntr
ati
on
[cm
3 (
ST
P)/
cm3 p
olym
er]
Pressure [cmHg]
Figure 5.1b Sorption isotherm of n-pentane in PET at 35°C. The saturation vaporpressure of n-pentane at 35°C is 72.7 cmHg [222].
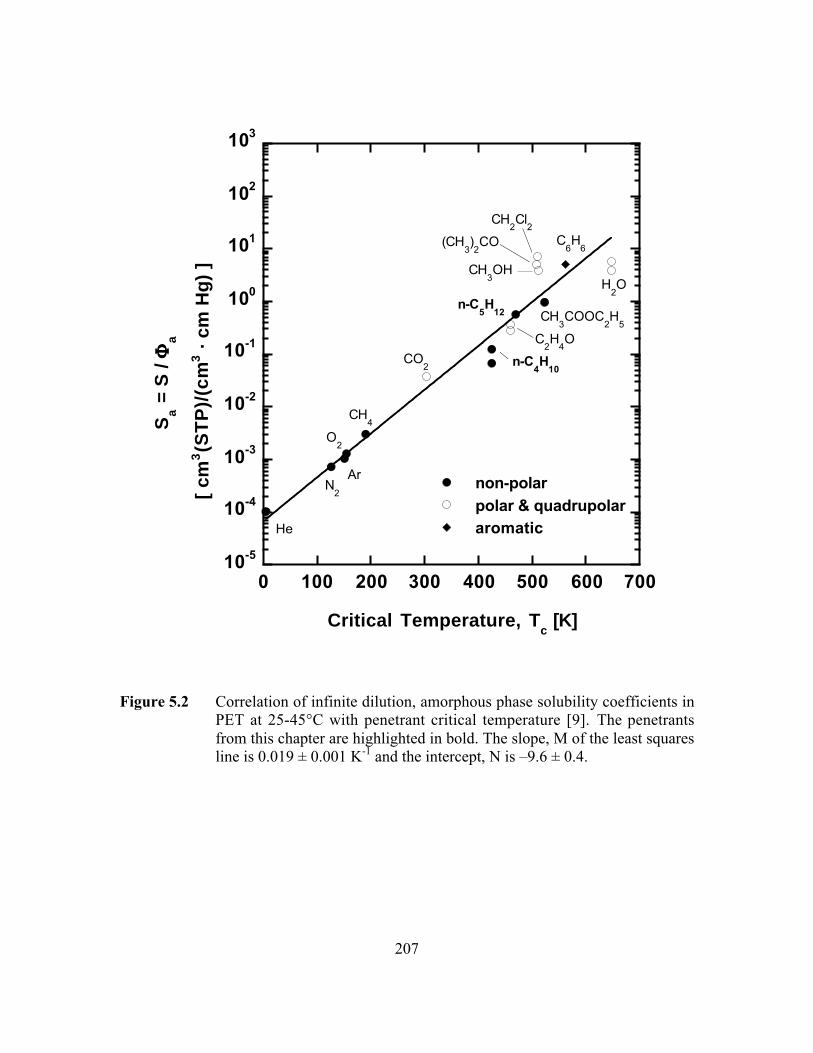
207
10-5
10-4
10-3
10-2
10-1
100
101
102
103
0 100 200 300 400 500 600 700
non-polar
polar & quadrupolararomatic
Sa =
S /
FFFFa
[ cm
3(S
TP
)/(c
m3 ·
cm
Hg)
]
Critical Temperature, Tc [K]
He
Ar
C6H
6
O2
N2
CO2
CH4
n-C4H
10
CH3OH
CH3COOC
2H
5
CH2Cl
2
H2O
C2H
4O
n-C5H
12
(CH3)2CO
Figure 5.2 Correlation of infinite dilution, amorphous phase solubility coefficients inPET at 25-45°C with penetrant critical temperature [9]. The penetrantsfrom this chapter are highlighted in bold. The slope, M of the least squaresline is 0.019 ± 0.001 K-1 and the intercept, N is –9.6 ± 0.4.
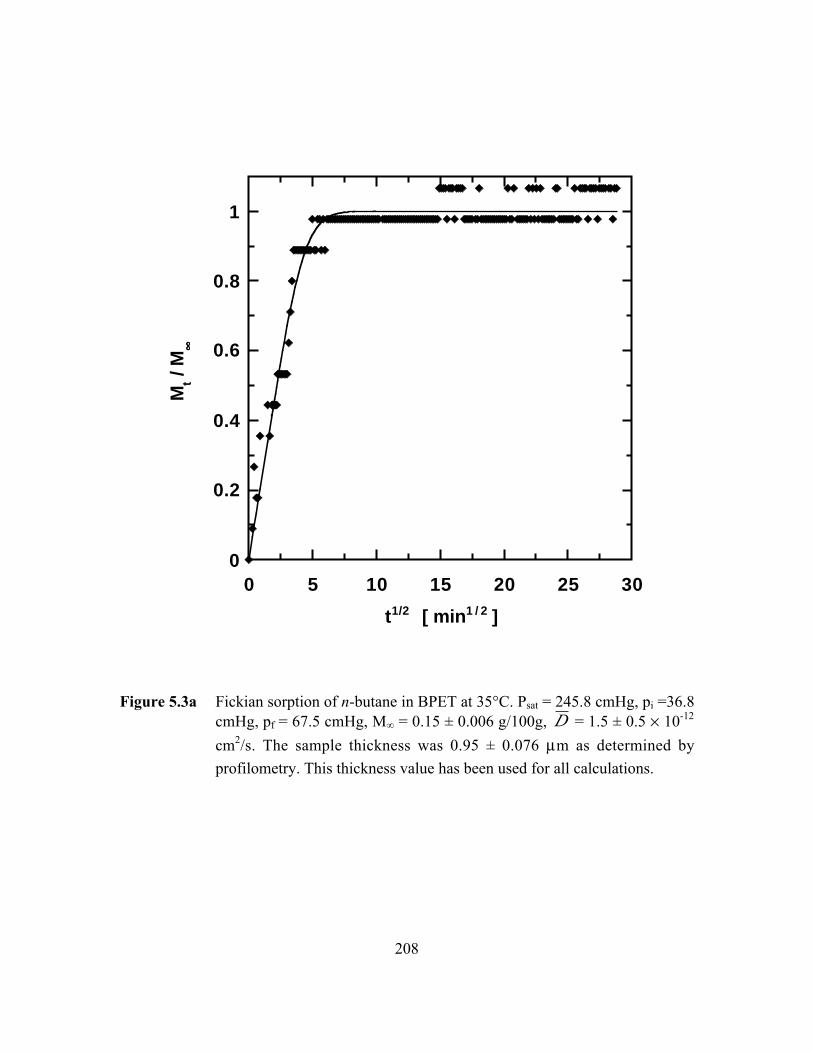
208
0
0.2
0.4
0.6
0.8
1
0 5 10 15 20 25 30
Mt /
M••••
t1/2 [ min 1 / 2 ]
Figure 5.3a Fickian sorption of n-butane in BPET at 35°C. Psat = 245.8 cmHg, pi =36.8cmHg, pf = 67.5 cmHg, M∞ = 0.15 ± 0.006 g/100g, D = 1.5 ± 0.5 ¥ 10-12
cm2/s. The sample thickness was 0.95 ± 0.076 mm as determined by
profilometry. This thickness value has been used for all calculations.

209
0
0.2
0.4
0.6
0.8
1
0 5 10 15 20 25 30
Mt /
M••••
t1 / 2 [ min 1 / 2 ]
Figure 5.3b Non-Fickian sorption of n-butane in BPET at 35°C; Psat = 245.8 cmHg,pi = 11.5 cmHg, pf = 59.6 cmHg, M∞ = 0.43 ± 0.046 g/100g,D = 1.3 ± 0.4 ¥ 10-12 cm2/s, aR = 0.32 ± 0.04, tR = 115 ± 5 min.,
tF = 115 ± 41 min., tD = 74 ± 9 min.

210
0
0.2
0.4
0.6
0.8
1
0 10 20 30 40 50
Mt /
M••••
t1 / 2 [min 1 / 2]
Figure 5.3c Fickian sorption of n-pentane in BPET at 35°C. Psat = 72.7 cmHg, pi = 0cmHg, pf = 14.5 cmHg, M∞ = 0.41 ± 0.007 g/100g, D = 4.8 ± 0.8 ¥ 10-14
cm2/s.
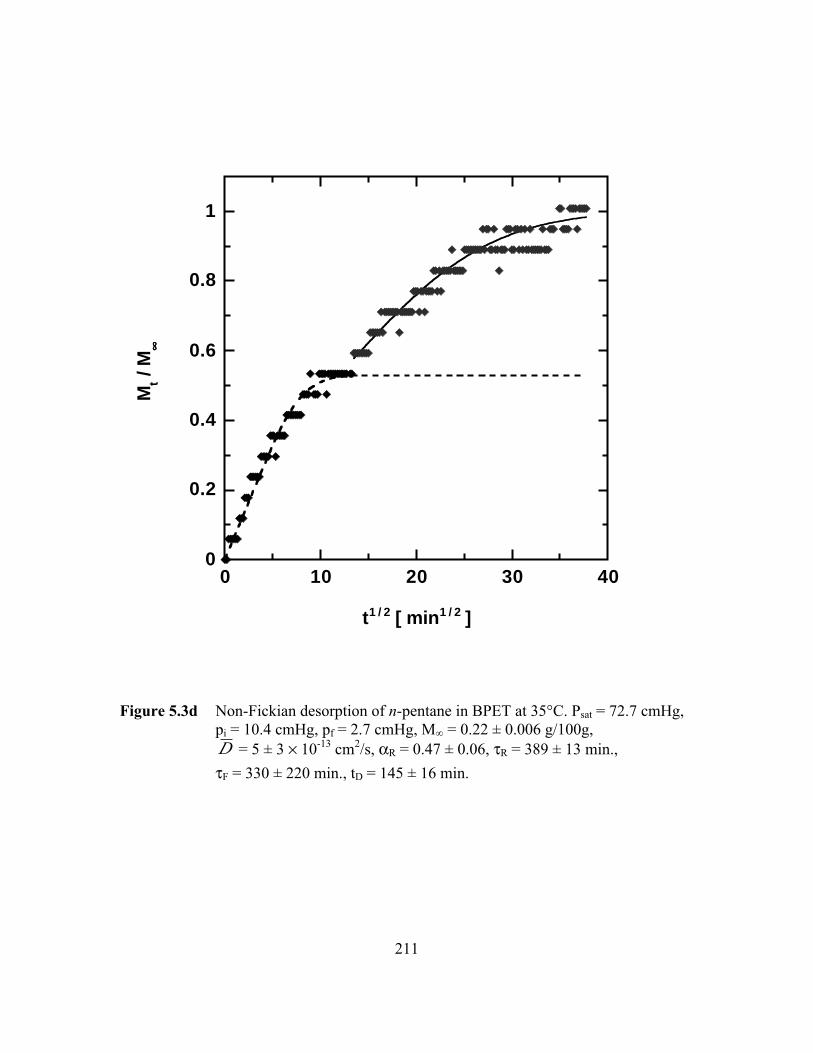
211
0
0.2
0.4
0.6
0.8
1
0 10 20 30 40
Mt /
M••••
t 1 / 2 [ min 1 / 2 ]
Figure 5.3d Non-Fickian desorption of n-pentane in BPET at 35°C. Psat = 72.7 cmHg,pi = 10.4 cmHg, pf = 2.7 cmHg, M∞ = 0.22 ± 0.006 g/100g,D = 5 ± 3 ¥ 10-13 cm2/s, aR = 0.47 ± 0.06, tR = 389 ± 13 min.,
tF = 330 ± 220 min., tD = 145 ± 16 min.
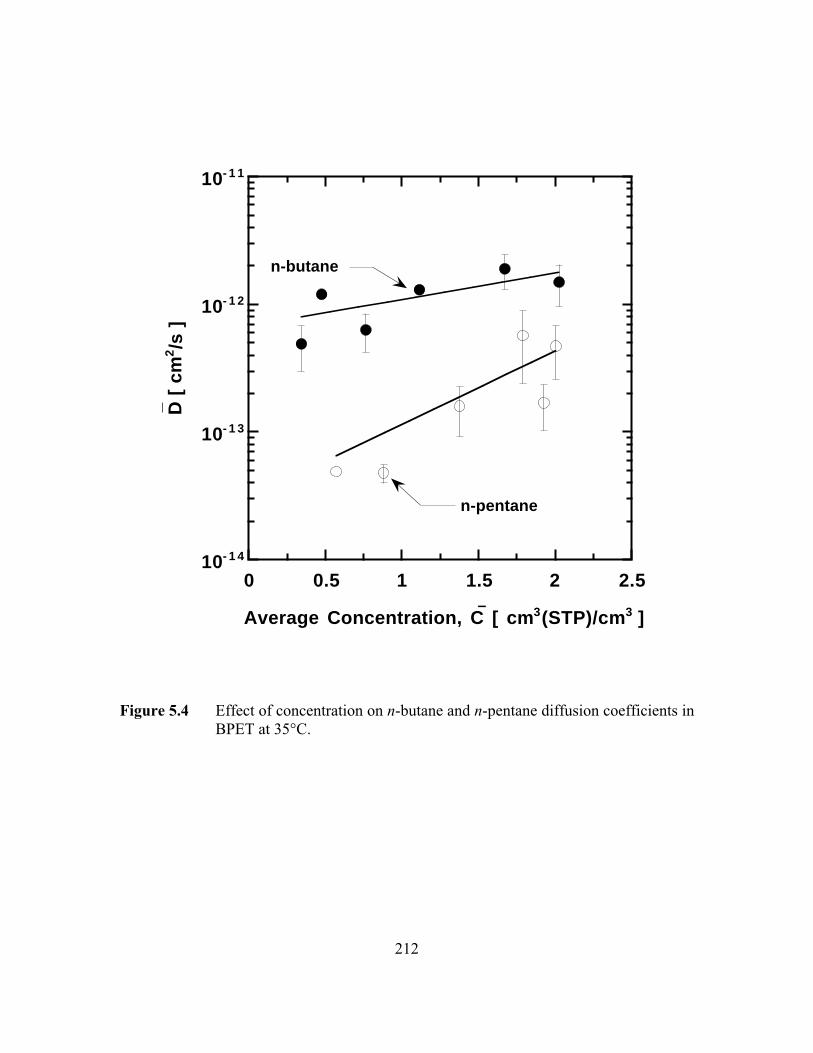
212
10- 1 4
10- 1 3
10- 1 2
10- 1 1
0 0.5 1 1.5 2 2.5
D [
cm
2/s
]
Average Concentration, C [ cm 3(STP)/cm 3 ]
n-butane
n-pentane
-
Figure 5.4 Effect of concentration on n-butane and n-pentane diffusion coefficients inBPET at 35°C.
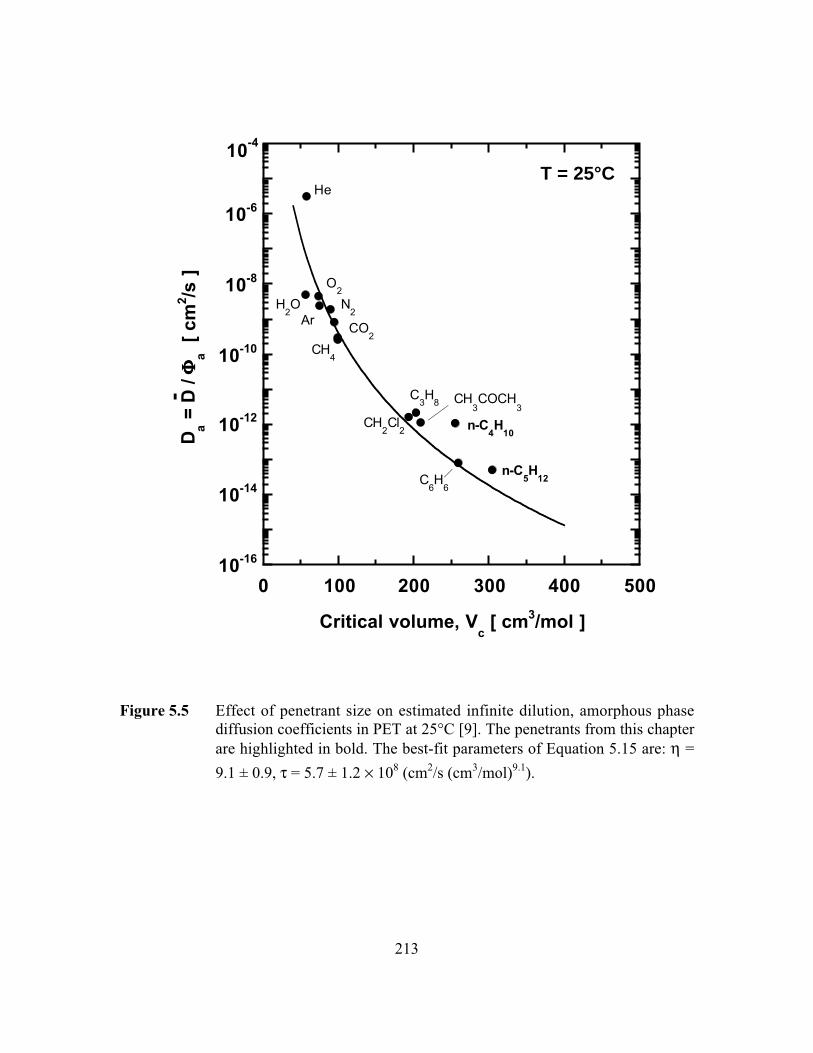
213
10-16
10-14
10-12
10-10
10-8
10-6
0 100 200 300 400 500
Da =
D /
FFFFa
[ cm
2 /s ]
Critical volume, Vc [ cm3/mol ]
-T = 25°C
He
O2
N2
CO2
CH4
H2O
Ar
CH2Cl
2
C3H
8
C6H
6
n-C4H
10
n-C5H
12
10-4
CH3COCH
3
Figure 5.5 Effect of penetrant size on estimated infinite dilution, amorphous phasediffusion coefficients in PET at 25°C [9]. The penetrants from this chapterare highlighted in bold. The best-fit parameters of Equation 5.15 are: h =
9.1 ± 0.9, t = 5.7 ± 1.2 ¥ 108 (cm2/s (cm3/mol)9.1).
214
CHAPTER 6
Sorption and Transport of Linear and Branched
Ketones in Biaxially Oriented
Poly(ethylene terephthalate)
This chapter has been adapted with permission from an article submitted under the same
title to Polymer.
Unpublished work copyright„ 2004 Elsevier.
215
6.1 Summary
This chapter presents results from a kinetic gravimetric sorption study of four
linear and branched ketones, acetone, methyl ethyl ketone (MEK), methyl n-propyl
ketone (MnPK), and methyl i-propyl ketone (MiPK) in uniform, biaxially oriented,
semicrystalline poly(ethylene terephthalate) (BPET) films at 35°C and low penetrant
activity. Chemical structures and relevant physical properties of these ketones are
presented in Table 6.1. This series of penetrants permits a systematic study of the effects
of ketone carbon-chain length and branching on solubility and diffusivity. Sorption
isotherms for all penetrants are well described by the dual-mode sorption model. Sorption
and desorption kinetics are described either by Fickian diffusion or a two-stage model
incorporating Fickian diffusion at short times and protracted polymer structural relaxation
at long times. Diffusion coefficients and equilibrium solubility at fixed relative pressure
decrease in the following order:
acetone > MEK > MnPK > MiPK
Diffusion coefficients for each penetrant increases with increasing penetrant
concentration.
6.2 Experimental
6.2.1 Materials
Biaxially oriented PET films having a uniform nominal thickness of 0.9 µm were
purchased from the Goodfellow Co. (Berwyn, PA) and used as received. The film
density, 1.395 g/cm3, was furnished by the supplier. The complete details of sample
216
characterization techniques and corresponding results and discussion were presented
earlier in Chapter 3. High-performance liquid chromatographic (HPLC) grade acetone
(99.9% purity), MEK (99.5% purity), MnPK (99.5% purity), and MiPK (99% purity)
were purchased from Sigma-Aldrich Corp. (St. Louis, MO). The liquid penetrants were
subjected to several freeze-thaw cycles to remove dissolved gases before use.
6.2.2 Gravimetric Sorption
Interval kinetic gravimetric sorption experiments were performed using a
traditional McBain spring balance system, as described in Chapter 3 (cf. Section 3.2 in
Chapter 3). The quartz springs were supplied by Ruska Industries (Houston, TX).
6.3 Results and Discussion
6.3.1 Equilibrium Uptakes of Ketones in PET
Interval kinetic gravimetric sorption experiments were used to determine sorption
isotherms of acetone, MEK, MnPK, and MiPK in BPET at 35°C. The results are
presented in Figure 6.1 and, at constant pressure, solubility in BPET at 35°C increases in
the following order: acetone < MEK ª MiPK < MnPK. All isotherms are concave to the
pressure axis and are well described by the dual-mode sorption model [18]:
C k p Cbp
bpD H= + ¢+
ÊËÁ
ˆ¯̃1
(6.1)
where kD is the Henry’s Law coefficient, CH´ is the Langmuir capacity parameter, a
measure of the sorption capacity in the non-equilibrium excess volume of the glassy
217
polymer, and b is the Langmuir affinity parameter, a measure of the penetrant’s affinity
for the Langmuir sites. The curves in Figure 6.1 represent least-square fits of the
experimental sorption data to Equation 6.1.
The dual-mode model parameters obtained in this study are recorded in Table 6.2
alongside the dual-mode model parameters obtained by McDowell et al. for acetone
sorption in semicrystalline, unoriented PET (SPET) [27]. Acetone sorption isotherms in
BPET and SPET at 35°C are presented in Figure 6.2. Acetone solubility in SPET is
significantly higher than BPET at 35°C even though the crystallinity values of SPET (40
vol. %) and BPET (39 vol. %) are very similar. Assuming that no sorption occurs in the
crystalline phase, the differences in acetone uptake should be due to differences in the
morphology of the non-crystalline regions of the samples. The BPET sample was
produced in a melt phase drawing process that strongly orients the polymer chains
whereas SPET was prepared via solvent casting, which should introduce little or no
orientation. These differences in processing histories likely lead to different
morphologies of the non-crystalline phases and these differences are reflected in the
density values of oriented BPET (1.395 g/cm3) and unoriented SPET (1.373 g/cm3). The
detailed effects of morphology, orientation, and crystallinity on the sorption and transport
properties of PET are complex. Such effects have been noted by many investigators, and
they have been and continue to be the subject of active research [10,13,16,24,71-
73,75,77,187,220,229-235]. Several studies report that the sample processing history
affects morphology of both the crystalline and non-crystalline phases and that these
morphological differences can manifest themselves in the sorption and transport
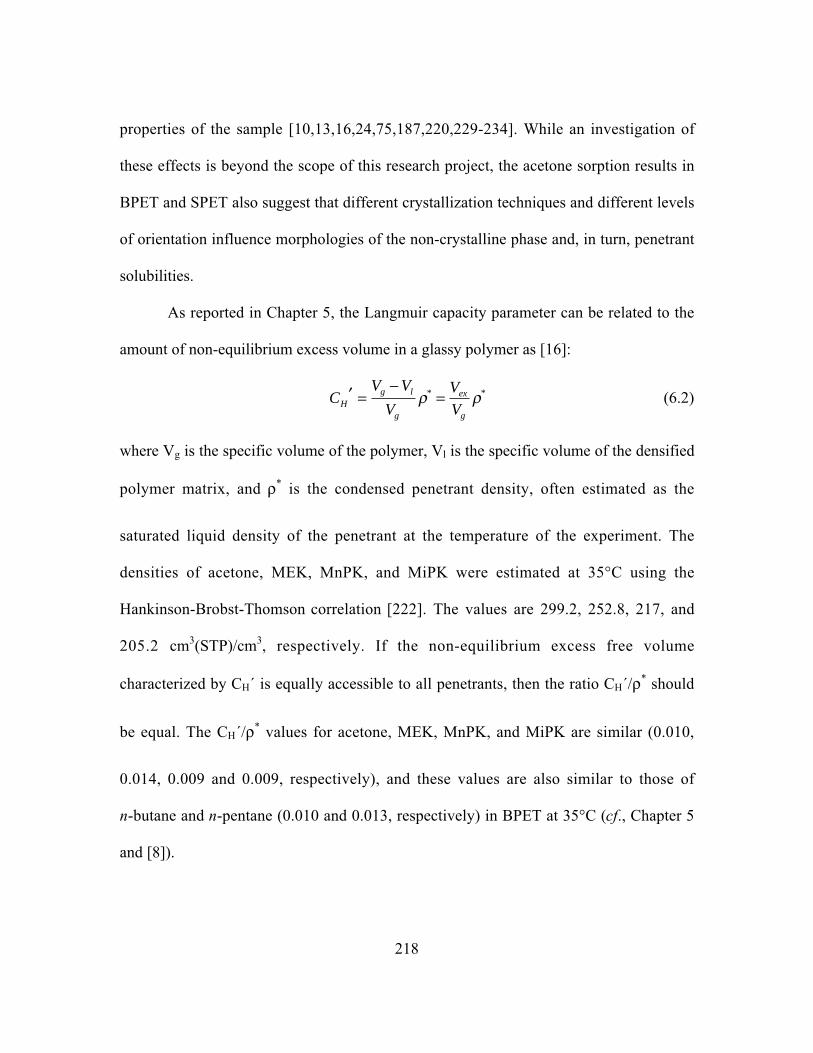
218
properties of the sample [10,13,16,24,75,187,220,229-234]. While an investigation of
these effects is beyond the scope of this research project, the acetone sorption results in
BPET and SPET also suggest that different crystallization techniques and different levels
of orientation influence morphologies of the non-crystalline phase and, in turn, penetrant
solubilities.
As reported in Chapter 5, the Langmuir capacity parameter can be related to the
amount of non-equilibrium excess volume in a glassy polymer as [16]:
CV V
V
V
VHg l
g
ex
g
¢ =-
=r r* * (6.2)
where Vg is the specific volume of the polymer, Vl is the specific volume of the densified
polymer matrix, and r* is the condensed penetrant density, often estimated as the
saturated liquid density of the penetrant at the temperature of the experiment. The
densities of acetone, MEK, MnPK, and MiPK were estimated at 35°C using the
Hankinson-Brobst-Thomson correlation [222]. The values are 299.2, 252.8, 217, and
205.2 cm3(STP)/cm3, respectively. If the non-equilibrium excess free volume
characterized by CH´ is equally accessible to all penetrants, then the ratio CH´/r* should
be equal. The CH´/r* values for acetone, MEK, MnPK, and MiPK are similar (0.010,
0.014, 0.009 and 0.009, respectively), and these values are also similar to those of
n-butane and n-pentane (0.010 and 0.013, respectively) in BPET at 35°C (cf., Chapter 5
and [8]).
219
Figure 6.3 presents the solubility of acetone, MEK, MnPK, MiPK, and other
literature data for PET as a function of critical temperature. This solubility correlation
plot was previously reported in Chapter 5. The solubility values reported in this figure
have been adjusted to an amorphous basis using the following approximate relation [10]:
SS
aa
=f
(6.3)
where S is penetrant solubility and fa is the amorphous phase volume fraction. This
relation should be regarded as a first approximation, as discussed in Chapter 5. In
general, for the organic vapor sorption data in Figure 6.3, infinite-dilution solubility
values were obtained by extrapolating the reported solubility values to zero concentration
[9]. However, because of the scatter in the data at low activity for MEK, MnPK, and
MiPK, we did not attempt to compute infinite-dilution solubilities. For these penetrants,
the solubility coefficients are reported at an arbitrarily chosen activity (P/Psat, where Psat
is the saturation vapor pressure of the penetrant, and P is the penetrant pressure in the gas
phase contiguous to the polymer sample) of 0.1 in Figure 6.3. As shown, the logarithm of
solubilities increases rather systematically and linearly with Tc. While the general trend is
observed, there is noticeable scatter in the data, some of which is likely due to the
approximate nature of Equation 6.3. Also, the literature data for some penetrants
(methanol, ethyl acetate, and water) were not available at infinite dilution [9], and
penetrant solubility is expected to be a function of penetrant activity in PET. While it is
difficult to draw definitive conclusions, the solubilities of ketones and many of the other
polar penetrants appear to exhibit a positive deviation from the correlation line. This
220
effect would be even more pronounced if the solubilities of these penetrants were
reported at lower activities since solubility increases with decreasing activity (cf. Figure
6.4). This trend may reflect favorable interactions between polar penetrants and the polar
PET matrix, and this effect will be explored in more detail below.
In order to account for penetrant condensability and to study the effect of
penetrant-polymer interactions on solubility, the sorption isotherms are re-plotted as a
function of activity or relative pressure, P/Psat. In a previous study with linear alkanes (cf.,
Chapter 5 and [8]), which are not expected to exhibit any specific interactions with PET,
this transformation produced a common isotherm for the two penetrants. As shown in
Figure 6.4, in contrast to the behavior of alkanes, this procedure does not collapse the
sorption isotherms for the ketones to a single curve. At relative pressure values greater
than approximately 0.1 or so, penetrant concentration in BPET increases as follows:
MiPK < MnPK < MEK < acetone. This trend, which is almost the opposite of the ranking
of isotherms based on pressure (Figure 6.1), is consistent with the difference between the
penetrant solubility parameters and the solubility parameter of PET (cf. Table 6.1).
Typically one would expect the solubility to decrease as the square of the difference
between the polymer and penetrant solubility parameters increases [236,237]. Based on
this analysis, at constant relative pressure, penetrant solubility should decrease in the
observed order. These results are also qualitatively consistent with several literature
studies reporting that ketone solubility in polar liquids (e.g., methanol and water)
decreases as the ketone chain length increases [238-240].
221
Sorption isotherms for MEK and n-butane and MnPK and n-pentane were
compared in order to study the effect of the polar carbonyl group on solubility of
penetrants with the same number of carbon atoms (C4 and C5, respectively) and a similar
carbon skeleton. These comparisons are presented in Figures 6.5a and 6.5b, which
display uptake as a function of penetrant relative pressure. At constant relative pressure,
the solubility coefficients of MEK and MnPK are significantly higher than those of
n-butane and n-pentane, respectively. The solubility parameters of polar MEK and MnPK
are more similar to that of PET, which is a polar polymer, than those of the nonpolar
alkane analogs, which supports the notion that the polar ketones should be more soluble
than their alkane analogs. Similar solubility trends have been observed with ketones and
alkanes in polar liquids such as methanol and water [241,242].
6.3.2 Sorption Kinetics of Ketones in PET
Figures 6.6(a-c) present results from three representative kinetic sorption
experiments in BPET at 35°C. In each case, the fractional mass uptake Mt / M∞ increases
linearly with t1/2 for short times. This behavior is characteristic of sorption kinetics
controlled by Fickian diffusion (see, for example, Figures 6.6b, 6.6c and the dotted curve
in Figure 6.6a). At longer times, however, the fractional mass uptake may exhibit a
protracted, asymptotic approach towards equilibrium [224] (see, for example, the solid
curve in Figure 6.6a). This behavior is ascribed to mass uptake kinetics limited by
polymer swelling and structural rearrangement to accommodate the penetrant rather than
Fickian diffusion, as discussed in Chapter 5.
222
In this study, similar non-Fickian kinetic behavior was also observed in vapor
desorption experiments (see, for example, Figures 6.7(a-c)). Non-Fickian desorption has
been reported for a number of glassy polymer/condensable vapor systems [8,225,243-
247]. Typical observations include a rapid initial desorption stage, where the mass
removal rate is proportional to t1/2, consistent with Fickian transport, followed by a
protracted second stage. For example, Patton et al. reported such behavior for benzene
desorption from a thin (2.5 µm) PET film at 50°C [225]. This effect was also reported by
Crank and Park for chloroform [246] desorption from polystyrene at 25°C and for
methylene chloride [248] desorption from polystyrene. Striking examples of such
behavior were observed by Wang et al. for benzene and hexane vapor desorption from a
very rigid, aromatic polyimide [243]. Drechsel et al. reported similar desorption kinetics
for acetone removal from cellulose nitrate [247], and Downes and Mackay reported such
kinetics for water vapor desorption from wool fibers [249].
The discussion of the cause of non-Fickian desorption behavior focuses on several
explanations that are probably not mutually exclusive. Crank [250] proposed a model
wherein the diffusion coefficient depended on time in an effort to capture history-
dependent phenomena (such as penetrant induced rearrangement of the polymer chain
segments or slow molecular relaxation of the polymer (i.e., deswelling) as the penetrant is
removed during desorption) that could influence diffusion coefficients. The effect of
stresses generated as a result of the concentration profile present during desorption on the
rate of mass uptake has also been invoked as a possible contributing factor to observed
non-Fickian desorption [248,249,251]. In an extreme example of the impact of stresses

223
on desorption, Rosen reports actual tensile microfracture (i.e., crazing) upon removal of
water from phenol-formaldehyde resins [252]. Perhaps closely related to this line of
reasoning is the work by Crank suggesting that the presence of a skin region, where
penetrant has been removed and which has a very low diffusion coefficient relative to
that in the more swollen, solvent-rich regions of a sample, can lead to the types of
desorption kinetics that have been reported [250]. While a detailed molecular explanation
of this phenomenon is lacking, it is clear that two stage, non-Fickian desorption is
observed in many different polymer/penetrant systems.
In the present study, the non-Fickian sorption and desorption kinetics have been
described using the following empirical model [8]:
M
M n
D n t
l
t tH tt
Rn
RD
RD
• =
•
= - -+
- +ÊËÁ
ˆ¯̃
ÏÌÓ
¸˝˛
+ ¥- -Ê
ËÁˆ¯̃
¥ ( )Â1 18 1
2 12 1
2 2
2 2
20
( )( )
exp( )
exp( )a
pp a
t(6.4)
where D is the average diffusion coefficient, l is polymer film thickness, aR is the
fraction of weight uptake (or weight desorbed) occurring during the protracted, non-
Fickian approach to equilibrium, tR is the time constant associated with the long time
drift in mass uptake (or mass desorbed), tD is a delay factor accounting for a delay in the
beginning of structural relaxation, and H(tD) is the Heaviside unit step function [253].
The curves in Figure 6.6a and Figures 6.7(a-c) present least-squares fits of
Equation 6.4 to the experimental data for sorption of acetone and desorption of MEK,
MiPK, and MnPK in BPET at 35°C, respectively, following the procedure described
earlier in Chapter 5 [8]. In Figure 6.6a, the dotted curve indicates the fraction of mass
uptake controlled by Fickian diffusion, whereas the solid curve indicates the fraction

224
controlled by polymer chain relaxation. The time to reach half of the total mass uptake by
Fickian diffusion is given by:
tl
DF
1 2
2
20 20/ = =t
(6.5)
where tF is the characteristic timescale for diffusion, defined as l2/ D .
Average diffusion coefficients were estimated as described previously [8]. In
previous studies of n-butane and n-pentane [8] as well as acetone diffusion in PET [27], a
distinct plateau in the mass uptake kinetic profile was observed in all experiments. In this
study, distinct plateaus were observed at intermediate times during the mass uptake
profiles of acetone, and these plateaus served as a clear demarcation of the transition
from Fickian diffusion to polymer structural relaxation. Hence, the value of fractional
mass uptake at the plateau can be set equal to (1-aR). However, for other penetrants in
this study, such plateau regions were not clearly observed for all experiments (see, for
example, Figures 6.7(a-c)). In such cases, aR could not be determined from a qualitative
examination of the data. The aR values were determined by an iterative procedure using
an algorithm described in the literature [21].
Figure 6.8 presents the diffusion coefficients of acetone, MEK, MnPK, and MiPK
in BPET as a function of average penetrant concentration. The average penetrant
concentration was defined as follows:
CC Ci f=
+2
(6.6)
225
where Ci and Cf are the penetrant concentrations at the beginning and end of the sorption
experiment, respectively. For all penetrants, the logarithm of diffusion coefficient
increases approximately linearly with penetrant concentration, consistent with earlier
studies with n-alkanes in BPET (cf. Chapter 5). The following empirical model was used
to characterize the concentration dependence [8]:
D D C= • exp( )w (6.7)
where D∞ is the infinite-dilution diffusion coefficient and the slope, w, characterizes the
dependence of D on C . D∞ and w values for acetone, MEK, MnPK and MiPK are
shown in Table 6.3. On the basis of w values in Table 6.3, over the penetrant
concentration range considered, the dependence of D on C is similar for all the
penetrants studied. The fraction of penetrant sorption due to polymer relaxation, aR, and
chain relaxation constant, tR, did not exhibit systematic trends with increasing penetrant
concentration.
The infinite-dilution, estimated amorphous phase diffusion coefficient of acetone
in BPET is approximately an order of magnitude lower than the corresponding value in
SPET, which was 2.3 ¥ 10-11 cm2/s at 35°C [27]. The effects of processing history on
morphology and of morphology on diffusion coefficients are complex. In fact, the
situation is likely to be more complex for diffusion than for sorption because the kinetics
of the diffusion process are expected to be affected by the spatial arrangement of the
various domains, while solubility, which is an equilibrium (or in the case of a glassy
226
polymer a quasi-equilibrium) property is not. For example, it is well known [4] that the
orientation and aspect ratios of the impermeable phases affect penetrant flux. Thus,
penetrant diffusion coefficients are expected to be affected by not only the amount of
crystallinity, but also the morphology of the non-crystalline regions and the larger scale
geometry and spatial distribution of these regions. Again, a study of these effects is
outside the scope of this work, but the differences between the diffusion coefficients of
acetone in BPET and SPET are in qualitative agreement with other studies reporting the
effect of orientation on diffusion coefficients of organic vapors and liquids in amorphous
and semicrystalline PET [13,20,23,75,230,232,234]. These results suggest that the
orientation of PET can lead to more efficient chain packing, thereby reducing the overall
free volume and diffusion coefficients.
As demonstrated in Chapter 5, penetrant diffusion coefficients generally decrease
with increasing penetrant size. The infinite-dilution, estimated amorphous phase diffusion
coefficients of ketones in BPET decrease with increasing penetrant size from acetone to
MiPK, as shown in Figure 6.9. The infinite-dilution, estimated amorphous phase
diffusion coefficients in PET may be roughly correlated with critical volume using the
following empirical power law model [8]:
DVa
c
=t
h (6.8)
where t and h are adjustable parameters.
Since the diffusion coefficients of the four ketones from the present study were
obtained at 35°C, they were adjusted to 25°C using the procedure described in the
227
literature [9]. The correlation of D with Vc is good for relatively linear penetrants, such as
acetone, MEK, and MnPK. However, the diffusion coefficient of MiPK is approximately
an order of magnitude lower than the value anticipated by this simple empirical model.
This result is not particularly surprising because critical volume cannot accurately capture
the effect of penetrant shape on diffusion coefficients and MiPK, being a branched
molecule, is expected to present a larger cross-section for diffusion than linear molecules
in the same series of penetrants [9].
6.4 Conclusions
Equilibrium sorption and uptake kinetics of acetone, MEK, MnPK, and MiPK in
biaxially oriented, semicrystalline PET films at 35°C have been reported. Sorption
isotherms for all penetrants are well described by the dual-mode sorption model. At
constant relative pressure, penetrant solubility increases in the order: MiPK < MnPK <
MEK < acetone. Solubility of polar ketones in BPET is approximately two times higher
than that of non-polar alkanes having the same number of carbon atoms and a similar
carbon skeleton. These results are consistent with the differences between the solubility
parameters of the penetrants and PET. Similar solubility trends have also been observed
for ketones and alkanes in polar liquids. Sorption and desorption kinetics in PET are
described by a two-stage model incorporating Fickian diffusion at short times and
protracted polymer structural relaxation at long times. Diffusion coefficients also increase
in the order: MiPK < MnPK < MEK < acetone, and the diffusion coefficients for each
penetrant increase with increasing penetrant concentration.
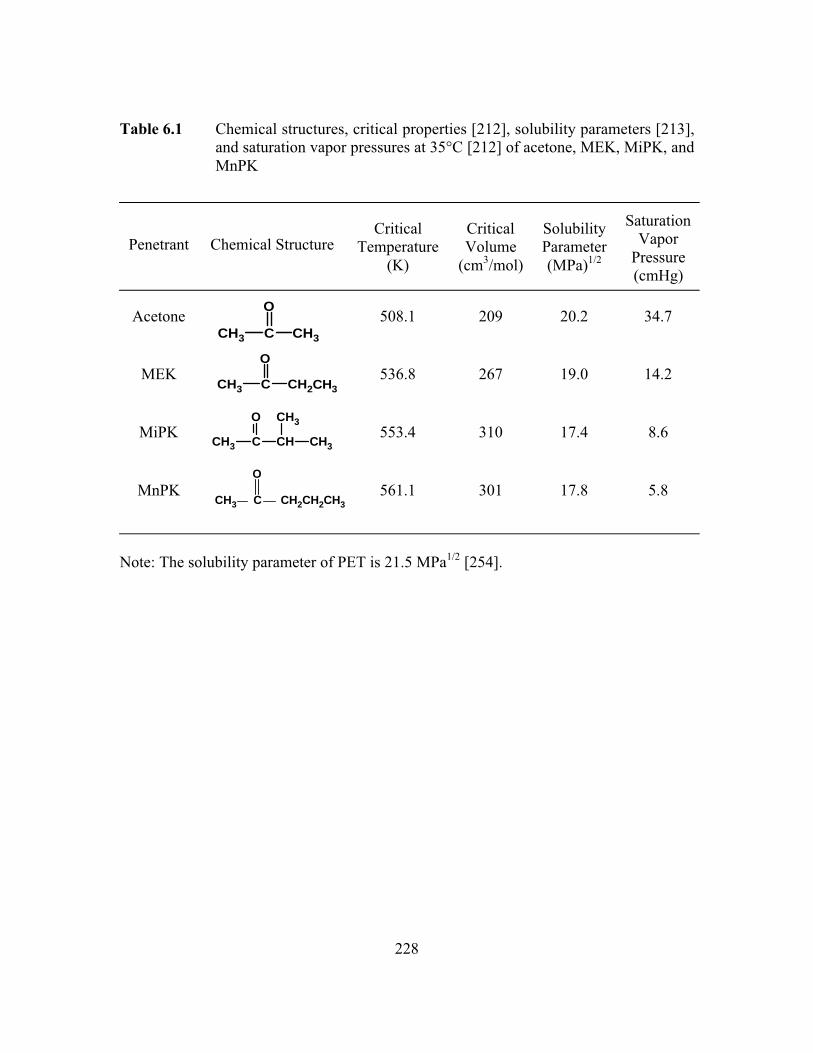
228
Table 6.1 Chemical structures, critical properties [212], solubility parameters [213],and saturation vapor pressures at 35°C [212] of acetone, MEK, MiPK, andMnPK
Penetrant Chemical StructureCritical
Temperature(K)
CriticalVolume
(cm3/mol)
SolubilityParameter(MPa)1/2
SaturationVapor
Pressure(cmHg)
Acetone 508.1 209 20.2 34.7
MEK 536.8 267 19.0 14.2
MiPK 553.4 310 17.4 8.6
MnPK 561.1 301 17.8 5.8
Note: The solubility parameter of PET is 21.5 MPa1/2 [254].
CH3 C
O
CH3
CH3 C
O
CH2CH3
CH3 C
O
CH
CH3
CH3
O
CH3 C CH2CH2CH3

229
Table 6.2 Dual-mode model parameters for acetone, MEK, MiPK, and MnPKsorption in BPET and acetone sorption in solvent-cast PET (SPET) [27] at35°C
Sample /
Penetrant
kD
cm3(STP)/(cm3.cmHg)
CH´
cm3(STP)/cm3
b
cmHg-1
CH´ b / kD
SPET / acetone 0.8 7.2 0.66 5.9
BPET / acetone 0.43 ± 0.01 3.1 ± 0.06 0.6 ± 0.03 4.5
BPET / MEK 0.53 ± 0.02 3.4 ± 0.04 2.2 ± 0.1 14
BPET / MiPK 0.85 ± 0.02 1.8 ± 0.02 16 ± 2 33
BPET / MnPK 1.4 ± 0.07 2.0 ± 0.02 20 ± 1 29
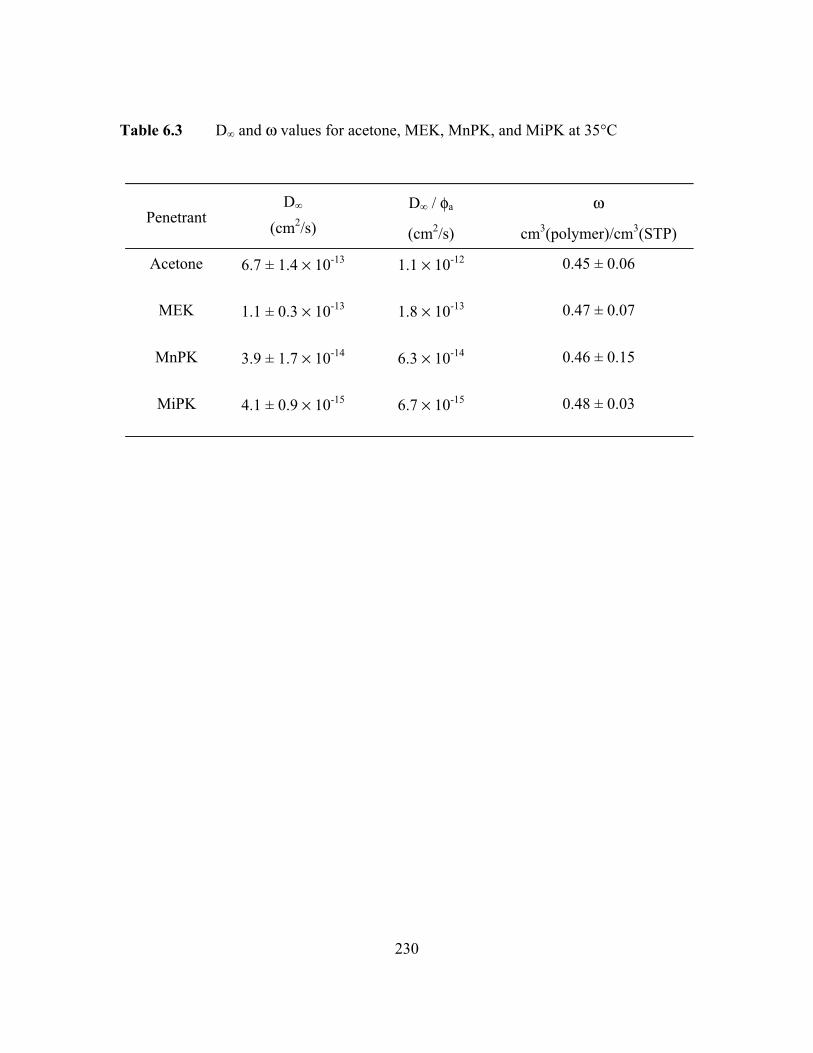
230
Table 6.3 D∞ and w values for acetone, MEK, MnPK, and MiPK at 35°C
PenetrantD∞
(cm2/s)
D∞ / fa
(cm2/s)
w
cm3(polymer)/cm3(STP)
Acetone 6.7 ± 1.4 ¥ 10-13 1.1 ¥ 10-12 0.45 ± 0.06
MEK 1.1 ± 0.3 ¥ 10-13 1.8 ¥ 10-13 0.47 ± 0.07
MnPK 3.9 ± 1.7 ¥ 10-14 6.3 ¥ 10-14 0.46 ± 0.15
MiPK 4.1 ± 0.9 ¥ 10-15 6.7 ¥ 10-15 0.48 ± 0.03
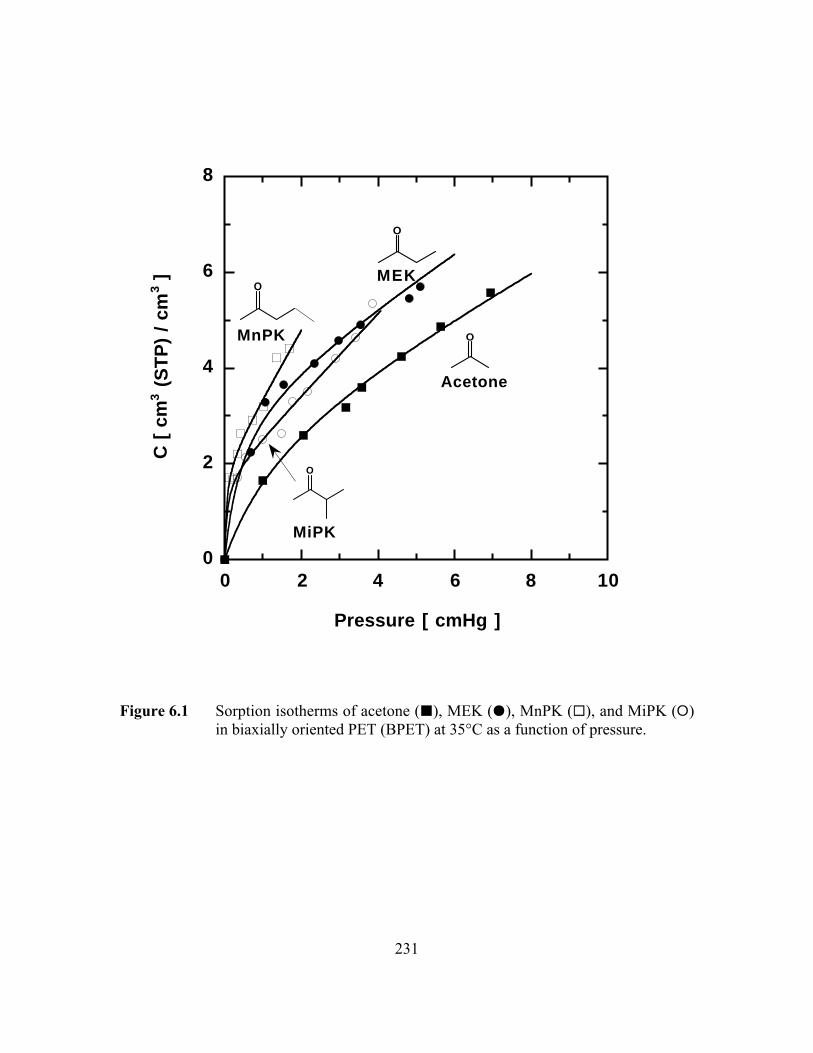
231
0
2
4
6
8
0 2 4 6 8 10
C [
cm
3 (
ST
P)
/ cm
3 ]
Pressure [ cmHg ]
Acetone
O
O
MEK
O
MiPK
O
MnPK
Figure 6.1 Sorption isotherms of acetone (B), MEK (J), MnPK (G), and MiPK (E)in biaxially oriented PET (BPET) at 35°C as a function of pressure.
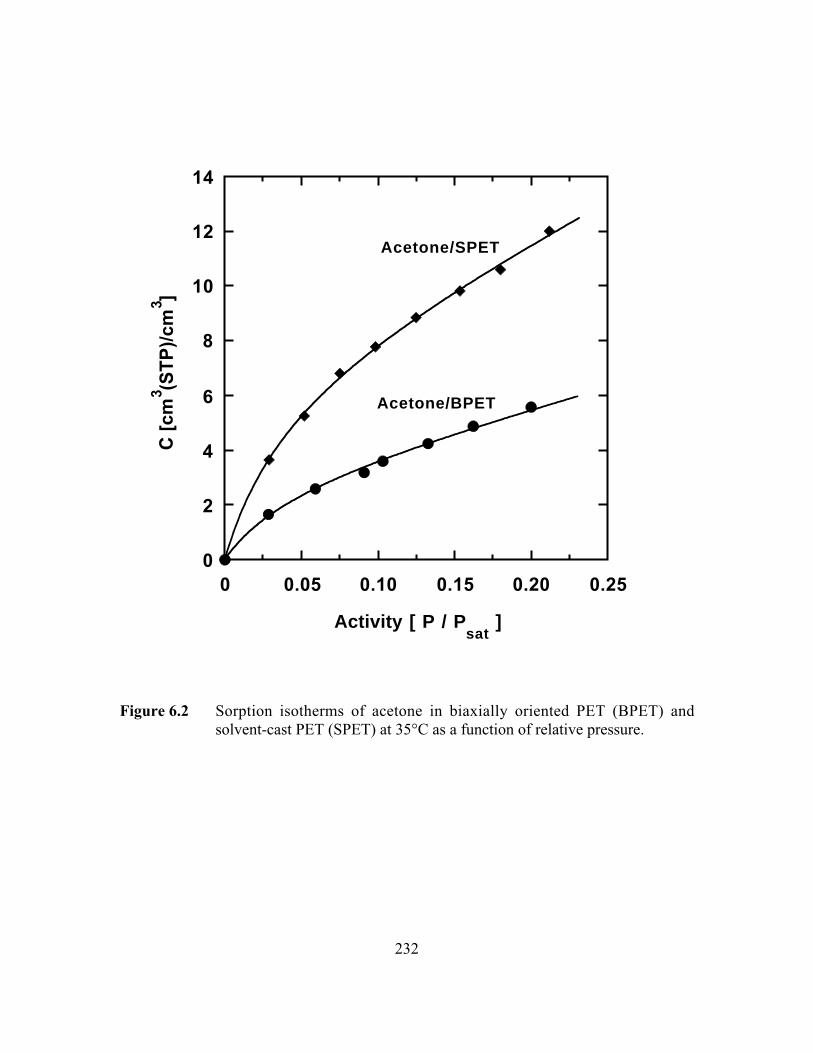
232
0
2
4
6
8
10
12
14
0 0.05 0.10 0.15 0.20 0.25
C [
cm3 (S
TP
)/cm
3 ]
Activity [ P / Psat
]
Acetone/BPET
Acetone/SPET
Figure 6.2 Sorption isotherms of acetone in biaxially oriented PET (BPET) andsolvent-cast PET (SPET) at 35°C as a function of relative pressure.
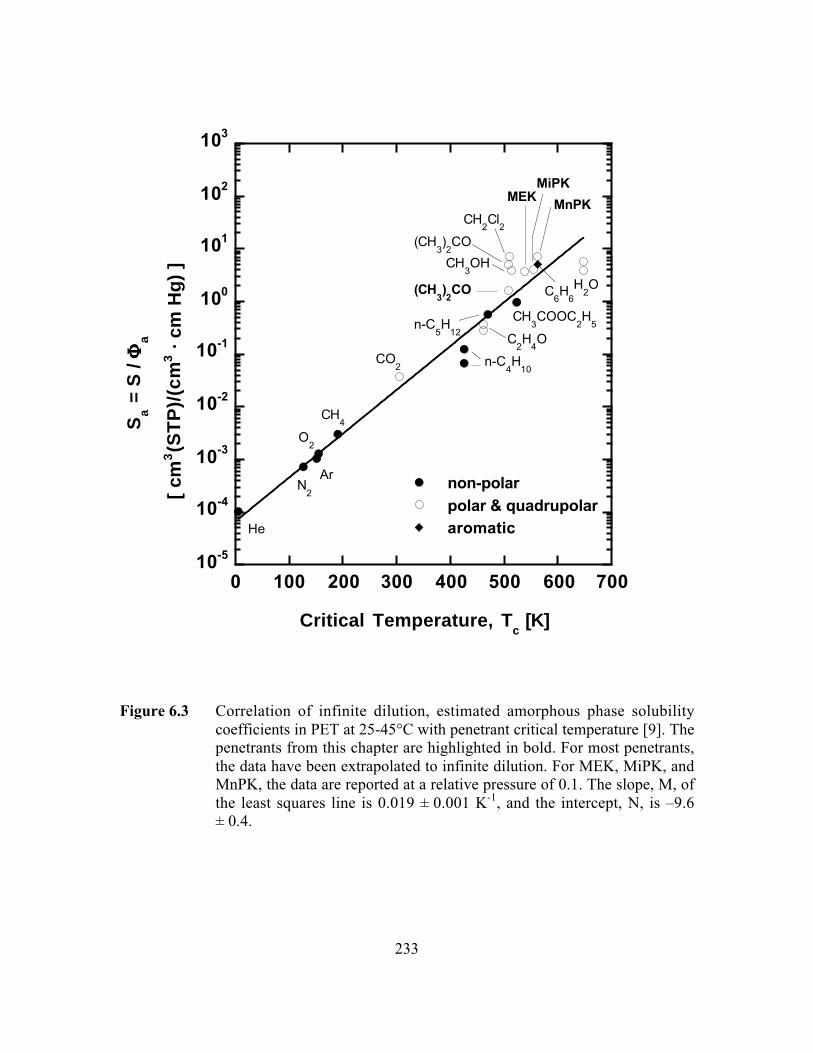
233
10-5
10-4
10-3
10-2
10-1
100
101
102
103
0 100 200 300 400 500 600 700
non-polar
polar & quadrupolararomatic
Sa =
S /
FFFFa
[ cm
3(S
TP
)/(c
m3 ·
cm
Hg)
]
Critical Temperature, Tc [K]
He
Ar
C6H
6
O2
N2
CO2
CH4
n-C4H
10
CH3OH
CH3COOC
2H
5
CH2Cl
2
H2O
C2H
4O
n-C5H
12
(CH3)2CO
MEKMiPK
MnPK
(CH3)2CO
Figure 6.3 Correlation of infinite dilution, estimated amorphous phase solubilitycoefficients in PET at 25-45°C with penetrant critical temperature [9]. Thepenetrants from this chapter are highlighted in bold. For most penetrants,the data have been extrapolated to infinite dilution. For MEK, MiPK, andMnPK, the data are reported at a relative pressure of 0.1. The slope, M, ofthe least squares line is 0.019 ± 0.001 K-1, and the intercept, N, is –9.6± 0.4.
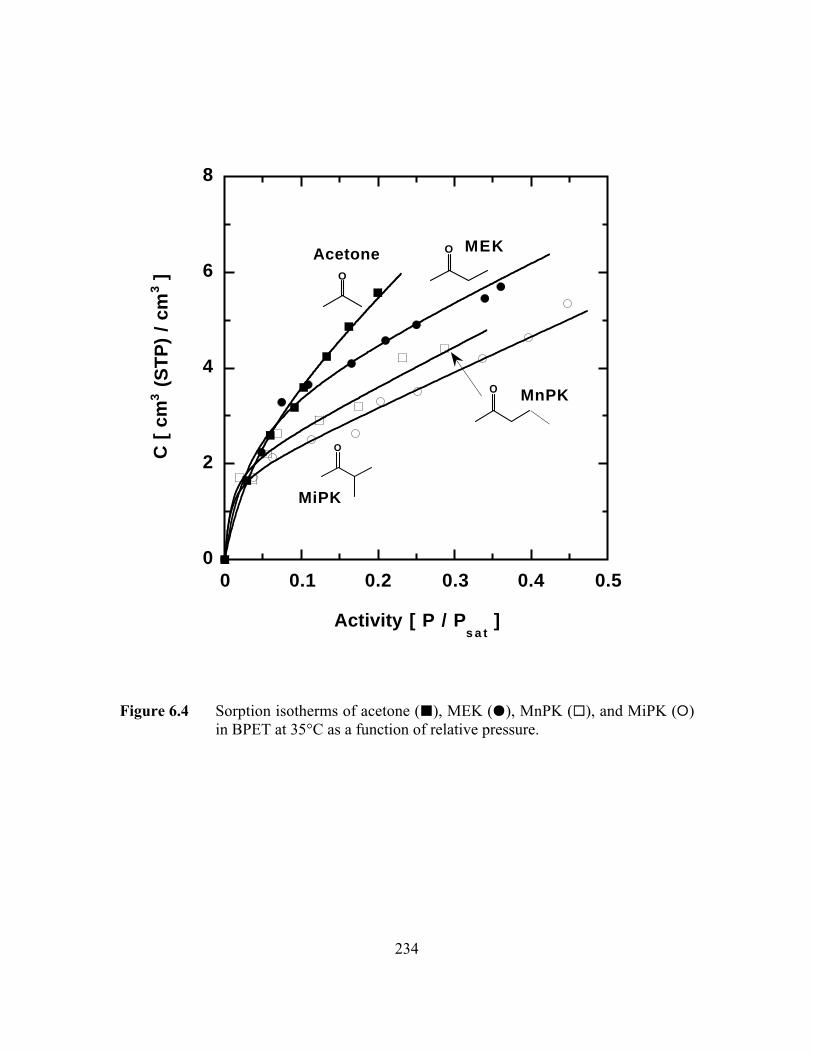
234
0
2
4
6
8
0 0.1 0.2 0.3 0.4 0.5
C [
cm
3 (
ST
P)
/ cm
3 ]
Activity [ P / Ps a t
]
O
O
O
O
Acetone MEK
MnPK
MiPK
Figure 6.4 Sorption isotherms of acetone (B), MEK (J), MnPK (G), and MiPK (E)in BPET at 35°C as a function of relative pressure.
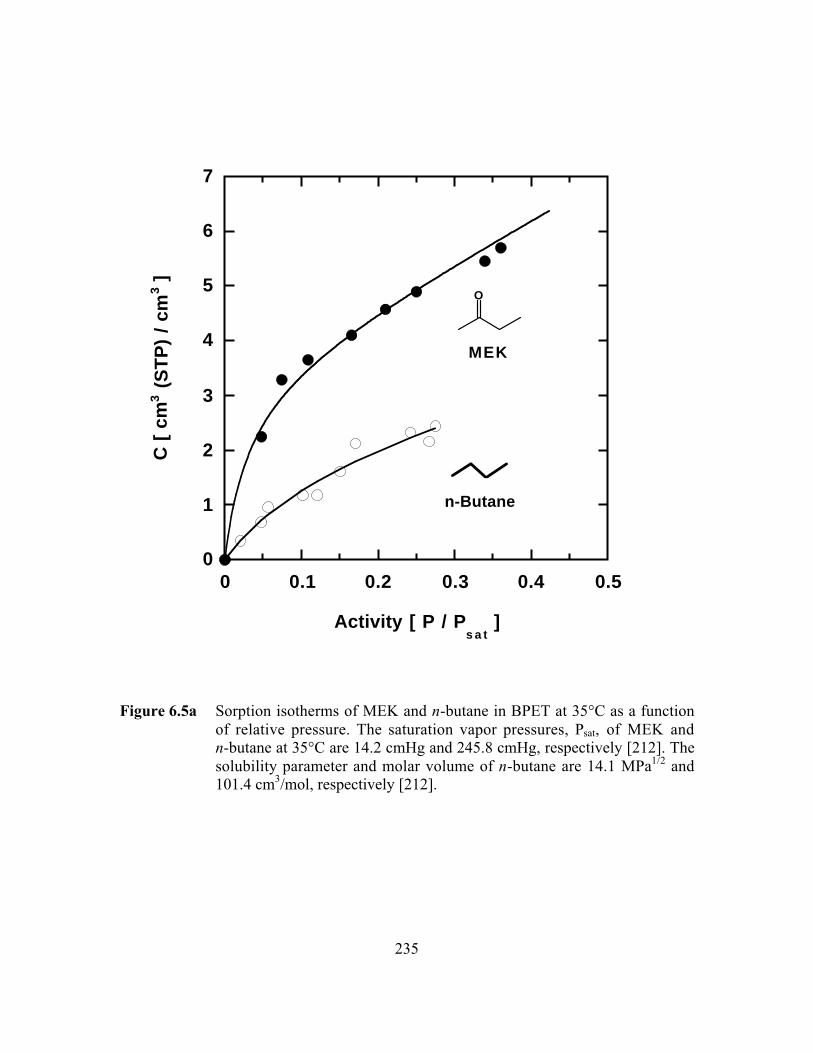
235
0
1
2
3
4
5
6
7
0 0.1 0.2 0.3 0.4 0.5
C [
cm
3 (
ST
P)
/ cm
3 ]
Activity [ P / Ps a t
]
n-Butane
O
MEK
Figure 6.5a Sorption isotherms of MEK and n-butane in BPET at 35°C as a functionof relative pressure. The saturation vapor pressures, Psat, of MEK andn-butane at 35°C are 14.2 cmHg and 245.8 cmHg, respectively [212]. Thesolubility parameter and molar volume of n-butane are 14.1 MPa1/2 and101.4 cm3/mol, respectively [212].

236
0
1
2
3
4
5
6
0 0.1 0.2 0.3 0.4 0.5 0.6
n-Pentane
O
MnPK
C [
cm
3 (
ST
P)
/ cm
3 ]
Activity [ P / Ps a t
]
Figure 6.5b Sorption isotherms of MnPK and n-pentane in BPET at 35°C as a functionof relative pressure. The saturation vapor pressures, Psat, of MnPK andn-pentane at 35°C are 5.8 cmHg and 72.7 cmHg, respectively [212]. Thesolubility parameter and molar volume of n-pentane are 14.5 MPa1/2 and116.2 cm3/mol, respectively [212].
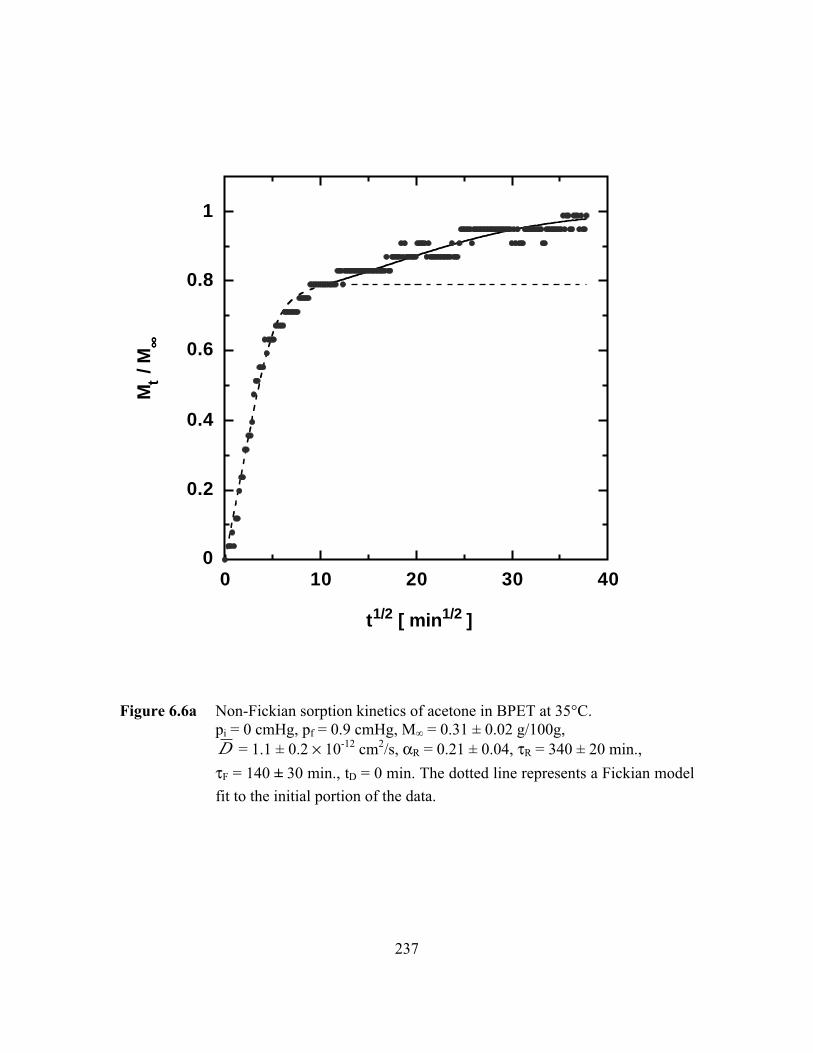
237
0
0.2
0.4
0.6
0.8
1
0 10 20 30 40
Mt /
M••••
t1/2 [ min 1/2 ]
Figure 6.6a Non-Fickian sorption kinetics of acetone in BPET at 35°C.pi = 0 cmHg, pf = 0.9 cmHg, M∞ = 0.31 ± 0.02 g/100g,D = 1.1 ± 0.2 ¥ 10-12 cm2/s, aR = 0.21 ± 0.04, tR = 340 ± 20 min.,
tF = 140 ± 30 min., tD = 0 min. The dotted line represents a Fickian model
fit to the initial portion of the data.

238
0
0.2
0.4
0.6
0.8
1
0 10 20 30 40 50 60
Mt /
M••••
t1/2 [ min 1/2 ]
Figure 6.6b Fickian sorption kinetics of MEK in BPET at 35°C.pi = 0 cmHg, pf = 2.3 cmHg, M∞ = 0.94 ± 0.003 g/100g,D = 4.4 ± 1.8 ¥ 10-13 cm2/s.
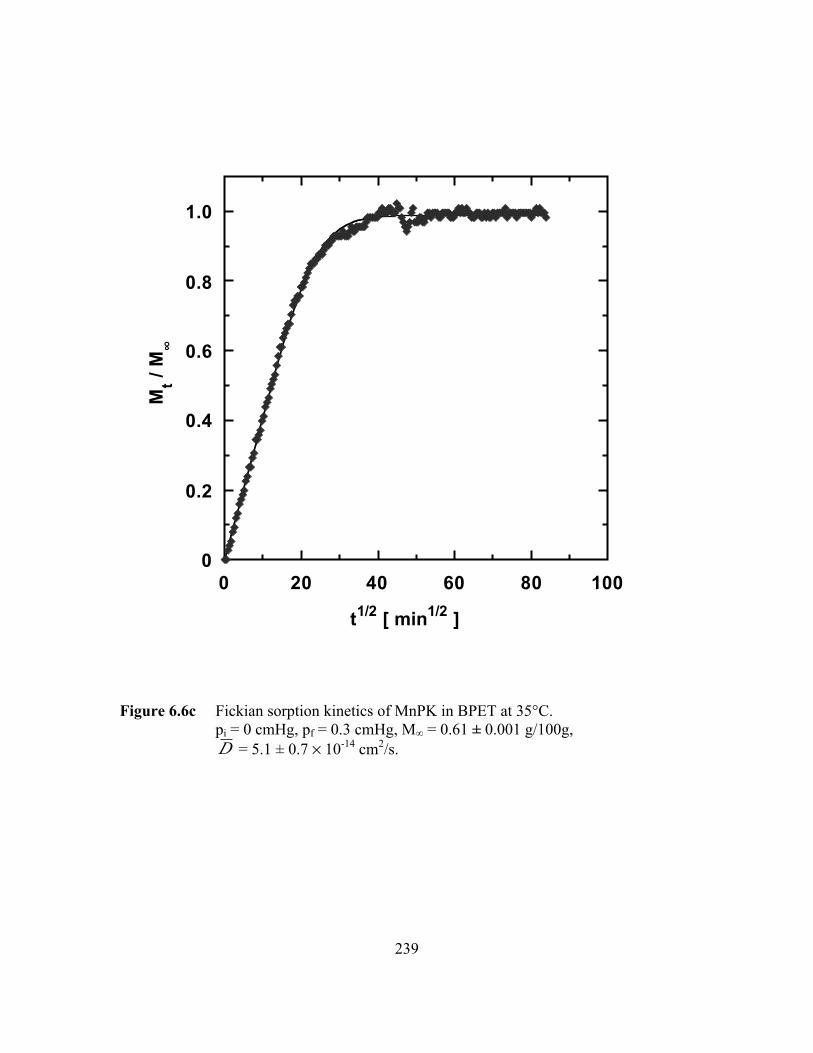
239
0
0.2
0.4
0.6
0.8
1.0
0 20 40 60 80 100
Mt /
M∞
t1/2 [ min1/2 ]
Figure 6.6c Fickian sorption kinetics of MnPK in BPET at 35°C.pi = 0 cmHg, pf = 0.3 cmHg, M∞ = 0.61 ± 0.001 g/100g,D = 5.1 ± 0.7 ¥ 10-14 cm2/s.
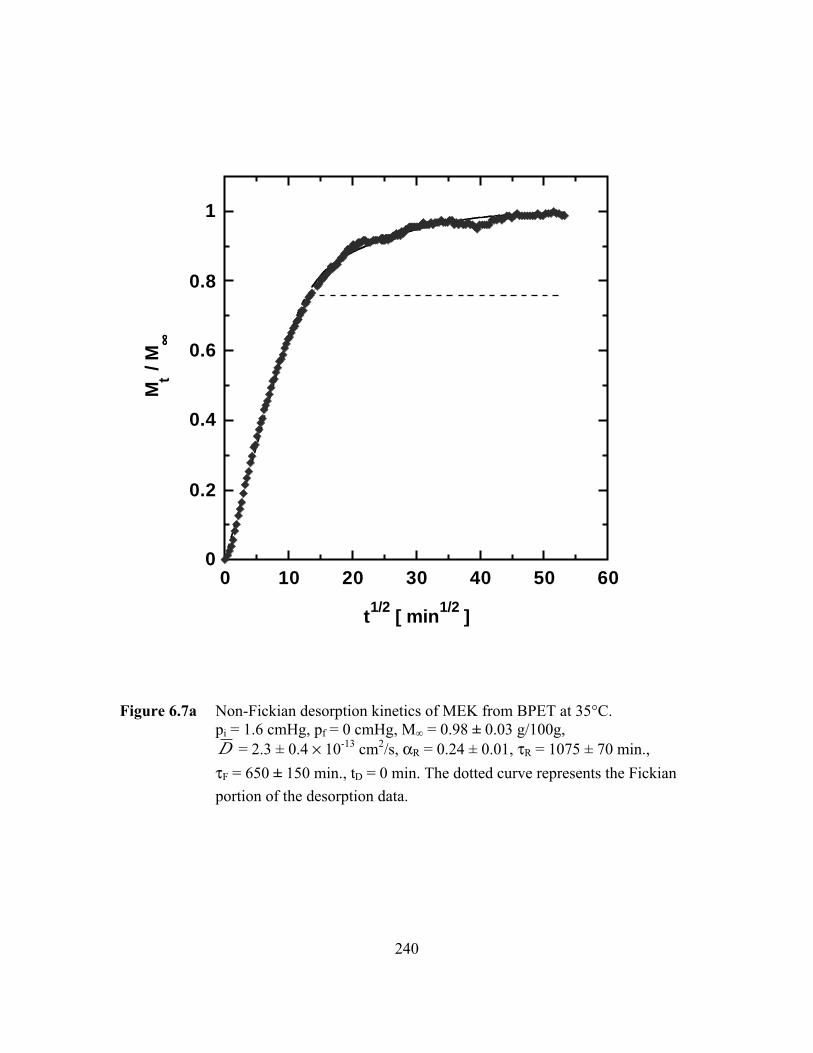
240
0
0.2
0.4
0.6
0.8
1
0 10 20 30 40 50 60
t1/2 [ min 1/2 ]
Mt /
M••••
Figure 6.7a Non-Fickian desorption kinetics of MEK from BPET at 35°C.pi = 1.6 cmHg, pf = 0 cmHg, M∞ = 0.98 ± 0.03 g/100g,D = 2.3 ± 0.4 ¥ 10-13 cm2/s, aR = 0.24 ± 0.01, tR = 1075 ± 70 min.,
tF = 650 ± 150 min., tD = 0 min. The dotted curve represents the Fickian
portion of the desorption data.
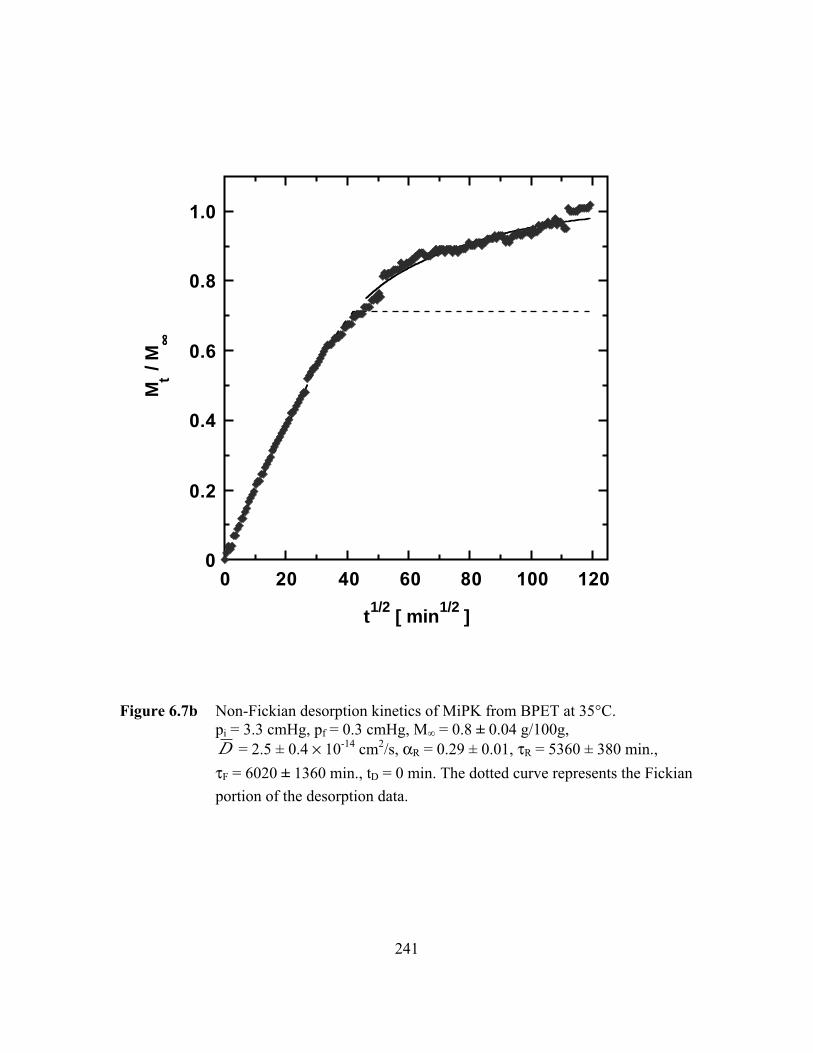
241
0
0.2
0.4
0.6
0.8
1.0
0 20 40 60 80 100 120
Mt /
M••••
t1/2 [ min 1/2 ]
Figure 6.7b Non-Fickian desorption kinetics of MiPK from BPET at 35°C.pi = 3.3 cmHg, pf = 0.3 cmHg, M∞ = 0.8 ± 0.04 g/100g,D = 2.5 ± 0.4 ¥ 10-14 cm2/s, aR = 0.29 ± 0.01, tR = 5360 ± 380 min.,
tF = 6020 ± 1360 min., tD = 0 min. The dotted curve represents the Fickian
portion of the desorption data.
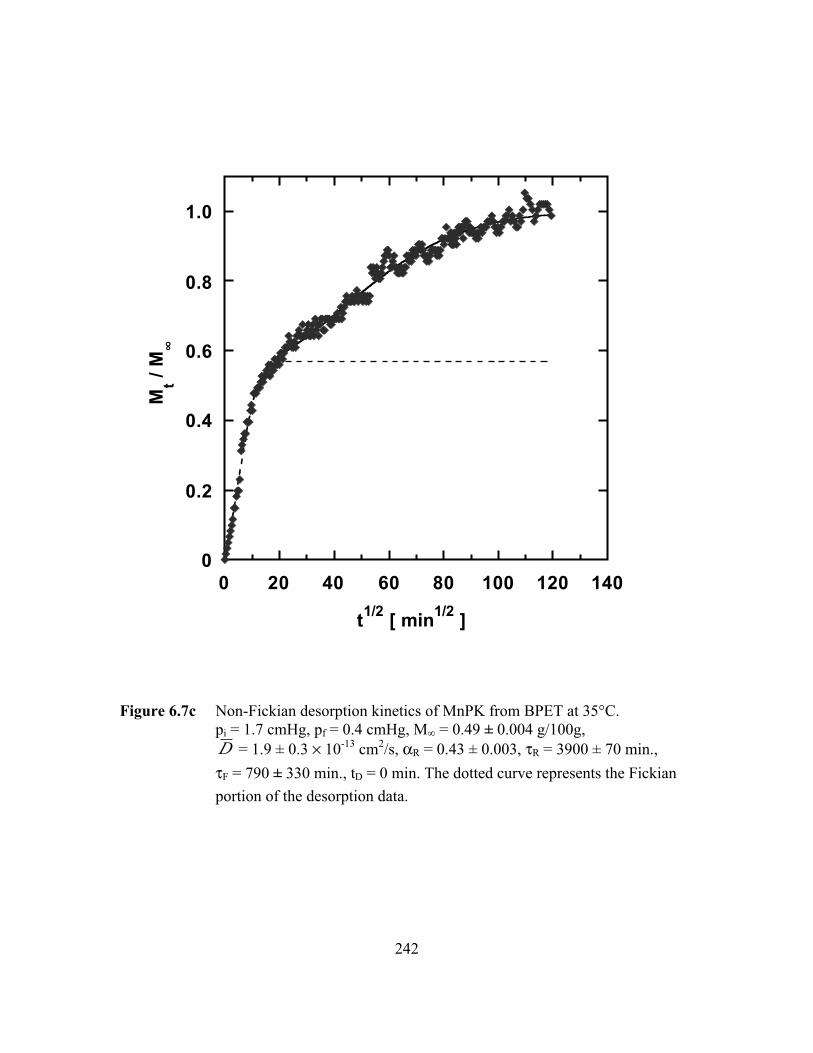
242
0
0.2
0.4
0.6
0.8
1.0
0 20 40 60 80 100 120 140
Mt /
M∞
t1/2
[ min1/2
]
Figure 6.7c Non-Fickian desorption kinetics of MnPK from BPET at 35°C.pi = 1.7 cmHg, pf = 0.4 cmHg, M∞ = 0.49 ± 0.004 g/100g,D = 1.9 ± 0.3 ¥ 10-13 cm2/s, aR = 0.43 ± 0.003, tR = 3900 ± 70 min.,
tF = 790 ± 330 min., tD = 0 min. The dotted curve represents the Fickian
portion of the desorption data.
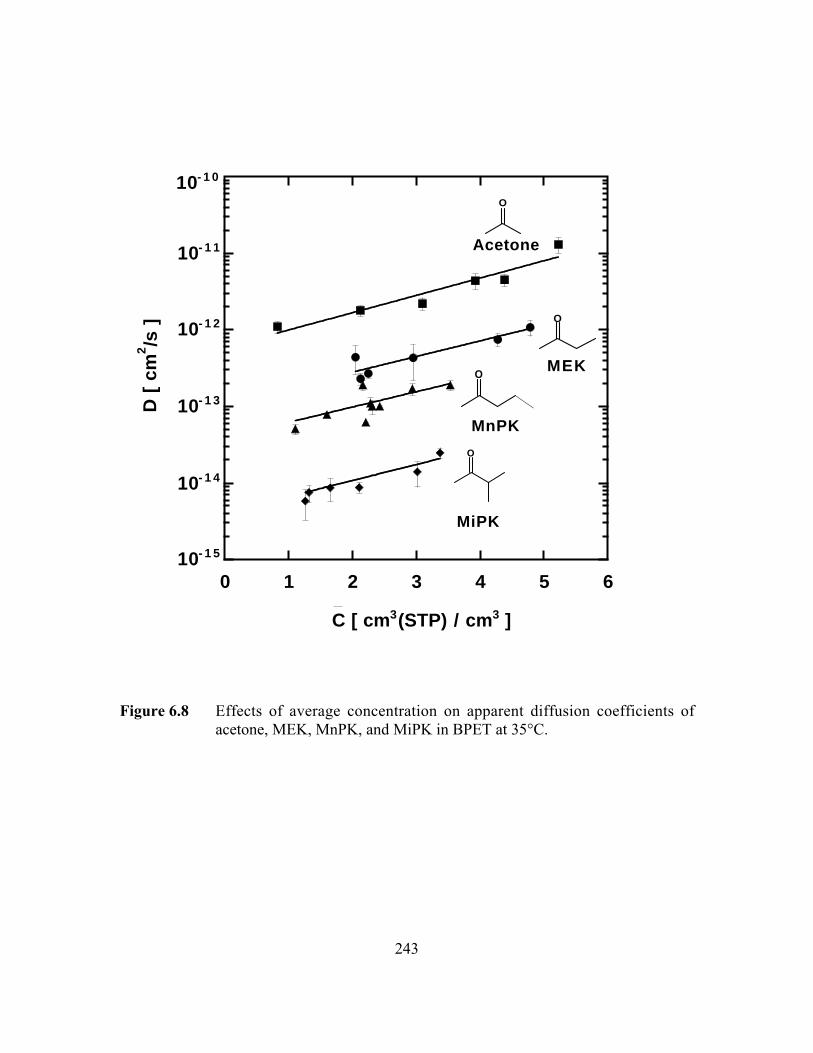
243
10- 1 5
10- 1 4
10- 1 3
10- 1 2
10- 1 1
0 1 2 3 4 5 6
C [ cm 3(STP) / cm 3 ]
Acetone
MEK
MiPK
O
O
O
10- 1 0
O
MnPK
D [
cm
2/s
]
Figure 6.8 Effects of average concentration on apparent diffusion coefficients ofacetone, MEK, MnPK, and MiPK in BPET at 35°C.

244
10-16
10-14
10-12
10-10
10-8
10-6
0 100 200 300 400 500
Da =
D /
FFFFa
[ cm
2 /s ]
Critical volume, Vc [ cm3/mol ]
-T = 25°C
He
O2
N2
CO2
CH4
H2O
Ar
CH2Cl
2
C3H
8
C6H
6
n-C4H
10
n-C5H
12(CH3)2CO MEK
MiPK
MnPK
10-4
Figure 6.9 Effect of penetrant size on infinite dilution, estimated amorphous phasediffusion coefficients in PET at 25°C [9]. The penetrants from this chapterare highlighted in bold. The best-fit parameters of Equation 6.8 are h = 9.1
± 0.9, t = 5.7 ± 1.2 ¥ 108 (cm2/s (cm3/mol)9.1).

245
CHAPTER 7
Sorption and Transport of Linear Esters and
Branched Alkanes in Biaxially Oriented
Poly(ethylene terephthalate)
This chapter has been adapted with permission from an article in press under the same
title in Industrial & Engineering Chemistry Research.
Unpublished work copyright„ 2004 American Chemical Society.
246
7.1 Summary
Equilibrium sorption and uptake kinetics of i-butane, i-pentane, methyl acetate,
and ethyl acetate vapor in uniform, biaxially oriented, semicrystalline poly(ethylene
terephthalate) films were determined at 35°C and low penetrant activity (or relative
pressure). Chemical structures and relevant physical properties of these penetrants are
recorded in Table 7.1. Sorption isotherms of i-butane, methyl acetate, and ethyl acetate
were well described by the dual-mode sorption model. The sorption isotherm of i-pentane
was described by the dual-mode model at low activity and the Flory-Huggins model at
high activity. At low penetrant activity, the solubility coefficients of i-pentane and
i-butane were 11.5 and 1.3 times lower than those previously reported for their linear
analogues, respectively. At constant activity, the solubility coefficients of the two
acetates were substantially higher than those of alkanes, and the solubility of methyl
acetate was higher than that of ethyl acetate. Sorption kinetics were described either by
Fickian diffusion or a two-stage model incorporating Fickian diffusion at short times and
protracted polymer structural relaxation at long times. Diffusion coefficients for each
penetrant increased with increasing penetrant concentration. The diffusion coefficients of
esters (methyl acetate and ethyl acetate) were quite similar to those of ketones (acetone
and methyl ethyl ketone) with the same number of carbon atoms.

247
7.2 Experimental
7.2.1 Materials
Biaxially oriented PET films having a nominal thickness of 0.9 µm and purchased
from Goodfellow Co. (Berwyn, PA) were used as received. The film density, 1.395 g/cc,
was furnished by the supplier. The complete details of sample characterization techniques
and corresponding results and discussion were presented earlier in Chapter 3. i-Butane
(99.5% purity) was purchased from Scott Specialty Gases (Durham, NC). High-
performance liquid chromatographic (HPLC) grade i-pentane (99.5% purity), methyl
acetate (99.5% purity), and ethyl acetate (99.8% purity) were purchased from Sigma-
Aldrich Corp. (St. Louis, MO). The liquid penetrants were subjected to several freeze-
thaw cycles to remove dissolved gases before use.
7.2.2 Gravimetric Sorption
Interval kinetic gravimetric sorption experiments were performed using a
traditional McBain spring balance system described earlier in Chapter 3. The quartz
springs were supplied by Ruska Industries, Inc. (Houston, TX) and had spring constants
of 3.03 mm/mg and 3.22 mm/mg.
248
7.3 Results and Discussion
7.3.1 Equilibrium Uptake of Alkanes in PET
Interval kinetic gravimetric sorption experiments were used to determine sorption
isotherms of i-butane and i-pentane in BPET at 35°C. The results are presented in Figures
7.1a and 7.1b. The sorption isotherms of analogous linear alkane hydrocarbons, n-butane
and n-pentane, in BPET at 35°C [8] (presented previously in Chapter 5) are also included
in Figures 7.1a and 7.1b for comparison. The sorption isotherm of i-butane is concave to
the pressure axis and is well described by the dual-mode sorption model, which is often
used to describe sorption of gases and low activity vapors in both amorphous and
semicrystalline glassy polymers such as PET [10,16-18,229]. According to this model,
the total penetrant concentration is the algebraic sum of the concentration in the
equilibrium densified polymer matrix (Henry’s Law sites) and the so-called non-
equilibrium excess volume of the glassy polymer (Langmuir sites) [16,17]:
C k p Cbp
bpD H= + ¢+
ÊËÁ
ˆ¯̃1
(7.1)
where kD is the Henry’s Law coefficient, CH´ is the Langmuir capacity parameter, a
measure of the sorption capacity in the non-equilibrium excess volume of the glassy
polymer, and b is the Langmuir affinity parameter, a measure of the penetrant’s affinity
for the Langmuir sites.
According to the commonly used two-phase model, only the amorphous regions
of the polymer are generally regarded to be accessible to penetrant sorption. Hence, the
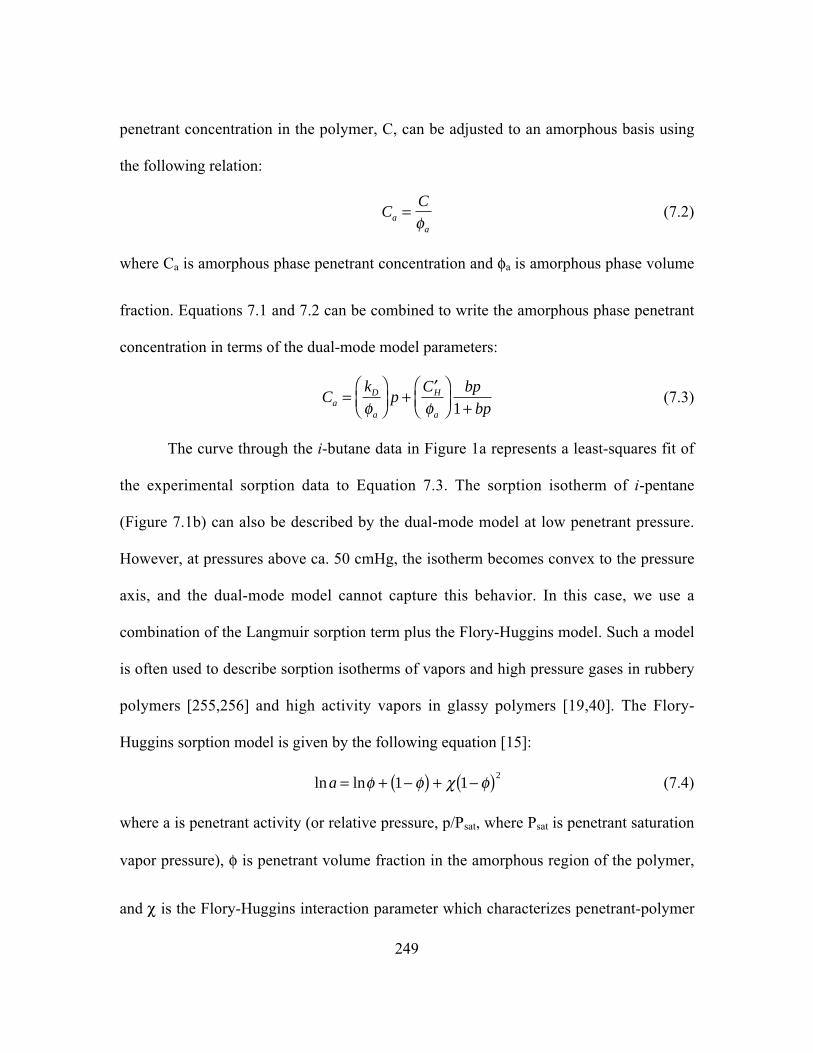
249
penetrant concentration in the polymer, C, can be adjusted to an amorphous basis using
the following relation:
CC
aa
=f
(7.2)
where Ca is amorphous phase penetrant concentration and fa is amorphous phase volume
fraction. Equations 7.1 and 7.2 can be combined to write the amorphous phase penetrant
concentration in terms of the dual-mode model parameters:
Ck
pC bp
bpaD
a
H
a
=ÊËÁ
ˆ¯̃
+ ¢ÊËÁ
ˆ¯̃ +f f 1
(7.3)
The curve through the i-butane data in Figure 1a represents a least-squares fit of
the experimental sorption data to Equation 7.3. The sorption isotherm of i-pentane
(Figure 7.1b) can also be described by the dual-mode model at low penetrant pressure.
However, at pressures above ca. 50 cmHg, the isotherm becomes convex to the pressure
axis, and the dual-mode model cannot capture this behavior. In this case, we use a
combination of the Langmuir sorption term plus the Flory-Huggins model. Such a model
is often used to describe sorption isotherms of vapors and high pressure gases in rubbery
polymers [255,256] and high activity vapors in glassy polymers [19,40]. The Flory-
Huggins sorption model is given by the following equation [15]:
ln lna = + -( ) + -( )f f c f1 12
(7.4)
where a is penetrant activity (or relative pressure, p/Psat, where Psat is penetrant saturation
vapor pressure), f is penetrant volume fraction in the amorphous region of the polymer,
and c is the Flory-Huggins interaction parameter which characterizes penetrant-polymer

250
interactions. The concentration dependence of c is given by the following empirical
expression [207]:
c c c f= +0 1 (7.5)
The curve through the i-pentane data in Figure 7.1b represents a least-square fit of the
experimental sorption data to Equations 7.3, 7.4, and 7.5, using a procedure described in
the literature [126]. The Henry’s Law coefficient, kD, can be related to the Flory-Huggins
interaction parameter, c, at infinite dilution [214]. The dual-mode and Flory-Huggins
model parameters for i-butane and i-pentane obtained in this study are recorded in Table
7.2 along with the dual-mode parameters for n-butane and n-pentane in BPET [8] (from
Chapter 5).
From the data in Figures 7.1a and 7.1b, at constant pressure, i-butane and
i-pentane have lower solubility in BPET than their linear analogues. For example, at 20
cmHg, the solubility ratio for n-butane/i-butane is 1.3, which is approximately an order of
magnitude lower than the value for n-pentane/i-pentane, which is 11.5. Within the
framework of the dual-mode model, penetrant sorption in the non-equilibrium excess
volume of glassy polymers is characterized by the Langmuir capacity parameter, which is
related to the amount of non-equilibrium excess volume as follows [16]:
¢ =-
=C V V
V
V
VH
a
g l
g
ex
gfr r* * (7.6)
where Vg is the specific volume of the penetrant-accessible (i.e., amorphous) regions of
the polymer, Vl is the specific volume of the hypothetical, densified, equilibrium polymer

251
matrix, and r* is the condensed penetrant density, which is often estimated as the
saturated liquid density of the penetrant at the temperature of the experiment. In this
study, the saturation densities were estimated at 35°C using the Hankinson-Brobst-
Thomson correlation [212]. The values are 207.4 and 188.1 cm3(STP)/cm3, respectively,
for i-butane and i-pentane. If the non-equilibrium excess volume characterized by CH´ is
equally accessible to both penetrants, then the ratio CH´/r* should also be equal. The
CH´/r* values for i-butane and i-pentane are 0.005 ± 0.001 and 0.001 ± 0.0005 (cf. Table
7.2), respectively, suggesting that i-butane has far greater access to the non-equilibrium
excess volume of PET than i-pentane. For comparison, the CH´/r* values for n-butane and
n-pentane in BPET at 35°C are 0.010 and 0.013, respectively, which are similar [8].
Thus, the lower solubility of the branched alkane hydrocarbons in BPET compared to
their linear analogues appears to result in part from restricted access of the branched
penetrants to the non-equilibrium excess volume of the polymer, and this seems to have a
more pronounced effect on solubility of i-pentane in BPET than on i-butane.
For comparison, one may consider the effect of chain branching on hydrocarbon
solubility in an equilibrium polymer, which would correspond more closely to the
sorption in the Henry’s law regions of PET. In this regard, experimental sorption
isotherms of n-butane, i-butane, n-pentane, and i-pentane in low density polyethylene
(LDPE) at 25°C are available [214]. Based on the sorption curves presented in Figure 7.2,
the infinite dilution solubility ratios for n-butane/i-butane and n-pentane/i-pentane in
LDPE at 25°C are similar (1.65 and 1.55, respectively). These values are approximately
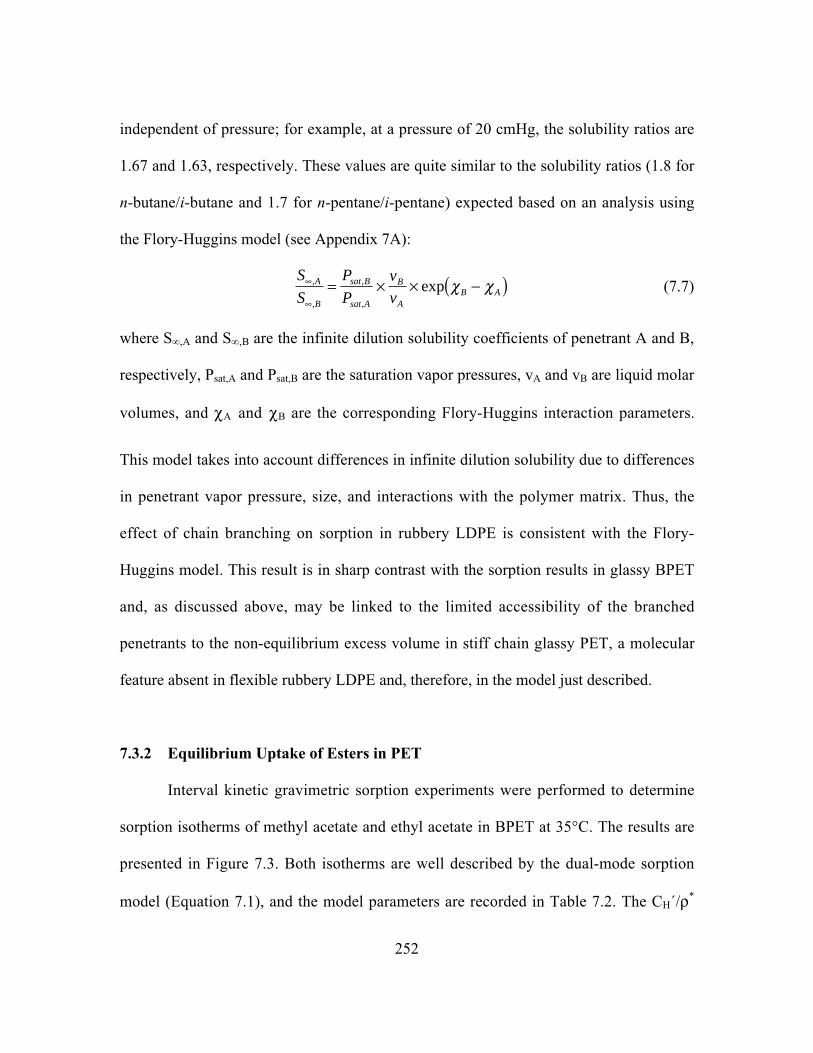
252
independent of pressure; for example, at a pressure of 20 cmHg, the solubility ratios are
1.67 and 1.63, respectively. These values are quite similar to the solubility ratios (1.8 for
n-butane/i-butane and 1.7 for n-pentane/i-pentane) expected based on an analysis using
the Flory-Huggins model (see Appendix 7A):
S
S
P
P
v
vA
B
sat B
sat A
B
AB A
•
•
= ¥ ¥ -( ),
,
,
,
exp c c (7.7)
where S∞,A and S∞,B are the infinite dilution solubility coefficients of penetrant A and B,
respectively, Psat,A and Psat,B are the saturation vapor pressures, vA and vB are liquid molar
volumes, and cA and cB are the corresponding Flory-Huggins interaction parameters.
This model takes into account differences in infinite dilution solubility due to differences
in penetrant vapor pressure, size, and interactions with the polymer matrix. Thus, the
effect of chain branching on sorption in rubbery LDPE is consistent with the Flory-
Huggins model. This result is in sharp contrast with the sorption results in glassy BPET
and, as discussed above, may be linked to the limited accessibility of the branched
penetrants to the non-equilibrium excess volume in stiff chain glassy PET, a molecular
feature absent in flexible rubbery LDPE and, therefore, in the model just described.
7.3.2 Equilibrium Uptake of Esters in PET
Interval kinetic gravimetric sorption experiments were performed to determine
sorption isotherms of methyl acetate and ethyl acetate in BPET at 35°C. The results are
presented in Figure 7.3. Both isotherms are well described by the dual-mode sorption
model (Equation 7.1), and the model parameters are recorded in Table 7.2. The CH´/r*

253
values for methyl acetate and ethyl acetate are 0.010 and 0.013, respectively, which are
similar to the values reported earlier for linear alkanes [8] (cf. Table 7.2) and linear and
branched ketones in BPET at 35°C [11] (previously reported in Chapters 5 and 6,
respectively). From the data in Figure 7.3, at constant pressure, ethyl acetate solubility is
higher than that of methyl acetate, consistent with the higher critical temperature of ethyl
acetate (cf. Table 7.2).
Figure 7.4 presents the solubility of the branched alkane hydrocarbons and linear
esters from this study on the infinite-dilution solubility correlation plot previously
presented in Chapters 5 and 6. The solubility values reported in this figure have been
adjusted to an amorphous basis as described earlier (cf., Chapter 5) [10]. In general, for
the organic vapor sorption data in Figure 7.4, infinite-dilution solubility values were
obtained by extrapolating reported solubility values to zero concentration [9]. However,
because of the scatter in the data at low pressure for methyl acetate and ethyl acetate, we
did not attempt to compute infinite-dilution solubilities. For these penetrants, the
solubility coefficients are reported at an activity (or relative pressure) of 0.1 in Figure 7.4.
The logarithm of solubility increases rather systematically and linearly with Tc. While the
general trend is observed, there is scatter in the data, which may arise from several
sources, as discussed in Chapter 6. The solubility of i-butane and i-pentane is lower than
expected, possibly due to the branched structures restricting their access to the non-
equilibrium excess volume of PET, as discussed above. While it is difficult to draw firm
conclusions, the solubilities of esters from this study and many of the other polar
penetrants appear to exhibit a positive deviation from the correlation line. This trend may
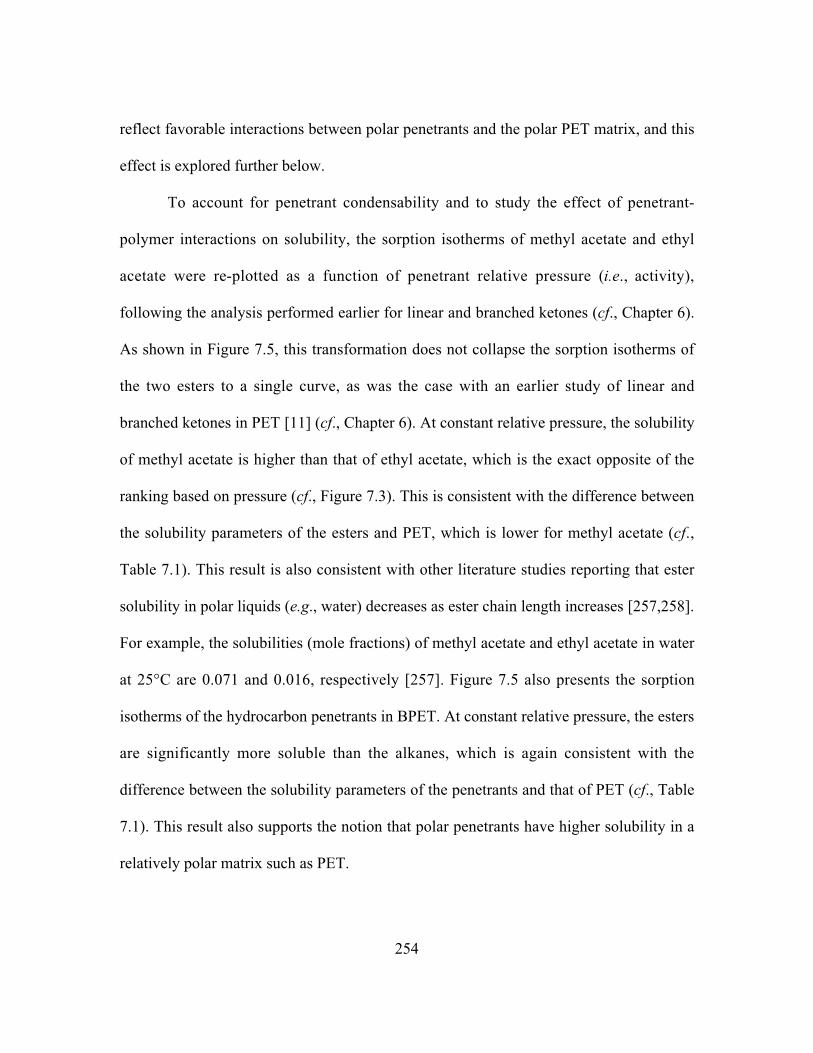
254
reflect favorable interactions between polar penetrants and the polar PET matrix, and this
effect is explored further below.
To account for penetrant condensability and to study the effect of penetrant-
polymer interactions on solubility, the sorption isotherms of methyl acetate and ethyl
acetate were re-plotted as a function of penetrant relative pressure (i.e., activity),
following the analysis performed earlier for linear and branched ketones (cf., Chapter 6).
As shown in Figure 7.5, this transformation does not collapse the sorption isotherms of
the two esters to a single curve, as was the case with an earlier study of linear and
branched ketones in PET [11] (cf., Chapter 6). At constant relative pressure, the solubility
of methyl acetate is higher than that of ethyl acetate, which is the exact opposite of the
ranking based on pressure (cf., Figure 7.3). This is consistent with the difference between
the solubility parameters of the esters and PET, which is lower for methyl acetate (cf.,
Table 7.1). This result is also consistent with other literature studies reporting that ester
solubility in polar liquids (e.g., water) decreases as ester chain length increases [257,258].
For example, the solubilities (mole fractions) of methyl acetate and ethyl acetate in water
at 25°C are 0.071 and 0.016, respectively [257]. Figure 7.5 also presents the sorption
isotherms of the hydrocarbon penetrants in BPET. At constant relative pressure, the esters
are significantly more soluble than the alkanes, which is again consistent with the
difference between the solubility parameters of the penetrants and that of PET (cf., Table
7.1). This result also supports the notion that polar penetrants have higher solubility in a
relatively polar matrix such as PET.
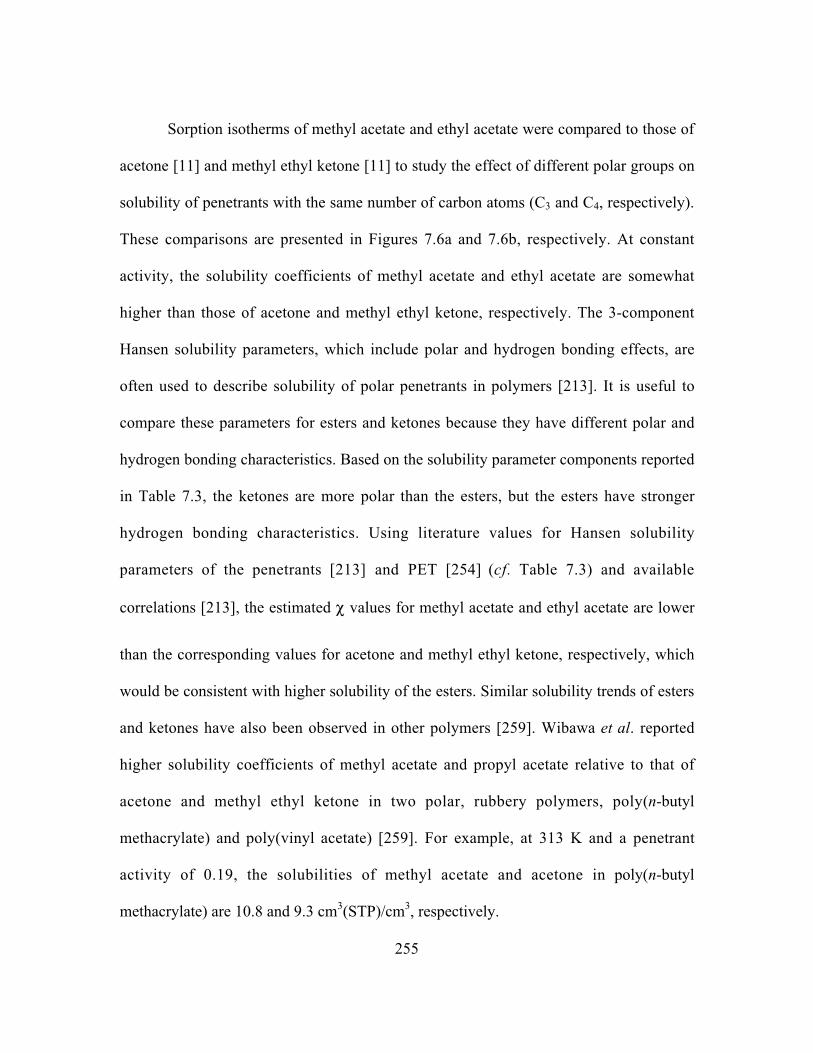
255
Sorption isotherms of methyl acetate and ethyl acetate were compared to those of
acetone [11] and methyl ethyl ketone [11] to study the effect of different polar groups on
solubility of penetrants with the same number of carbon atoms (C3 and C4, respectively).
These comparisons are presented in Figures 7.6a and 7.6b, respectively. At constant
activity, the solubility coefficients of methyl acetate and ethyl acetate are somewhat
higher than those of acetone and methyl ethyl ketone, respectively. The 3-component
Hansen solubility parameters, which include polar and hydrogen bonding effects, are
often used to describe solubility of polar penetrants in polymers [213]. It is useful to
compare these parameters for esters and ketones because they have different polar and
hydrogen bonding characteristics. Based on the solubility parameter components reported
in Table 7.3, the ketones are more polar than the esters, but the esters have stronger
hydrogen bonding characteristics. Using literature values for Hansen solubility
parameters of the penetrants [213] and PET [254] (cf. Table 7.3) and available
correlations [213], the estimated c values for methyl acetate and ethyl acetate are lower
than the corresponding values for acetone and methyl ethyl ketone, respectively, which
would be consistent with higher solubility of the esters. Similar solubility trends of esters
and ketones have also been observed in other polymers [259]. Wibawa et al. reported
higher solubility coefficients of methyl acetate and propyl acetate relative to that of
acetone and methyl ethyl ketone in two polar, rubbery polymers, poly(n-butyl
methacrylate) and poly(vinyl acetate) [259]. For example, at 313 K and a penetrant
activity of 0.19, the solubilities of methyl acetate and acetone in poly(n-butyl
methacrylate) are 10.8 and 9.3 cm3(STP)/cm3, respectively.

256
7.3.3 Sorption Kinetics of Alkanes and Esters in PET
Figures 7.7a and 7.7b present results from two representative kinetic sorption
experiments of i-butane and methyl acetate, respectively, in BPET at 35°C. In each case,
the fractional mass uptake, Mt / M∞, increases linearly with t1/2 at short times. This
behavior is characteristic of sorption kinetics controlled by Fickian diffusion (see, for
example, Figure 7a and the dotted curve in Figure 7b). In some instances, the fractional
mass uptake at longer times exhibits a protracted, asymptotic approach towards
equilibrium [224] (see, for example, the solid curve in Figure 7b). As described earlier in
Chapters 5 and 6, this behavior is ascribed to mass uptake kinetics limited by polymer
swelling and structural rearrangement to accommodate the penetrant rather than Fickian
diffusion. These sorption kinetics may be described using the following empirical model
[11]:
M
M n
D n t
l
t tH tt
Rn
RD
RD
• =
•
= - -+
- +ÊËÁ
ˆ¯̃
ÏÌÓ
¸˝˛
+ ¥- -Ê
ËÁˆ¯̃
¥ ( )Â1 18 1
2 12 1
2 2
2 2
20
( )( )
exp( )
exp( )a
pp a
t(7.8)
where D is the average diffusion coefficient, l is polymer film thickness, aR is the
fraction of weight uptake occurring during the protracted, non-Fickian approach to
equilibrium, tR is the time constant associated with the long time drift in mass uptake, tD
is a delay factor accounting for a delay in the beginning of structural relaxation, and H(tD)
is the Heaviside unit step function [253].
The curves in Figures 7.7a and 7.7b represent least-squares fits of Equation 7.8 to
the experimental data for sorption of i-butane and methyl acetate in BPET at 35°C,
respectively, following the procedure described in Chapter 5 [8]. In Figure 7.7b, the
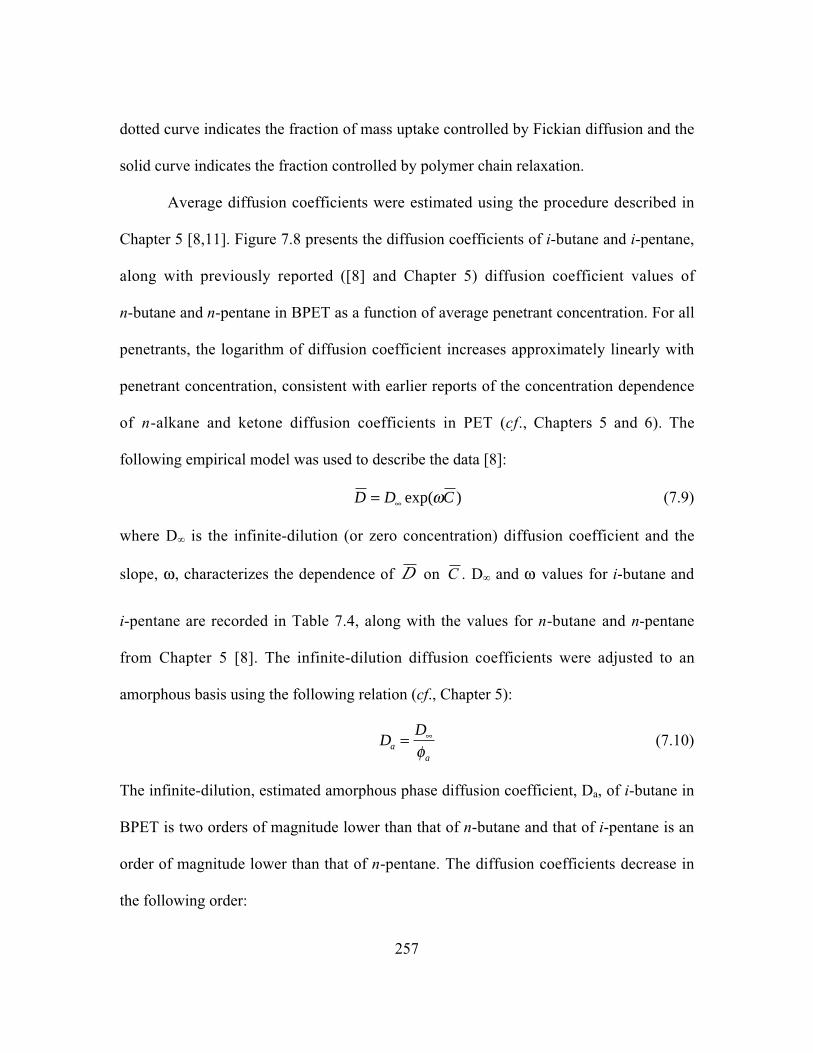
257
dotted curve indicates the fraction of mass uptake controlled by Fickian diffusion and the
solid curve indicates the fraction controlled by polymer chain relaxation.
Average diffusion coefficients were estimated using the procedure described in
Chapter 5 [8,11]. Figure 7.8 presents the diffusion coefficients of i-butane and i-pentane,
along with previously reported ([8] and Chapter 5) diffusion coefficient values of
n-butane and n-pentane in BPET as a function of average penetrant concentration. For all
penetrants, the logarithm of diffusion coefficient increases approximately linearly with
penetrant concentration, consistent with earlier reports of the concentration dependence
of n-alkane and ketone diffusion coefficients in PET (cf., Chapters 5 and 6). The
following empirical model was used to describe the data [8]:
D D C= • exp( )w (7.9)
where D∞ is the infinite-dilution (or zero concentration) diffusion coefficient and the
slope, w, characterizes the dependence of D on C . D∞ and w values for i-butane and
i-pentane are recorded in Table 7.4, along with the values for n-butane and n-pentane
from Chapter 5 [8]. The infinite-dilution diffusion coefficients were adjusted to an
amorphous basis using the following relation (cf., Chapter 5):
DD
aa
= •
f(7.10)
The infinite-dilution, estimated amorphous phase diffusion coefficient, Da, of i-butane in
BPET is two orders of magnitude lower than that of n-butane and that of i-pentane is an
order of magnitude lower than that of n-pentane. The diffusion coefficients decrease in
the following order:
258
n-butane > n-pentane > i-butane > i-pentane
suggesting that chain branching has a larger effect on lowering hydrocarbon diffusion
coefficients in PET than chain length.
To compare the effect of chain branching versus chain length on hydrocarbon
diffusion coefficients in PET, infinite-dilution, estimated amorphous phase diffusion
coefficients of linear and branched alkane hydrocarbons in PET from this study and
available literature data [9] are presented in Figure 7.9 as a function of number of carbon
atoms. Since the diffusion coefficients of penetrants in this study were measured at 35°C,
they were adjusted to 25°C using the procedure described in the literature [9]. The
logarithm of diffusion coefficients of normal hydrocarbons decreases linearly with
increasing chain length (from C1 to C5), as shown. To quantify the effect of chain
branching on diffusion coefficients, the following procedure was used [102]. An effective
chain length was obtained for i-butane and i-pentane based on their diffusion coefficient
values and an extrapolated linear curve-fit to the data for the normal C1 to C5
hydrocarbons. The effective chain length obtained by this technique was 6.2 for i-butane
(C4) and 7.2 for i-pentane (C5). Based on this analysis, the effective size contribution to
diffusion coefficient of a methyl (CH3) side-group is 2.2, while that of a CH3 or CH2
group in the main chain is unity. Although this method assumes a linear decrease in
diffusion coefficients of straight-chain hydrocarbons larger than n-pentane, which may
not be accurate, it clearly demonstrates the important effect of chain branching on
hydrocarbon diffusion coefficients in PET. This result is consistent with several literature
studies reporting the size and shape effects on hydrocarbon diffusion coefficients in

259
rubbery polymers such as polyisobutylene [260], ethyl cellulose [17], and natural rubber
[261], and glassy polymers such as polycarbonate [262].
Figure 7.10 presents the diffusion coefficients of methyl acetate and ethyl acetate
as a function of average penetrant concentration. The logarithm of diffusion coefficients
increases linearly with penetrant concentration for both penetrants. The data were fit to
the model presented in Equation 7.9 and the D∞ and w values are recorded in Table 7.4.
The dependence of D on C is similar for methyl acetate and ethyl acetate over the
concentration range studied. The diffusion coefficient values of acetone and methyl ethyl
ketone in BPET from Chapter 6 [11] are also included in Figure 7.10 for comparison.
Somewhat surprisingly, the diffusion coefficients of methyl acetate and ethyl
acetate are quite similar to those of acetone and methyl ethyl ketone, respectively, over
the concentration range studied, even though the esters are slightly larger than the ketones
with the same number of carbon atoms (cf. Table 7.3) [212]. Some literature studies have
even reported higher diffusion coefficients of methyl acetate than acetone in rubbery
poly(vinyl acetate) [263], and in glassy [264] and rubbery [263] poly(methyl
methacrylate). Diffusion coefficients of polar penetrants in polymers can be retarded by
specific favorable interactions between the penetrant and polymer matrix [130]. Based on
their dipole moments, the ketones are much more polar than esters with the same number
of carbon atoms (cf. Table 7.3) [212]. The larger sizes of the esters (which would favor
lower diffusion coefficients) could be partially offset by their lower polarity (which
would favor higher diffusion coefficients), resulting in similar diffusion coefficient
values for these two classes of penetrants. Interestingly, the diffusion coefficients of ethyl

260
acetate and methyl ethyl ketone in a non-polar, rubbery polymer, high-density
polyethylene (HDPE), support this notion [265,266]. The diffusion coefficient of methyl
ethyl ketone (4.7 ¥ 10-13 cm2/s) is an order of magnitude larger than that of ethyl acetate
(0.4 ¥ 10-13 cm2/s) in HDPE at 30°C and a penetrant activity of 0.1 [265]. This result
suggests that penetrant-polymer interactions, which act to decrease the diffusion
coefficient of the smaller but more polar ketone relative to that of the larger but less polar
ester in BPET, are absent in non-polar HDPE.
As reported earlier in Chapters 5 and 6, the infinite-dilution, estimated amorphous
phase diffusion coefficients in PET may be roughly correlated with critical volume using
the following empirical power law model [8]:
DVa
c
=t
h (7.11)
where t and h are adjustable parameters. Figure 7.11 presents the correlation plot along
with the data for linear esters and branched alkanes from this study. Since the diffusion
coefficients of the penetrants studied in this research project (reported in Chapters 5, 6,
and 7) were obtained at 35°C, the diffusion coefficients of several other penetrants in
Figure 7.11, originally reported at 25°C (cf., Figure 5.5), were adjusted to 35°C using the
procedure described in the literature [9]. The infinite-dilution diffusion coefficient of
ethyl acetate is approximately an order of magnitude lower than that of methyl acetate,
consistent with its larger size. The correlation of D with Vc is good for relatively linear
penetrants, such as methyl acetate and ethyl acetate. The values of t and h (4.4 ± 1.2 ¥

261
107 cm2/s (cm3/mol)8.4 and 8.4 ± 1.0, respectively), which were obtained from a curve-fit
of the experimental data for spherical and relatively linear penetrants at 35°C, are
somewhat different from the parameter values reported earlier at 25°C (cf., Figure 5.5)
[9]. The diffusion coefficients of i-butane and i-pentane are approximately an order of
magnitude lower than the values anticipated by this simple empirical model. As reported
in Chapter 6, this is because critical volume does not accurately capture the effect of
penetrant shape on diffusion coefficients [9,11].
7.4 Conclusions
Equilibrium sorption and uptake kinetics of i-butane, i-pentane, methyl acetate,
and ethyl acetate in biaxially oriented, semicrystalline PET films at 35°C have been
reported. The equilibrium solubility of i-butane and i-pentane is lower than that of the
corresponding linear alkanes, possibly due to restricted access of the branched penetrants
to the non-equilibrium excess volume of PET. At constant relative pressure, the solubility
of methyl acetate is higher than that of ethyl acetate, consistent with solubility trends of
esters in other polymers and polar liquids, and the solubility of esters in PET is higher
than that of ketones having the same number of carbon atoms. These results are
consistent with the differences between the solubility parameters of the penetrants and
PET. Similar solubility trends have also been observed for esters and ketones in other
polar and rubbery polymers. Thus, penetrant solubility in PET, which is primarily
determined by penetrant condensability, also appears to be strongly dependent on
penetrant size and shape (for non-polar penetrants) and specific penetrant-polymer
262
interactions (for polar penetrants). Sorption kinetics of all penetrants are described either
by Fickian diffusion or a two-stage model incorporating Fickian diffusion at short times
and protracted polymer structural relaxation at long times. Chain branching appears to
have an important effect on hydrocarbon diffusion coefficients in PET, consistent with
the results reported for other rubbery and glassy polymers. The infinite-dilution diffusion
coefficient of ethyl acetate is an order of magnitude lower than that of methyl acetate,
which is consistent with its larger size. The diffusion coefficients for each penetrant
increase with increasing penetrant concentration. The diffusion coefficients of esters
(methyl acetate and ethyl acetate) are quite similar to those of ketones (acetone and
methyl ethyl ketone) with the same number of carbon atoms despite the esters being
slightly larger than the ketones. Thus, penetrant diffusion coefficients in PET, which are
primarily dependent on penetrant size and shape, appear to be influenced by polarity
effects as well.
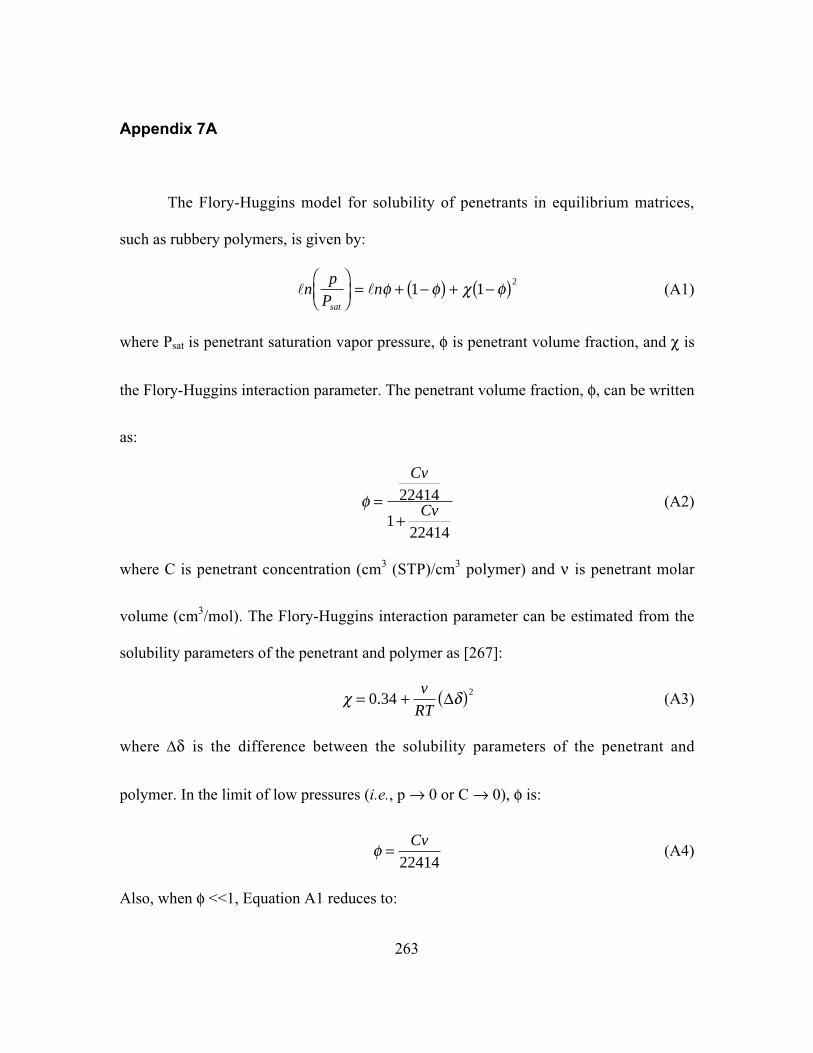
263
Appendix 7A
The Flory-Huggins model for solubility of penetrants in equilibrium matrices,
such as rubbery polymers, is given by:
l lnp
Pn
sat
ÊËÁ
ˆ¯̃
= + -( ) + -( )f f c f1 12
(A1)
where Psat is penetrant saturation vapor pressure, f is penetrant volume fraction, and c is
the Flory-Huggins interaction parameter. The penetrant volume fraction, f, can be written
as:
f =+
Cv
Cv22414
122414
(A2)
where C is penetrant concentration (cm3 (STP)/cm3 polymer) and n is penetrant molar
volume (cm3/mol). The Flory-Huggins interaction parameter can be estimated from the
solubility parameters of the penetrant and polymer as [267]:
c d= + ( )0 342
.v
RTD (A3)
where ∆d is the difference between the solubility parameters of the penetrant and
polymer. In the limit of low pressures (i.e., p Æ 0 or C Æ 0), f is:
f =Cv
22414(A4)
Also, when f <<1, Equation A1 reduces to:
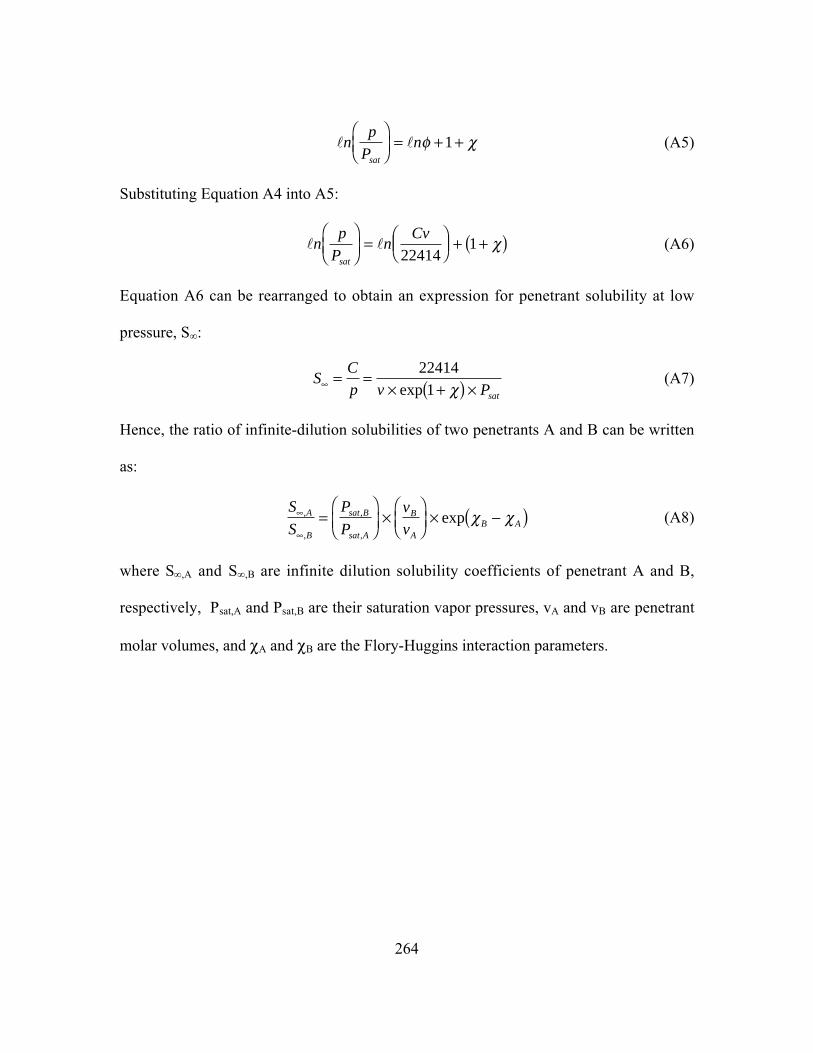
264
l lnp
Pn
sat
ÊËÁ
ˆ¯̃
= + +f c1 (A5)
Substituting Equation A4 into A5:
l lnp
Pn
Cv
sat
ÊËÁ
ˆ¯̃
= ÊËÁ
ˆ¯̃ + +( )
224141 c (A6)
Equation A6 can be rearranged to obtain an expression for penetrant solubility at low
pressure, S∞:
SC
p v Psat• = =
¥ +( ) ¥224141exp c
(A7)
Hence, the ratio of infinite-dilution solubilities of two penetrants A and B can be written
as:
S
S
P
P
v
vA
B
sat B
sat A
B
AB A
•
•
=ÊËÁ
ˆ¯̃
¥ÊËÁ
ˆ¯̃
¥ -( ),
,
,
,
exp c c (A8)
where S∞,A and S∞,B are infinite dilution solubility coefficients of penetrant A and B,
respectively, Psat,A and Psat,B are their saturation vapor pressures, vA and vB are penetrant
molar volumes, and cA and cB are the Flory-Huggins interaction parameters.
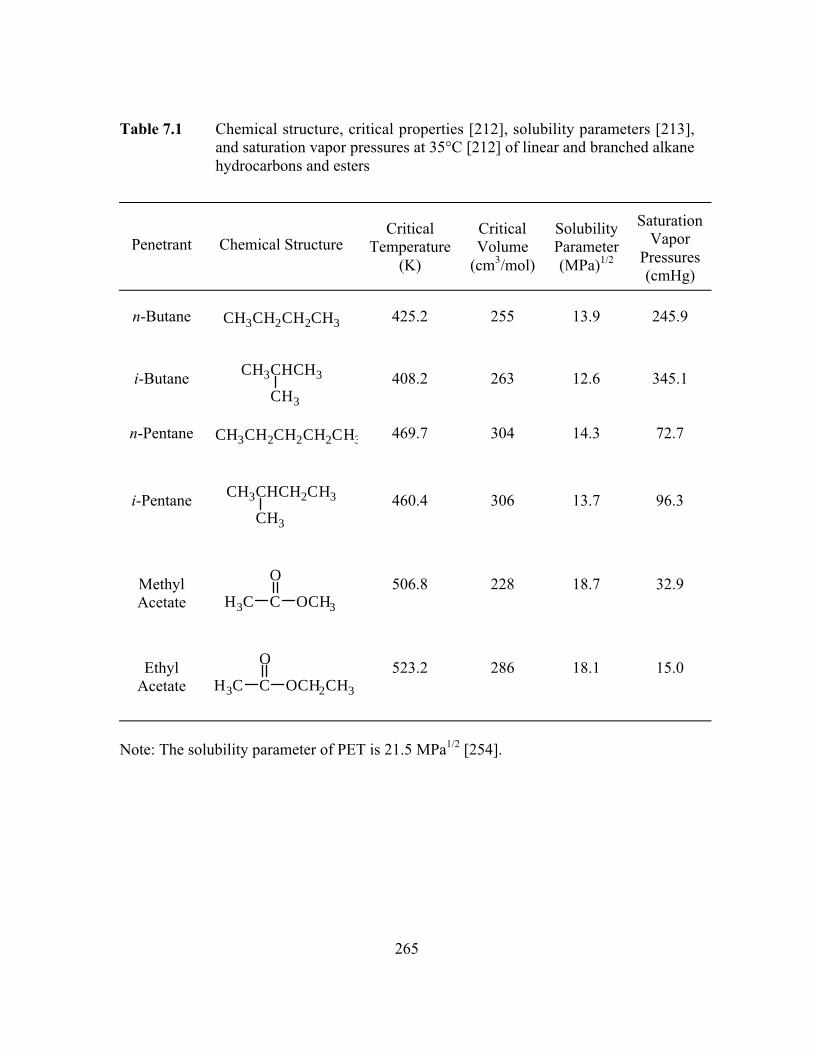
265
Table 7.1 Chemical structure, critical properties [212], solubility parameters [213],and saturation vapor pressures at 35°C [212] of linear and branched alkanehydrocarbons and esters
Penetrant Chemical StructureCritical
Temperature(K)
CriticalVolume
(cm3/mol)
SolubilityParameter(MPa)1/2
SaturationVapor
Pressures(cmHg)
n-Butane CH3CH2CH2CH3 425.2 255 13.9 245.9
i-Butane
CH3CHCH3
CH3
408.2 263 12.6 345.1
n-Pentane CH3CH2CH2CH2CH3 469.7 304 14.3 72.7
i-Pentane
CH3CHCH2CH3
CH3
460.4 306 13.7 96.3
MethylAcetate
H3C C
O
OCH3
506.8 228 18.7 32.9
EthylAcetate
H3C C
O
OCH2CH3
523.2 286 18.1 15.0
Note: The solubility parameter of PET is 21.5 MPa1/2 [254].
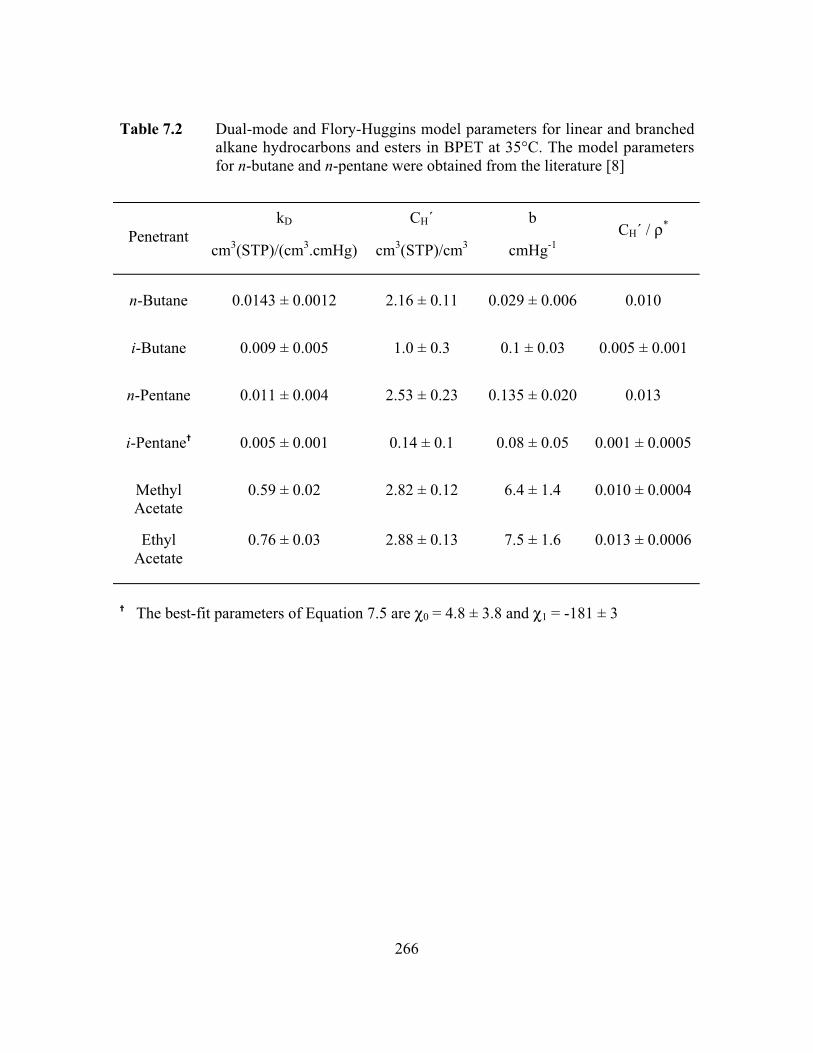
266
Table 7.2 Dual-mode and Flory-Huggins model parameters for linear and branchedalkane hydrocarbons and esters in BPET at 35°C. The model parametersfor n-butane and n-pentane were obtained from the literature [8]
PenetrantkD
cm3(STP)/(cm3.cmHg)
CH´
cm3(STP)/cm3
b
cmHg-1CH´ / r*
n-Butane 0.0143 ± 0.0012 2.16 ± 0.11 0.029 ± 0.006 0.010
i-Butane 0.009 ± 0.005 1.0 ± 0.3 0.1 ± 0.03 0.005 ± 0.001
n-Pentane 0.011 ± 0.004 2.53 ± 0.23 0.135 ± 0.020 0.013
i-Pentane� 0.005 ± 0.001 0.14 ± 0.1 0.08 ± 0.05 0.001 ± 0.0005
MethylAcetate
0.59 ± 0.02 2.82 ± 0.12 6.4 ± 1.4 0.010 ± 0.0004
EthylAcetate
0.76 ± 0.03 2.88 ± 0.13 7.5 ± 1.6 0.013 ± 0.0006
� The best-fit parameters of Equation 7.5 are c0 = 4.8 ± 3.8 and c1 = -181 ± 3
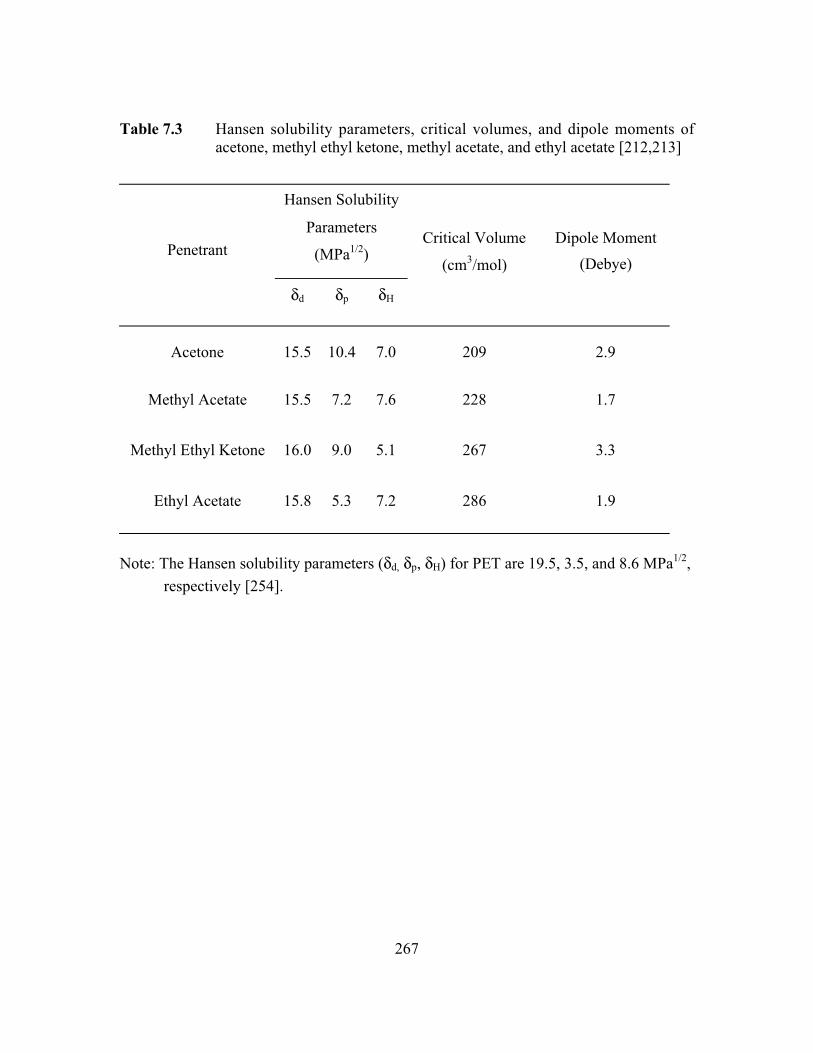
267
Table 7.3 Hansen solubility parameters, critical volumes, and dipole moments ofacetone, methyl ethyl ketone, methyl acetate, and ethyl acetate [212,213]
Hansen Solubility
Parameters
(MPa1/2)Penetrant
dd dp dH
Critical Volume
(cm3/mol)
Dipole Moment
(Debye)
Acetone 15.5 10.4 7.0 209 2.9
Methyl Acetate 15.5 7.2 7.6 228 1.7
Methyl Ethyl Ketone 16.0 9.0 5.1 267 3.3
Ethyl Acetate 15.8 5.3 7.2 286 1.9
Note: The Hansen solubility parameters (dd, dp, dH) for PET are 19.5, 3.5, and 8.6 MPa1/2,
respectively [254].
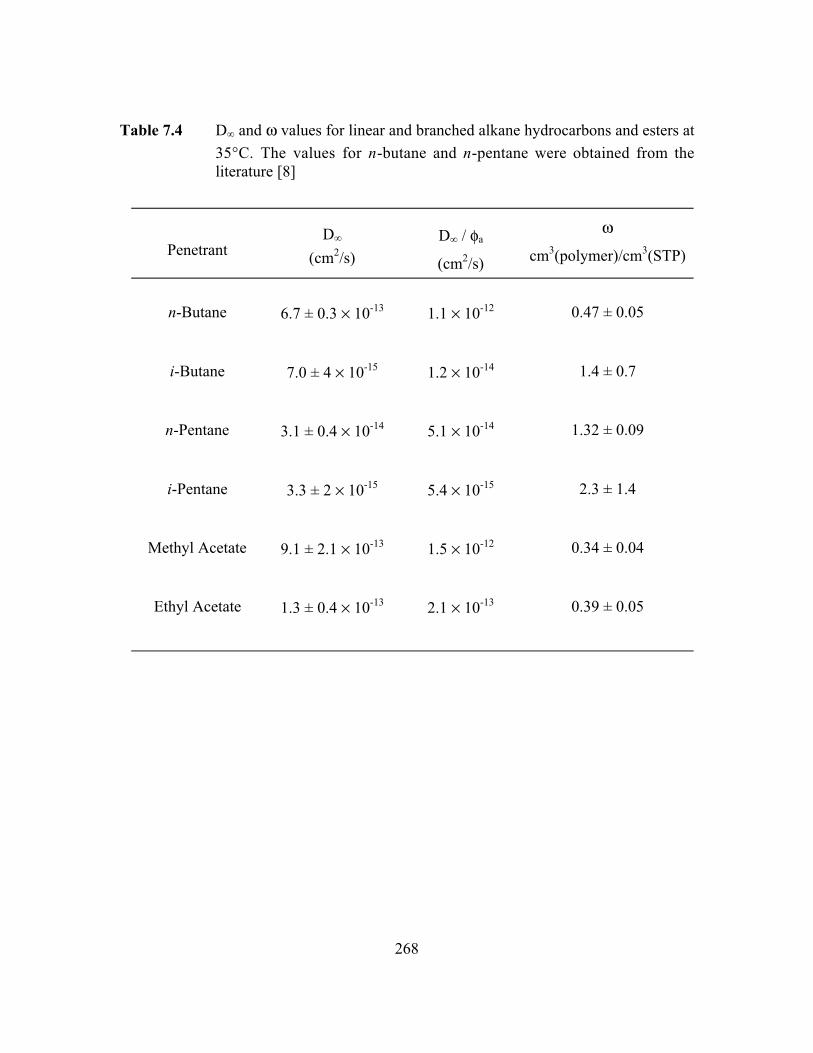
268
Table 7.4 D∞ and w values for linear and branched alkane hydrocarbons and esters at
35°C. The values for n-butane and n-pentane were obtained from theliterature [8]
PenetrantD∞
(cm2/s)D∞ / fa
(cm2/s)
w
cm3(polymer)/cm3(STP)
n-Butane 6.7 ± 0.3 ¥ 10-13 1.1 ¥ 10-12 0.47 ± 0.05
i-Butane 7.0 ± 4 ¥ 10-15 1.2 ¥ 10-14 1.4 ± 0.7
n-Pentane 3.1 ± 0.4 ¥ 10-14 5.1 ¥ 10-14 1.32 ± 0.09
i-Pentane 3.3 ± 2 ¥ 10-15 5.4 ¥ 10-15 2.3 ± 1.4
Methyl Acetate 9.1 ± 2.1 ¥ 10-13 1.5 ¥ 10-12 0.34 ± 0.04
Ethyl Acetate 1.3 ± 0.4 ¥ 10-13 2.1 ¥ 10-13 0.39 ± 0.05
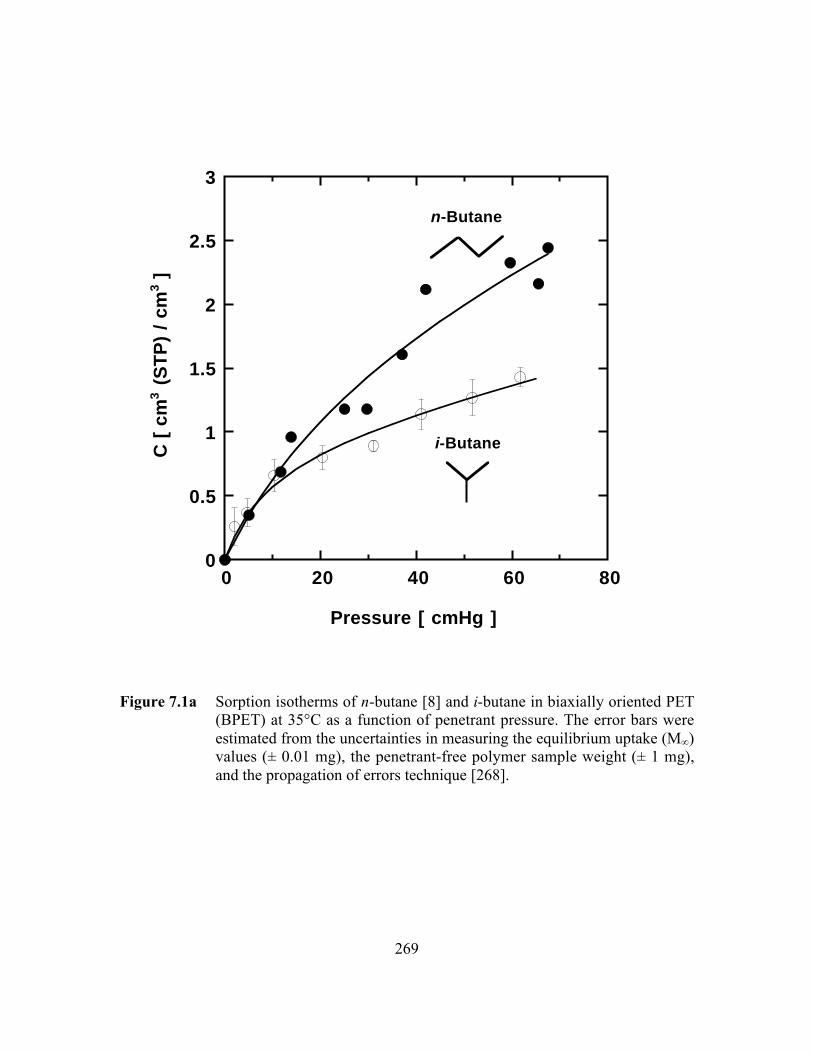
269
0
0.5
1
1.5
2
2.5
3
0 20 40 60 80
C [
cm
3 (
ST
P)
/ cm
3 ]
Pressure [ cmHg ]
n-Butane
i-Butane
Figure 7.1a Sorption isotherms of n-butane [8] and i-butane in biaxially oriented PET(BPET) at 35°C as a function of penetrant pressure. The error bars wereestimated from the uncertainties in measuring the equilibrium uptake (M∞)values (± 0.01 mg), the penetrant-free polymer sample weight (± 1 mg),and the propagation of errors technique [268].
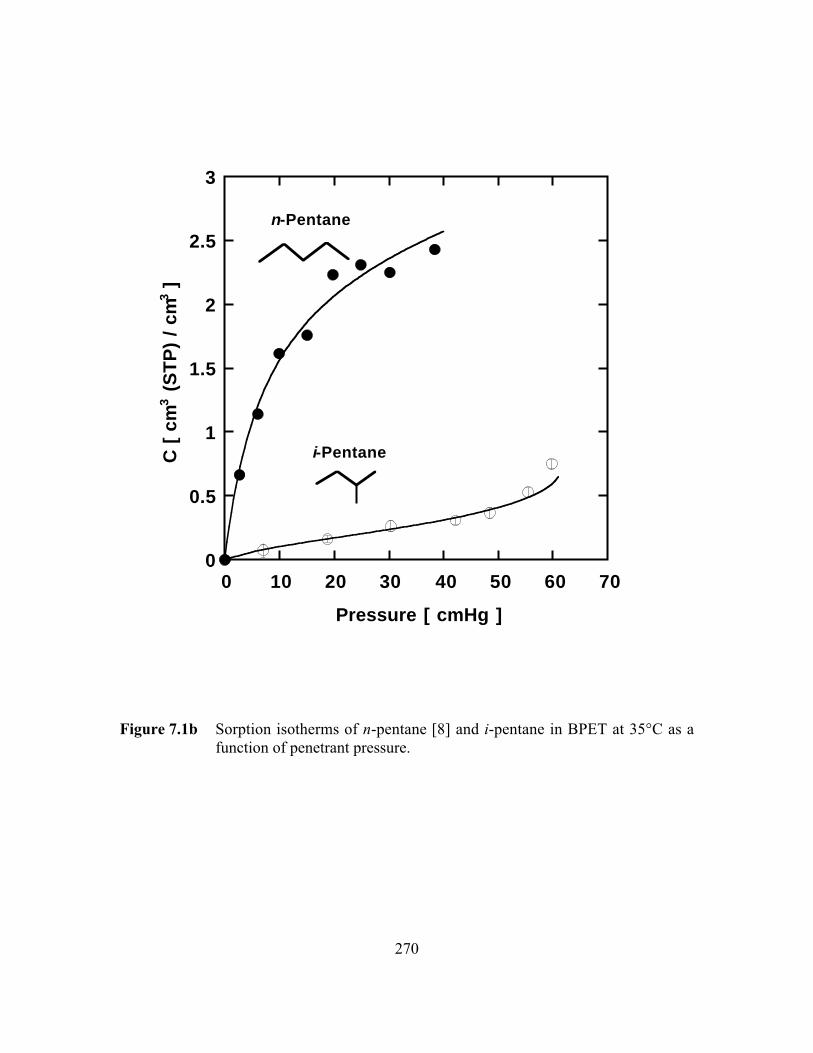
270
0
0.5
1
1.5
2
2.5
3
0 10 20 30 40 50 60 70
C [
cm
3 (
ST
P)
/ cm
3 ]
Pressure [ cmHg ]
n-Pentane
i-Pentane
Figure 7.1b Sorption isotherms of n-pentane [8] and i-pentane in BPET at 35°C as afunction of penetrant pressure.
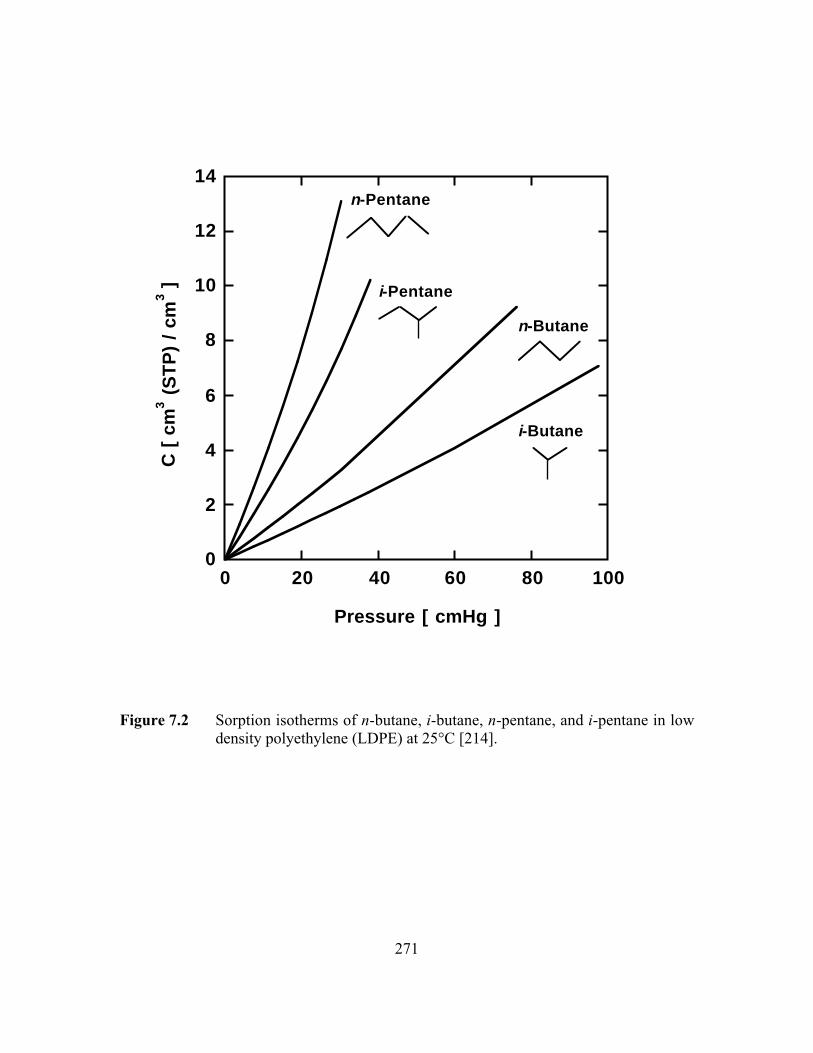
271
0
2
4
6
8
10
12
14
0 20 40 60 80 100
C [
cm
3 (
ST
P)
/ cm
3 ]
Pressure [ cmHg ]
n-Pentane
i-Pentane
n-Butane
i-Butane
Figure 7.2 Sorption isotherms of n-butane, i-butane, n-pentane, and i-pentane in lowdensity polyethylene (LDPE) at 25°C [214].
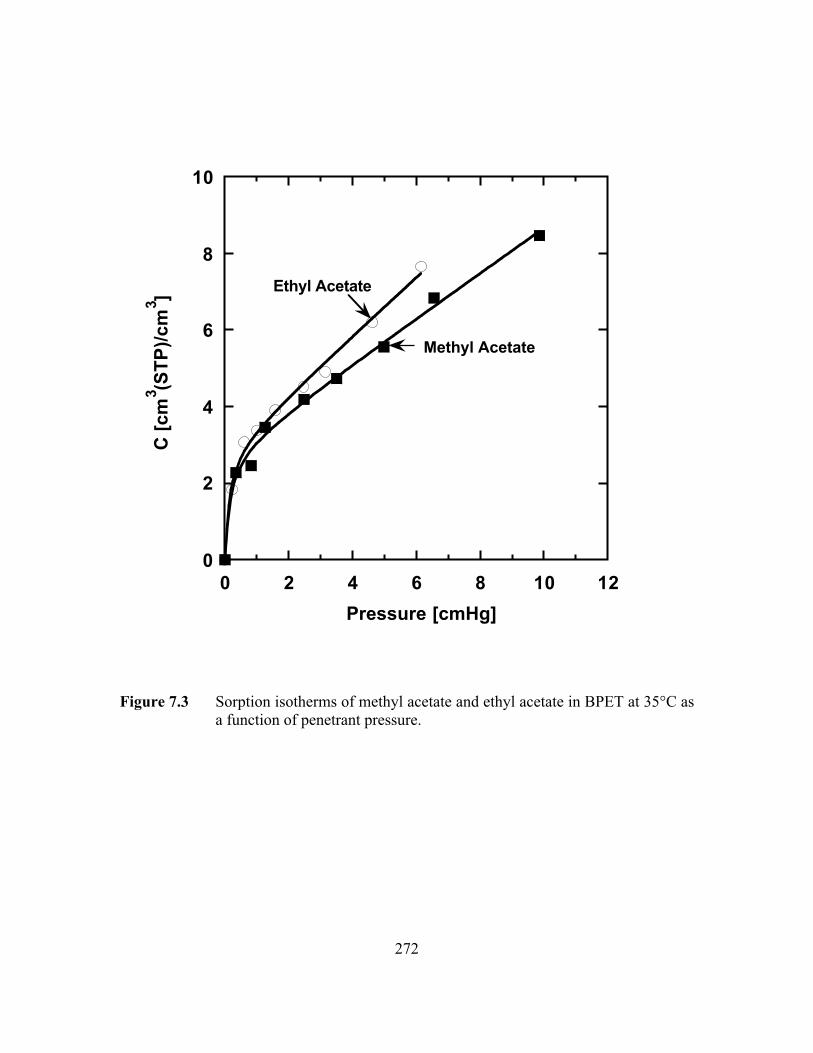
272
0
2
4
6
8
10
0 2 4 6 8 10 12
C [
cm3 (S
TP
)/cm
3 ]
Pressure [cmHg]
Methyl Acetate
Ethyl Acetate
Figure 7.3 Sorption isotherms of methyl acetate and ethyl acetate in BPET at 35°C asa function of penetrant pressure.
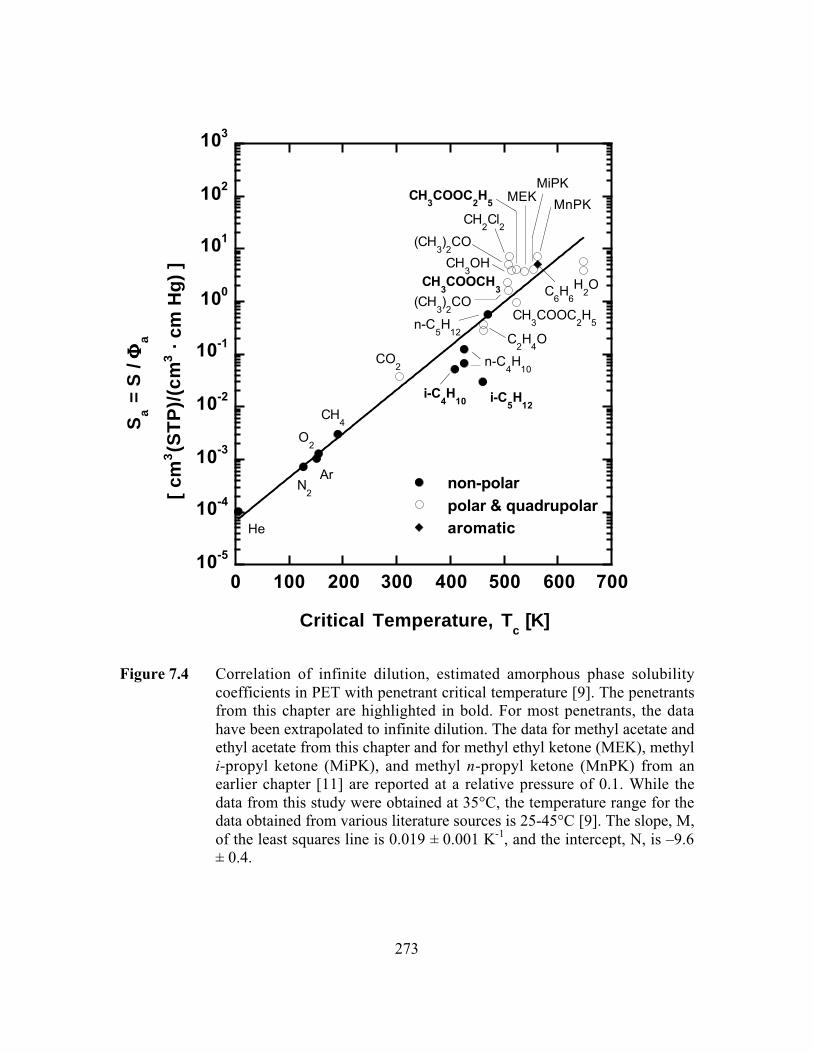
273
10-5
10-4
10-3
10-2
10-1
100
101
102
103
0 100 200 300 400 500 600 700
non-polar
polar & quadrupolararomatic
Sa =
S /
FFFFa
[ cm
3(S
TP
)/(c
m3 ·
cm
Hg)
]
Critical Temperature, Tc [K]
He
Ar
C6H
6
O2
N2
CO2
CH4
n-C4H
10
CH3OH
CH3COOC
2H
5
CH2Cl
2
H2O
C2H
4O
n-C5H
12
(CH3)2CO
i-C4H
10 i-C5H
12
MEKMiPK
MnPKCH
3COOC
2H
5
CH3COOCH
3
(CH3)2CO
Figure 7.4 Correlation of infinite dilution, estimated amorphous phase solubilitycoefficients in PET with penetrant critical temperature [9]. The penetrantsfrom this chapter are highlighted in bold. For most penetrants, the datahave been extrapolated to infinite dilution. The data for methyl acetate andethyl acetate from this chapter and for methyl ethyl ketone (MEK), methyli-propyl ketone (MiPK), and methyl n-propyl ketone (MnPK) from anearlier chapter [11] are reported at a relative pressure of 0.1. While thedata from this study were obtained at 35°C, the temperature range for thedata obtained from various literature sources is 25-45°C [9]. The slope, M,of the least squares line is 0.019 ± 0.001 K-1, and the intercept, N, is –9.6± 0.4.

274
0
2
4
6
8
10
0 0.2 0.4 0.6 0.8
C [
cm3 (S
TP
)/cm
3 ]
Activity [ P / Psat
]
Methyl Acetate
Ethyl Acetate
n-Butane
i-Butane
n-Pentane
i-Pentane
Figure 7.5 Sorption isotherms of methyl acetate (B), ethyl acetate (J), n-butane [8](H), n-pentane [8] (A), i-butane (C), and i-pentane (F) in BPET at 35°Cas a function of relative pressure.
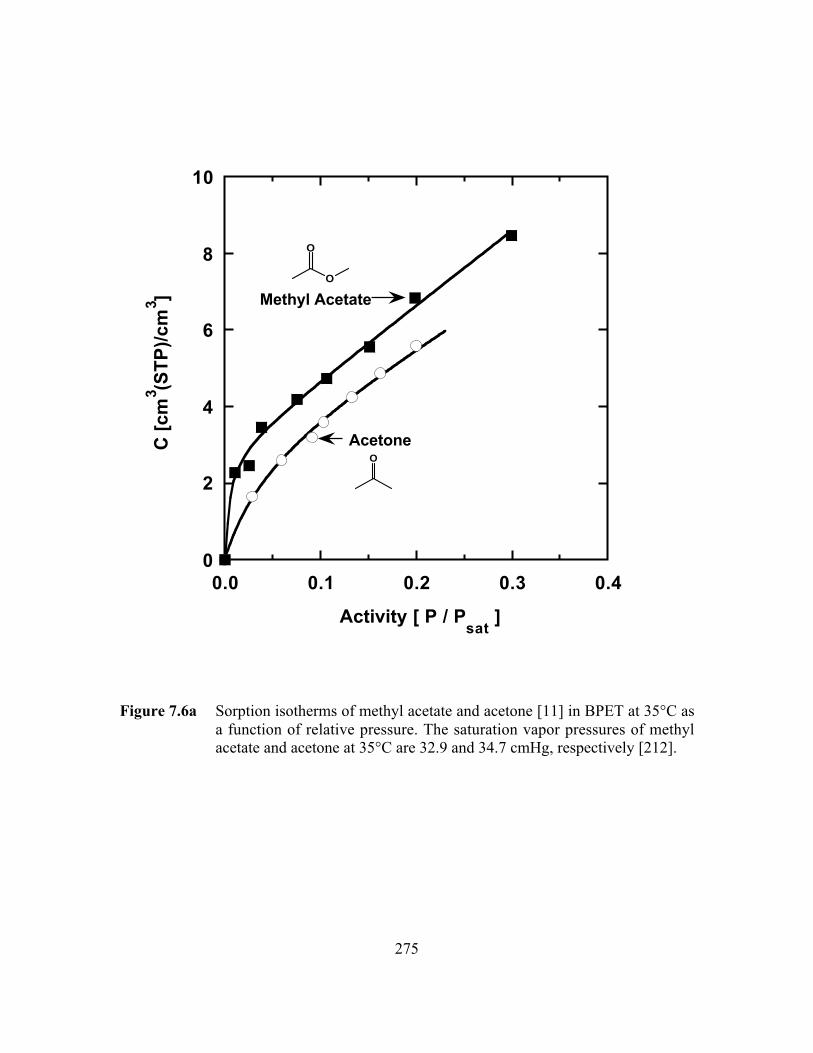
275
0
2
4
6
8
10
0.0 0.1 0.2 0.3 0.4
C [
cm3 (S
TP
)/cm
3 ]
Activity [ P / Psat
]
Methyl Acetate
Acetone
O
O
O
Figure 7.6a Sorption isotherms of methyl acetate and acetone [11] in BPET at 35°C asa function of relative pressure. The saturation vapor pressures of methylacetate and acetone at 35°C are 32.9 and 34.7 cmHg, respectively [212].
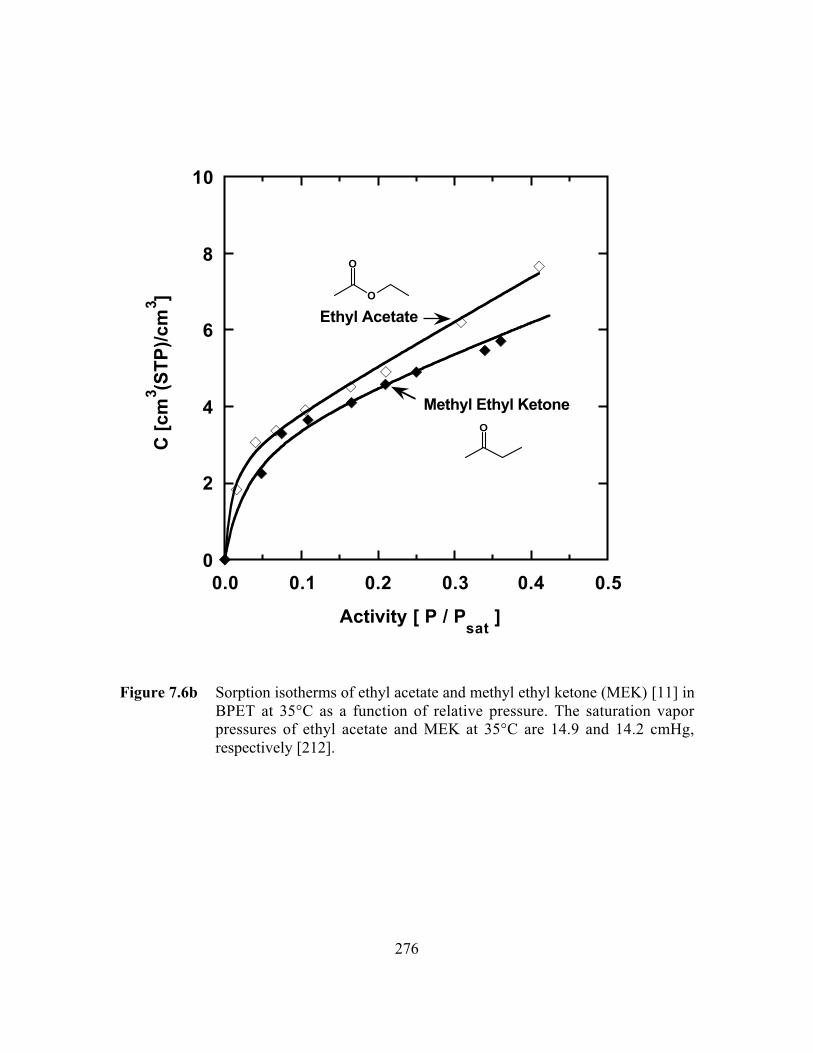
276
0
2
4
6
8
10
0.0 0.1 0.2 0.3 0.4 0.5
C [
cm3 (S
TP
)/cm
3 ]
Activity [ P / Psat
]
Ethyl Acetate
Methyl Ethyl Ketone
O
O
O
Figure 7.6b Sorption isotherms of ethyl acetate and methyl ethyl ketone (MEK) [11] inBPET at 35°C as a function of relative pressure. The saturation vaporpressures of ethyl acetate and MEK at 35°C are 14.9 and 14.2 cmHg,respectively [212].
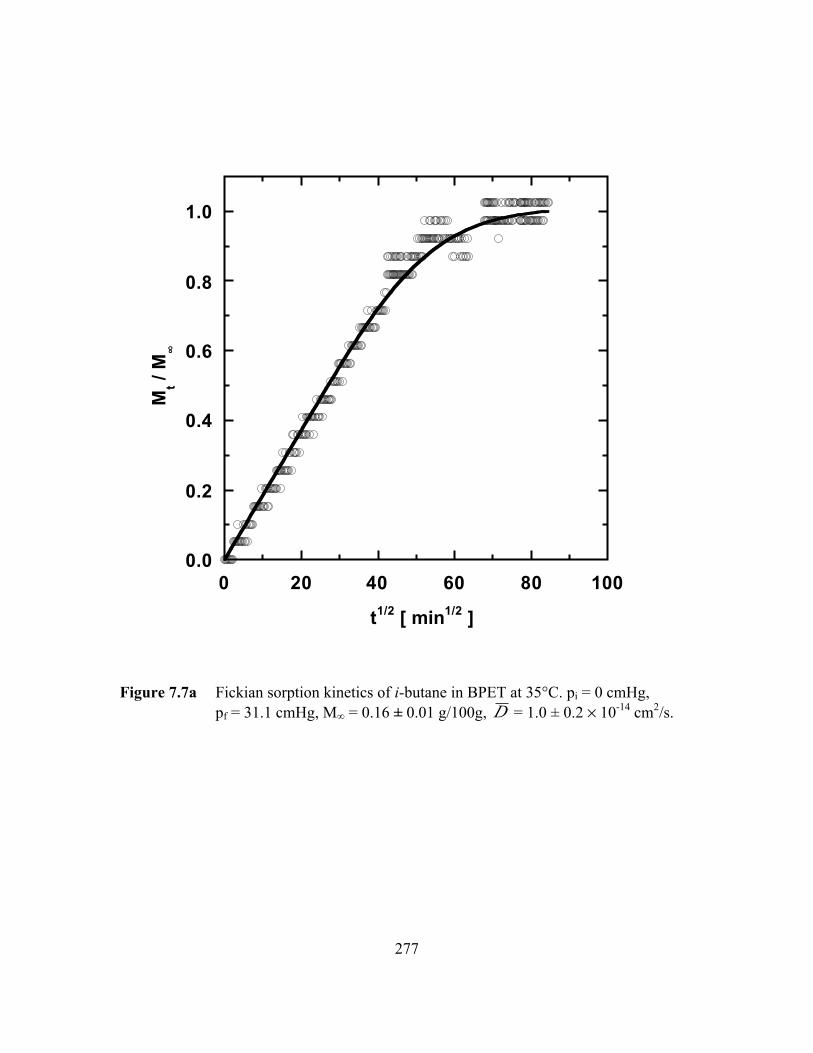
277
0.0
0.2
0.4
0.6
0.8
1.0
0 20 40 60 80 100
Mt /
M∞
t1/2 [ min1/2 ]
Figure 7.7a Fickian sorption kinetics of i-butane in BPET at 35°C. pi = 0 cmHg,pf = 31.1 cmHg, M∞ = 0.16 ± 0.01 g/100g, D = 1.0 ± 0.2 ¥ 10-14 cm2/s.
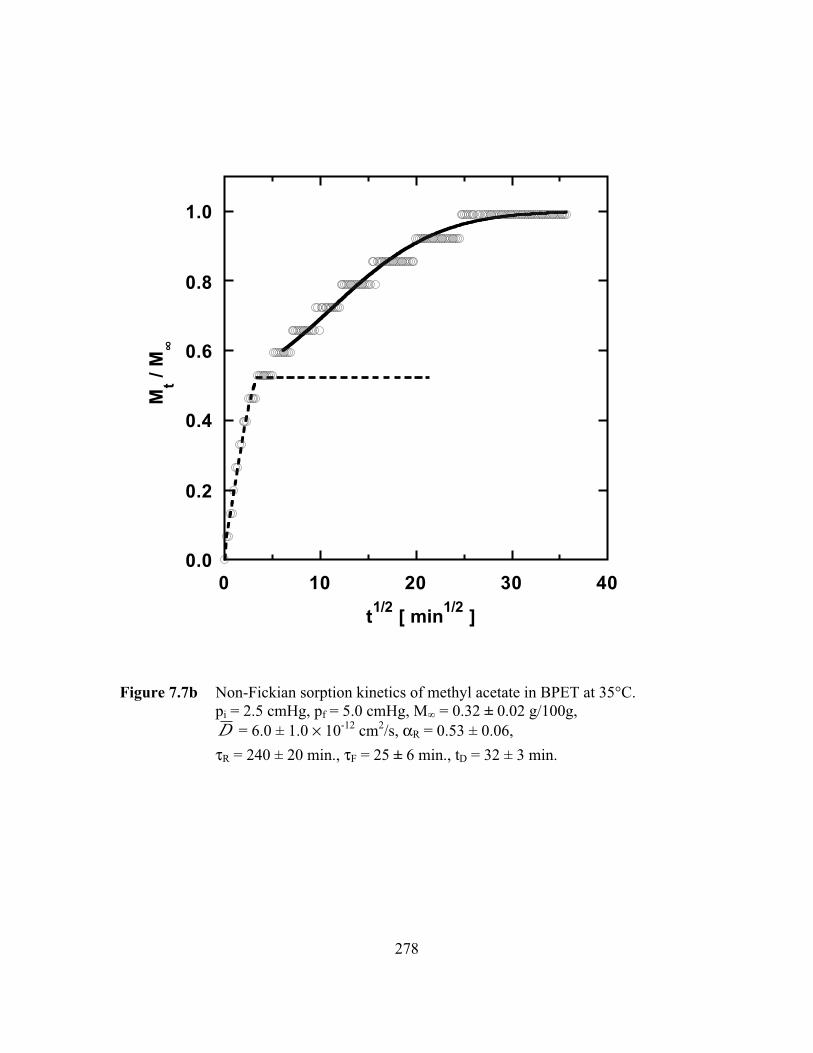
278
0.0
0.2
0.4
0.6
0.8
1.0
0 10 20 30 40
Mt /
M∞
t1/2
[ min1/2
]
Figure 7.7b Non-Fickian sorption kinetics of methyl acetate in BPET at 35°C.pi = 2.5 cmHg, pf = 5.0 cmHg, M∞ = 0.32 ± 0.02 g/100g,D = 6.0 ± 1.0 ¥ 10-12 cm2/s, aR = 0.53 ± 0.06,
tR = 240 ± 20 min., tF = 25 ± 6 min., tD = 32 ± 3 min.

279
10- 1 6
10- 1 5
10- 1 4
10- 1 3
10- 1 2
10- 1 1
0 0.5 1 1.5 2 2.5
D [
cm
2/s
]
C [ cm 3(STP) / cm 3 ]
n-Butane
i-Butane
n-Pentane
i-Pentane
10- 1 0
Figure 7.8 Effect of average concentration on apparent diffusion coefficients of linear[8] and branched alkane hydrocarbons in BPET at 35°C.
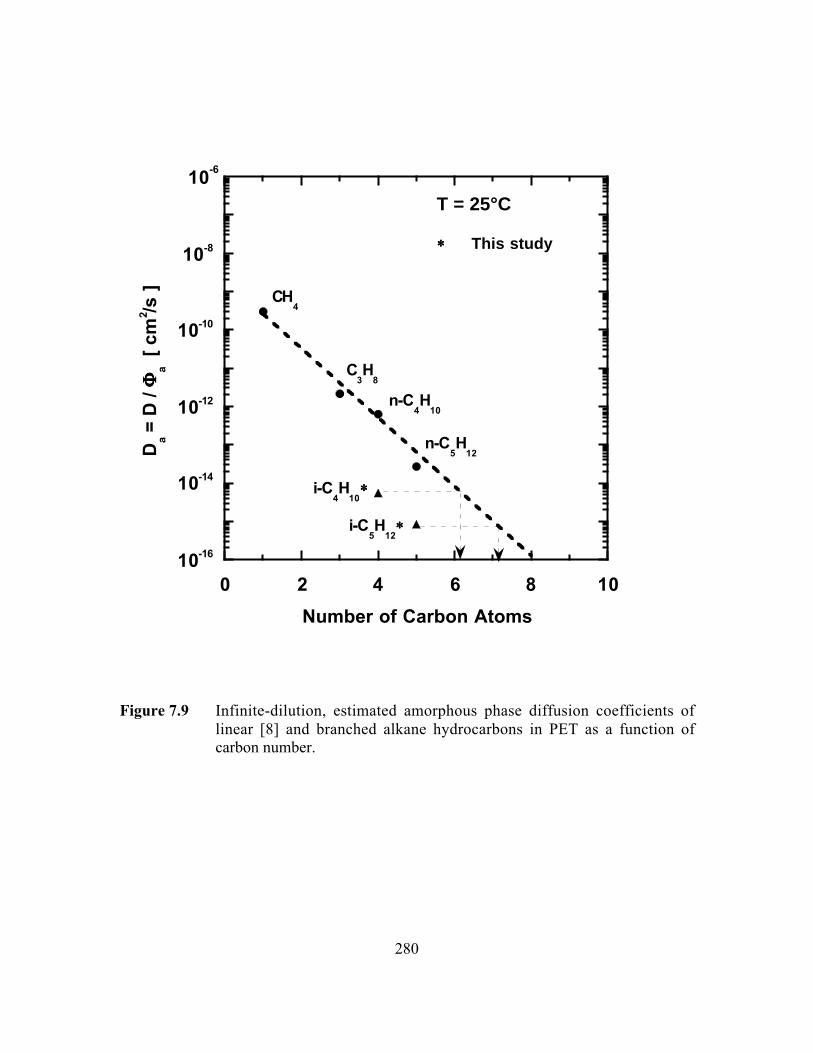
280
10-16
10-14
10-12
10-10
10-8
0 2 4 6 8 10
Number of Carbon Atoms
10-6
CH4
C3H
8
n-C4H
10
n-C5H
12
i-C4H
10****
i-C5H
12****
T = 25°C
**** This study
Da =
D /
FFFFa
[ cm
2 /s ]
Figure 7.9 Infinite-dilution, estimated amorphous phase diffusion coefficients oflinear [8] and branched alkane hydrocarbons in PET as a function ofcarbon number.
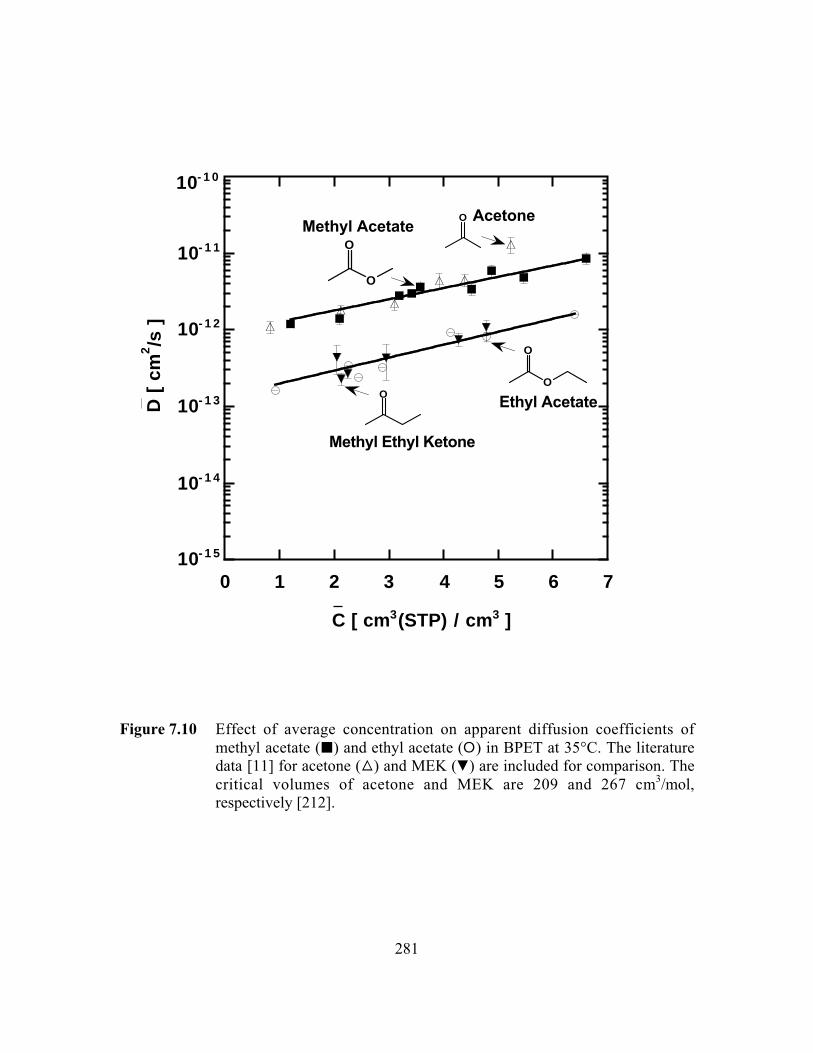
281
10- 1 5
10- 1 4
10- 1 3
10- 1 2
10- 1 1
0 1 2 3 4 5 6 7
C [ cm 3(STP) / cm 3 ]
O
O
10- 1 0
D [
cm
2/s
]
O
O
O
O
Methyl Acetate
Ethyl Acetate
Acetone
Methyl Ethyl Ketone
Figure 7.10 Effect of average concentration on apparent diffusion coefficients ofmethyl acetate (B) and ethyl acetate (E) in BPET at 35°C. The literaturedata [11] for acetone (C) and MEK (P) are included for comparison. Thecritical volumes of acetone and MEK are 209 and 267 cm3/mol,respectively [212].

282
10-15
10-13
10-11
10-9
10-7
10-5
0 100 200 300 400 500
branched penetrants
Da =
D /
FFFFa
[ cm
2 /s ]
Critical volume, Vc [ cm3/mol ]
-T = 35°C
He
O2
N2
CO2
CH4
H2O
Ar
CH2Cl
2
C3H
8
C6H
6
n-C4H
10
n-C5H
12
(CH3)2CO
i-C5H
12
i-C4H
10
CH3COOC
2H
5
CH3COOCH
3
MEK
MiPK
MnPK
Figure 7.11 Effect of penetrant size on infinite-dilution, estimated amorphous phasediffusion coefficients in PET at 35°C. The penetrants from this chapter arehighlighted in bold. The best-fit parameters of Equation 7.11 are h = 8.4 ±
1.0, t = 4.4 ± 1.2 ¥ 107 (cm2/s (cm3/mol)8.4).

283
CHAPTER 8
Sorption and Diffusion of
Toluene and CO2 in Biaxially Oriented
Poly(ethylene terephthalate)
284
8.1 Summary
This chapter presents results from kinetic gravimetric sorption and dual volume
pressure decay sorption studies of toluene and CO2 in biaxially oriented PET (BPET)
films at 35°C and 25°C, respectively. Sorption isotherms of toluene and CO2 are well
described by the dual-mode sorption model. Sorption kinetics of both penetrants are
described either by Fickian diffusion or a two-stage model incorporating Fickian
diffusion at short times and protracted polymer structural relaxation at long times.
Diffusion coefficients of toluene increase with increasing penetrant concentration.
Toluene and CO2 are the largest and smallest penetrant whose sorption and diffusion
coefficients were measured in BPET film during this Ph.D. dissertation. Hence, toluene
exhibits the highest solubility and one of the lowest diffusion coefficients, whereas CO2
exhibits the lowest solubility and highest diffusion coefficient among all the penetrants
studied. As discussed in the next section, CO2 was selected in order to compare its
sorption and diffusion coefficients in BPET films with available literature values for
thicker PET films and understand the extent to which the vapor sorption results from this
dissertation are applicable to thicker PET films used in practice.
8.2 Introduction
The primary objective of this research project was to characterize the sorption and
transport properties of large organic compounds in PET. The conventional gravimetric
sorption techniques are limited to penetrants with high vapor pressures, as discussed in
Chapter 4. Therefore, a new experimental technique was developed which extends the

285
measurement capability of the McBain quartz spring balance and is suitable for
penetrants with vapor pressures as low as 10-7 mmHg. This technique makes it possible to
overcome the limitations of current generation gravimetric sorption techniques and
measure the solubility and diffusivity of larger and much more condensable penetrants.
To demonstrate the efficacy of this technique, sorption and diffusion coefficients of
toluene, the largest and most condensable penetrant selected in this research project, were
measured in BPET films.
Sorption and transport properties of glassy polymers, such as PET, depend on the
processing history of the sample, as discussed in Chapter 6. Conventional PET films used
in practice can be significantly thicker and have a different processing history than the
PET films used in this study. To provide a basis for understanding the extent to which the
vapor sorption and transport results from this dissertation are applicable to conventional
PET films, it is necessary to compare sorption and transport properties of a light gas, such
as CO2, in the thin BPET films with extensive literature data available for thicker films.
Therefore, CO2 permeation experiments were attempted using steady-state permeation
equipment (at high upstream pressures (up to 5 atm) and with the downstream at vacuum
condition). All samples were masked on both sides along the perimeter using aluminum
tape. Also, extreme care was taken while evacuating the permeation cell; the downstream
was evacuated first by slowly opening the vacuum valve and a similar procedure was
later repeated for the upstream side of the sample. However, several attempts to perform
these experiments failed, possibly due to the presence of pinholes in the BPET films
(presumably resulting from high orientation). The BPET films were also sent to Ms. Yu
286
(Ivy) Huang (a member of Dr. Donald Paul’s research group), who has considerable
experience with permeation measurements of ultra-thin films. She tested several samples
after ensuring that they were properly masked and completely flat inside the permeation
cell. None of her attempts resulted in successful permeation measurements. The
measured flux was too high, suggesting the presence of pinholes in the films. Therefore,
CO2 sorption and diffusion coefficients were determined in separate experiments, and
steady state CO2 flux was not measured directly. The dual volume pressure decay
technique (described in Chapter 3) was used to obtain CO2 solubility coefficients at high
pressures, and gravimetric sorption experiments were performed to obtain CO2 diffusion
coefficients at low pressures.
8.3 Experimental
8.3.1 Materials
Biaxially oriented PET films having a uniform nominal thickness of 0.9 mm were
purchased from Goodfellow Co. (Berwyn, PA) and used as received. The complete
details of sample characterization techniques and corresponding results and discussion
have been presented in Chapter 3. High-performance liquid chromatographic (HPLC)
grade toluene (99.9% purity) was purchased from Sigma-Aldrich Corp. (St. Louis, MO).
It was subjected to several freeze-thaw cycles to remove dissolved gases before use.
Alphagaz grade CO2 gas was purchased from Air Liquide (Houston, TX) and used as
received.
287
8.3.2 Gravimetric Sorption
Integral kinetic gravimetric sorption experiments were performed using the new
technique with He carrier gas (described in Chapter 4) for toluene and the traditional
McBain spring balance technique (described in Chapter 3) for CO2. The quartz spring
was supplied by Ruska Industries (Houston, TX) and had spring constant of 3.03 mm/mg.
8.3.3 Dual Volume Pressure Decay Sorption
CO2 sorption experiments were performed at 25°C and pressures in the range of 2
to 11 atm using the dual volume pressure decay sorption technique, as described in
Chapter 3.
8.4 Results and Discussion
8.4.1 Equilibrium Sorption and Uptake Kinetics of Toluene in PET
Integral kinetic gravimetric sorption experiments were used to obtain a sorption
isotherm of toluene in BPET at 35°C, and this result is presented in Figure 8.1. The
isotherm is well described by the dual-mode sorption model [18]:
C k p Cbp
bpD H= + ¢+
ÊËÁ
ˆ¯̃1
(8.1)
where kD is the Henry’s Law coefficient, CH´ is the Langmuir capacity parameter, and b
is the Langmuir affinity parameter. The curve in Figure 8.1 represents a least-squares fit
of the experimental sorption data to Equation 8.1. The dual-mode sorption parameters of
toluene are reported in Table 8.1. Based on the estimated liquid density of toluene at
288
35°C [212], the CH´/r* value for toluene is 0.016 ± 0.005, which is similar to the CH´/r*
values for the linear alkane hydrocarbons (0.010 – 0.013), ketones (0.009 – 0.014), and
esters (0.010 – 0.013) reported earlier in this dissertation (cf. Chapters 5, 6, and 7).
Figure 8.2 presents the solubility of toluene along with other literature data for
PET on the solubility correlation plot from Chapter 7. In general, for the vapor sorption
data in Figure 8.2, infinite-dilution solubility values were obtained by extrapolating the
reported solubility values to zero concentration. However, the data for ketones and esters
from this dissertation were reported at an activity of 0.1 because of the scatter in the data
at low activity (cf. Chapters 6 and 7). The solubility coefficient of toluene is also reported
at the same activity, and it is in good agreement with the model.
Figures 8.3(a,b) present results from two representative kinetic sorption
experiments of toluene in BPET at 35°C. In both cases, the fractional mass uptake Mt/M∞
increases linearly with t1/2 for short times and this behavior is characteristic of sorption
kinetics controlled by Fickian diffusion. However, at longer times, the fractional mass
uptake may exhibit a protracted, asymptotic approach towards equilibrium, as seen in
Figure 8.3b. As discussed previously for alkanes, ketones, and esters, this behavior is
ascribed to mass uptake kinetics limited by polymer swelling and structural
rearrangement to accommodate the penetrant rather than Fickian diffusion. The sorption
kinetics are often described using the following empirical model [8]:
M
M n
D n t
l
t tH tt
Rn
RD
RD
• =
•
= - -+
- +ÊËÁ
ˆ¯̃
ÏÌÓ
¸˝˛
+ ¥- -Ê
ËÁˆ¯̃
¥ ( )Â1 18 1
2 12 1
2 2
2 2
20
( )( )
exp( )
exp( )a
pp a
t(8.2)
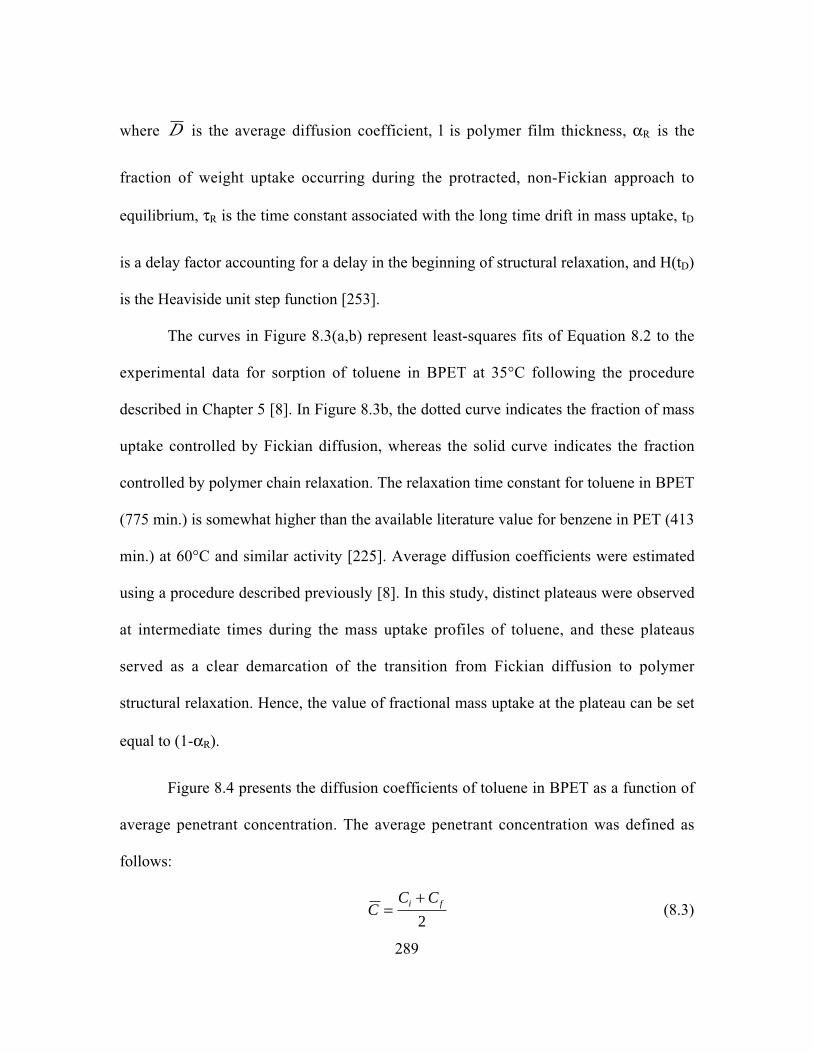
289
where D is the average diffusion coefficient, l is polymer film thickness, aR is the
fraction of weight uptake occurring during the protracted, non-Fickian approach to
equilibrium, tR is the time constant associated with the long time drift in mass uptake, tD
is a delay factor accounting for a delay in the beginning of structural relaxation, and H(tD)
is the Heaviside unit step function [253].
The curves in Figure 8.3(a,b) represent least-squares fits of Equation 8.2 to the
experimental data for sorption of toluene in BPET at 35°C following the procedure
described in Chapter 5 [8]. In Figure 8.3b, the dotted curve indicates the fraction of mass
uptake controlled by Fickian diffusion, whereas the solid curve indicates the fraction
controlled by polymer chain relaxation. The relaxation time constant for toluene in BPET
(775 min.) is somewhat higher than the available literature value for benzene in PET (413
min.) at 60°C and similar activity [225]. Average diffusion coefficients were estimated
using a procedure described previously [8]. In this study, distinct plateaus were observed
at intermediate times during the mass uptake profiles of toluene, and these plateaus
served as a clear demarcation of the transition from Fickian diffusion to polymer
structural relaxation. Hence, the value of fractional mass uptake at the plateau can be set
equal to (1-aR).
Figure 8.4 presents the diffusion coefficients of toluene in BPET as a function of
average penetrant concentration. The average penetrant concentration was defined as
follows:
CC Ci f=
+2
(8.3)
290
where Ci and Cf are the penetrant concentrations at the beginning and end of the sorption
experiment, respectively. The logarithm of diffusion coefficient increases approximately
linearly with penetrant concentration, consistent with earlier studies with alkane
hydrocarbons, ketones, and esters in BPET (cf. Chapters 5-7). The following empirical
model was used [8]:
D D C= • exp( )w (8.4)
where D∞ is the infinite-dilution diffusion coefficient and the slope, w, characterizes the
dependence of D on C . D∞ and w values for toluene are 3.0 ± 0.5 ¥ 10-14 cm2/s and 0.69
± 0.09, respectively.
Figure 8.5 presents the infinite dilution, estimated amorphous phase diffusion
coefficient of toluene at 35°C on the diffusivity correlation plot from Chapter 7.
According to this empirical model, diffusion coefficients decrease according to a power
law relation with increasing penetrant critical volume, and toluene diffusion coefficient is
in excellent agreement with the model.
8.4.2 Equilibrium Sorption and Uptake Kinetics of CO2 in PET
Dual volume pressure decay sorption experiments were performed to obtain a
sorption isotherm of CO2 in BPET at 25°C and for pressures in the range of 2-11 atm.
The sorption isotherm, presented in Figure 8.6, is concave to the pressure axis and can be
described by the dual-mode sorption model, as described in the previous section (cf.
Equation 8.1). The dual-mode sorption model parameters for CO2 are recorded in Table
291
8.1. Based on the saturated liquid density of CO2 (0.85 g/cc) [16], the CH´/r* value for
CO2 is 0.013 ± 0.001, which is in good agreement with the corresponding values for the
alkane hydrocarbons, ketones, and esters reported earlier in this dissertation. This value is
also in reasonable agreement with the CH´/r* values for CO2 reported in the literature by
Koros and Paul (0.018) [16], Michaels et al. (0.012) [10], Veith et al. (0.013) [229], and
Fenelon (0.014) [269].
The CO2 sorption isotherm from this study is compared with literature data in
Figures 8.7 and 8.8. In Figure 8.7, the comparison is made on a semicrystalline basis (i.e.,
without any corrections for the effect of crystallinity on CO2 concentration in the
polymer). There are significant differences between the solubility values obtained from
various literature sources. Some of the solubility differences could be due to differences
in the crystallinities of the PET samples. The effects of morphology, orientation, and
crystallinity on the sorption and transport properties of PET are complex, as noted in
Chapter 6, and these effects could result in the observed differences in CO2 solubility
values.
In Figure 8.8, the concentrations are adjusted to an amorphous basis using the
following relation, which has been used previously for CO2 in PET [10]:
CC
aa
=f
(8.5)
where C is CO2 concentration and fa is amorphous phase volume fraction. For the
literature data reported in Figure 8.8, the values of fc were calculated (and in some cases,
292
the reported crystallinity values were adjusted) using the reported density values and the
following relation:
f r rr rc
a
c a
=--
ÊËÁ
ˆ¯̃
(8.6)
where fc is crystalline phase volume fraction and r, rc and r a are densities of the
semicrystalline polymer sample, wholly crystalline PET, and wholly amorphous PET,
respectively. We used the constant and widely reported amorphous and crystalline
density values of 1.335 g/cm3 and 1.515 g/cm3, respectively [8,12,76,195].
As can be seen in Figure 8.8, on an amorphous basis, the data from this study are
in good agreement with solubility data reported by Koros and Paul [16] for a 51 µm
thick, biaxially oriented, semicrystalline PET film and with those reported by Zhang et al.
[270] for an 0.5 µm thick, spin-cast, semicrystalline PET film. However, there are
significant differences between CO2 solubility coefficients obtained from various
literature sources [10,16,229,234]. This result again highlights the complex effect of
morphology, orientation, and crystallinity on the sorption and transport properties of
PET, as mentioned above. Such effects have been and continue to be the subject of active
research. Several literature studies have reported that sample processing history affects
morphology of both the crystalline and non-crystalline phases and that these
morphological differences can manifest themselves in the sorption and transport
properties of the sample (cf. Chapter 6).
Integral kinetic gravimetric sorption experiments of CO2 in BPET were performed
at 25°C and for pressures ranging from 0 to approximately 76 cmHg. The equilibrium
293
solubility data from these experiments are also presented in Figures 8.7 and 8.8. Average
diffusion coefficients were estimated using the procedure described previously [8]. The
concentration (or pressure) dependence of diffusion coefficients was described by using
the so-called dual mobility model, as discussed below.
Dual Mobility Model
This model of the concentration dependence of diffusivity in glassy polymers is
based on the notion that the two populations of penetrant molecules (i.e., Henry’s Law
and Langmuir) in the dual-mode model have different mobilities [271]. In this so-called
dual mobility model, one-dimensional penetrant transport is described by the following
form of Fick’s law [225]:
N DdC
dxD
dC
dxHH
DD= - - (8.7)
where N is penetrant flux, CD and DD are the penetrant concentration and diffusion
coefficient in the dense, equilibrium polymer matrix (Henry’s law mode), and CH and DH
are the penetrant concentration and diffusion coefficient in the non-equilibrium excess
volume (Langmuir mode). Within the context of the dual mobility model, the average
diffusion coefficient determined in integral kinetic gravimetric sorption experiments is
[225]:
D DFK bp
K bpD=+ +
+ +ÈÎÍ
˘˚˙
1 11 1
/ ( )/ ( )
(8.8)
where p is penetrant pressure at the end of integral kinetic gravimetric sorption
experiments, K=CH´b/kD and F=DH/DD. This model has been used to describe pressure
294
dependence of diffusion of CO2, acetone, and benzene in PET [27,225,271]. In the case
of acetone, DD and DH were taken to be concentration dependent [27]. In this study, DH
and DD were assumed to be independent of concentration. Figure 8.9 presents the average
diffusion coefficients of CO2 as a function of CO2 pressure. Due to experimental
difficulties, such as fast kinetics and low CO2 uptake at low pressures, diffusion data
could be obtained only in a narrow pressure range. From a non-linear regression analysis
method, value of DD for CO2 in BPET was estimated to be 3.4 ± 1.6 ¥ 10-10 and F << 1.
The curve-fit in Figure 8.9 is based on Equation 8.8 (in the limit F << 1) and the value of
DD noted above.
Table 8.2 presents a comparison of DD value from this study with available
literature values [234,271,272]. The DD values were adjusted to an amorphous basis
using the following two-phase model [20]:
DD
D aD
a, =
f(8.9)
where DD,a is amorphous phase diffusion coefficient. The estimated amorphous phase DD
value from this study is approximately a factor of 3 to 8 times lower than the literature
values. The literature data were reported for much thicker films and the effects of
morphology, crystallinity, and orientation (i.e., processing history) mentioned above (in
connection with sorption) are likely to be more complex for diffusion. For example,
orientation and aspect ratios of impermeable crystalline phases affect penetrant flux [4].
Thus, penetrant diffusion coefficients are affected by not only the amount of crystallinity,
but also by the larger scale geometry and spatial distribution of these regions.
295
Additionally, the noncrystalline regions of BPET are much more oriented than those in
the unoriented PET samples studied by Toi et al. and Brolly et al., and previous studies
(cf. Section 6.3.2 in Chapter 6) suggest that orientation in PET leads to more efficient
chain packing, thereby reducing the overall free volume and, in turn, diffusion
coefficients. Also, the diffusion coefficients in this study were obtained from a non-
steady state, kinetic gravimetric sorption technique, while the literature values were
estimated from steady state permeability techniques, and the experimental technique used
can have an effect on the observed diffusion coefficient values [273]. For example,
Barrer et al. reported the diffusion coefficient of argon in
poly(tetraethyleneglycoldimethacrylate) at 60°C from desorption kinetics and steady state
permeation and sorption measurement as 3.2 ¥ 10-9 and 6.3 ¥ 10-9 cm2/s, respectively
[273].
CO2 permeability coefficients can be estimated using the following relation [271]:
P k DFK
bpD D= ++
È
ÎÍ
˘
˚˙1
1 2( )(8.10)
where P is CO2 permeability coefficient, and p2 is upstream pressure (downstream
pressure is assumed to be zero). Using the above equation, at p2=10 atm, the estimated
CO2 permeability coefficient in BPET is 0.07 Barrer. To compare the CO2 permeability
coefficient in BPET with literature data for various amorphous and semicrystalline PET
samples, the permeability values were adjusted to an amorphous basis using the two-
phase model [20]:
296
PP
aa
=f 2 (8.11)
where Pa is amorphous phase permeability. Using the above equation, the Pa value for
CO2 in BPET at 10 atm is 0.18 Barrer.
Table 8.2 presents a comparison of the estimated CO2 permeability coefficient
from this study with literature data [20,54,234,271,272,274]. The estimated amorphous
permeability coefficient of CO2 in BPET from this study is in good agreement with the
value reported by McGonigle et al. [54] for a 230 µm thick, amorphous PET film.
However, the estimated amorphous permeability value from this study is lower than the
other literature values reported in Table 8.2; the largest difference can be seen between
the permeability value in the BPET film and the value reported by Koros and Paul [271]
for a 51 µm thick, biaxially oriented, semicrystalline PET film. As discussed before,
sample processing history (i.e., morphology, crystallinity, orientation) influences
transport properties of CO2 in PET. As can be seen in Table 8.2, most of the available
CO2 permeability values are for unoriented PET films (except for the sample used by
Koros and Paul), and orientation has been reported to reduce permeability of small
molecules in PET. For example, 4 ¥ 4 biaxial orientation reduced O2 permeability in PET
by a factor of two [24]. So, while the sample crystallinity differences were accounted for
crudely by adjusting the permeability values to an amorphous basis (using Equation
8.11), differences in sample orientation can lead to differences in CO2 permeability
values, and these differences are not accounted for in adjustments to the permeability
values. Also, CO2 permeability typically decreases with increasing upstream pressure
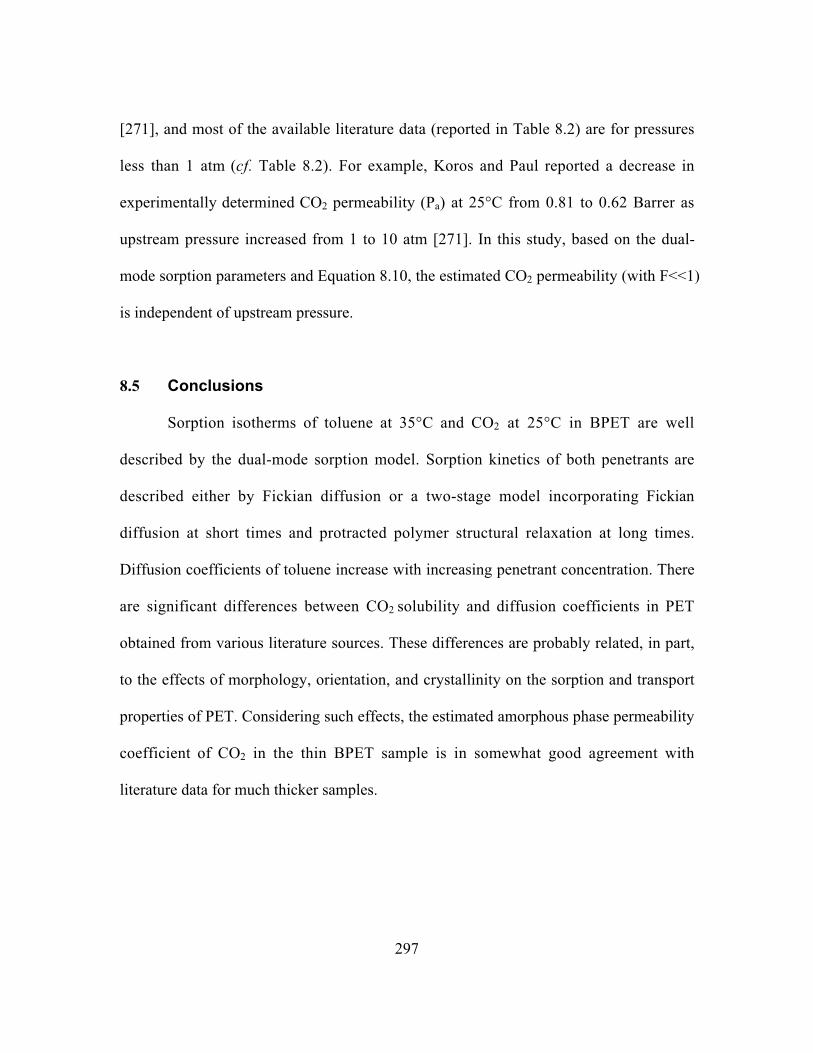
297
[271], and most of the available literature data (reported in Table 8.2) are for pressures
less than 1 atm (cf. Table 8.2). For example, Koros and Paul reported a decrease in
experimentally determined CO2 permeability (Pa) at 25°C from 0.81 to 0.62 Barrer as
upstream pressure increased from 1 to 10 atm [271]. In this study, based on the dual-
mode sorption parameters and Equation 8.10, the estimated CO2 permeability (with F<<1)
is independent of upstream pressure.
8.5 Conclusions
Sorption isotherms of toluene at 35°C and CO2 at 25°C in BPET are well
described by the dual-mode sorption model. Sorption kinetics of both penetrants are
described either by Fickian diffusion or a two-stage model incorporating Fickian
diffusion at short times and protracted polymer structural relaxation at long times.
Diffusion coefficients of toluene increase with increasing penetrant concentration. There
are significant differences between CO2 solubility and diffusion coefficients in PET
obtained from various literature sources. These differences are probably related, in part,
to the effects of morphology, orientation, and crystallinity on the sorption and transport
properties of PET. Considering such effects, the estimated amorphous phase permeability
coefficient of CO2 in the thin BPET sample is in somewhat good agreement with
literature data for much thicker samples.

298
8.6 Acknowledgment
The author wishes to thank Ms. Yu (Ivy) Huang (University of Texas at Austin,
Austin, TX) for attempting CO2 permeation experiments with the thin BPET films from
this study.

299
Table 8.1 Dual-mode model parameters for toluene at 35°C and CO2 at 25°C in PET
Penetrant kD
cm3(STP)/cm3.cmHg
CH´
cm3(STP)/cm3
b
cmHg-1
Toluene 3.0 ± 0.1 3.4 ± 0.1 18 ± 1.2
CO2 0.02 ± 0.001 5.8 ± 0.5 0.005 ± 0.0004

Table 8.2 Comparison of estimated amorphous phase CO2 permeability (Pa) and Henry’s Law mode diffusioncoefficients (DD,a) at 25°C in a thin BPET film from this study with literature data for much thicker films
Source
SampleThickness
(µm)
Orientation/Crystallinity
(vol%)
DD,a
(10-9 cm2/s)
Pa
(Barrer) a, b
UpstreamPressure
This study 0.9 Biaxial/39% 0.6 ± 0.3 0.18 10 atm
McGonigle et al. [54] 230 Unoriented/amorphous
NA 0.14 4 atm
Koros et al. [271] 51 Biaxial/60% 5.0 0.62 10 atm
Toi et al. [272] 50-100 Unoriented/37.5%
4.0 0.31 < 1 atm c
Michaels et al. [20] 75 Unoriented/amorphous
NA 0.30 < 0.13 atm c
Lewis et al. [274] 204 Unoriented/amorphous
NA 0.36 < 1 atm c
Brolly et al. [234] 35 Unoriented/amorphous
1.5 0.53 Infinitedilution
a 1 Barrer = 10-10 cm3(STP).cm/cm2.s.cmHgb Literature permeability values were determined using constant volume, variable pressure permeation techniques
(negligible downstream pressure). In this study, the permeability value was estimated from experimentallydetermined solubility and diffusion coefficients and by using the dual mobility model.
c Exact upstream pressure not reported
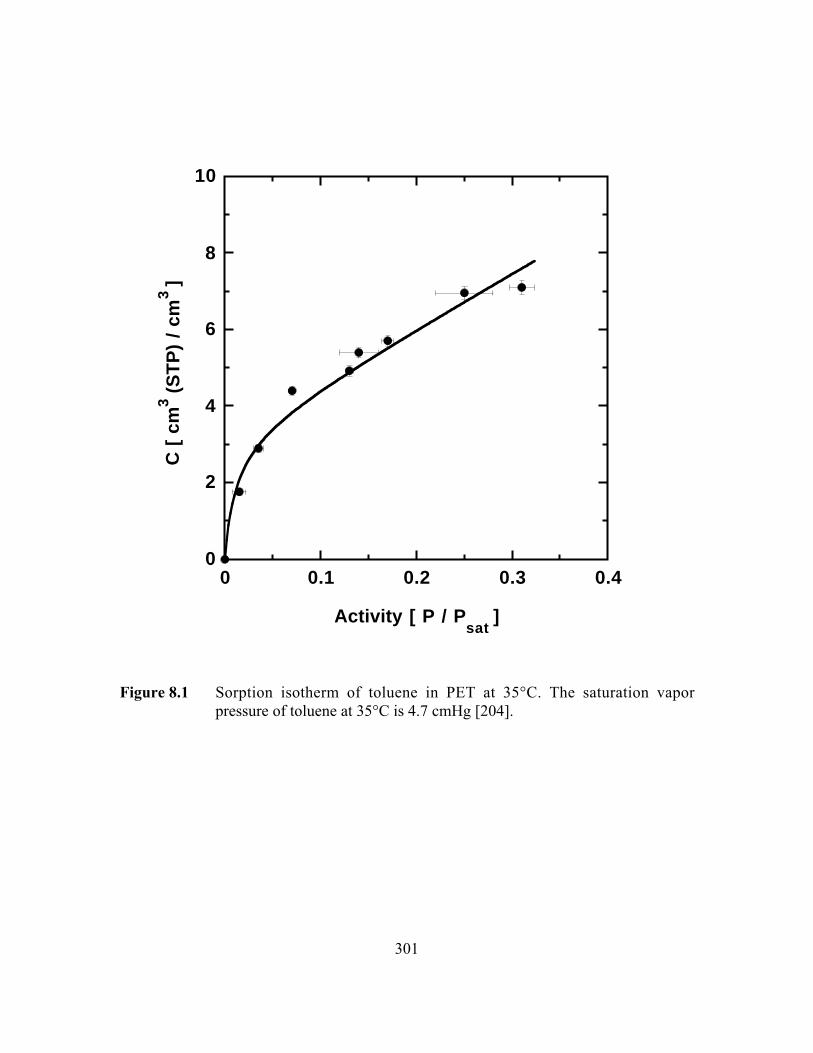
301
0
2
4
6
8
10
0 0.1 0.2 0.3 0.4
C [
cm
3 (S
TP
) /
cm3 ]
Activity [ P / Psat
]
Figure 8.1 Sorption isotherm of toluene in PET at 35°C. The saturation vaporpressure of toluene at 35°C is 4.7 cmHg [204].
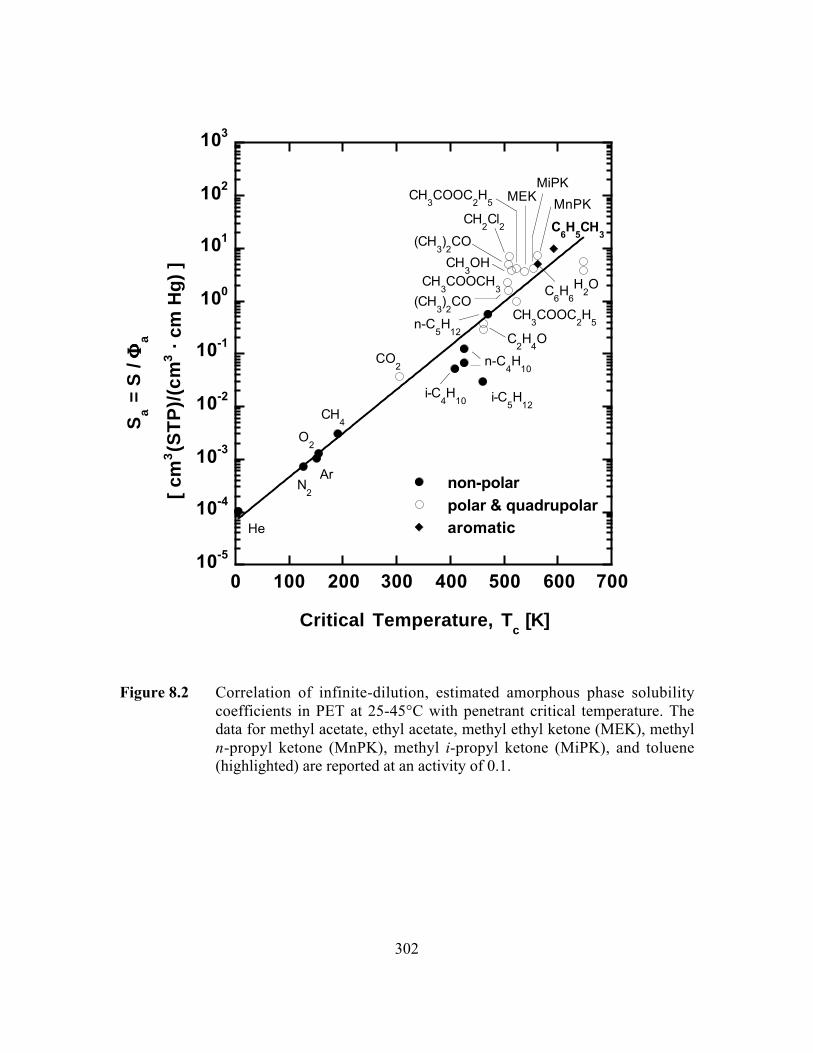
302
10-5
10-4
10-3
10-2
10-1
100
101
102
103
0 100 200 300 400 500 600 700
non-polar
polar & quadrupolararomatic
Sa =
S / FFFF
a
[ cm
3(S
TP
)/(c
m3 ·
cm
Hg)
]
Critical Temperature, Tc [K]
He
Ar
C6H
5CH
3
C6H
6
O2
N2
CO2
CH4
n-C4H
10
CH3OH
CH3COOC
2H
5
CH2Cl
2
H2O
C2H
4O
n-C5H
12
(CH3)2CO
i-C4H
10 i-C5H
12
MEKMiPK
MnPKCH
3COOC
2H
5
CH3COOCH
3
(CH3)2CO
Figure 8.2 Correlation of infinite-dilution, estimated amorphous phase solubilitycoefficients in PET at 25-45°C with penetrant critical temperature. Thedata for methyl acetate, ethyl acetate, methyl ethyl ketone (MEK), methyln-propyl ketone (MnPK), methyl i-propyl ketone (MiPK), and toluene(highlighted) are reported at an activity of 0.1.
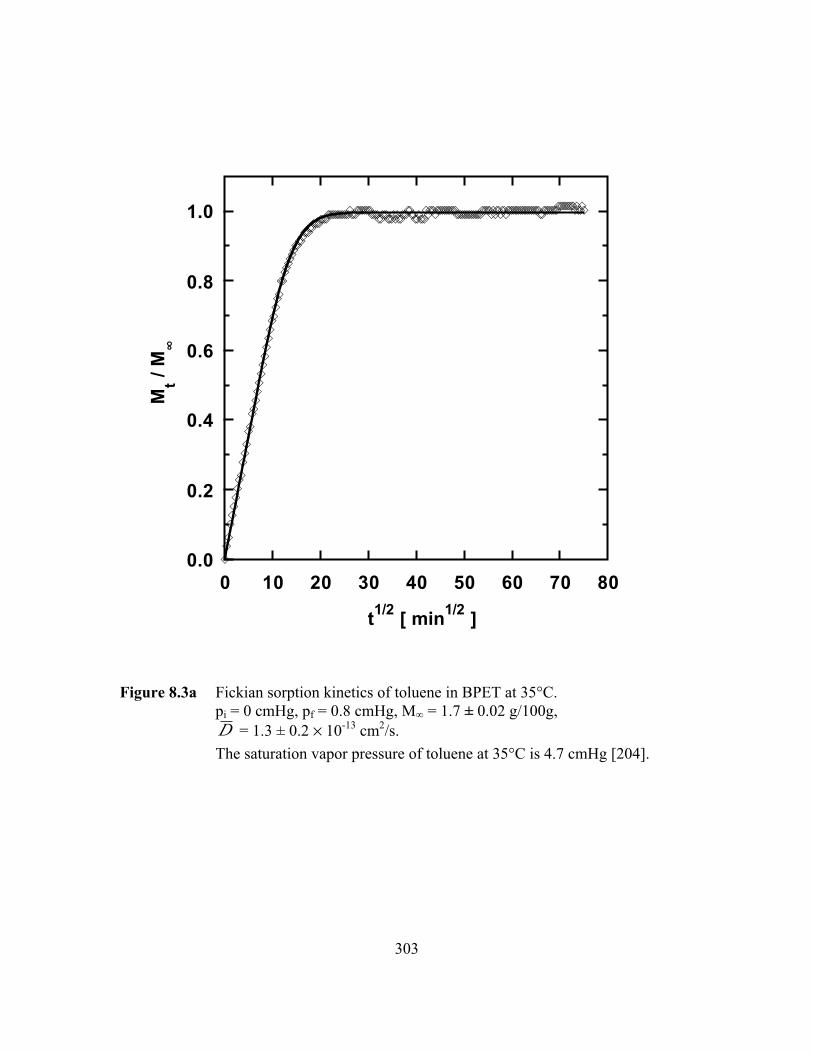
303
0.0
0.2
0.4
0.6
0.8
1.0
0 10 20 30 40 50 60 70 80
Mt /
M∞
t1/2
[ min1/2
]
Figure 8.3a Fickian sorption kinetics of toluene in BPET at 35°C.pi = 0 cmHg, pf = 0.8 cmHg, M∞ = 1.7 ± 0.02 g/100g,D = 1.3 ± 0.2 ¥ 10-13 cm2/s.
The saturation vapor pressure of toluene at 35°C is 4.7 cmHg [204].
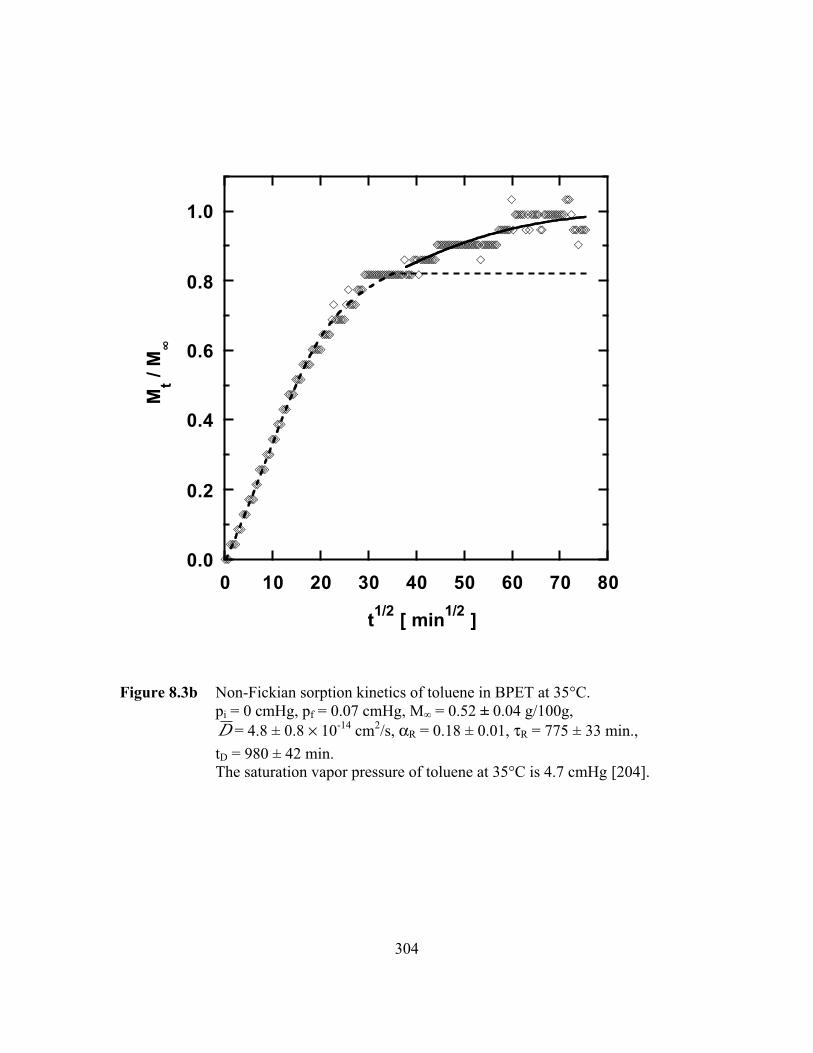
304
0.0
0.2
0.4
0.6
0.8
1.0
0 10 20 30 40 50 60 70 80
Mt /
M∞
t1/2
[ min1/2
]
Figure 8.3b Non-Fickian sorption kinetics of toluene in BPET at 35°C.pi = 0 cmHg, pf = 0.07 cmHg, M∞ = 0.52 ± 0.04 g/100g,D = 4.8 ± 0.8 ¥ 10-14 cm2/s, aR = 0.18 ± 0.01, tR = 775 ± 33 min.,
tD = 980 ± 42 min.The saturation vapor pressure of toluene at 35°C is 4.7 cmHg [204].
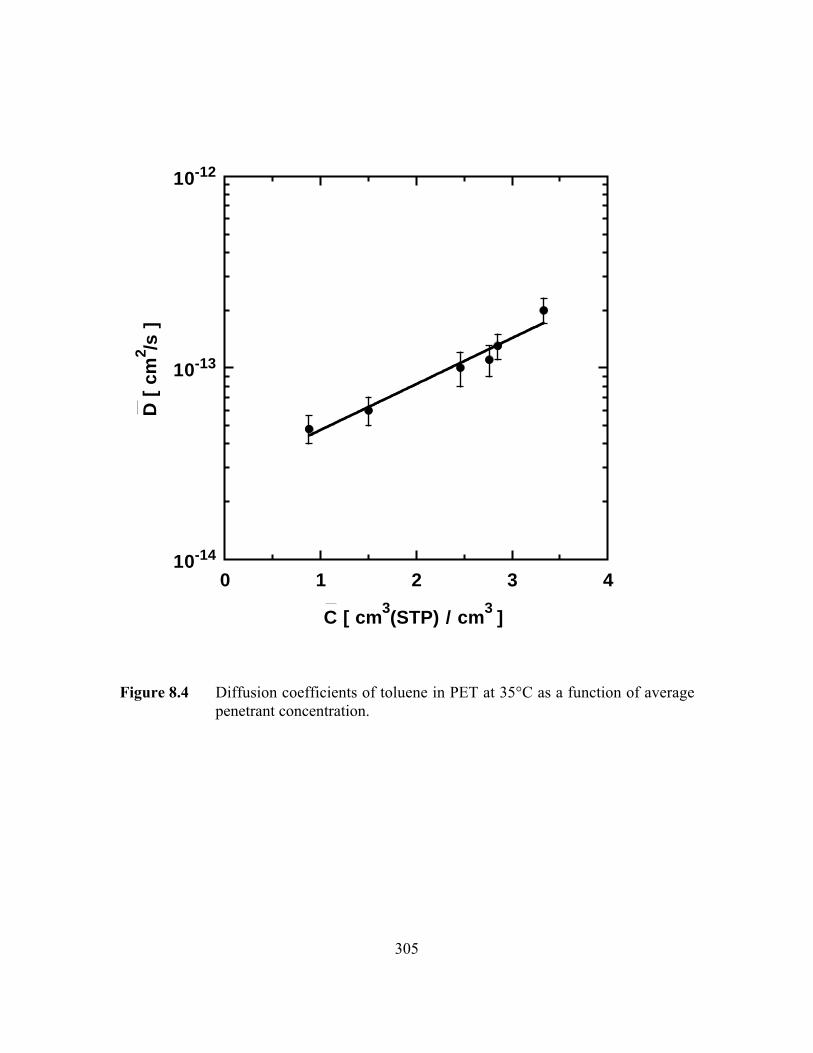
305
10-14
10-13
10-12
0 1 2 3 4
D [
cm
2 /s ]
C [ cm 3(STP) / cm3 ]
Figure 8.4 Diffusion coefficients of toluene in PET at 35°C as a function of averagepenetrant concentration.
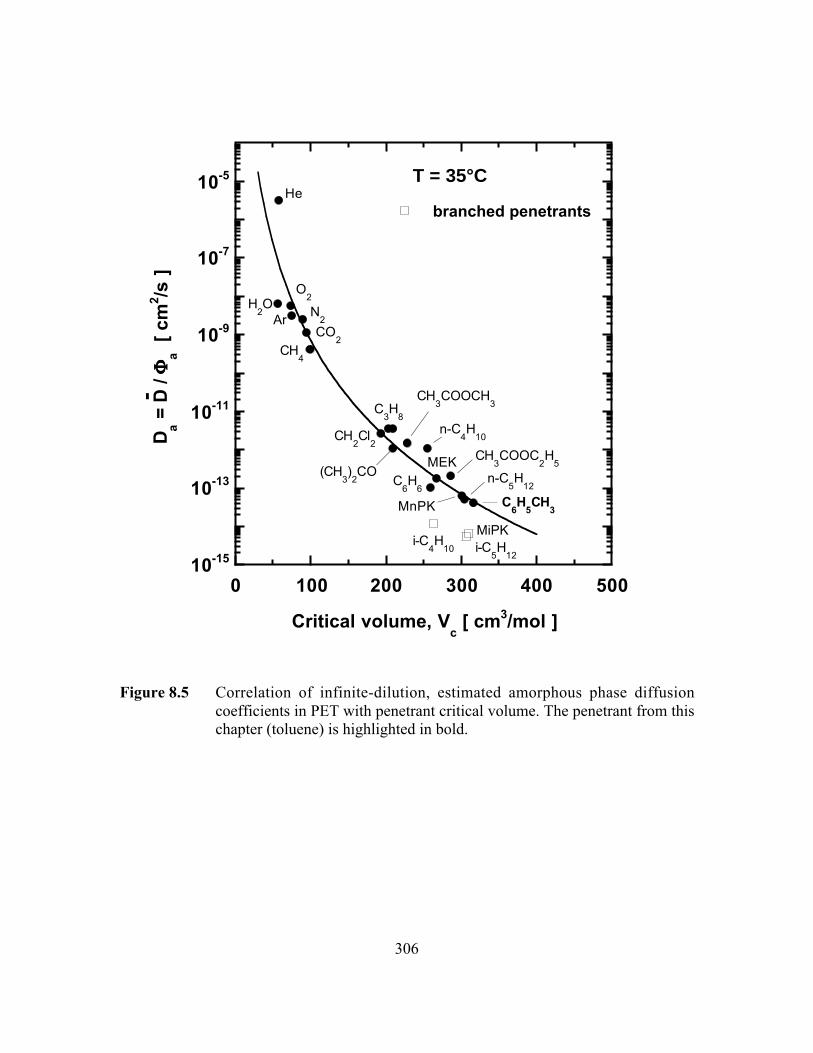
306
10-15
10-13
10-11
10-9
10-7
10-5
0 100 200 300 400 500
branched penetrants
Da =
D /
FFFFa
[ cm
2 /s ]
Critical volume, Vc [ cm3/mol ]
-T = 35°C
He
O2
N2
CO2
CH4
H2O
Ar
CH2Cl
2
C3H
8
C6H
6
C6H
5CH
3
n-C4H
10
n-C5H
12
(CH3)2CO
i-C5H
12
i-C4H
10
CH3COOC
2H
5
CH3COOCH
3
MEK
MiPK
MnPK
Figure 8.5 Correlation of infinite-dilution, estimated amorphous phase diffusioncoefficients in PET with penetrant critical volume. The penetrant from thischapter (toluene) is highlighted in bold.
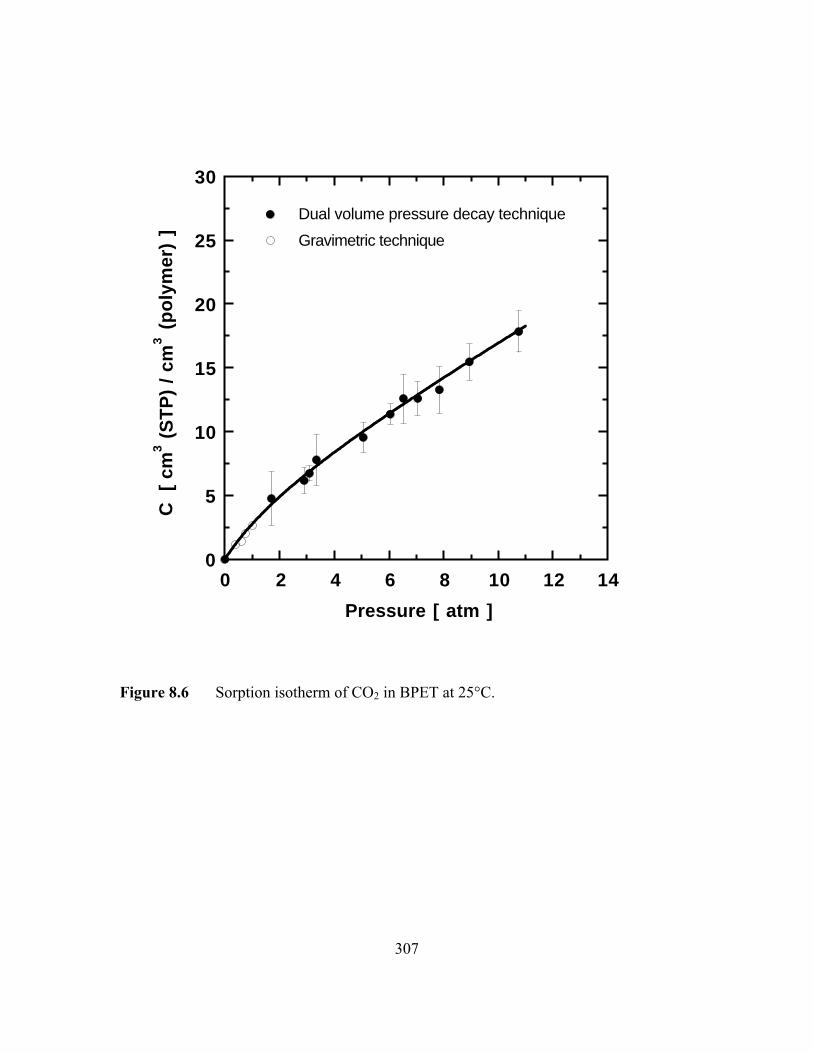
307
0
5
10
15
20
25
30
0 2 4 6 8 10 12 14
Dual volume pressure decay technique
Gravimetric technique
C
[ cm
3 (
ST
P)
/ cm
3 (
poly
mer
) ]
Pressure [ atm ]
Figure 8.6 Sorption isotherm of CO2 in BPET at 25°C.
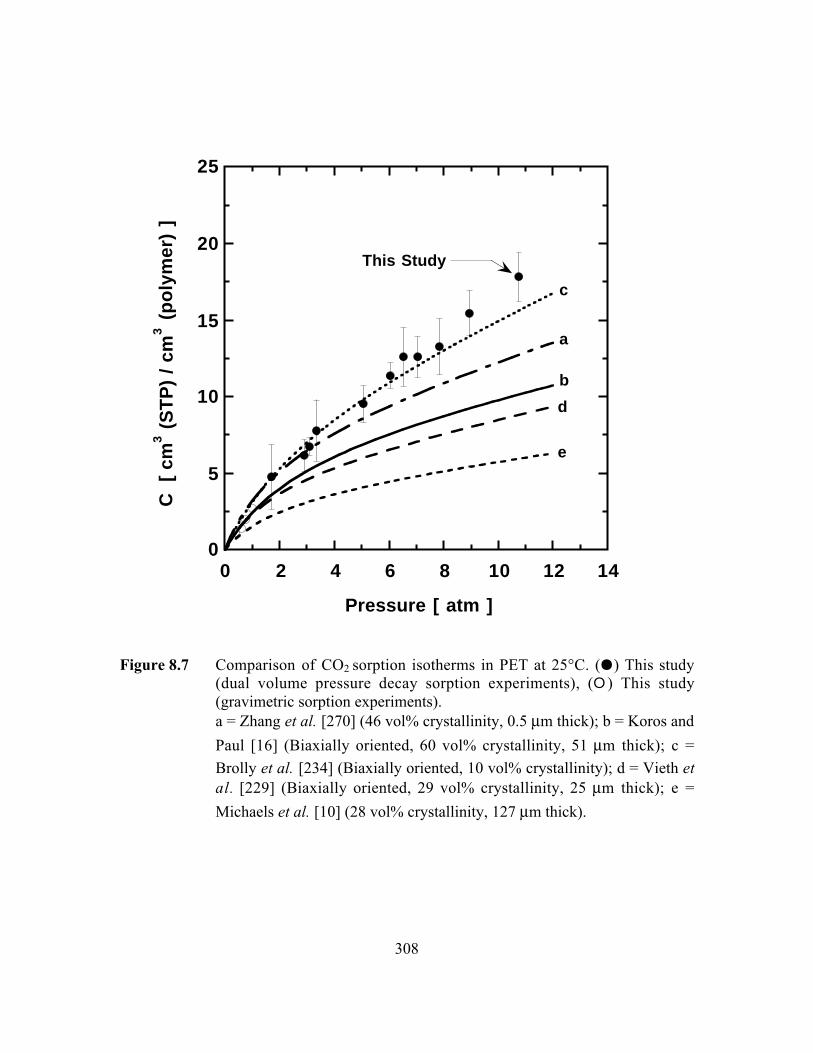
308
0
5
10
15
20
25
0 2 4 6 8 10 12 14
C
[ cm
3 (
ST
P)
/ cm
3 (
poly
mer
) ]
Pressure [ atm ]
a
b
c
d
e
This Study
Figure 8.7 Comparison of CO2 sorption isotherms in PET at 25°C. (J) This study(dual volume pressure decay sorption experiments), (E ) This study(gravimetric sorption experiments).a = Zhang et al. [270] (46 vol% crystallinity, 0.5 mm thick); b = Koros and
Paul [16] (Biaxially oriented, 60 vol% crystallinity, 51 mm thick); c =
Brolly et al. [234] (Biaxially oriented, 10 vol% crystallinity); d = Vieth etal. [229] (Biaxially oriented, 29 vol% crystallinity, 25 mm thick); e =
Michaels et al. [10] (28 vol% crystallinity, 127 mm thick).
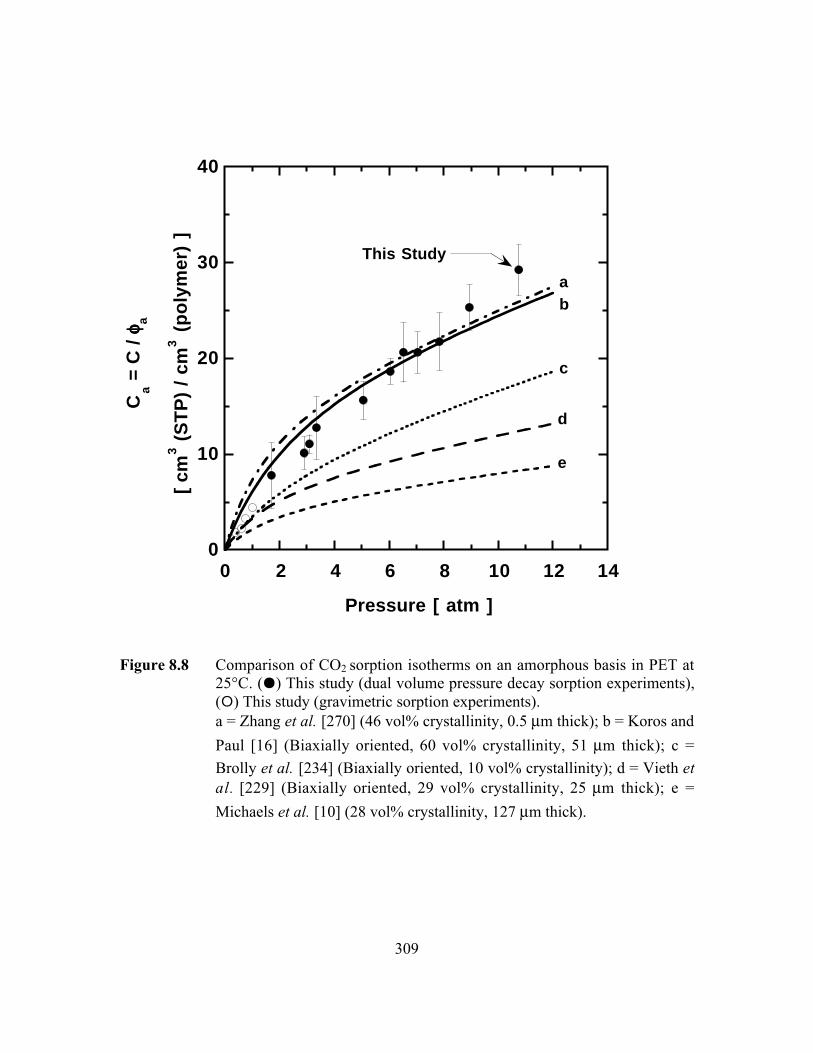
309
0
10
20
30
40
0 2 4 6 8 10 12 14
Ca =
C / ffff a
[ cm
3 (
ST
P)
/ cm
3 (
poly
mer
) ]
Pressure [ atm ]
ab
c
d
e
This Study
Figure 8.8 Comparison of CO2 sorption isotherms on an amorphous basis in PET at25°C. (J) This study (dual volume pressure decay sorption experiments),(E) This study (gravimetric sorption experiments).a = Zhang et al. [270] (46 vol% crystallinity, 0.5 mm thick); b = Koros and
Paul [16] (Biaxially oriented, 60 vol% crystallinity, 51 mm thick); c =
Brolly et al. [234] (Biaxially oriented, 10 vol% crystallinity); d = Vieth etal. [229] (Biaxially oriented, 29 vol% crystallinity, 25 mm thick); e =
Michaels et al. [10] (28 vol% crystallinity, 127 mm thick).

310
0
0.8
1.6
2.4
3.2
4
0 0.3 0.6 0.9 1.2 1.5
D [ ¥¥¥¥
101
0 cm
2/s
]
Pressure [ atm ]
DD = 3.4 ± 1.6 ¥¥¥¥ 10-10 cm2/s
F << 1
Figure 8.9 Average diffusion coefficients of CO2 in BPET at 25°C as a function ofCO2 pressure at the end of integral kinetic gravimetric sorptionexperiments. The beginning pressure for each of these data points was 0atm. The curve-fit is based on the dual mobility model (Equation 8.8).

311
CHAPTER 9
Conclusions and Recommendations
312
9.1 Summary of Conclusions
Equilibrium sorption and uptake kinetics of alkane hydrocarbons (n-butane,
i-butane, n-pentane, and i-pentane), ketones (acetone, MEK, MnPK, and MiPK), esters
(methyl acetate and ethyl acetate), and toluene in thin, biaxially oriented, semicrystalline
PET (BPET) films are reported at 35°C and for pressures ranging from 0 to
approximately 76 cmHg. Sorption isotherms for all penetrants, with the exception of
i-pentane, are well described by the dual-mode sorption model. The sorption isotherm for
i-pentane is described by the dual-mode model at low activity (or relative pressure) and
the Flory-Huggins model at high activity. Sorption kinetics of all penetrants are described
either by Fickian diffusion or a two-stage model incorporating Fickian diffusion at short
times and protracted polymer structural relaxation at long times. Diffusion coefficient for
each penetrant increases with increasing penetrant concentration.
To a first approximation, solubility and diffusion coefficients in PET correlate
well with penetrant critical temperature and critical volume, respectively (cf. Figures 8.2
and 8.5). The logarithm of infinite dilution, estimated amorphous phase solubility
coefficient increases linearly with critical temperature, a measure of penetrant
condensability. Infinite dilution, estimated amorphous phase diffusion coefficients
decrease according to a power law relation with increasing critical volume, a measure of
penetrant size.
However, there are a few exceptions. Strictly speaking, the solubility correlation
is valid only for equilibrium materials, such as rubbery polymers. Hence, it does not
account for sorption effects in the non-equilibrium excess volume of glassy polymers,
313
such as PET, that may involve different mechanisms, such as hole-filling, than are
present in equilibrium materials. For example, the solubility difference between
n-pentane and i-pentane is 10 times larger in glassy PET than rubbery LDPE. The
solubility difference between these two penetrants in the equilibrium regions of both PET
and LDPE appears to be similar. However, PET has an additional mode of sorption,
namely the non-equilibrium excess volume. Based on an analysis using the commonly
used dual-mode sorption model, linear n-pentane appears to fit into (and hence, access)
the non-equilibrium excess volume of PET much more easily than branched i-pentane. In
fact, based on some preliminary experiments, neopentane does not show measurable
uptake in PET. The magnitude of such shape effects in glassy polymers cannot be
predicted by the solubility correlation.
Also, the solubility correlation is strictly valid only for penetrants that do not have
any specific interactions with the polymer matrix. Because PET is polar, the solubility of
polar penetrants (e.g., ketones, esters, aldehydes) can be enhanced due to specific,
favorable interactions. For example, as discussed in Chapter 6, solubility of polar ketones
in PET is approximately two times higher than that of non-polar alkanes having the same
number of carbon atoms and a similar carbon skeleton. This effect can also be seen in the
solubility correlation plot (cf. Figure 8.2). The data for most of the polar penetrants
reported in this dissertation show a positive deviation from the correlation line.
The diffusivity correlation is empirical, and is proposed based on analogy with
correlations of diffusion coefficients of small molecules in liquids [9]. Critical volume
was used as a measure of penetrant size because it is commonly available for a wide
314
variety of penetrants. However, it cannot capture the effect of penetrant shape on
diffusion coefficients, and so the correlation is expected to be less accurate for
asymmetric penetrants. As shown in Figure 8.5 (Chapter 8), diffusion coefficients of
branched i-butane, i-pentane, and methyl i-propyl ketone are an order of magnitude lower
than the predicted values based on a correlation curve drawn using mainly linear and
more or less spherical penetrants.
Among the alkane hydrocarbons studied, chain branching is more efficient than
chain length in lowering hydrocarbon diffusion coefficients in PET. This effect is
demonstrated in Figure 7.9 (Chapter 7). Similar size and shape effects on hydrocarbon
diffusion coefficients have been observed in other rubbery (e.g., polyisobutylene, ethyl
cellulose, natural rubber) and glassy polymers (e.g., polycarbonate), as reported in
Chapter 7.
The interplay of penetrant size and polarity on diffusion coefficients in PET is
discussed in Chapter 7. Because PET is polar, diffusion of polar penetrants (e.g., ketones,
esters) can be retarded, presumably by specific penetrant-polymer interactions. Smaller,
but more polar, ketones have very similar diffusion coefficients to larger, but much less
polar, esters. Thus, penetrant diffusion in PET, which is primarily dependent on penetrant
size and shape, can also be influenced by polarity effects. Similar effects of penetrant
polarity on diffusion coefficients have been previously reported in polysulfones [130].
However, non-polar polymers, such as high-density polyethylene, do not show such
effects (cf. Chapter 7).

315
Conventional gravimetric sorption equipment is not suitable for large and highly
condensable organic compounds, such as flavor and aroma compounds. The
measurement sensitivity of current-generation pressure transducers limits the use of the
sorption equipment to penetrants with relatively high vapor pressures. For example,
benzyl alcohol, a common flavor compound, has vapor pressure of 0.1 mmHg at 25°C. It
would be very difficult to measure its sorption and transport properties over a wide range
of activity using conventional gravimetric sorption techniques. This dissertation reports a
new technique, which is suitable for such low volatility organic vapors. As discussed in
Chapter 4, this technique extends the measurement capability of the widely used McBain
quartz spring balance, and is suitable for penetrants with vapor pressures as low as 10-7
mmHg.
Chapter 8 reports sorption, diffusion, and estimated permeability coefficients of
CO2 in the thin BPET films used for vapor sorption measurements. As discussed in
Chapter 6, sorption and transport properties of PET depend on the processing history of
the sample. Conventional PET films used in practice are significantly thicker than the
PET films used in this study. To provide a basis for understanding the extent to which the
vapor sorption and transport results from this dissertation are applicable to conventional
PET films, the sorption and transport properties of CO2 in the thin BPET films from this
study were compared with literature data for thicker PET films. As reported in Chapter 8,
the estimated amorphous phase solubility and permeability coefficients of CO2 in BPET
films at 25°C are in good agreement with some literature values for much thicker films.
However, there are significant differences between CO2 solubility and diffusion

316
coefficients from various literature sources (cf. Chapter 8). These results highlight the
complex effects of morphology, orientation, and crystallinity on the sorption and
transport properties of PET. Such effects have been and continue to be the subject of
active research. Several literature studies have reported that sample processing history
affects morphology of both the crystalline and non-crystalline phases, and these
morphological differences can manifest themselves in the sorption and transport
properties of the sample.
9.2 Recommendations for Future Work
9.2.1 Solubility and Diffusivity Correlations
This dissertation has focused on systematic characterization of sorption and
transport properties of large organic compounds in PET. Several model flavor
compounds (i.e., low molecular weight analogs of common flavor compounds) from
various classes of non-polar and polar organic compounds were studied. Due to their
large sizes and extremely low vapor pressures, it is very difficult to measure sorption and
transport properties of flavor and aroma compounds in barrier polymers such as PET.
One way of overcoming this drawback is to develop solubility and diffusivity correlations
that can be extrapolated to predict sorption and transport properties of flavor and aroma
compounds with reasonable accuracy. As discussed in the previous section, the currently
available correlations work well only as first approximations because of certain
limitations. For example, they do not take into account the effects of penetrant shape and
polarity on solubility and diffusivity. The experimental results reported in this
317
dissertation highlight these limitations. Hence, there is a need to develop better solubility
and diffusivity correlations in the future that will take such effects into account and
provide more accurate predictions of solubility and diffusivity of flavor and aroma
compounds based on their size, shape, and chemical structure.
9.2.2 New Gravimetric Sorption Technique for Low Volatility Organic Vapors
As discussed in Chapter 4, conventional gravimetric sorption techniques are not
suitable for low volatility organic compounds, such as flavor and aroma compounds (e.g.,
vapor pressures of d-limonene and benzyl alcohol are 1 and 0.1 mmHg, respectively, at
25°C). To overcome this drawback, a new experimental technique is described in
Chapter 4, which might be used for penetrants with vapor pressures as low as 10-7
mmHg. This technique was used to measure solubility and diffusivity of toluene vapor in
BPET at 35°C (cf. Chapter 8). In the future, it can be used to study more condensable
organic compounds, including some flavor and aroma compounds (such as lower
alcohols), in barrier polymers, over a wide range of activity. The sorption and diffusion
data for such penetrants in the liquid phase (unit activity) are commonly available, but to
the best of our knowledge, vapor phase data (low activity) in barrier polymers are very
limited. Furthermore, the new technique can also be used in the future to characterize
gas/vapor mixture sorption properties of polymer membranes used in gas/vapor
separation applications.
318
9.2.3 Solvent-Induced Crystallization of Amorphous PET
In the presence of certain interacting penetrants, crystallization of amorphous
polymers can occur at temperatures well below the glass transition temperature (Tg) of
the polymer. The interaction of the polymer with the penetrant lowers the effective Tg of
the material. If the depression in Tg is large enough to permit sufficient polymer chain
motion to allow crystallization, then the polymer chains may reorganize from the
amorphous state to the crystalline state. In addition to crystallization, polymer-solvent
interactions have been reported to cause void formation in amorphous and oriented PET
[9]. The void structure is one of the major differences between solvent and thermally
crystallized PET. It is of particular importance in the case of PET fibers in connection
with dyeing behavior [71-73,77,235].
It would be interesting to study the effect of solvent-induced crystallization on
amorphous phase morphology and transport properties of PET. Our preliminary
experiments with 12.7 µm thick, amorphous, extruded PET films exposed to
acetaldehyde confirm the development of crystallinity. For example, exposing the
initially amorphous sample to acetaldehyde at 45°C and vapor activity of 0.35 resulted in
an increase in crystallinity from 5 wt.% to 37 wt.%, as detected by Wide Angle X-ray
Diffraction and Differential Scanning Calorimetry (cf. Figures 9.1 and 9.2). In the future,
techniques such as Positron Annihilation Lifetime Spectroscopy and Small Angle X-ray
Scattering can be used to further probe the amorphous phase morphology of the solvent-
crystallized PET samples. Also, series of sorption and permeation measurements with
light gases and organic vapors can be performed to investigate the effect of induced

319
crystallinity and accompanying morphology change on sorption and transport behavior of
solvent-crystallized PET samples.
9.2.4 Effect of Processing Conditions on Sorption and Transport Properties of
PET
As discussed in Chapters 6 and 8, gas and vapor sorption and permeation
properties of PET depend on the sample processing history. It would be interesting to
study the effect of various processing conditions (thermal annealing, uniaxial and biaxial
orientation, etc.) and film thickness on sorption and transport properties of PET.
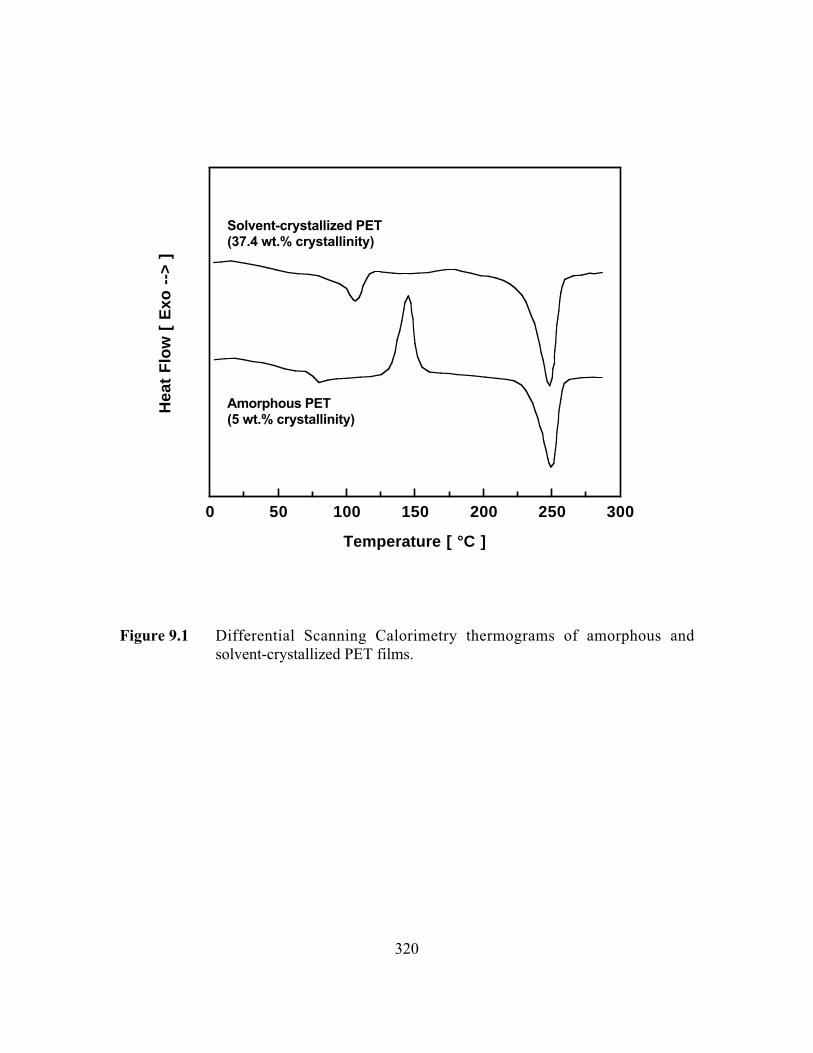
320
0 50 100 150 200 250 300
Hea
t F
low
[ E
xo -
-> ]
Temperature [ °C ]
Solvent-crystallized PET (37.4 wt.% crystallinity)
Amorphous PET (5 wt.% crystallinity)
Figure 9.1 Differential Scanning Calorimetry thermograms of amorphous andsolvent-crystallized PET films.
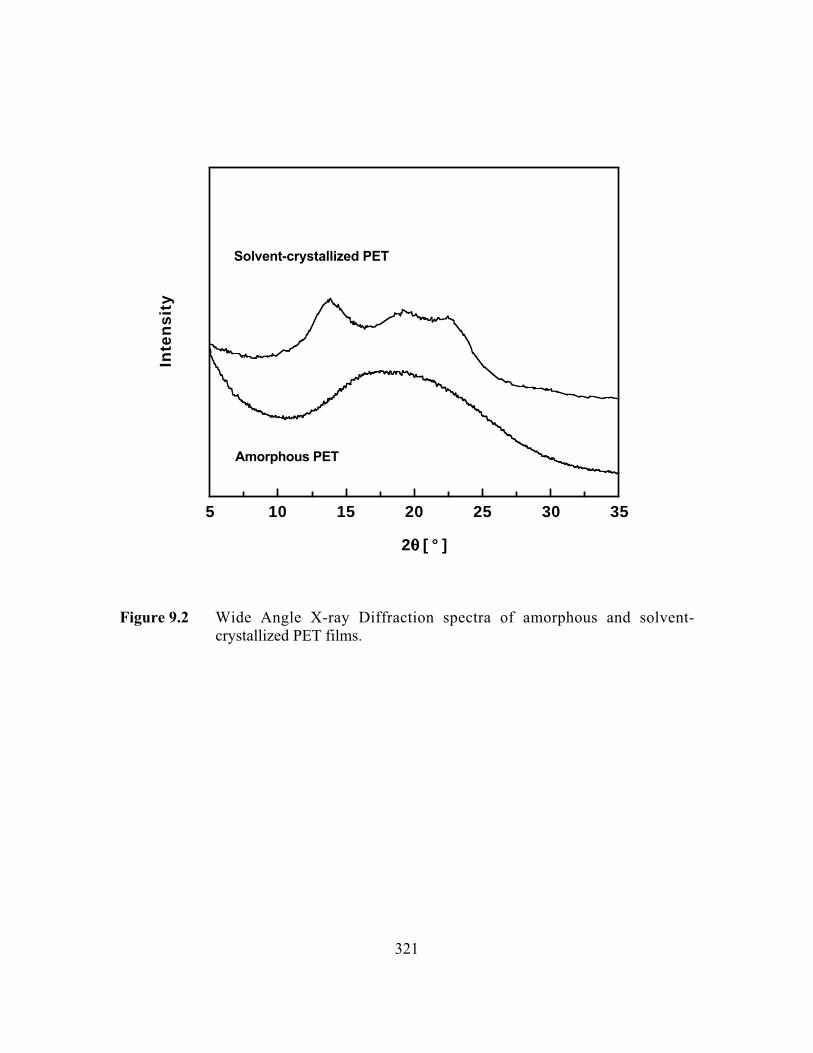
321
5 10 15 20 25 30 35
Inte
nsi
ty
2qqqq [ ° ]
Solvent-crystallized PET
Amorphous PET
Figure 9.2 Wide Angle X-ray Diffraction spectra of amorphous and solvent-crystallized PET films.
322
BIBLIOGRAPHY
1. W. E. Brown, Properties of Plastics Used in Food Packaging in Plastics in FoodPackaging, edited by H. A. Hughes (Marcel Dekker, Inc., New York, 1992), p103.
2. P. DeLassus, Barrier Polymers in Encyclopedia of Polymer Science andEngineering, edited by J. I. Kroschwitz (Wiley-Interscience, New York, 1992),Vol. 3, p 931.
3. A. Tullo, Polymer Makers: New Plastics Packaging Markets Open Up inChemical and Engineering News, May 22, 2000, p 25.
4. S. N. Dhoot, B. D. Freeman, M. E. Stewart, Barrier Polymers in Encyclopedia ofPolymer Science and Technology, 3rd ed., edited by J. I. Kroschwitz (Wiley-Interscience, New York, 2003), Vol. 5, p 198.
5. A. P. Hansen, D. C. Booker, Flavor Interaction with Casein and Whey Protein inFlavor-Food Interactions, edited by R. J. McGorrin, J. V. Leland (AmericanChemical Society, Washington, DC, 1996), Vol. 633, p 75.
6. W. E. Brown, Barrier Design in Plastics in Food Packaging, edited by H. A.Hughes (Marcel Dekker, Inc., New York, 1992), p 292.
7. W. J. Koros, Barrier Polymers and Structures: Overview in Barrier Polymers andStructures, edited by W. J. Koros (American Chemical Society, Washington, DC,1990), Vol. 423, p 1.
8. S. N. Dhoot, B. D. Freeman, M. E. Stewart, A. J. Hill, Sorption and Transport ofLinear Alkane Hydrocarbons in Biaxially Oriented Poly(ethylene terephthalate) J.Polym. Sci. : Polym. Phys. Ed. 39 (11), 1160 (2001).
9. G. E. Serad, B. D. Freeman, M. E. Stewart, A. J. Hill, Gas and Vapor Sorptionand Diffusion in Poly(ethylene terephthalate) Polymer 42, 6929 (2001).
10. A. S. Michaels, W. R. Vieth, J. A. Barrie, Solution of Gases in Poly(ethyleneterephthalate) J. Appl. Phys. 34 (1), 1 (1963).
11. S. N. Dhoot, B. D. Freeman, M. E. Stewart, Sorption and Transport of Linear andBranched Ketones in Biaxially Oriented Poly(ethylene terephthalate) J. Polym.Sci : Polym. Phys. Ed., submitted (2003).
323
12. S.-B. Lin, J. L. Koenig, Spectroscopic Characterization of the RotationalConformations in the Disordered Phase of Poly(ethylene terephthalate) J. Polym.Sci : Polym. Phys. Ed. 20, 2277 (1982).
13. J. A. Slee, G. A. J. Orchard, D. I. Bower, I. M. Ward, The Transport of Oxygenthrough Oriented Poly(ethylene terephthalate) J. Polym. Sci : Polym. Phys. Ed.27, 71 (1989).
14. K. Ghosal, B. D. Freeman, Gas Separation Using Polymeric Membranes: AnOverview Polymers for Advanced Technologies 5, 673 (1994).
15. P. J. Flory, Statistical Mechanics of Swelling of Network Structures J. Chem.Phys. 18, 108 (1950).
16. W. J. Koros, D. R. Paul, CO2 Sorption in Poly(ethylene terephthalate) Above andBelow the Glass Transition J. Polym. Sci : Polym. Phys. Ed. 16 (11), 1947 (1978).
17. R. M. Barrer, J. A. Barrie, J. Slater, Sorption and Diffusion in Ethyl Cellulose.Part III. Comparison Between Ethyl Cellulose and Rubber J. Polym. Sci. 27, 177(1958).
18. D. R. Paul, Gas Sorption and Transport in Glassy Polymers Ber. Bunsenges. Phys.Chem. 83, 294 (1979).
19. A. R. Berens, Transport of Plasticizing Penetrants in Glassy Polymers in BarrierPolymers and Structures, edited by W. J. Koros (American Chemical Society,Washington, DC, 1990), Vol. 423, p 92.
20. A. S. Michaels, W. R. Vieth, J. A. Barrie, Diffusion of Gases in Poly(ethyleneterephthalate) J. Appl. Phys. 34 (1), 13 (1963).
21. G. E. Serad. Sorption and Diffusion of Small Molecules in Poly(ethyleneterephthalate), M.S. Thesis, North Carolina State University, 1999.
22. D. H. Weinkauf, D. R. Paul, Effects of Structural Order on Barrier Properties inBarrier Polymers and Structures, edited by W. J. Koros (American ChemicalSociety, Washington, DC, 1990), Vol. 423, p 60.
23. M. M. Nir, A. Ram, J. Miltz, Sorption and Migration of Organic Liquids inPoly(ethylene terephthalate) Polym. Eng. Sci. 36 (6), 862 (1996).
24. M. R. Tant, M. E. Stewart, S. Weinhold, V. K. Long, A. J. Hill, Effects ofProcessing on the Structure and Properties of Poly(ethylene Terephthalate) and
324
Poly(ethylene Naphthalate-2,6-Dicarboxylate) Polym. Mater. Sci. Eng. 81, 374(1999).
25. J. Crank, The Mathematics of Diffusion, 2nd ed. (Clarendon Press, Oxford, 1975).
26. C. E. Rogers, Permeation of Gases and Vapors in Polymers in PolymerPermeability, edited by J. Comyn (Elsevier Applied Science, London and NewYork, 1988), p 11.
27. C. C. McDowell, B. D. Freeman, G. W. McNeely, Acetone Sorption and UptakeKinetics in Poly(ethylene terephthalate) Polymer 40 (12), 3487 (1999).
28. M. Moaddeb, W. J. Koros, Effects of Orientation on the Transport of d-Limonenein Polypropylene J. Appl. Polym. Sci. 57, 687 (1995).
29. A. H. Windle, Case II Sorption in Polymer Permeability, edited by J. Comyn(Elsevier Applied Science, London and New York, 1988), p 75.
30. R. G. Carbonell, G. C. Sarti, Coupled Deformation and Mass-Transport Processesin Solid Polymers Ind. Eng. Chem. Res. 29, 1194 (1990).
31. P. H. Hermans, Contribution to the Physics of Cellulose Fibers (Elsevier,Amsterdam, 1948), p 23.
32. J. S. Vrentas, J. L. Duda, Diffusion in Polymer-Solvent Systems: III. Constructionof Deborah Number Diagrams J. Polym. Sci : Polym. Phys. Ed. 15 (3), 441(1977).
33. K. Bauer, D. Garbe, H. Surburg, Common Fragrance and Flavor Materials:Preparation, Properties and Uses, 4th ed. (Wiley-VCH, Weinheim, Germany,2001).
34. L. N. Britton, R. B. Ashman, T. M. Aminabhavi, P. E. Cassidy, Prediction ofTransport Properties of Permeants through Polymer Films J. Chem. Edu. 65 (4),368 (1988).
35. R. Franz, Permeation of Volatile Organic Compounds Across Polymer Films-PartI: Development of a Sensitive Test Method Suitable for High Barrier PackagingFilms at Very Low Permeant Vapor Pressures Packag. Technol. Sci. 6, 91 (1993).
36. Y. Osajima, T. Matsui, Dynamic Approach to the Sorption of Flavors into a FoodPackaging Film Anal. Sci. 9, 753 (1993).
325
37. P. Hernandez-Munoz, R. Gavara, R. J. Hernandez, Evaluation of Solubility andDiffusion Coefficients in Polymer Film-Vapor Systems by Sorption ExperimentsJ Membr. Sci. 154, 195 (1999).
38. R. C. Reid, J. M. Prausnitz, B. E. Poling, The Properties of Gases and Liquids(McGraw Hill, New York, 1988), p 230.
39. J. Crank, The Mathematics of Diffusion, Second ed. (Clarendon Press, Oxford,1975), p 414.
40. A. R. Berens, Sorption of Organic Liquids and Vapors by Rigid PVC J. Appl.Polym. Sci. 37, 901 (1989).
41. F. Muller-Plathe, Mechanism of Penetrant Transport in Polymers Acta Polym. 45,259 (1994).
42. W. J. Koros, M. W. Hellums, Transport Properties in Encyclopedia of PolymerScience and Engineering, edited by J. I. Kroschwitz (John Wiley & Sons, NewYork, 1990), Supplement, p 724.
43. D. Hofman, J. Ulbrich, D. Fritsch, D. Paul, Molecular Modeling Simulation ofGas Transport in Amorphous Polyimide and Poly(amide imide) MembraneMaterials Polymer 37, 4773 (1996).
44. J. R. Fried, Molecular Simulation of Gas Permeability: Poly(2,6-dimethyl-1,4-phenylene oxide) J Membr. Sci. 149, 115 (1998).
45. A. Bondi, van der Waals Volumes and Radii J. Phys. Chem. 68 (3), 441 (1964).
46. D. W. van Krevelen, Properties of Polymers: Their Correlation with ChemicalStructure; Their Numerical Estimation and Prediction from Additive GroupContributions, 3rd ed. (Elsevier, Amsterdam, 1990), p 875.
47. M. H. Cohen, D. Turnbull, Molecular Transport in Liquids and Glasses J. Chem.Phys. 31, 1164 (1959).
48. K. Ghosal, R. T. Chern, B. D. Freeman, The Effect of Aryl Nitration on GasSorption and Permeation in Polysulfone J. Polym. Sci. : Polym. Phys. Ed. 33, 657(1995).
49. D. H. Weinkauf, D. R. Paul, Gas Transport Properties of Thermotropic LiquidCrystalline Copolyesters. II The Effect of Copolymer Composition J. Polym. Sci.: Polym. Phys. Ed. 30, 837 (1992).
326
50. W. M. Lee, Selection of Barrier Materials from Molecular Structure Polym. Eng.Sci. 20, 65 (1980).
51. A. Singh, W. J. Koros. Permeation Processes in Barriers and Membranes:Differences and Similarities. Polymers, Laminations & Coatings Conference, SanFrancisco, CA, 1998; p 361.
52. A. J. Hill, S. Weinhold, G. M. Stack, M. R. Tant, Effect of CopolymerComposition on Free Volume and Gas Permeability in Poly(ethyleneterephthalate)-Poly(1,4 cyclohexylenedimethylene terephthalate) CopolyestersEur. Polym. J. 32 (7), 843 (1996).
53. B. D. Freeman, A. J. Hill, Free Volume and Transport Properties of Barrier andMembrane Polymers in Structure and Properties of Glassy Polymers, edited byM. R. Tant, A. J. Hill (American Chemical Society, Washington, DC, 1997), Vol.710, p 306.
54. E. A. McGonigle, J. J. Liggat, R. A. Pethrick, S. D. Jenkins, J. H. Daly, D.Hayward, Permeability of N2, Ar, He, O2 and CO2 through Biaxially OrientedPolyester Films - Dependence on Free Volume Polymer 42, 2413 (2001).
55. V. P. Shantarovich, I. B. Kevdina, Y. P. Yampolskii, A. Y. Alentiev, PositronAnnihilation Lifetime Study of High and Low Free Volume Glassy Polymers:Effects of Free Volume Sizes on the Permeability and PermselectivityMacromolecules 33, 7453 (2000).
56. J. E. Robertson, T. C. Ward, A. J. Hill, Thermal, Mechanical, Physical, andTransport Properties of Blends of Novel Oligomer and Thermoplastic PolysulfonePolymer 41, 6251 (2000).
57. G. Dlubek, M. Stolp, C. Nagel, H. M. Fretwell, M. A. Alam, H. J. Radusch, Effectof Crystallization and of Water Uptake on the Free Volume Hole Size inPolyamides 6 and 66 J. Phys.: Condens. Matter 10, 10443 (1998).
58. H. Yang, Y. C. Jean, The Industrial Applications of Positron AnnihilationSpectroscopy in Performance Polymers Mater. Sci. Forum 255-257, 40 (1997).
59. R. M. Barrer, Transition-State Theory of Diffusion in Crystals Trans. FaradaySoc. 38, 78 (1942).
60. G. J. van Amerongen, Permeability of Different Rubbers to Gases and its Relationto Diffusivity and Solubility J. Appl. Phys. 17, 972 (1946).

327
61. R. M. Barrer, G. Skirrow, Transport and Equilibrium Phenomena in Gas-Elastomer Systems. I. Kinetic Phenomena J. Polym. Sci. 3, 549 (1948).
62. R. M. Barrer, Viscosity of Pure Liquids: I. Nonpolymerized Fluids Trans.Faraday Soc. 39, 48 (1943).
63. J. E. Leffler, The Enthalpy-Entropy Relationship and its Implications For OrganicChemistry J. Org. Chem. 20, 1202 (1955).
64. P. Meares, The Diffusion of Gases Through Poly(vinyl acetate) J. Amer. Chem.Soc. 76, 3415 (1954).
65. T. K. Kwei, W. Arnheim, Linear Free Energy Relationships in the Diffusion ofGases Through Polymer Films J. Chem. Phys. 37, 1900 (1962).
66. J. Brandrup, E. H. Immergut, E. A. Grulke, Polymer Handbook, 4th ed. (Wiley-Interscience, New York, 1999), p VI/198.
67. M. Salame, The Use of Barrier Polymers in Food and Beverage Packaging inPlastic Film Technology, edited by K. M. Finlayson (Technomic, 1989), Vol. 1, p132.
68. R. R. Light, R. W. Seymour, Effect of Sub-Tg Relaxations on the Gas TransportProperties of Polyesters Polym. Eng. Sci. 22 (14), 857 (1982).
69. P. M. Subramanian, I. G. Plotzker, Barrier Materials by Blending in PolymerBlends, edited by D. R. Paul, C. B. Bucknall (John Wiley & Sons, 2000), Vol. 2, p359.
70. A. C. Puleo, D. R. Paul, P. K. Wong, Gas Sorption and Transport inSemicrystalline Poly(4-methyl-1-pentene) Polymer 30, 1357 (1989).
71. H. D. Weigmann, M. G. Scott, A. S. Ribnick, L. Rebenfeld, Interactions ofNonaqueous Solvents with Textile Fibers: Part VII Text. Res. J. 46, 574 (1976).
72. H. Jameel, J. Waldman, L. Rebenfeld, The Effects of Orientation and Crystallinityon the Solvent-Induced Crystallization of Poly(ethylene terephthalate). I Sorptionand Diffusion Related Phenomena J. Appl. Polym. Sci. 26, 1795 (1981).
73. H. Jameel, H. D. Noether, L. Rebenfeld, The Effects of Orientation andCrystallinity on the Solvent-Induced Crystallinity of Poly(ethylene terephthalate).II Physical Structure and Morphology J. Appl. Polym. Sci. 27, 773 (1982).

328
74. A. S. Michaels, R. B. J. Parker, Sorption and Flow of Gases in Polyethylene J.Polym. Sci. 61, 53 (1959).
75. N. Qureshi, E. V. Stepanov, D. Schiraldi, A. Hiltner, E. Baer, Oxygen-BarrierProperties of Oriented and Heat-Set Poly(ethylene terephthalate) J. Polym. Sci :Polym. Phys. Ed. 38, 1679 (2000).
76. D. J. Sekelik, E. V. Stepanov, S. Nazarenko, D. Schiraldi, A. Hiltner, E. Baer,Oxygen Barrier Properties of Crystallized and Talc-Filled Poly(ethyleneterephthalate) J. Polym. Sci : Polym. Phys. Ed. 37, 847 (1999).
77. H. D. Weigmann, M. G. Scott, A. S. Ribnick, R. D. Matkowsky, Interactions ofNonaqueous Solvents with Textile Fibers: Part VIII Text. Res. J. 47, 745 (1977).
78. P. H. Hermans, P. Platzek, The Deformation Mechanism and the Fine Structure ofHydrate Cellulose. IX. The Theoretical Relation Between Swelling Anisotrpy andthe Characteristic Double Refraction of Oriented Filaments Kolloid Z. 88, 68(1939).
79. R. Shastri, H. C. Roehrs, C. N. Brown, S. E. Dollinger, Permeability ofCompetitive Oxygen-Barrier Resins in Barrier Polymers And Structures, editedby W. J. Koros (American Chemical Society, Washington, DC, 1990), Vol. 423, p239.
80. R. J. Hernandez, S. E. M. Selke, J. D. Culter, Mass Transfer in PolymericPackaging Systems in Plastics Packaging: Properties, Processing, Applications,and Regulations, (Hanser Gardner Publications, Inc., Cincinnati, OH, 2000), p313.
81. R. J. Hernandez, Effect of Water Vapor on the Transport Properties of OxygenThrough Polyamide Packaging Materials J. Food Eng. 22 (1/4), 495 (1994).
82. G. Strupinsky, A. L. Brody. A Twenty-Year Retrospective on Plastics: OxygenBarrier Packaging Materials. Polymers, Laminations & Coatings Conference, SanFrancisco, CA, 1998; p 119.
83. W. R. Vieth, Diffusion In and Through Polymers: Principles and Applications(Oxford Univ. Press, New York, 1991), p 20.
84. H. L. Frisch, Time Lag in Diffusion. II. J. Phys. Chem. 62, 401 (1958).

329
85. K. D. Ziegel, H. K. Frensdorff, D. E. Blair, Measurement of Hydrogen IsotopeTransport in Poly(vinyl fluoride) Films by the Permeation-Rate Method J. Polym.Sci. 7, 809 (1969).
86. Annual Book of ASTM Standards; Standard D3985 (American Society for Testingand Materials, West Conshocken, PA, 1994), Vol. 15.09, p 542.
87. Ox-Tran‚ Oxygen Transmission Rate Measurement System (MOCON, Inc.,
Minneapolis, MN, 1998).
88. Annual Book of ASTM Standards; Standard F1249 (American Society for Testingand Materials, West Conshocken, PA, 1994), Vol. 15.09, p 1051.
89. C. D. Barr, J. R. Giacin, R. J. Hernandez, A Determination of SolubilityCoefficient Values by Gravimetric and Isostatic Permeability Techniques Packag.Technol. Sci. 13, 157 (2000).
90. C. C. McDowell, D. T. Coker, B. D. Freeman, An Automated Spring Balance forKinetic Gravimetric Sorption of Gases and Vapors in Polymers Rev. Sci. Instrum.69 (6), 2510 (1998).
91. B. I. Chaudhary, A. I. Johns, Solubilities of Nitrogen, Isobutane and CarbonDioxide in Polyethylene J. Cell. Plast. 34 (4), 312 (1998).
92. O. Pfannschmidt, W. Michaeli. Determination of the Solubility and Diffusivity ofGases in Polymers by using a High Pressure Magnet-Suspension-Balance. AnnualTechnical Conference of the Society of Plastics (ANTEC), Atlanta, USA, 1998; p1918.
93. M. Salame, Prediction of Gas Barrier Properties of High Polymers Polym. Eng.Sci. 26 (22), 1543 (1986).
94. J. Y. Park, D. R. Paul, Correlation and Prediction of Gas Permeability in GlassyPolymer Membrane Materials via a Modified Free Volume Based GroupContribution Method J Membr. Sci. 125, 23 (1997).
95. S. C. Fayoux, A. Seuvre, A. J. Voilley, Aroma Transfers in and through PlasticPackagings: Orange Juice and d-Limonene. A Review. Part II: Overall SorptionMechanisms and Parameters-a Literature Survey Packag. Technol. Sci. 10, 145(1997).
96. G. Strandburg, P. T. DeLassus, B. A. Howell, Thermodynamics of Permeation ofFlavors in Polymers: Prediction of Solubility Coefficients in Food and Packaging

330
Interactions II, edited by S. J. Risch, J. H. Hotchkiss (American ChemicalSociety, Washington, DC, 1991), Vol. 473, p 133.
97. R. M. Barrer, G. J. Skirrow, Transport and Equilibrium Phenomena in Gas-Elastomer Systems. II. Equilibrium Phenomena J. Polym. Sci. 3, 564 (1948).
98. S. A. Stern, J. T. Mullhaupt, P. J. Gareis, Effect of Pressure on the Permeation ofGases and Vapors Through Polyethylene. Usefulness of the Corresponding StatesPrinciple AIChE J. 15 (1), 64 (1969).
99. S. Li, J. S. Paik, Flavor Sorption Estimation by UNIFAC Group ContributionModel Trans. ASAE 39 (3), 1013 (1996).
100. J. S. Paik, M. A. Tigani, Application of Regular Solution Theory in PredictingEquilibrium Sorption of Flavor Compounds by Packaging Polymers J. Agric.Food Chem. 41, 806 (1993).
101. B. D. Freeman, I. Pinnau, Membrane Materials Design Considerations for GasSeparations in Polymeric Materials for Gas Separations: Chemistry andMaterials Science, edited by B. D. Freeman, I. Pinnau (American ChemicalSociety, Washington DC, 1999), p 1.
102. R. C. Mason, P. T. DeLassus, G. Strandburg, B. A. Howell, Diffusion of Flavorsin Polymers: Effect of Permeant Size and Shape Tappi J. 75 (6), 163 (1992).
103. C. S. Coughlin, K. A. Mauritz, R. F. Storey, A General Free Volume BasedTheory for the Diffusion of Large Molecules in Amorphous Polymers above Tg,4. Polymer-Penetrant Interactions Macromolecules 24 (7), 1526 (1991).
104. T. H. Begley, Methods and Approaches Used by FDA to Evaluate the Safety ofFood Packaging Materials Food Addit. Contam. 14 (6-7), 545 (1997).
105. O. Piringer, R. Franz, M. Huber, T. H. Begley, T. P. McNeal, Migration FromFood Packaging Containing a Functional Barrier: Mathematical and ExperimentalEvaluation J. Agric. Food Chem. 46, 1532 (1998).
106. A. O'Brien, A. Goodson, I. Cooper, Polymer Additive Migration to Foods - ADirect Comparison of Experimental Data and Values Calculated From MigrationModels for High Density Polyethylene (HDPE) Food Addit. Contam. 16 (9), 367(1999).
107. W. Limm, H. C. Hollifield, Modeling of Additive Diffusion in Polyolefins FoodAddit. Contam. 13, 949 (1996).

331
108. W. A. Jenkins, J. P. Harrington, The Chemistry and Manufacture of Polymersused in Packaging in Packaging Foods With Plastics, edited by W. A. Jenkins, J.P. Harrington (Technomic Publishing Co., Lancaster, PA, 1991), p 46.
109. Permeability And Other Film Properties of Plastics and Elastomers (PlasticsDesign Library, Norwich, NY, 1995), p 706.
110. V. T. Stannett, Barrier Properties and Migration Problems of Plastics Polym. Eng.Sci. 18 (15), 1129 (1978).
111. R. J. Ashley, Permeability and Plastics Packaging in Polymer Permeability, editedby J. Comyn (Elsevier Applied Science Publishers Ltd., Essex, England, 1985).
112. M. Salame, Barrier Polymers in The Wiley Encyclopedia of PackagingTechnology, edited by M. Bakker (John Wiley & Sons, New York, 1986), p 48.
113. S. Pauly, Permeability and Diffusion Data in Polymer Handbook, 3rd ed., editedby J. Brandrup, E. H. Immergut (Wiley Interscience, New York, 1989), p IV:435.
114. P. T. DeLassus, Interaction of High Barrier Plastics with Food: Permeation andSorption in Food Product-Package Compatibility, edited by J. I. Gray, B. R.Harte, J. Miltz (Technomic Publishing, Lancaster, PA, 1987), p 229.
115. J. Landois-Garza, J. H. Hotchkiss, Permeation of High Barrier Films by EthylEsters in Food and Packaging Interactions, edited by J. H. Hotchkiss (AmericanChemical Society, Washington DC, 1988), p 42.
116. M. G. R. Zobel, Aroma Barrier Properties of Coextruded Films (SchotlandBusiness Research, Princeton, NJ, 1984), p 75.
117. G. L. Robertson, Structure and Related Properties of Plastic Polymers in FoodPackaging. Principles and Practice, edited by H. A. Hughes (Marcel Dekker,Inc., New York, 1993), Vol. 6, p 9.
118. R. Catala, R. Gavara, Review: Alternative High Barrier Polymers for FoodPackaging Food Sci. Tech. Int. 2, 281 (1996).
119. W. E. Brown, Properties of Plastics used in Food Packaging in Plastics in FoodPackaging, edited by W. E. Brown (Marcel Dekker, Inc., New York, 1992), p132.
120. R. J. Hernandez, S. E. M. Selke, J. D. Culter, Major Plastics in Packaging inPlastics Packaging: Properties, Processing, Applications, and Regulations,(Hanser Gardner Publications, Inc., Cincinnati, OH, 2000), p 89.

332
121. Selar PA Processing Guide (E.I. du Pont de Nemours & Co., Wilmington, DE,2001).
122. P. M. Morse, PEN: The New Polyester in Chemical & Engineering News,November 10, 1997, p 8.
123. T. M. McGee, A. S. Jones. The Effect of Processing Parameters on PhysicalProperties of PET/PEN Blends for Bottle Applications. 11th Annual HighPerformance Blow Molding Conference: Technical Innovations in Blow Molding,Cleveland, OH, 1995; p 89.
124. C. C. McDowell, B. D. Freeman, G. W. McNeely, M. I. Haider, A. J. Hill,Synthesis, Physical Characterization, and Acetone Sorption Kinetics in RandomCopolymers of Poly(ethylene terephthalate) and Poly(ethylene 2,6-naphthalate) J.Polym. Sci : Polym. Phys. Ed. 36, 2981 (1998).
125. G. R. Cantrell, B. D. Freeman, H. B. Hopfenberg, S. Makhija, I. Haider, M. Jaffe,The Influence of Thermal Annealing on Organic Vapor Sorption and Transport ina Nematogenic Copolyester in Liquid Crystalline Polymers, edited by C. Carfagna(Pergamon Press, Oxford, 1994), p 233.
126. N. R. Miranda, J. T. Willits, B. D. Freeman, H. B. Hopfenberg, Organic VaporSorption and Transport in a Thermotropic Liquid Crystalline Polyester J. Membr.Sci. 94, 67 (1994).
127. R. Lusignea, High-Barrier Packaging with Liquid Crystal Polymers Tappi J. 80(6), 205 (1997).
128. R. Lusignea. Flexible Multilayer Packaging with Oriented LCP Barrier Layer.Polymers, Laminations & Coatings Conference, San Francisco, CA, 1998; p 889.
129. D. J. Brennan, J. E. White, A. P. Haag, S. L. Kram, M. N. Mang, S. Pikulin, C. N.Brown, Poly(hydroxy amide ethers): New High-Barrier ThermoplasticsMacromolecules 29, 3707 (1996).
130. K. Ghosal, R. T. Chern, B. D. Freeman, W. H. Daly, I. I. Negulescu, Effect ofBasic Substituents on Gas Sorption and Permeation in PolysulfoneMacromolecules 29 (12), 4360 (1996).
131. M. R. Pixton, D. R. Paul, Relationship between Structure and TransportProperties for Polymers with Aromatic Backbones in Polymeric Gas Separation
333
Membranes, edited by D. R. Paul, Y. P. Yampolskii (CRC Press, Boca Raton, FL,1994), p 83.
132. C. H. Silvis, Recent Advances in Polymers for Barrier Applications TrendsPolym. Sci. 5 (3), 75 (1997).
133. BLOXTM Adhesion and Barrier Resins: Product Information (The Dow ChemicalCompany, May 2001).
134. T. Glass, H. Pham, M. Winkler. New Thermoplastic Adhesive and Barrier Resins.ANTEC 2000: Plastics, The Magical Solution, Orlando, FL, 2000.
135. W. Erickson. New Coextruded PCTFE-Based Moisture Barrier Films for HighPerformance Packaging. Polymers, Laminations & Coatings Conference, SanFrancisco, CA, 1998; p 355.
136. Aclar Fluoropolymer films: Product Information (Honeywell International, 2001).
137. P. T. DeLassus, D. L. Clarke, T. Cosse, Barrier Coating Cuts CO2 Loss in SmallPET Bottles Mod. Plast., 86 (January 1983).
138. W. E. Brown, Properties of Plastics used in Food Packaging in Plastics in FoodPackaging, edited by W. E. Brown (Marcel Dekker, Inc., New York, 1992), p125.
139. E. Werner, S. Janocha, M. Hopper, K. Mackenzie, Polyester Films inEncyclopedia of Polymer Science and Technology, edited by J. I. Kroschwitz(Wiley-Interscience, New York, 1992), Vol. 12, p 193.
140. N. Whiteman, P. T. DeLassus, J. Gunderson, in TAPPI Proceedings of PLCConference, 2001.
141. W. E. Brown, Properties of Plastics used in Food Packaging in Plastics in FoodPackaging, edited by W. E. Brown (Marcel Dekker, Inc., New York, 1992), p105.
142. J. L. Throne, Polymer Properties in The Wiley Encyclopedia of PackagingTechnology, edited by M. Bakker (John Wiley & Sons, New York, 1986), p 529.
143. A. R. Berens, Penetrant Diffusion in Unplasticized and Plasticized PVCMakromol. Chem., Macromol. Symp. 29, 95 (1989).
334
144. J. H. Levy. Nylon 6 Barrier Coextrusions: A Cost-effective Packaging Route.Polymers, Laminations & Coatings Conference, San Francisco, CA, 1998; p 163.
145. W. A. Jenkins, J. P. Harrington, Plastics and their Fabrication in Packaging FoodsWith Plastics, edited by W. A. Jenkins, J. P. Harrington (Technomic PublishingCo., Lancaster, PA, 1991), p 11.
146. MXD-6 Nylon Polyamide Property Brochure (Mitsubishi Gas ChemicalCompany, Inc., 2001), p 30.
147. D. A. Abramowicz, P. J. Heyes. Comparing the Performance of Barrier-Coatedversus Multilayer PET Containers for Oxygen Sensitive Products. Nova-PackAmericas 2000, Orlando, FL, 2000.
148. T. Hart. New Effective Barrier Coating for Plastic Containers. Bev-Pak Americas'97, Directions 21, Inc., 1997.
149. D. S. Finch, J. Franks, N. X. Randall, A. Barnetson, J. Crouch, A. C. Evans, B.Ralph, Diamond-like Carbon, a Barrier Coating for Polymers used in PackagingApplications Packag. Technol. Sci. 9, 73 (1996).
150. N. Inagaki, Oxygen Gas Barrier PET Films Formed by Deposition of Plasma-Polymerized SiOx Films in Silicones and Silicone-Modified Materials, edited byS. J. Clarson, J. J. Fitzgerald, M. J. Owen, S. D. Smith (Oxford University Press,Washington, DC, 2000), Vol. 729, p 544.
151. R. J. Hernandez, S. E. M. Selke, J. D. Culter, Converting, Lamination and Coatingin Plastics Packaging: Properties, Processing, Applications, and Regulations,(Hanser Gardner Publications, Inc., Cincinnati, OH, 2000), p 217.
152. G. L. Robertson, Processing and Converting of Thermoplastic Polymers in FoodPackaging. Principles and Practice, edited by H. A. Hughes (Marcel Dekker,Inc., New York, 1993), Vol. 6, p 111.
153. W. A. Jenkins, J. P. Harrington, Snack Foods in Packaging Foods With Plastics,edited by W. A. Jenkins, J. P. Harrington (Technomic Publishing Co., Lancaster,PA, 1991), p 195.
154. A. S. Da Silva Sobrinho, G. Czeremuszkin, M. Latreche, M. R. Wertheimer,Study of Defect Numbers and Distributions in PECVD SiO2 Transparent BarrierCoatings on PET in Plasma Deposition and Treatment of Polymers, edited by W.W. Lee, R. d'Agostino, M. R. Wertheimer (Materials Research Society, Boston,MA, 1998), Vol. 544, p 245.

335
155. K. H. Haas, S. Amberg-Schwab, K. Rose, G. Schottner, Functionalized CoatingsBased on Inorganic-Organic Polymers (ORMOCERs) and Their Combinationwith Vapor Deposited Inorganic Thin Films Surf. Coat. Tech. 111, 72 (1999).
156. M. Hoffmann, S. Amberg-Schwab, H. Bader, M. Gessler, Inorganic-OrganicPolymers with Barrier Properties for Water Vapor, Oxygen and Flavors J. Sol GelSci. Tech. 1/2, 141 (1998).
157. H. Langowski, Plastics Packaging in the 21st Century Kunstoffe 90 (6), 88 (2000).
158. German Brewer Second To Launch In 'Glaskin' in Packaging World, May 2000, p2.
159. I. Bucklow, P. Butler, Plastic Proves It Can Hold Its Beer in Materials World,August 2000, p 14.
160. French Brewer Pioneers New Barrier Technology in Packaging World, June1999, p 2.
161. R. M. Barrer, Diffusion and Permeation in Heterogeneous Media in Diffusion inPolymers, edited by J. Crank, G. S. Park (Academic Press, New York, 1968), p165.
162. K. M. Kit, J. M. Schultz, R. Gohil, Morphology and Barrier Properties ofOriented Blends of Poly(ethylene terephthalate) and Poly(ethylene 2,6-naphthalate) with Poly(ethylene-co-vinyl alcohol) Polym. Eng. Sci. 35 (8), 680(1995).
163. O. Motta, L. Di Maio, L. Incarnato, D. Acierno, Transport and MechanicalProperties of PET/Rodrun 3000 Blown Films Polymer 37 (12), 2373 (1996).
164. E. Petrovicova, R. Knight, L. S. Schadler, T. E. Twardowski, Nylon 11/SilicaNanocomposite Coatings Applied by the HVOF Process. II: Mechanical andBarrier Properties J. Appl. Polym. Sci. 78, 2272 (2000).
165. S. Brauer, P 234: Polymer Nanocomposites (Business Communications Co., Inc.,April 2000), p XIII.
166. Honeywell's Polymerized Nanocomposite Nylon Resin in Packaging World,November 6, 2000, Web exclusive.
336
167. K. Kamena. Emerging Nanocomposite Technologies for Barrier and ThermalImprovements in PET Containers. Nova-Pack Americas '99, Orlando, FL, 1999; p1.
168. L. Vermeiren, F. Devlieghere, M. van Beest, N. Kruijf, J. Debevere,Developments in the Active Packaging of Foods Trends Food Sci. Tech. 10, 77(1999).
169. W. Scholl. Active Barrier Packaging: A Technology for the 21st Century.Polymers, Laminations & Coatings Conference, Atlanta, GA, 1999; p 671.
170. M. L. Rooney, Active Packaging in Polymer Films in Active Food Packaging, 1sted., edited by M. L. Rooney (Blackie Academic & Professional, Glasgow, UK,1995), p 74.
171. S. Lambert. New EVOH-Based Oxygen Scavenging Resins for Use in Co-Injected PET Bottles. Nova-Pack Europe 2000, Neuss, Germany, 2000; p 163.
172. E. P. Socci, M. K. Akkapeddi, D. C. Worley. New High Barrier, OxygenScavenging Polyamides for Packaging Applications. ANTEC, 2001.
173. B. D. Rodgers. New High Capacity Oxygen Scavenging Polymer For Use inFlexible Packaging. Flex-Pak Europe 2000, Amsterdam, Nov. 2000; p 61.
174. M. A. Cochran, R. Folland, J. W. Nicholas, E. R. Robinson. U.S. Patent5,639,815, 1997.
175. F. N. Teumac, B. A. Ross, M. R. Rassouli, Oxygen Scavengers Inside Liners ofBottle Closures MBAA Technical Quarterly 27, 122 (1990).
176. C. Yang, E. Nuxoll, E. Cussler, Reactive Barrier Films AIChE J. 47 (2), 295(2001).
177. Permeability And Other Film Properties of Plastics and Elastomers (PlasticsDesign Library, Norwich, NY, 1995), p 143.
178. A. B. Robertson, K. R. Habermann, Fluoropolymer Film in The WileyEncyclopedia of Packaging Technology, edited by M. Bakker (John Wiley &Sons, New York, 1986), p 311.
179. J. Quezada-Gallo, F. Debeaufort, A. Voilley, Mechanism of Aroma TransferThrough Edible and Plastic Packagings in Food Packaging: Testing Methods and
337
Applications, edited by S. J. Risch (American Chemical Society, Washington,DC, 1999), Vol. 753, p 130.
180. J. W. McBain, A. M. Bakr, A New Sorption Balance J. Am. Chem. Soc. 48, 690(1926).
181. W. J. Koros, D. R. Paul, Design Considerations for Measurement of Gas Sorptionin Polymers by Pressure Decay J. Polym. Sci : Polym. Phys. Ed. 14, 1903 (1976).
182. W. Puff, PFPOSFIT: A New Version of a Program For Analyzing PositronLifetime Spectra with Non-Gaussian Prompt Curve Comput. Phys. Commun. 30(4), 359 (1983).
183. S. Fakirov, E. W. Fischer, R. Hoffmann, G. F. Schmidt, Structure and Propertiesof PET Crystallized by Annealing in the Highly Oriented State: 2. MeltingBehavior and the Mosaic Block Structure of the Crystalline Layers Polymer 18,1121 (1977).
184. H.-G. Elias, An Introduction to Polymer Science, 1st ed. (VCH, Weinheim, 1997),p 287.
185. K. H. Illers, Melting Behavior of Drawn Polyethylene Angew. Makromol. Chem.12, 89 (1970).
186. E. W. Fischer, S. Fakirov, Structure and Properties of PET Crystallized byAnnealing in the Highly Oriented State: Part 1. Morphological Structure asRevealed by Small Angle X-ray Scattering J. Mater. Sci. 11, 1041 (1976).
187. R. M. Gohil, Morphology-Permeability Relationships in Biaxially Oriented PETFilms: A Relationship between Oxygen Permeability and PROF J. Appl. Polym.Sci. 48, 1649 (1993).
188. P. H. Hermans, Contribution to the Physics of Cellulose Fibers (Elsevier,Amsterdam, 1946), Appendix 3.
189. Z. W. Wilchinsky, Advances in X-ray Analysis (Plenum Press, New York, 1963),Vol. 6, p 231.
190. G. R. Cantrell, C. C. McDowell, B. D. Freeman, C. Noel, The Influence ofAnnealing on Thermal Transitions in a Nematic Copolyester J. Polym. Sci :Polym. Phys. Ed. 37, 505 (1999).
338
191. G. Farrow, I. M. Ward, Crystallinity of Poly(ethylene terephthalate): AComparison of X-ray, Infra-red and Density measurements Polymer 1, 330(1960).
192. G. VerStrate, Z. W. Wilchinsky, Ethylene-Propylene Copolymers: Degree ofCrystallinity and Composition J. Polym. Sci.: Part A-2 9, 127 (1971).
193. J. L. Koenig, M. J. Hannon, Infrared Studies of Chain Folding in Polymers. II.Poly(ethylene terephthalate) J. Macromol. Sci.: Part B1 1 (1), 119 (1967).
194. L. E. Alexander, X-Ray Diffraction Methods in Polymer Science, 2nd ed. (R.K.Publishing Company, Malabar, FL, 1985), p 137.
195. Z. Bashir, I. Al-Aloush, I. Al-Raqibah, M. Ibrahim, Evaluation of Three Methodsfor the Measurement of Crystallinity of PET Resins, Preforms, and Bottles Polym.Eng. Sci. 40 (11), 2442 (2000).
196. K. E. Bacon, Differential Thermal Analysis of High Polymers. V. EthyleneCopolymers J. Polym. Sci. 61, 47 (1962).
197. G. Farrow, I. M. Ward, Comparison of X-Ray and Nuclear Magnetic ResonanceMeasurements of Crystallinity in Poly(ethylene terephthalate) Brit. J. Appl. Phys.11, 543 (1960).
198. S. Kavesh, J. M. Schultz, Meaning and Measurement of Crystallinity in Polymers:A Review Polym. Eng. Sci. 9 (5), 331 (1969).
199. A. J. Hill, Positron Annihilation Lifetime Spectroscopy to Probe Free VolumeEffects in Polymers and Composites in High Temperature Properties andApplications of Polymeric materials, edited by M. R. Tant, J. W. Connell, H. L.N. McManus (ACS, Washington, 1995), p 63.
200. A. J. Hill, M. R. Tant, Effect of Crystallinity on Amorphous regions of PET/PCTCopolymer Polym. Mater. Sci. Eng. 81, 281 (1999).
201. L. Xie, D. Gidley, H. Hristov, A. Yee, Positronium Formation in SemicrystallinePET Polymer 35 (1), 14 (1994).
202. H. Mohamed, Y. Ito, M. Imai, Change of Distribution of Free Volume HolesDuring Crystallization of PET Revealed by PALS J. Chem. Phys. 105 (11), 4841(1996).
203. A. M. Roland, J. H. Hotchkiss, Determination of Flavor-Polymer Interactions byVacuum-Microgravimetric Method in Food and Packaging Interactions II, edited

339
by S. J. Risch, J. H. Hotchkiss (American Chemical Society, Washington, DC,1991), p 149.
204. R. C. Reid, J. M. Prausnitz, B. E. Poling, The Properties of Gases and Liquids,4th ed. (McGraw-Hill Book Company, New York, 1988).
205. J. Miltz, A. Ram, M. M. Nir, Prospects for Application of Post-Consumer UsedPlastics in Food Packaging Food Add. Contam. 14 (6-7), 649 (1997).
206. C. K. Yeom, S. H. Lee, H. Y. Song, J. M. Lee, Vapor Permeations of a Series ofVOCs/N2 Mixtures Through PDMS Membrane J. Membr. Sci. 198, 129 (2002).
207. A. Singh, B. D. Freeman, I. Pinnau, Pure and Mixed Gas Acetone/NitrogenPermeation Properties of Polydimethylsiloxane [PDMS] J. Polym. Sci : Polym.Phys. Ed. 36, 289 (1998).
208. H. M. McNair, J. M. Miller, Qualitative and Quantitative Analysis in Basic GasChromatography, (Wiley-Interscience, New York, 1998), p 126.
209. T. C. Merkel, V. I. Bondar, K. Nagai, B. D. Freeman, I. Pinnau, Gas Sorption,Diffusion, and Permeation in Poly(dimethylsiloxane) J. Polym. Sci : Polym. Phys.Ed. 38, 415 (2000).
210. S. V. Dixon-Garrett, K. Nagai, B. D. Freeman, Ethylbenzene Solubility,Diffusivity, and Permeability in Poly(dimethyl siloxane) J. Polym. Sci : Polym.Phys. Ed. 38, 1461 (2000).
211. Y. Sun, J. Chen, Sorption/Desorption Properties of Ethanol, Toluene, and Xylenein Poly(dimethylsiloxane) Membranes J. Appl. Polym. Sci. 51, 1797 (1994).
212. R. C. Reid, J. M. Prausnitz, B. E. Poling, The Properties of Gases and Liquids,4th ed. (McGraw-Hill Book Company, New York, 1988), p 656.
213. C. M. Hansen, Hansen Solubility Parameters: A User's Handbook (CRC Press,Boca Raton, 2000), p 168.
214. Y. Kamiya, Y. Naito, K. Terada, K. Mizoguchi, Volumetric Properties andInteraction Parameters of Dissolved Gases in Poly(dimethylsiloxane) andPolyethylene Macromolecules 33 (8), 3111 (2000).
215. A. F. Mills, Basic Heat and Mass Transfer (Irwin, Inc., Boston, MA, 1995), p677.
340
216. J. Crank, The Mathematics of Diffusion, 2nd ed. (Clarendon Press, Oxford, 1975),p 60.
217. N. H. Snow, G. C. Slack, Gas Chromatography in Kirk-Othmer Encyclopedia ofChemical Technology, 4th ed., edited by M. Howe-Grant (Wiley-Interscience,New York, 2002).
218. F. D. Rossini, K. S. Pitzer, R. L. Arnett, R. M. Braun, G. C. Pimentel, SelectedValues of Physical and Thermodynamic Properties of Hydrocarbons and RelatedCompounds (Carnegie Press, Pittsburgh, PA, 1953).
219. F. Doghieri, G. C. Sarti, Nonequilibrium Lattice Fluids: A Predictive Model forthe Solubility in Glassy Polymers Macromolecules 29, 7885 (1996).
220. W. Czerwinski, The Effect of Molecular Orientation on the Vapor Sorption ofCyclohexane in Amorphous Polyester Fibres Angew. Makromol. Chem. 135, 65(1985).
221. A. Morisato, B. D. Freeman, I. Pinnau, C. G. Casillas, Pure Hydrocarbon SorptionProperties of Poly(1-trimethylsilyl-1-propyne) (PTMSP), Poly(1-phenyl-1-propyne) (PPP) and PTMSP/PPP Blends J. Polym. Sci : Polym. Phys. Ed. 34,1925 (1996).
222. R. C. Reid, J. M. Prausnitz, B. E. Poling, The Properties of Gases and Liquids,4th ed. (McGraw-Hill Book Company, New York, 1988), p 55.
223. D. VanKrevelen, Properties of Polymers: Their Correlation with ChemicalStructure; Their Numerical Estimation and Prediction from Additive GroupContributions (Elsevier Science, Amsterdam, 1990), p 875.
224. A. R. Berens, H. B. Hopfenberg, Diffusion and Relaxation in Glassy PolymerPowders. 2. Separation of Diffusion and Relaxation Parameters Polymer 19 (5),489 (1978).
225. C. J. Patton, R. M. Felder, W. J. Koros, Sorption and Transport of Benzene inPoly(ethylene Terephthalate) J. Appl. Polym. Sci. 29, 1095 (1984).
226. G. F. Billovits, C. J. Durning, Two-stage Weight Gain in the Polystyrene-Ethylbenzene System Polym. Commun. 31 (9), 358 (1990).
227. A. Kishimoto, H. Fujita, H. Odani, M. Kurata, M. Tamura, SuccessiveDifferential Absorptions of Vapors by Glassy Polymers J. Phys. Chem. 64, 594(1960).

341
228. H. Fujita, Organic Vapors Above the Glass Transition Temperature in Diffusionin Polymers, edited by J. Crank, G. S. Park (Academic Press, Inc., New York,1968), p 75.
229. W. R. Vieth, H. H. Alcalay, A. J. Frabetti, Solution of Gases in OrientedPoly(ethylene terephthalate) J. Appl. Polym. Sci. 8, 2125 (1964).
230. G. A. J. Orchard, P. Spiby, I. M. Ward, Oxygen and Water Vapor DiffusionThrough Biaxially Oriented Poly(ethylene terephthalate) J. Polym. Sci : Polym.Phys. Ed. 28, 603 (1990).
231. A. Natu, E. A. Lofgren, W. Kollen, S. A. Jabarin. Effect of Morphology onBarrier Properties of Poly(ethylene terephthalate). 56th Annual TechnicalConference - Society of Plastics Engineers, 1998; p 1642.
232. R. Y. F. Liu, D. A. Schiraldi, A. Hiltner, E. Baer, Oxygen Barrier Properties ofCold-Drawn Polyesters J. Polym. Sci : Polym. Phys. Ed. 40, 862 (2002).
233. J. Lin, S. Shenogin, S. Nazarenko, Oxygen Solubility and Specific Volume ofRigid Amorphous Fraction in Semicrystalline Poly(ethylene terephthalate)Polymer 43, 4733 (2002).
234. J. B. Brolly, D. I. Bower, I. M. Ward, Diffusion and Sorption of CO2 inPoly(ethylene terephthalate) and Poly(ethylene naphthalate) J. Polym. Sci :Polym. Phys. Ed. 34, 769 (1996).
235. P. J. Makerewicz, G. L. Wilkes, Diffusion Studies of Poly(ethylene terephthalate)Crystallized by Nonreactive Liquids and Vapors J. Polym. Sci : Polym. Phys. Ed.16, 1529 (1978).
236. V. Bellenger, J. Kaltenecker-Commercon, J. Verdu, Interactions of Solvents withPoly(methyl methacrylate) Polymer 38 (16), 4175 (1997).
237. G. A. Bernier, R. P. Kambour, The Role of Organic Agents in the Stress Crazingand Cracking of Poly(2,6-dimethyl-1,4-phenylene oxide) Macromolecules 1 (5),393 (1968).
238. V. P. Belousov, M. Y. Panov, Thermodymanic Properties of Aqueous Solutions ofOrganic Substances (CRC Press, Boca Raton, 1994), p 63.
239. A. V. Bailey, D. Mitcham, E. L. Skau, Binary Freezing Point Diagrams for SomeMethyl Ketones and Their Complete Solubilities in Acetone, Methanol, Benzene,and Carbon Tetrachloride J. Chem. Eng. Data 15 (4), 542 (1970).
342
240. C. L. Yaws, S. D. Sheth, M. Han, Using Solubility and Henry's Law ConstantData for Ketones in Water Pollut. Eng. 30 (2), 44 (1998).
241. W. K. Stephenson, R. Fuchs, Enthalpies of Interaction of Ketones with OrganicSolvents Can. J. Chem. 63, 336 (1985).
242. C. L. Yaws, H. C. Yang, Water Solubility Data for Organic Compounds Pollut.Eng. 22 (10), 70 (1990).
243. H. Wang, T. Ugomori, K. Tanaka, H. Kita, K. Okamoto, Y. Suma, Sorption andPervaporation Properties of Sulfonyl-Containing Polyimide Membrane toAromatic/Non-Aromatic Hydrocarbon Mixtures J. Polym. Sci : Polym. Phys. Ed.38, 2954 (2000).
244. H. Odani, M. Uchikura, Y. Ogino, M. Kurata, Diffusion and Solution of MethanolVapor in Poly(2-vinylpyridine)-block-Polyisoprene and Poly(2-vinylpyridine)-block-Polystyrene J. Membr. Sci. 15, 193 (1983).
245. E. Bagley, F. A. Long, Two-stage Sorption and Desorption of Organic Vapors inCellulose Acetate J. Am. Chem. Soc. 77, 2172 (1955).
246. J. Crank, G. S. Park, An Evaluation of the Diffusion Coefficient for Chloroformin Polystyrene from Simple Absorption Experiments Trans. Faraday Soc. 45, 240(1949).
247. P. Drechsel, J. L. Hoard, F. A. Long, J. Polym. Sci. 10, 241 (1953).
248. J. Crank, G. S. Park, Diffusion in High Polymers: Some Anomalies and TheirSignificance Trans. Faraday Soc. 47, 1072 (1951).
249. J. G. Downes, B. H. Mackey, Sorption Kinetics of Water Vapor in Wool Fibres J.Polym. Sci. 28, 45 (1958).
250. J. Crank, A Theoretical Investigation of the Influence of Molecular Relaxationand Internal Stress on Diffusion in Polymers J. Polym. Sci. 11 (2), 151 (1953).
251. G. S. Park, The Glassy State and Slow Process Anomalies in Diffusion inPolymers, edited by J. Crank, G. S. Park (Academic Press, New York, 1968), p141.
252. B. Rosen, Time Dependent Tensile Properties. Part III. Microfracture and Non-Fickian Vapor Diffusion in Organic Glasses J. Polym. Sci. 49, 177 (1961).
343
253. R. Bracewell, The Fourier Transform and Its Applications, 3rd ed. (McGraw-Hill,New York, 1999), p 57.
254. A. F. Barton, CRC Handbook of Polymer-Liquid Interaction Parameters andSolubility Parameters (CRC Press, Boca Raton, 1990), p 202.
255. G. K. Fleming, W. J. Koros, Dilation of Polymers by Sorption of Carbon Dioxideat Elevated Pressures Macromolecules 19, 2285 (1986).
256. M. Suwandi, S. Stern, Transport of Heavy Organic Vapors through SiliconeRubbers J. Polym. Sci : Polym. Phys. Ed. 11, 663 (1973).
257. N. Segatin, C. Klofutar, Thermodynamics of Solution of Some Alkyl Acetates inWater Monatsh. Chem. 132, 1451 (2001).
258. D. A. Sullivan, Industrial Solvents in Kirk-Othmer Encyclopedia of ChemicalTechnology, 4th ed., edited by M. Howe-Grant (Wiley-Interscience, New York,2000).
259. G. Wibawa, R. Hatano, Y. Sato, S. Takishima, H. Masuoka, Solubilities of 11Polar Organic Solvents in Four Polymers Using the Piezoelectric-Quartz SorptionMethod J. Chem. Eng. Data 47, 1022 (2002).
260. S. Prager, F. A. Long, Diffusion of Hydrocarbons in Polyisobutylene J. Am.Chem. Soc. 73, 4072 (1951).
261. A. Aitken, R. M. Barrer, Transport and Solubility of Isomeric Paraffins in RubberTrans. Faraday Soc. 51, 116 (1955).
262. S. P. Chen, J. A. D. Edin, Fickian Diffusion of Alkanes Through GlassyPolymers: Effects of Temperature, Diffusant Size, and Polymer Structure Polym.Eng. Sci. 20 (1), 40 (1980).
263. D. Arnould, R. L. Laurence, Size Effects on Solvent Diffusion in Polymers Ind.Eng. Chem. Res. 31, 218 (1992).
264. A. R. Berens, H. B. Hopfenberg, Diffusion of Organic Vapors at LowConcentrations in Glassy PVC, Polystyrene, and PMMA J. Membr. Sci. 10, 283(1982).
265. S. J. Huang. Evaluating Isostatic and Quasi-isostatic Procedures for Determiningthe Organic Vapor Barrier Properties Through Polymer Membranes, M.S. Thesis,Michigan State University, 1996.
344
266. S. J. Huang, J. R. Giacin, Evaluating the Effect of Temperature and VaporConcentration on the Organic Vapor Barrier Properties of Polymer Membranes byan Isostatic Procedure J. Plastic Film Sheeting 14 (4), 308 (1998).
267. J. Brandrup, E. H. Immergut, E. A. Grulke, Polymer Handbook, 4th ed. (Wiley-Interscience, New York, 1999), p VII/685.
268. P. R. Bevington, Data Reduction and Error Analysis for the Physical Sciences(McGraw-Hill Book Co., New York, 1969).
269. P. J. Fenelon, in Permeability of Plastic Films and Coatings to Gases, Vapors,and Liquids, edited by H. B. Hopfenberg (Plenum, New York, 1974), p 285.
270. C. Zhang, B. P. Cappleman, M. Defibaugh-Chavez, D. H. Weinkauf, GlassyPolymer Sorption Phenomena Measured with a Quartz Crystal MicrobalanceTechnique J. Polym. Sci : Polym. Phys. Ed. 41, 2109 (2003).
271. W. J. Koros, D. R. Paul, Transient and Steady State Permeation in Poly(ethyleneterephthalate) Above and Below the Glass Transition J. Polym. Sci : Polym. Phys.Ed. 16, 2171 (1978).
272. K. Toi, Analysis of the Permeation of CO2 Through Glassy Polymers J. Membr.Sci. 41, 37 (1989).
273. R. M. Barrer, J. A. Barrie, P. S. L. Wong, The Diffusion and Solution of Gases inHighly Crosslinked Copolymers Polymer 9 (12), 609 (1968).
274. E. L. V. Lewis, R. A. Duckett, I. M. Ward, J. P. A. Fairclough, A. J. Ryan, TheBarrier Properties of Poly(ethylene terephthalate) to Mixtures of Oxygen, CarbonDioxide and Nitrogen Polymer 44, 1631 (2003).
345
VITA
Sushil Naresh Dhoot was born on August 6, 1977 in Aurangabad, India, the son
of Sudha Dhoot and Naresh Dhoot. After completing his work in St. Xavier’s High
School and Vivekanand Junior College in Kolhapur, India, he entered Mumbai
University Institute of Chemical Technology in May 1994. He graduated with a Bachelor
of Science (B.S.) degree in Chemical Engineering from Mumbai University in May 1998.
Then, he entered North Carolina State University in Raleigh, NC that same year. He was
awarded a Master of Science (M.S.) degree in Chemical Engineering in December 2000.
In January 2002, he transferred to The University of Texas at Austin and continued to
work with the same supervisor, Professor Benny D. Freeman, in the Chemical
Engineering department.
Permanent Address: Rajarampuri 6th Lane, Gayatri Bldg., Kolhapur, 416 008 INDIA.
This dissertation was typed by the author.