sources and effects of ionizing radiation to sales no. e.10.xi.3 18 may 2016 v.16-02682 (e)...
TRANSCRIPT

SOURCES AND EFFECTS OF IONIZING RADIATION
United Nations Scientific Committee on the Effects of Atomic Radiation
UNSCEAR 2008 Report to the General Assembly
with Scientific Annexes
VOLUME I
UNITED NATIONSNew York, 2010

NOTE
The report of the Committee without its annexes appears as Official Records of the General Assembly, Sixty-third Session, Supplement No. 46.
The designations employed and the presentation of material in this publication do not imply the expression of any opinion whatsoever on the part of the Secretariat of the United Nations concerning the legal status of any country, territory, city or area, or of its authorities, or concerning the delimitation of its frontiers or boundaries.
The country names used in this document are, in most cases, those that were in use at the time the data were collected or the text prepared. In other cases, however, the names have been updated, where this was possible and appropriate, to reflect political changes.
UNITED NATIONS PUBLICATION
Sales No. E.10.XI.3
ISBN 978-92-1-142274-0

Corrigendum to Sales No. E.10.XI.3
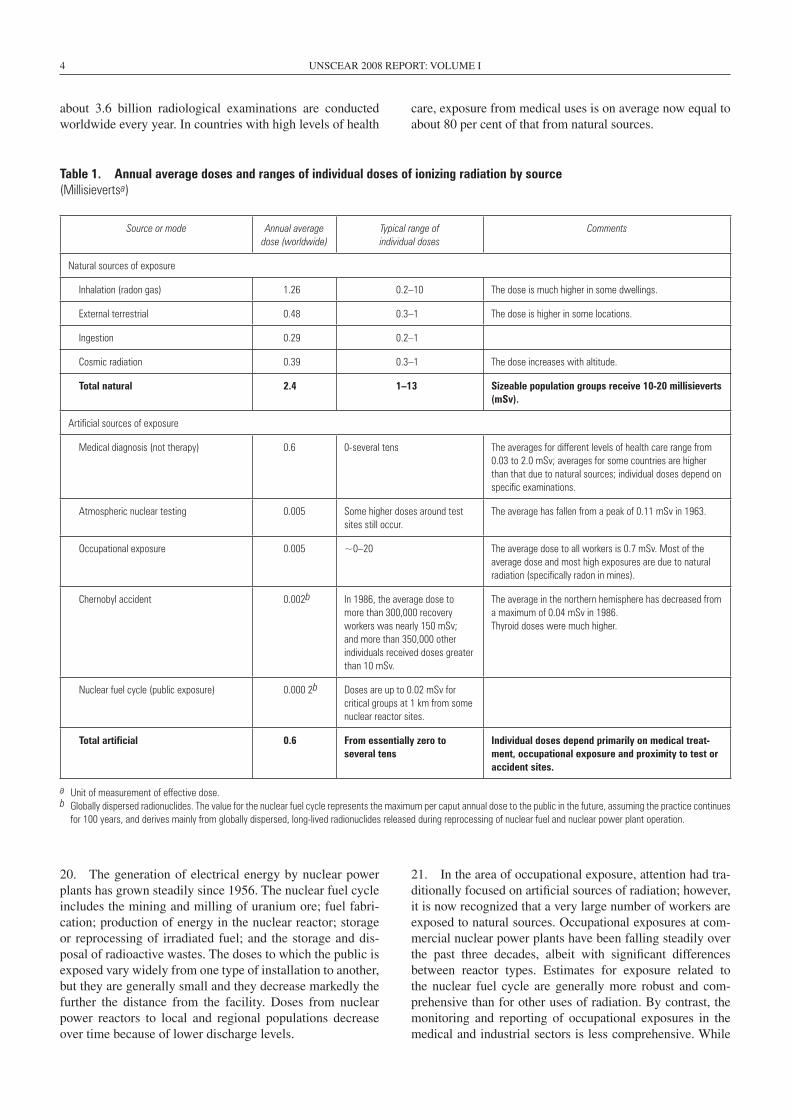
18 May 2016
V.16-02682 (E)
*1602682*
Sources and Effects of Ionizing Radiation: United Nations Scientific Committee on the Effects of Atomic Radiation 2008 Report
Volume I
Report of the United Nations Scientific Committee on the Effects of Atomic Radiation to the General Assembly
Corrigendum
1. Page 8, figure III
For the entry for level I (diagnostic medical), for 1308 read 1332
For the entry for Global (diagnostic medical), for 482 read 488
2. Page 9, figure IV
For the entry for level I, for 1.88 read 1.92
For the entry for Global, for 0.61 read 0.62
3. Page 11, table 4, column headed “Sources of exposure”, subcolumn headed“Nuclear medicine examinations (man Sv)”
After the entry 82 insert a Insert at the foot of the table a footnote reading a Refers to health-care levels III-IV.
4. Page 14, table 6, column headed “1990-1994”
For the value for the weighted average, for 0.8 read 1.3
5. Page 15, paragraph 63
In fthe ourth line, for 38 read 35
In fthe ifth line, for 26 read 24
In the sixth line, for 38 read 35
In the seventh line, for 34 read 31

2 V.16-02682
Corrigendum to Sales No. E.10.XI.3
In the tenth line, for 29 read 32
In the eleventh line, for 68 read 61
6. Page 15, paragraph 64
In the fourth line, for 85 read 80
In the sixth line, for Twenty-five read Nine
In the seventh line, for 164 read 120
7. Page 15, paragraph 65
In the third line, for 29 read 34
In fthe ifth line, for 33 read 42
8. Page 15, paragraph 66
In the fourth line, for 29 read 32
In fthe ifth line, for 45 read 46
In fthe ifth line, for 613 read 623

iii
CONTENTS
Page
VOLUME I: SOURCES
Report of the United Nations Scientific Committee on the Effects of Atomic Radiation to the General Assembly . . . . . . . . . . . . . . . . . . . . . . . . . . . . . . . . . . . . . . . . . . . . . . . . . . . . . . . . . . . . . . . . . . . . . . 1
Scientific Annexes
Annex A . Medical radiation exposures . . . . . . . . . . . . . . . . . . . . . . . . . . . . . . . . . . . . . . . . . . . . . . . . . . . . . . . . . . 21Annex B . Exposures of the public and workers from various sources of radiation . . . . . . . . . . . . . . . . . . . . . . . . . . 221
VOLUME II: EFFECTS
Annex C . Radiation exposures in accidentsAnnex D . Health effects due to radiation from the Chernobyl accidentAnnex E . Effects of ionizing radiation on non-human biota


v
Contents
Page
I . Introduction . . . . . . . . . . . . . . . . . . . . . . . . . . . . . . . . . . . . . . . . . . . . . . . . . . . . . . . . . . . . . . . . . . . . . . . . . . . . 1
II . Deliberations of the United Nations Scientific Committee on the Effects of Atomic Radiation at its fifty-sixth session . . . . . . . . . . . . . . . . . . . . . . . . . . . . . . . . . . . . . . . . . . . . . . . . . . . . . . . . . . . . . . . . . . . . . . 1
III . Strategic plan and programme of work of the Committee . . . . . . . . . . . . . . . . . . . . . . . . . . . . . . . . . . . . . . . . . 2
IV . Scientific report . . . . . . . . . . . . . . . . . . . . . . . . . . . . . . . . . . . . . . . . . . . . . . . . . . . . . . . . . . . . . . . . . . . . . . . . . 3 A . Sources of radiation exposure . . . . . . . . . . . . . . . . . . . . . . . . . . . . . . . . . . . . . . . . . . . . . . . . . . . . . . . . . . 5 B . Chernobyl accident . . . . . . . . . . . . . . . . . . . . . . . . . . . . . . . . . . . . . . . . . . . . . . . . . . . . . . . . . . . . . . . . . . . 15 C . Effects on non-human biota . . . . . . . . . . . . . . . . . . . . . . . . . . . . . . . . . . . . . . . . . . . . . . . . . . . . . . . . . . . . 18
Appendices
I . Members of national delegations attending the fiftieth to fifty-sixth sessions of the United Nations Scientific Committee on the Effects of Atomic Radiation, at which the 2008 scientific report was elaborated . . . . . . . . . . . . . . . . . . . . . . . . . . . . . . . . . . . . . . . . . . . . . . . . . . . . . 19
II . Scientific staff and consultants cooperating with the United Nations Scientific Committee on the Effects of Atomic Radiation in the preparation of the 2008 scientific report of the Committee . . . . . . . . . . . . . . . . . . . . . . . . . . . . . . . . . . . . . . . . . . . . . . . . . . . . . . . . . . . 20
Report of the United Nations Scientific Committee on the Effects of Atomic Radiation to the General Assembly


1
I. INTROdUCTION
1. Exposure to radiation has origins such as medical diag-nostic and therapeutic procedures; nuclear weapons pro-duction and testing; natural background radiation; nuclear electricity generation; accidents such as the one at Cherno-byl in 1986; and occupations that entail increased exposure to artificial or naturally occurring sources of radiation.
2. Since the establishment of the United Nations Scientific Committee on the Effects of Atomic Radiation by General Assembly resolution 913 (X) of 3 December 1955, the man-date of the Committee has been to undertake broad reviews of the sources of ionizing radiation and of the effects of that radiation on human health and the environment. In pur-suit of its mandate, the Committee thoroughly reviews and evaluates global and regional exposures to radiation; and it evaluates evidence of radiation-induced health effects in exposed groups, including survivors of the atomic bombings
in Japan. The Committee also reviews advances in the under-standing of the biological mechanisms by which radiation-induced effects on health or on the environment can occur. Those assessments provide the scientific foundation used, inter alia, by the relevant agencies of the United Nations system in formulating international standards for protec-tion of the public and of workers against ionizing radiation;1 those standards, in turn, are linked to important legal and regulatory instruments.
1 The international basic safety standards for protection against ionizing radiation and for the safety of radiation sources are currently co-sponsored by the International Labour Organization, the Food and Agriculture Organi-zation of the United Nations (FAO), the World Health Organization (WHO), the International Atomic Energy Agency (IAEA), the Nuclear Energy Agency of the Organization for Economic Cooperation and Development and the Pan American Health Organization.
II. dELIbERATIONS OF ThE UNITEd NATIONS SCIENTIFIC COMMITTEE ON ThE EFFECTS OF ATOMIC RAdIATION AT ITS FIFTy-SIxTh SESSION
3. The Committee held its fifty-sixth session in Vienna from 10 to 18 July 2008.2 Norman Gentner (Canada), Wolfgang Weiss (Germany) and Mohamed A. Gomaa (Egypt) served as Chairman, Vice-Chairman and Rapporteur, respectively. The Committee scrutinized and approved for publication five scientific annexes that had last been considered at its fifty-fifth session (21-25 May 2007), as reported to the General Assembly in the report of the Committee on that session.3 As previously reported,4 the Committee had originally planned that those documents would be published by 2005.
4. With regard to the report with scientific annexes that it had approved in 2006,5 the Committee was disappointed that
2 The fifty-sixth session of the Committee was attended by members of the Committee and by the official contact points of Belarus, the Russian Feder-ation and Ukraine, for matters related to the Chernobyl accident; observers for Belarus, Finland, Pakistan, the Republic of Korea, Spain and Ukraine; and observers for the United Nations Environment Programme (UNEP), WHO, IAEA, the International Agency for Research on Cancer, the Euro-pean Commission, the International Commission on Radiological Protec-tion, the International Commission on Radiation Units and Measurements, the International Organization for Standardization and the International Union of Radioecology.3 Official Records of the General Assembly, Sixty-second Session, Supple-ment No. 46 (A/62/46), para. 3.4 Ibid., Fifty-sixth Session, Supplement No. 46 (A/56/46), para. 10.5 Ibid., Sixty-first Session, Supplement No. 46 (A/61/46), para. 2.
volume I had not been published until July 2008 and that volume II would likely not be published before December 2008, bearing in mind that Member States and some organi-zations6 relied on the information contained in that report, to which the Committee members had contributed invaluable expertise. It was observed that the delays were traceable in part to inadequate staffing and to a lack of sufficient, assured and predictable funding.
5. The Committee noted that the General Assembly, in its resolution 62/100 of 17 December 2007, had appealed to the Secretary-General to take appropriate administrative measures so that the secretariat could adequately service the Committee in a predictable and sustainable manner; and had
6 At its fifty-first regular session, the IAEA General Conference, in its reso-lution GC(51)/RES/11, entitled “Measures to strengthen international coop-eration in nuclear, radiation and transport safety and waste management”, noted that the IAEA Secretariat had commenced revision of the Interna-tional Basic Safety Standards for Protection against Ionizing Radiation and the Safety of Radiation Sources with the participation of co-sponsors; noted the report of the United Nations Scientific Committee on the Effects of Atomic Radiation on its fifty-fourth session (Official Records of the General Assembly, Sixty-first Session, Supplement No. 46 (A/61/46)); and urged the IAEA Secretariat to consider carefully and to justify any potential changes to the Basic Safety Standards, ensuring consistency with, inter alia, the Committee’s report.
2 UNSCEAR 2008 REPORT: VOLUME I
requested the Secretary-General to provide a comprehensive and consolidated report to the Assembly at its sixty-third session, to be prepared in consultation with the Committee as appropriate, addressing the financial and administrative implications of increased Committee membership, staffing of the professional secretariat and methods to ensure sufficient,
assured and predictable funding. The secretariat was requested to facilitate the inclusion in the Secretary-General’s report of the views of the Committee on those matters.
6. The Committee decided to hold its fifty-seventh session in Vienna from 25 to 29 May 2009.
III. STRATEGIC pLAN ANd pROGRAMME OF wORk OF ThE COMMITTEE
7. The Committee had developed a strategic plan7 to pro-vide vision and direction for all its activities during the period 2009-2013, to facilitate result-based programming by the secretariat, to help foster management of sufficient, assured and predictable resources and to improve planning and coordination among the various parties involved.
8. The Committee considered that its strategic objective for the period was to increase awareness and deepen under-standing among authorities, the scientific community and civil society with regard to levels of ionizing radiation and the related health and environmental effects as a sound basis for informed decision-making on radiation-related issues.
9. It was established that the thematic priorities for the period would be medical exposures of patients, radiation levels and effects of energy production, exposure to natural sources of radiation and improved understanding of the effects from low-dose-rate radiation exposure.
10. Several strategic shifts were envisaged in order to better meet the needs of Member States, including: (a) stream lining the Committee’s scientific evaluation process by preparing short yet wide-ranging summary reports every 4-5 years on the levels and effects of radiation exposure and preparing spe-cial reports that respond to emerging issues as the need arises; and establishing standing expert groups to maintain surveil-lance on emerging issues and networks of centres of excel-lence to help implement the strategic plan; (b) enhancing mechanisms for data collection, analysis and dissemination; (c) improving result-based planning, including improving
7 Available on request from the Secretary of the Committee.
coordination with other stakeholders to develop areas of syn-ergy and avoid inconsistencies; and (d) raising awareness and improving outreach by enhancing the website of the Com-mittee and disseminating findings in readily understandable formats to decision makers and the public.
11. It was assumed that, in order to implement the strategic plan, intersessional work by the Committee would increase and action would have to be taken to address both the concern of the Committee that reliance on a single Professional-level post in its secretariat had left the Committee seriously vul-nerable and had hampered the efficient implementation of its approved programme of work, and methods to ensure sufficient, assured and predictable funding, as requested in General Assembly resolution 62/100.
12. For its future programme of work, the Committee decided to initiate work immediately on assessments of levels of radiation from energy production and the effects on human health and the environment; uncertainty in radia-tion risk estimation; attributability of health effects due to radiation exposure (in response to paragraph 6 of General Assembly resolution 62/100); updating its methodology for estimating exposures due to discharges from nuclear instal-lations; a summary of radiation effects; and improving data collection, analysis and dissemination. Depending on the availability of resources, other work might be undertaken on the biological effects of key internal emitters, medical exposures of patients, enhanced exposures to natural sources of radiation due to human activities, public information and development of a knowledge base on radiation levels and effects. The Committee authorized the secretariat to take appropriate action to implement the strategic plan and future programme of work.

3
IV. SCIENTIFIC REpORT
13. The scientific report and its annexes were elaborated from the fiftieth to the fifty-sixth sessions of the Committee on the basis of documents submitted by the secretariat. Serving as Chairman, Vice-Chairman and Rapporteur at those sessions were:
Session Chairman Vice-Chairman Rapporteur
Fiftieth J. Lipsztein (Brazil) Y. Sasaki (Japan) R. Chatterjee (Canada)Fifty-first J. Lipsztein (Brazil) Y. Sasaki (Japan) R. Chatterjee (Canada)Fifty-second Y. Sasaki (Japan) R. Chatterjee (Canada) P. Burns (Australia)Fifty-third Y. Sasaki (Japan) P. Burns (Australia) N. Gentner (Canada)Fifty-fourth P. Burns (Australia) N. Gentner (Canada) C. Streffer (Germany)Fifty-fifth P. Burns (Australia) N. Gentner (Canada) W. Weiss (Germany)Fifty-sixth N. Gentner (Canada) W. Weiss (Germany) M. Gomaa (Egypt)
14. The names of the members of national delegations who attended those sessions are listed in appendix I. The Committee wishes to acknowledge the contribution of the representatives of specialized agencies of the United Nations system and other organizations to the discussion. The Committee also wishes to recognize a small group of consultants who helped prepare the material (see appendix II). They were responsible for the preliminary assessment of the relevant technical information, on which rested the final deliberations of the Committee.
15. In conducting its work, the Committee applied scien-tific judgement to the material it reviewed and took care to assume an independent and neutral position in reaching its conclusions. Following established practice, the findings are presented in the present report. The supporting scientific annexes are aimed at the scientific community and will be issued separately as a United Nations sales publication.
Overview
16. For as long as they have been on the planet, humans have been exposed to ionizing radiation from natural sources, although exposure may be modified by human activity. In addition, new, artificial sources of exposure have developed over the past century or so. The Committee last made estimates of radiation exposure levels and trends in its 2000 report.8 The present report updates and extends those estimates; table 1 summarizes the updated values for average annual doses and ranges of exposure from all sources.9
8 Official Records of the General Assembly, Fifty-fifth Session, Supplement No. 46 (A/55/46).9 See paragraph 26 below for a discussion of the concept of radiation dose.
17. The main natural sources of exposure are cosmic radia-tion and natural radionuclides found in the soil and in rocks. Cosmic radiation is significantly higher at the cruising alti-tudes of jet aircraft than on the Earth’s surface. External exposure rates due to natural radionuclides vary considerably from place to place, and can range up to 100 times the aver-age. An important radionuclide is radon, a gas that is formed during the decay of natural uranium in the soil and that seeps into homes. Exposures due to inhalation of radon by people living and working indoors vary dramatically depending on the local geology, building construction and household life-styles; this mode of exposure accounts for about half of the average human exposure to natural sources.
18. The Committee evaluated the additional radiation expo-sures introduced by military and peaceful activities. Nuclear test explosions in the atmosphere had been conducted at a number of sites, mostly in the northern hemisphere, the most active testing being in the periods 1952–1958 and 1961–1962. The radioactive fallout from those tests rep-resents a source of continuing exposure even today, albeit at very low levels. There is concern regarding the return of residents to nuclear test areas, because radioactive residue levels are considerable at some sites. People living near sites where nuclear materials and weapons had been produced are also exposed to radiation. Military use of depleted uranium, especially in armour-piercing munitions, has raised concerns about residual contamination; however, radiation exposures are generally negligible.
19. With regard to the peaceful uses of radiation, medical exposures were by far the dominant form. Medical exposure is almost always voluntary and provides a direct benefit to the exposed individual. Irrespective of the level of health care in a country, the medical uses of radiation continue to increase as techniques develop and become more widely disseminated;
4 UNSCEAR 2008 REPORT: VOLUME I
about 3.6 billion radiological examinations are conducted worldwide every year. In countries with high levels of health
20. The generation of electrical energy by nuclear power plants has grown steadily since 1956. The nuclear fuel cycle includes the mining and milling of uranium ore; fuel fabri-cation; production of energy in the nuclear reactor; storage or reprocessing of irradiated fuel; and the storage and dis-posal of radioactive wastes. The doses to which the public is exposed vary widely from one type of installation to another, but they are generally small and they decrease markedly the further the distance from the facility. Doses from nuclear power reactors to local and regional populations decrease over time because of lower discharge levels.
21. In the area of occupational exposure, attention had tra-ditionally focused on artificial sources of radiation; however, it is now recognized that a very large number of workers are exposed to natural sources. Occupational exposures at com-mercial nuclear power plants have been falling steadily over the past three decades, albeit with significant differences between reactor types. Estimates for exposure related to the nuclear fuel cycle are generally more robust and com-prehensive than for other uses of radiation. By contrast, the monitoring and reporting of occupational exposures in the medical and industrial sectors is less comprehensive. While
Table 1. Annual average doses and ranges of individual doses of ionizing radiation by source(Millisievertsa)
Source or mode Annual average dose (worldwide)
Typical range of individual doses
Comments
Natural sources of exposure
Inhalation (radon gas) 1 .26 0 .2–10 The dose is much higher in some dwellings .
External terrestrial 0 .48 0 .3–1 The dose is higher in some locations .
Ingestion 0 .29 0 .2–1
Cosmic radiation 0 .39 0 .3–1 The dose increases with altitude .
Total natural 2.4 1–13 Sizeable population groups receive 10-20 millisieverts (mSv).
Artificial sources of exposure
Medical diagnosis (not therapy) 0 .6 0-several tens The averages for different levels of health care range from 0 .03 to 2 .0 mSv; averages for some countries are higher than that due to natural sources; individual doses depend on specific examinations .
Atmospheric nuclear testing 0 .005 Some higher doses around test sites still occur .
The average has fallen from a peak of 0 .11 mSv in 1963 .
Occupational exposure 0 .005 ~0–20 The average dose to all workers is 0 .7 mSv . Most of the average dose and most high exposures are due to natural radiation (specifically radon in mines) .
Chernobyl accident 0 .002b In 1986, the average dose to more than 300,000 recovery workers was nearly 150 mSv; and more than 350,000 other individuals received doses greater than 10 mSv .
The average in the northern hemisphere has decreased from a maximum of 0 .04 mSv in 1986 .Thyroid doses were much higher .
Nuclear fuel cycle (public exposure) 0 .000 2b Doses are up to 0 .02 mSv for critical groups at 1 km from some nuclear reactor sites .
Total artificial 0.6 From essentially zero to several tens
Individual doses depend primarily on medical treat-ment, occupational exposure and proximity to test or accident sites.
care, exposure from medical uses is on average now equal to about 80 per cent of that from natural sources.
a Unit of measurement of effective dose .b Globally dispersed radionuclides . The value for the nuclear fuel cycle represents the maximum per caput annual dose to the public in the future, assuming the practice continues
for 100 years, and derives mainly from globally dispersed, long-lived radionuclides released during reprocessing of nuclear fuel and nuclear power plant operation .

REPORT TO THE GENERAL ASSEMBLY 5
the average dose to workers in all occupational groups has dropped substantially over the past two decades, occupational exposures from natural radiation sources have changed little.
22. A small number of accidents have occurred in asso-ciation with the nuclear fuel cycle and have attracted wide-spread publicity. However, more than 100 accidents have occurred with industrial and medical sources, especially in settings termed “orphaned” (i.e. outside regulatory control), and those accidents have caused injury to workers and the public. Accidents can also occur during medical uses of radi-ation, usually involving human or machine error in radio-therapy. While it is known that accidents involving orphan sources and medical uses of radiation have become more frequent, the current figures are likely to be underestimates, and possibly significantly so, because of underreporting.
23. The accident at the Chernobyl nuclear power plant in 1986 was the most severe such accident in the history of civilian nuclear power. Two workers died in the immediate aftermath, and 134 plant staff and emergency personnel suf-fered acute radiation syndrome, which proved fatal for 28 of them. Several hundred thousand workers were subsequently involved in recovery operations. Among the persons exposed to the highest radiation doses in 1986 and 1987, there are some reports of increased incidence of leukaemia and of cata racts; there is no other consistent evidence to date of other radiation-related health effects. The radioactive cloud created by the accident deposited substantial amounts of radioactive material over large areas of the former Soviet Union and other parts of Europe, contaminating land, water and biota and causing particularly serious social and eco-nomic disruption to large segments of the population in the countries known today as Belarus, the Russian Federation and Ukraine. Among the people who were children or ado-lescents in 1986 in affected areas of the former Soviet Union, more than 6,000 cases of thyroid cancer have been reported (to date only a small number of them fatal), of which a sub-stantial portion could be attributed to drinking milk contami-nated with the short-lived radionuclide iodine-131. In the longer term, the general population too was exposed to radi-ation (of the low-level chronic type) but there has been no consistent evidence yet of any other radiation-related health effects in the general population.
24. In its 1996 scientific report, the Committee evaluated the rates of exposure below which effects on populations of species other than humans were unlikely. The Commit-tee has since reviewed the approaches to evaluating radi-ation doses to species other than humans, together with new scientific information on the radiobiological effects on plants and animals (in particular information from the continuing follow-up of the environmental consequences of the Chernobyl accident). That review has revealed no evidence to support changing the conclusions of the 1996 report according to which no effects are expected at chronic dose rates below 0.1 milligrays per hour or at acute doses below 1 gray to the most highly exposed individuals in the exposed population.
A. Sources of radiation exposure
25. All matter is made up of atoms. Some atoms are naturally stable, others are unstable. Radioactivity is a natural phenomenon that occurs when an atom with an un stable nucleus spontaneously transforms, releasing energy in the form of ionizing radiation. These unstable elements are known as radionuclides and they are radio-active. The released radiation may take the form of par-ticles (including electrons, neutrons and alpha particles) or of electromagnetic gamma radiation or X-rays, all with different amounts of energy. Radiation can also be generated artificially by machines.
26. When ionizing radiation passes through matter, includ-ing living tissue, it deposits energy that ultimately produces ionization and excitation in the matter. The amount of energy deposited divided by the mass of tissue exposed is called the absorbed dose and is usually measured in units known as milligrays. The biological damage caused by radiation is related to the amount of energy deposited. However, to estimate the potential biological effect, allowance is made for the fact that different kinds of radiation have different biological effects for the same amount of energy deposited and the fact that tissues also react differently. A weighted quantity called the effective dose is used in radiation pro-tection, and is the most commonly used indicator of the potential biological effects associated with exposure to ion-izing radiation in humans. The effective dose (here simply “dose”) is usually expressed in millisieverts (mSv). The total exposure of a group of people to radiation is called the col-lective dose and is expressed in man-sieverts (man Sv). As a reference for subsequent comparisons, the annual global average per caput dose from natural background radiation is 2.4 mSv, while the corresponding annual collective dose to the global population from natural background radiation is about 16 million man Sv.
1. Natural sources
27. For most individuals, exposure to natural background radiation is the largest component of their total radiation exposure. Although the sources of radiation are natural, exposures are affected by human activity, of which the sim-plest example is living in a house. Building materials pro-vide shielding against radiation from the ground but may themselves contain radionuclides that increase exposure. In addition, buildings may trap radon gas and thus increase exposures vis-à-vis those occurring in the open air.
28. Cosmic radiation (i.e. radiation originating in outer space) is significantly attenuated by the Earth’s atmosphere. At sea level it contributes about 15 per cent of the total dose from natural radiation sources; however, at higher altitudes and especially in outer space, it is the dominant radiation source. At cruising altitudes of commercial aircraft, the average dose rates are 0.003–0.008 mSv per hour, some two orders of magnitude higher than at sea level.

6 UNSCEAR 2008 REPORT: VOLUME I
29. Everything in and on the Earth contains radionuclides. The so-called primordial radionuclides found in the ground (potassium-40, uranium-238 and thorium-232), together with the radionuclides into which they decay, emit radiation. Estimates of external exposure10 vary considerably from one
10 External exposure is exposure to radiation that originates from outside the body, whereas internal exposure is exposure to radiation that originates from radioactive material inside the body.
location to another. Some specific locations have such high concentrations of these radionuclides that the dose rates may be 100 times the global average value. These radionuclides and some formed by the interaction of cosmic rays with the Earth’s atmosphere are also present in food and drink and so become incorporated into the body. Environmental con-centrations of natural radionuclides are highly variable (see figure I). Most of the dose from such internal exposure10 is due to potassium-40.
Figure I. Variability of natural uranium concentrations observed in drinking water
Note: The vertical lines express the range of values observed in the country . Note that the scales on the vertical axes increase by factors of 10 .
30. One radionuclide produced from the uranium-238 decay series is radon-222 (or simply “radon”). This gas is a normal constituent of soil gas and seeps into buildings. When radon is inhaled, some of its short-lived decay prod-ucts are retained in the lungs and irradiate cells in the respi-ratory tract. Radon levels vary dramatically depending on the underlying local geology and other factors such as the permeability of the soil, construction of the building, climate and household lifestyles. Very extensive measurement pro-grammes have been conducted and have formed the basis for implementing measures to reduce indoor radon concentra-tions. Radon accounts for about half of the average exposure to natural sources of radiation.
31. The estimates of annual average and individual doses of ionizing radiation from exposure to all natural radiation sources are shown above in table 1.
2. Artificial sources
(a) Exposures from military activities
32. Nuclear test explosions in the atmosphere were con-ducted at a number of sites, mostly in the northern hemi-sphere, between 1945 and 1980, the most active testing being in the periods 1952–1958 and 1961–1962. In all, 502 tests were conducted, with a total yield of 434 mega-tons of trinitrotoluene (TNT) equivalent. The estimated annual per caput effective dose of ionizing radiation due to global fallout from atmospheric nuclear weapons test-ing was highest in 1963, at 0.11 mSv, and subsequently fell to its present level of about 0.005 mSv (see figure II). This source of exposure will decline only very slowly in the future as most of it is now due to the long-lived radio-nuclide carbon-14.
0.01
0.1
1
10
100
1 000
10 000
100 000
1 000 000
Argen
tina
Braz
ilCh
ina
Czec
h Re
p.Fi
nlan
dFr
ance
Germ
any
Greec
eHun
gary
Indi
aIta
lyM
oroc
coRo
man
iaSp
ainSw
itzer
land
Unite
d St
ates
URA
NIU
M�2
38 C
ON
CEN
TRAT
ION
(mill
ibec
quer
els
per l
itre)
NA
TURA
L URA
NIU
M CO
NCEN
TRATIO
N
(microgram
s per litre)
0.008
0.000 8
8 000
800
0.08
80
0.8
8
80 000

REPORT TO THE GENERAL ASSEMBLY 7
Figure II. Estimated annual per caput effective dose of ionizing radiation worldwide from atomic bomb tests, 1945–2005
0
0.02
0.04
0.06
0.08
0.1
0.12
1945 1955 1965 1975 1985 1995 2005
YEAR
AN
NU
AL
EFFE
CTI
VE D
OSE
�mSv
�
33. People living near test sites were also exposed to local fallout. Because the sites and the characteristics of the tests differed substantially, doses can only be estimated separately after very detailed studies at each site. Many of those studies were carried out in the late 1990s and the early years of the present decade and are still continuing. It is clear that some people living near the sites at the time of testing received very large doses. Presently there is concern regarding the return to use of nuclear test areas, since radioactive residue in some environments may be considerable.
34. From 1962 to 1990, following the signature of the 1963 Treaty Banning Nuclear Weapon Tests in the Atmos-phere, in Outer Space and under Water,11 typically up to 50 or more explosions were conducted underground annually; a few tests were also conducted after that. Most underground tests had a much lower yield than atmospheric tests, and any radioactive debris was usually contained unless gases were vented or leaked into the atmosphere. The tests generated a very large quantity of radioactive residue, but that residue is not expected to expose the public to radiation because it is located deep underground and essentially is fused with the host rock.
35. In addition to the weapons tests themselves, the installations where nuclear materials were produced and nuclear weapons were manufactured were another source of radionuclide releases leading to radiation exposure of local populations.
36. A by-product of uranium enrichment is depleted ura-nium, which is less radioactive than natural uranium. Its
11 United Nations, Treaty Series, vol. 480, No. 6964.
chemical toxicity is its most hazardous property. Except for a few specific scenarios (such as long-term handling), radiation exposures should be negligible.
(b) Exposures from peaceful activities
(i) Radiation exposures of patients
37. The exposure of patients to ionizing radiation relates to diagnostic radiology, nuclear medicine and radiotherapy. The Committee conducted a survey of medical exposures for the period 1997–2007. There are some limitations on the survey data, with the majority of the responses being received from relatively more developed countries. Explicit comparison of doses resulting from medical exposures with those from other sources is inappropriate, as patients receive a direct benefit from their exposure and, moreover, they may be sick or older than the general population. In fact, increas-ing medical exposure is likely associated with increased health benefits to the population.
Diagnostic medical exposures
38. Since the previous survey (covering the period 1991–1996), the total number of diagnostic medical examinations (both medical and dental) is estimated to have risen from 2.4 billion to 3.6 billion—an increase of approximately 50 per cent. As in previous reports of the Committee, data are grouped according to a country’s health-care level (I, II, III or IV—I being the highest, IV the lowest—based on the number of physicians per population). Figure III shows, for the period 1997-2007, the annual frequency of

8 UNSCEAR 2008 REPORT: VOLUME I
medical X-ray examinations by health-care level. As can be seen from the figure, such examinations were over 65 times more frequent in level I countries (which account for 24 per cent of the global population) than in level III and
IV countries (which account for 27 per cent of the global population). The wide imbalance in health-care provision is also reflected in the availability of X-ray equipment and of physicians.
Figure III. Average annual frequency of diagnostic medical and dental x-ray examinations, by health-care level, 1997–2007
332
320
1 332
488
16
275
740
200
400
600
800
1 000
1 200
1 400
I II III and IV Global
HEALTH�CARE LEVEL
FREQ
UEN
CY
�per
1 0
00 p
opul
atio
n�
Diagnostic medical Dental X-ray
39. Table 2 shows the trend in the use of diagnostic radiology and the associated exposures.
Table 2. Trend in radiation exposure from diagnostic radiology
Year of Committee report in which survey data were analysed
Number of examinations (millions) Collective effective dose (man Sv) Annual per caput dose (mSv)
1988 1 380 1 800 000 0 .35
1993 1 600 1 600 000 0 .3
2000 1 910 2 300 000 0 .4
2008 3 100 4 000 000 0 .6
40. As part of that trend, new, high-dose X-ray technology(particularly computed tomography scanning) is causingextremely rapid growth in the annual number of proceduresperformed in many countries and, by extension, a markedincrease in collective doses. For several countries, this hasresulted, for the first time in history, in a situation where theannual collective and per caput doses of ionizing radiationdue to diagnostic radiology have exceeded those from thepreviously largest source (natural background radiation).
41. Since the last survey analysed by the Committee,the total collective effective dose from medical diagnosticexaminations is estimated to have increased by 1.7 millionman Sv, rising from about 2.3 million to about 4 millionman Sv, an increase of approximately 70 per cent. Figure IVshows, for the period 1997–2007, the annual average percaput effective dose of radiation by health-care level and forthe global population due to diagnostic medical and dentalX-ray examinations.

REPORT TO THE GENERAL ASSEMBLY 9
Figure IV. Annual average per caput effective dose of ionizing radiation due to diagnostic medical and dental x-ray examinations, by health-care level, 1997–2007
Nuclear medicine
42. An estimated 32.7 million diagnostic nuclear medicineexaminations are presently performed annually worldwide,which represents an increase of 0.2 million examinationsper year or under 1 per cent since the 1991–1996 survey.Over that same period, the collective effective dose due
0.32
0.03
0.62
1.92
0.0
0.5
1.0
1.5
2.0
I II III and IV Global
HEALTH�CARE LEVEL
PER
CAPU
T D
OSE
�mSv
�
to nuclear medicine examinations rose from 150,000 to 202,000 man Sv, representing an increase of 52,000 man Sv or about 35 per cent. People living in health-care level I coun-tries account for about 90 per cent of all nuclear medicine examinations. Figure V presents, for the period 1997–2007, a summary of the annual frequency of diagnostic nuclear medicine examinations by health-care level.
Figure V. Annual frequency of diagnostic nuclear medicine examinations, by health-care level, 1997–2007
19
1.10.02
0
5
10
15
20
I II III and IV Global
HEALTH�CARE LEVEL
FREQ
UEN
CY
�per
1 0
00 p
opul
atio
n�
5.1
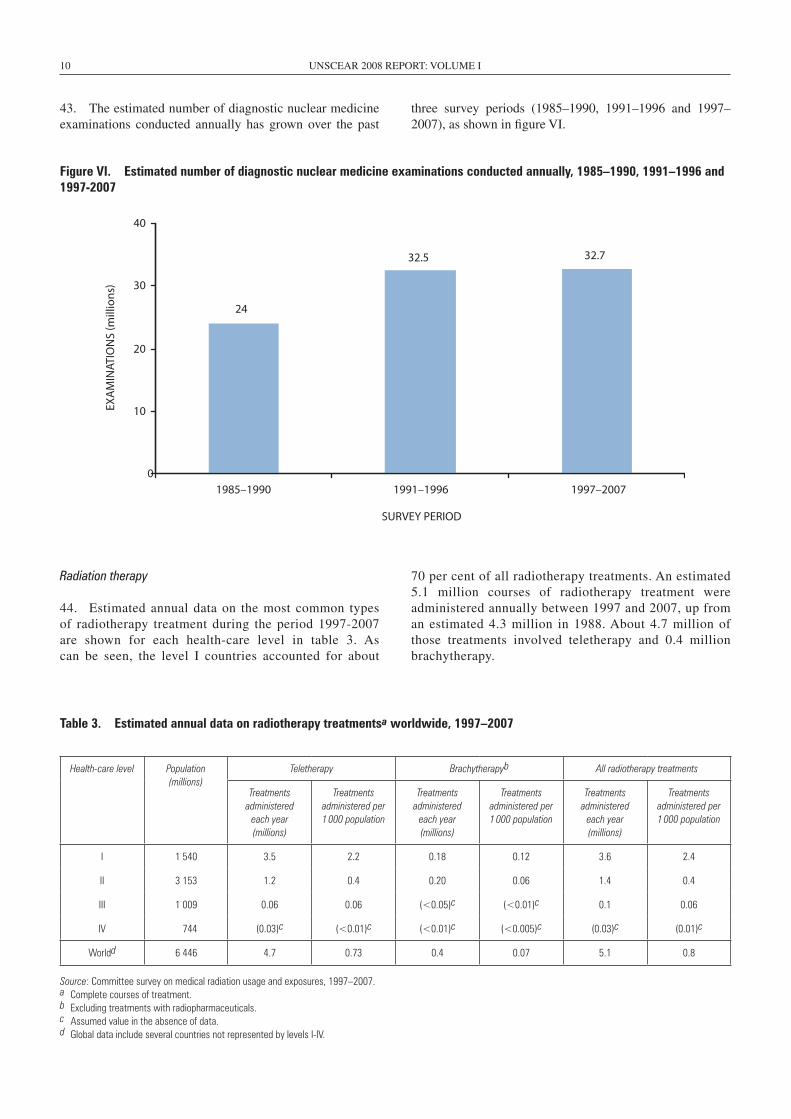
10 UNSCEAR 2008 REPORT: VOLUME I
43. The estimated number of diagnostic nuclear medicine examinations conducted annually has grown over the past
three survey periods (1985–1990, 1991–1996 and 1997–2007), as shown in figure VI.
Figure VI. Estimated number of diagnostic nuclear medicine examinations conducted annually, 1985–1990, 1991–1996 and 1997-2007
24
32.5 32.7
0
10
20
30
40
1985–1990 1991–1996 1997–2007
SURVEY PERIOD
EXA
MIN
ATIO
NS
�mill
ions
�
Radiation therapy
44. Estimated annual data on the most common types of radiotherapy treatment during the period 1997-2007 are shown for each health-care level in table 3. As can be seen, the level I countries accounted for about
70 per cent of all radiotherapy treatments. An estimated 5.1 million courses of radiotherapy treatment were administered annually between 1997 and 2007, up from an estimated 4.3 million in 1988. About 4.7 million of those treatments involved teletherapy and 0.4 million brachytherapy.
Table 3. Estimated annual data on radiotherapy treatmentsa worldwide, 1997–2007
Health-care level Population (millions)
Teletherapy Brachytherapyb All radiotherapy treatments
Treatments administered
each year (millions)
Treatments administered per 1 000 population
Treatments administered
each year (millions)
Treatments administered per 1 000 population
Treatments administered
each year (millions)
Treatments administered per 1 000 population
I 1 540 3 .5 2 .2 0 .18 0 .12 3 .6 2 .4
II 3 153 1 .2 0 .4 0 .20 0 .06 1 .4 0 .4
III 1 009 0 .06 0 .06 (<0 .05)c (<0 .01)c 0 .1 0 .06
IV 744 (0 .03)c (<0 .01)c (<0 .01)c (<0 .005)c (0 .03)c (0 .01)c
Worldd 6 446 4 .7 0 .73 0 .4 0 .07 5 .1 0 .8
Source: Committee survey on medical radiation usage and exposures, 1997–2007 .a Complete courses of treatment .b Excluding treatments with radiopharmaceuticals .c Assumed value in the absence of data .d Global data include several countries not represented by levels I-IV .

REPORT TO THE GENERAL ASSEMBLY 11
Summary
45. Table 4 summarizes the estimated annual collectiveeffective dose of ionizing radiation due to medical exposures
for the period 1997–2007. Almost 75 per cent of the world-wide collective effective dose due to medical exposures is accounted for by health-care level I countries (those that are relatively more developed).
Table 4. Estimated annual collective effective dose of ionizing radiation due to medical exposures, 1997–2007(Totals may not add precisely because of rounding)
Health-care level Population (millions)
Source of exposure Total (man Sv)
Diagnostic medical examinations (man Sv)
Dental X-ray examinations (man Sv)
Nuclear medicine examinations (man Sv)
I 1 540 2 900 000 9 900 186 000 3 100 000
II 3 153 1 000 000 1 300 16 000 1 000 000
III 1 009 33 000 51 82a 33 000
IV 744 24 000 38 . . 24 000
World 6 446 4 000 000 11 000 202 000 4 200 000
46. Medical exposure remains by far the largest artificialsource of exposure to ionizing radiation and continues togrow at a remarkable rate. Medical exposures account for98 per cent of the contribution from all artificial sources andare now the second largest contributor to the population doseworldwide, representing approximately 20 per cent of thetotal. About 3.6 billion medical radiation procedures wereperformed annually during the survey period, compared with
2.5 billion in the previous survey period; that is an increase of 1.1 billion procedures, or over 40 per cent, in the last decade. The total annual collective effective dose due to medical exposures (excluding radiotherapy) stood at approximately 4.2 million man Sv, an increase of 1.7 million man Sv (or just over 65 per cent) over the previous period. The distribu-tion of medical procedures and of doses is markedly uneven among country groups (see figure VII).
Figure VII. Total annual collective effective dose of radiation due to medical exposures (excluding radiotherapy)
3 141 138
1 000 000
33 000 24 000
4 224 622
0
1 000 000
2 000 000
3 000 000
4 000 000
5 000 000
I II III IV Global
HEALTH�CARE LEVEL
COLL
ECTI
VE E
FFEC
TIVE
DO
SE �m
an S
v�
a Refers to health-care levels III-IV.

12 UNSCEAR 2008 REPORT: VOLUME I
(ii) Radiation exposures of the general public
47. The generation of electrical energy by nuclearpower plants has grown steadily since the industry beganin 1956. Despite the increase in the decommissioning ofolder reactors, electrical energy production from nuclearsources continues to grow (see figure VIII). The nuclearfuel cycle has the following stages: mining and milling
of uranium ore and its conversion to nuclear fuel; fabri-cation of fuel elements; production of energy in a nuclear power plant; storage or reprocessing of irradiated fuel; transport between the various stages; and the storage and disposal of radioactive wastes. The doses of ionizing radiation to exposed individuals vary widely from one type of facility to another, between different locations and over time.
0
100
200
300
400
1970 1975 1980 1985 1990 1995 2000 2005
YEAR
INST
ALL
ED C
APA
CITY
�g
igaw
atts
ele
ctric
al�
Figure VIII. Installed nuclear electricity-generating capacity worldwide, 1970–2005
48. Uranium mining and milling produces substantialquantities of residues in the form of tailings. Until 2003, thetotal world production of uranium was about 2 million tonneswhile the resultant tailings totalled over 2 billion tonnes.Current tailing piles are well maintained, but many old,abandoned sites exist and only a few have been remedi-ated. The Committee estimates the current annual collectivedose of ionizing radiation to local and regional populationgroups around mine and mill sites and tailing piles at about50–60 man Sv, similar to its previous estimates.
49. Most power reactors are of the light-water moderatedand cooled type, although other designs are used in somecountries. The average annual collective dose of ionizingradiation to local and regional population groups (combined)due to environmental releases from reactors is now estimatedto be 75 man Sv. This is lower than previous estimates.
50. In the nuclear fuel cycle, spent fuel is reprocessed torecover uranium and plutonium for reuse in reactors. Mostspent fuel is retained in interim storage but about one thirdof that so far produced has been reprocessed. The estimateof the annual collective dose of ionizing radiation due toreprocessing is still in the range of 20–30 man Sv.
51. The low-level and some of the intermediate-level wastefrom fuel cycle operations is currently disposed of in near-surface facilities, although waste was sometimes dumped atsea in the past. Both the high-level waste from reprocessingand the spent fuel (if not reprocessed) are stored but willeventually need to be disposed of. The public is expected tobe exposed to radiation from disposed waste only in the dis-tant future, if at all, so assessment of the radiological impacthas to rely on mathematical modelling. Overall, an annualcollective dose of about 200 man Sv is estimated for all oper-ations related to electrical energy production. The dominantcomponent of those operations is mining. The annual percaput dose to representative local and regional populationsaround nuclear power plants is less than 0.0001 mSv (aboutequivalent to the dose received from cosmic radiation in afew minutes of air travel).
52. There are several types of facility around the world that,while unrelated to the use of nuclear energy, may all the sameexpose the public to radiation because of enhanced concen-trations of naturally occurring radionuclides in their industrialproducts, by-products and waste. The most important suchfacilities involve mining and minerals processing. Besidesthese, naturally occurring radioactive material can expose

REPORT TO THE GENERAL ASSEMBLY 13
people to ionizing radiation as a result of various normal human practices, such as the agricultural use of sludge from water treatment or the use of residue as landfill or building material. Although doses to the public are low, on the order of less than a few thousandths of a millisievert, some especially vulnerable groups could receive doses approaching 1 mSv. A major effort is under way, at both the national and interna-tional levels, to assess exposure to naturally occurring radio-active material and to develop strategies to address situations that give rise to increased radiation exposure.
(iii) Radiation exposures of workers
53. Until the 1990s, attention in the area of occupationalexposure—apart from the practices related to the nuclearfuel cycle—focused on artificial sources of radiation.Now, however, it is realized that a very large number ofworkers are exposed occupationally to natural sources ofradiation as well, and the current estimate of the result-ing collective dose is about three times that indicated inthe Committee’s 2000 report. The total number of workersexposed to ionizing radiation is currently estimated to be
about 22.8 million, of whom about 13 million are exposed to natural sources of radiation and about 9.8 million to artificial sources. Medical workers comprise the largest proportion (75 per cent) of workers exposed to artificial sources of radiation.
54. Radiation exposure of workers involved in militaryactivities occurs during the production and testing of weap-ons, the operation of reactors for propulsion of naval vesselsand other uses similar to those in the civilian sector. TheCommittee estimates that the worldwide average annualcollective dose of ionizing radiation from such sources wasabout 50–150 man Sv and the average annual worker dosewas about 0.1–0.2 mSv. However, there is a large degree ofuncertainty in this estimate.
55. The extraction and processing of radioactive ores thatmay contain significant levels of natural radionuclides is awidespread activity. The mining sector accounts for the vastmajority of occupationally exposed workers, and radon isthe main source of radiation exposure in underground minesof all types. Table 5 summarizes the exposure to radon in theworkplace.
Table 5. Exposure to radon in the workplace
Workplace Number of workers (millions) Collective dose (man Sv) Average effective dose (mSv)
Coal mines 6 .9 16 560 2 .4
Other minesa 4 .6 13 800 3 .0
Other workplaces 1 .25 6 000 4 .8
Weighted average 2 .9
a Excluding uranium mines .
56. The annual collective dose of ionizing radiation to air-line flight crews is about 900 man Sv. The estimated annualaverage effective dose is 2–3 mSv. Dose measurements havealso been made available for a number of space missions.The reported doses for short space missions were in therange of 1.9–27 mSv.
57. The annual collective dose of ionizing radiation toworkers involved in the nuclear fuel cycle is estimated tobe about 800 man Sv. For the fuel cycle overall, the aver-age annual effective dose is about 1.0 mSv. The averageannual dose to monitored workers in the nuclear fuel cyclehas gradually declined since 1975, from 4.4 mSv to 1.0 mSvat present. Much of this decline is because of the significantreduction in uranium mining coupled with more advancedmining techniques; concurrently, the total occupationalexposure at commercial nuclear power plants divided by the
energy produced has also fallen steadily over the past three decades (see figure IX).
58. Between 1975 and 1989 the annual collective effec-tive dose averaged over five-year periods for all operationsin the nuclear fuel cycle varied little from the average valueof 2,500 man Sv despite the three- to four-fold increase inelectrical energy generated by nuclear means. The energygenerated has continued to increase, but the average annualcollective effective dose has fallen by almost half, from1,400 man Sv in the period 1990–1994 to 800 man Sv in theperiod 2000–2002.
59. The annual collective dose to workers involved in themedical use of radiation is estimated to be about 3,540 man Sv;the average annual effective dose is about 0.5 mSv. The aver-age annual dose to monitored workers involved in medical

14 UNSCEAR 2008 REPORT: VOLUME I
uses of radiation increased by a factor of 1.7 from 1994 to 2002. However, workers involved in interventional procedures have high effective doses; and extremity doses can reach the regulatory limits. As the number of interventional procedures
Figure Ix. Annual occupational collective dose of ionizing radiation at reactors, normalized to unit electrical energy produced, 1975– 2002
has increased significantly, the number of workers involved in the medical use of radiation increased by a factor of seven in the period from 1975 to 2002, and the estimated number was about 7.4 million for 2002.
60. The annual collective dose to workers involved inindustrial uses of radiation is estimated to be about 289 manSv, and the average annual effective dose is about 0.3 mSv.This represents a decrease from the level of 1.6 mSv in1975. The number of workers involved in industrial usesof radiation increased by a factor of 1.6 in the period from1975 to 2002; the estimated number was about 0.9 millionfor 2002.
0
2
4
6
8
10
12
14
1975–1979 1980–1984 1985–1989 1990–1994 1995–1999 2000–2002
SURVEY PERIOD
COLL
ECTI
VE E
FFEC
TIVE
DO
SE P
ER U
NIT
EL
ECTR
ICA
L EN
ERG
Y PR
OD
UCE
D
�man
Sv
per g
igaw
att-
year
ele
ctric
al�
61. The trends in average annual occupational effective dosesof ionizing radiation are shown in table 6 for the periods 1980–1984, 1990–1994 and 2000–2002. A decrease in the averageeffective dose can be seen for all categories of exposure to arti-ficial sources; the sharp decrease in dose for the nuclear fuelcycle was due mainly to changes in uranium mining. However,the overall weighted average effective dose increased becauseof the increased exposure to natural sources of radiation.
Table 6. Trends in average annual occupational effective doses of ionizing radiation, 1980–1984, 1990–1994 and 2000–2002(Millisieverts)
Source of exposure 1980–1984 1990–1994 2000–2002
Natural sources . . 1 .8 2 .9
Military activities 0 .7 0 .2 0 .1
Nuclear fuel cycle 3 .7 1 .8 1 .0
Medical uses 0 .6 0 .3 0 .5
Industrial uses 1 .4 0 .5 0 .3
Miscellaneous 0 .3 0 .1 0 .1
weighted average 1.3 1.3 1.8

REPORT TO THE GENERAL ASSEMBLY 15
(c) Exposures in accidents
62. Early acute effects of radiation exposure occur only asthe result of accidents (or malicious acts). Some serious acci-dents have led to significant population exposures owing todispersion of radioactive material in the environment. Radia-tion exposures from accidents have been discussed in severalpast reports of the Committee, including specific evaluationsof the Chernobyl accident. The Committee has categorizedand summarized reported radiation accidents that resultedin early acute health effects, deaths or major environmentalcontamination over the past 60 years.
63. Accidents associated with the nuclear fuel cycleincluded a small number of serious accidents that receivedextensive publicity and whose consequences were reportedin detail. Between 1945 and 2007, 35 serious radiation acci-dents occurred in nuclear facilities, 24 of them in facilitiesrelated to nuclear weapons programmes. Of those 35 acci-dents, 31 resulted in employee deaths or injury and 7 causedoff-site releases of radioactive materials and significant pop-ulation exposures. Excluding the 1986 accident at Chernobyl(which is discussed in section B below), 32 deaths (includ-ing 4 deaths caused by trauma) and 61 cases of radiation-related injuries requiring medical care are known to haveoccurred as a result of accidents associated with the nuclearfuel cycle.
64. Large radiation sources are in widespread use in indus-try (industrial irradiation facilities or accelerators) and havebeen involved in a number of accidents, usually attribut-able to operator error. All of the 80 accidents covered in thepresent report involved sufficient levels of exposure to causeradiation-related injuries to workers. Nine deaths and120 worker injuries were reported in connection with thoseaccidents.
65. Orphan sources are radioactive sources that were origi-nally subject to regulatory control but were then abandoned,lost or stolen. The 34 reported serious accidents involvingorphan sources caused radiation-related injuries to the pub-lic; altogether, 42 people, including a number of children,died in those accidents. In the accident in Goiânia, Brazil, in1987, several hundred people were contaminated.
66. In radiation medicine, accidents generally involveerrors in the delivery of radiotherapy that are often detectedonly after many patients have been overexposed. The Com-mittee has reviewed only 32 reported accidents—involving46 deaths and 623 injuries—since 1967. It is likely that somedeaths and many injuries in the medical use of radiation havenot been reported. Nevertheless, the reported accidents aloneappear to have injured more people than accidents in anyother category.
67. Of the accidents that caused exposures of ionizing radi-ation to the general population, the 1986 Chernobyl accidentwas by far the most serious one. The collective dose fromthat accident was many times greater than the combined
collective dose from all other accidents causing exposures to the general population.
68. The trends in these accidents vary considerably. Criti-cality accidents were more common during the early peri-ods of nuclear weapons programmes. Operational eventsrelated to the nuclear fuel cycle are sporadic. Accidents inindustry and in academic or research establishments appearto have peaked in the late 1970s, falling off to only a fewisolated occurrences in industry since 2000. The extensiveand worldwide transport of radioactive materials for non-military purposes over the past many years has not resultedin any radiation-related injuries at all. Accidents with orphansources and those related to medical uses of radiation haveshown an increase over recent periods but the data may sufferfrom underreporting.
(d) Comparison of exposures
69. Although it is clear from the data presented that dosesvary substantially by location, group, health-care level andso on, it is nonetheless helpful and customary to summa-rize the findings on a global basis (see table 1 above). Expo-sure to natural radiation does not change significantly overtime, although individual exposures, particularly to radon,can vary significantly. One of the most striking changes overthe past decade or so has been the sharp increase in medi-cal exposures, owing for example to the rapid expansion inthe use of computed tomography scanning. In several coun-tries, this has meant that medical exposure has displacedexposure due to natural sources of radiation as the largestoverall component. The residual doses from atmospherictesting and from the Chernobyl accident continue to declineslowly. Although occupational exposure shows a low valuewhen averaged across the whole population, the estimatedlevel has increased substantially owing to the recognitionof exposure to natural radionuclides in mining. Doses fromthe nuclear fuel cycle continue to be very small despite thegradual expansion of that sector.
b. Chernobyl accident
70. The 1986 accident at the Chernobyl nuclear powerplant in the former Soviet Union was the most severe suchaccident in the history of civilian nuclear power. Two work-ers died in the immediate aftermath, and 134 plant staff andemergency personnel suffered acute radiation syndrome,which proved fatal for 28 of them. Several hundred thousandworkers were subsequently involved in recovery operations.
71. The accident caused the largest uncontrolled radio activerelease into the environment ever recorded for any civilianoperation; large quantities of radioactive substances werereleased into the atmosphere for about 10 days. The radio-active cloud created by the accident dispersed over the entirenorthern hemisphere and deposited substantial amounts ofradioactive material over large areas of the former Soviet

16 UNSCEAR 2008 REPORT: VOLUME I
Union and other parts of Europe, contaminating land, water and biota and causing particularly serious social and eco-nomic disruption to large segments of the population in the countries known today as Belarus, the Russian Federation and Ukraine. Two radionuclides, the short-lived iodine-131 (with a half-life of 8 days) and the long-lived caesium-137 (with a half-life of 30 years), were particularly significant because of the radiation dose they delivered to the public. However, the doses delivered were quite different for the two radionuclides: the thyroid doses from iodine-131 ranged up to several grays within a few weeks after the accident, while the whole-body doses from caesium-137 ranged up to a few hundred millisieverts over the following few years.
72. The contamination of fresh milk with iodine-131 andthe lack of prompt countermeasures led to high thyroid doses,particularly among children, in the former Soviet Union. Inthe longer term, mainly due to radiocaesium, the generalpopulation was also exposed to radiation, both externallyfrom radioactive deposits and internally from consumingcontaminated foodstuffs. However, the resulting long-termradiation doses were relatively low (the average additionaldose over the period 1986–2005 in “contaminated areas”12
of Belarus, the Russian Federation and Ukraine was 9 mSv,approximately equivalent to that from a medical computedtomography scan), and should not lead to substantial healtheffects in the general population that could be attributed toradiation. The foregoing notwithstanding, the severe dis-ruption caused by the accident resulted in a major socialand economic impact and great distress for the affectedpopulations.
73. Since the accident, the international community hasmade unprecedented efforts to assess the magnitude andcharacteristics of its radiation-related health effects. Manyinitiatives, including those by the United Nations Educa-tional, Scientific and Cultural Organization (UNESCO), theWorld Health Organization (WHO), the International AtomicEnergy Agency (IAEA) and the European Commission,were launched to better understand the consequences of theaccident and assist in their mitigation. The results of thoseinitiatives were synthesized at an international conferenceon the theme “One decade after Chernobyl: summing up theconsequences of the accident”, which was held in Viennafrom 8 to 12 April 1996. The conference was co-sponsoredby WHO, IAEA and the European Commission in coopera-tion with the United Nations, the United Nations ScientificCommittee on the Effects of Atomic Radiation, the Food andAgriculture Organization of the United Nations, UNESCOand the Nuclear Energy Agency of the Organisation for Eco-nomic Co-operation and Development. In the internationalscientific assessments, broadly similar conclusions werereached on the extent and character of the consequences ofthe accident.
12 The “contaminated areas” were defined arbitrarily by the former Soviet Union as areas where the soil levels of caesium-137 were greater than 37 kilobecquerels per square metre.
74. The Committee first considered the initial radiologi-cal consequences of the accident in its 1988 report.13 In its2000 report, the Committee provided a detailed account ofthe situation as it was known at that time. Subsequent to thepublication of that report, eight organizations and bodies ofthe United Nations system14 (including the Committee) andthe three affected States launched the Chernobyl Forum,which was to generate authoritative consensual statementson the environmental and health consequences attribut-able to radiation exposure and to provide advice on issuessuch as environmental remediation, special health-care pro-grammes and research activities. The work of the ChernobylForum was appraised at an international conference on thetheme “Chernobyl: looking back to go forwards; towards aUnited Nations consensus on the effects of the accident andthe future”, which was held in Vienna on 6 and 7 Septem-ber 2005. At that conference, all the previous assessmentsof the scale and character of the radiation-related health consequences of the accident were essentially reconfirmed.
75. The objective of the Committee in the present evalua-tion is to provide an authoritative and definitive review of thehealth effects observed to date that are attributable to radiationexposure due to the accident and a clarification of the projec-tion of potential effects, taking into account the levels, trendsand patterns of radiation dose to the exposed populations.To that end the Committee evaluated relevant informationthat became available since its 2000 report and ascertainedthat observations were not inconsistent with assumptionsused previously to assess radiological consequences. It alsorecognized that some outstanding details merited furtherscrutiny and that its work to provide the scientific basis fora better understanding of the radiation-related health and environmental effects of the accident needed to continue.
76. Although a considerable volume of new research datahas become available, the major conclusions regarding thescale and nature of the health consequences of the Cherno-byl accident are essentially consistent with the Committee’s1988 and 2000 reports. Those conclusions are as follows:
(a) A total of 134 plant staff and emergency work-ers received high doses of radiation that resulted in acute radiation syndrome (ARS), many of them also incurring skin injuries due to beta irradiation;
(b) The high radiation doses proved fatal for 28 ofthose people in the first few months following the accident;
(c) Although 19 ARS survivors had died by 2006,those deaths had different causes that usually were not associated with radiation exposure;
(d) Skin injuries and radiation-related cataracts wereamong the main sequelae of ARS survivors;
13 Official Records of the General Assembly, Forty-third Session, Supple-ment No. 45 (A/43/45).14 UNEP, Office for the Coordination of Humanitarian Affairs of the Sec-retariat, the United Nations Development Programme, the United Nations Scientific Committee on the Effects of Atomic Radiation, FAO, WHO, the World Bank and IAEA.

REPORT TO THE GENERAL ASSEMBLY 17
(e) Aside from the emergency workers, severalhundred thousand people were involved in recovery operations but, apart from indications of an increase in incidence of leukaemia and of cataracts among those who received higher doses, there is to date no consistent evi-dence of health effects that can be attributed to radiation exposure;
(f) A substantial increase in thyroid cancer incidenceamong persons exposed to the accident-related radiation as children or adolescents in 1986 has been observed in Belarus,
Ukraine and four of the more affected regions of the Russian Federation. For the period 1991–2005, more than 6,000 cases were reported, of which a substantial portion could be attrib-uted to drinking milk in 1986 contaminated with iodine-131. Although thyroid cancer incidence continues to increase for this group (see figure X for the trend in Belarus), up to 2005 only 15 cases had proved fatal;
(g) Among the general public, to date there has beenno consistent evidence of any other health effect that can be attributed to radiation exposure.
Figure x. Thyroid cancer incidence among people in belarus who were children or adolescents at the time of the Chernobyl accident, 1986–1990, 1991–1995, 1996–2000 and 2001–2005
0
5
10
15
1986–1990 1991–1995 1996–2000 2001–2005
PERIOD
CRU
DE
AN
NU
AL
INCI
DEN
CE
�per
100
000
pop
ulat
ion�
Females Males
77. Although model-based predictions have been pub-lished about possible increases in solid cancer incidenceamong the general population, for all the population groupsconsidered the doses are relatively small and are compar-able to doses resulting from exposure to natural backgroundradiation. The Committee has decided not to use models toproject absolute numbers of effects in populations exposedto low doses because of unacceptable uncertainties in thepredictions. However, the Committee considers that it is appropriate to continue surveillance.
78. Based on 20 years of studies, it is possible to recon-firm the conclusions of the Committee’s 2000 report. Essen-tially, persons who were exposed as children to radioiodinefrom the Chernobyl accident and the emergency and recov-ery operation workers who received high doses of radiationare at increased risk of radiation-induced effects. Most area
residents were exposed to low-level radiation comparable to or a few times higher than the annual natural background radiation levels and need not live in fear of serious health consequences.
79. The Committee considers its most recent evalua-tion an important point of reference for the United NationsCoordinator of International Cooperation on Chernobyl inresponding to the request by the General Assembly pursu-ant to paragraph 16 of its resolution 62/9 of 20 November2007, that the Coordinator continue his work in organ-izing, in collaboration with the Governments of Belarus,the Russian Federation and Ukraine, a further study of thehealth, environmental and socio-economic consequences ofthe Chernobyl disaster, consistent with the recommenda-tions of the Chernobyl Forum, and to improve the provisionof information to local populations.

18 UNSCEAR 2008 REPORT: VOLUME I
C. Effects on non-human biota
80. All species present on the Earth have existed andevolved in environments where they have been exposedto ionizing radiation from the natural background. Morerecently, however, organisms are also being exposed to artificial sources of radiation, such as global fallout fromatmospheric nuclear weapons tests and, in certain locations,controlled discharges of radionuclides or accidental releasesof radioactive material.
81. In its 1996 report,15 the Committee evaluated thosedoses and dose rates of ionizing radiation below whicheffects on populations of non-human biota were unlikely. Itconsidered that the individual responses to radiation expo-sure that were likely to be significant at the population levelwere in the areas of mortality, fertility, fecundity and theinduction of mutations. The Committee also consideredthat reproductive changes were a more sensitive indicator ofradiation effects than mortality, and that mammals were themost sensitive of all animal organisms. On that basis, theCommittee derived the dose rates to the most highly exposedindividuals that would be unlikely to have significant effectson most populations.
82. Since then, new data on the effects of ionizing radia-tion have been obtained from follow-up observations ofnon-human biota in the area around the Chernobyl site. Vari-ous organizations have carried out comprehensive reviewsof the scientific literature and, in some cases, have devel-oped new approaches for assessing the potential effects on
15 Official Records of the General Assembly, Fifty-first Session, Supplement No. 46 (A/51/46).
non-human biota. There is a considerable range of end points and corresponding effect levels presented in the lit-erature and also considerable variation in how different researchers evaluate those data. Table 7 provides a brief summary of the relevant data for aggregated categories of organisms.
83. The Committee concluded that, overall, there was noevidence to support changing the conclusions of its 1996report according to which chronic dose rates of less than0.1 milligrays per hour to the most highly exposed individ-uals would be unlikely to have significant effects on mostterrestrial communities and chronic dose rates of less than0.4 milligrays per hour to any individual in aquatic popu-lations of organisms would be unlikely to have any detri-mental effect at the population level. For acute exposures, studies of the Chernobyl accident experience had confirmedthat significant effects on populations of non-human biotawere unlikely at doses below about 1 gray.
84. Since the time of the Committee’s 1996 report, a greatdeal of work has been done to investigate and improve dataand methods for evaluating pathways through which biotaare exposed to radiation in their environment; there havealso been many improvements in assessing doses to biota.It is important to note that many opportunities remain forimproving current understanding and methods in those areas.An improved understanding of such aspects will improvethe overall understanding of the relationship between levelsof radiation and radioactivity in the environment and thepotential effects on biota.
Table 7. Some effects of ionizing radiation on selected categories of non-human biota
Chronic dose rate (milligrays per hour)
Category Effect End point
0 .1-1 Plants Death of pine needles: reduced numbers of herbaceous plants Mortality, morbidity
Fish Reduction in sperm production, delayed spawning Reproductive damage
About 0 .1 Mammals No detrimental end points described Morbidity, mortality, reproductive damage

19
AppENdIx I
MEMbERS OF NATIONAL dELEGATIONS ATTENdING ThE FIFTIETh TO FIFTy-SIxTh SESSIONS OF ThE UNITEd NATIONS SCIENTIFIC COMMITTEE ON ThE EFFECTS OF ATOMIC RAdIATION, AT whICh ThE 2008 SCIENTIFIC REpORT wAS ELAbORATEd
Argentina A. J. González (Representative), D. Beninson (Representative), P. Gisone (Representative), M. del Rosario Pérez
Australia P. A. Burns (Representative), S. Solomon, P. Thomas
Belgium H. Vanmarcke (Representative), H. Bosmans, A. Debauche, H. Engels, J. Lembrechts, J. R. Maisin(Representative), P. Smeesters, J. M. Van Dam, A. Wambersie, H. Bijwaard, R. O. Blaauboer,M. J. Brugmans
Brazil O. Dias Gonçalves (Representative), J. L. Lipsztein (Representative), M. C. Lourenço, M. Nogueira Martins, D. R. Melo (Representative), E. R. Rochedo
Canada N. E. Gentner (Representative), R. P. Bradley, K. Bundy, D. B. Chambers, R. M. Chatterjee (Representative), R. J. Cornett, R. Lane, C. Lavoie, S. Vlahovich (Representative), D. Whillans
China Pan Z. (Representative), He Q., Hou P., Jia J., Li K., Li J., Liu S., Liu Q., Lu J., Pan S., Shang B., Shi J., Su X., Sun J., Sun Q., Wang F., Xiu B., Xuan Y., Yang G., Yang H., Yang X., Yu J., Zhang J., Zhu M.
Egypt M.A.M. Gomaa (Representative), A. M. el-Naggar (Representative)
France A. Flüry-Hérard (Representative), E. Ansoborlo, A. Aurengo, D. Averbeck, M. Benderitter,M. Bourguignon, C. Forestier, J. F. Lacronique (Representative), J. Lallemand, J. J. Leguay,C. Luccioni, R. Maximilien, A. Rannou, M. Tirmarche
Germany W. Weiss (Representative), A. Friedl, P. Jacob, A. Kellerer, J. Kiefer, G. Kirchner, W. Köhnlein,R. Michel, W. U. Müller, C. Streffer (Representative)
India K. B. Sainis (Representative)
Indonesia Z. Alatas (Representative), K. Wiharto (Representative)
Japan O. Niwa (Representative), Y. Yonekura (Representative), T. Asano, M. Doi, Y. Ishikuro, A. Iwama,K. Kodama, H. Kuniyoshi, T. Maeyama, M. Nakano, Y. Nakayama, S. Saigusa, K. Sakai, M. Sasaki,Y. Sasaki (Representative), K. Sato, G. Suzuki, H. Tatsuzaki, S. Yoshinaga, M. Yoshizawa
Mexico H. Maldonado (Representative)
Peru L. V. Pinillos Ashton (Representative)
Poland M. Waligórski (Representative), L. Dobrzyński, M. Janiak, Z. Jaworowski (Representative)
Russian Federation M. Kiselev (Representative), A. Akleev, R. M. Alexakhin, T. Azizova, N. P. Garnyk, A. K. Guskova(Representative), L. A. Ilyin (Representative), V. K. Ivanov, K. Kotenko, I. I. Kryshev, B. K. Lobach,Y. Mokrov, O. A. Pavlovsky, T. S. Povetnikova, S. Romanov, M. N. Savkin, V. A. Shevchenko,S. Shinkarev
Slovakia E. Bédi (Representative), P. Gaál, V. Klener, P. Ragan, L. Tomášek, D. Viktory (Representative),I. Zachariášová
Sudan A. Elgaylani (Representative), K.E.H. Mohamed (Representative)
Sweden C. M. Larsson (Representative), A. Almén, L. E. Holm (Representative), L. Moberg
United Kingdom of Great Britain and Northern Ireland
R. Cox (Representative), S. Bouffler, R. H. Clarke (Representative), J. Cooper, S. Ebdon-Jackson,G. M. Kendall, T. McMillan, C. Muirhead, R. Paynter, P. Shrimpton, J. W. Stather
United States of America
F. A. Mettler Jr. (Representative), L. R. Anspaugh, B. G. Bennett, J. D. Boice Jr., N. H. Harley, E. V. Holahan Jr., C. B. Meinhold, R. J. Preston, H. Royal, P. B. Selby, A. G. Sowder, A. Upton

20 UNSCEAR 2008 REPORT: VOLUME I
Secretary of the United nationS Scientific committee on the effectS of atomic radiation
N. E. Gentner (fiftieth to fifty-second sessions)
M. J. Crick (fifty-third to fifty-sixth sessions)
AppENdIx II
SCIENTIFIC STAFF ANd CONSULTANTS COOpERATING wITh ThE UNITEd NATIONS SCIENTIFIC COMMITTEE ON ThE EFFECTS OF ATOMIC RAdIATION IN ThE
pREpARATION OF ThE 2008 SCIENTIFIC REpORT OF ThE COMMITTEE
M. Balonov
D. B. Chambers
K. Faulkner
G. Howe
G. Ibbott
G. Kirchner
D. Melo
R. Ricks
E. Rochedo
M. Stabin
G.A.M. Webb
D. Woodhead