Äspö hard rock laboratory - skb
TRANSCRIPT

Svensk Kärnbränslehantering ABSwedish Nuclear Fueland Waste Management CoBox 5864SE-102 40 Stockholm SwedenTel +46 8 459 84 00Fax +46 8 661 57 19
InternationalProgress Report
IPR-01-52
Äspö Hard Rock Laboratory
TRUE Block ScaleDetailed characterisation stage
Interference tests and tracer testsPT-1 PT-4
Peter Andersson
Jan-Erik Ludvigson
Eva Wass
Magnus Holmqvist
GEOSIGMA AB
September 1999


Report no. No.
IPR-01-52 F56KAuthor Date
Andersson, Ludvigson,Wass, Holmqvist 99-09-01Checked by Date
Approved Date
Christer Svemar 02-08-23
Keywords: TRUE, block scale, tracer tests, tracer dilution test, interference test
This report concerns a study which was conducted for SKB. The conclusionsand viewpoints presented in the report are those of the author(s) and do notnecessarily coincide with those of the client.
Äspö Hard Rock Laboratory
TRUE Block ScaleDetailed characterisation stage
Interference tests and tracer testsPT-1 PT-4
Peter Andersson
Jan-Erik Ludvigson
Eva Wass
Magnus Holmqvist
GEOSIGMA AB
September 1999

i
Abstract
One of the components of the TRUE Block Scale Detailed Characterisation Stage(DCS) is to conduct a combined interference and tracer test programme (pre-tests) in theinstrumented Block Scale array within the Äspö HRL. The overall objectives of the pre-tests (PT-1 to PT-4) were to test the present deterministic structural model, March 99model and to test the possibility to conduct tracer tests with injection of tracer in pointsbelonging to the network of deterministic (discrete) structures. In total four interferencetests were performed with a duration of 1-28 days. Flow measurements using the tracerdilution technique was performed simultaneously in 6-12 observation sections duringthe long-term interference tests. Tracer injections were made in four observationsections during the last test (PT-4). The flow and pressure responses obtained during thetests confirmed the deterministic structural model. Tracer breakthrough was obtainedfrom all four injection points. The tracer test results were used to estimate transportparameters for three flow paths involving one to three structures within the block.

ii

iii
Sammanfattning
En av komponenterna av TRUE Block Scale Detailed Characterisation Stage (DCS) äratt utföra ett kombinerat interferens- och spårämnestestprogram (för-tester) i deninstrumenterade Block Scale-området av Äspö HRL. Det övergripande syftet med för-testerna (PT-1 till PT-4) är att testa den aktuella strukturmodellen, Mars ’99-modellen,och att då testa möjligheten att utföra spårämnesförsök med injicering av spårämnen ipunkter tillhörande nätverket av deterministiska (diskreta) strukturer. Totalt utfördesfyra interferenstester med en varaktighet av 1-28 dagar. Under de längre försökenutfördes samtidiga flödesmätningar med spårämnesteknik i 6-12 observationssektioner.I det sista testet, PT-4, injicerades spårämnen i fyra observationssektioner. Beräknadeflödes- och tryckresponser, erhållna under försöken, bekräftade den aktuellastrukturmodellen. Genombrott av spårämne uppnåddes från alla fyrainjektionspunkterna. Resultaten användes för att bestämma transportparametrar för treflödesvägar involverande en till tre strukturer i blocket.

iv

v
Executive Summary
The Second phase of the Detailed Characterisation Stage (DCS II) of the TRUE BlockScale Project is currently ongoing at Äspö HRL. The primary purpose of DCS II is toexplore the possibilities to perform tracer tests in the selected target volume at ÄspöHRL. This is accomplished by updating the flow model though different field activitiesand by performing scoping calculations (Winberg, in prep.).
The purpose of the pre-tests was to assess the possibility to perform quantitative andinformative tracer experiments in the current borehole array. The tests also served as acheck of the current structural model, March 99 model (Hermanson in prep.) and asinput to whether an additional borehole was needed or not. The four pre-tests (PT-1 toPT-4) included a combination of flow and pressure interference tests similar to the onesperformed in the Preliminary Characterisation Stage (PCS) (Andersson et al., 1998).The main difference was the existence of the new borehole KI0025F02 and maximumstrength in sinks.
The pre-tests in selected sections involved four different test set-ups, three runs withtracer dilution tests combined with pumping (PT-1 to PT-3) and a tracer test (PT-4). Thetest cycle for PT-1 to PT-3 was similar to the one used in the combined interference andtracer tests performed in the Preliminary Characterisation Stage (PCS) (Andersson etal., 1998).
The pumping and recovery phases were performed as conventional constant headinterference tests implying that the flow rates and pressures were monitored with a highmeasurement frequency. The flow from the pumped section together with the electricalconductivity was measured manually during the pumping period.
The pre-test #4, PT-4, was focused on tracer transport and performed as a radiallyconverging tracer test. Based on the many good flow responses during PT-2 the sameset-up was decided for use in PT-4. Tracer injections were made in four sections(KA2563A:S1, KA2563A:S4, KI0025F02:P3 and KI0025F02:P6) with pumping insection KI0023B:P6 using the same pumping rate as in PT-2. The tracer injections wereperformed as decaying pulses and sampling was performed in the water withdrawn fromthe source section KI0023B:P6. In two of the injections, the tracer solution wasexchanged with non-traced water in order to shorten the tail of the breakthrough curve.The tracers used were three different fluorescent dyes namely, Uranine (KA2563A:S1),Rhodamine WT (KA2563A:S4 and KI0025F02:P6) and Amino G Acid(KI0025F02:P3).
The three pre-tests PT-1, PT-2 and PT-3 generally confirm the March´99 structuralmodel. In most cases, the flow and pressure responses give the same indication ofconnectivity, i.e. a good (high and fast) pressure response and a good flow response(increase). However, there are exceptions in each test where a low and slow pressureresponse is obtained together with a good flow response, or the opposite. These resultsimply that pressure responses alone cannot be used for assessment of transportconnectivity.

vi
PT-1, performed by pumping structure #13 (KI0023B:P4), shows good flow andpressure responses both within the structure as well as in structures #20 and #21. Theonly exception being section KI0025F02:P3 where a very good flow response and aslow pressure response are obtained. One possible explanation for this may be that thesection is located close to a constant head boundary, which also is indicated by thequantitative interpretation of the pressure response.
PT-2 (and PT-4), performed by pumping structure #21 (KI0023B:P6), gives good flowand pressure responses in structures #6, 13, 20, 21 and #22. The only unexpectedresponse is the significant flow response in structure #19 (KA2563A:S1) which has arelatively low and slow pressure response. Thus, connectivity between structures #21and #19 clearly exists. This was also confirmed by the tracer breakthrough obtainedduring PT-4. Two sections with structures not identified in the March´99 model,KI0023B:P5 and KI0025F02:P7, also have good flow and pressure responses.
The third test, PT-3, performed by pumping structure #20 (KI0025F02:P5), has analmost identical pressure response pattern as in PT-2. Both pressure and flow responsesare stronger due to the stronger sink but the pattern is identical. This indicates thatKI0025F02 may be used as sink in future tracer tests and that structures #20 and #21have a very good hydraulic connection.
The quantitative analysis of the most prominent pressure responses generally showspredominantly radial flow with a slight leakage at the end of the test. Analysis ofresponses in the bounding structures #6, 7 and 19 shows effects of constant headboundaries. In PT-3, indications of no flow boundaries are evident in the responses inKI0025F:R4 and KI0025F02:P7. This may indicate that structure #20 ends to the east ofborehole KI0025F and the unknown structure in KI0025F02:P7 also is terminated to thewest of KI0025F02.
The transmissivity and diffussivity values determined are generally rather uniform forstructure #20 (T=7-12⋅10-7 m2/s, T/S=3-10 m2/s). They are also consistent with earlierinterpretations (Andersson et al., 1998 and Adams et al., in prep.). Structure #21, onlyinterpreted in KI0023B:P6 and KI0025F02:P3 gives a similar point value inKI0023B:P6 whereas the low and slow response in KI0025F02:P3 gives an indicationof a higher transmissivity (T=6-10⋅10-6 m2/s) in that region. The responses in thebounding structures #6, 7 and 19 generally yield about one order of magnitude highertransmissivity values than structures #13, 20, 21 and 22.
The tracer dilution tests in 14 different sections showed that the “natural” flow variesconsiderably within the block scale volume. An extremely high flow rate (10 l/h) wasmeasured in KI0023B:P7 which constitutes a short-circuit between structures #6 and#20. The flow rates in the other measured sections were typically in the range 1-200ml/h. Estimated hydraulic gradients using transmissivities of the sections are typicallyin the order of 0.3-3 m/m. The exceptions are a few sections connected to structures #20and #21 having a lower gradient and an extremely high gradient in the short-circuitsection KI0023B:P7.

vii
The tracer test performed by pumping in structure #21 (KI0023B:P6) resulted in tracerbreakthrough from all four injection points, KA2563A:R1 (structure #19), KA2563A:S4(structure #20), KI0025F02:P3 (structures #13 and 21) and KI0025F02:P6 (structure#22).
Very high mass recovery was obtained for the injections in KI0025F03:P3 and P6whereas the short flow path from KA2563A:S4 only gave 50% mass recovery whichshould be compared to 44% in a previous test (Andersson et al., 1998). The mass loss isattributed to the boundary conditions (intersections with other structures having lowerhydraulic head).
The numerical modelling using a simple one-dimensional advection-dispersion modelwas not able to fit the breakthrough curves very well. In addition, evaluated dispersivityvalues where unrealistically high for a single path for two of the flow paths. Usage of amultiple-path model would improve the fits considerably although this could not bedone within the framework of this evaluation. The transport parameters calculated basedon the mean travel times; fracture conductivity, equivalent fracture aperture and flowporosity, show somewhat different values, where the flow path from KI0025F02:P6shows a slow transport, indicating high flow porosity (and large equivalent aperture)whereas the fast flow path from KA2563A:S4 has about one order of magnitude lowerflow porosity (and equivalent aperture).

viii

ix
Contents
Abstract i
Sammanfattning iii
Executive Summary v
Contents ix
1 Introduction 11.1 Background 1
1.2 Objectives 1
2 Performance and evaluation procedure 32.1 Equipment and tracers used 3
2.2 Performance of the combined interference tests and tracer tests,pre-tests #1-4 (PT-1, PT-2, PT-3, PT-4) 4
2.3 Laboratory analyses 11
2.4 Evaluation 112.4.1 Hydraulic interference tests 112.4.2 Tracer dilution tests 132.4.3 Tracer test 14
3 Results and interpretation 173.1 General 17
3.2 Pressure response matrix 17
3.3 Pre-Test #1 (PT-1) 19
3.4 Pre-Test #2 (PT-2) 23
3.5 Pre-Test #3 (PT-3) 27
3.6 Pre-PT-4 30
3.7 Pre-Test #4 (PT-4) 333.7.1 Tracer injections 333.7.2 Tracer breakthrough 353.7.3 Numerical modelling and analytical interpretation 36

x
4 Conclusions and recommendations for future tests 414.1 Connectivity and structural model 41
4.2 Hydraulic parameters 41
4.3 Transport parameters 42
4.4 Optimisation of the borehole array 444.4.1 Re-mediation of KI0023B 444.4.2 Borehole KI0025F 444.4.3 Borehole KI0025F02 45
4.5 Need for a new borehole 45
5 References 47
APPENDIX 1: Drawdown versus t/R2 plots for PT-1, PT-2 and PT-3 49

1
1 Introduction
1.1 Background
The Second phase of the Detailed Characterisation Stage (DCS II) of the TRUE BlockScale Project is currently ongoing at Äspö HRL. The primary purpose of DCS II is toexplore the possibilities to perform tracer tests in the selected target volume at ÄspöHRL. This is accomplished by updating the flow model though different field activitiesand by performing scoping calculations (Winberg, in prep.). In addition, an elaborateeffect is put on identifying issues for future tracer tests posing of hypotheses, and designcalculations.
Recent field work has included a detailed flow logging, using the POSIVA tool, inboreholes KA2563A and KA2511A and a series of short-term flow and pressureinterference tests in different sections of KA2563A in order to update the structuralmodel and to optimise the packer configuration in the boreholes. Boreholes KA2511Aand KA2563A have been re-instrumented based on these tests with a focus on theselected target structures #13 and #20.
1.2 Objectives
The purpose of the pre-tests was to assess the possibility to perform quantitative andinformative tracer experiments in the current borehole array, cf. Table 1-1. The testsalso served as a check of the current structural model, March 99 model (Hermanson inprep.) and as input to whether an additional borehole was needed or not. The pre-testsincluded a combination of flow and pressure interference tests similar to the onesperformed in the Preliminary Characterisation Stage (PCS) (Andersson et al., 1998).The main difference was the existence of the new borehole KI0025F02 and maximumstrength in sinks.

2
Table 1-1. Objectives and performance of pre-tests #1 to #5 (PT-1 to PT-5). Thestructural interpretation refers to the March 1999 model (Hermanson,in prep.).
Test # Objective Performance
PT-1 Test of connectivity withinstructure #13 and between #13and #20
Tracer dilution test under natural andpumped conditions. Sink in #13(KI0023B:P4)
PT-2 Test of connectivity withinstructure #20 and between #20and #21, #22, #13, #6 and someminor structures
Tracer dilution test under natural andpumped conditions. Sink in #21(KI0023B:P6)
PT-3 Test of connectivity withinstructure #20 and between #20and #21, #22, #13, #6 and someminor structures
Tracer dilution test under natural andpumped conditions. Sink in #20(KI0025F02:P5)
PT-4 Test of transport connectivity,assessment of transportproperties
Tracer test in radially converging flowgeometry. Tracer injection in 3-5 selectedsections. Selection of sink and injectionsections based on PT-1 to PT-3.
PT-5* Test of connectivity withinstructure #19 and between #19and #13
Tracer dilution test under natural andpumped conditions. Sink in #19(KI0025F:R2)
*= PT-5 was postponed due to a strained time schedule.

3
2 Performance and evaluation procedure
2.1 Equipment and tracers used
Each of the five characterisation boreholes involved in the tests is instrumented with 6-10 inflatable packers such that 5-10 borehole sections are isolated. Each boreholesection is connected to a pressure transducer which is connected the HMS-system. Eachof the sections planned to be used for tracer tests are equipped with three nylon hoses,two with an inner diameter of 4 mm and one with an inner diameter of 2 mm. The two4-mm hoses are used for injection, sampling and circulation in the borehole sectionwhereas the 2-mm hose is used for pressure monitoring.
The tracer dilution tests were performed using six identical equipment set-ups for tracertests, i.e. allowing six sections to be measured simultaneously. A schematic drawing ofthe tracer test equipment is shown in Figure 2-1. The basic idea is to have an internalcirculation in the borehole section. The circulation makes it possible to obtain ahomogeneous tracer concentration in the borehole section and to sample the tracerconcentration outside the borehole in order to monitor the injection rate of the tracerwith time, and also the dilution rate.
Circulation is controlled by a pump with variable speed (A) and measured by a flowmeter (B). Water and tracer injections are made with two different HPLC plungerpumps (C1 and C2) and sampling is made by continuously extracting a small volume ofwater from the system through a flow controller (constant leak) to a fractional sampler(D). Water and tracer solution is stored in two separate pressurised vessels (E1 and E2)under nitrogen atmosphere. The tracer test equipment has earlier been used in theTRUE-1 tracer tests (e.g. Andersson, 1996).
The tracers used were Uranine (Sodium Fluorescein) from KEBO (purum quality),Amino G Acid from Aldrich (techn.quality) and Rhodamine WT from Holiday DyesInc. (techn. quality). These tracers have all been used extensively in the TRUE-1 tracertests.

4
Figure 2-1. Schematic drawing of the tracer injection/sampling system used in the TRUEProject.
2.2 Performance of the combined interference tests andtracer tests, pre-tests #1-4 (PT-1, PT-2, PT-3, PT-4)
The pre-tests in selected sections involved four different test set-ups, three runs withtracer dilution tests combined with pumping (PT-1 to PT-3) and a tracer test (PT-4), cf.Table 1-1.
The test cycle for PT-1 to PT-3 was similar to the one used in the combined interferenceand tracer tests performed in the Preliminary Characterisation Stage (PCS) (Anderssonet al., 1998). The following test cycle was used:
Day 1 start tracer dilution test under natural gradient in six selected sections
Day 2 change of test sections to six new locations (only PT-2 and PT-3)
Day 3 start pumping in selected sink section
Day 4 change of test section to the six first tested (only PT-2 and PT-3)
Day 5 stop pumping, preparations for the next test

5
PT-1 only included six sections which means that these tests had a duration of threedays each and hence, a duration of the pumping period of 24 hours, cf. Table 2-1. Thetracer test, PT-4, did not include any measurement during unpumped conditions. Insteadthe actual injection of tracers was preceded by a period of 3-5 days with pumping in theselected sink section to establish stationary flow and pressure conditions.
All sinks were established using maximum possible flow. The flow was only restrictedby the dimension of the tubing and the hydraulic transmissivity of the section.
The pumping and recovery phases were performed as conventional constant headinterference tests implying that the flow rates and pressures were monitored with a highmeasurement frequency. The logging frequency of the HMS system was manually setbefore start of pumping phase and recovery phase by the HMS operator. The loggingfrequency was set to enable transient evaluation of pressure data. This means a loggingfrequency of one scan every second during the first ten minutes, one scan every minuteup to two hours and one scan every ten minutes up to two days.
The flow from the pumped section together with the electrical conductivity of thepumped water were measured manually during the pumping period.
The pre-test #4, PT-4, was focused on tracer transport and performed as a radiallyconverging tracer test. Based on the many good flow responses observed during PT-2,the same set-up was decided for use in PT-4. Tracer injections were made in foursections (KA2563A:S1, KA2563A:S4, KI0025F02:P3 and KI0025F02:P6) withpumping in section KI0023B:P6 with the same pumping rate as in PT-2. The tracerinjections were performed as decaying pulses and sampling was performed in the waterwithdrawn from the source section KI0023B:P6. In two of the injections, the tracersolution was exchanged with non-traced water in order to obtain a well-defined squaredinjection signal, and thus shorten the tail of the breakthrough curve.
Table 2-1 summarises the test set-ups including expected flow rates (based on earliertests) and distances. The positions of the sinks and sections used for flow measurementsusing the tracer dilution technique are shown in Figures 2-2 to 2-5.

6
Table 2-1. Test set-ups for TRUE Block Scale pre-tests PT-1 to PT-4. Thestructural interpretation refers to the March 1999 model (Hermanson,in prep.).
Test#
Sink Structure#
Test sections Structure#
Naturalflow*(ml/h)
Euclideandistance (m)
PT-1 KI0023B:P4 13 KA2563A:S3KI0025F02:P3KI0025F02:P5KA2563A:S4KI0025F:R4KI0023B:P6
131320202021
?145
50022
212722264115
PT-2 KI0023B:P6 21 KI0025F02:P5KA2563A:S4KI0025F:R4KI0023B:P4KI0025F02:P3KA2563A:S3KI0025F02:P8KI0025F02:P6KI0023B:P7KI0025F02:P7KI0023B:P5KA2563A:S1
20202013
13, 2113622
6, 20??
19
5500
21
14?
30?????
20164215362123181420740
PT-3 KI0025F02:P5
20 KI0023B:P6KA2563A:S4KI0025F:R4KI0023B:P4KI0025F02:P3KA2563A:S3KI0025F02:P8KI0025F02:P6KI0023B:P7KI0023B:P5KI0025F02:P7KI0023B:P2
21202013
13, 2113622
6, 20??
19
2500
21
14?
30?????
20352422243821726201543
PT-4 KI0023B:P6 21 KA2563A:S1KA2563A:S4KI0025F02:P3KI0025F02:P6
1920
13, 2122
?50014
?
40163618
* estimated based on earlier measurements

7
Figure 2-2. Position of sink and dilution test sections during the TRUE Block Scale pre-testPT-1. The positions of the structures are based on the March 1999 structuralmodel (Hermanson, in prep.). Z=-450 masl.

8
Figure 2-3. Position of sink and dilution test sections during the TRUE Block Scale pre-testPT-2. The positions of the structures are based on the March 1999 structuralmodel (Hermanson, in prep.). Z=-450 masl.

9
Figure 2-4. Position of sink and dilution test sections during the TRUE Block Scale pre-testPT-3. The positions of the structures are based on the March 1999 structuralmodel (Hermanson, in prep.). Z=-450 masl.

10
Figure 2-5. Positions of sink, dilution test sections and tracer injection sections during theTRUE Block Scale pre-test PT-4. The positions of the structures are based on theMarch 1999 structural model (Hermanson, in prep.). Z=-450 masl.

11
2.3 Laboratory analyses
Samples were analysed for dye tracer content at the GEOSIGMA Laboratory, Uppsala,using a Jasco FP777 Spectrofluorometer.
2.4 Evaluation
2.4.1 Hydraulic interference tests
Qualitative interpretation
The hydraulic responses have been evaluated in different steps, each at which part of thedata has been sorted out for further (quantitative) evaluation. This procedure wasnecessary in order to restrict the quantitative evaluation to a manageable amount of data.
First, time-drawdown- and time-recovery plots were prepared for sections showing adrawdown (or recovery) of more than sp=0.1 m (1 kPa) at the end of the tests. Thisthreshold value was selected with due consideration of the amplitude of the tidal effects.These types of plots were used to estimate the response times (tR) for each section. Theresponse time is here defined as the time, after start of flowing, when a drawdown (orrecovery) of 1 kPa (0.1 m) is observed (in the logarithmic plots) for the actualobservation section.
To account for the different flow rates used in the tests and to make the response plotscomparable between tests, the final drawdown by stop of flowing (sp) is normalisedwith respect to the flow rate (Q). The ratio sp/Q is plotted on the Y-axis. On the X-axis,the ratio of the response time to the squared distance R in space between the (midpointof the) source section and (the midpoint of) each observation section (tR/R2) is plotted.The latter ratio is inversely related to the hydraulic diffusivity of the rock, whichparameter indicates the speed of propagation of the pressure signal in the rock createdby the drawdown in the flowing section. The distances in space between source andobservation points, R, are given in Appendix 1 for all tests.
From the response plots of sp/Q versus tR/R2 for each test, sections with anomalouslyfast response times (high hydraulic diffusivity) and large (normalised) drawdown can beidentified. Such sections, showing primary responses, can be assumed to have a distincthydraulic connection to the flowing section and may be intersected by fracture zones orother conductive structures in the rock. On the other hand, sections with delayed andweak responses may correspond to sections in the rock mass between such structures.
From the calculated values of sp/Q (index 1) and tR/R2 (index 2) for each observationsection, and from each test, a common response matrix, showing the response patternsfor all tests, was prepared by classifying the responses by means of the above indexes 1and -2. For index 1 the following class limits and associated characteristics ofdrawdown were used:

12
Index 1 (sp/Q)
sp/Q> 1⋅105 s/m2 Excellent
3⋅104 <sp/Q≤ 1⋅105 s /m2 High
1⋅104 <sp/Q≤ 3⋅104 s /m2 Medium
sp/Q≤ 1⋅104 s /m2 Low
For index 2 the following class limits and response characteristics were used:
Index 2 (tR/R2)
tR/R2< 0.01 s/m2 Excellent (E)
0.01 ≤tR/R2< 0.1 s/m2 Good (G)
0.1 ≤tR/R2< 0.3 s/m2 Medium (M)
tR/R2≥ 0.3 s/m2 Bad (B)
The results from the qualitative analysis were compared with the structural (March 99)model and checked for consistency and possible need of revision. It should be pointedout that the response diagrams of sp/Q versus tR/R2 described above were only meant tobe used as diagnostic tools to identify the most significant responses during each testand to construct the response matrix. The diagrams should be used with some care sincethe true distances (along pathways) between the source and observation sections areuncertain which may affect the position of a certain section in the horizontal direction inthe diagrams. However, in most cases, the shortest distance between the source andobservation section, as used here, is considered as a sufficient and robust approximationfor the above purpose.
Another potential source of error in the response diagrams may occur if (internal)hydraulic interaction exists between sections along an observation borehole. Forexample, such interaction could either be due to packer leakage (insufficient packersealing) or leakage through interconnecting fractures around the packers. Such acondition may give a false impression that good hydraulic communication existsbetween such observation sections and the actual source section. However, any analysismethod will suffer from this potential source of error.
The derivative of the drawdown was used as a diagnostic tool in the interpretation of theflow geometry and deduction of hydraulic boundaries. The derivative was generated bythe SKB-code PUMPKONV and plotted together with the drawdown curves.
Quantitative interpretation
The main purpose of the quantitative interpretation of the interference tests in this studyis to estimate the hydraulic parameters and the hydraulic characteristics of the most

13
significant responses during each test as identified from the qualitative interpretation.The transmissivity, storativity and hydraulic diffusivity, and in some cases also theleakage coefficient, are estimated from the tests. The estimated hydraulic parameters areassumed to represent the hydraulic properties of some of the fracture zones tested. Inaddition, the quantitative interpretation also provides (soft) information on the flowgeometry during the tests including effects of outer hydraulic boundaries.
The quantitative interpretation (time-drawdown) was made using the code AquiferTest(Waterloo Hydrologic). As a standard interpretation model, the Hantush model forconstant flow rate tests in a leaky (or non-leaky) aquifer with no aquitard storage wasused. This model was used because of its generality and its ability to analyse pure radialflow (Theis’ type curve) as well as leaky (pseudo-spherical) flow. The type curve forr/L=0 in the Hantush’ model (no leakage) corresponds to the classical Theis’ type curvefor radial flow. Tests showing periods with (pseudo)-radial flow were analysed usingthe Cooper-Jacob’s method in semi-logarithmic graphs. By the analysis of the constanthead tests, a varying (declining) flow rate was applied at the sink.
2.4.2 Tracer dilution tests
Flow rates were calculated from the decay of tracer concentration versus time throughdilution with natural unlabelled groundwater, c.f. Winberg (ed), (1996).
The dilution of tracer with time in the injection sections was determined by analysingthe samples withdrawn from the sections. The so-called "dilution curves" were plottedas the natural logarithm of concentration versus time. Theoretically, a straight-linerelationship exists between the natural logarithm of the relative tracer concentration(c/c0) and time (t):
Qbh = −V ⋅ ∆ ln (c/c0) / ∆ t 2-1
where Qbh (m3/s) is the groundwater flow rate through the borehole section and V (m3)is the volume of the borehole section. The flow, Qbh, may be translated into a Darcyvelocity by taking into account the distortion of the flow caused by the borehole and theangle between borehole and flow direction, c.f. Rhén et al. (1991). The relation betweenthe flow in the rock, the Darcy velocity, qw (m/s), and the measured flow through theborehole with a dilution test, Qbh, can be expressed as:
��
���
���
�
� ++⋅+⋅⋅⋅=642
cossin 3212 DDDdbhwbh
aaarLqQ βπβα 2-2
where
bh
wd
Lrr 2= 2-3
Assuming a 90° angle between borehole and the flow direction the relationship between

14
Qbh and qw may be estimated from
α⋅⋅⋅= wbhwbh rLqQ 2 2-4
where Lbh is the length of the borehole section (m), rw is the borehole radius (m) and αis the factor accounting for the distortion of flow caused by the borehole. The factor αwas given the value 2 in the calculations, which is the theoretical value for ahomogeneous porous media.
2.4.3 Tracer test
The evaluation of the tracer test has involved computer modelling using a simple one-dimensional advection-dispersion model (Van Genuchten & Alves, 1982). From thecomputer modelling, dispersivity and mean travel times were determined using anautomated parameter estimation program, PAREST (Nordqvist, 1994). PAREST uses anon-linear least squares regression where regression statistics (correlation, standarderrors and correlation between parameters) also is obtained.
The chosen one-dimensional model assumes a constant fluid velocity and negligibletransverse dispersion, cf. Equation 2-5.
∂ C/∂ t = D(∂ 2C/∂ x2) - v⋅∂ C/∂ x 2-5
where: D = Dispersion coefficientv = fluid velocity (m/s)C = concentration of solutex = distance from injection point (m)t = time (s)
According to Ogata & Banks (1961) and Zuber (1974), the dispersion in a radiallyconverging flow field can be calculated with good approximation by equations valid forone-dimensional flow. Although a linear flow model (constant velocity) is used for aconverging flow field, it can be demonstrated that breakthrough curves and parameterestimates are similar for Peclet numbers of about 10 and higher.
Van Genuchten (1982) gives a solution for step input with dispersion over the injectionboundary. The solution of Equation 2-5, then is:
C/Co= 2 erfc [(x-v⋅t) / Z] + (V/π)2 exp [(x-v⋅t)2 / (4D⋅t)] - 2-62[1+v⋅x/D+V] exp [v⋅x/D] erfc[(x+v⋅t) / Z]
where: Z = 2(D⋅t)2
V = v2t/D

15
Variable injection schemes were simulated by superposition of the solution given inEquation 2-6.
The fit of the breakthrough curves using a three-parameter fit included velocity, v,dispersion coefficient, D, and the so called F-factor which corresponds to injected massdivided by fracture volume, Minj/Vf. The result of the evaluation is presented in Chapter3.7.3.
Based on the mean travel times, tm, determined from the parameter estimation, thehydraulic fracture conductivity, Kfr (m/s), were calculated assuming radial flow andvalidity of Darcy's law (Gustafsson & Klockars, 1981);
Kfr= ln (r/rw) (r2-rw2) / 2⋅ tm⋅∆h 2-7
where: r = travel distance (m)rw= borehole radius (m)tm= mean travel time of tracer (s)∆h= head difference (m)
The equivalent fracture aperture, b (m), was calculated from:
b = Q⋅tm/π ⋅(r2-rw2) 2-8
where Q (m3/s), is the mean pumping rate.
Flow porosity, θk, was calculated using:
θk = K/Kfr 2-9
where K is the hydraulic conductivity of the packed-off section of the boreholedetermined from steady state evaluation of the interference test (Moye, 1967):
K = (Q/∆h⋅L) ⋅ ((1+ln L/2rw)/2π) 2-10
where L (m) is the length of the packed-off section. It should be noted that the term flowporosity might be misleading to use in a fractured heterogeneous rock as it is defined fora porous media. However, it is often used in fractured media as a scaling factor fortransport, but then defined over a finite thickness which, in his case, is defined as thelength of the packed-off borehole section (L = 1.0 m).
The values calculated using Equations 2-7 through 2-10 are presented together withparameters determined from the numerical modelling of the tracer breakthrough inTable 3-6.
Tracer mass recovery was calculated by integration of the injection and breakthroughcurves for mass flux (mg/h) versus time (h).

16

17
3 Results and interpretation
3.1 General
The equipment has worked well and no major hydraulic disturbance has occurred duringthe tests. A few of the sections closest to the I-tunnel have been somewhat disturbed byactivities in the G-tunnel during the pumping phase of PT-2. However, this has notaffected the interpretation of the tests. A summary of the tests are given in Table 3-1.
Test # Sink Structure Q*(l/min)
Sp **(m)
Q/Sp (m2/s)
Flow period(h)
PT-1 KI0023B:P4 13 0.675 389 2.9⋅10-8 24
PT-2 KI0023B:P6 21 2.55 225 1.9⋅10-7 48
PT-3 KI0025F02:P5 20 4.70 72 1.1⋅10-6 93
PT-4 KI0023B:P6 21 2.40 209*** - 663
* Flow at the end of the pumping period** Drawdown at the end of the pumping period*** Influenced by “global” pressure variations
3.2 Pressure response matrix
The pressure response matrix for PT-1 to PT-3 is shown in Figure 3-1. The matrix isbased on the responses during the flow phase. The coding in colours and letters is basedon the two indexes sp/Q (drawdown normalised to pumping rate) and tR/R2 (responsetime normalised to the square of the distance) according to Andersson et al. (1998). ForPT-1 and PT-3 the drawdown pattern at the end of the flow phase is shown whereas fortest PT-2 the data during the flow phase were truncated at t=1140 min due to externaldisturbances, see below.
Figure 3-1 shows that the pressure responses during PT-1 are restricted to the centralarea of the block. During PT-2 and PT-3, most of the monitored borehole sectionsrespond. The response patterns during the latter two tests are similar. The difference
between the tests are mainly resulting from the strength of the sink in relation to thedistances involved. The hydraulic responses are discussed more in detail for each testbelow.
Table 3-1. Summary of pre-tests 1-4 (PT-1 – PT-4).

18
Structure #13 #21 #20
Borehole Interval (m) PT-1
PT-2
PT-3
Structure
KA2511A:T1 239-293 B B #10,11,18 INDEX 1=sp/QKA2511A:T2 171-238 B B #19 EXCELLENTKA2511A:T3 139-170 B B # ? HIGHKA2511A:T4 111-138 B B #20 MEDIUMKA2511A:T5 103-110 B B #16 LOWKA2511A:T6 96-102 B B #6 NO RESPONSEKA2511A:T7 65-95 B B # ?KA2511A:T8 6-64 B B #4,7
INDEX 2=tr/R2KA2563A:S1 242-246 M B B #19 E=EXCELLENTKA2563A:S2 236-241 B B #19 G=GOODKA2563A:S3 206-208 M M G #13 M=MEDIUMKA2563A:S4 187-190 M E E #20 B=BADKA2563A:S5 146-186 M G G #6,7
KI0025F:R1 169-194 B B Z S=SOURCEKI0025F:R2 164-168 B B #19KI0025F:R3 89-163 M B ?KI0025F:R4 86-88 M G G # 20KI0025F:R5 41-85 B B #6KI0025F:R6 3.5-40 B B # 5
KI0023B:P1 113.7-200.7 B B #10KI0023B:P2 111.25-112.7 B B #19KI0023B:P3 87.20-110.25 E E G ?KI0023B:P4 84.75-86.20 S E M #13KI0023B:P5 72.95-83.75 G G G #18KI0023B:P6 70.95-71.95 B S G #21KI0023B:P7 43.45-69.95 M E E #6, 20KI0023B:P8 41.45-42.45 B M #7KI0023B:P9 4.5-40.45 B #5
KI0025F02:P1 135.15-204 B B #?KI0025F02:P2 100.25-134.15 B B #19KI0025F02:P3 93.40-99.25 B M B #13,21KI0025F02:P4 78.25-92.4 B B B #?KI0025F02:P5 73.3-77.25 B G S #20KI0025F02:P6 64.0-72.3 B M M #22KI0025F02:P7 56.1-63.0 B B M #?KI0025F02:P8 51.7-55.1 M G G #6KI0025F02:P9 38.5-50.7 B M #7KI0025F02:P10 3.4-37.5 B B #5
KA3510A:P1 122.02-150 #3,4,5,6,8KA3510A:P2 114.02-121.02 B M #15KA3510A:P3 4.52-113.02 B #?KA3548A01:P1 15-30 B #?KA3548A01:P2 10-14 B #?KA3573A:P1 18-40 B B #15KA3573A:P2 4.5-17 B #5KA3600F:P1 22-50.1 B #?KA3600F:P2 4.5-21 B B #5, 7?
Figure 3-1. Pressure response matrix (cf. Andersson et al., 1998) for pre-tests PT-1 to PT-3.

19
3.3 Pre-Test #1 (PT-1)
The first test, PT-1, performed by pumping structure #13 in KI0023B:P4, showspressure responses in 15 borehole sections within the TRUE Block over distancesranging between 15 and 45 m. The pumping flow rate decreased from 0.89 to 0.68 l/minduring the 24-hour pumping period. A decrease in the electrical conductivity indicatingincreasing portion of less saline water was also noted (cf. Figure 3-2).
In the sink borehole, good responses are found in the two sections adjacent to thepumping section (KI0023B:P3 and P5), cf. Figure 3-3. However, both sections have alow transmissivity and may be affected by minor compliance in the equipment causedby the pressure drop in section P4. It should also be noted that section P3 includes theentire water volume of the (collapsed) central tube in the borehole. The latter sectionhas therefore been omitted in the diagnostic pressure response plots. Good responses arealso found in sections KI0023B:P6 and P7 in the sink borehole. The latter sectioncontains structures #6 and 20.
In the receiver boreholes, a very good hydraulic response also occur in KA2563A:S3(#13) as expected, cf. Figure 3-3. The remainder of the responding sections are all,except three, interpreted to contain structures #6, 7, 13, 20, 21 and 22. The remainingthree sections include two low-transmissive sections in KI0025F02 (P4 and P7), andone in structure #19 ( KA2563A:S1). Notable is also the slow response inKI0025F02:P3 interpreted to include structure #13. In the latter section the flow rateincreased significantly during flowing, cf. Table 3-1.
The rather strong pressure response in KI0025F02:P8 (structure #6) may possibly be (inpart) explained by the hydraulic short-circuiting in the sink borehole. This may result inthat structure #6 also is activated in this borehole during the flow period via sectionKI0023B:P7, cf. above.

20
0 400 800 1200 1600
1320
1360
1400
1440
1480El
ectri
cal C
ondu
ctiv
ity (m
S/m
)
0.65
0.7
0.75
0.8
0.85
0.9
Pum
p ra
te (l
/min
)
PT-1Electrical conductivityPump rate
Figure 3-2. Pump rate and electrical conductivity of pumped water during pre-test PT-1.
TRUE- Blockscale . PT-1 - Sink: KI0023B4 : 85-86 m. Structure #13All responding (sp>1 kPa) receiver sections. Drawdown phase (t=1440 mins).
2563A1
25F02P3
25F02P4
25F02P50025F4
0023B7
25F02P6
0023B5
2563A5
2563A3
0023B6
25F02P725F02P8
2563A4
1.0E+03
1.0E+04
1.0E+05
1.0E+06
1.0E+07
1.0E-02 1.0E-01 1.0E+00 1.0E+01 1.0E+02
tR /R2 (s/m2)
sp /Q
(s/m
2)
Figure 3-3. Diagnostic response plot (cf. Andersson et al., 1998) for pre-test PT-1.

21
PT-1 also included measurements of flow rates using the tracer dilution method in sixselected observation sections. The tests were performed both under natural gradient andduring pumping in order to study the influence of the pumping. The results presented inTable 3-2 show a distinct influence in three of the selected sections including structures#13, 20 and 21, whereas two sections have a minor and uncertain increase and onesection (KI0025F:R4) has no increase at all. The latter section, which is interpreted inStructure #20, shows a rather strong pressure response, c.f. Figure 3-3. Notable is thatsection KA2563A:S4 (formerly R5) has a significantly lower (1/4) natural flow thanduring the measurements in Spring 1998 (Andersson et al., 1998). One possibleexplanation for this may be the re-instumentation of KA2563A.
The good flow response in KA2563A:S3 and KI0025F02:P3 confirm the structuralinterpretation of structure #13 and the response in KA2563A:S4 suggests that structures#13 and #20 are better interconnected in the northwestern parts of the block. This is alsoconsistent with the orientation of the two structures.
Table 3-2. Results of tracer dilution tests during PT-1.
Test section Structure Qnatural(ml/h)
Qpump(ml/h)
∆Q(ml/h)
KA2563A:S3 13 1 16 + 15
KA2563A:S4 20 120 280 + 160
KI0023B:P6 21 36 40 + 4
KI0025F:R4 20 1 1 ± 0
KI0025F02:P3 13,21 38 130 + 92
KI0025F02:P5 20 49 58 + 9
The sections with the most significant pressure responses (including the tracer dilutionsections) during PT-1 are shown in a drawdown versus time/distance squared (t/R2)-diagram in Appendix 1. In a homogenous and isotropic medium all response curveswould merge to a common curve. The figure shows that medium is heterogeneous. Thecalculated transmissivity and storativity corresponds to the limiting Theis´-curve shownand thus mainly represent section KA2563A:S3.
Quantitative (time-drawdown) evaluation has been made for the most significantresponses of the receiver sections according to the procedures described in Section2.4.1. The results for PT-1 are shown in Table 3-3. The calculated values of thehydraulic parameters represent parameters of an equivalent fractured porous medium.

22
It should be observed that the results from receiver sections with small drawdowns, e.gsections located at long distances from the sink section or, alternatively, sections withdecreased hydraulic connection to the sink section, are uncertain. In particular, thetransmissivity may be over-estimated in such cases due to the assumptions regardinghomogeneity and isotropy in the evaluation model. In addition, the results from receiversections within the sink borehole may be uncertain due to non-radial flow between thesink and receiver sections. Uncertain results due to any of the above reasons are markedwith an asterix in Table 3-3. In this table, the transmissivity (T), storativity (S), thehydraulic diffusivity (T/S) and the leakage coefficient (K’/b’) are estimated togetherwith the dominating flow geometry during the test.
BoreholeSection
Structure#
T (m2/s) Storativity T/S(m2/s)
K’/b’ (s-1) Dom. FlowGeometry
KA2563A:S1 19 3.7⋅10-6 * 1.8⋅10-6 * 2.0 * 5.7⋅10-11 * Leaky→CHB
KA2563A:S3 13 4.5⋅10-8 8.6⋅10-8 0.5 1.2⋅10-11 Leaky
KA2563A:S4 20 6.9⋅10-7 1.3⋅10-6 0.5 1.1⋅10-10 Leaky
KA2563A:S5 6, 7 1.8⋅10-6 * 1.8⋅10-6 * 1.0 * 1.1⋅10-10 * Leaky→CHB
KI0025F:R4 20 6.7⋅10-7 8.0⋅10-7 0.8 6.2⋅10-11 Leaky
KI0023B:P4(SINK)
13 3.2⋅10-7 - - - Leaky→CHB
KI0023B:P5 18? 2.4⋅10-7 * 3.4⋅10-6 * 0.07 * 6.9⋅10-10 * Irregular
KI0023B:P6 21 6.9⋅10-7 * 3.6⋅10-6 * 0.07 * 2.5⋅10-10 * Leaky
KI0023B:P7 6, 20 7.5⋅10-7 * 1.1⋅10-6 * 0.7 * 1.4⋅10-10 * Leaky
KI0025F02:P3 13, 21 6.3⋅10-6 * 1.3⋅10-5 * 0.5 * 1.3⋅10-9 * Leaky→CHB
KI0025F02:P5 20 7.3⋅10-7 2.0⋅10-6 0.4 2.1⋅10-10 Leaky
KI0025F02:P6 22 1.2⋅10-6 * 2.9⋅10-6 * 0.4 * 2.5⋅10-10 * Leaky
KI0025F02:P8 6 1.5⋅10-6 * 1.6⋅10-6 * 0.9 * 1.6⋅10-10 * Leaky
* = uncertain value, see discussion above.
Table 3-3. Results of quantitative evaluation of hydraulic tests during PT-1.Leaky=pseudospherical, CHB=Apparent Constant head boundaryT=transmissivity.

23
3.4 Pre-Test #2 (PT-2)
The second test, PT-2, performed by pumping structure #21 in KI0023B:P6, showspressure responses in 40 of the 47 monitored borehole sections within the TRUE Blockarray over distances ranging between 15 and 150 m. The pumping flow rate decreasedfrom 2.85 to 2.55 l/min during the 48-hour pumping period. A decrease in the electricalconductivity indicating increasing portion of less saline water was also noted(cf. Figure 3-4).
0 1000 2000 3000
1320
1360
1400
1440
1480
Elec
trica
l Con
duct
ivity
(mS/
m)
2.5
2.6
2.7
2.8
2.9
Pum
p ra
te (l
/min
)
PT-2Electrical conductivityPump rate
Figure 3-4. Pump rate and electrical conductivity of pumped water during pre-test PT-2.
In the diagnostic pressure response plots the data during the flow phase are truncated att=1140 min due to external interference after this time. In the sink borehole, strongresponses occurred in the adjacent sections KI0023B:P3, P4, P5 and P7 to the flowingsection P6 (structure #21) which results in that several other structures were (indirectly)activated during this test (structures #6, 13, 18, 20).
In the receiver boreholes, the most prominent responses are found in sectionsinterpreted to include structures #6, 13, 20, 21 and 22, cf. Figure 3-5. The figure showsthat the hydraulic connectivity between structures #13, 20, 21 and 22 is very good. Therather strong pressure responses in sections KI0025F02:P8 and KA2563A:S5,containing structures #6 and 7, may possibly (in part) be explained by the hydraulicshort-circuiting in the sink borehole, c.f. above.

24
The remaining responses are lower and slower. Slow pressure responses are observed insections KA2563:S1 and S2, indicating that structure #19 has a certain hydraulicconnection to structure #21, cf. Table 3-3. The non-responding sections are allinterpreted to be associated with structure #5 which seems to be hydraulically wellisolated from the system formed by #21 and associated structures.
TRUE- Block Scale. Pre-test #2 (PT-2) - Sink: KI0023B6 : 70.4-71.4 m. Structure #21. All responding (sp>1 kPa) receiver sections. Drawdown phase (t=1140 mins).
2511A1
2511A32511A8
2563A1
0023B2
25F02P3
25F02P1025F02P1
2511A62511A5
0025F1 3510A2
0023B1
25F02P4
25F02P5
0025F40023B7
25F02P9
25F02P6
2511A7
0023B5
0025F52563A2
2563A5
0023B4
3600F2 3573A1
2563A3
2511A2
25F02P20025F6
25F02P7
0023B8
0025F3
0025F2
25F02P8
2563A4
2511A4
1.0E+03
1.0E+04
1.0E+05
1.0E+06
1.0E-03 1.0E-02 1.0E-01 1.0E+00 1.0E+01
tR /R2 (s/m2)
sp /Q
(s/m
2)
Figure 3-5. Diagnostic response plot (cf. Andersson et al., 1998) for pre-test PT-2.
The sections with the most significant pressure responses (including the tracer dilutionsections) during PT-2 are shown in a drawdown versus time/distance squared (t/R2)-diagram in Appendix 1. The calculated transmissivity and storativity corresponds to thelimiting Theis´-curve shown and thus mainly represent section KI0025F:R4.
PT-2 included measurements of flow rates using the tracer dilution method in twelveselected observation sections. The tests were performed both under natural gradient andduring pumping in order to study the influence of the pumping. The results presented inTable 3-4 show a distinct influence in nine of the selected sections, including structures#6, 13, 19, 20, 21 and 22 whereas three sections have a minor and uncertainincrease/decrease. The two remaining sections measured during PT-2 could not beinterpreted due to some unknown degradation of the tracer used. In conjunction withPT-4, which uses the same sink as PT-2, some of the uncertainties in the tracer dilutiontests were unraveled by repetition of the tests, cf. Table 3-4.
The observed increases are generally very significant but in one case a decrease isobserved from 10100 to 2500 ml/h. This section (KI0023B:P7) is adjacent to the sinkand is interpreted to include two structures, #6 and #20. The extremely high flow duringnatural conditions is likely to be caused by the head difference between structures #6and #20. When pumping starts in the section containing structure #21, the gradient isreversed, or partly reversed. This is further discussed in Chapter 4.

25
Test section Structure Qnatural(ml/h)
Qpumped(ml/h)
∆Q (ml/h)
KA2563A:S3 13 14 11 − 3
KA2563A:S4 20 130 610 + 480
KA2563A:S1 19 115 400 + 285
KI0023B:P4 13 18 16 − 2
KI0023B:P5 ? 2 122 + 120
KI0023B:P7 6,20 10120 2490 − 7630
KI0025F:R4 20 3 1 − 2
KI0025F02:P3 13,21 25 140 + 115
KI0025F02:P5 20 50 111 + 61
KI0025F02:P6 22 230 460 + 230
KI0025F02:P7 ? 7 18 + 11
KI0025F02:P8 6 21 13 − 8
* Value determined during PT-4
The results of the quantitative evaluation of the hydraulic tests in PT-2 are shown inTable 3-5. The same comments apply as for PT-1, see Section 3.3. As for the qualitativeanalysis, the drawdown responses during PT-2 were truncated due to externaldisturbances, see above.
Table 3-4. Results of tracer dilution tests during PT-2.

26
BoreholeSection
Structure#
T (m2/s) Storativity T/S(m2/s)
K’/b’ (s-1) Dom. FlowGeometry
KA2563A:S1 19 2.4⋅10-5 * 1.7⋅10-5 * 1.4 * - Radial→Tidal
KA2563A:S3 13 6.0⋅10-7 2.3⋅10-6 0.3 1.6⋅10-10 Leaky
KA2563A:S4 20 7.4⋅10-7 2.0⋅10-7 3.6 2.7⋅10-11 Leaky
KA2563A:S5 6, 7 1.5⋅10-6 * 8.9⋅10-7 * 1.7 * 1.8⋅10-10 * Leaky
KI0025F:R4 20 8.1⋅10-7 1.1⋅10-7 7.5 8.7⋅10-12 Leaky
KI0023B:P4 13 6.0⋅10-7 * 3.8⋅10-6 * 0.2 * 2.1⋅10-10 * Leaky
KI0023B:P5 18 4.7⋅10-7 * 1.3⋅10-6 * 0.4 * 1.2⋅10-10 * Leaky
KI0023B:P6(SINK)
21 1.2⋅10-6 - - - Leaky→CHB
KI0023B:P7 6, 20 7.9⋅10-7 * 2.4⋅10-7 * 3.3 * 2.4⋅10-11 * Leaky
KI0025F02:P3 13, 21 1.0⋅10-5 * 3.8⋅10-6 * 2.7 * 2.1⋅10-10 * Leaky→CHB
KI0025F02:P5 20 7.7⋅10-7 1.9⋅10-7 4.0 2.9⋅10-11 Leaky
KI0025F02:P6 22 1.1⋅10-6 7.4⋅10-7 1.5 1.5⋅10-10 Leaky
KI0025F02:P7 ? 1.2⋅10-6 3.6⋅10-6 0.3 4.4⋅10-10 Leaky
KI0025F02:P8 6 1.4⋅10-6 3.8⋅10-7 3.7 7.6⋅10-11 Leaky
* = uncertain value, see discussion above
Table 3-5. Results of the quantitative evaluation of hydraulic test responsesduring PT-2. T=transmissivity, Leaky=pseudospherical,CHB=Apparent Constant head boundary, Tidal=Response clearlyaffected by tidal effects.

27
3.5 Pre-Test #3 (PT-3)
The third test, PT-3, performed by pumping structure #20 in KI0025F02:P5, showspressure responses in 46 of the 47 monitored borehole sections within the TRUE Blockarray over distances ranging between 15 and 150 m.. The pumping flow rate was keptrather constant throughout the 48-hour pumping period, at about 4.8 l/min. Theelectrical conductivity was also almost constant, 1440 mS/m, cf. Figure 3-6.
0 400 800 1200 1600 2000
1320
1360
1400
1440
1480
Elec
trica
l Con
duct
ivity
(mS/
m)
4.7
4.8
4.9
5
5.1
Pum
p ra
te (l
/min
)
PT-3Electrical conductivityPump rate
Figure 3-6. Pump rate and electrical conductivity of pumped water during pre-test PT-3.
The response pattern for this test is very similar to test PT-2, cf. Figure 3-1. This impliesthat structures #20 and 21 have a very good hydraulic connection.
The most prominent responses are found in sections interpreted to include structures #6,7, 13, 20, 21 and 22, cf. Figure 3-7. The remaining responses are lower and slower. Thesame conclusions can be drawn from this test as for the previous test.
The sections with the most significant pressure responses (including the tracer dilutionsections) during PT-3 are shown in a drawdown versus time/distance squared (t/R2)-diagram in Appendix 1. The calculated transmissivity and storativity corresponds to thelimiting Theis´-curve shown and thus mainly represent section KA2563A:S4.

28
TRUE- Block Scale. Pre-test #3 (PT-3) - Sink: KI0025F02:P5 : 73.3-77.25 m. Structure #20. All responding (sp>1 kPa) receiver sections. Drawdown phase (t=5560 mins).
2511A12511A32511A8
3510A3 3548A13573A2
0023B22563A1
25F02P10
25F02P12511A6
2511A50025F13510A2
0023B1
25F02P4
0025F4
0023B7
25F02P9
25F02P6
2511A7
0023B5
0025F52563A2
2563A5
3600F1
0023B4
3548A23600F2
3573A1
2563A30023B6
2511A2
25F02P20025F6
25F02P7
0023B90023B8
0025F3
0025F2
25F02P8
2563A4
2511A4
25F02P3
1.0E+03
1.0E+04
1.0E+05
1.0E+06
1.0E-03 1.0E-02 1.0E-01 1.0E+00 1.0E+01
tR /R2 (s/m2)
sp /Q
(s/m
2)
Figure 3-7. Diagnostic response plot (cf. Andersson et al., 1998) for pre-test PT-3.
PT-3 included measurements of flow rates using the tracer dilution method in twelveselected observation sections. The test were performed both under natural gradient andduring pumping in order to study the influence of the pumping. The results presented inTable 3-6 show a distinct influence in five of the selected sections containing structures#6, 13, 20, 21 and 22 whereas one section (KI0025F02:P8) has a minor and uncertainincrease and one (KI0023B:P2) has no increase. Section KI0025F02:P3 could only bemeasured during the pumping phase but is most likely also influenced by the pumpingas the natural flow during PT-1 and PT-2 was significantly lower than 250 ml/min, cf.Tables 3.1 and 3.3. The four remaining sections could not be interpreted due to someunknown degradation of the tracer used.

29
Test section Structure Qnatural(ml/h)
Qpumped(ml/h)
∆Q (ml/h)
KA2563A:S3 13 ? 15 ?
KA2563A:S4 20 80 950 + 870
KI0023B:P2 19 14 14 ± 0
KI0023B:P4 13 ? ? ?
KI0023B:P5 ? (390) (90) − 300
KI0023B:P6 21 3 12 + 9
KI0023B:P7 6,20 ? ? ?
KI0025F:R4 20 3 5 + 2
KI0025F02:P3 13,21 ? 250 + 200?
KI0025F02:P6 22 100 1500 + 1400
KI0025F02:P7 ? ? ? ?
KI0025F02:P8 6 33 39 + 6
The results of the quantitative evaluation of the hydraulic tests in PT-3 are shown inTable 3-7. The same comments apply as for PT-1, see Section 3.3. Notable is also theclear effects of no-flow hydraulic boundaries occurring in most of the respondingsections (including the sink) at about 2000 minutes (33 hours) during the drawdownphase, cf. Appendix A. The boundary effect is not as pronounced during the recoveryphase but can be seen in some sections. In section KI0025F02:P3, no-flow boundaryeffects appear earlier, at about 250 minutes (4 hours), both during drawdown andrecovery. Such boundary effects have not been seen in previous tests of KI0025F02:P5(Adams et al., in prep.) but considering the long duration of the drawdown phase (4days) they might represent large-scale effects, i.e. limitations in the extension of thefracture system tested.
Table 3-6. Results of tracer dilution tests during PT-3. Values within brackets areuncertain. Questionmarks represent bad data.

30
BoreholeSection
Structure#
T (m2/s) Storativity T/S(m2/s)
K’/b’ (s-1) Dom. FlowGeometry
KA2563A:S3 13 6.0⋅10-7 9.5⋅10-7 0.6 4.8⋅10-11 Leaky→NFB
KA2563A:S4 20 7.0⋅10-7 7.4⋅10-8 9.5 8.3⋅10-12 Leaky→NFB
KA2563A:S5 6, 7 1.4⋅10-6 5.5⋅10-7 2.6 5.5⋅10-11 Leaky→NFB
KI0025F:R4 20 6.5⋅10-7 2.1⋅10-7 3.1 6.6⋅10-12 Leaky→NFB
KI0023B:P4 13 6.3⋅10-7 2.2⋅10-6 0.3 1.2⋅10-10 Leaky→NFB
KI0023B:P5 18 6.5⋅10-7 5.4⋅10-7 1.2 3.7⋅10-11 Leaky→NFB
KI0023B:P6 21 7.3⋅10-7 2.1⋅10-7 3.4 2.7⋅10-11 Leaky→NFB
KI0023B:P7 6, 20 7.8⋅10-7 1.2⋅10-7 6.7 9.8⋅10-12 Leaky→NFB
KI0025F02:P3 13, 21 1.0⋅10-5 * 1.3⋅10-5 * 0.8 * 1.5⋅10-9 * Leaky→NFB
KI0025F02:P5(SINK)
20 6.9⋅10-7 - - - Leaky→NFB
KI0025F02:P6 22 1.0⋅10-6 * 2.2⋅10-6 * 0.4 * 2.0⋅10-10 * Leaky→NFB
KI0025F02:P7 ? 1.3⋅10-6 * 5.1⋅10-6 * 0.2 * 5.6⋅10-10 * Leaky→NFB
KI0025F02:P8 6 1.5⋅10-6 * 5.8⋅10-7 * 2.6 * 6.1⋅10-11 * Leaky→NFB
* = uncertain value, see discussion above.
3.6 Pre-PT-4
Prior to the actual tracer injections during PT-4, two tracer injections were performed inKI0023B:P7 with the purpose to check that the pumping in KI0023B:P6 is strongenough to reverse the hydraulic gradient in section P7 caused by the short-circuitbetween structures #6 and #20 in the latter section. Figure 3-8 shows a schematic planeview of borehole KI0023B and the intercepts with different structures.
Table 3-7. Results of the quantitative evaluation of hydraulic test responsesduring PT-3. T=Transmissivity, Leaky=pseudospherical,NFB=Apparent No-flow boundary.

31
42,2 m43,75 m
44,2 m68,95 m
71,1 m69,9 m
P8 P7
KI0023B
P6
338/83
41.45 - 42.45 m
Packer
43.45 - 69.95 m 70.95 - 71.95 m
088/83
123/86157/82133/89
016/80#7 #6
#21#20
Figure 3-8. Schematic plane view of borehole KI0023B with fracture intersections in thepacked-off sections P6, P7 and P8.
The first injection was performed by injecting a slug of Uranine in the lower part ofsection P7, close to structure #20, and the second by injecting a slug of Rhodamine WTclose to structure #6 in the upper part of section P7. The injections were made throughthe circulation loop. Pumping was done in KI0023B:P6 with the same pumping rate asin PT-2.
The breakthrough of Uranine (Figure 3-9) shows a very fast travel time with a firstarrival of about 10 minutes. The injection was originally intended to cover the entirelength of the section but as breakthrough was clearly visible, the injection was stoppedafter 25 minutes. The additional small peak after 2 hours results from an unintentionalrun of the circulation pump creating a short extra pulse. The peak after 4 hourscorresponds to the injection of Rhodamine in the upper part of the borehole which wasperformed by switching the inlet and outlet tubes of the circulation loop. Thus, Uranineremaining in the tube was also injected simultaneously with the Rhodamine pulse. Thetracer mass recovery of Uranine was estimated to 100%.
The results confirms that structures #20 and #21 intersect very close to the boreholewhich also is indicated by the orientation of the structures obtained from the BIPSmeasurement (Figure 3-8).

32
0 2 4 6 8 10Elapsed time (h)
0
2
4
6
8
10
Con
c. (p
pm)
Pre Pt-4Breakthrough Uranine
Flow path KI0023B P7 - KI0023B P6
Figure 3-9. Breakthrough of Uranine in KI0023B:P6 from injection in the lower part of sectionP7, close to structure #20, cf. Figure 3-8.
The breakthrough of Rhodamine WT from the upper part of section P7 (Figure 3-10) isdelayed with about 1-2 hours compared to the Uranine breakthrough which correspondsto the travel time along the 27.5 m long borehole section. The breakthrough confirmsthat water from structure #6 flows along the borehole section. However, the tracer massrecovery of Rhodamine WT was estimated to only about 50% indicating that parts ofthe tracer mass is lost. Losses could occur either to other fractures intersecting theborehole that are controlled by an even stronger sink than section P6, or by entrappmentin poorely mixed parts of the section (no circulation was done).

33
0 2 4 6 8 10Elapsed time (h)
0
0.04
0.08
0.12
0.16C
onc.
(ppm
)Pre Pt-4
Breakthrough RdWtFlow path KI0023B P7 - KI0023B P6
Figure 3-10. Breakthrough of Rhodamine WT in KI0023B:P6 from injection in the upper partof section P7, close to structure #6, cf. Figure 3-8.
3.7 Pre-Test #4 (PT-4)
The fourth pre-test, PT-4, was focused on tracer transport. Based on the many goodflow responses observed during PT-2 (Table 3-4) the same set-up was decided for use inPT-4. Pumping was done in KI0023B:P6 with the same pumping rate as in PT-2 andfour primary injection sections were chosen (Table 3-8). An optional injection sectionwas also selected, but it was decided to limit the number of tracers injected to avoidcontamination and also to optimise the analysis resourses available.
3.7.1 Tracer injections
The injections were performed as decaying pulses. In two of the injections (sectionsKI0025F02:P3 and KI0025F02:P6), the tracer solution was exchanged with non-tracedwater in order to shorten the tail of the breakthrough curve. However, due to therelatively large volume of the circulating system a rather poor efficiency was obtained.The injection concentrations and injection rates given in Table 3-8 are the actuallymeasured ones.

34
Table 3-8. Tracer injection data for PT-4 (measured values).
Inj # Section Structure Tracer Max Injconc(mg/l)
Inj rate(ml/h)*
Vol. ofsect. (ml)
1 KA2563A:S4 20 Rhodamine 120 680 68832 KA2563A:S1 19 Uranine 420 220 88143 KI0025F02:P3 13, 21 Amino G Acid 2200 113 82384 KI0025F02:P6 22 Rhodamine 250 350 9717
*Calculated from the tracer dilution during injection
The injection functions presented as the logarithm of concentration (Ln C) versus timeare shown in Figure 3-11.
0 40 80 120Elapsed time (h)
-4
-2
0
2
4
6
LN C
Pt-4Injection RdWt #1
KA2563A S4
0 100 200 300 400 500Elapsed time (h)
-2
0
2
4
6
8
LN C
Pt-4Injection Uranine
KA2563A S1
0 40 80 120 160 200Elapsed time (h)
0
2
4
6
8
LN C
Pt-4Injection Amino G
KI0025F02 P3
0 50 100 150 200 250Elapsed time (h)
-4
-2
0
2
4
6
LN C
Pt-4Injection RdWt #2
KI0025F02 P6
Figure 3-11. Tracer injection functions (Ln C versus time) including straight-line fits for thefour injections during PT-4. Note that the axis scales differ.

35
3.7.2 Tracer breakthrough
The breakthrough of tracer was monitored both in the sink section KI0023B:P6 and inthe adjacent section P7, where the short-circuit between structure #6 and #20 occurs.Tracer breakthrough was detected from all four injections in section P6 and the resultingbreakthrough curves are presented in Figure 3-12.
0 40 80 120 160 200Elapsed time (h)
0
0.04
0.08
0.12
Con
c. (p
pm)
Pt-4Breakthrough RdWt #1
Flow path KA2563A S4 - KI0023B P6
0 100 200 300 400 500
Elapsed time (h)
0
0.1
0.2
0.3
0.4
Con
c. (p
pm)
Pt-4Breakthrough Amino G Acid
Flow path KI0025F02 P3 - KI0023B P6
200 300 400 500Elapsed time (h)
0
0.0004
0.0008
0.0012
0.0016
0.002
Conc
. (pp
m)
Pt-4Breakthrough Uranine
Flow path KA2563A S1 - KI0023B P6
0 100 200 300 400Elapsed time (h)
0
0.02
0.04
0.06
Conc
. (pp
m)
Pt-4Breakthrough RdWt #2
Flow path KI0025F02 P6 - KI0023B P6
Figure 3-12. Tracer breakthrough in KI0023B:P6 during PT-4. Note that the axis scales differbetween the plots.
The pumping was stopped on June 15th after a pumping period of 28 days. Theequipment was removed to Uppsala for cleaning and maintenance. No major equipmentfailure occurred during the test period.

36
Calculations of the tracer mass recovery (Table 3-9) show high mass recovery for twoof the flow paths (>75%). A rather large portion of the tail of the breakthrough then stillremains to be recovered, and it is therefore likely that the mass recovery would haveraised up close to 100%. The mass recovery of Rhodamine WT from KA2563A:S4 onlyreaches about 50%, i.e. only slightly higher than during ESV-1c (Andersson et al.,1998) although the discharge from KI0023B:P6 is 2.5 times higher (2.5 l/min comparedto 1.0 l/min during ESV-1c). Finally, the mass recovery of Uranine from structure #19in KA2563A:S1 is still less than 1% after 480 hours. It is likely that the flow path fromthe injection point to the sink is very long and complicated as several structures need tobe crossed.
No tracer breakthrough was found in KI0023B:P7 during the pumping period.
Table 3-9. Tracer mass recoveries from KI0023B:P6 during PT-4.
Inj # Section Structure Tracer MassRecovery
(%)
Samplingtime (h)
1 KA2563A:S4 20 Rhodamine WT 51 1692 KA2563A:S1 19 Uranine <1 4803 KI0025F02:P3 13, 21 Amino G Acid 75* 4574 KI0025F02:P6 22 Rhodamine WT 80* 311
* mass recovery likely to be close to 100% if sampling had been prolonged
3.7.3 Numerical modelling and analytical interpretation
The breakthrough curves from PT-4 were evaluated using the one-dimensionaladvection-dispersion model described in Section 2.4.3.
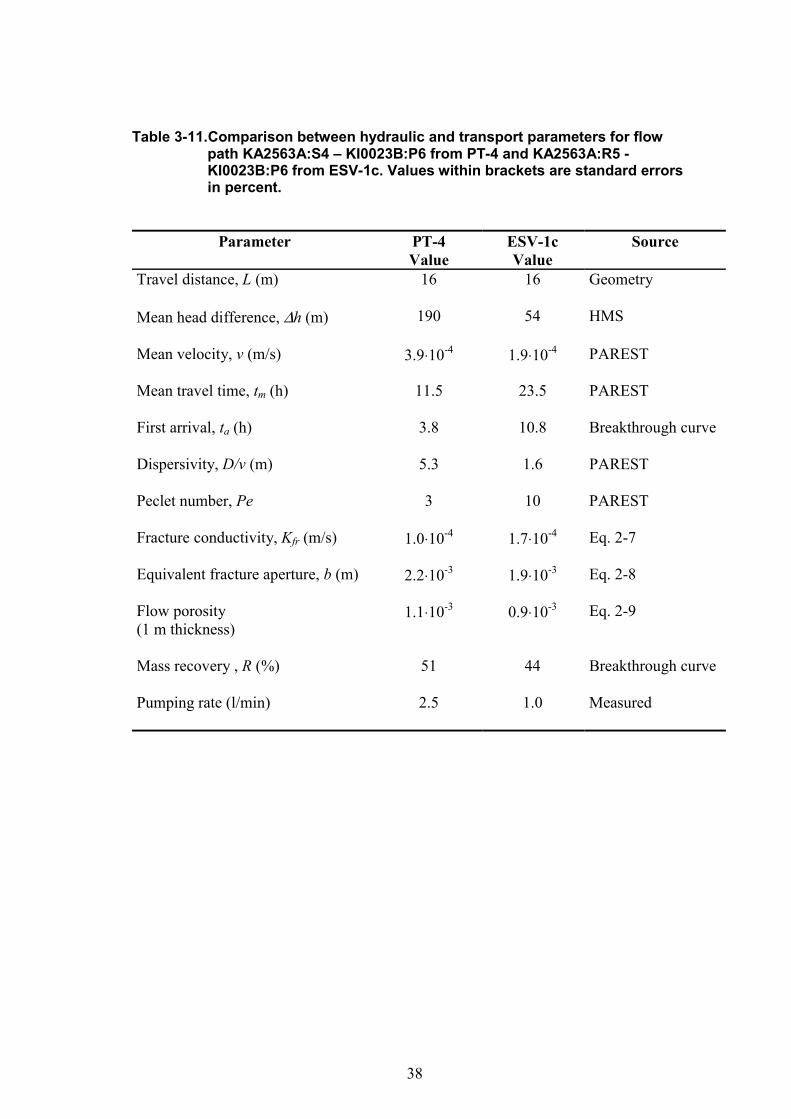
The transport parameters derived from the numerical modelling and the analyticalexpressions described in Section 2.4.3 are presented in Table 3-10. The parameters forthe flow path KA2563A:S4 → KI0023B:P6 from PT-4 are also compared to thoseobtained from the tracer test performed in the same flow path during ESV-1c, in April1998 (Andersson et al., 1998), cf. Table 3-11. Borehole KA2563A was re-instrumentedin March 1999 and the present borehole section KA2563A:S4 corresponds to theprevious section KA2563A:R5, both containing structure #20.
The best-fit runs for each tracer/flow path are presented in Figure 3-13. The modellingresulted in relatively good fits with quite low standard errors, 0.5-4 %. In general thepeak of the breakthrough curves is quite well fitted while the tail part is worse.
Numerical modelling for the flow path KA2563A:S1 → KI0023B:P6 has not been madesince the tracer mass recovery of Uranine was very low and no complete breakthroughcurve was obtained.

37
Table 3-10.Summary of hydraulic and transport parameters for the flow pathsKA2563A:S4 – KI0023B:P6, KI0025F02:P3 - KI0023B:P6 andKI0025F02:P6 - KI0023B:P6 in PT-4. Values within brackets arestandard errors in percent.
Parameter KA2563A:S4-KI0023B:P6
Value
KI0025F02:P3-KI0023B:P6
Value
KI0025F02:P6-KI0023B:P6
Value
Source
Travel distance, L(m)
16 36 18 Geometry
Mean headdifference, ∆h (m)
190 214.5 203.5 HMS
Mean velocity, v(m/s)
3.9⋅10-4 (1) 7.1⋅10-5 (0.5) 4.5⋅10-5 (0.5) PAREST
Mean travel time, tm(h)
11.5 (1) 140.3 (0.5) 98.3 (0.5) PAREST
First arrival, ta(h)
4 85 19 Breakthroughcurve
Dispersivity, D/v (m) 5.3 (3.6) 2.9 (4.1) 5.0 (1) PAREST
Peclet number, Pe 3.0 12.6 3.6 PAREST
Fracture conductivity,Kfr (m/s)
9.8⋅10-5 4.1⋅10-5 1.4⋅10-5 Eq. 2-7
Equivalent fractureaperture, b (m)
2.2⋅10-3 5.2⋅10-3 1.4⋅10-2 Eq. 2-8
Flow porosity(1 m thickness)
1.1⋅10-3 2.7⋅10-3 8.0⋅10-3 Eq. 2-9
Mass recovery, R (%) 51 75 80 Breakthroughcurve
38
Table 3-11.Comparison between hydraulic and transport parameters for flowpath KA2563A:S4 – KI0023B:P6 from PT-4 and KA2563A:R5 -KI0023B:P6 from ESV-1c. Values within brackets are standard errorsin percent.
Parameter PT-4Value
ESV-1cValue
Source
Travel distance, L (m) 16 16 Geometry
Mean head difference, ∆h (m) 190 54 HMS
Mean velocity, v (m/s) 3.9⋅10-4 1.9⋅10-4 PAREST
Mean travel time, tm (h) 11.5 23.5 PAREST
First arrival, ta (h) 3.8 10.8 Breakthrough curve
Dispersivity, D/v (m) 5.3 1.6 PAREST
Peclet number, Pe 3 10 PAREST
Fracture conductivity, Kfr (m/s) 1.0⋅10-4 1.7⋅10-4 Eq. 2-7
Equivalent fracture aperture, b (m) 2.2⋅10-3 1.9⋅10-3 Eq. 2-8
Flow porosity(1 m thickness)
1.1⋅10-3 0.9⋅10-3 Eq. 2-9
Mass recovery , R (%) 51 44 Breakthrough curve
Pumping rate (l/min) 2.5 1.0 Measured

39
0 40 80 120 160 200Elapsed time (h)
0
0.04
0.08
0.12
Con
c. (p
pm)
MeasuredSimulated
Pt-4Breakthrough RdWt #1
Flow path KA2563 S4 - KI0023B P6
0 100 200 300 400
Elapsed time (h)
0
0.02
0.04
0.06
Conc
. (pp
m)
MeasuredSimulated
Pt-4Breakthrough RdWt #2
Flow path KI0025F02 P6 - KI0023B P6
0 100 200 300 400 500Elapsed time (h)
0
0.1
0.2
0.3
0.4
Con
c. (p
pm)
MeasuredSimulated
Pt-4Breakthrough Amino-G Acid
Flow path KI0025F02 P3 - KI0023B P6
Figure 3-13. Comparison between measured and simulated tracer breakthrough in KI0023B:P6during PT-4, cf. Table 3-10 for evaluated parameters. Note that the axis scalesdiffer between the plots.

40

41
4 Conclusions and recommendations forfuture tests
4.1 Connectivity and structural model
The three pre-tests PT-1, PT-2 and PT-3 generally confirm the March´99 structuralmodel. In most cases, the flow and pressure responses give the same indication ofconnectivity, i.e. a good (high and fast) pressure response and a good flow response(increase). However, there are exceptions in each test where a low and slow pressureresponse is obtained together with a good flow response, or the opposite. These resultsimply that pressure responses alone cannot be used for assessment of transportconnectivity. These particular cases are discussed below.
PT-1, performed by pumping structure #13 (KI0023B:P4), shows good flow andpressure responses both within the pumped structure as well as in structures #20 and#21. The only exception being section KI0025F02:P3 where a very good flow responseand a slow pressure response is obtained. One possible explanation for this may be thatthe section is located close to a constant head boundary, which also is indicated by thequalitative interpretation of the pressure response. It should also be noted that thissection is intersected both by structures #13 and #21, thus creating a short-circuitbetween the two structures in the particular section.
PT-2 (and PT-4), performed by pumping structure #21 (KI0023B:P6), gives good flowand pressure responses in structures #6, 13, 20, 21 and #22. The only unexpectedresponse is the significant flow response in structure #19 (KA2563A:S1) which has arelatively low and slow pressure response. Thus, connectivity between structures #21and #19 clearly exists. This was also confirmed by the tracer breakthrough obtainedduring PT-4. Two sections containing structures not identified in the March´99 model,KI0023B:P5 and KI0025F02:P7, also show good flow and pressure responses. Possiblecandidate structures need to be assessed from BIPS measurements and flow logs.
The third test, PT-3, performed by pumping structure #20 (KI0025F02:P5), has analmost identical pressure response pattern as seen in PT-2. Both pressure and flowresponses are stronger due to the stronger sink but the pattern is identical. This indicatesthat KI0025F02 may be used as sink in future tracer tests.
4.2 Hydraulic parameters
The quantitative analysis of the most prominent pressure responses generally showspredominant radial flow with a slight leakage by the end of the test. Analysis ofresponses in the bounding structures #6, 7 and 19 shows effects of constant headboundaries. In PT-3, indications of no flow boundaries are evident in all responses. This

42
may indicate a limited extent of structure #20 possibly ending to the east of boreholeKI0025F and that the unknown structure in KI0025F02:P7 also is ended to the west ofKI0025F02.
The transmissivity and diffussivity values determined are generally rather uniform forstructure #20 (T=7-12⋅10-7 m2/s, T/S=3-10 m2/s). They are also consistent with earlierinterpretations (Andersson et al., 1998 and Adams et al., in prep). Structure #21, onlyinterpreted in KI0023B:P6 and KI0025F02:P3, gives a similar point value inKI0023B:P6 whereas the low and slow response in KI0025F02:P3 gives an indicationof a higher transmissivity (T=6-10⋅10-6 m2/s) in that part. The responses in the boundingstructures #6, 7 and 19 generally yield about one order of magnitude highertransmissivity values than estimated for structures #13, 20, 21 and 22.
4.3 Transport parameters
The tracer dilution tests in 14 different sections showed that the “natural” flow variesquite a lot within the Block Scale rock volume. An extremely high flow rate (10 l/h)was measured in KI0023B:P7 where a short-circuit between structures #6 and #20exists. The flow rates in the other measured sections typically were in the range 1-200ml/h.
Based on the measured flow rates, the Darcy velocity was estimated as described inChapter 2.4.2. The Darcy velocities determined together with estimates of the hydraulicconductivity, presented in Table 4-1, where used to calculate the hydraulic gradient, I.The estimated gradients are typically in the order of 0.3-3 m/m. The exceptions are afew sections connected to structures #20 and #21 having a lower gradient and anextremely high gradient in the short-circuit section KI0023B:P7.
The tracer test performed by pumping in structure #21 (KI0023B:P6) resulted in tracerbreakthrough from all four injection points, KA2563A:R1 (structure #19), KA2563A:S4(structure #20), KI0025F02:P3 (structures #13 and 21) and KI0025F02:P6 (structure#22). The tests cover Euclidean distances ranging between 16 to 36 m which probablyare longer in reality.
Very high mass recovery was obtained for the injections in KI0025F03:P3 and P6whereas the short flow path from KA2563A:S4 only gave 50% mass recovery whichshould be compared to 44% obtained in a previous test (Andersson et al., 1998). Themass loss is attributed to the boundary conditions (intersections with other structureshaving lower hydraulic head).
The numerical modelling using a simple one-dimensional advection-dispersion modelwas not able to fit the breakthrough curves very well. In addition, dispersivity valueswhere unrealistically high for a single path model for two of the modelled flow paths.

43
Usage of a multiple-path model would improve the fits considerably although this couldnot be done within the framework of this evaluation. The transport parameterscalculated based on the mean travel times; fracture conductivity, equivalent fractureaperture and flow porosity, show somewhat different values, where the flow path fromKI0025F02:P6 shows a slow transport, indicating high flow porosity (and largeequivalent aperture) whereas the fast flow path from KA2563A:S4 has about one orderof magnitude lower flow porosity (and equivalent aperture).
Section Structure Measuredflow
(ml/h)
Darcyvelocity
(m/s)
Hydrauliccond.(m/s)*
Hydr.Gradient(m/m)
Test
KA2563A:S1 19 115 7.1⋅10-8 8.1⋅10-8 0.9 PT-2
KA2563A:S3 13 14 1.7⋅10-8 1.6⋅10-8 1.1 PT-2
KA2563A:S4 20 130 1.1⋅10-7 1.3⋅10-7 0.9 PT-2
KI0023B:P2 19 14 1.8⋅10-8 6.8⋅10-8 0.3 PT-3
KI0023B:P4 13 18 2.3⋅10-8 1.9⋅10-8 1.2 PT-2
KI0023B:P5 ? 2 3.4⋅10-11 1.6⋅10-9 0.02 PT-2
KI0023B:P6 21 3 5.5⋅10-9 1.3⋅10-7 0.04 PT-3
KI0023B:P7 6,20 10000 6.9⋅10-7 3.8⋅10-9 180 PT-2
KI0025F:R4 20 3 2.7⋅10-9 1.8⋅10-8 0.15 PT-2PT-3
KI0025F02:P3 13,21 25 7.8⋅10-9 6.7⋅10-9 1.2 PT-2
KI0025F02:P5 20 50 2.3⋅10-8 2.8⋅10-7 0.08 PT-1PT-2
KI0025F02:P6 22 200 3.0⋅10-8 2.4⋅10-8 1.2 PT-2
KI0025F02:P7 ? 7 1.8⋅10-9 1.2⋅10-9 1.5 PT-2
KI0025F02:P8 6 21 1.1⋅10-8 3.2⋅10-9 3.5 PT-2
*= determined from detailed flow logging
Table 4-1. Summary of measured flow rates, calculated Darcy velocities andhydraulic gradients from PT-1 to PT-4.

44
4.4 Optimisation of the borehole array
4.4.1 Re-mediation of KI0023B
The results of the tracer dilution tests in KI0023B:P7 clearly indicates that there is amajor short-circuit between structures #6 and #20 in the borehole section. The measured“natural” flow rate is in the order of 10 l/h in the direction from #20 to #6, i.e. towardsthe tunnel. This is also consistent with the hydraulic head measurements which indicatea 5-m head difference between the two structures. However, the tracer dilution tests andthe pre-PT-4 tests indicate that the gradient in P7 can be reversed by pumping in sectionP6.
This means that tracer tests may be performed with KI0023B:P6 used as a sink, whichalso is manifested by the results of PT-4. However, if another sink is used it may bemore difficult to control the head field and avoid tracers being lost. A brief study of thehead distribution during PT-3 (KI0025F02:P5 as sink) shows that the head in section P6is somewhat lower than in section P7 (about 20 kPa) during pumping. Thus, thegradient should still be directed towards P6. A different choice of sink than in PT-4would most probably require further pre-tests to assess the possibility of performingtracer tests.
Another uncertainty related to KI0023B is the unknown structure in section P5 which islocated in between structures #13 and #21. The results of PT-1 to PT-3 and the previoustest (Andersson et al., 1998) shows that section P5 is well connected to theneighbouring structures. This is a potentially interesting tracer injection point but theexact location is not known from the 5-m packer logging. This also implies that thepackers need to be re-arranged.
In summary, it is possible to perform tracer tests without re-mediation of KI0023B butthe consequences of choosing another sink than KI0023B:P6 need to be furtherexplored. The flowing structure in section P5 cannot be used as potential injection pointwithout removing and re-arranging the packer system.
4.4.2 Borehole KI0025F
The latest update of the structural model (March-99) by Hermanson (in prep) includes astructure (#22) that is currently located beneath the packer between section R4 and R3at 88.8 m borehole length. During flow logging in 5-m intervals (Gentzschein, 1997) aflow rate of 1.08 l/min was measured in the interval 87-92 m. Later, during the pressurebuild-up tests, a localisation of the flowing structure was made (Gentzschein &Morosini, 1998) where the main flow was located to the section 87.0-87.75 m.However, the detailed localisation was stopped at 88.75 m, i.e. very close to the #22intercept. The flow was also measured by Andersson & Wass (1998) who found a flowrate of 0.72 l/min at 42 bars pressure drop. The flow rates may be somewhat difficult tocompare as boundary conditions are different but, there is a possibility that the notedflow difference is associated with the interpreted structure #22.

45
One way of exploring this situation would be to simply push the entire instrumentationin KI0025F in two steps of one metre and measure the resulting flow. That means thatthe packers are moved from the original position at 86-88 m, involving only structure#20, to 87-89 m involving both structures, and finally to 88-90 m involving onlystructure #22. If #22 is located a short-term interference test should be done.
4.4.3 Borehole KI0025F02
The last update of the March-99 model also includes a dual intercept of structure #21and #13 in borehole section KI0025F02:P3. The structures are relatively well-separated(4 m) and are easily identified in the detailed POSIVA flow log. Based on the results ofthe tracer dilution tests and the tracer test during PT-4 it is clear that this section is veryinteresting for future tracer tests. A separation of the two structures would possiblyfurther increase the understanding of the structures and maybe also increase the numberof possible tracer injection points.
Another observation is that the “natural” flow rate measured in this section (25-40 ml/h)is relatively high in comparison with other structures with similar transmissivity. Thismay indicate that the short-circuit between the structures induces a gradient with anincreased flow rate as a result. However, it should be noted that the head differencebetween the structures probably is much less than in KI0023B:P7.
In summary, the instrumentation of KI0025F02 seems to be well optimised with theexception of the section mentioned above. It should also be noted that the structure at93.9 m (#13) has about one order of magnitude lower transmissivity than structure #21at 97.9 m. Thus, it is likely that the main part of the transport occurs in structure #21.The orientation of the two structures also indicates that they intersect not far from theborehole.
Based on the discussion above, a separation of the two structures in section P3 may notbe warranted in relation to what could be gained in terms of new injection points.
4.5 Need for a new borehole
The tracer tests performed during PT-4 and the dilution tests performed during PT-1 toPT-3 clearly shows that there are several potential tracer injection points in the currentarray. From this point of view there is a limited need for a new borehole. There are,however, a few arguments for drilling a new borehole. These are:
• The inter-distances between injection and sinks are rather long, from 16 metres andupwards in the current array. This may limit the number of possible pathways forinjection of sorbing tracers
• The borehole intercepts with the target structures line up more or less at the samedepth in the array. This means that anisotropy in the system cannot be studied

46

47
5 References
Adams, J., Andersson P., Meier P., in prep.: TRUE Block Scale Project. Preliminaryresults of selective pressure build-up tests in borehole KI0025F02. Äspö Hard RockLaboratory International Progress Report IPR-01-56.
Andersson, P., 1996: TRUE 1st stage tracer test programme. Experimental data andpreliminary evaluation of the TRUE-1 radially converging tracer test (RC-1). ÄspöHard Rock Laboratory Progress Report HRL-96-24.
Andersson, P., Ludvigson, J-E., Wass, E., 1998: TRUE Block Scale Project.Preliminary Characterisation Stage. Combined Interference Tests and Tracer Tests.Appendix volume. Evaluation plots and data sheets for interference test interpretation.Äspö Hard Rock Laboratory International Progress Report IPR-01-44.
Andersson P, Wass E, 1998: TRUE 1st stage tracer test programme. PreliminaryDesign Tests for tests with radioactive sorbing tracers (PDT-1, PDT-2, PDT-3).Experimental description and preliminary evaluation. Äspö Hard Rock LaboratoryProgress Report HRL-98-13.
Gentzschein, B., 1997: TRUE Block Scale Project. Detailed flow logging of coreborehole KA2563A.SKB Internal Report.
Gentzschein, B., Morosini, M., 1998: TRUE Block Scale Project. Selective pressurebuild-up tests in borehole KI0025F. Äspö Hard Rock Laboratory International ProgressReport IPR-01-45.
Gustafsson, E., Klockars, C-E., 1981: Studies of groundwater transport in fracturedcrystalline rock under controlled conditions using non-radioactive tracers. SwedishNuclear Fuel and Waste Management Company. SKBF/KBS Technical ReportTR 81-07
Hermanson, J., in prep.: TRUE Block Scale Project. Structural model March 1999,Based on borehole data from KI0025F02, KA3600F and KA3573A. SKB InternalReport.
Moye, D.G., 1967: Diamond drilling for foundation exploration. Civil Eng. Trans., Inst.Eng. Australia (Apr. 1967), 95-100.
Nordqvist, R., 1994: Documentation of some analytical flow and transport modelsimplemented for use with PAREST - Users manual. GEOSIGMA GRAP 94 006,Uppsala.
Ogata, A., Banks, R., 1961: A solution to the differential equation of longitudinaldispersion in porous media. U.S. Geol. Surv. Prof. Paper 411-A, Washington.

48

49
APPENDIX 1: Drawdown versus t/R2 plots for PT-1, PT-2 and PT-3

50

A:1

A:2

A:3