spatial and temporal differences in bulk atmospheric
TRANSCRIPT

Spatial and Temporal Differences in Atmospheric Deposition of Contaminants in the Green River Watershed Jenée Colton, Carly Greyell, Richard Jack Science Section, KC Water and Land Resources Division Science Seminar October 24, 2013

Study Objectives
Compare bulk atmospheric deposition rates in areas of different land use within the Green/Duwamish River Basin
To provide information to assist in understanding atmospheric sources to the Lower Duwamish Waterway
2

Bulk Atmospheric Deposition
Bulk = particles (dry) and rainfall (wet) Atmospheric Deposition = solid or liquid
that falls onto earth’s surface Atmospheric Deposition rate (flux) =
mass/unit area/time (µg/m2/day)
3

Study Design Site Land use
Duwamish Industrial & urban
Beacon Hill Regional urban, residential
South Park Suburban, industrial, residential
Kent downtown
Suburban & commercial (with rail)
Kent Senior Center
Suburban & commercial (without rail)
Enumclaw Rural
4

Study Design
Passive Sampler
photo
5
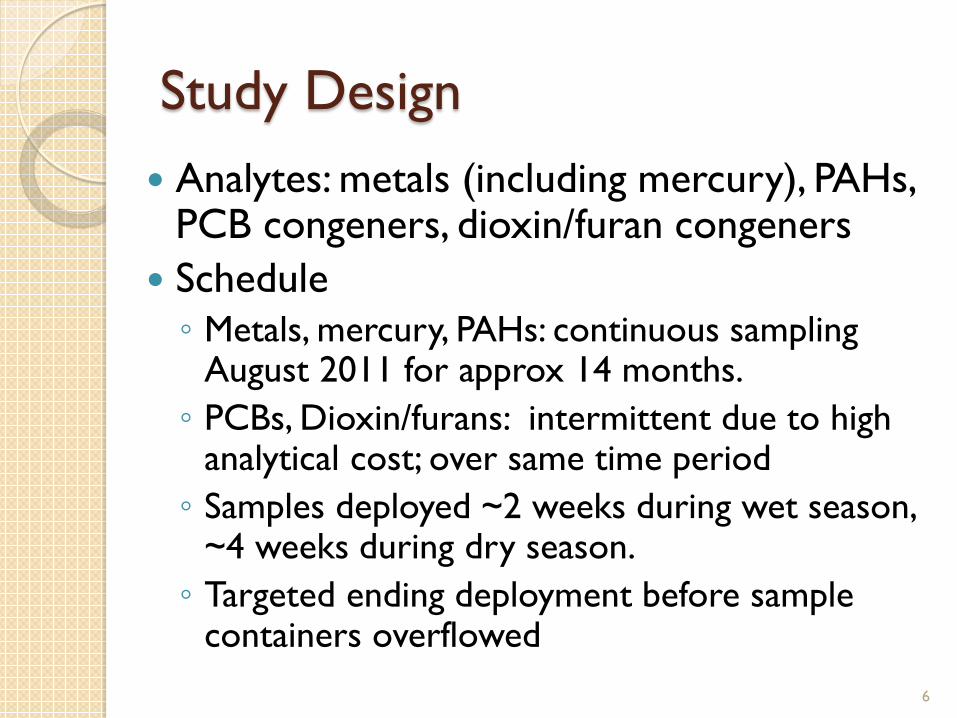
Study Design Analytes: metals (including mercury), PAHs,
PCB congeners, dioxin/furan congeners Schedule ◦ Metals, mercury, PAHs: continuous sampling
August 2011 for approx 14 months. ◦ PCBs, Dioxin/furans: intermittent due to high
analytical cost; over same time period ◦ Samples deployed ~2 weeks during wet season,
~4 weeks during dry season. ◦ Targeted ending deployment before sample
containers overflowed 6

Study Design Change
Intermittent results showed high dioxins/furans at Kent station
Proximal location to rail line suspicious Added 2nd station for parallel sampling in
summer 2012
7
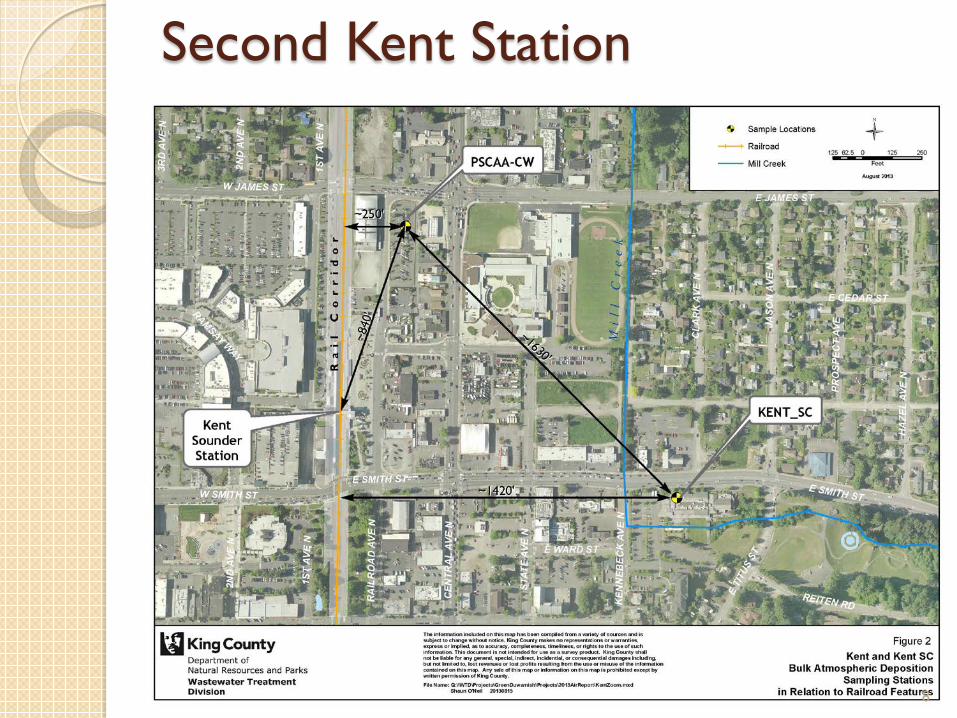
Second Kent Station
8
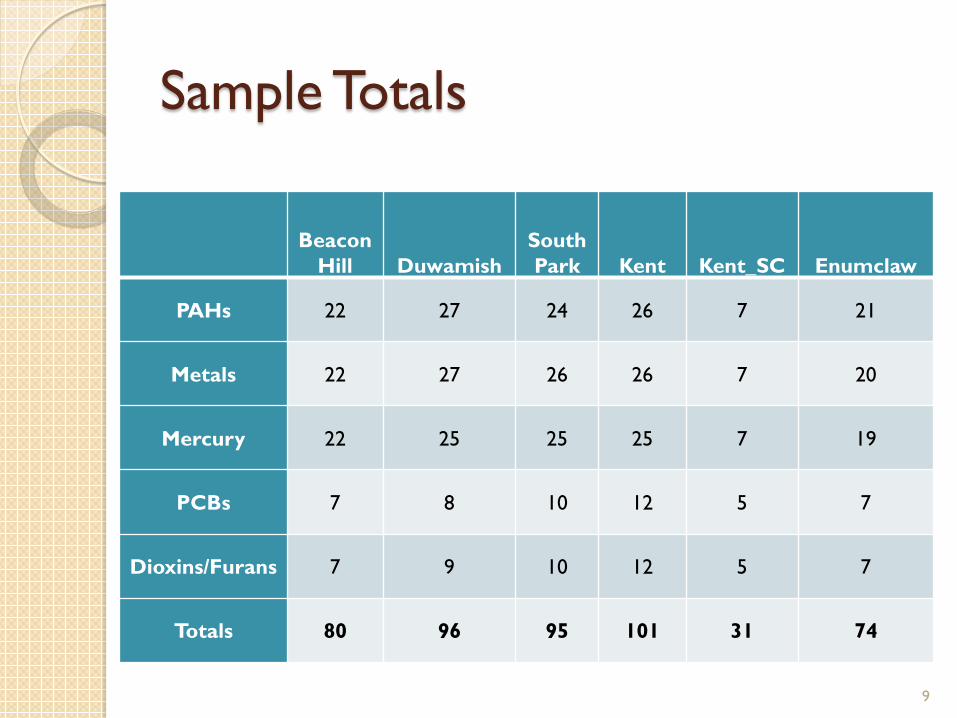
Sample Totals
Beacon
Hill Duwamish South Park Kent Kent_SC Enumclaw
PAHs 22 27 24 26 7 21
Metals 22 27 26 26 7 20
Mercury 22 25 25 25 7 19
PCBs 7 8 10 12 5 7
Dioxins/Furans 7 9 10 12 5 7
Totals 80 96 95 101 31 74
9

Temporal Differences
10

Temporal Trends
Nonparametric testing determined that fluxes were significantly higher (p<0.05) in the dry period (June through September) for all metals except cadmium, mercury and silver.
11

Spatial Trends – Metals: Copper
12

Spatial Trends – Metals: Arsenic
13

Spatial Trends - HPAHs
14
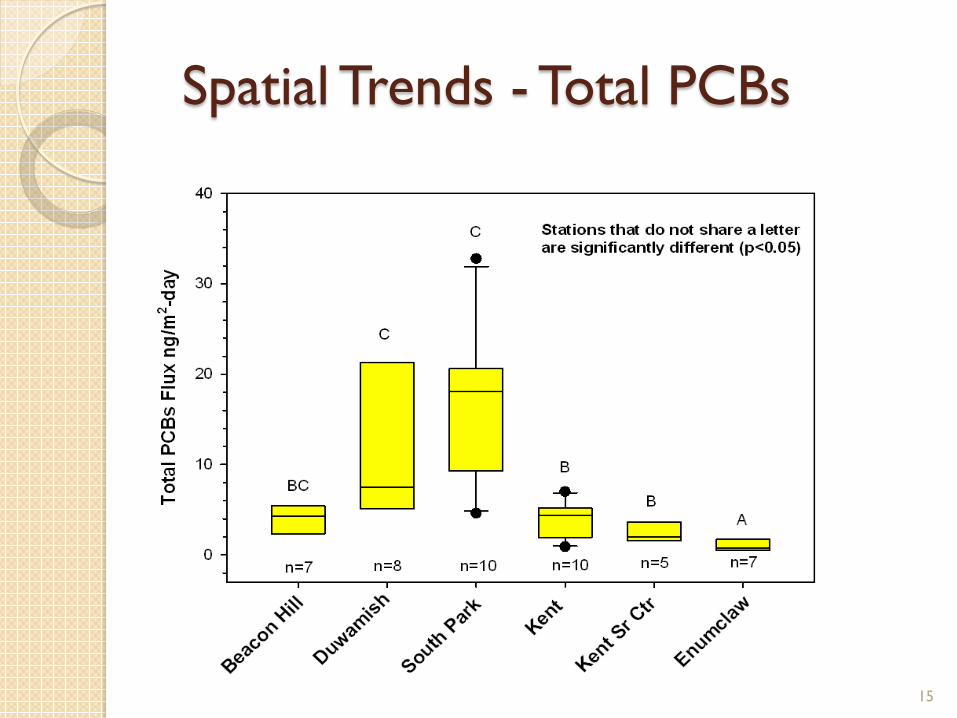
Spatial Trends - Total PCBs
15
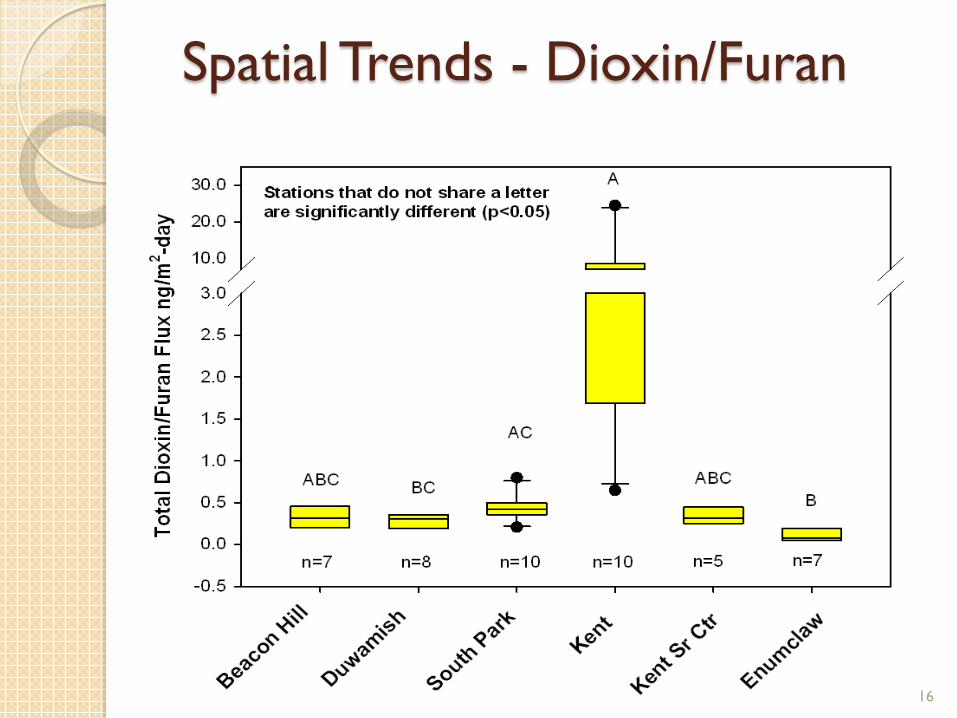
Spatial Trends - Dioxin/Furan
16

Small Particle Concentrations (Data from PSCAA)
Beacon Hill South Park 17
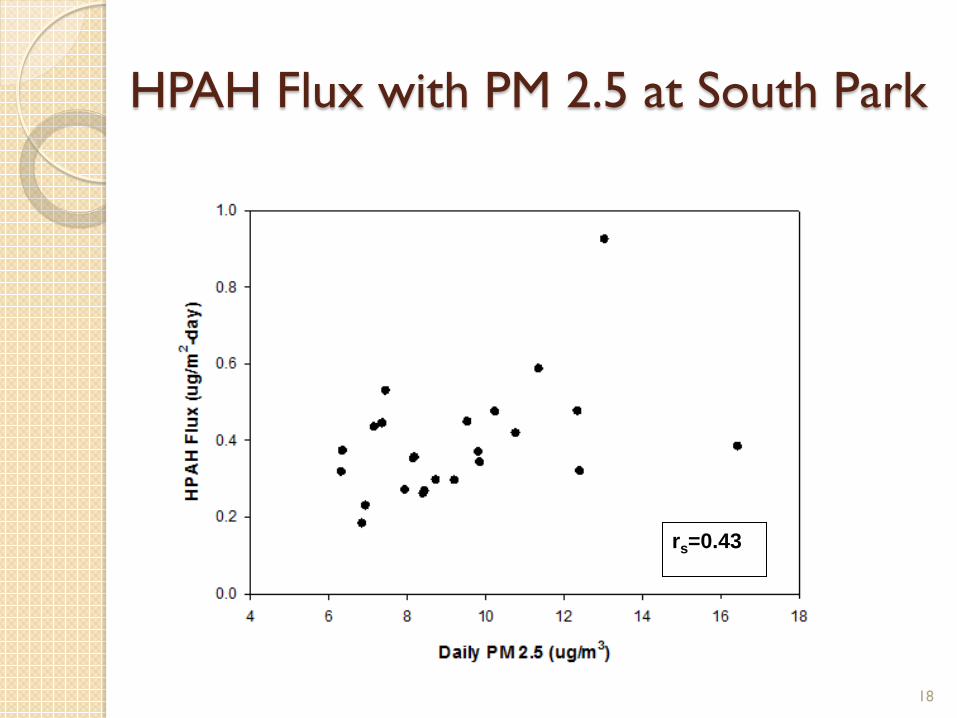
HPAH Flux with PM 2.5 at South Park
rs=0.43
18

Findings Metals and organics fluxes relate to degree
of urbanization Metals and organic fluxes at Duwamish or
South Park often highest, Enumclaw lowest Microscale effects seen in dioxins and
HPAHs at Kent due to local source PCB fluxes highest at Duwamish and South
Park; South Park were >2X higher than Duwamish
Metals fluxes significantly higher in the dry season and decreased during early wet season.
19
Bulk Air Deposition Study Acknowledgements: ◦ KC Field Sciences Unit: Bob Kruger, Jim Devereaux,
Ben Budka ◦ KC Environmental Lab: Fritz Grothkopp, Diane
McElhany, Susannah Rowles & Michael Muramoto ◦ PSCAA: Adam Petrusky ◦ Ecology: John Williamson ◦ South Park Community Center: Bill Pease ◦ KC Science Section: Scott Mickelson, Debra Williston ◦ KC Industrial Waste: Bruce Tiffany ◦ KC Wastewater Treatment Division: Jeff Stern ◦ AXYS Analytical
20