spatial augmented reality a tool for 3d data...
TRANSCRIPT
Spatial Augmented Reality - A Tool for 3D Data Visualization
Bruce H. Thomas1, Michael Marner1, Ross T. Smith1, Neven Abdelaziz Mohamed Elsayed1, Stewart Von Itzstein1, Karsten Klein2, Matt Adcock1,3, Peter Eades4, Andrew Irlitti1, Joanne Zucco1, Timothy Simon1, James
Baumeister1, and Timothy Suthers1 University of South Australia1, Monash University2, CSIRO3, and University of Sydney4
ABSTRACT This paper presents a proposal for the use of Spatial Augmented Reality as a tool for 3D data visualizations. The use of traditional display technologies such as LCD monitors provides a fish tank metaphor for the user, i.e. the information is behind a plane of glass. The use of VR technologies allows the user to be immersed in the 3D volume and remove this fish tank problem, but can limit the set of techniques that allow users to interact with spatial data. Spatial Augmented Reality employed in conjunction with a high-resolution monitor provides an elegant blend of spatial reasoning, tangible interaction, and detailed information viewing. This paper purposes a range of usages for SAR in 3D visualizations.
Keywords: Spatial Augmented Reality, 3D Visualization, Spatial User Interaction.
Index Terms:!• Human-centered computing ~Information visual-ization • Human-centered computing ~Visualization theory, con-cepts and paradigms • Computing methodologies ~Mixed / aug-mented reality
1 INTRODUCTION Spatial Augmented Reality (SAR) [1] enhances the visual aspects of physical objects, allowing users to better understand the virtual content. The users not only view the digital information but also gain a tactile understanding through touching the physical object.
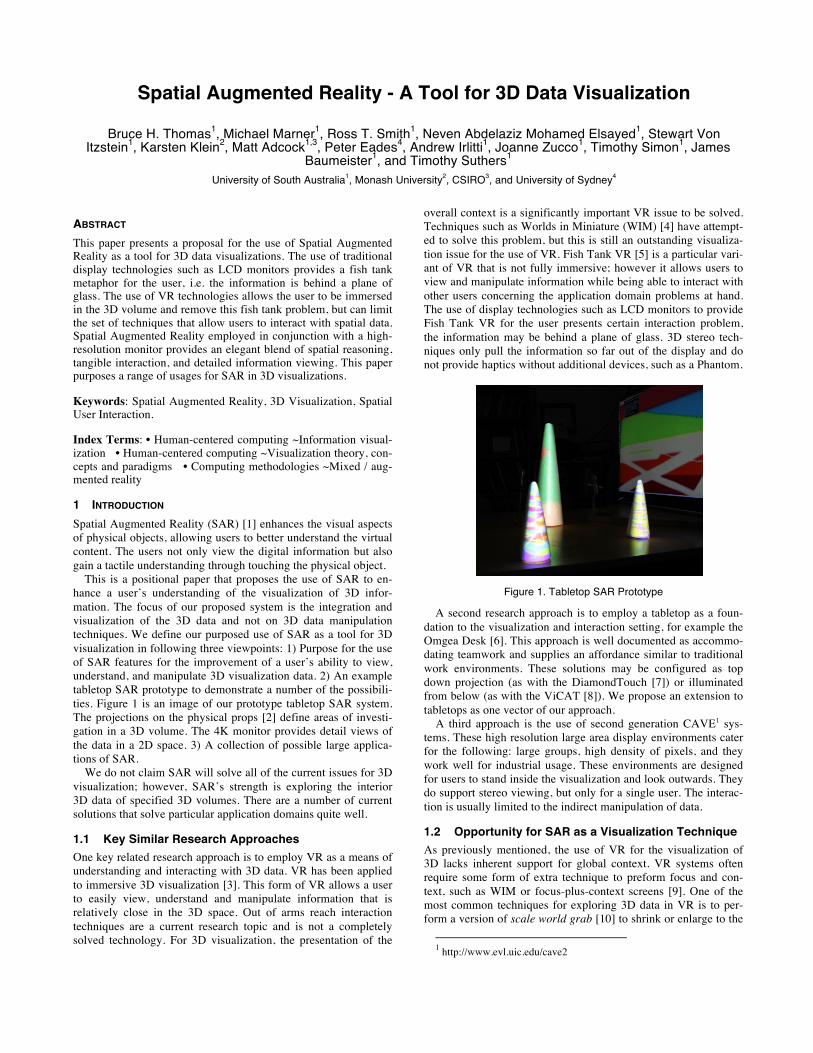
This is a positional paper that proposes the use of SAR to en-hance a user’s understanding of the visualization of 3D infor-mation. The focus of our proposed system is the integration and visualization of the 3D data and not on 3D data manipulation techniques. We define our purposed use of SAR as a tool for 3D visualization in following three viewpoints: 1) Purpose for the use of SAR features for the improvement of a user’s ability to view, understand, and manipulate 3D visualization data. 2) An example tabletop SAR prototype to demonstrate a number of the possibili-ties. Figure 1 is an image of our prototype tabletop SAR system. The projections on the physical props [2] define areas of investi-gation in a 3D volume. The 4K monitor provides detail views of the data in a 2D space. 3) A collection of possible large applica-tions of SAR.
We do not claim SAR will solve all of the current issues for 3D visualization; however, SAR’s strength is exploring the interior 3D data of specified 3D volumes. There are a number of current solutions that solve particular application domains quite well.
1.1 Key Similar Research Approaches One key related research approach is to employ VR as a means of understanding and interacting with 3D data. VR has been applied to immersive 3D visualization [3]. This form of VR allows a user to easily view, understand and manipulate information that is relatively close in the 3D space. Out of arms reach interaction techniques are a current research topic and is not a completely solved technology. For 3D visualization, the presentation of the
overall context is a significantly important VR issue to be solved. Techniques such as Worlds in Miniature (WIM) [4] have attempt-ed to solve this problem, but this is still an outstanding visualiza-tion issue for the use of VR. Fish Tank VR [5] is a particular vari-ant of VR that is not fully immersive; however it allows users to view and manipulate information while being able to interact with other users concerning the application domain problems at hand. The use of display technologies such as LCD monitors to provide Fish Tank VR for the user presents certain interaction problem, the information may be behind a plane of glass. 3D stereo tech-niques only pull the information so far out of the display and do not provide haptics without additional devices, such as a Phantom.
Figure 1. Tabletop SAR Prototype
A second research approach is to employ a tabletop as a foun-dation to the visualization and interaction setting, for example the Omgea Desk [6]. This approach is well documented as accommo-dating teamwork and supplies an affordance similar to traditional work environments. These solutions may be configured as top down projection (as with the DiamondTouch [7]) or illuminated from below (as with the ViCAT [8]). We propose an extension to tabletops as one vector of our approach.
A third approach is the use of second generation CAVE1 sys-tems. These high resolution large area display environments cater for the following: large groups, high density of pixels, and they work well for industrial usage. These environments are designed for users to stand inside the visualization and look outwards. They do support stereo viewing, but only for a single user. The interac-tion is usually limited to the indirect manipulation of data.
1.2 Opportunity for SAR as a Visualization Technique As previously mentioned, the use of VR for the visualization of 3D lacks inherent support for global context. VR systems often require some form of extra technique to preform focus and con-text, such as WIM or focus-plus-context screens [9]. One of the most common techniques for exploring 3D data in VR is to per-form a version of scale world grab [10] to shrink or enlarge to the
1 http://www.evl.uic.edu/cave2
user’s perspective to fit the working scale of the virtual world. The actions of scale world grab place a large cognitive load on the user to maintain the context of the 3D data they are viewing.
We envision SAR technologies being deployed in conjunction with traditional display technologies to provide an alternative method for navigating through a volume of 3D data and maintain-ing the global context. Within such a scenario the user is able to hold a 6DOF tracked physical prop and view 3D visualization data projected onto the prop. Our vision is similar to the Paper-Lens [11] approach, but the objects are full 3D physical shapes. The scale of the physical props ranges from hand held scaled props employed on a table to free standing projection props in a room size setting, such as the life-sized SAR dioramas employed by Low et al. [12]. The user is able to walk unencumbered in the environment, and move the physical props that slice (cut) into the 3D data volume. The context is provided through a combination of projections on working horizontal surface, the physical place-ment of the prop in a working volume, and traditional displays.
The main benefits of this approach are the ability for users to easily navigate and comprehend large 3D visualizations. A dis-tinct feature of physical props is their static state, when placed on a solid surface; they naturally remain in their placed position. In the case of a tabletop setting, tracked props are moved by the user through the 3D data volume and left in locations where the 3D data is of interest. When deployed in room sized SAR environ-ments, the users are still able to move small props, and they could also be able to move larger freestanding objects like wall seg-ments onto which graphics can be projected.
SAR may be applied to a range of 3D data visualization prob-lems: information visualization, scientific visualization, and visual analytics. The data may be volumetric in nature as in 3D data samples or the data may be derived through calculations. While the example applications in this proposal are rectangular in shape, this is not a requirement.
Our research team is interested in 1) large scale heterogeneous data sets and 2) extremely large graphs. The examples shown in this proposal would be considered closer to scientific visualiza-tion, but we also wish to apply this technology to the representa-tion of information in a visual analytics context. Using large high resolution projection spaces not only allows us to immerse the analyst in the visualization, but also to combine different visuali-zation modes in efficient hybrid 2D and 3D visualizations. When projection on physical props can be used, the props themselves and the shape and position can be used to represent known static domain knowledge, giving the user an environment that they are familiar with for easy orientation and navigation. Data can then be dynamically projected onto the props during exploratory analysis.
1.3 Structure of the Paper Following the introduction we discuss related works in 3D visual-izations, spatial augmented reality and visualization technologies enhanced with augmented reality. We then propose a set of SAR techniques for use with 3D visualizations and a set of example applications. Finally we discuss future directions and finish with concluding remarks.
2 BACKGROUND
2.1 3D Visualization Historically visualization has primarily been displayed on small planar (2D) screens. If the visualization was multidimensional then mechanisms to flatten the representation were necessary to project it on two dimensions. Visualization and visual analysis perform significant functions in exploring, analyzing, and present-
ing scientific data, and the data and model applications are multi-faceted (the data is regularly spatiotemporal and multivariate) [13]. For instance graph visualization [14] attempts to project 3D information into a 2D form that is comprehendible by the observ-er. Inherently 3D data does not map well to 2D displays due to occlusion caused by the reduced display space combined with overlapping data. All of these approaches exert a cognitive load on the producer of the representation (reduction to two dimen-sions) and on the consumer (unpacking from two dimensions). Whilst this work in 2D representations has made improvements in the visualization of smaller data sets the user is still relegated to an external observer peering through a small window.
With the advances in computing technology, dynamic 3D visu-alizations are common, and users are able to immerse themselves in the 3D content. The users can also manipulate the rendering of the scene dynamically allowing the user to shift their perspective or annotate additional information to the scene. For example use of volumetric lenses to overlay different datasets onto 3D scien-tific visualisations [15], to allows users to see a representation of topological information for a given geographic area. The users are able to move the 3D map around interacting with the view of the terrain so as to change their perspective. These dynamic visualisa-tions mean the viewer can move their point of view within the 3D environment, acquire more information via the lenses and gaining a deeper insight into the data.
2.2 Spatial Augmented Reality SAR enhances the physical world with perspectively correct com-puter generated graphics using digital projectors [16]. SAR re-quires physical surfaces to project onto, consisting of any objects in the environments that are of interest to the user; projections are not limited to walls or purpose built screens. Although graphics are typically projected on the object’s surface, these projections may be depicted above the surface [17] or below the surface [18].
SAR allows users to physically touch the virtual information. The surfaces provide passive haptic feedback and all stereoscopic depth cues are naturally provided by the physical substrate. Previ-ous virtual reality research has shown that the ability to touch virtual objects and information enhances user experience, and can improve users’ performance [19]. As SAR places computer gen-erated information directly onto objects in the real world, groups can view and interact with the system. This makes SAR an ideal choice for collaborative tasks.
2.3 Visualization Technologies Enhanced with AR AR has been employed to support a number of different visualiza-tion tasks. In particular AR has supported visualization tasks by complexity reduction, layout optimization, and interaction tech-niques [20]. Complexity reduction techniques can reduce the amount of information needed to be represented on the AR dis-plays. Data filtering is considered to be a key approach used for complexity reduction, such as filtering the data based on location [21], user profile [22] or instruction ordering [23].
Layout optimization techniques are used to manage the display layout, to enhance the information understanding and avoid clut-tering. Some layout optimization techniques work on enhancing the virtual object appearance for better understanding. Bell et al. investigated layout arrangement approaches for multiple media types [24], the main advantage of this approach is that it used information filtering techniques combined with the layout optimi-zation techniques. To improve a user’s ability to understand the AR annotations, there have been a number of investigations on the
enhancement of the visual presentation by using different drawing styles, intensities, and opacities [21].
Interactions are a main approach used to solve the AR display space limitation. Typically the overview is presented first, then interaction is used to explore details on demand. Interaction has been proposed as a solution to visualize the relationships (links) between the information. Hollerer et al. proposed interactive visu-alization for hypermedia [25]. This approach uses a tracked see-through head worn display (HWD) to overlay 3D graphics, imag-es, and audio. Hollerer et al.’s system shows virtual flags aug-mented on the physical scene. These flags indicate an existence of information in its relative location. The user can explore this in-formation according to their interest (first overview, then Data-on-Demand). Their techniques were tilting, lifting, and shifting. Slay et al. [20] employed ARToolkit as a means to view and interact with 3D graph structures. Additional interaction tools were devel-oped for the selection and manipulation of graph nodes graph.
2.4 Tabletop Approaches There have been a number of investigations into the use of tab-letops to enhance the visualization process. As previously men-tioned, the two investigations closest to our investigation are Slice WIM and PaperLens, and these are described in detail.
Coffey et al.’s Slice WIM [26] system is designed to support scientific volume data with a novel context and focus technique for linking 2D and 3D data displays within the VR environment. Their system consists of two display technologies. The first is a semi-immersive VR system enabled with a large head tracked stereoscopic display, and the second display is a tabletop touch screen for enhanced interaction. This tabletop display supports a shadow metaphor for manipulating 3D objects positioned above the table. Coffey et al. noted tabletop touch interactions naturally support collaboration. The authors introduce a solution in the form of a multi-surface hardware configuration that allows for viewing an unobstructed object positioned above the table and touching the object’s shadow for interaction. Slice WIM provides a miniature 3D copy of the world that appears to float above the table, and this miniature serves together as a reference and an interaction space.
Spindler, Stellmach, and Dachselt’s PaperLens [11] approach employs a 6DOF tracked planar surface (a piece of cardboard) above a passive table with a downward projector above the table. The projector displays information directly on the table and planar surface. The tracked planner surface slices a polygon object into the volume data area above the table. They defined four classes of different exploration information spaces: volumetric, layered, zoomable, and temporal. The volumetric information space is described as a set of 3D samples or voxels. Spindler, Büschel, and Dachselt [27] extended the PaperLens approach in a number of ways: the addition of head tracking for enhanced Fish Tank VR viewing into the hand held planar surfaces, support of multiple users, and enhanced user interaction with the virtual objects in the scene. With the addition of motion parallax for Fish Tank VR, their new approach greatly improved the concept of a virtual win-dow into the virtual world.
Broecker et al. [28] applied view dependent rendering tech-niques to SAR, and for single user viewing, SAR could support all of the above approaches. Dalsgaard and Halskov [29] explored the use of top down projectors for SAR on shapes placed on a rear projected table. One use was for urban planning to add details to physical cubes (buildings) and cylinders (UI controls) to produce a tangible system. A second application was to enhance a blue-
print viewing with a perpendicular rectangular surface to expose the view of the CAD model at that position on the blueprint.
3 BENEFITS OF SAR 3D VISUALIZATION The very nature of SAR allows the user natural views of projected information onto physical substrates. Our concept is the 3D in-formation is contained in a virtual volume2 that the user is able to move conveniently through, see Figure 2. Physical props act as a projection substrates to allow the user to probe 3D data at that location. With multiple projectors, the projection substrates are draped with digital information from all sides. This form of tech-nology forms a number of advantages for 3D visualization, and these are as follows: 1) Natural proprioception, 2) Tangible, 3) Collaboration, 4) Non-planar project surfaces, 5) Scales up to larger volumes, and 5) Scales up to multiple users and props.
SAR naturally leverages the power of a user’s sense of proprio-ception [10]. Users operate in a SAR environment in an unen-cumbered manner. Because the virtual information is projected directly onto the physical objects, users are able to view them from different angles by physically walking around them. The users are also able to pick up the physical objects; they are able to move and rotate the objects to view the objects’ different faces. While immersive VR systems support similar interactions, the use of a HWD or enclosure in a CAVE environment does not support this in as natural a fashion, as this technology has a low social weight [30]. The affordance of the physical props as projection substrates is far superior in a SAR environment, as the projections are directly on the props themselves.
The tangible nature of the physical props provides the users with an easy to understand method of exploring the data [31]. The ease of moving a physical object underpins the use of tangibles, as there is no training to understand that physically moving an object locates that object to a new position and orientation. There is the limitation of not being able to scale the objects. SAR technology inherently supports the ability to project perspectively correctly information onto the physical objects. The shape of the object provides a clear understanding of what is going to be sliced out the 3D data volume. 3D printing allows most hand held sized objects to be produced and incorporated into the SAR system.
The projected information may be viewed by multiple people simultaneously, as the physical props are viewable from all par-ties. This enables simultaneous collaborative decision making between several people with different views on the problem at hand. The movement of physical object may be performed in par-allel between multiple users. A large number (thousands) of phys-ical objects may be added to the viewing area.
As previously mentioned, SAR supports the projection onto non-planar surfaces of a physical object. This is a key attribute that enables SAR to perform visualization tasks differently to other techniques, including previous projection techniques. The shape of the physical object defines what region will be visual-ized; therefore a sphere will slice out a sphere shaped visualiza-tion volume. We envision a number of different sizes and shapes of physical objects to be projected onto; providing the users with a large range of tools to explore the 3D visualization space.
SAR can accommodate a range of different physical sizes and scales concerning the 3D volume to be visualized. We envision a room size configuration to accommodate physically large visuali-zation surfaces. This will facilitate larger groups for collaboration and complex multifaceted data. Imagine: instead of moving a hand held cube through the 3D data volume, the user slides wall
2 Similar to the PaperLens’ volumetric information
size projection surfaces to different positions and orientations. As with the hand held props, multiple projection surfaces may be employed simultaneously and they may be of various shapes and sizes. Large Styrofoam white blocks would make suitable projec-tion surfaces, as they are rigid and light weight enough to serve the proper purpose.
As noted in a number of the benefits described above, we envi-sion the use of SAR to accommodate different sizes of user groups and number of physical props. From a technology point of view, the only limiting factor is the size of the space and 6DOF tracking solutions deployed. Modern 6DOF tracking systems can easily handle this scaling problem; for example the OptiTrack3 system supports up to 2000 markers. These tracking systems pro-vide both 6DOF tracking information and unique identification of the tracked physical prop.
4 EXAMINATION OF TABLETOP SAR FOR 3D VISUALIZATIONS
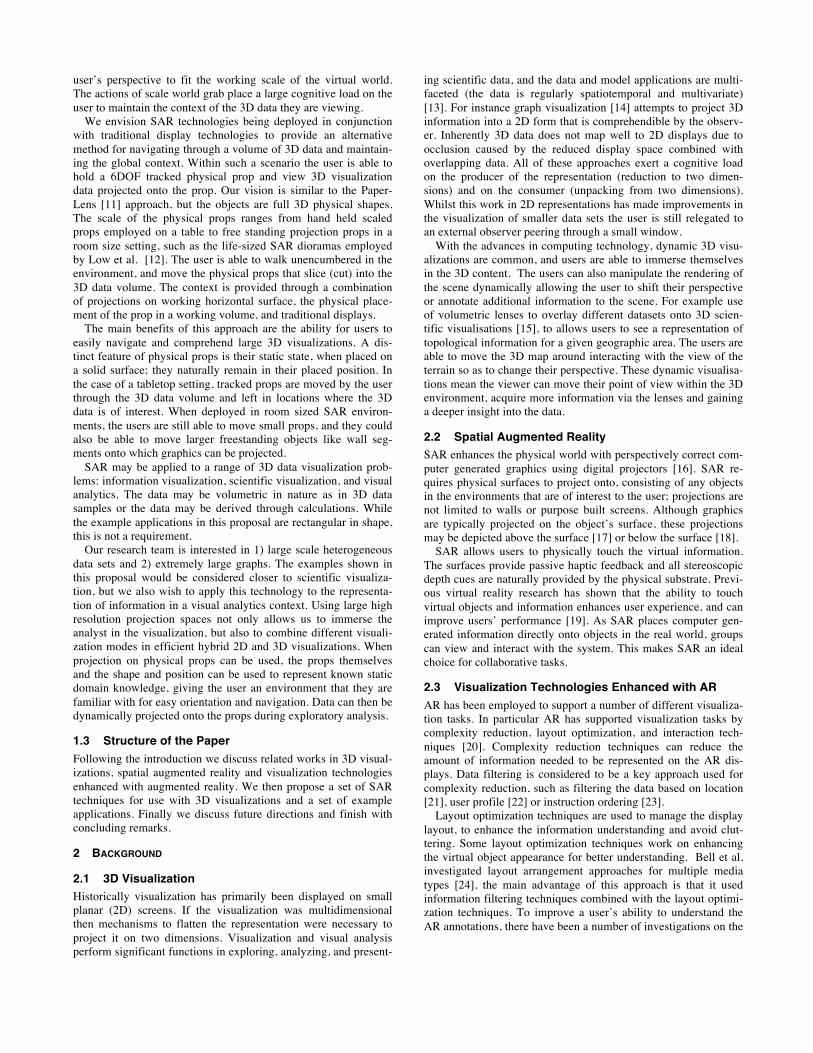
Figure 2. Overall Configuration of the Tabletop SAR
Figure 2 depicts the overall setup of the proposed tabletop system. The system is designed to leverage a physical table surface. The table acts as physical lower boundary for the virtual volume, a support surface for physical props, and a natural passive haptic surface for the user. There are two major display technologies: projectors and a 4K large display. The projectors drape the physi-cal props and the tabletop with SAR information. The 4K large display provides detailed views of the 3D visualization specified via the physical props and the hand held input device. This 4K monitor’s orientation could provide an axis as a reference to the user to orient themselves in the 3D volume. The virtual volume is instrumented with a 6DOF tracking system to determine pose and position of hand held interaction devices and the physical props.
The table provides a physical boundary for the virtual volume and a surface to hold the tangible display surfaces. The defined virtual volume is a one-to-one volume over the table. Physical objects are tangible projection surfaces that expose data on com-plex surfaces in the virtual volume. The views into a 3D volume are defined by the different shaped and sized volumes aligning with the placement of the physical objects. The user is able to move the shapes within the virtual volume to define new visuali-zations. The shapes are placed on the table or physical stands for persistence. The 4K monitor provides 2D views (specified by 3D input) of the 3D scenes with complementary information to users,
3 http://www.naturalpoint.com/
and these 2D views in some cases provide more appropriate in-formation than those based on 3D views [32].
Our prototype shows what is possible and acts as an exploration into the concept. The currently developed prototype displays pre-defined 3D data on predefined physical objects; the 6DOF track-ing has not been integrated. The interaction devices have been design but not implemented. All the required technology has been deployed in previous research projects with our team [33, 34].
In Grossman and Wigdor’s taxonomy for 3D on and above the table [35] our work can be described as follows:
1. Display Properties a. Perceived display space - Surface Constrained (non-
view dependent rendering) and 3D Volumetric (view dependent rendering)
b. Actual display space - Surface Constrained c. Viewpoint correlation – High
2. Input Properties a. Direct Surface Constrained b. Direct 3D c. Indirect 3D
3. Physical properties a. Physical form - Table with Proxies b. Physical size – All: Personal, Collaborative, Large
Scale, and Room Size.
4.1 Rendering of 3D Visualization Data The physical objects used as projection surfaces cut the virtual volume to define a shell of an interesting 3D data volume. The 3D visualization data may be defined as a parametric function or a set of 3D points. In both cases the visualization is rendered as a tex-ture to be projected onto the physical object through the SAR system. The texture is constructed every time the physical object moves, or the data changes, or the zoom of the virtual volume is altered. In the case of a parametric function defining the 3D visu-alization data, a texture map is created pixel by pixel from the points of the physical object’s surface that intersect the 3D vol-ume. In the case of a set of 3D points, the closest data point within a predefined distance is defined for each surface point. The 3D object may also act as a clipping boundary in the case of view dependent rendering.
4.2 Manipulations Virtual Data The design of the wireless hand held input device is based on a stylus and initially has two controls: a push button for selection and scroll wheel for 2D zooming. To drill down on 3D data pro-jected onto the physical objects, we envision a 6DOF tracked hand held pointing device. The drill down data is displayed on the large 4K monitor, and each user would have their own device. This hand held input device controls what is displayed on the 4K monitor and the level of zoom to be displayed.
Touching the side of physical object with the hand held point-ing device defines the 2D view of the 3D volume data focused on that point. There are three choices of 2D mapping of the 3D vol-ume data. The first is a tangential plane to the physical object defined at the point of contact defines the plane that cuts through the 3D volume data. The second is the plane is defined as perpen-dicular to the major axis of the hand held input device and the point of contact. The final 2D view is a projection mapping of the 3D volume data the physical object cuts through. We envision a scroll wheel on the hand held pointing device that would enable zooming in and out of the information displayed on the 4K moni-tor. The user would be able to move the pointing device and scroll simultaneously to smoothly change the view on the monitor.
4.3 Manipulations of Physical Objects Physical objects allow for tangible interactions. We explored a range of shapes and sizes of physical objects: different size cones, spheres, hemispheres, sheets, disks, and cubes. In the case of a physical object that is symmetrical around an axis of rotation such as a cone or cylinder, the action of rotation may be employed as interaction gesture itself. The rotation action may be used to zoom in on some data or adjust a parameter or change the color scheme. The physical objects remain in their position on the table after the user interacts with them. This is a problem when the region of interest is above the table. Physical support devices such as rods or platforms may have to be employed in this scenario.
4.4 Zooming of a Virtual Volume We designed a 6DOF tracked 3D solid rectangular object for the specification of a zoom region in the virtual volume. The rectan-gular object is instrumented with a physical push button with wireless communications (see Figure 3). This tool is used to spec-ify a particular region in the virtual volume to zoom into. The high-resolution display depicts a representation of the position and orientation in the total virtual volume. The user positions the rec-tangular object in the virtual volume with a desired location and orientation and presses the push button to lock this zoom position in place. A second possible control on the rectangular object is a scroll wheel to virtually increase or decrease the zoomed volume currently being defined.
Figure 3. Device to Specify Zoom of 3D Virtual Volume
4.5 Limitations The initial experimentation with our prototype has shown a num-ber of limitations with this approach. The first is the lighting the room must be controlled, as details in the gradients of the project-ed data may be lost with too much ambient lighting. Brighter pro-jectors might correct for this problem. The correspondence be-tween the virtual and physical objects was not exact. The physical shapes were Styrofoam models purchased from a local crafts store. These were physically measured and modeled as approxi-mate parametric shapes. This caused problems in the alignment of the graphics to the physical shapes, and in particular caused the projectors to miss some edges and cast light onto the table. A possible solution is to illuminate only the center portions of the surface areas. While tracking was not employed, the use of track-ing will increase this problem.
5 FURTHER EXAMPLE APPLICATIONS OF SAR We examine three large-scale example applications of SAR to support 3D visualization, room size SAR, SAR employed in con-junction with CAVE2 technologies, and SAR with a large refer-ence shape. There is a set of short descriptions with illustrations.
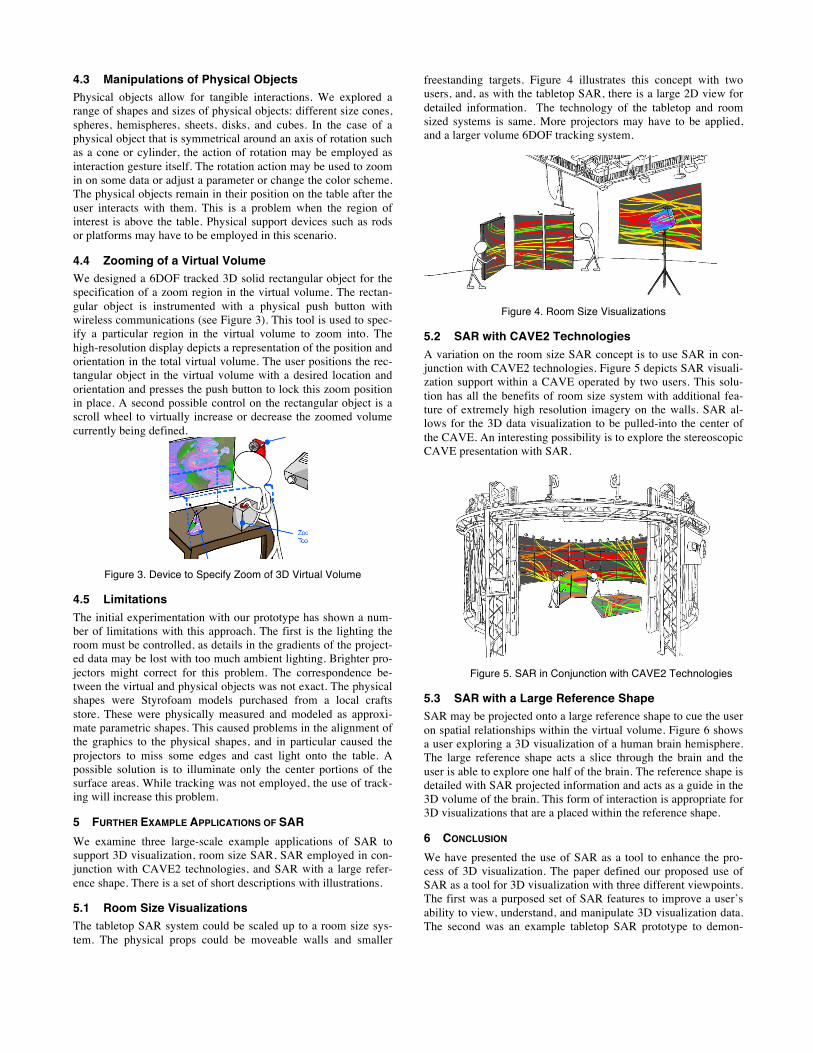
5.1 Room Size Visualizations The tabletop SAR system could be scaled up to a room size sys-tem. The physical props could be moveable walls and smaller
freestanding targets. Figure 4 illustrates this concept with two users, and, as with the tabletop SAR, there is a large 2D view for detailed information. The technology of the tabletop and room sized systems is same. More projectors may have to be applied, and a larger volume 6DOF tracking system.
Figure 4. Room Size Visualizations
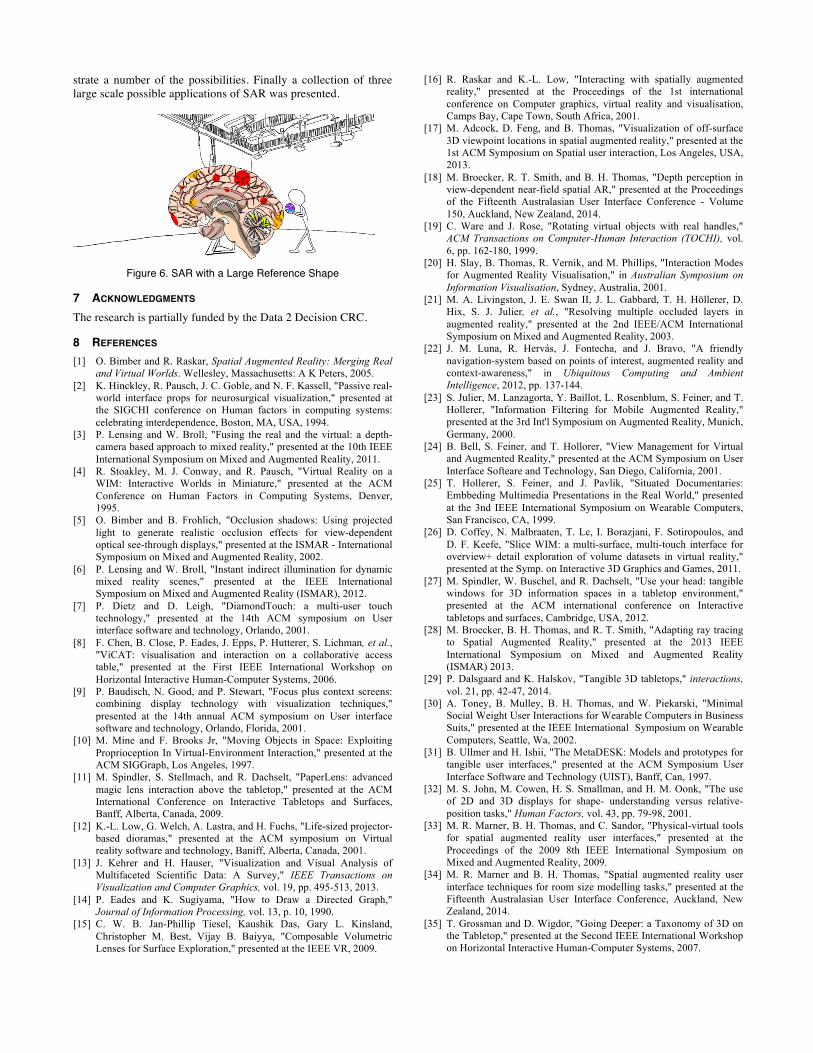
5.2 SAR with CAVE2 Technologies A variation on the room size SAR concept is to use SAR in con-junction with CAVE2 technologies. Figure 5 depicts SAR visuali-zation support within a CAVE operated by two users. This solu-tion has all the benefits of room size system with additional fea-ture of extremely high resolution imagery on the walls. SAR al-lows for the 3D data visualization to be pulled-into the center of the CAVE. An interesting possibility is to explore the stereoscopic CAVE presentation with SAR.
Figure 5. SAR in Conjunction with CAVE2 Technologies
5.3 SAR with a Large Reference Shape SAR may be projected onto a large reference shape to cue the user on spatial relationships within the virtual volume. Figure 6 shows a user exploring a 3D visualization of a human brain hemisphere. The large reference shape acts a slice through the brain and the user is able to explore one half of the brain. The reference shape is detailed with SAR projected information and acts as a guide in the 3D volume of the brain. This form of interaction is appropriate for 3D visualizations that are a placed within the reference shape.
6 CONCLUSION We have presented the use of SAR as a tool to enhance the pro-cess of 3D visualization. The paper defined our proposed use of SAR as a tool for 3D visualization with three different viewpoints. The first was a purposed set of SAR features to improve a user’s ability to view, understand, and manipulate 3D visualization data. The second was an example tabletop SAR prototype to demon-
strate a number of the possibilities. Finally a collection of three large scale possible applications of SAR was presented.
Figure 6. SAR with a Large Reference Shape
7 ACKNOWLEDGMENTS The research is partially funded by the Data 2 Decision CRC.
8 REFERENCES [1] O. Bimber and R. Raskar, Spatial Augmented Reality: Merging Real
and Virtual Worlds. Wellesley, Massachusetts: A K Peters, 2005. [2] K. Hinckley, R. Pausch, J. C. Goble, and N. F. Kassell, "Passive real-
world interface props for neurosurgical visualization," presented at the SIGCHI conference on Human factors in computing systems: celebrating interdependence, Boston, MA, USA, 1994.
[3] P. Lensing and W. Broll, "Fusing the real and the virtual: a depth-camera based approach to mixed reality," presented at the 10th IEEE International Symposium on Mixed and Augmented Reality, 2011.
[4] R. Stoakley, M. J. Conway, and R. Pausch, "Virtual Reality on a WIM: Interactive Worlds in Miniature," presented at the ACM Conference on Human Factors in Computing Systems, Denver, 1995.
[5] O. Bimber and B. Frohlich, "Occlusion shadows: Using projected light to generate realistic occlusion effects for view-dependent optical see-through displays," presented at the ISMAR - International Symposium on Mixed and Augmented Reality, 2002.
[6] P. Lensing and W. Broll, "Instant indirect illumination for dynamic mixed reality scenes," presented at the IEEE International Symposium on Mixed and Augmented Reality (ISMAR), 2012.
[7] P. Dietz and D. Leigh, "DiamondTouch: a multi-user touch technology," presented at the 14th ACM symposium on User interface software and technology, Orlando, 2001.
[8] F. Chen, B. Close, P. Eades, J. Epps, P. Hutterer, S. Lichman, et al., "ViCAT: visualisation and interaction on a collaborative access table," presented at the First IEEE International Workshop on Horizontal Interactive Human-Computer Systems, 2006.
[9] P. Baudisch, N. Good, and P. Stewart, "Focus plus context screens: combining display technology with visualization techniques," presented at the 14th annual ACM symposium on User interface software and technology, Orlando, Florida, 2001.
[10] M. Mine and F. Brooks Jr, "Moving Objects in Space: Exploiting Proprioception In Virtual-Environment Interaction," presented at the ACM SIGGraph, Los Angeles, 1997.
[11] M. Spindler, S. Stellmach, and R. Dachselt, "PaperLens: advanced magic lens interaction above the tabletop," presented at the ACM International Conference on Interactive Tabletops and Surfaces, Banff, Alberta, Canada, 2009.
[12] K.-L. Low, G. Welch, A. Lastra, and H. Fuchs, "Life-sized projector-based dioramas," presented at the ACM symposium on Virtual reality software and technology, Baniff, Alberta, Canada, 2001.
[13] J. Kehrer and H. Hauser, "Visualization and Visual Analysis of Multifaceted Scientific Data: A Survey," IEEE Transactions on Visualization and Computer Graphics, vol. 19, pp. 495-513, 2013.
[14] P. Eades and K. Sugiyama, "How to Draw a Directed Graph," Journal of Information Processing, vol. 13, p. 10, 1990.
[15] C. W. B. Jan-Phillip Tiesel, Kaushik Das, Gary L. Kinsland, Christopher M. Best, Vijay B. Baiyya, "Composable Volumetric Lenses for Surface Exploration," presented at the IEEE VR, 2009.
[16] R. Raskar and K.-L. Low, "Interacting with spatially augmented reality," presented at the Proceedings of the 1st international conference on Computer graphics, virtual reality and visualisation, Camps Bay, Cape Town, South Africa, 2001.
[17] M. Adcock, D. Feng, and B. Thomas, "Visualization of off-surface 3D viewpoint locations in spatial augmented reality," presented at the 1st ACM Symposium on Spatial user interaction, Los Angeles, USA, 2013.
[18] M. Broecker, R. T. Smith, and B. H. Thomas, "Depth perception in view-dependent near-field spatial AR," presented at the Proceedings of the Fifteenth Australasian User Interface Conference - Volume 150, Auckland, New Zealand, 2014.
[19] C. Ware and J. Rose, "Rotating virtual objects with real handles," ACM Transactions on Computer-Human Interaction (TOCHI), vol. 6, pp. 162-180, 1999.
[20] H. Slay, B. Thomas, R. Vernik, and M. Phillips, "Interaction Modes for Augmented Reality Visualisation," in Australian Symposium on Information Visualisation, Sydney, Australia, 2001.
[21] M. A. Livingston, J. E. Swan II, J. L. Gabbard, T. H. Höllerer, D. Hix, S. J. Julier, et al., "Resolving multiple occluded layers in augmented reality," presented at the 2nd IEEE/ACM International Symposium on Mixed and Augmented Reality, 2003.
[22] J. M. Luna, R. Hervás, J. Fontecha, and J. Bravo, "A friendly navigation-system based on points of interest, augmented reality and context-awareness," in Ubiquitous Computing and Ambient Intelligence, 2012, pp. 137-144.
[23] S. Julier, M. Lanzagorta, Y. Baillot, L. Rosenblum, S. Feiner, and T. Hollerer, "Information Filtering for Mobile Augmented Reality," presented at the 3rd Int'l Symposium on Augmented Reality, Munich, Germany, 2000.
[24] B. Bell, S. Feiner, and T. Hollorer, "View Management for Virtual and Augmented Reality," presented at the ACM Symposium on User Interface Softeare and Technology, San Diego, California, 2001.
[25] T. Hollerer, S. Feiner, and J. Pavlik, "Situated Documentaries: Embbeding Multimedia Presentations in the Real World," presented at the 3nd IEEE International Symposium on Wearable Computers, San Francisco, CA, 1999.
[26] D. Coffey, N. Malbraaten, T. Le, I. Borazjani, F. Sotiropoulos, and D. F. Keefe, "Slice WIM: a multi-surface, multi-touch interface for overview+ detail exploration of volume datasets in virtual reality," presented at the Symp. on Interactive 3D Graphics and Games, 2011.
[27] M. Spindler, W. Buschel, and R. Dachselt, "Use your head: tangible windows for 3D information spaces in a tabletop environment," presented at the ACM international conference on Interactive tabletops and surfaces, Cambridge, USA, 2012.
[28] M. Broecker, B. H. Thomas, and R. T. Smith, "Adapting ray tracing to Spatial Augmented Reality," presented at the 2013 IEEE International Symposium on Mixed and Augmented Reality (ISMAR) 2013.
[29] P. Dalsgaard and K. Halskov, "Tangible 3D tabletops," interactions, vol. 21, pp. 42-47, 2014.
[30] A. Toney, B. Mulley, B. H. Thomas, and W. Piekarski, "Minimal Social Weight User Interactions for Wearable Computers in Business Suits," presented at the IEEE International Symposium on Wearable Computers, Seattle, Wa, 2002.
[31] B. Ullmer and H. Ishii, "The MetaDESK: Models and prototypes for tangible user interfaces," presented at the ACM Symposium User Interface Software and Technology (UIST), Banff, Can, 1997.
[32] M. S. John, M. Cowen, H. S. Smallman, and H. M. Oonk, "The use of 2D and 3D displays for shape- understanding versus relative-position tasks," Human Factors, vol. 43, pp. 79-98, 2001.
[33] M. R. Marner, B. H. Thomas, and C. Sandor, "Physical-virtual tools for spatial augmented reality user interfaces," presented at the Proceedings of the 2009 8th IEEE International Symposium on Mixed and Augmented Reality, 2009.
[34] M. R. Marner and B. H. Thomas, "Spatial augmented reality user interface techniques for room size modelling tasks," presented at the Fifteenth Australasian User Interface Conference, Auckland, New Zealand, 2014.
[35] T. Grossman and D. Wigdor, "Going Deeper: a Taxonomy of 3D on the Tabletop," presented at the Second IEEE International Workshop on Horizontal Interactive Human-Computer Systems, 2007.
