spatial neighborhood effects in agricultural technology...
TRANSCRIPT
Spatial Neighborhood Effects in Agricultural Technology Adoption: Evidence from
Nigeria By Serge Adjognon and Lenis Saweda Liverpool-Tasie,
Michigan State University
This paper uses plot level data to analyze network effects on the adoption of a targeted
fertilizer application technique amongst rice producers in Niger State, Nigeria. A
Spatial Durbin Model (SDM) of farmers’ probability of using the Urea Deep Placement
(UDP) technology is estimated using a Spatial Instrumental Variable Probit estimation
approach. The results reveal the existence of significant and positive spatial correlation
in rice farmers’ adoption of UDP in the study area. These results have important
implications for the design of appropriate and cost effective extension programs, in
order to facilitate the diffusion of agricultural technologies in developing countries.
Keywords: Spatial, Adoption, Social network, agriculture, UDP
JEL codes: O13, O33, Q16
1
1. Introduction
Sustainable intensification is now a subject of keen interest in many developing countries. With growing
populations and limited supply of inputs like land, water and energy, increasing food supply in a
sustainable manner is critical (IFPRI, 2013). This includes the use of improved technologies (like
improved seeds and fertilizers) and management strategies. Despite the agronomic advantages of many
of these input intensification strategies, a long-standing conundrum is why farmers do not adopt such
technologies. Questions still remain about the real drivers (or constraints) to farmers’ adoption of new
agricultural technologies particularly those with the potential to increase farmer productivity and
incomes.
In addition to the commonly cited constraints to adoption (like transactions costs and profitability issues
due to poor input and output markets) another key challenge is limited farmer knowledge about new and
potentially profitable agricultural technologies. Even after farmers hear about some technology, their
decision to adopt it depends on many interrelated factors, and may very well be influenced by neighbors’
attitudes towards the technology (Case 1992). Faced with limited access to often poorly functioning
extension systems, farmers in many developing countries rely on other informal sources of information.
It is thus important for government and development practitioners to understand and successfully
leverage these alternative sources of information for broader impact.
Increasingly, spatial econometric methods are being used by applied researchers in agricultural,
environmental and development economics, to analyze situations in which decision or outcomes of
individual are spatially correlated. Recently, Krishnan et al. (2014) found evidence of learning from
neighbors while examining the role of learning from extension agents versus learning from neighbors
for both improved seeds and fertilizer adoption in Ethiopia. Holloway, Shankar et al. (2002) also
found evidence of spatial dependence in binary choices regarding high-yielding variety (HYV)
adoption among Bangladeshi rice producers, using a Bayesian Probit estimation approach.
Theoretical motivations for the inclusion of spatial dependence in regression models have also been
discussed by many authors (Anselin 2002; Pace and LeSage 2009). However, applications to
situations of adoption of agricultural technology are still limited. In particular, no study has focused
on neighborhood effects in farmers’ agricultural technology adoption decision in Nigeria. Such results
from empirical studies that incorporate or control for neighborhood effect in farmers’ decision to
adopt new agricultural technologies, have important policy implications for technology diffusion and
also the design of cost effective extension programs. When farmers interact with each other in a way
that the adoption decision of each farmer is positively correlated with the adoption decision of their
neighbors, there is great potential for reducing extension cost by taking this into account. The
spillover effects from learning from others also create an externality effect that could warrant
2
government support to encourage farmers to experiment with the technology. Within Sub Saharan
Africa generally and Nigeria particularly, there is a dearth of information on the existence of spatial
dependence in technology adoption decisions. Furthermore, a major problem related to ignoring the
existence of spatial dependence when it exists is the omitted variable problem, leading to biased and
inconsistent estimates of the determinants of adoption. Consequently, this paper adds to both the
literature on spatial dependence in technology adoption and estimation of spatial dependence in a
discrete choice context. The paper analyzes the role of spatial interactions in the spread (of
information) and adoption of an innovative technique for the application of fertilizer (Urea) for rice
production in Niger State, Nigeria. Though widely promoted in Sub Saharan Africa in the recent past,
there are not many empirical assessments of the UDP technology specifically on rice production using
survey data (that we are aware of)1, and taking into account spatial considerations, in Sub Saharan
Africa. Consequently our study also begins to fill this research gap.
The rest of this paper is organized as follows. Section 2 provides a brief background on the Urea Deep
Placement technology and its promotion in Nigeria. Section 3 describes the study’s theoretical and
empirical framework while section 4 presents the identification strategy and estimation methods used.
In section 5 we discuss our data source and describe our sample. Section 6 presents our results and
section 7 is the conclusion.
2. Background On Urea Deep Placement Technology
Urea super granules for deep placement (Urea Deep Placement (UDP)) is one among several current
innovations for sustainable input intensification currently being encouraged in developing countries
(including Nigeria). The UDP technology involves the use of compacted urea super granules usually
1-3 grams each placed at a depth of between 7-10 cm by hand at the center of every four rice seedling
hills in rice soils during or after rice transplanting (IFDC, 2012). The urea super granules are said to
increase nitrogen use efficiency because more urea nitrogen stays in the soil, close to the plant roots
where it is absorbed more effectively. Urea deep placement is said to potentially increase crop yields
by 25 percent while reducing nitrogen losses by 40 percent (IFDC, 2012). Compared to the traditional
application of urea by broadcasting, done two or three times in a planting cycle, the urea super
granules are only applied once. Because it is deep placed, the fertilizer nutrients are beyond the reach
of weeds thus reducing weed incidence. UDP is potentially profitable for farmers because it increases
crops yield, reduces the number of fertilizer applications necessary as well as lowers weeding costs,
while being competitively priced relative to other fertilizers. Field demonstrations in several sites
1
Liverpool-Tasie et al (2015) is an exception
3
across Africa and Asia have indicated significant potential benefits of the Urea deep placement
approximating 45 percent advantage over traditional practices (IFDC, 2012). While 2 out of 3 bags
of urea were lost by the traditional method of fertilizer application (broadcasting), only one out of
three bags of USG was lost when deep placed (IFDC, 2013). Increased Nitrogen use efficiency was
found to lead to increase productivity in several locations. For instance, rice output increased to an
average of 7 tonnes per hectare in the dry season with best practices and USG application, compared
to an average of 4.4 tonnes per hectare based on farmer’s traditional practices (this is average ouput
from Gombe, Kebbi and Niger States) (IFDC 2013). As a result of productivity increases, USG also
increased gross revenues and ultimately profits by a very healthy margin (IFDC, 2013). Moreover,
Liverpool-Tasie et al. (2015) provided empirical evidence of positive and significant effect of UDP
on rice yields in Niger State, Nigeria.
The use of USG is actively being promoted across Nigeria (and other African countries) by various
development partners. In Nigeria, a development agency, International center for soil fertility and
development (IFDC) and Notore (a private fertilizer supply company in Nigeria) have used several
approaches to encourage the adoption of USG. In the two study villages in Niger State; Washe and
Sheshi villages, a key component of the promotion of UDP was the use of a village promoter. The
concept of the village promoter is a mix of commerce and extension developed by Notore to sell
fertilizer. The village promoter is a farmer based in the village who has sufficient social capital to be
able to teach other farmers improved farming practices while simultaneously serving as the local
supplier of the technology. Notore village promoters are trained in the best practices in the use of
USG, and then serve as a source of information and fertilizer to other villagers. In addition to the
use of the village promoter, IFDC and Notore also jointly set up demonstration plots (in the vicinity
of the two villages) in conjunction with local farmers. On these plots, USG was utilized with
recommended best practices, These best practices included the establishment of nurseries which are
then transplanted to a well-watered and levelled plot. The USG is deep placed on the plot (with a
recommendation that 1 USG serve 4 rice plants) a week after transplanting at a depth of about 7-
10cm. Fields are recommended to be well watered during and after application of the USG.
The demonstration plots were placed directly beside plots where only traditional farmers’ practices
were used. Villagers were able to see the clear difference between the two plots in terms of plant
development and ultimately yield. In the two study villages, the village promoter was also one of the
demo plot farmers, adding to his credibility in the village. Village field days were held with officials
of Notore and IFDC. During the field days, all farmers from both villages were told more about the
technology and able to view the progress of the rice fields.

4
3. Theoretical and Empirical Framework
3.1.The spatial reaction function
The theoretical basis for the spatial autoregressive model is a spatial reaction function that expresses
how the magnitude of a decision variable for an economic agent depends on the magnitudes of the
decision variables set by other economic agents (Anselin 2002). Brueckner (2003) developed two
theoretical frameworks for strategic interaction that yield a reaction function as the equilibrium
solution: the spillover model and the resource flow model. While the resource flow model can also
be made relevant, the spillover model seems more relevant to the case of neighborhood effect in
technology adoption.
According to the spillover model, an agent i’s objective function is affected not only by his choice of
a decision variable, yi , but also the values of the y chosen by other agents (say,y−i , where the –i
subscripts refers to all agents other than i).
𝑈𝑖 = 𝑈(𝑦𝑖, 𝑦−𝑖)
Choosing the decision variable to maximize this objective functions yields the following reaction
function:
𝑦𝑖 = 𝑅(𝑦−𝑖)
When the other agents are neighbors, this reaction function coincides with a spatial lag model where
agent's decision is a function of the decision made by his neighbors. Models of social learning,
learning from others, technological externalities (Conley and Udry 2001; Foster and Rosenzweig
1995, 2010) are all consistent with this spillover model.
The model of learning from others developed by Foster and Rosenzweig (1995) established that
farmer’s decisions about technology use, depend not only on a farmer’s evaluation of its profitability,
but also on the experience of his information network. This is because if one farmer experiments with
a new technology, this generates information for other farmers and increases their expected profits
from adoption. However this learning externality can have both a positive and negative effect on
farmers’ adoption decision. The more a farmer experiments, the higher the profit she expects. At the
same time, since expected profit is increasing in both personal experimentation and the information
from ones network, a farmer with many neighbors adopting the new technology may delay adoption
(Bandiera and Rasul 2006; Bardhan and Udry 1999; Liverpool-Tasie and Winter-Nelson 2012).
3.2. A spatial latent variable model
Consider the following spatial latent variable model (Anselin 2002; Pace and LeSage 2009) based on
the utility maximization approach for modeling individuals’ decision choice. We treat the observed
choice of each individual i=1,..,N as the realization of a random choice variable Yi, where Yi =1 if

5
individual i adopts the UDP technology, and Yi =0 otherwise. Choices are assumed to be based on
utility maximizing behavior, where individual i’s net utility from adoption can be represented by the
following equation:
𝒚𝒊∗ = 𝑿𝒊𝜷 + 𝜺𝒊 (1)
We do not observe 𝑦𝑖∗, but only the choice made, which are reflected in the random variable 𝑦𝑖 such
as:
𝒚𝒊 = {𝟏, 𝒊𝒇 𝒚𝒊
∗ ≥ 𝟎
𝟎, 𝒊𝒇 𝒚𝒊∗ < 𝟎
(2)
Consider X is an (N x K) matrix of K explanatory variables that are assumed to affect individual
farmers net utilities and therefore decision to adopt UDP technology. Our interest lies primarily in
the response probability:
𝑃(𝑋) = 𝐸[𝑦|𝑋] = Pr(𝑦𝑖 = 1|𝑋) = Pr(𝑦𝑖∗ ≥ 0|𝑋) (Wooldridge 2002).
Assuming the random component ε follows a normal distribution, we can use a Probit model for the
response probability (Wooldridge 2002). When spatial interdependence exists within the data,
standard models will not only result in biased and inconsistent estimates, but also sacrifice important
policy relevant information (Case 1992; Holloway et al. 2002; Loomis et al. 2013; Pace and LeSage
2009). Therefore, the model used in this paper allows for neighbors to influence one another in their
decision choice. And the model for the latent variable takes the following Spatial Autoregressive
form:
𝒚∗ = 𝝆𝑾𝒚∗ + 𝑿𝜷 + 𝜺 (3)
𝒚∗ = (𝑰𝒏 − 𝝆𝑾)−𝟏(𝑿𝜷 + 𝜺) = (𝑰𝒏 − 𝝆𝑾)−𝟏𝑿𝜷 + 𝝐 (4)
where
𝝐 = (𝑰𝒏 − 𝝆𝑾)−𝟏𝜺 ~ 𝑵(𝟎, 𝝈𝜺 [(𝑰𝒏 − 𝝆𝑾)′(𝑰𝒏 − 𝝆𝑾)]−𝟏) (5)
X is a (N x K) matrix of K explanatory variables that are assumed to affect the dependant variable. ε
is the (N x 1) vector of random error component assumed to be iid N(0,σε).
The parameter ρ is the parameter of interest. It reflects the spatial correlation between a given farmer’s
probability of adopting the UDP technology, and his neighbors’ probability. A significant ρ implies
that farmers’ decision to adopt UDP technology is influenced by their neighbors’ behavior.
6
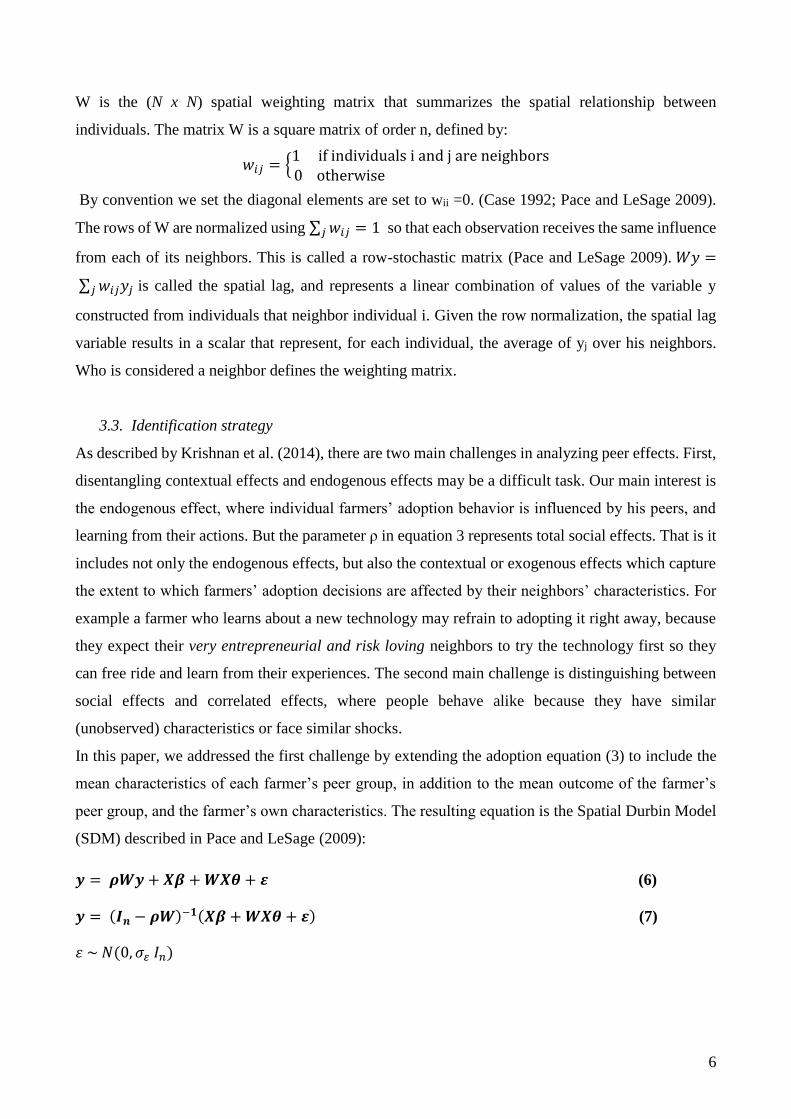
W is the (N x N) spatial weighting matrix that summarizes the spatial relationship between
individuals. The matrix W is a square matrix of order n, defined by:
𝑤𝑖𝑗 = {1 if individuals i and j are neighbors0 otherwise
By convention we set the diagonal elements are set to wii =0. (Case 1992; Pace and LeSage 2009).
The rows of W are normalized using ∑ 𝑤𝑖𝑗𝑗 = 1 so that each observation receives the same influence
from each of its neighbors. This is called a row-stochastic matrix (Pace and LeSage 2009). 𝑊𝑦 =
∑ 𝑤𝑖𝑗𝑦𝑗𝑗 is called the spatial lag, and represents a linear combination of values of the variable y
constructed from individuals that neighbor individual i. Given the row normalization, the spatial lag
variable results in a scalar that represent, for each individual, the average of yj over his neighbors.
Who is considered a neighbor defines the weighting matrix.
3.3. Identification strategy
As described by Krishnan et al. (2014), there are two main challenges in analyzing peer effects. First,
disentangling contextual effects and endogenous effects may be a difficult task. Our main interest is
the endogenous effect, where individual farmers’ adoption behavior is influenced by his peers, and
learning from their actions. But the parameter ρ in equation 3 represents total social effects. That is it
includes not only the endogenous effects, but also the contextual or exogenous effects which capture
the extent to which farmers’ adoption decisions are affected by their neighbors’ characteristics. For
example a farmer who learns about a new technology may refrain to adopting it right away, because
they expect their very entrepreneurial and risk loving neighbors to try the technology first so they
can free ride and learn from their experiences. The second main challenge is distinguishing between
social effects and correlated effects, where people behave alike because they have similar
(unobserved) characteristics or face similar shocks.
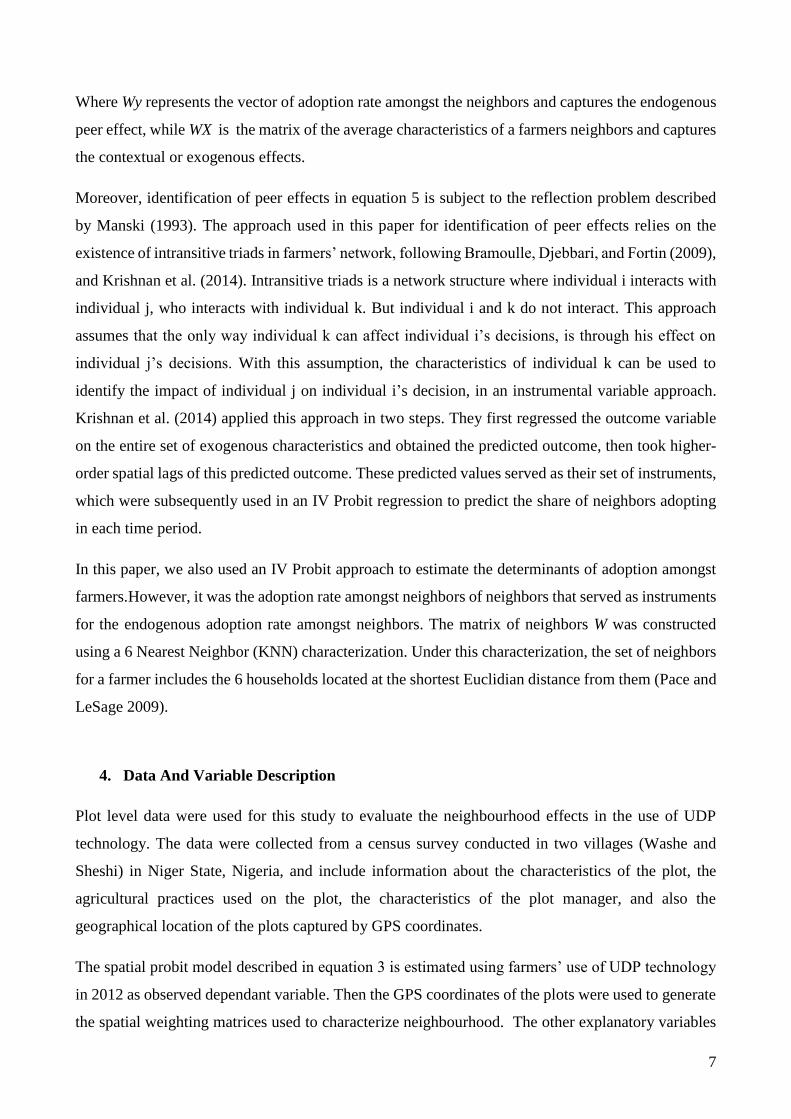
In this paper, we addressed the first challenge by extending the adoption equation (3) to include the
mean characteristics of each farmer’s peer group, in addition to the mean outcome of the farmer’s
peer group, and the farmer’s own characteristics. The resulting equation is the Spatial Durbin Model
(SDM) described in Pace and LeSage (2009):
𝒚 = 𝝆𝑾𝒚 + 𝑿𝜷 + 𝑾𝑿𝜽 + 𝜺 (6)
𝒚 = (𝑰𝒏 − 𝝆𝑾)−𝟏(𝑿𝜷 + 𝑾𝑿𝜽 + 𝜺) (7)
𝜀 ~ 𝑁(0, 𝜎𝜀 𝐼𝑛)
7
Where Wy represents the vector of adoption rate amongst the neighbors and captures the endogenous
peer effect, while WX is the matrix of the average characteristics of a farmers neighbors and captures
the contextual or exogenous effects.
Moreover, identification of peer effects in equation 5 is subject to the reflection problem described
by Manski (1993). The approach used in this paper for identification of peer effects relies on the
existence of intransitive triads in farmers’ network, following Bramoulle, Djebbari, and Fortin (2009),
and Krishnan et al. (2014). Intransitive triads is a network structure where individual i interacts with
individual j, who interacts with individual k. But individual i and k do not interact. This approach
assumes that the only way individual k can affect individual i’s decisions, is through his effect on
individual j’s decisions. With this assumption, the characteristics of individual k can be used to
identify the impact of individual j on individual i’s decision, in an instrumental variable approach.
Krishnan et al. (2014) applied this approach in two steps. They first regressed the outcome variable
on the entire set of exogenous characteristics and obtained the predicted outcome, then took higher-
order spatial lags of this predicted outcome. These predicted values served as their set of instruments,
which were subsequently used in an IV Probit regression to predict the share of neighbors adopting
in each time period.
In this paper, we also used an IV Probit approach to estimate the determinants of adoption amongst
farmers.However, it was the adoption rate amongst neighbors of neighbors that served as instruments
for the endogenous adoption rate amongst neighbors. The matrix of neighbors W was constructed
using a 6 Nearest Neighbor (KNN) characterization. Under this characterization, the set of neighbors
for a farmer includes the 6 households located at the shortest Euclidian distance from them (Pace and
LeSage 2009).
4. Data And Variable Description
Plot level data were used for this study to evaluate the neighbourhood effects in the use of UDP
technology. The data were collected from a census survey conducted in two villages (Washe and
Sheshi) in Niger State, Nigeria, and include information about the characteristics of the plot, the
agricultural practices used on the plot, the characteristics of the plot manager, and also the
geographical location of the plots captured by GPS coordinates.
The spatial probit model described in equation 3 is estimated using farmers’ use of UDP technology
in 2012 as observed dependant variable. Then the GPS coordinates of the plots were used to generate
the spatial weighting matrices used to characterize neighbourhood. The other explanatory variables
8
included to control for other factors that may influence adoption of the UDP technology include the
plot characteristics, the socio-economic characteristics of the plot manager (age, gender, marital
status), as well as plot manager’s previous exposure to or experience with UDP.
In particular, to account for farmers’ diverse experience in farming, information was gathered on
farmers’ previous yields and their exposure to UDP. We predicted that farmers who participated in
the Notore demonstration are likely to have seen and heard of the benefits of UDP while others have
not. To capture farmers unobserved but differential ability, motivation and/or likely strength,
independent of exposure to UDP, we collected information on farmers’ prior yields in 2011. Table 1
describes the socio-economic characteristics of the managers of the plots included in our analysis.
Overall, UDP plots, which are plots on which UDP technology was used, represent 52.32% of the
total number of plots. We present the descriptive stats by UDP and NON-UDP plots. The table reveals
that male farmers manage 91.55% of the plots, and this holds irrespective of the UDP status of the
plot.
The overall average age of plot manager is 37.17 years with an average of 26.67 years of experience
in farming activities, and 36.84 years of residence in the village on average. These do not differ
significantly between UDP and NON-UDP plots. This result is not surprising knowing that most
farmers are native of the area and have started participating in farming activities from a young age.
Also most plot managers are married (80.31 %) and have received some formal education (85.63%)
irrespectively of adoption status.
Adopters and non adopters are similar in terms of wealth status. The asset index computed to capture
wealth status indicates that there is not a significant difference between the 2 groups.
Overall about 78% of the plots are managed by farmers that are members of farmer’s organization.
This number is higher for UDP plots than non-UDP plots. Most plots managers (96% overall)
participated to the training organized by NOTORE.
As far as ownership of the plot is concerned, most plots are owned by their managers but a
significantly higher proportion of the UDP plots (98%) are owned by their manager, compared to the
NON-UDP plots where 91% of them are owned by the plot manager.
Irrigation practices are not very common in the study area. Only 13.40% of the plots analyzed were
irrigated. This percentage is similar amongst UDP and NON –UDP plots.
9
On the majority of the plots, whether they are UDP or non UDP plots, rice is not cultivated in
association with any other crop.
Hired labor is used on 97% of the UDP plots and on 94% of the non-UDP plots. This may capture
the additional labor for higher yields but could also indicate that the use of UDP requires some
additional tasks that increase the need for hired labor.
5. Results and discussion
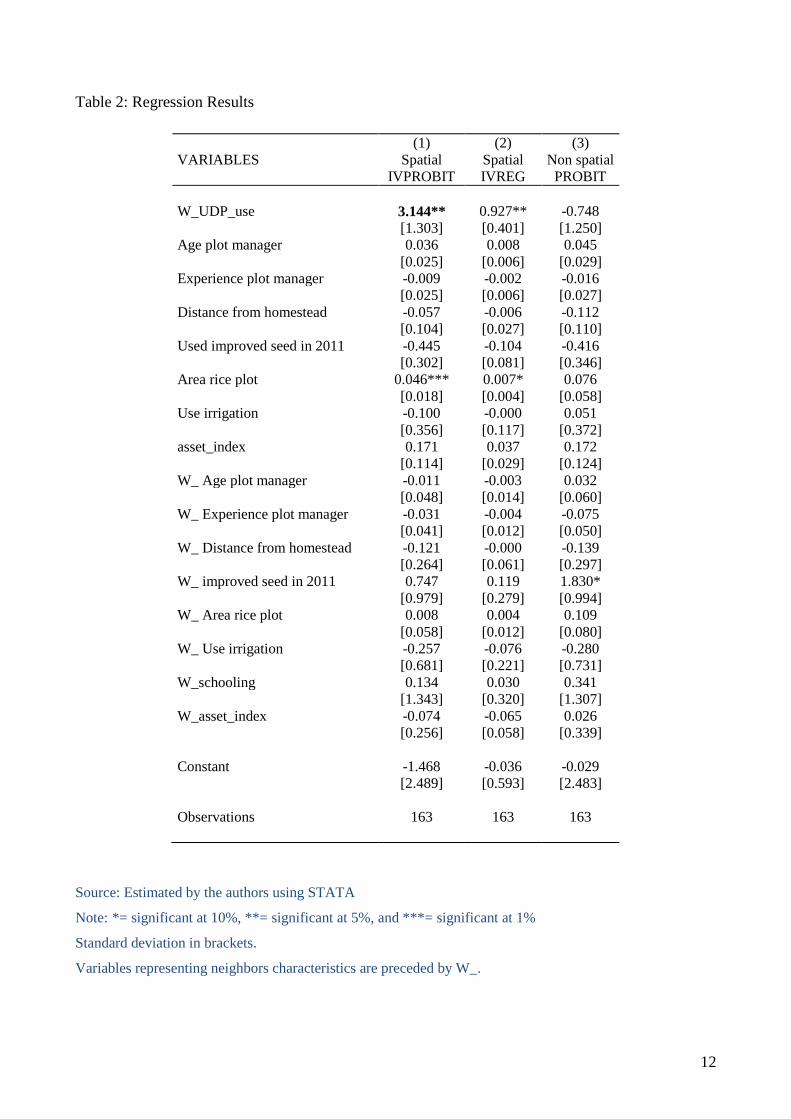
Table 2 presents the results of the estimation of equation 5, evaluating neighborhood effect in the
UDP adoption. The results of both the Spatial Probit and Instrumental Variable Spatial Probit models
are presented along with the IV spatial linear regression model. We controlled for both farmers and
neighbors characteristics. Those characteristics include age of the plot manager, the manager’s
experience in farming activities, the wealth captured by an asset index, the distance of plot from
homestead, the use of irrigation system, and the area of rice plot. The Spatial Probit and Instrumental
Variable Spatial Probit regression models have yielded significantly different results, suggesting that
it is important to use instrumental variable method to avoid bias estimates due to endogeneity of the
adoption rate amongst neighbors. The results of the IV spatial linear regression are similar to the IV
spatial probit model and different from the (non IV) spatial probit results.
The Instrumented Spatial Probit estimation results suggest that there is a strong relationship between
the adoption decisions of neighbors and one’s own decision to adopt UDP technology for rice
production amongst farmers in the study area, with a coefficient significant at 1%. This means that
an increase of take up in a farmer’s network seems to increase the farmers’ likelihood of adoption of
UDP technology. This result is consistent with the findings of Holloway et al. (2002) about the
adoption of HYV of rice in Bangladesh, and Krishnan et al. (2014) about the adoption of agricultural
new technologies in Ethiopia.
Also, the exogenous effects seem to not matter much here because all the coefficients on the
characteristics of the neighbor are non-significant. However they are mostly negative suggesting that
there might be some strategic behavior amongst farmers (Foster and Rosenzweig 1995).
Characteristics such as wealth of neighbors, that are supposed to increase neighbors’ adoption rate,
seem to have a negative effect on a farmer’s own adoption.
These results have important implications for the design of appropriate and cost effective extension
program in Nigeria. They indicate that strategies that focus the training for a new technology like
UDP on particular farmers or groups of farmers within a village are likely to enhance the spread of
information about the technology and its consequent adoption. This is an important contribution to
10
the understanding of the diffusion process of agricultural technologies in a developing countries
context.
However an important limitation to the data used in this paper is worth mentioning. As we stated
earlier, this study used a cross sectional data at the plot level. Therefore there is still possibility that
both time variant and non-variant unobservable factors might be driving our findings. Krishnan and
Patnam (2014) corrected for this by using differences between the three rounds of data available to
them and account for unobserved farmer-fixed effect that could bias the peer interaction effect. We
we unable to do so because we only had one round of data.
6. Conclusion
This paper examines neighborhood effect in the adoption of Urea Deep Placement technology for rice
production in Niger state, Nigeria. We estimated a spatial autoregressive model of UDP adoption
using a Spatial Instrumental Variable Probit method. The results indicate that there is significant
spatial correlation in rice farmers’ adoption of UDP in the study area, and have important implications
for the design of appropriate and cost effective extension program in Nigeria. This is an important
contribution to the understanding of the diffusion process of agricultural technologies in a developing
countries context.
What remains unknown is how the exact distance from the neighbor, influences the effect that
neighbor has on a farmer’s decision making. Does how far a neighbor is from a farmer determine
how strong his influence on that farmer decision making is? To investigate this, we need to use a
weighting matrix that captures the actual distance between farmers and his neighbors. Therefore, our
next step is to carry out such analysis and evaluate how the current results change and the importance
of proximity on the strenght of network effects.

11
TABLES AND FIGURES
Table 1: Descriptive statistics
Mean/percentage
Variables UDP plots Non UDP
plots
Total T test
Have heard of UDP 100% 90.64% 93.79% -5.8299***
Use UDP 100% 0% 52.32%
Gender Male 91.30% 94.16% 91.55%
Female 8.70% 5.84% 8.45% -1.3938
Age (years) 37.95
(14.43)
36.59
(13.28)
37.17
(14.01)
-1.2373
Number of years of
residence in the village
(years)
37.83
(14.57)
35.99
(13.73)
36.84
(14.34)
-1.6581*
Experience in agriculture
(years)
27.60
(14.16)
25.79
(13.74)
26.67
(14.16)
-1.6423
Married 80.86% 80.56% 80.31 % -0.0958
Single 19.14% 19.44% 19.69%
Percentage of respondents
that have attended formal
education
88.29% 83.70% 85.63% -1.7139
Size of plots cultivated
(hectares)
4.42
(14.28)
7.30
(97.48)
14.44
(206.65)
0.6082
Asset index .055
(1.21)
-.014
(1.19)
-.0065
(1.24)
-0.7406
Percentage of respondents
that are members of
farmer association
83.58% 74.92% 78.79% -2.7092***
Percentage of respondents
that attended the Notore
training
96.86% 93.90% 96.10% -1.5408
Ownership of cultivated
plot
98.22% 91.80% 95.39% -3.8330***
Irrigation practice 14.37% 12.94% 13.40% -0.5169
Only rice on the plot 92.01% 89.74% 89.95% -0.8743
Percentage of respondents
using hired labor
97.92% 94.41% 95.73% -2.3395**
Yield in 2011 (kg/hectare) 177.48
(1470.39)
1904.87
(9065.67)
705.48
(5194.6)
3.1314***
Use of improved seeds in
2011
73.03% 46.81% 59.14% -6.5590***
Distance from plot to
home (km)
1.89
(5.52)
2.30
(5.13)
1.97
(4.91)
0.9433
Area of rice plots (ha) 4.41
(14.85)
1.23
(1.56)
2.849
(10.89)
-2.7530***
Source: Estimated by the authors using STATA
Note: *= significant at 10%, **= significant at 5%, and ***= significant at 1%. Standard deviation in
parentheses.
12
Table 2: Regression Results
(1) (2) (3)
VARIABLES Spatial
IVPROBIT
Spatial
IVREG
Non spatial
PROBIT
W_UDP_use 3.144** 0.927** -0.748
[1.303] [0.401] [1.250]
Age plot manager 0.036 0.008 0.045
[0.025] [0.006] [0.029]
Experience plot manager -0.009 -0.002 -0.016
[0.025] [0.006] [0.027]
Distance from homestead -0.057 -0.006 -0.112
[0.104] [0.027] [0.110]
Used improved seed in 2011 -0.445 -0.104 -0.416
[0.302] [0.081] [0.346]
Area rice plot 0.046*** 0.007* 0.076
[0.018] [0.004] [0.058]
Use irrigation -0.100 -0.000 0.051
[0.356] [0.117] [0.372]
asset_index 0.171 0.037 0.172
[0.114] [0.029] [0.124]
W_ Age plot manager -0.011 -0.003 0.032
[0.048] [0.014] [0.060]
W_ Experience plot manager -0.031 -0.004 -0.075
[0.041] [0.012] [0.050]
W_ Distance from homestead -0.121 -0.000 -0.139
[0.264] [0.061] [0.297]
W_ improved seed in 2011 0.747 0.119 1.830*
[0.979] [0.279] [0.994]
W_ Area rice plot 0.008 0.004 0.109
[0.058] [0.012] [0.080]
W_ Use irrigation -0.257 -0.076 -0.280
[0.681] [0.221] [0.731]
W_schooling 0.134 0.030 0.341
[1.343] [0.320] [1.307]
W_asset_index -0.074 -0.065 0.026
[0.256] [0.058] [0.339]
Constant -1.468 -0.036 -0.029
[2.489] [0.593] [2.483]
Observations 163 163 163
Source: Estimated by the authors using STATA
Note: *= significant at 10%, **= significant at 5%, and ***= significant at 1%
Standard deviation in brackets.
Variables representing neighbors characteristics are preceded by W_.

13
References
Anselin, Luc (2002), 'Under the hood issues in the specification and interpretation of spatial
regression models', Agricultural economics, 27 (3), 247-67.
Bandiera, Oriana and Rasul, Imran (2006), 'Social networks and technology adoption in northern
mozambique*', The Economic Journal, 116 (514), 869-902.
Bardhan, Pranab and Udry, Christopher (1999), Development microeconomics (Oxford University
Press).
Bramoulle, Yann, Djebbari, Habiba, and Fortin, Bernard (2009), 'Identification of Peer Effects
through Social Networks', Journal of Econometrics, 150 (1), 41-55.
Brueckner, Jan K (2003), 'Strategic interaction among governments: An overview of empirical
studies', International regional science review, 26 (2), 175-88.
Case, Anne (1992), 'Neighborhood influence and technological change', Regional Science and
Urban Economics, 22 (3), 491-508.
Conley, Timothy and Udry, Christopher (2001), 'Social learning through networks: The adoption of
new agricultural technologies in Ghana', American Journal of Agricultural Economics, 668-
73.
Foster, Andrew D and Rosenzweig, Mark R (1995), 'Learning by doing and learning from others:
Human capital and technical change in agriculture', Journal of political Economy, 1176-209.
--- (2010), 'Microeconomics of technology adoption', Annual Review of Economics, 2.
Holloway, Garth, Shankar, Bhavani, and Rahmanb, Sanzidur (2002), 'Bayesian spatial probit
estimation: a primer and an application to HYV rice adoption', Agricultural Economics, 27
(3), 383-402.
Krishnan, Pramila and Patnam, Manasa (2014), 'Neighbors and Extension Agents in Ethiopia: Who
Matters More for Technology Adoption?', American Journal of Agricultural Economics, 96
(1), 308-27.
Liverpool-Tasie, Lenis Saweda O and Winter-Nelson, Alex (2012), 'Social Learning and Farm
Technology in Ethiopia: Impacts by Technology, Network Type, and Poverty Status', The
Journal of Development Studies, 48 (10), 1505-21.
Liverpool-Tasie, Lenis Saweda O, Adjognon, Serge, and Kuku-Shittu, Oluyemisi (2015),
'Productivity effects of sustainable intensification: The case of Urea deep placement for rice
production in Niger State, Nigeria', African Journal of Agricultural and Resource
Economics Volume, 10 (1), 51-63.

14
Loomis, John B, et al. (2013), 'A Spatial Probit Modeling Approach to Account for Spatial
Spillover Effects in Dicotomous Choice Contingent Valuation Surveys', Journal of
Agricultural and Applied Economics, 45 (01).
Manski, Charles F (1993), 'Identification of endogenous social effects: The reflection problem', The
review of economic studies, 60 (3), 531-42.
Pace, R Kelley and LeSage, JP (2009), 'Introduction to spatial econometrics', Boca Raton, FL:
Chapman &Hall/CRC.
Wooldridge, Jeffrey M (2002), Econometric analysis of cross section and panel data (The MIT
press).