spatial-spectral cross-correlation for change detection ---a
TRANSCRIPT
ASPRS 2007 Annual Conference Tampa, Florida ♦ May 7-11, 2007
SPATIAL-SPECTRAL CROSS-CORRELATION FOR CHANGE DETECTION ---A CASE STUDY FOR CITRUS COVERAGE CHANGE DETECTION
Zhengwei Yang Rick Mueller
United States Department of Agriculture National Agricultural Statistics Service Research and Development Division 3251 Old Lee Highway, Room 305
Fairfax, VA 22030 [email protected]
[email protected] ABSTRACT Citrus tree change detection is of great importance for citrus production (inventory) analysis and forecasting. The National Agricultural Statistics Service’s recent citrus GIS modernization effort built the GIS infrastructure for the entire State of Florida. To detect changes in citrus acreage, it is necessary to detect not only the land coverage changes between the citrus groves and other land uses, but also the changes in the existing citrus groves, such as tree removal, tree replacement, abandonment or new plantings. There are many change detection techniques applicable if proper imagery is available. However, the data available to our program is collected from different cooperating Florida State Agencies and they originate from different sensors with differences in radiometric, dynamic range, spatial resolution and spectral bands. Spectral signature correlation is one of the spectral based change detection methods, which can overcome radiometric and dynamic range differences. However, it does not solve the mixed-pixel effect caused by resolution difference. In this paper, a spatial-spectral cross-correlation method is presented. This method generalized correlation coefficients defined in a spatial domain or a spectral domain into a spatial-spectral domain. It has shown that either spatial or spectral correlation coefficients are a special case of spatial-spectral cross-correlation coefficients. This method is spatial-spectral signature based; it is invariant to the dynamic range and robust to radiometric difference, the noise and the mixed-pixel effect; yet it is straightforward with minimum preprocessing required. Finally, experimental results will be presented as a comparison between spatial-spectral correlation and spectral correlation methods.
INTRODUCTION
The detection of change or presence of an object in a given scene is one of the most important tasks in image and remote sensing analysis. Change detection in remote sensing is basically the further interpretation of image scene matching among the imageries acquired at different dates. It highlights and reflects the land cover, land use, the soil condition, wetness, and biomass changes, etc. For the USDA, National Agricultural Statistics Service (NASS), the Florida citrus tree cover change detection is of great importance for the citrus tree cover maps updating, the citrus production statistics, citrus tree monitoring, and policy making. Maintaining an accurate citrus tree inventory is necessary for the Florida Citrus industry, as the industry currently has active production in over 700,000 acres, with urban sprawl, hurricanes and citrus diseases driving rapid changes and the need for monitoring and tracking these changes is necessary, therefore developing a change detection tool is needed. Citrus change detection method in NASS has been traditionally performed by using stereo scopes to manually interpret field changes. Over 1,200 maps and photographs are analyzed and redrawn biennially. This manual change detection process is labor intensive, inefficient and non-ergonomic. Therefore, the need to automate or semi-automate the process of citrus tree change detection based on remotely sensed data is required in the NASS Florida Field Office. There are many change detection methods that have been developed over the past 30 years. In general, the change detection methods can be classified into two main categories: pre-classification spectral change detection and post-classification change detection methods. The pre-classification spectral change detection methods, sometimes called spectrally-based methods. They include image differencing (Weismiller et al, 1977), change vector analysis (Malila, 1980), inner product analysis (Inamura et al., 1982 and Yasuoka et al., 1988), spectral correlation analysis (Coiner, 1980 and Yasuoka et al., 1988), image ratioing (Howarth and Wickware, 1981), vegetation index

ASPRS 2007 Annual Conference Tampa, Florida ♦ May 7-11, 2007
differencing (Nelson 1983), normalized image differencing, radiometrically normalized image differencing, principal component analysis and comparison (Byrne et al., 1980, Richardson and Milne, 1983, Singh and Harrison 1985, Fung and LeDrew 1987). Among these methods, the image differencing method is the most straightforward, in which the co-registered images from two dates are simply subtracted pixel by pixel. However, it requires images from two different dates to have the same spectral coverage, dynamic range, and precise co-registration. The normalized image differencing and the radiometrically-normalized image differencing methods are just image differencing methods with preprocessing, which may improve the change detection results. For images with different spectral coverage, it may deliver only limited improvement. Image ratioing is another straightforward change detection method, but it is sensitive to registration error and radiometric variations. The inner product method is another pixel-wise method, which measures the cosine of the angle between two corresponding pixel spectral vectors from different dated images. This method is sensitive to registration error and mixed-pixel effects. It is also sensitive to changes in absolute radiance and fluctuation in the sensor gain and offsets (Yasuoka et al., 1988). The vegetation index differencing method uses the ratios or differences of vegetation indices from two different images. The vegetation index usually tends to normalize the irradiance responses of different bands, which reduces the effect of the radiometric distortion in the images. This method is spectral band dependent and requires the same spectral band coverage for the sensor used for acquiring images on different dates. The principal component analysis (PCA) based change detection method is good for global image comparison and it is insensitive to image registration errors. However, its interpretation often requires experience and knowledge of the image data being studied. It needs further visual and/or analytical analysis, such as the differencing or ratioing to extract change information (Yuan, et al., 1998). The change vector analysis by Malila (1980) is a very special change detection method. It uses spectral and spatial information to perform spatial-spectral clustering on a two temporal image data set to find the homogeneous area. This method first locates the homogeneous area in each image, and computes the change vector using the located area of spectral signatures of two images. The change vector magnitude provides the change level while the angle determines the type of change. The major drawback of this method is the difficulty in setting parameters for locating the homogeneous area (Hame, et al., 1998). Similar to raw image differencing, the change vector analysis method is sensitive to misregistration and mixed-pixel and to the radiometric differences between two studied images. The post-classification methods first classify each of two images from different dates into various different classes with or without supervision. The areas of change are then identified via a direct comparison between the two classification maps. There are many different classification methods, such as maximum likelihood (Duda and Hart 1973), Bayesian Network (Cheng and Greiner 1999, Park and Stenstrom 2003), Neural Network (Yoshida and Omatu 1994), Gabor Filter texture modeling (Yang and Lishman 2003), Support Vector Machine (Goncalves et al, 2006), and Classification and Regression Trees (Breiman et al, 1984), etc. Each method has its advantages and disadvantages. The detection accuracy for post-classification change generally depends upon on the accuracy of the classification method used. This category of methods sometimes leads to low accuracy because two classification results are compared, i.e., the classification errors from both results are propagated to the change detection evaluation. In the worst case, the change detection errors could be the sum of both classification errors. They are usually more complicated, require experienced, well-trained analysts to perform the classification and to interpret the results. The post-classification comparison methods are generally good for land coverage type change detection, but it is difficult to use to detect citrus growth change since the inter-class changes are not well defined.
DATA REQUIREMENTS AND FLORIDA CITRUS IMAGERY DATA
Change Detection Data Requirements To perform a systematic change detection study, two data sets acquired at different times are required. Whether
the change detection method can be effectively used mainly depends on the data availability and data quality. The ideal imagery data for change detection purposes should meet these requirements: 1) The imagery should be acquired from the same sensor with the physical parameters unchanged, such as radiometric calibration, image resolution, pixel dynamic range and the spectral coverage remaining unchanged; 2) The image should be taken during the same season; 3) The weather conditions should be nearly identical; 4) The images should be geo-rectified; 5) The images should be accurately registered under the same map projection parameters (Different map projections will introduce additional errors); and 6) It should be radio-metrically corrected. These are general data requirements for change detection. In reality, many imagery data sets may not meet these ideal requirements. Therefore, it is necessary to evaluate the available Florida citrus imagery data against these requirements first. Then

ASPRS 2007 Annual Conference Tampa, Florida ♦ May 7-11, 2007
it is necessary to find out a method that is applicable to the data conditions, or figure out a new change detection method applicable to the data conditions. The basic assumptions in this change detection study are: changes in citrus cover result in changes in radiance values; changes in radiance due to citrus cover changes are larger with respect to that caused by other factors such as differences in atmospheric condition, differences in soil moisture, citrus tree bedding/maintenance issues, tree health factors such as diseases like canker, tristezia, and greening, and differences in sun angles. In addition, it is assumed that the image data is already geo-rectified, registered and that the image scenes all overlap each other.
Experiment Data --- the Florida Citrus Data
Florida citrus imagery data is not systematically acquired. It comes from various sources and is acquired by different agencies written under different acquisition contracts that have different specifications and requirements, both temporal and spatial, with different sensors. It was determined that the available Florida citrus aerial imagery data for this change detection study was acquired in 2004 and 1999 with different sensors; one was taken with a digital camera while the other was taken with a film camera and scanned with a film scanner. The imageries were acquired in different years and have different spatial resolutions; one is 1 meter, the other is 2 meters. Their dynamic ranges are different; one is 8-bit while the other is 16-bit. The spectral coverage of the images from different sensors is different, though the number of bands are the same; one image has R/G/IR bands while the other has R/G/B bands. It was also found that the images were geo-rectified and geo-referenced to within one pixel level of error. However, the map projection information from the image set acquired in 1999 was missing. It had to be fixed before the data could be used for change detection. Finally, the exact imagery acquiring time and the weather conditions were unknown for both images; the atmospheric condition and sun angles were not corrected and compensated either. The differences in spatial resolutions between the different images may cause the “mixed pixel” effect. For every pixel of the lower resolution image, it covers multiple pixels in the higher resolution image. Those higher resolution image pixels may belong to different cover types (or classes). Obviously, there are differences caused by the difference in the resolution. This type of difference will usually be detected by the pixel-wise operation based, pre-classification change detection methods. Therefore, a change detection method with the capability of compensating for the “mixed pixel” effect is needed. Florida citrus data sets came from different sensors, which resulted in differences in radiometric, dynamic range, spatial resolution and spectral band coverage, making the change detection task very difficult. With the existing data conditions, it is necessary to find a change detection technique that is invariant to the radiometric and dynamic range differences, and at the same time, handle the “mixed pixel” problem caused by the different spatial resolutions from the different sensors. Moreover, the method should require only minimum preprocessing and should be easy to use for end users. As discussed above, each of those change detection methods discussed has its pros and cons and none of them is found to be completely matched for solving the citrus change detection problem. In the next section, the correlation methods are examined to see if it can solve this problem.
SPATIAL CORRELATION AND SPECTRAL CORRELATION
The normalized spatial correlation is widely used for template matching among image scenes without transformational distortion. It is assumed that the images pixel is a scalar, i.e. there is only one band. The principle of using cross-correlation for template matching is that the cross correlation coefficient provides a measure of the similarity between the template and the targeted image region in the spatial domain. For given images f(x,y) and g(x,y), the normalized cross correlation (or correlation coefficient) is given by:
∑∑∑∑
∑∑
∈ ∈∈ ∈
∈ ∈
−++−++
−++−++
=
Wx WyWx Wy
Wx Wy
jifyjxifjigyjxig
jifyjxifjigyjxigjic
22 )],(),([)],(),([
)],(),()][,(),([),( (1)

ASPRS 2007 Annual Conference Tampa, Florida ♦ May 7-11, 2007
where
∑∑∈ ∈
++=Wx Wy
yjxigW
jig ),(1),( 2
∑∑∈ ∈
++=Wx Wy
yjxifW
jif ),(1),( 2
As shown in formula (1), the correlation coefficient is calculated over a given image window, which means the
spatial correlation coefficient measures the similarity of a local image area of a given window size between images f(x, y) and g(x, y), i.e., it can only be used for detecting the regional radiance change of one-band images, not for detecting the pixel-wised, detailed changes. For two multi-spectral imageries f(x, y, k) and g(x, y, k), however, a normalized spectral cross correlation is defined as pixel based operation:
22 ),(),(),(),(
)],(),([)],(),([),(jifjifjigjig
jifjifjigjigjicT
−−
−−= (2)
where:
⎥⎥⎥⎥
⎦
⎤
⎢⎢⎢⎢
⎣
⎡
=
),,(...
)2,,()1,,(
),(
Ljig
jigjig
jig ,
⎥⎥⎥⎥
⎦
⎤
⎢⎢⎢⎢
⎣
⎡
=
),,(...
)2,,()1,,(
),(
Ljif
jifjif
jif
∑=
=L
kkjig
Ljig
1),,(1),(
∑=
=L
kkjif
Ljif
1),,(1),,(
Formula (2) represents a pixel-wise measure of the spectral signature similarity between two different multi-
spectral images. The most similar signature will have the highest correlation with little change, while the lowest correlation indicates the biggest change in signature. The successful applications of this method for change detection have been reported (Coiner, 1980 and Yasuoka et al., 1988). Coiner (1980) used spectral correlation methods to monitor changes in vegetation cover induced by desertification processes and Yasuoka et al. (1988) used this method to detect land cover changes. Yasuoka et al. found that the spectral correlation method substantially reduced the radiometric effects among scene-to-scene radiometric differences as compared with the inner product method. This is a critical advantage since most of the image data in the real world has the scene-to scene radiometric difference problem. Moreover, this method overcomes the dynamic range differences between imagery scenes acquired by different sensors. This method is conceptually straightforward and needs minimum data preprocessing. However, it is sensitive to co-registration errors and mixed pixel effects. The correlation coefficient value c(i, j) ranges from -1.0 to 1.0. The c(i, j) becomes 1 when the two spectral signature vectors or two image windows have a linear relationship. For display purposes, it can be rescaled to be in the range from 0~ 255.
ASPRS 2007 Annual Conference Tampa, Florida ♦ May 7-11, 2007
NORMALIZED SPATIAL-SPECTRAL CROSS CORRELATION
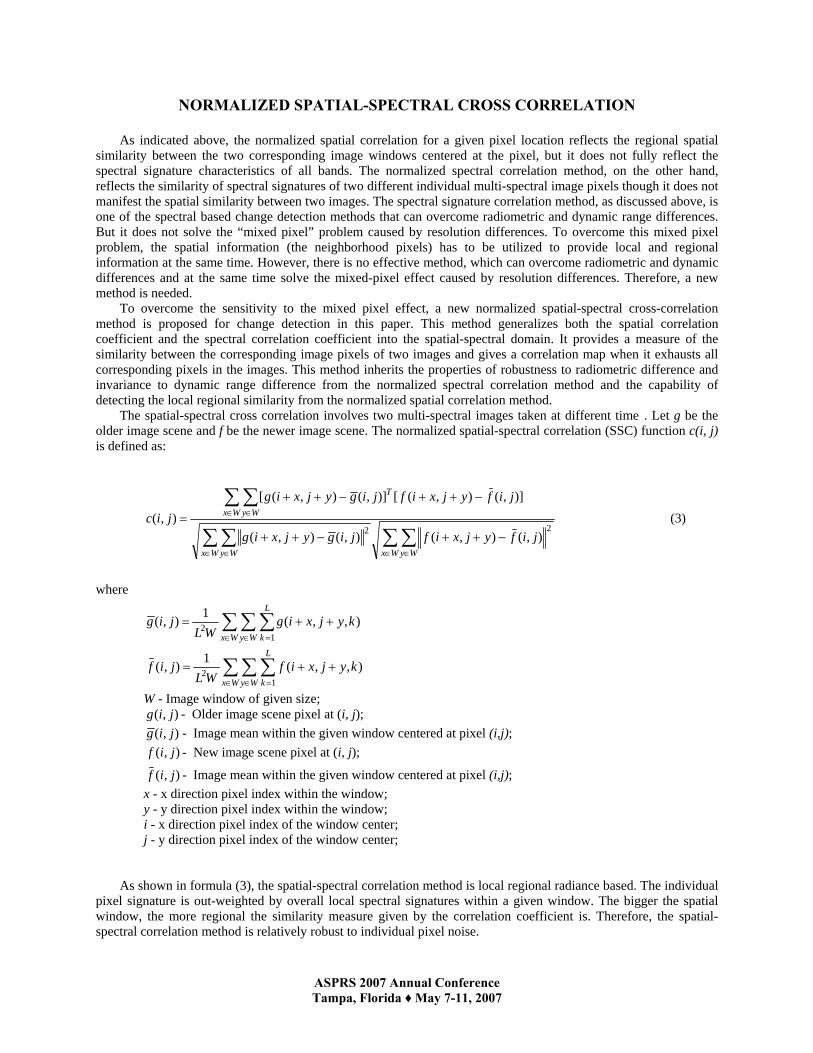
As indicated above, the normalized spatial correlation for a given pixel location reflects the regional spatial similarity between the two corresponding image windows centered at the pixel, but it does not fully reflect the spectral signature characteristics of all bands. The normalized spectral correlation method, on the other hand, reflects the similarity of spectral signatures of two different individual multi-spectral image pixels though it does not manifest the spatial similarity between two images. The spectral signature correlation method, as discussed above, is one of the spectral based change detection methods that can overcome radiometric and dynamic range differences. But it does not solve the “mixed pixel” problem caused by resolution differences. To overcome this mixed pixel problem, the spatial information (the neighborhood pixels) has to be utilized to provide local and regional information at the same time. However, there is no effective method, which can overcome radiometric and dynamic differences and at the same time solve the mixed-pixel effect caused by resolution differences. Therefore, a new method is needed. To overcome the sensitivity to the mixed pixel effect, a new normalized spatial-spectral cross-correlation method is proposed for change detection in this paper. This method generalizes both the spatial correlation coefficient and the spectral correlation coefficient into the spatial-spectral domain. It provides a measure of the similarity between the corresponding image pixels of two images and gives a correlation map when it exhausts all corresponding pixels in the images. This method inherits the properties of robustness to radiometric difference and invariance to dynamic range difference from the normalized spectral correlation method and the capability of detecting the local regional similarity from the normalized spatial correlation method. The spatial-spectral cross correlation involves two multi-spectral images taken at different times. Let g be the older image scene and f be the newer image scene. The normalized spatial-spectral correlation (SSC) function c(i, j) is defined as:
∑∑∑∑
∑∑
∈ ∈∈ ∈
∈ ∈
−++−++
−++−++
=
Wx WyWx Wy
Wx Wy
T
jifyjxifjigyjxig
jifyjxifjigyjxig
jic22 ),(),(),(),(
)],(),([)],(),([
),( (3)
where
∑∑∑∈ ∈ =
++=Wx Wy
L
kkyjxig
WLjig
12 ),,(1),(
∑∑∑∈ ∈ =
++=Wx Wy
L
kkyjxif
WLjif
12 ),,(1),(
W - Image window of given size; ),( jig - Older image scene pixel at (i, j);
),( jig - Image mean within the given window centered at pixel (i,j); ),( jif - New image scene pixel at (i, j);
),( jif - Image mean within the given window centered at pixel (i,j); x - x direction pixel index within the window; y - y direction pixel index within the window; i - x direction pixel index of the window center; j - y direction pixel index of the window center;
As shown in formula (3), the spatial-spectral correlation method is local regional radiance based. The individual
pixel signature is out-weighted by overall local spectral signatures within a given window. The bigger the spatial window, the more regional the similarity measure given by the correlation coefficient is. Therefore, the spatial-spectral correlation method is relatively robust to individual pixel noise.

ASPRS 2007 Annual Conference Tampa, Florida ♦ May 7-11, 2007
From the spatial-spectral correlation definition (3), we can easily deduce the relationship among the spatial-spectral correlation, spatial correlation and spectral correlation. If only a single band is to be considered in computation, i.e. set L=1, the spatial-spectral correlation c(i, j) formula (3) becomes the spatial correlation definition as defined in formula (1). However, if the correlation spatial window size is set to 1 in the spatial-spectral correlation, i.e., only one pixel is involved in the spatial-spectral correlation calculation, we see that the spatial-spectral correlation c(i, j) definition (3) reduces into the normalized spectral correlation definition (2). This proves that the spatial correlation and spectral correlation are just special cases of the spatial-spectral correlation. The spatial-spectral correlation generalizes both spatial cross correlation and spectral correlation from the single domain correlation into both spatial-spectral domains.
EXPERIMENTAL RESULTS
Data Preparation and Correction To prepare the data for change detection, the following data processing and corrections were successfully
conducted. The lower resolution image was first re-sampled to match with higher resolution image at 1 meter. The image that was missing map-projection information was then corrected manually with ESRI’s ArcGIS. For the testing of the normalized spectral correlation method and the new normalized spatial-spectral correlation method, there was no other preprocessing having been performed, nor were any radiometric and atmospheric correction performed. The 16-bit image was not rescaled to match the other 8-bit image.
Figure 1. Original 2004 16-bit image Figure 2. Original 1999 8-bit image

ASPRS 2007 Annual Conference Tampa, Florida ♦ May 7-11, 2007
a) band-1 Histogram b ) band-2 Histogram c) band-3 Histogram
Figure 3. Original 2004 16-bit image histograms
a) band-1 Histogram b ) band-2 Histogram c) band-3 Histogram
Figure 4. Original 1999 8-bit image histograms Results of Spectral Correlation and Spatial-Spectral Correlation Change Detection The original input imageries used for this change detection study are demonstrated as Figure 1 and Figure 2. Figure 1 is a 16-bit image taken in 2004, with a resolution of 1 meter. Figure 2 is a 8-bit image taken in 1999, with a resolution of 2 meters. By comparing the same scene image taken in 2004 with the one taken in 1999, it is observed that there are significant radiometric differences. As shown in the image histograms in Figure 3 and Figure 4, the 2004 image has a much larger dynamic range (16-bit) while the 1999 image has only an 8-bit dynamic range. When comparing the histograms of band-1’s of these two images, it is found that their shapes are significantly different. This significant difference originated from the spectral band differences from band 1 of these two images. It is a
Figure 5. Enhanced 2004 16-bit image Figure 6. Enhanced 1999 8-bit image

ASPRS 2007 Annual Conference Tampa, Florida ♦ May 7-11, 2007
Figure 7. Spectral Correlation Map (SC) Figure 8. Spatial-Spectral Correlation
W=1 Map (SSC) with W=3
direct result of the difference in sensors’ radiance response to the land covers. This kind of difference will cause many change detection methods to fail because of their incapability of compensating the difference.
Figure 5 and Figure 6 are the images enhanced with the standard deviation stretch method of Figure 1 and Figure 2 for better visualization only. Figure 7 shows the spectral correlation results between Figure 1 and Figure 2, while Figure 8 shows the spatial-spectral correlation map. Figure 9 and Figure 10 are the corresponding threshold images of the correlation maps as shown in Figure 7 and Figure 8. The bright area in Figure 7 and Figure 8 indicate that the area is highly correlated, i.e. the land cover is unchanged, while the dark area in the Figure 7 and Figure 8 represents the unchanged land cover. However, the images Figure 9 and Figure 10 contrarily highlighted the detected change areas with bright pixels, while the dark area indicates this area remains unchanged. It should be indicated that the correlation maps on Figure 7 and Figure 8 are automatically binarized into either changed or unchanged areas using the ISODATA threshold algorithm. Of course, the different thresholding level will affect highlighting the changes in the change highlight maps Figure 9 and Figure 10.
Figure 9. Threshold Change Map from Figure 10. Threshold Change Map from
SC Map W =1 SSC Map with W =3

ASPRS 2007 Annual Conference Tampa, Florida ♦ May 7-11, 2007
a. Enhanced 2004 16-bit image b. Enhanced 1999 8-bit image
c. Zoomed in SC Map d. Zoomed in SSC Map with W=3
Figure 11. Pixel view
By comparing the enhanced original images in Figure 5 and Figure 6, it is observed that 4 citrus fields in the central bottom part of the citrus grove, and a small part of field in the middle right side of the scene are abandoned. In the upper right portion of the scene, there is a partial block of a citrus field that is not well managed or semi-abandoned. If we look at these fields in the spectral correlation map on Figure 7 and the spatial-spectral correlation map in Figure 8, there is low correlation between them. As shown in the highlighted change maps of Figure 9 and Figure 10, these fields are all highlighted as change areas. Moreover, the subtle semi-abandoned field in the upper right portion of the scene is also well detected as shown in the change maps in Figure 9 and Figure 10.
When comparing the upper left quarter of the enhanced original images Figure 5 and Figure 6, we can see that there is a large complex of buildings constructed in the later 2004 image but not in the earlier 1999 image. The location was originally a citrus field as shown in Figure 6. When looking at this area in the correlation maps on Figure 7 or Figure 8, the new roads in the complex are detected as shown. However, it is surprising that only some of the buildings of the new complex have been detected. From visual inspection of the images Figure 5 and Figure 6, the undetected building area causes significant physical area change. But from the spectral signature perspective, the area should not be detected since the pixel spectral signatures in the area of both images are highly correlated, as shown by the result of the spectral signature correlation method. This problem could be caused by the band spectral coverage differences between two sensors or differences in the building top material. At this moment we don’t know exactly what causes it. In theory, the correlation is defined only if both of the standard deviations of two corresponding image pixels or image windows are finite and both of them are nonzero. For example, if all bands of one of two pixels or image windows are fully saturated, the correlation becomes undefined, i.e., the spectral correlation or spatial-spectral correlation will fail.
When comparing these correlation maps Figure 9 and Figure 10, the overall spectral correlation map and the spatial-spectral correlation map manifest the same correlation mapping spatially. They generally have similar capabilities of global land cover change detection. However, these two methods do behave differently in the local domain. As shown in Figure 11-a and Figure 11-b, the corresponding pixels in the corresponding features between two images are one pixel off in the horizontal direction and around 2 pixels off in the vertical direction. If the pixels at the cross-hair are compared, it is evident that the spatial-spectral correlation method yields smoother results spatially than that of the spectral correlation method as shown in Figure 11-c. and Figure 11-d. In the spectral correlation map as shown in Figure 11-c, the individual pixels jump up-and down dramatically, while the spatial-
ASPRS 2007 Annual Conference Tampa, Florida ♦ May 7-11, 2007
spectral correlation method gives a more continuously patterned result. It does catch the misregistration effect, but it dilutes the effect with the neighborhood pixels. The pixels at the cross-hair neighborhood can be viewed as a mixed-pixel. From that perspective, we see that the spectral correlation method is sensitive to the mixed-pixel, while the spatial-spectral correlation method is robust to it.
CONCLUSION
This paper presented a new method called normalized spatial-spectral correlation for remote sensing change detection. This method generalizes the normalized spatial correlation method and the normalized spectral correlation method from the individual spatial domain and spectral domain into a spatial-spectral domain. This normalized spatial-spectral correlation method is not only intrinsically signature dependent as is the spectral correlation method, but it also utilizes the spatial information. This method needs only minimum pre-processing as does the spectral correlation method. In general, there is no data correction needed. Similar to the normalized spectral correlation method, it also overcomes radiometric differences and image dynamical range differences very well. The advantage of the spatial-spectral correlation method over the spectral correlation method is that it detects changes based on the regional spectral signatures, rather than a single pixel spectral signature. This leads this method to be robust to noise and the mixed-pixel effects and less sensitive to misregistration. As a result, the spatial-spectral correlation method gives a more smoothed, less salt & pepper effect correlation map than the spectral correlation method does. The robustness to the mixed-pixel effect makes this method more attractive for change detection in the case of multi-temporal image data with different spatial resolutions. It is also proved in this paper that both the spatial correlation method and the spectral correlation method are just special cases of the Spatial-Spectral correlation. Like any other method, the spatial-spectral correlation method has its shortcomings. The shortcoming of this method is that it is more computational intensive and it has the common weakness of all normalized correlation methods, i.e., it will fail on any fully saturated data (with the zero variance). Overall, this method can be used for generating a correlation map, which can be used as a global navigation tool or as a local change indication for images of different spatial resolutions.
REFERENCES
Breiman, L., et al, (1984) Classification and Regression Trees, Chapman and. Hall, New York, NY, 1984. Byrne, G.F., P.F. Crapper, and K.K. Mayo (1980), Monitoring land cover change by principal component analysis
of multitemporal Landsat data. Remote Sensing Environ., 10, pp. 175-184. Cheng, Jie, and Greiner, Russell (1999) Comparing Bayesian Network Classifiers, In Proceedings of the 15th
Conference on Uncertainty in Artificial Intelligence, pp. 101-107. Morgan Kaufmann Publishers. Coiner, J.C. (1980) “Using Landsat to monitor change in vegetation cover induced by desertification process”,
Proceedings of the 14th International Symposium of Remote Sensing of Environment, San Juan, Costa Rica, 1980, pp. 1341-1351.
Duda R. O. and Hart P. E., (1973) Pattern Classification and Scene Analysis, New York: John Wiley & Sons. Fung, T. and E. LeDrew (1987), Application of principal components analysis to change detection,
Photogrammetric Engineering and Remote Sensing, 53(12), pp. 16649-165. Goncalves, P., H. Carrao, et al, (2006) Land cover classification with Support Vector Machine applied to MODIS
imagery, in Global Developments in Environmental Earth Observation from Space ( A. Marcl, editor), Millpress, Rotterdam, pp. 517-525
Hame, T. and Heiler, I., (1998) An unsupervised change detection and recognition system for forestry, Int. J. Remote Sensing, Vol. 19, No. 6, pp. 1079-1099.
Howarth, J. P. and Wickware, G. M., (1981) Procedure for change detection using Landsat digital data, Int. J. Remote Sensing Environment, No. 13, pp. 149-160, 1983.
Inamura, M., Toyota, H., and Fujimura S.,(1982) Exterior algebraic processing for remotely sensed multispectral and multitemporal images, IEEE Transactions on Geosciences and Remote Sensing, 20(1), pp. 112-118.
Malila, W. A., (1980) Change vector analysis: an approach for detecting forest changes with Landsat, Proceedings of the 6th Annual Symposium on Machine Processing of Remotely Sensed Data, Purdue University, Indiana (New York: IEEE), pp. 326-335.

ASPRS 2007 Annual Conference Tampa, Florida ♦ May 7-11, 2007
Nelson, R.F. (1983) Detecting forest canopy change due to insect activity using Landsat MSS. Photogrammetric Engineering and Remote Sensing, 49, pp. 1303-1314.
Park, M. and M. K. Stenstrom (2003), Landuse classification for Stormwater Modeling using Bayesian Networks, Diffuse Pollution Conference, Dublin.
Richardson, J.A. and A.K. Milne (1983), Mapping fire burns and vegitation regeneration using principal components analysis. Proc. Of IGARSS ’83, San Francisco, CA, pp.51-56.
Singh, A., (1989) “Digital change detection techniques using remotely sensed data,” Int. J. Remote Sensing, Vol. 10 No. 6, pp. 989-1003, 1989
Singh, A., and A. Harrison (1985), Standard principal components, Int. J. Remote Sensing, 6(6), pp. 883-896. Tomoji Yoshida and Sigeru Omatu, (1994) Neural Network Approach to Land Cover Mapping, IEEE Trans. on
Geoscience and Remote Sensing, Vol 32, NO 5. September 1994 Weismiller, R. A., et al, (1977) Change detection in coastal zone environments, Photogrammetric Engineering and
Remote Sensing, 43, pp. 1533-1539. Yang, F. and Lishman, R.,(2003) Land Cover Change Detection Using Gabor Filter Texture, Proceedings of the
Ninth Int. Conf. on Computer Vision, Nice, France, October Yasuoka, Y. et al., (1988) Detection of land-cover change from remotely sensed images using spectral signature
similarity, Proceedings of the 9th Asian Conference on Remote Sensing, pp. G3-1-G3-6. Yoshida, T and S. Omatu, (1994) “Neural network applications. to land-cover mapping,” IEEE Transactions on
Geoscience. and Remote Sensing 32 (5), pp. 1103-1109. Yuan, Ding, C.D. Elvidge, and R.S. Lunetta (1998), Survey of Multispectral Methods for Land Cover Change
Analysis, Remote Sensing Change Detection, Lunetta & Elvidge, Ed., Ann Arbor Press.