spe distinguished lecturer series spe … · spe distinguished lecturer series ... integrity or...
TRANSCRIPT

SPE DISTINGUISHED LECTURER SERIESis funded principally
through a grant of the
SPE FOUNDATIONThe Society gratefully acknowledges
those companies that support the programby allowing their professionals
to participate as Lecturers.
And special thanks to The American Institute of Mining, Metallurgical,and Petroleum Engineers (AIME) for their contribution to the program.
Eni S.p.A. - E&P Division
Low-cost, Non-invasive, Remote
Pipeline and Well Inspection Technologies
Alberto Di Lullo Eni E&P DivisionSPE – Italian Section
SPE DISTINGUISHED LECTURER SERIES
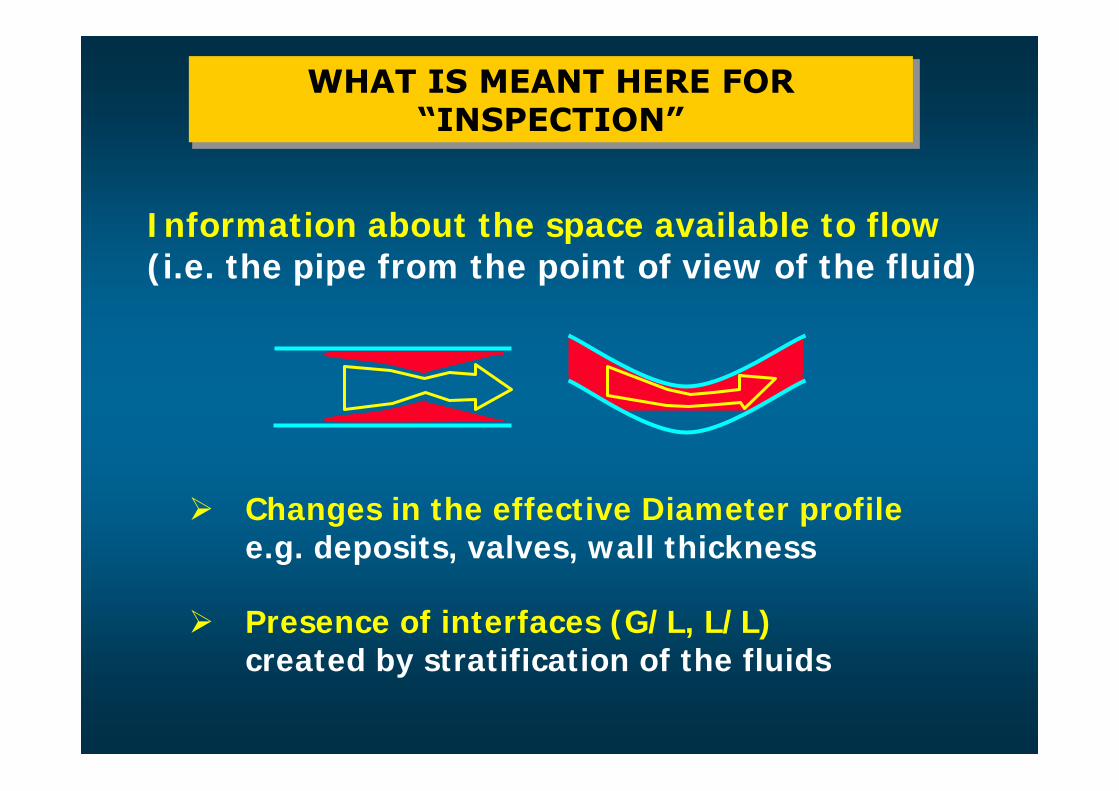
WHAT IS MEANT HERE FOR“INSPECTION”
Information about the space available to flow (i.e. the pipe from the point of view of the fluid)
Changes in the effective Diameter profilee.g. deposits, valves, wall thickness
Presence of interfaces (G/L, L/L)created by stratification of the fluids

FLOW ASSURANCEWAX PLUGS

FLOW ASSURANCEASPHALTENES

FLOW ASSURANCEEMULSIONS

FLOW ASSURANCEDEFINITION
Flow Assurance
guarantees the achievementof the life-time production targets
of a lifting and transportation system
by predicting, preventing and solving problemsdirectly originated by the behavior of
the transported substances(gases, liquids, solids)
either as single phases orin multiphase conditions

WHY FLOW ASSURANCENEEDS MONITORING
• Solutions may reduce the rate of problemsor may create new problems
• Cost reduction leads to progressive optimizations, which must be validated
WE NEED FLOW ASSURANCE MONITORING BECAUSE:
• Some problems require really expensiveinterventions, which must be optimized
• Some problems may affect Pipeline Integrity or impede intelligent pigging

PRESENTATIONAGENDA
Overview
• Contexts needing pipeline and tubing inspection
• Limitations of Steady–State Monitoring Techniques
• Alternatives to Steady–State Techniques
• Transient based inspection technologies
• Field applications and examples
• Conclusions
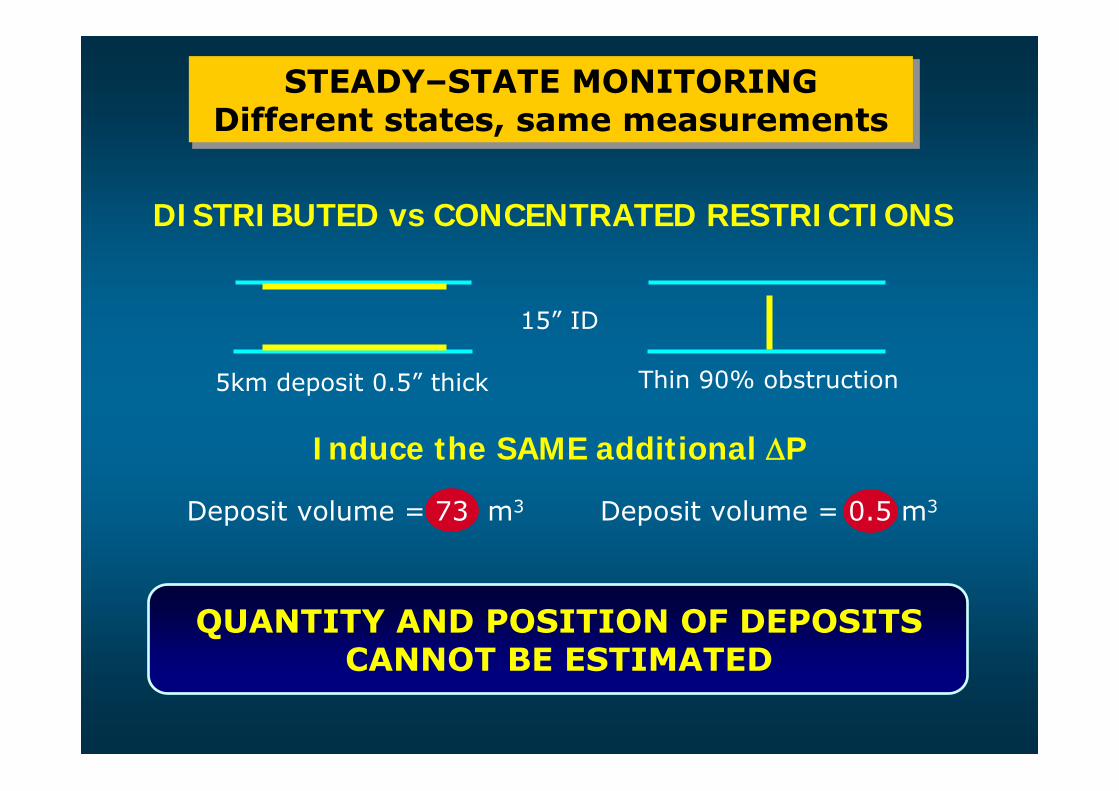
STEADY–STATE MONITORINGDifferent states, same measurements
DISTRIBUTED vs CONCENTRATED RESTRICTIONS
5km deposit 0.5” thick Thin 90% obstruction
QUANTITY AND POSITION OF DEPOSITSCANNOT BE ESTIMATED
15” ID
Deposit volume = 73 m3 Deposit volume = 0.5 m3
Induce the SAME additional ΔP
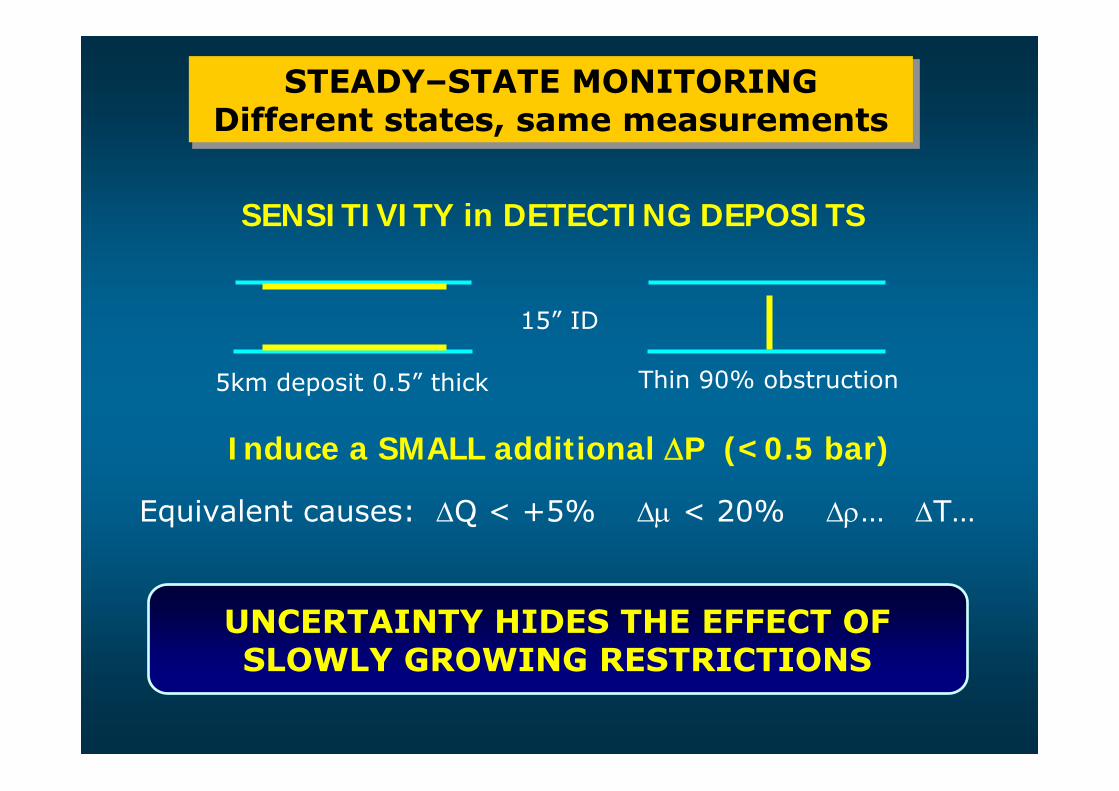
STEADY–STATE MONITORINGDifferent states, same measurements
Induce a SMALL additional ΔP (<0.5 bar)
5km deposit 0.5” thick Thin 90% obstruction
Equivalent causes: ΔQ < +5% Δμ < 20% Δρ… ΔT…
UNCERTAINTY HIDES THE EFFECT OF SLOWLY GROWING RESTRICTIONS
15” ID
SENSITIVITY in DETECTING DEPOSITS

STEADY–STATE MONITORINGDifferent states, same measurements
SENSITIVITY in DETECTING DEPOSITS
17.0
17.5
18.0
18.5
19.0
19.5
20.0
20.5
0.00 20.00 40.00 60.00 80.00 100.00 120.00 140.00 160.00 180.00 200.00
Volume of deposits [m3] uniform over 5km
ΔP
[b
ar]
Q+5%
Q–5%Minimum volume of deposits
practically detectable
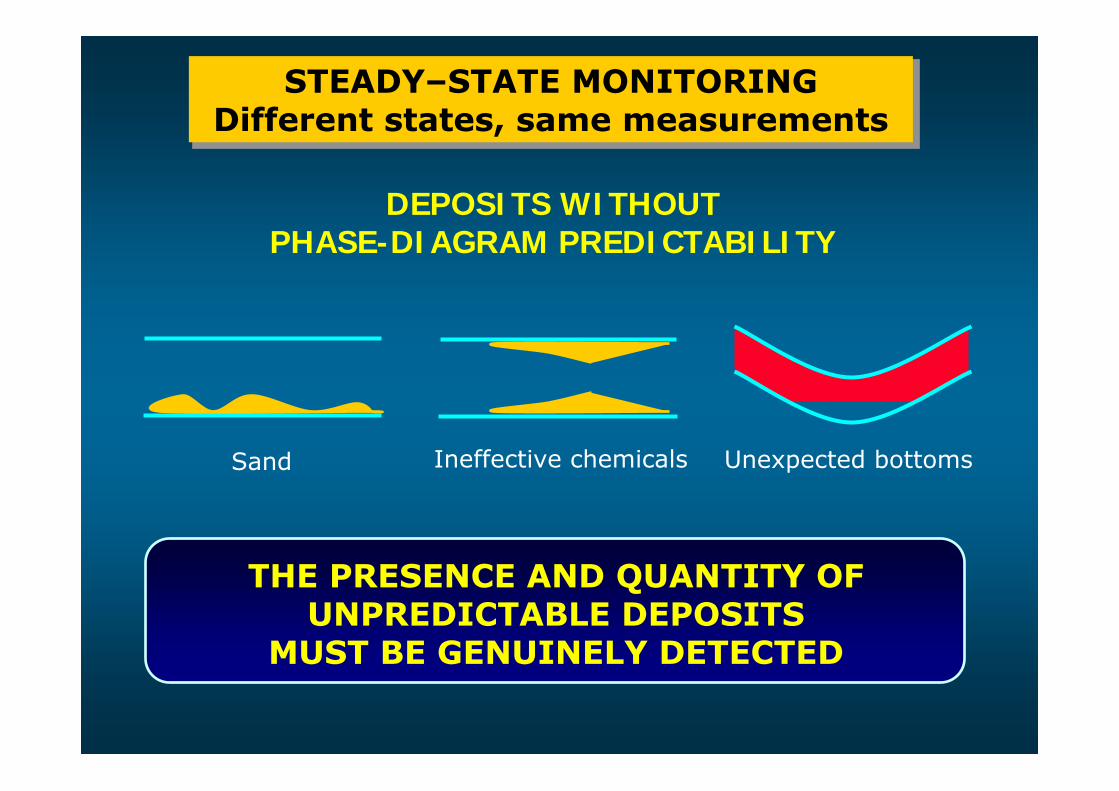
STEADY–STATE MONITORINGDifferent states, same measurements
DEPOSITS WITHOUTPHASE-DIAGRAM PREDICTABILITY
Sand Ineffective chemicals
THE PRESENCE AND QUANTITY OF UNPREDICTABLE DEPOSITS
MUST BE GENUINELY DETECTED
Unexpected bottoms
PRESENTATIONAGENDA
Overview
• Contexts needing pipeline and tubing inspection
• Limitations of Steady–State Monitoring Techniques
• Alternatives to Steady–State Techniques
• Transient based inspection technologies
• Field applications and examples
• Conclusions

ALTERNATIVES TOSTEADY–STATE TECHNIQUES?
TWO POSSIBILITIES
• ANALYSIS OF PASSIVE NOISE
Noise with no change of production conditions
Potentially applicable for continuous monitoring
• ANALYSIS OF FLOWRATE TRANSIENTS
Transients create waves which “explore” the line
Need for temporary changes in production conditions

ALTERNATIVES TOSTEADY–STATE TECHNIQUES?
PRO’S and CON’S OF THE TWO POSSIBILITIES
• PASSIVE NOISEPRO: Works under normal productionCON: Applicable to very short pipelines (<200m?)
• FLOWRATE TRANSIENTSPRO: Applicable to long wells and pipelinesCON: Temporary change of flow conditions
Passive noise not discussed here,but might deserve more exploration
PRESENTATIONAGENDA
Overview
• Contexts needing pipeline and tubing inspection
• Limitations of Steady–State Monitoring Techniques
• Alternatives to Steady–State Techniques
• Transient based inspection technologies
• Field applications and examples
• Conclusions

TRANSIENT-BASED INSPECTIONCONCEPT
1) GENERATING A FAST FLOW RATE TRANSIENT
2) MEASURING THE RESULTING PRESSURE EVOLUTION
3) ANALYZING THE DATA
Flow rateTransient
INSPECTION ACCOMPLISHED BY:
MEASURING PRESSURE IN ONE POINTAND NOT MEASURING FLOWRATE
Pressure sensor
Processing Unit
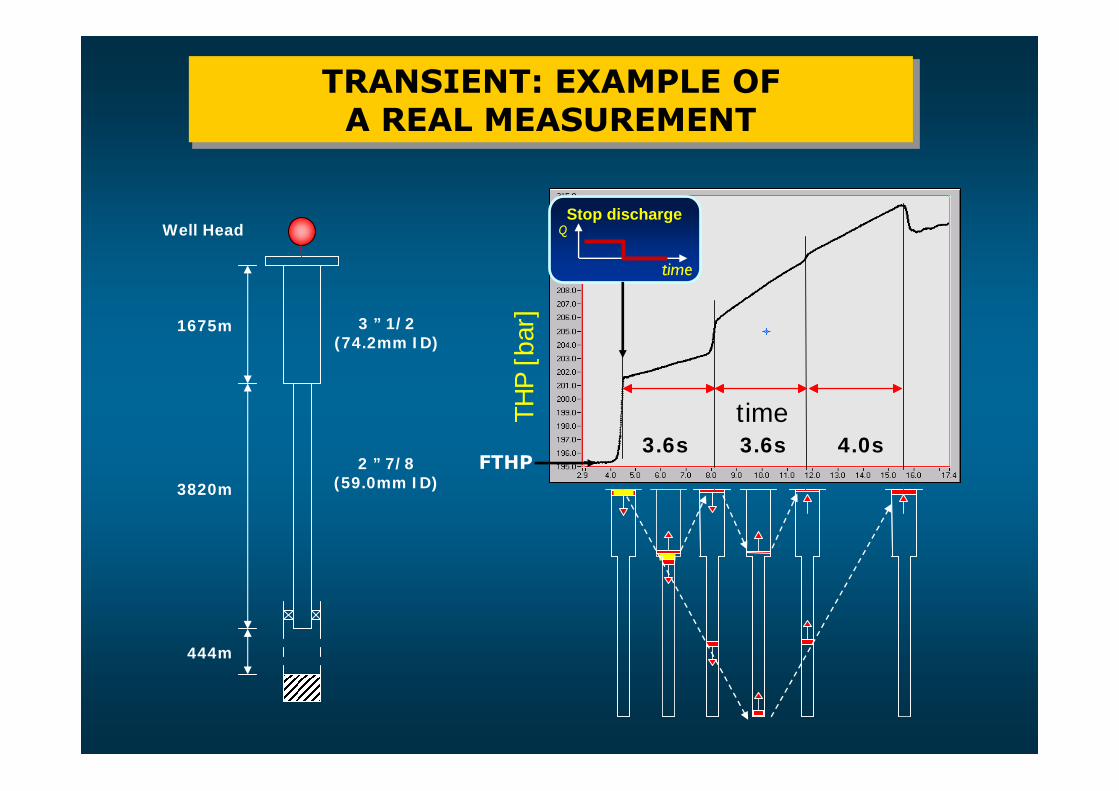
444m
1675m
Well Head
3820m
2 ” 7/8(59.0mm ID)
3 ” 1/2(74.2mm ID)
TRANSIENT: EXAMPLE OFA REAL MEASUREMENT
4.0s3.6s3.6s
THP
[bar
]
time
QStop discharge
time
FTHP

EXPLOITATION OFFLOW RATE TRANSIENTS
TheoryCorrect modeling
Simulation softwarePressure sensorsAccurate at high P
Fast response
Data acquisitionIn the field with operatorsPortable and reliable tools
Inverse problemFrom P data to profileof variables along pipe
EXPLOITING
TRANSIENTS
PATENTED

TRANSIENT–BASEDMEASUREMENTS EXECUTION
TRANSIENTS EXPLOITATION REQUIRES STRONG INTERACTION WITH PLANT OPERATORS:
• There is no “standard plant”Application flexibility is mandatoryOperator’s understanding is mandatory
• Transients must be produced bysomebody’s hands: he/she has to learn how
Can you learn Tango by exchanging e-mails ?

TRANSIENT–BASED, REMOTEINSPECTION TECHNOLOGY
Transient
Based
Inspection
TBI
(In Eni, we call it PRIMEFLO)

PRESENTATIONAGENDA
Overview
• Contexts needing pipeline and tubing inspection
• Limitations of Steady–State Monitoring Techniques
• Alternatives to Steady–State Techniques
• Transient based inspection technologies
• Field applications and examples
• Conclusions
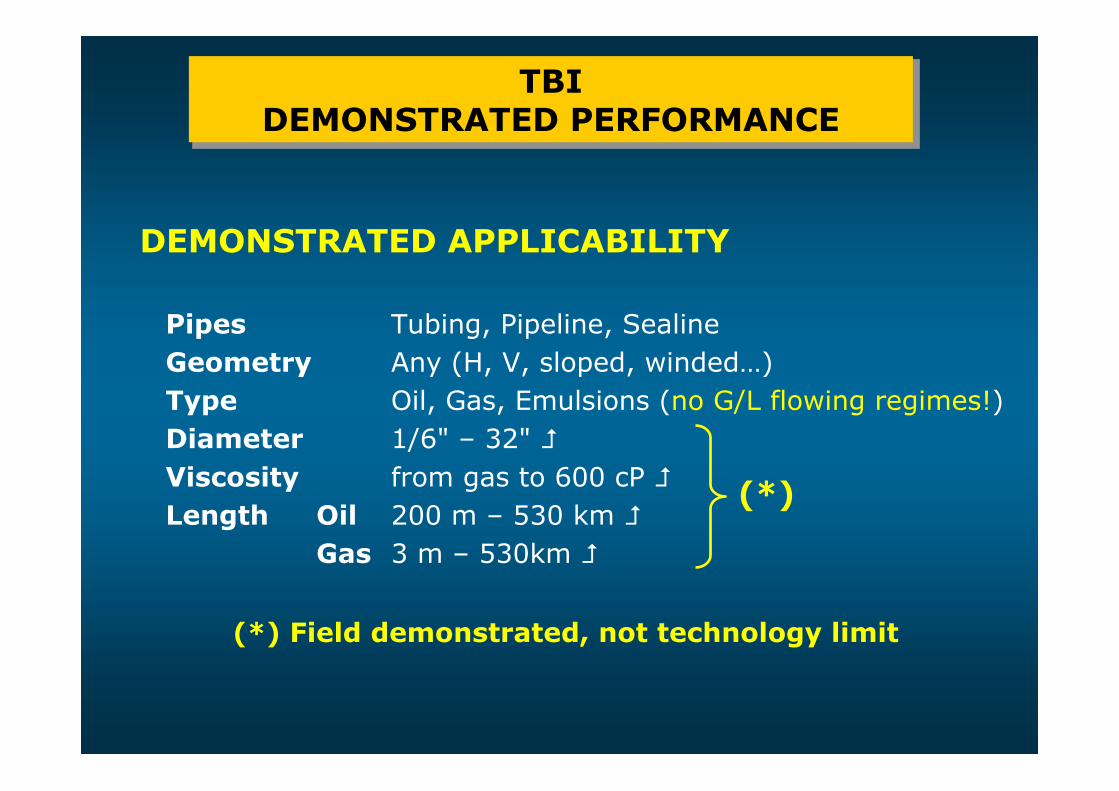
Pipes Tubing, Pipeline, SealineGeometry Any (H, V, sloped, winded…)Type Oil, Gas, Emulsions (no G/L flowing regimes!)Diameter 1/6" – 32" Viscosity from gas to 600 cP Length Oil 200 m – 530 km
Gas 3 m – 530km
TBIDEMONSTRATED PERFORMANCE
DEMONSTRATED APPLICABILITY
(*) Field demonstrated, not technology limit
(*)

TRANSIENTS DISPERSIONEXAMPLE OF OIL PIPELINE (530km)
Signal dispersion (width):negligible broadening after a 1060km trip
Equally true for OIL and GAS pipelines
-1.00
-0.80
-0.60
-0.40
-0.20
0.00
-20 -10 0 10 20Time [s]
dP/d
t [ba
r/s]
-0.10
-0.08
-0.06
-0.04
-0.02
0.00
980 990 1000 1010 1020Time [s]
x10
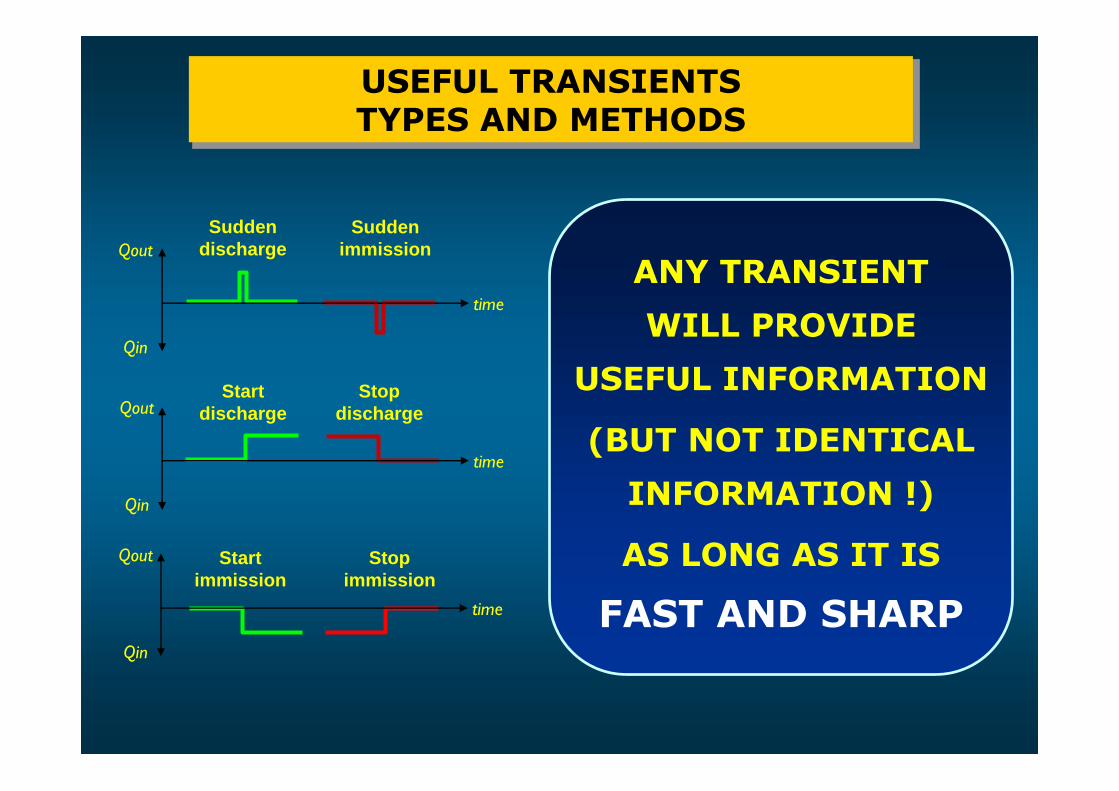
USEFUL TRANSIENTSTYPES AND METHODS
time
QoutSudden
dischargeSudden
immission
Qin
time
QoutStart
dischargeStop
discharge
Qin
time
Qout Startimmission
Stopimmission
Qin
ANY TRANSIENT
WILL PROVIDE
USEFUL INFORMATION
(BUT NOT IDENTICAL
INFORMATION !)
AS LONG AS IT IS
FAST AND SHARP

TBISENSITIVITY
DEMONSTRATED SENSITIVITY
Light crude with μ = 2 cP350’000 m far from sensor, ¼” / 24” diameter change
Heavy crude with μ = 600 cP300 m far from sensor, ⅛” / 16” diameter change
P Distance from sensor
Pipeline

TECHNOLOGYSCOPE
TBI can detect, localize and estimate:
Changes in the effective Diameter profilee.g. deposits, obstructions, restrictions, …
Presence of interfaces (G/L, L/L)created by stratification of the fluids
Changes in composition or propertiesof the transported fluids
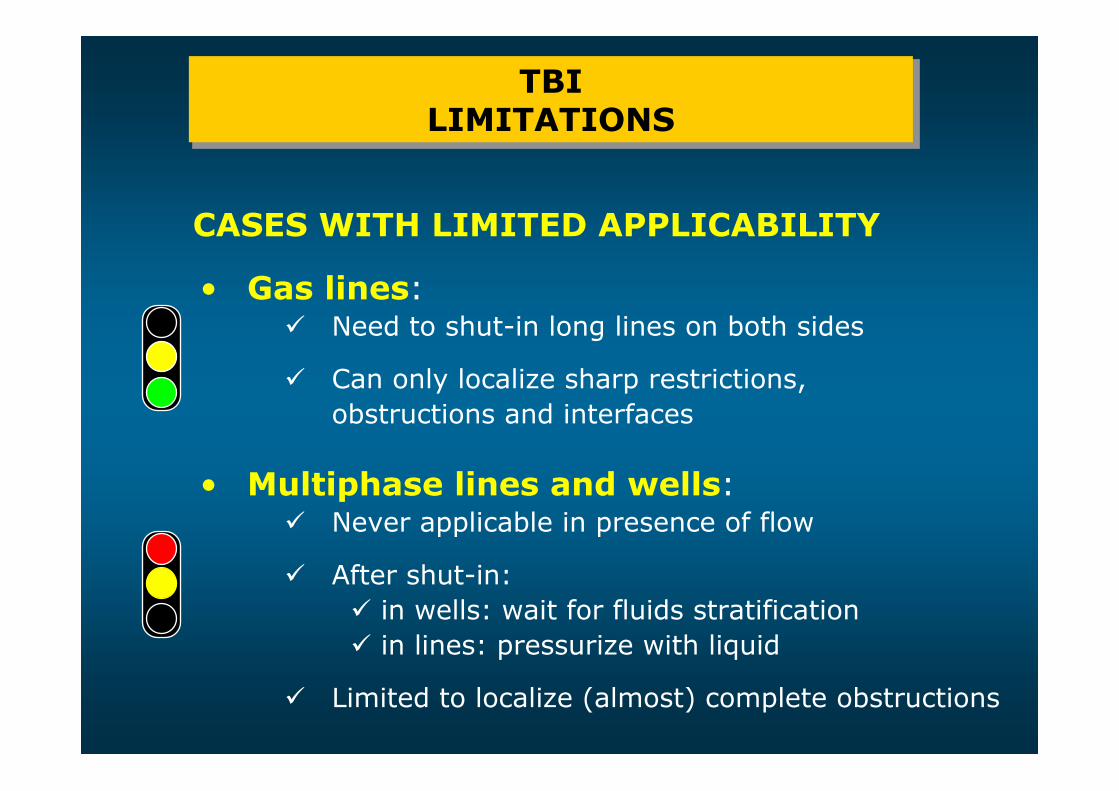
TBILIMITATIONS
CASES WITH LIMITED APPLICABILITY
• Gas lines:Need to shut-in long lines on both sides
Can only localize sharp restrictions, obstructions and interfaces
• Multiphase lines and wells:Never applicable in presence of flow
After shut-in:in wells: wait for fluids stratificationin lines: pressurize with liquid
Limited to localize (almost) complete obstructions

TBILIMITATIONS
CASES WITH LIMITED APPLICABILITY
• Leaks:
No definitive conclusions
Probably applicable only with:
very low ΔP between inside and outside,to avoid critical flow across the leak(hydrostatics may prevent this)
rather big holes, e.g. like a coin
THEFT of hydrocarbons

• Remote: only access to the ends of the pipe is necessary no “walking” along the line
• Fast: measurements does not require long flow stabilization and production is affected for about 5s/km (oil lines) and 15s/km (gas)
• Low risk: nothing is introduced in the line, no excavations, no installation, etc.
• Low cost: see above + low cost instrumentation
LOW–COST, LOW–RISK,REMOTE AND FAST
TBI ATTRIBUTES:

?
TBI APPLICATIONOIL WELL INSPECTION
Well Head
Deposits of unknown nature, localization (tubing/reservoir) and distribution
Plan best remedial technique and verify its effectiveness
Oil well losing productivity

TBI APPLICATIONOIL WELL INSPECTION
Well Head
TBImeasure
Beforeacid job
Internaldiameter profile

TBI APPLICATIONOIL WELL INSPECTION
Deposits actually removed by the acid jobWell Head
-5000
-4500
-4000
-3500
-3000
-2500
-2000
-1500
-1000
-500
0
0.0 1.0 2.0 3.0 4.0 5.0 6.0 7.0 8.0 9.0 10.0
Deposits thickness [mm]
Dep
th[m
]
Diagnosis:Inorganic scales(no asphaltenes
no fines)
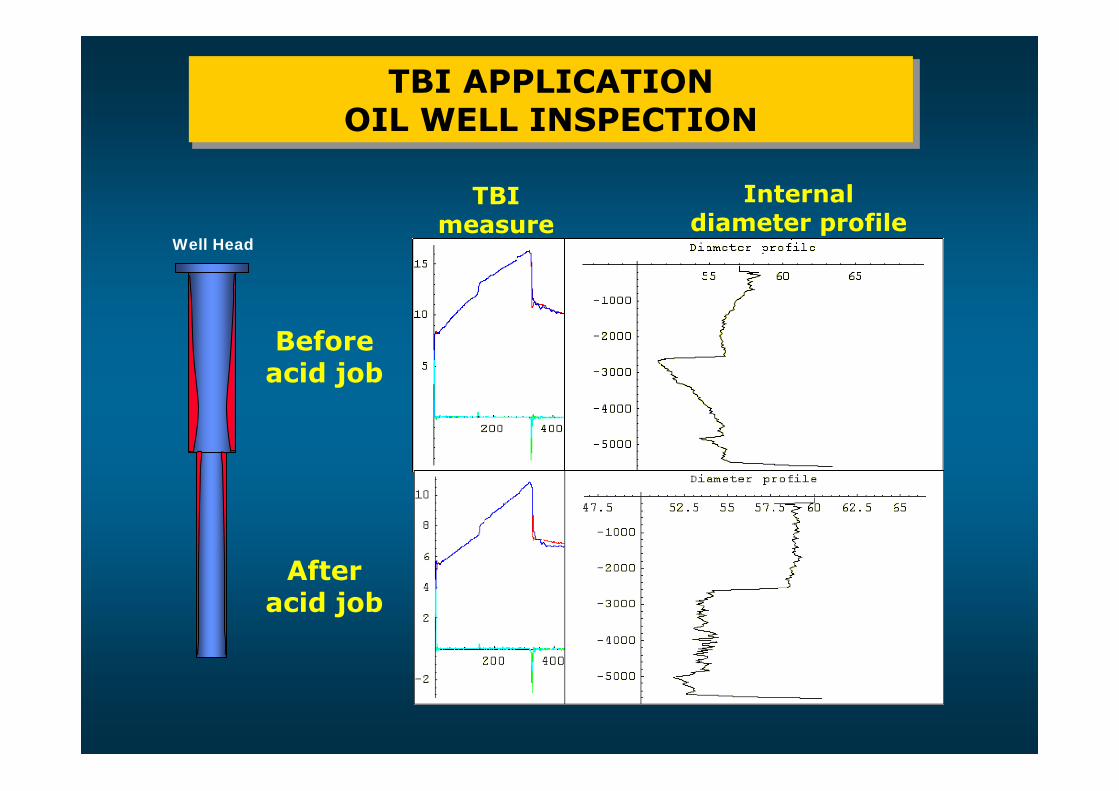
TBI APPLICATIONOIL WELL INSPECTION
Well Head
TBImeasure
Afteracid job
Beforeacid job
Internaldiameter profile

TBI APPLICATIONTO GAS WELLS
Fluid stratification: interface localizationCompletion and wireline operations control
Compositional changes tracking
E.g. "Acoustic Velocities in Petroleum Oils", Zhijing Wang et al., JPT, Feb 1990, p.192-200
The speed of wave propagation enables the detection of
interfaces and of changes in several parameters
The velocity of the flow rate waves is as a function of P, T
and composition
Gas Well
Gasoline
Water
700m
734m
1090m
1160mSand

-140.0
-120.0
-100.0
-80.0
-60.0
-40.0
-20.0
0.0
20.0
40.0
0 10000 20000 30000 40000 50000 60000 70000
Lunghezza della Sealine (m)
Prof
ondi
tà (m
)
Pig positionwas lost
TBI APPLICATIONTO AN OIL SEALINE
sea level
Productionplatform
Onshoreterminal
LOCATE STUCK PIG (OBSTRUCTING)
FINAL SOLUTIONcut and substitute a pipeline section
Stop bywax deposits
-115.0
-114.0
-113.0
-112.0
-111.0
-110.0
9800 10000 10200 10400 10600 10800 11000 11200 11400
CU
T 2
LOCATED PIG
CU
T 1

-20.00
-18.00
-16.00
-14.00
-12.00
-10.00
-8.00
-6.00
-4.00
-2.00
0.00
2.00
0% 10% 20% 30% 40% 50% 60% 70% 80% 90% 100%
Line Lenght [%]
Sign
al [
a.u.]
8.41.13 9.49.57 11.37.49 13.22.26 15.10.51 18:44:56
(grey) Difference due to thedeposits removed by the pig
Progressivepig positions
Curves artificially separatedfor the sake of clarity
TBI APPLICATIONTO PIG TRACKING
Estimate pig arrival time and monitor its tripwhen other tracking techniques not applicable
Pig traveling direction

PRESENTATIONAGENDA
Overview
• Contexts needing pipeline and tubing inspection
• Limitations of Steady–State Monitoring Techniques
• Alternatives to Steady–State Techniques
• Transient based inspection technologies
• Field applications and examples
• Conclusions

ECONOMICCONCLUSIONS
Since its first Eni field application (Dec 2000),TBI impact has been evaluated.
Several million US$ savings on OPEX
(reduction of repair and intervention costs,optimization of well cleaning jobs,reduction of time–to–action)
Several thousands bbl of oil productionNOT delayed or lost

WHAT’S NEXT FOR TBI–LIKE TECHNOLOGIES:
• APPLY TO PRODUCTION OPTIMIZATION(e.g. gas condensate wells)
• TUBING + PIPELINE MONITORING
• NEAR-WELL FORMATION DAMAGE MONITORING
• MULTIPHASE FLOWING SYSTEMS
TBI FUTUREDEVELOPMENTS
TECHNICALCONCLUSIONS
OVERALL TECHNICAL MESSAGE FROM TBI:Often very easy to gain precious information from annoying shutdowns or flowrate changes
GENERATE “CULTURAL” ACCEPTANCE OF TRANSIENTS AS MONITORING TOOLS:
Never apply transients without asking which information they could provide
Stop just “tuning simulations” andstart to “measure through simulations”
Thank you for your attention