spe-spe-181015-ms-ms natural language processing
TRANSCRIPT

SPE-SPE-181015-MS-MS
Natural Language Processing Techniques on Oil and Gas Drilling Data M. Antoniak, J. Dalgliesh, M. Verkruyse, Maana; J. Lo, Chevron Services Company
Copyright 2016, Society of Petroleum Engineers This paper was prepared for presentation at the SPE Intelligent Energy International Conference and Exhibition held in Aberdeen, United Kingdom, 6–8 September 2016. This paper was selected for presentation by an SPE program committee following review of information contained in an abstract submitted by the author(s). Contents of the paper have not been reviewed by the Society of Petroleum Engineers and are subject to correction by the author(s). The material does not necessarily reflect any position of the Society of Petroleum Engineers, its officers, or members. Electronic reproduction, distribution, or storage of any part of this paper without the written consent of the Society of Petroleum Engineers is prohibited. Permission to reproduce in print is restricted to an abstract of not more than 300 words; illustrations may not be copied. The abstract must contain conspicuous acknowledgment of SPE copyright.
Abstract Recent advances in search, machine learning, and natural language processing have made it possible to extract structured information from free text, providing a new and largely untapped source of insights for well and reservoir planning. However, there are major challenges involved in applying these techniques to data that is messy and/or lacking a labeled training set; we cover some of the methods in which these problems can be overcome. We present a method to compare the distribution of hypothesized and realized risks to oil wells described in two datasets that contain free-text descriptions of risks. We treat one dataset as a training set for a logistic regression classifier, and then use this classifier to label in the events in the other, out-of-domain dataset. To adjust for differences between the datasets, we rebalance the training set and supplement it with labeled instances automatically extracted from the test set. These simple domain adaptation techniques allow us to achieve an average F1 score of 0.84 on the out-of-domain test set.
Introduction
In the oil and gas industry, risk identification and assessment is a critical business practice. This holds particularly true during the drilling stages, which cannot begin before a risk assessment is conducted to understand what risks are possible. While these risk assessments are typically conducted in a group setting (in an aptly titled Risk Assessment Meeting), the project drilling engineer will usually have a predetermined list of risks and likelihood scores that are the focus of the conversation.
One problem with this approach is that the drilling engineer is inherently biased by personal experiences, which can affect their view on how likely an event is to happen. For example, if the project drilling engineer recently encountered well control issues, they will likely over-estimate the chance of future well control issues; on the other hand, if they have never encountered a well control issue, it may be unintentionally omitted in their risk assessments altogether. Both scenarios pose problems, and the latter may become even more prevalent during the Big Crew Change, since newer drilling engineers could lack both the experience to assess the full array of risks, and the mentors/guidance to correct their oversight1.
Using historical data as a barometer could help the drilling engineer overcome these issues, though doing so requires a unified view of both prior risk assessments, and prior issues encountered. Chevron possesses both pieces of data, though in disparate systems:
• Risk Assessment (A) database contains descriptions of risks from historical risk assessments • Well Operations Database (B) contains descriptions of unexpected events and associated
unexpected event (UE) codes, which categorize the unexpected events.
All final manuscripts will be sent through an XML markup process that will alter the LAYOUT. This will NOT alter the content in any way.
2 SPE-SPE-181015-MS-MS
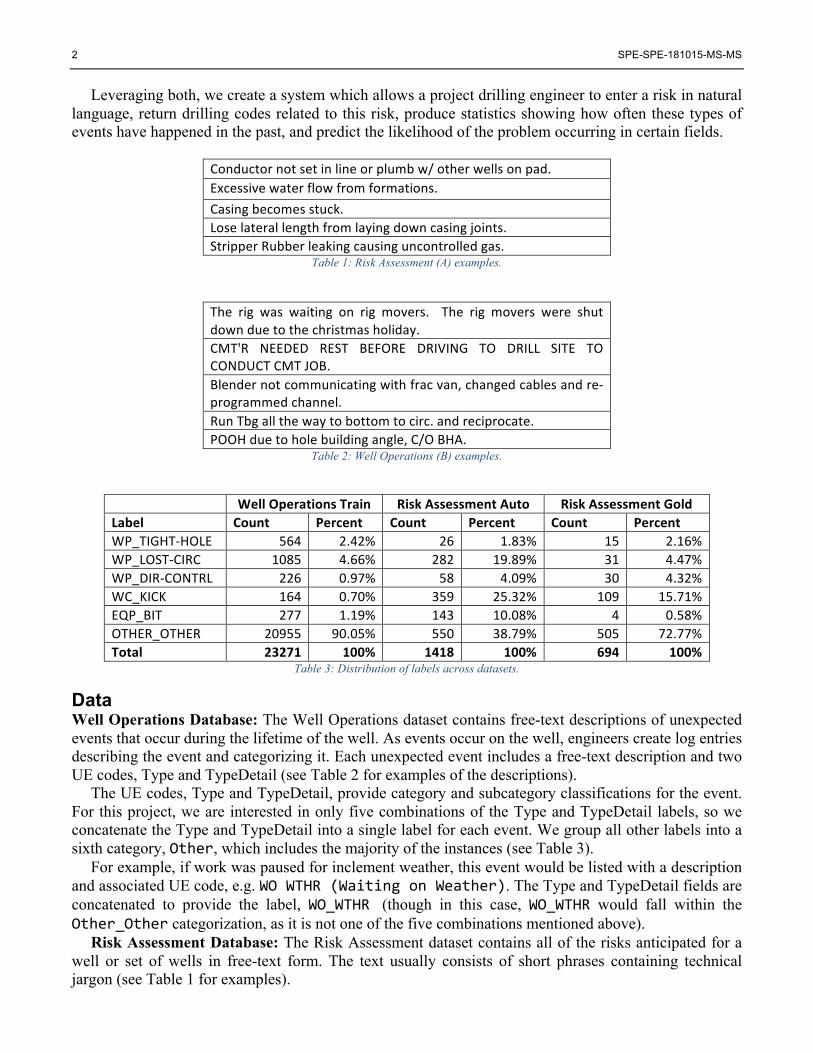
Leveraging both, we create a system which allows a project drilling engineer to enter a risk in natural language, return drilling codes related to this risk, produce statistics showing how often these types of events have happened in the past, and predict the likelihood of the problem occurring in certain fields.
Conductor not set in line or plumb w/ other wells on pad. Excessive water flow from formations. Casing becomes stuck. Lose lateral length from laying down casing joints. Stripper Rubber leaking causing uncontrolled gas.
Table 1: Risk Assessment (A) examples.
The rig was waiting on rig movers. The rig movers were shut down due to the christmas holiday. CMT'R NEEDED REST BEFORE DRIVING TO DRILL SITE TO CONDUCT CMT JOB. Blender not communicating with frac van, changed cables and re-‐programmed channel. Run Tbg all the way to bottom to circ. and reciprocate. POOH due to hole building angle, C/O BHA.
Table 2: Well Operations (B) examples.
Well Operations Train Risk Assessment Auto Risk Assessment Gold Label Count Percent Count Percent Count Percent WP_TIGHT-‐HOLE 564 2.42% 26 1.83% 15 2.16% WP_LOST-‐CIRC 1085 4.66% 282 19.89% 31 4.47% WP_DIR-‐CONTRL 226 0.97% 58 4.09% 30 4.32% WC_KICK 164 0.70% 359 25.32% 109 15.71% EQP_BIT 277 1.19% 143 10.08% 4 0.58% OTHER_OTHER 20955 90.05% 550 38.79% 505 72.77% Total 23271 100% 1418 100% 694 100%
Table 3: Distribution of labels across datasets.
Data Well Operations Database: The Well Operations dataset contains free-text descriptions of unexpected events that occur during the lifetime of the well. As events occur on the well, engineers create log entries describing the event and categorizing it. Each unexpected event includes a free-text description and two UE codes, Type and TypeDetail (see Table 2 for examples of the descriptions).
The UE codes, Type and TypeDetail, provide category and subcategory classifications for the event. For this project, we are interested in only five combinations of the Type and TypeDetail labels, so we concatenate the Type and TypeDetail into a single label for each event. We group all other labels into a sixth category, Other, which includes the majority of the instances (see Table 3).
For example, if work was paused for inclement weather, this event would be listed with a description and associated UE code, e.g. WO WTHR (Waiting on Weather). The Type and TypeDetail fields are concatenated to provide the label, WO_WTHR (though in this case, WO_WTHR would fall within the Other_Other categorization, as it is not one of the five combinations mentioned above).
Risk Assessment Database: The Risk Assessment dataset contains all of the risks anticipated for a well or set of wells in free-text form. The text usually consists of short phrases containing technical jargon (see Table 1 for examples).
SPE-SPE-181015-MS-MS 3
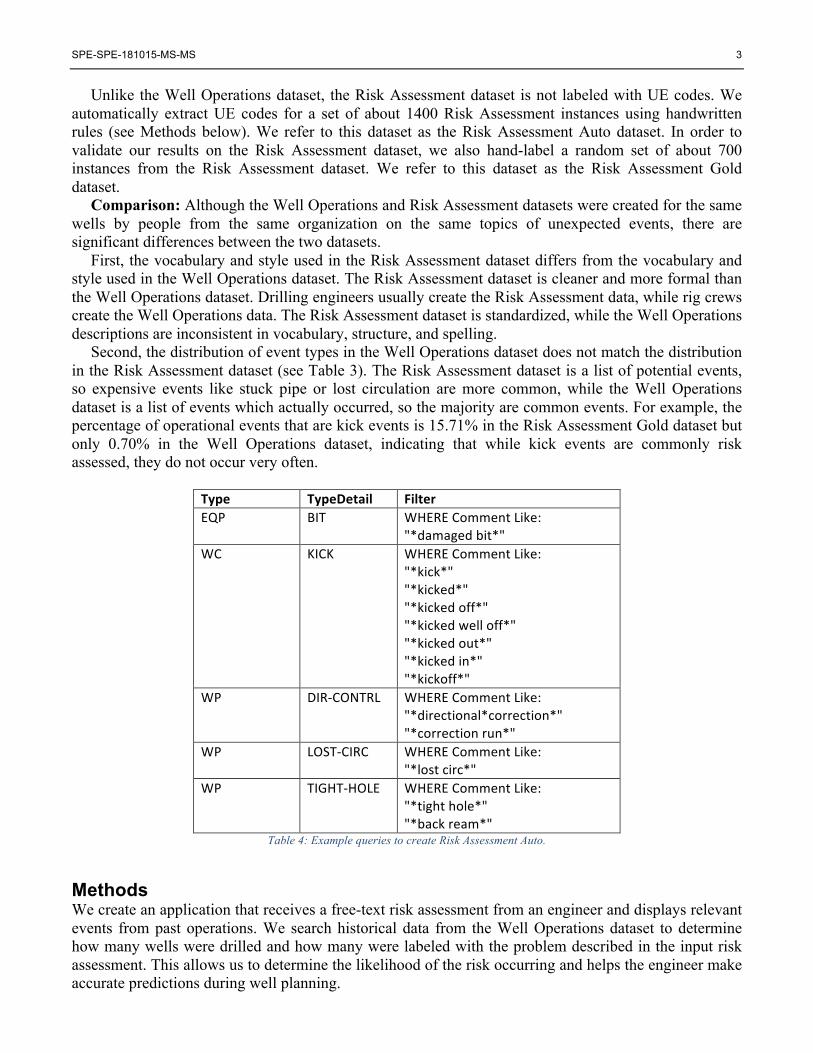
Unlike the Well Operations dataset, the Risk Assessment dataset is not labeled with UE codes. We automatically extract UE codes for a set of about 1400 Risk Assessment instances using handwritten rules (see Methods below). We refer to this dataset as the Risk Assessment Auto dataset. In order to validate our results on the Risk Assessment dataset, we also hand-label a random set of about 700 instances from the Risk Assessment dataset. We refer to this dataset as the Risk Assessment Gold dataset.
Comparison: Although the Well Operations and Risk Assessment datasets were created for the same wells by people from the same organization on the same topics of unexpected events, there are significant differences between the two datasets.
First, the vocabulary and style used in the Risk Assessment dataset differs from the vocabulary and style used in the Well Operations dataset. The Risk Assessment dataset is cleaner and more formal than the Well Operations dataset. Drilling engineers usually create the Risk Assessment data, while rig crews create the Well Operations data. The Risk Assessment dataset is standardized, while the Well Operations descriptions are inconsistent in vocabulary, structure, and spelling.
Second, the distribution of event types in the Well Operations dataset does not match the distribution in the Risk Assessment dataset (see Table 3). The Risk Assessment dataset is a list of potential events, so expensive events like stuck pipe or lost circulation are more common, while the Well Operations dataset is a list of events which actually occurred, so the majority are common events. For example, the percentage of operational events that are kick events is 15.71% in the Risk Assessment Gold dataset but only 0.70% in the Well Operations dataset, indicating that while kick events are commonly risk assessed, they do not occur very often.
Type TypeDetail Filter EQP BIT WHERE Comment Like:
"*damaged bit*" WC KICK WHERE Comment Like:
"*kick*" "*kicked*" "*kicked off*" "*kicked well off*" "*kicked out*" "*kicked in*" "*kickoff*"
WP DIR-‐CONTRL WHERE Comment Like: "*directional*correction*" "*correction run*"
WP LOST-‐CIRC WHERE Comment Like: "*lost circ*"
WP TIGHT-‐HOLE WHERE Comment Like: "*tight hole*" "*back ream*"
Table 4: Example queries to create Risk Assessment Auto.
Methods We create an application that receives a free-text risk assessment from an engineer and displays relevant events from past operations. We search historical data from the Well Operations dataset to determine how many wells were drilled and how many were labeled with the problem described in the input risk assessment. This allows us to determine the likelihood of the risk occurring and helps the engineer make accurate predictions during well planning.
4 SPE-SPE-181015-MS-MS
In order to compare the input risk assessment with the historical data, we enrich the risk assessments with the UE code labels from the Well Operations dataset. Once both datasets are labeled, we are able to both compare a new risk assessment to the historical data and to determine the accuracies of the risk assessment predictions by comparing the distributions of Risk Assessment Database’s risk assessments to the Well Operations’ unexpected events for particular wells and well groups.
To obtain the UE code labels for the risk assessments, we train a statistical classifier on the labeled data in the Well Operation dataset. We split the Well Operations instances into 60% training, 20% development, and and 20% test sets, and we treat the Risk Assessment Database descriptions as an unlabeled test set. We apply a series of preprocessing functions to the free-text descriptions: we lowercase the text, remove numbers and punctuation, extract ngram features, and remove features that occur fewer than 5 times in the Well Operations training set. We use the remaining features to convert each instance into a sparse feature vector.
We train a logistic regression classification model on the Well Operation feature vectors. Label probabilities from the classification model produce a ranked list of UE codes for each test instance. In the final application, a threshold for these scores ensures that classifications with very low confidence are not assigned labels.
Because the UE code labels are very unbalanced and the Other category contains many more instances than the five categories of interest, we balance the classes by reweighting during training. The weights are adjusted inversely proportional to the class frequencies2.
To address the differences in style and vocabulary between the Risk Assessment and Well Operation datasets, we automatically extract a set of labeled instances from the Risk Assessment dataset. We write a series of simple queries (see Table 4) which capture unambiguous UE code matches. We add these instances to the Well Operation training set and use the combined Well Operation + Risk Assessment Auto dataset to train the classification model.
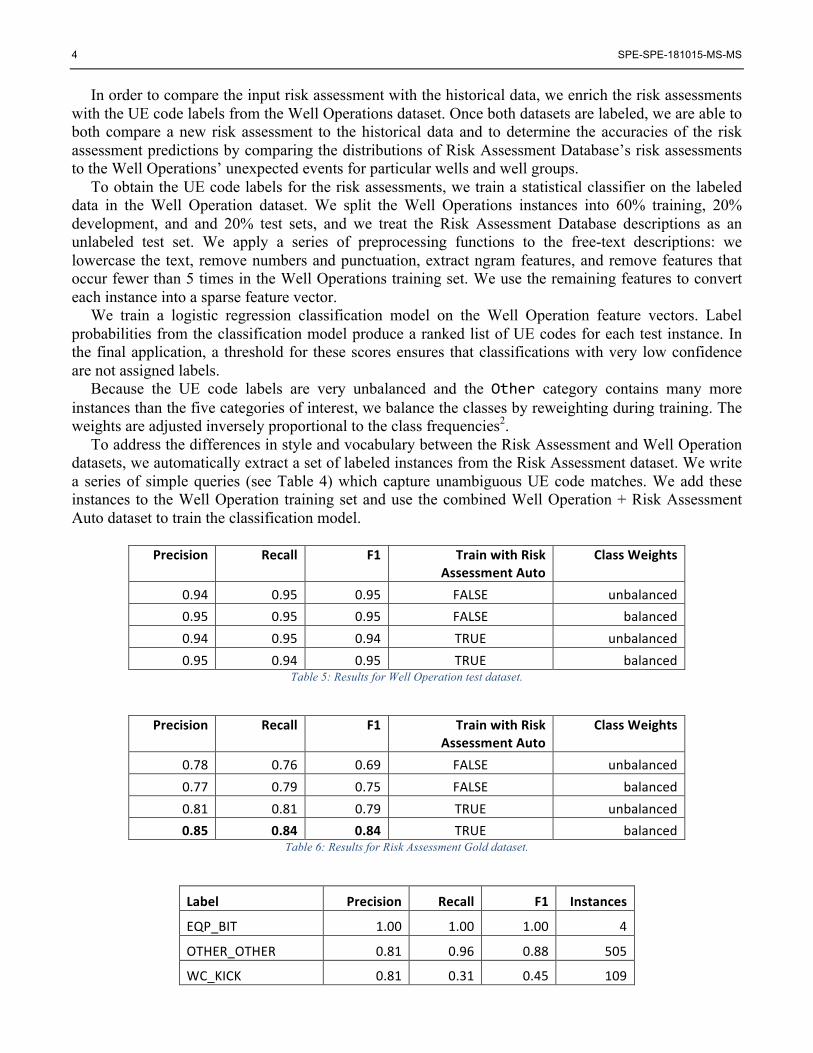
Precision Recall F1 Train with Risk
Assessment Auto Class Weights
0.94 0.95 0.95 FALSE unbalanced 0.95 0.95 0.95 FALSE balanced 0.94 0.95 0.94 TRUE unbalanced 0.95 0.94 0.95 TRUE balanced
Table 5: Results for Well Operation test dataset.
Precision Recall F1 Train with Risk
Assessment Auto Class Weights
0.78 0.76 0.69 FALSE unbalanced 0.77 0.79 0.75 FALSE balanced 0.81 0.81 0.79 TRUE unbalanced 0.85 0.84 0.84 TRUE balanced
Table 6: Results for Risk Assessment Gold dataset.
Label Precision Recall F1 Instances
EQP_BIT 1.00 1.00 1.00 4
OTHER_OTHER 0.81 0.96 0.88 505
WC_KICK 0.81 0.31 0.45 109
SPE-SPE-181015-MS-MS 5
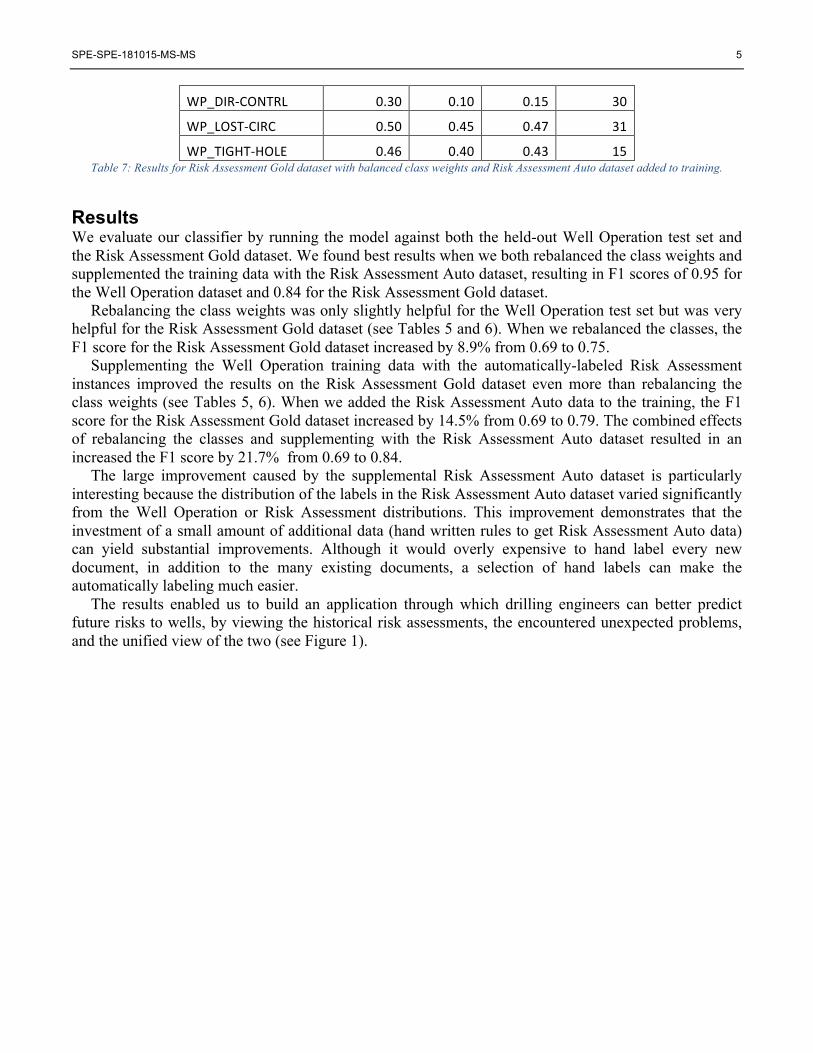
WP_DIR-‐CONTRL 0.30 0.10 0.15 30
WP_LOST-‐CIRC 0.50 0.45 0.47 31
WP_TIGHT-‐HOLE 0.46 0.40 0.43 15 Table 7: Results for Risk Assessment Gold dataset with balanced class weights and Risk Assessment Auto dataset added to training.
Results We evaluate our classifier by running the model against both the held-out Well Operation test set and the Risk Assessment Gold dataset. We found best results when we both rebalanced the class weights and supplemented the training data with the Risk Assessment Auto dataset, resulting in F1 scores of 0.95 for the Well Operation dataset and 0.84 for the Risk Assessment Gold dataset.
Rebalancing the class weights was only slightly helpful for the Well Operation test set but was very helpful for the Risk Assessment Gold dataset (see Tables 5 and 6). When we rebalanced the classes, the F1 score for the Risk Assessment Gold dataset increased by 8.9% from 0.69 to 0.75.
Supplementing the Well Operation training data with the automatically-labeled Risk Assessment instances improved the results on the Risk Assessment Gold dataset even more than rebalancing the class weights (see Tables 5, 6). When we added the Risk Assessment Auto data to the training, the F1 score for the Risk Assessment Gold dataset increased by 14.5% from 0.69 to 0.79. The combined effects of rebalancing the classes and supplementing with the Risk Assessment Auto dataset resulted in an increased the F1 score by 21.7% from 0.69 to 0.84.
The large improvement caused by the supplemental Risk Assessment Auto dataset is particularly interesting because the distribution of the labels in the Risk Assessment Auto dataset varied significantly from the Well Operation or Risk Assessment distributions. This improvement demonstrates that the investment of a small amount of additional data (hand written rules to get Risk Assessment Auto data) can yield substantial improvements. Although it would overly expensive to hand label every new document, in addition to the many existing documents, a selection of hand labels can make the automatically labeling much easier.
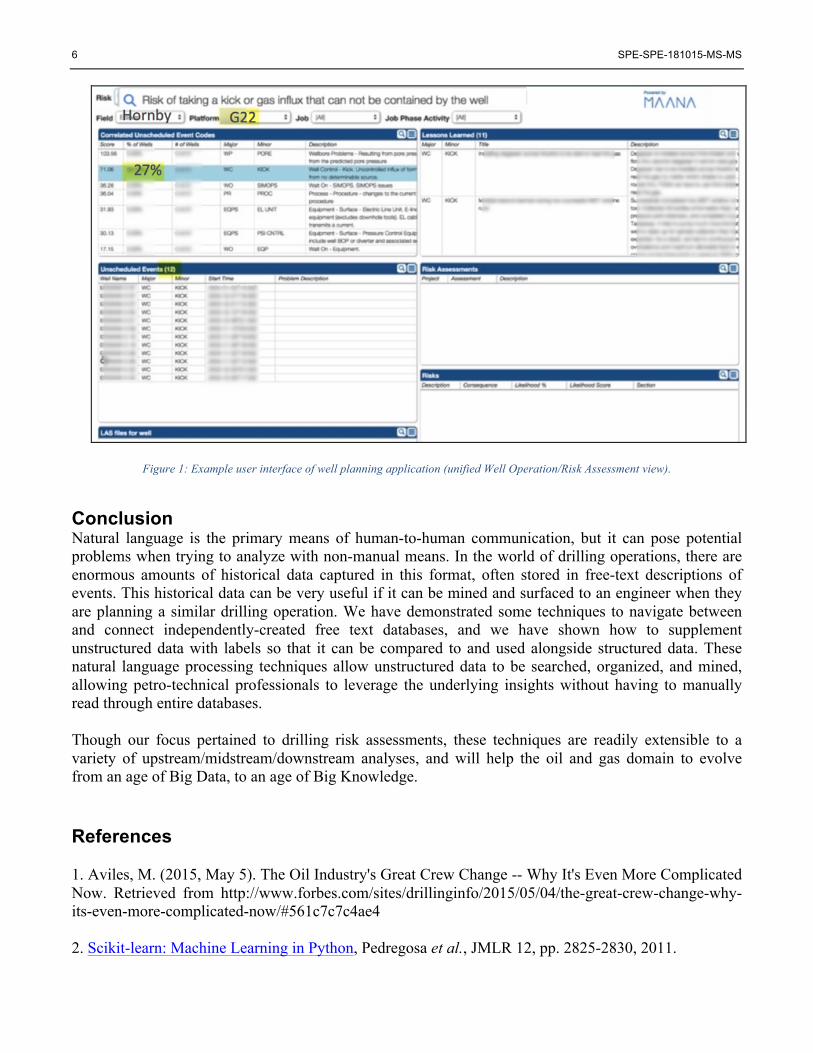
The results enabled us to build an application through which drilling engineers can better predict future risks to wells, by viewing the historical risk assessments, the encountered unexpected problems, and the unified view of the two (see Figure 1).
6 SPE-SPE-181015-MS-MS
Figure 1: Example user interface of well planning application (unified Well Operation/Risk Assessment view).
Conclusion Natural language is the primary means of human-to-human communication, but it can pose potential problems when trying to analyze with non-manual means. In the world of drilling operations, there are enormous amounts of historical data captured in this format, often stored in free-text descriptions of events. This historical data can be very useful if it can be mined and surfaced to an engineer when they are planning a similar drilling operation. We have demonstrated some techniques to navigate between and connect independently-created free text databases, and we have shown how to supplement unstructured data with labels so that it can be compared to and used alongside structured data. These natural language processing techniques allow unstructured data to be searched, organized, and mined, allowing petro-technical professionals to leverage the underlying insights without having to manually read through entire databases. Though our focus pertained to drilling risk assessments, these techniques are readily extensible to a variety of upstream/midstream/downstream analyses, and will help the oil and gas domain to evolve from an age of Big Data, to an age of Big Knowledge. References
1. Aviles, M. (2015, May 5). The Oil Industry's Great Crew Change -- Why It's Even More Complicated Now. Retrieved from http://www.forbes.com/sites/drillinginfo/2015/05/04/the-great-crew-change-why-its-even-more-complicated-now/#561c7c7c4ae4 2. Scikit-learn: Machine Learning in Python, Pedregosa et al., JMLR 12, pp. 2825-2830, 2011.