spherical resorcinol-formaldehyde resin testing for cs … · mj steele, kk thomas, de wallace, nh...
TRANSCRIPT

PNWD-3697WTP-RPT-134, Rev 0
Spherical Resorcinol-Formaldehyde Resin Testing for 137Cs Removal from Simulated and Actual Hanford Waste Tank 241-AP-101 Diluted Feed (Envelope A) Using Small Column Ion Exchange S. K. Fiskum S. T. Arm M. S. Fountain M. J. Steele D. L. Blanchard, Jr February 2006 Prepared for Bechtel National Inc. under Contract No. 24590-101-TSA-W000-00004

LEGAL NOTICE
This report was prepared by Battelle Memorial Institute (Battelle) as an account of sponsored research activities. Neither Client nor Battelle nor any person acting on behalf of either:
MAKES ANY WARRANTY OR REPRESENTATION, EXPRESS OR IMPLIED, with respect to the accuracy, completeness, or usefulness of the information contained in this report, or that the use of any information, apparatus, process, or composition disclosed in this report may not infringe privately owned rights; or
Assumes any liabilities with respect to the use of, or for damages resulting from the use of, any information, apparatus, process, or composition disclosed in this report.
References herein to any specific commercial product, process, or service by trade name, trademark, manufacturer, or otherwise, does not necessarily constitute or imply its endorsement, recommendation, or favoring by Battelle. The views and opinions of authors expressed herein do not necessarily state or reflect those of Battelle.

COMPLETENESS OF TESTING
This report describes the results of work and testing specijied by Test Specijication 24590-PTF-TSP-RT-04-0005, Rev. 0 and Test Plan TP-RPP- WTP-378, Rev. 0, as modijied by test exceptions 24590-PTF- TEF-RT-05-00008 and 24590-PTF-TEF-RT-05-00011. The work and any associated testing followed the quality assurance requirements outlined in the Test Specijication/Plan. The descriptions provided in this test report are an accurate account of both the conduct of the work and the data collected. Test plan results are reported. Also reported are any unusual or anomalous occurrences that are diflerent from expected results. The test results and this report have been reviewed and verijied.
Gordon H. Beeman, Manager WTP R&T Support Project

iii
Contents
Terms and Abbreviations............................................................................................................................vii
References.................................................................................................................................................... ix
Testing Summary ......................................................................................................................................... xi
1.0 Introduction....................................................................................................................................... 1.1
2.0 Experimental..................................................................................................................................... 2.1
2.1 Spherical RF Resin .................................................................................................................. 2.1 2.1.1 Resin Sampling and Pretreatment............................................................................... 2.1 2.1.2 Physical Properties ..................................................................................................... 2.2 2.1.3 Dry Resin Mass .......................................................................................................... 2.3
2.2 Test Feeds ................................................................................................................................ 2.3 2.2.1 Simulant AP-101 ........................................................................................................ 2.3 2.2.2 Actual AP-101 Diluted Feed ...................................................................................... 2.3
2.3 Ion Exchange Column System................................................................................................. 2.5
2.4 Resin Bed Preparation and AP-101 Simulant Shakedown Testing ......................................... 2.6 2.4.1 In-Column Pretreatment ............................................................................................. 2.7 2.4.2 Bed Volume................................................................................................................ 2.7 2.4.3 AP-101 Simulant Processing ...................................................................................... 2.7 2.4.4 Actual Waste AP-101 Diluted Feed Processing ......................................................... 2.9 2.4.5 Sample Analysis ......................................................................................................... 2.9
3.0 Results and Discussion ..................................................................................................................... 3.1
3.1 Feed Compositions .................................................................................................................. 3.1
3.2 Cs Load.................................................................................................................................... 3.3 3.2.1 AP-101 Simulant Test ................................................................................................ 3.3 3.2.2 AP-101 Actual Waste Processing............................................................................... 3.5
3.3 Elution and Eluant Rinse ....................................................................................................... 3.11 3.3.1 AP-101 Simulant Test .............................................................................................. 3.11 3.3.2 AP-101 Actual Waste Test ....................................................................................... 3.12 3.3.3 Activity Balance for 137Cs......................................................................................... 3.15 3.3.4 Resin Volume Changes ............................................................................................ 3.16
4.0 Quality Control ................................................................................................................................. 4.1
4.1 Quality-Assurance Requirements ............................................................................................ 4.1
4.2 Analytical Results.................................................................................................................... 4.1 4.2.1 Inductively-Coupled Plasma–Atomic Emission Spectrometry .................................. 4.9 4.2.2 Inductively Coupled Plasma-Mass Spectrometry....................................................... 4.9 4.2.3 Uranium by Kinetic Phosphorescence Analysis......................................................... 4.9
iv
4.2.4 Gamma Energy Analysis ............................................................................................ 4.9 4.2.5 Americium, Curium, and Plutonium ........................................................................ 4.10 4.2.6 Total Alpha ............................................................................................................... 4.10 4.2.7 Ion Chromatography................................................................................................. 4.10 4.2.8 Hydroxide ................................................................................................................. 4.10
5.0 Conclusions....................................................................................................................................... 5.1
Appendix A: AP-101 Simulant Recipe..................................................................................................... A.1
Appendix B: AP-101 Sampling Chains of Custody...................................................................................B.1
Appendix C: Contract Limit Calculation ...................................................................................................C.1
Appendix D: Load and Elution Process Data ........................................................................................... D.1
Appendix E: Cesium Ion Exchange Testing Personnel .............................................................................E.1

v
Figures
2.1. Micrographs of Pretreated Spherical RF resin (Lot 5E-370/641) Surface (25×) and Cross-Section (70×) .......................................................................................................................... 2.2
2.2. Schematic of Cesium Ion Exchange Column System....................................................................... 2.5
2.3. Photograph of the Ion Exchange Test Apparatus with H-Form Resin ............................................. 2.6
3.1. 137Cs Breakthrough Curves for Simulant AP-101 Sample, Probability Plot..................................... 3.3
3.2. Lead and Lag Column Conversion Fronts During Preconditioning ................................................. 3.4
3.3. Lead and Lag Column Conversion Fronts During Simulant AP-101 Test Elution .......................... 3.4
3.4. 137Cs Breakthrough Curves for Actual Waste AP-101DF Sample, Probability Plot ........................ 3.5
3.5. Cumulative Effluent DF as a Function of BVs Processed ................................................................ 3.8
3.6. 137Cs Breakthrough Curve Comparison for AP-101 Simulant and Actual Waste, Probability Plot ................................................................................................................................. 3.9
3.7. Cs Elution and Eluant Rinse from the Lead and Lag Columns From AP-101 Simulant Processing ....................................................................................................................................... 3.12
3.8. Lead Column Elution and Rinse Profile from Actual AP-101DF Waste Processing ..................... 3.13
3.9. Comparison of Bed Volumes of the Lead and Lag Columns During Various Process Stages (a) Relative BV; (b) Actual BV........................................................................................... 3.18

vi
Tables
S.1. Test Objectives ................................................................................................................................... xi
S.2. Test Exceptions..................................................................................................................................xii
S.3. Success Criteria.................................................................................................................................xiii
S.4. Cs Load and Elution Summary ......................................................................................................... xiv
S.5. R&T Test-Condition Summary ......................................................................................................... xv 2.1. Pre-Treated Resin Particle-Size-Distribution Summary ................................................................... 2.3
2.2. Actual Tank Waste Samples Taken from AP-101 ............................................................................ 2.4
2.3. Column Process Testing Parameters................................................................................................. 2.8
2.4. Sampling Interval and Analyses ..................................................................................................... 2.10
2.5. Sample, ASR, and RPL Identifications........................................................................................... 2.11
2.6. Total Cs and Rb Concentrations in AP-101DF Feed...................................................................... 2.13
2.7. Radiochemical Alpha Analysis Procedure Identification ............................................................... 2.14
3.1. Composition of Simulant AP-101 and Actual AP-101 Diluted Feed ............................................... 3.1
3.2. AP-101DF Metals and Radionuclide Characterization..................................................................... 3.2
3.3. AP-101DF Cs-Decontaminated Product Effluent........................................................................... 3.10
3.4. Analysis Results from Composite Eluate ....................................................................................... 3.14
3.5. Radionuclides in the Lead Column Eluate Composite ................................................................... 3.15
3.6. Comparative Recoveries for Pu and Cr .......................................................................................... 3.15
3.7. Activity Balance for 137Cs............................................................................................................... 3.16
3.8. RF Resin Bed Volume Changes ..................................................................................................... 3.17
4.1. QC Results of Metals and Anions Analysis in AP-101 Simulant..................................................... 4.2
4.2. QC Results of ICP-AES Analysis in AP-101(As-Received) and AP-101DF................................... 4.4
4.3. ICP-AES, ICP-MS, KPA, and IC QC Results of AP-101DF Actual Waste AP-101 Feed, Effluent, and Eluate .......................................................................................................................... 4.6
4.4. Radionuclide QC Results for AP-101DF Feed and Effluent ............................................................ 4.8
4.5. Radionuclide QC Results for AP-101DF Eluate .............................................................................. 4.8

vii
Terms and Abbreviations
AEA alpha energy analysis
ASO Analytical Support Operations
ASR analytical services request
ASTM American Society for Testing and Materials
AV apparatus volume
BNI Bechtel National, Inc.
BS blank spike
BV bed volume
C/Co analyte concentration in column effluent divided by analyte concentration in feed
DF decontamination factor
DI deionized (water)
DOE U.S. Department of Energy
EQL estimated quantitation limit
F furnace (method)
FMI Fluid Metering, Inc., Syosset, NY
GEA gamma energy analysis
HLW high-level waste
HP hot persulfate (method)
IBC IBC Advanced Technologies, Inc., American Fork, Utah
IC ion chromatography
ICP-AES inductively coupled plasma-atomic emission spectrometry
ICP-MS inductively coupled plasma-mass spectrometry
KPA kinetic phosphorescence analysis
ILAW immobilized low-activity waste
LAW low-activity waste
LCS laboratory control sample
L/D length to diameter (ratio)
M molarity, moles/liter
MDL method detection limit

viii
MRQ minimum reportable quantity
MS matrix spike
M&TE measuring and test equipment
NA not applicable
ND not detected
ORP Office of River Protection
PB preparation blank
PNWD Battelle—Pacific Northwest Division
QA quality assurance
QC quality control
QAPjP Quality Assurance Project Plan
QARD Quality Assurance Requirements and Descriptions
RCRA Resource Conservation and Recovery Act
RF resorcinol-formaldehyde
RPD relative percent difference
RPP-WTP River Protection Project-Hanford Tank Waste Treatment and Immobilization Plant
RPL Radiochemical Processing Laboratory (PNWD facility)
R&T research and technology
SAL Shielded Analytical Laboratory
TC total carbon
TIC total inorganic carbon
TOC total organic carbon
WTP Waste Treatment Plant
WTPSP Waste Treatment Plant Support Project

ix
References
American Society for Testing and Materials (ASTM). 2001. Standard Practice for Sampling Particulate Ion-Exchange Materials, Method 2687, West Conshohocken, PA Bray LA, KJ Carson, RJ Elovich, and DE Kurath. 1992. Equilibrium Data for Cesium Ion Exchange of Hanford CC and NCAW Tank Waste. WTRSPP-92-020, Pacific Northwest Laboratory, Richland WA. Bray LA, KJ Carson, RJ Elovich, CK Carlson, JR DesChane, DE Kurath. 1996. Initial Evaluation of Two Organic Resins and Their Ion Exchange Column Performance for the Recovery of Cesium from Hanford Alkaline Wastes. PNNL-11124, Pacific Northwest National Laboratory, Richland WA. Brown GN, RJ Elovich, and LA Bray. 1995. Evaluations and Comparison of SuperLig® 644, Resorcinol-Formaldehyde and CS-100 Ion Exchange Materials for the Removal of Cesium from Simulated Alkaline Supernate. PNL-10486, Pacific Northwest Laboratory, Richland WA. Brown GN, LA Bray, CD Carlson, KJ Carson, JR DesChane, RJ Elovich, FV Hoopes, DE Kurath, LL Nenninger, and PK Tanaka. 1996. Comparison of Organic and Inorganic Ion Exchangers for Removal of Cesium and Strontium from Simulated an Actual Hanford 241-AW-101 DSSF Tank Waste. PNL-10920, Pacific Northwest National Laboratory, Richland WA Buckingham JS. 1967. Waste Management Technical Manual. ISO-100 DEL, Hanford Atomic Products Operation, Richland, WA. Fiskum SK, PR Bredt, JA Campbell, LR Greenwood, OT Farmer, III, GJ Lumetta, GM Mong, RT Ratner, CZ Soderquist, RG Swoboda, MW Urie, and JJ Wagner. 2000. Inorganic, Radioisotopic, and Organic Analysis of 241-AP-101 Tank Waste. PNNL-13354, Pacific Northwest National Laboratory, Richland, WA. Fiskum SK, ST Arm, DL Blanchard, and BM Rapko. 2004a. Small Column Ion Exchange Testing of SuperLig® 644 for Removal of 137Cs from Hanford Waste Tank 241-AP-101 Diluted Feed (Envelope A). PNWD-3198 Rev. 1, Battelle—Pacific Northwest Division, Richland, WA, 99352. Fiskum SK, BS Augspurger, KP Brooks, WC Buchmiller, RL Russell, MJ Schweiger, LA Snow, MJ Steele, KK Thomas, DE Wallace, NH Wong, JD Yeager, and DL Blanchard, Jr. 2004b. Comparison Testing of Multiple Resorcinol-Formaldehyde Resins for the River Protection Project—Waste Treatment Plant. PNWD-3387, Rev. 0, Battelle—Pacific Northwest Division, Richland, WA. Hamm LL, FG Smith, III, and DJ McCabe. 2000. Preliminary Ion Exchange Modeling for Removal of Cesium from Hanford Waste Using SuperLig® 644 Resin. BNF-003-98-0220, Rev. 0, Westinghouse Savannah River Company, Aiken, SC. Hardy BJ, SE Aleman, and LL Hamm. 2004. Ion Exchange Modeling for Removal of Cesium from Hanford Waste Using Resorcinol-Formaldehyde Resin. WSRC-TR-2004-00100. Savannah River National Laboratory, Aiken, SC.

x
Korkisch J. 1989. Handbook of Ion Exchange Resins: Their Application to Inorganic Analytical Chemistry, Vol. 1, CRC Press, Boca Raton, FL. Kurath DE, LA Bray, KP Brooks, GN Brown, SA Bryan, CD Carlson, KJ Carson, JR DesChane, RJ Elovich, and AY Kim. 1994. Experimental Data and Analysis to Support the Design of an Ion-Exchange Process for the Treatment of Hanford Tank Waste Supernatant Liquids. PNL-10187, Pacific Northwest Laboratory, Richland WA. Perry RH, and D Green. 1984. Perry’s Chemical Engineers’ Handbook, 6th Edition, McGraw Hill Book Company, Columbus, OH. Rosen JB. 1952. “Kinetics of Fixed Bed Systems for Solid Diffusion into Spherical Particles.” J. Chem. Phys. 20:387-394. Russell RL, SK Fiskum LK Jagoda, and AP Poloski. 2003. AP-101 Diluted Feed (Envelope A) Simulant Development Report. PNWD-3248. Battelle—Pacific Northwest Division, Richland, WA

xi
Testing Summary
Spherical resorcinol-formaldehyde (RF) resin, Microbeads Lot 5E-370/641, was selected for additional testing in a lead-lag column format on actual Hanford tank wastes. This report describes the Cs ion exchange performance of the spherical RF with AP-101 simulated waste (shakedown test) and diluted AP-101 actual tank waste satisfying the requirements of Technical Scoping Statement A-204.
Objectives The test objectives were to:
• Provide sufficient characterization data to evaluate ion exchange performance for spherical RF resin
• Perform column testing with AP-101 simulant and AP-101 actual tank waste and determine the loading and elution performance under nominal Waste Treatment Plant (WTP) processing conditions.(a)
The test objectives are further discussed in Table S.1.
Table S.1. Test Objectives
Test Objective Objective Met? Discussion
Provide sufficient characterization data to evaluate ion exchange performance for spherical RF resin.
Yes The simulant AP-101 material was characterized as part of the A-225 work scope. The actual AP-101 tank waste feed, ion exchange effluent, and eluate were characterized for metals inclusive of K, Cs, Rb, anions, and selected actinides to determine their fate during processing. The feed Na concentration was 5.13 M in the actual waste and 4.89 M in the simulant. Potassium, a major competitor for Cs, was measured at 0.74 M in actual waste and 0.68 M in the simulant.
Perform column testing on AP-101 simulant and AP-101 actual tank waste.
Yes Lead and lag column Cs load and elution profiles were generated for the AP-101 simulant. Lead and lag column load profiles and the lead column elution profile were generated as part of the AP-101 actual waste testing. The general load profile shapes were similar for the simulant and actual wastes. The simulant and actual waste broke through the contract limit for cesium at 28 and 25 bed volumes (BVs), respectively. The 50% breakthrough occurred at 92 BV for the actual waste and 123 BV for the simulant. Elution proceeded normally with peak Cs concentration captured in the 5th BV. Within experimental uncertainty, all Cs loaded on the lead column was recovered in the eluate.
(a) Column performance testing with Hanford tank waste AN-102 and spent resin analysis will be provided in later reports.

xii
Test Exceptions
Specific test details were modified in Test Exceptions 24590-PTF-TEF-RT-05-00008 and 24590-PTF-TEF-RT-05-00011. Table S.2 summarizes the test exceptions to the test plan and provides a discussion of the impacts on the tests.
Table S.2. Test Exceptions
Test Exception ID Test Exceptions Discussion
Modify elution volumes to include range from 15 to 30 BVs. The actual volume will be determined in consultation with the R&T Lead.
The intent was to match processing conditions to that of SL-644. The AP-101 testing on SL-644 used a 15-BV elution. The final SL-644 elution volumes were nominally 30 BV (both lead and lag columns).
24590-PTF-TEF-RT-05-00008
For the shakedown test only, increase the water rinse following elution to 8 BVs. The water rinse solutions, collected in 1 to 2 BV increments, are to be analyzed for pH using pH paper indicating-strips.
This test was to determine how Cs elution was affected by water.
24590-PTF-TEF-RT-05-00011
The interval for lag column eluate sample collection after the last waste tested will be determined in consultation with the research and technology (R&T) Lead.
Round the clock coverage for the AN-102 processing operation was estimated to last 1-week. However, the AN-102 load condition continued much longer than anticipated. The lag column elution had to be conducted on the following week with more limited resources. Eluate samples were collected in 1.4-BV increments from 0 to 10 BVs, one composite from 10 to 22 BVs, and then again in 1.4-BV increments from 22 to 29 BV processed. Note that AN-102 processing is not the subject of this report.
Results and Performance Against Success Criteria Success criteria for the RPP-WTP project were to demonstrate adequate Cs decontamination from the high-potassium Hanford tank waste and to demonstrate adequate Cs elution to meet follow-on tank waste processing. These are further discussed in Table S.3.

xiii
Table S.3. Success Criteria
Success Criteria Discussion
Combined effluent from the lag column after processing 60 BV meets low-activity waste (LAW) production specification of 0.3 Ci/m3 of immobilized low-activity waste (ILAW).
The 137Cs concentration of ≤0.3 Ci/m3 in glass requires a decontamination factor of 914 in the AP-101 matrix. The first 60-BV composite of simulant waste resulted in a Cs decontamination factor of >127,000. Up to 110 BVs of AP-101 tank waste could be processed in the lead/lag format before reaching the contract limit in the effluent composite. The first 60-BV composite of actual AP-101 tank waste resulted in a Cs decontamination of 179,000.
Elution performance meets process requirements.
Both lead and lag columns were eluted following AP-101 simulant processing. The measured and calculated Cs removed from the columns was >99%. The follow-on testing with actual AP-101 tank waste resulted in >99% recovery of all Cs that was loaded onto the lead column. Per the test plan, the lag column following actual waste testing was not eluted.
Additional Cs load and elution performance details are summarized in Table S.4. Data from previous tests are included to better appreciate the relative performance of the spherical RF. SuperLig-644 (SL-644) results are included from the dual column actual waste testing (Fiskum et al. 2004a), ground-gel RF results from simulant testing (Fiskum et al. 2004b), and spherical RF from simulant testing in a 2-cm-diameter column (based on data to be reported supporting Technical Scoping Statement A-225). The start of Cs breakthrough, contract limit (0.11% C/Co
(a)) breakthrough, and interpolated/extrapolated 50% Cs breakthrough are provided in terms of BVs processed. The SL-644 provided a higher volume of throughput before contract limit breakthrough in the AP-101 (high K) matrix than did the spherical RF resin. The Cs-elution parameters, also summarized in Table S.4, include the peak C/Co concentration and the BVs required to reach 1% C/Co, a gross indication of speed of elution and associated tailing. All resins eluted well with peak maxima at 4 to 6 BVs of processed eluant.
(a) C/Co = analyte concentration in column effluent divided by analyte concentration in feed.

xiv
Table S.4. Cs Load and Elution Summary
Cs Breakthrough Cs Elution
AP-101
Feed
Flowrate
BV/h Measured Onset, BV
Contract Limit
BV
50% C/Co, BV
Peak C/Co
1% C/Co, BV
Spherical RF(a)
Single column(b) Simulant 1.5 30(g) 58(g) 135 102(i) 15
Dual system, lead column Simulant 2.93 ≤12 28 123 56 10
Dual system, lead column Actual 2.89 ≤4 25 92 37 9.5
SL-644
Single column(c) Simulant 1.4/2.9(f) 39 73 220 121 13
Dual system, lead column(d) Actual 2.8 51 100 190(h) 64 12
Ground-gel RF(e)
Single column Simulant 2.9 25 57 205 66 17
(a) RF lot number 5E-370/641
(b) Data from TSS A-225, to be reported as part of A-225 scope, 2-cm-diameter column.
(c) SL-644 lot number C-01-11-05-02-35-60, wet sieved Na-form resin 18 to 40 mesh. Data from TSS A-225, to be reported as part of A-225 scope, 2-cm-diameter column.
(d) SL-644 lot number 010319SMC-IV-73, dry-sieved 212-425 microns (Fiskum et al. 2004a).
(e) Ground-gel RF data reproduced from PNWD-3387 (Fiskum et al. 2004b), 2-cm-diameter column.
(f) Flow rate increased to 2.9 BV/h after processing 89 BVs.
(g) Note that this result was based on half the flowrate used for the dual column test.
(h) Based on large extrapolation from 0.2% C/Co breakthrough.
(i) The elution was conducted with 0.4 M HNO3 instead of 0.5 M HNO3 as was used in the other tests.
Quality Requirements Battelle—Pacific Northwest Division (PNWD) implemented the River Protection Project-Waste Treatment Plant (RPP-WTP) quality requirements by performing work in accordance with the PNWD Waste Treatment Plant Support Project Quality Assurance Project Plan (QAPjP) approved by the RPP-WTP Quality Assurance (QA) organization and the approved test plan, TP-RPP-WTP-378, Rev. 0.(a) This work was performed to the quality requirements of NQA-1-1989 Part I, Basic and Supplementary Requirements, NQA-2a-1990, Part 2.7, and DOE/RW-0333P, Rev. 13, Quality Assurance Requirements and Descriptions (QARD). These quality requirements were implemented through PNWD’s Waste Treatment Plant Support Project (WTPSP) Quality Assurance Requirements and Description Manual. The analytical requirements were implemented through WTPSP’s Statement of Work (WTPSP-SOW-005) with the Radiochemical Processing Laboratory (RPL) Analytical Service Operations (ASO). (a) SK Fiskum. 2004. Column Performance Testing of Actual Wastes from Tanks AP-101 and AN-102 Using
Spherical Resorcinol Formaldehyde Ion Exchange Resin, Battelle Pacific Northwest Division, Richland, WA.

xv
PNWD addressed internal verification and validation activities by conducting an independent technical review of the final data report in accordance with PNWD’s procedure QA-RPP-WTP-604. This review verifies that the reported results were traceable, that inferences and conclusions were soundly based, and the reported work satisfied the test plan objectives. This review procedure is part of PNWD’s WTPSP QA Manual.
R&T Test Conditions This report summarizes the actual AP-101 waste preparation, simulant AP-101 ion exchange shakedown testing, and actual AP-101 tank waste ion exchange testing of spherical RF resin, Lot 5E-370/641. The resin was subsampled and pretreated before testing. Pretreatment included washing resin in 0.5 M HNO3, then converting it to the Na-form and then back to the H-form, and then repeating the conversions to the Na-form and H-form once more. The pretreated resins were aliquoted for testing. A duplicate volume was taken and dried in the H-form under nitrogen until a free-flowing form was obtained to assign resin mass per each column. The simulant AP-101 feed was prepared by Noah Technologies (San Antonio, TX) per the simulant preparation procedure (Russell et al. 2003) approved by WTP. The simulant was taken from the same source used to support the A-225 work scope. The actual tank waste AP-101 feed preparation required a simple compositing, filtration, and dilution to 5 M Na. Cesium ion exchange load and elution behaviors were tested using a lead-lag column format. Resin BVs were nominally 11-mL in a 1.5-cm-ID glass column with a nominal length-to-diameter (L/D) ratio of 4.2 when the resin was in the Na-form and an L/D of 3.3 when the resin was contracted in the H-form. Simulated AP-101 tank waste containing 5.82 μg/mL Cs and actual AP-101 tank waste containing 5.92 μg/mL Cs were tested. The simulant feed was spiked with 137Cs tracer to allow for rapid determination of Cs concentration (ion exchange performance) by gamma energy analysis (GEA). Load and elution processing was conducted according to nominal plant design and throughput. The AP-101 (simulant and actual) waste was processed at 2.9 BV/h; elution was conducted at 1.4 BV/h. All test conditions delineated by the test plan and test exceptions were met. A summary of test conditions is provided in Table S.5.
Table S.5. R&T Test-Condition Summary
R&T Test Condition Discussion
Use the same stock of AP-101 simulant as was used in A-225 testing.
This condition was followed. The second lot of AP-101 simulant prepared by Noah Technologies was used.
Prepare a composite of AP-101 actual waste from collected samples and dilute the composite to 5 ± 0.2 M Na. PNWD was to proceed after the R&T lead evaluated stepwise both the composite material and the diluted material Na concentrations.
These conditions were followed.
PNWD will analyze the actual waste test feed, effluent, and eluate for selected analytes.
These conditions were followed.
A batch contact sample was to be reserved for testing. A 600-mL aliquot was reserved for batch contact testing.

xvi
R&T Test Condition Discussion
Resin was to be sampled in accordance with Protocol P1-RF. This test condition was met.
Dry H-form RF resin bed mass was to be determined. The test plan indicated three specific RF resin lots and corresponding dry-hydrogen-form masses for (expanded Na-form) 10-mL resin beds. Neither of these resins were selected by R&T for actual waste testing. Instead, a different resin (Microbeads Lot # 5E-370/641) was used. The dry H-form mass (representative of the 10-mL Na-form resin bed) was determined on one resin aliquot according to the methodology described in the test plan.
RF resin preconditioning steps were to be conducted in accordance with the protocol P1-RF. Individual steps are not repeated here because of their extensive nature.
Preconditioning outside and inside the column was conducted as described in the protocol and test plan.
Ion exchange apparatus was to be built with 1.5-cm-ID columns in a lead-lag format.
The ion exchange apparatus was built per the diagram in the test plan with 1.5-cm internal diameter columns. The system and resin bed geometry were virtually identical to that of the SL-644 test.
Simulant AP-101 processing (shakedown testing) was to be conducted to exceed 50% Cs breakthrough on the lead column. Details of processing are not repeated here because of their extensive nature.
Processing was conducted in accordance with the test plan. The R&T lead provided specific direction where ranges were defined as follows:
• Simulant feed flowrate at 3 BV/h
• Feed displacement volume of two apparatus volumes
• Water rinse volume of two apparatus volumes
• Lead and lag column elutions of 15 BVs.
A 55% C/Co Cs breakthrough was obtained.
Actual AP-101 processing was to be conducted to exceed 50% Cs breakthrough on the lead column. Details of processing are not repeated here because of their extensive nature.
Processing was conducted in accordance with the test plan. The R&T lead provided specific direction where ranges were defined as follows:
• Actual waste feed flowrate at 3 BV/h
• Feed displacement volume of two apparatus volumes
• Water rinse volume of two apparatus volumes
• Lead column elution only of 15 BVs.
The load processing continued to 93% 137Cs breakthrough from the lead column.
Store the eluted resin in water as the H-form between ion exchange tests.
This condition was met.

xvii
Simulant Use Because of inherent expense with obtaining and handling actual Hanford tank wastes, a shakedown test to verify proper functioning of the ion exchange system was conducted with simulant AP-101. The simulant was prepared according to the WTP-approved formulation (Russell et al. 2003). This test matrix provided a bridge between the screening tests conducted with the same simulant (defined scope under A-225 testing, test specification 24590-PTF-TSP-RT-04-0001, Rev. 0) and the actual AP-101 waste test.
Discrepancies and Follow-on Tests
The actual AP-101 ion exchange test performance was slightly different from the simulant AP-101 waste test. The shapes of the load profile curves were similar; however, the 50% breakthrough occurred 31 BVs sooner than that of the simulant. The discrepancy was attributed to one of two possibilities.
• The lead column may have started developing channeling problems. Elution during the shakedown test indicated a non-uniform conversion front. This may have been manifested during the simulant feed (hence non-linearity of load profile). This situation may have been aggravated during the actual waste processing loading step resulting in the reduced Cs exchange performance.
• The actual tank waste Na concentration was 5% higher relative to that of the simulant and may have caused earlier Cs breakthrough. Hardy et al. (2004) predicted that small increases in Na concentration create large reductions in Cs breakthrough performance on the RF resin, resulting from decreased diffusivity of Cs+. The effect of increased Na concentration in this test was confounded by the corresponding 8% increase in K concentration; K has also been shown to adversely affect Cs loading onto RF resin.
The effect of increasing Na concentration on Cs ion exchange performance could easily be further studied. A batch contact comparison study evaluating a range of Na concentrations and the associated effect on Cs ion exchange capacity could be conducted using simulant and actual AP-101. The potential for channeling effects may be more pronounced with the narrow diameter column and may be associated with oxidative attack of the resin at the top surface of the resin bed. This effect could be studied with simulant testing. The success criteria were met for both the simulant and actual AP-101 waste processing.

1.1
1.0 Introduction
Forty years of plutonium production at the U.S. Department of Energy (DOE) Hanford Site has left a legacy of liquid waste generated as a byproduct of reprocessing operations. The wastes are a complex mixture composed mostly of sodium nitrate, nitrite, hydroxide, and sulfate, along with a broad spectrum of minor and trace metals, organics, and radionuclides stored in underground storage tanks. The DOE Office of River Protection (ORP) has contracted Bechtel National Incorporated (BNI) to build a processing plant, the River Protection Project-Waste Treatment and Immobilization Plant (RPP-WTP), that will chemically separate the highly radioactive components (specifically Cs/137Cs and, in some cases, Sr/90Sr and transuranics) of the tank waste from the bulk (non-radioactive) constituents and immobilize the wastes by vitrification. The plant will produce two waste streams: a high-volume low-activity waste (LAW) that is 137Cs (and 90Sr and transuranic) depleted and a low-volume high-activity waste (HLW) (the 137Cs, 90Sr, and transuranic-rich fraction). The wastes will be separated into LAW and HLW fractions in the pretreatment modules of the plant. The RPP-WTP contract statement of work specifies cesium ion exchange for removing 137Cs from tank waste supernatant to ultimately achieve a 137Cs loading of 0.3 Ci/m3 or less in the immobilized LAW product.(a) Further, the contract specifies that cesium ion exchange will use the elutable SuperLig® 644 (SL-644) resin (registered trademark of IBC Advanced Technologies, Inc.) or the DOE-approved equivalent. SL-644 is solely available through IBC Advanced Technologies. To provide an alternative to this sole-source resin supply, DOE-ORP directed BNI to initiate a three-stage process for selecting and potentially implementing an alternative ion exchange resin for cesium removal in the RPP-WTP.(b) BNI completed the first step of this process with the recommendation that resorcinol formaldehyde (RF) resin be pursued as a potential alternative to SL-644.(c) The RF resin is an organic-based resin developed at Westinghouse Savannah River Company in the late 1980s. It was selected as an alternative cesium ion exchange technology for the Initial Pretreatment Module project, and extensive testing was performed to support that project during the late 1980s to early 1990s (Bray et al. 1996; Brown et al. 1995 and 1996; Kurath et al. 1994). Both batch and column testing of the ground-gel RF resin was conducted at Battelle—Pacific Northwest Division (PNWD) and the Savannah River National Laboratory. The resin was found to have a high loading and selectivity for cesium from Hanford Site tank wastes. The cesium could be eluted from the resin under acidic conditions. BNI completed the second step of this process by developing an implementation plan.(d) BNI completed the first stage of the implementation plan with a spherical RF resin providing the best combination of characteristics required for WTP operations. The WTP Pretreatment Alternative Resin Selection report(e)
(a) DOE Contract No. DE-AC27-01RV14136 (DOE 2000) Section C.7.d.1.iii. (b) CCN 030290, Letter from CB Reid, ORP, to RF Naventi, BNI, dated March 13, 2002. (c) R. Peterson, H. Babad, L. Bray, J. Carlson, F. Dunn, A. Pajunen, I. Papp, and J. Watson. 2002. WTP
Pretreatment Alternative Resin Selection 24590-PTF-RPT-RT-02-001, Rev. 0, Bechtel National, Inc., Richland, WA
(d) M. Thorson. 2002. Alternative Ion Exchange Resin Supplemental Research and Technology Plan – Case 20, 24590-PTF-PL-RT-02-002, Rev. 0, Bechtel National, Inc., Richland, WA.
(e) Ibid. footnote (c).

1.2
reviewed available literature on RF performance relative to the WTP plant design and identified areas to target additional testing such as:
• Assess column chemical performance with Hanford-typical feeds.
• Address potential for resin packing induced by swelling in the plant column with resultant high pressure drops, potential resin structural breakdown, and potential channeling.
• Determine elution performance for resin to achieve desired decontamination factor and obtain data on cesium bleed from subsequent loading cycles.
• Determine concentration of residual metals, cesium, and other contaminants on spent resin as a function of the last elution conditions that may affect disposal requirements.
As part of the first stage of RF testing, spherical RF resin performance for Cs-removal was assessed using batch contact and column testing under the A-222 scoping statement (Fiskum et al. 2004b). The spherical resin was found to have good capacity, good kinetics, and better elution than the ground-gel RF resin. Based on these results, DOE-ORP directed BNI to initiate second-stage testing designed to evaluate RF resin for cold commissioning in the WTP.(a) Technical scoping statements A-204, A-212, and A-235 from these plans address testing of the spherical RF resin with actual waste samples from Hanford waste tanks AP-101 and AN-102, as well as analysis of the spent resin. This report summarizes the preparation of a dual small-column (11-mL) system with spherical RF resin and the sequential testing with simulant AP-101 and actual waste AP-101 supporting the second stage testing A-204 technical scoping statement. Cesium load and elution performances were determined under nominal baseline plant operation conditions for two complete process cycles. The fate of U, Pu, K, and other metals were evaluated during the actual AP-101 tank waste test.
(a) Schepens, 2004. CCN 083069, Letter from R. J. Schepens, ORP, to J. P. Henschel, BNI, “Direction to Perform Required Cesium Ion Exchange Alternative Resin Testing”, 03-WEC-006, effective date February 25, 2004.

2.1
2.0 Experimental
This section describes the spherical RF resin preparation, simulated AP-101 and actual AP-101 waste preparations, and ion exchange testing.
2.1 Spherical RF Resin The spherical RF resin forwarded for actual waste testing came from Microbeads (Skedsmokorset, Norway) Lot Number 5E-370/641. This resin lot was produced on 5/24/05 in a 50-gal production batch. General manufacturing conditions of this resin are protected by patent; specific lot preparation conditions were forwarded under separate letter to the BNI R&T lead by Microbeads. A nominal 1.75-L sample of the resin lot was received at PNWD on 6/6/05. The resin was provided in the hydrogen form under water in a glass 2-L bottle. The gaseous headspace was minimal.
2.1.1 Resin Sampling and Pretreatment Sub-samples of the RF resin were taken using the coring technique consistent with the American Society for Testing and Materials (ASTM) Method 2687, Standard Practice for Sampling Particulate Ion-Exchange Materials (ASTM 2001). After each sub-sampling event, the headspace was purged with nitrogen gas. A 63-mL settled resin volume aliquot was sampled on 7/10/05 (the settled resin volume was measured in a graduated cylinder with tapping/vibration to constant volume). Resin pretreatment was conducted according to Protocol P1-RF, Hanford RPP-WTP Alternate Resin Program - Protocol P1-RF: Spherical Resin Sampling from Containers, Resin Pretreatment, F-Factor, and Resin Loading to Column.(a) The resin sub-sample was transferred to a beaker and soaked in a 5× (five times the settled resin volume) volume of water for 30 minutes with agitation every 10 minutes. The water was decanted and a 5× volume of 1 M NaOH was added. The resin was soaked for 30 minutes with agitation every 10 minutes, and the solution pH was confirmed to exceed 14. The resin soak was continued overnight, and the final solution pH was confirmed to exceed 14. The solution was decanted, and a 3× volume of DI water was added; the slurry was again agitated every 10 minutes for 30 minutes. The water was decanted, and fresh rinse water was added two successive times with similar agitation. The final solution pH was measured at 12.5 with medium-range pH paper. The water was decanted, and a 10× volume of 0.5 M nitric acid was added with agitation every 10 minutes for 2 hours. The acid was decanted and the resin rinsed with 3× volume of DI water with agitation every 10 minutes for 30 minutes. The water rinse was repeated for a total of three successive times. The final solution pH was 5. The relaxed H-form resin volume was measured similarly to the starting material in a graduated cylinder at 79.5 mL, exhibiting a bulk expansion factor of 26% from the as-received form.
(a) WTP doc. no. 097893, CA Nash and CE Duffey, August 17, 2004.

2.2
2.1.2 Physical Propertiesa A subsample of the pretreated H-form resin aliquot, was dried under nitrogen to a free-flowing state for microscopy evaluation. Surface and cross-section micrographs are provided in Figure 2.1. The resin exhibited dark and light surface color variation. Generally, the particles appeared homogenously spherical. Particle cross sections were obtained using a scalpel to cleave several resin beads. The cross-section micrographs show a uniform density, indicating that RF formed through the entire sphere.
Figure 2.1. Micrographs of Pretreated Spherical RF resin (Lot 5E-370/641) Surface (25×) and Cross-Section (70×)
The mean particle diameters were measured using a Microtrac S3000(b) with water and 0.01 M NaOH dispersion fluids for the H-form and Na-form resins, respectively.(c) The average particle diameters, on a volume basis, were 421 microns in the H-form and 452 microns in the Na-form. These diameters correlated to a mean particle volume of 0.039 mm3 and 0.048 mm3, respectively, which reflects a 23% volume increase from the H-form to the Na-form. Further particle size details are provided in Table 2.1. The column diameter should be at least 20× larger than the particle diameter to minimize wall effects (Korkisch 1989, p. 39). The inner diameter of the ion exchange columns was 1.5 cm. Therefore, the column diameter was nominally 33 times larger than the Na-form particle diameter, indicating that wall effects were not an issue.
(a) Pre-treated resin physical properties were evaluated under a different technical scoping statement. Technical
details supporting Technical Scoping Statement A-225 will be reported separately. (b) The particle size distribution was measured according to procedure TPR-RPP-WTP-222, Rev. 1, S3000
Microtrac Particle Size Analyzer. (c) The Na-form resin was prepared from the pretreated H-form resin by soaking an aliquot in 1-M NaOH and
washing six times with DI water to an equilibrated pH of ~12.6.

2.3
Table 2.1. Pre-Treated Resin Particle-Size-Distribution Summary
Volume Distribution
(microns) Number Distribution
(microns) Area Dist. (microns)
Resin ID mv sd Low 5%
High 90% mn sd
Low 5%
High 90% ma
5E-370/641 H-form 421 78 307 538 377 59 288 457 403
5E-370/641 Na-form 452 83 333 575 406 70 308 493 434
mv = mean diameter volume distribution mn = mean diameter number distribution ma = mean diameter area distribution sd = standard deviation Low 5% = 5% of particles are below this value. High 90% = 10% of particles are greater than this value. Data generated from a Microtrac S3000.
2.1.3 Dry Resin Mass The pretreated H-form RF resin was subdivided into three 8.0-mL settled resin volume aliquots for ion exchange testing. The first two aliquots were forwarded to column testing for filling the lead and lag columns. The third aliquot was used to determine the dry resin mass. The 8.0-mL volume fraction of H-form resin was transferred to a tared glass beaker. Excess water was removed, and the damp resin was dried under vacuum, at 50oC to constant mass. Constant mass was defined as a mass change of <0.5% in a 7-h period at 50oC under vacuum. The dry H-form resin mass representing the 8-mL wet settled resin bed volume (BV) was 2.870 g. Thus, the H-form resin packing density was 0.36 g/mL.
2.2 Test Feeds Two feeds were prepared for ion exchange testing. The first feed was simulated AP-101 tank waste. The second feed was the actual AP-101 tank waste.
2.2.1 Simulant AP-101 Noah Technologies (San Antonio, TX) was contracted to prepare 100-L of AP-101 simulant according to the recipe reported by Russell et al. (2003). After allowing the simulant to sit for 24 hours, it was filtered through a 0.5-μm pore size glass fiber filter. The preparation Lot # 144354/1.1 was split in two 30-gal barrels and delivered to PNWD. The AP-101 simulant recipe is provided in Appendix A. Sub-samples from the top and bottom of the preparation were retrieved for chemical analysis. The measured Na molarities were 4.78 and 5.00 M for the top and bottom, respectively. The 5% difference was within the analytical uncertainty of ±15%.
2.2.2 Actual AP-101 Diluted Feed Ten discreet samples of Hanford Tank 241-AP-101 waste were taken in April 2004. The samples
were collected from two different risers (numbers 2 and 23) and at three different depths. A summary of the sample identifications, locations, depths, masses, and volumes are provided in Table 2.2. The

2.4
sampling depth represents the depth from the bottom of the tank; thus, the 3-foot depth represents a sample taken near the bottom of the tank.
Table 2.2. Actual Tank Waste Samples Taken from AP-101
Sample ID Collection
Date Riser Sample Elevation (feet and inches)
Mass, g
Volume, mL
1AP-04-02D 4/13/04 23 19' 0" 317.7 243.7
1AP-04-02E 4/13/04 23 19' 0" 318.7 244.5
1AP-04-02F 4/13/04 23 19' 0" 315.9 242.3
1AP-04-03D 4/13/04 23 3' 0" 327.4 251.2
1AP-04-03E 4/13/04 23 3' 0" 324.8 249.2
1AP-04-03F 4/13/04 23 3' 0" 323.6 248.3
1AP-04-04D 4/1/04 2 33' 0" 321.7 246.8
1AP-04-04E 4/1/04 2 33' 0" 321.6 246.7
1AP-04-04F 4/1/04 2 33' 0" 322.3 247.3
1AP-04-04G 4/1/04 2 33' 0" 321.5 246.6
Total na na na 3215.2 2466.6
The samples were forwarded to the Radiochemical Processing Laboratory (RPL) and received in the Shielded Analytical Laboratory (SAL) under chain of custody. Copies of the chains of custody are provided in Appendix B. The samples were examined, and no solids were visible in any of them. Each sample was passed through a 0.45-micron pore size nylon filter; the filtrates were collected and composited. Virtually no solids were observed on the filter. A subsample of the composited supernatant was analyzed for Na concentration by inductively coupled plasma-atomic emission spectrometry (ICP-AES) under ASR 7127. The density was determined to be 1.3035 g/mL (29oC), and Na concentration was measured at 5.64 M in a total volume of 2360 mL. The 106-mL difference (4% volume loss) was attributed to losses from residuals in the containers and evaporation in the SAL.
A 364-mL volume of 0.001 M NaOH was added to the composited AP-101 and was mixed thoroughly by shaking. A subsample of the diluted supernatant was analyzed for Na concentration by ICP-AES under ASR 7192. The diluted AP-101 (AP-101DF) density was 1.271 g/mL and, Na concentration was 5.20 M. The final sodium result was within the 5 ± 0.2 M tolerance, and the R&T contact(a) directed PNWD to proceed with ion exchange processing. The total volume of AP-101 diluted feed available for Cs ion exchange processing was about 2.68 L.
(a) J Meehan, e-mail dated 2/16/05.

2.5
2.3 Ion Exchange Column System A schematic of the ion exchange column system is shown in Figure 2.2. The system consisted of two small columns containing the ion exchange material, a small metering pump, three valves, a pressure gauge, and a pressure relief valve. Valves 1, 2, and 3 were three-way valves that could be turned to the flow position, sample position, or no-flow position. Valve 1 was placed at the outlet of the pump and was used to eliminate air from the system, purge the initial volume of the system, or isolate the columns from the pump. Valves 2 and 3 were primarily used for obtaining samples and could also be used to isolate the columns from the rest of the system. Both the 10-psi trigger pressure relief valve (Swagelok, Solon, OH) and the 15-psi pressure gauge (Ashcroft, Stratford, CT) were plumbed in line and before the first column.
0.5 M NaOH
Quick disconnect
3-way valve Pressure relief valve
Pump Pressure gauge
DI Water
AP-101
0.5 M HNO3
0.1 M NaOH
Lead Column
LagColumn
Valve 1 Valve 2 Valve 3
Direction of flow
Sample Port 1
Sample Port 2
Legend
EffluentCollection
0.5 M NaOH
Quick disconnect
3-way valve Pressure relief valve
Pump Pressure gauge
DI Water
AP-101
0.5 M HNO3
0.1 M NaOH
Lead Column
LagColumn
Valve 1 Valve 2 Valve 3
Direction of flow
Sample Port 1
Sample Port 2
Legend
EffluentCollection
Figure 2.2. Schematic of Cesium Ion Exchange Column System
The two columns were connected in series with the first column referred to as the lead column and the second column referred to as the lag column. The columns were standard 1.5-cm diameter by 15-cm tall Spectra/Chrom Organic columns (Spectrum Chromatography, Houston, TX). The top and bottom fittings were constructed of Teflon. Stainless steel, 200-mesh screens, stabilized in position with snug-fitting O-rings, supported each resin bed. The cavity below the screen support was filled with 3-mm-diameter glass beads, reducing the fluid-filled volume from 2 mL to 1 mL. A decal millimeter scale (Oregon Rule Co., Oregon City, Oregon) affixed to the column allowed for measurement of resin bed height and thus shrinkage and swelling. The connecting tubing was 1/8-in. OD, 1/16-in. ID polyethylene. Valved quick-disconnects (Cole Parmer, Vernon Hills, IL) were installed in-line to allow for ease of column switching. An FMI QVG50 pump (Fluid Metering, Inc., Syosset, New York) equipped with a ceramic and Kynar® coated low-flow piston pump head was used for all fluid introduction. The flow rate was controlled with a remotely operated FMI stroke-rate controller. The pump was calibrated with the stroke-rate controller and could
2.6
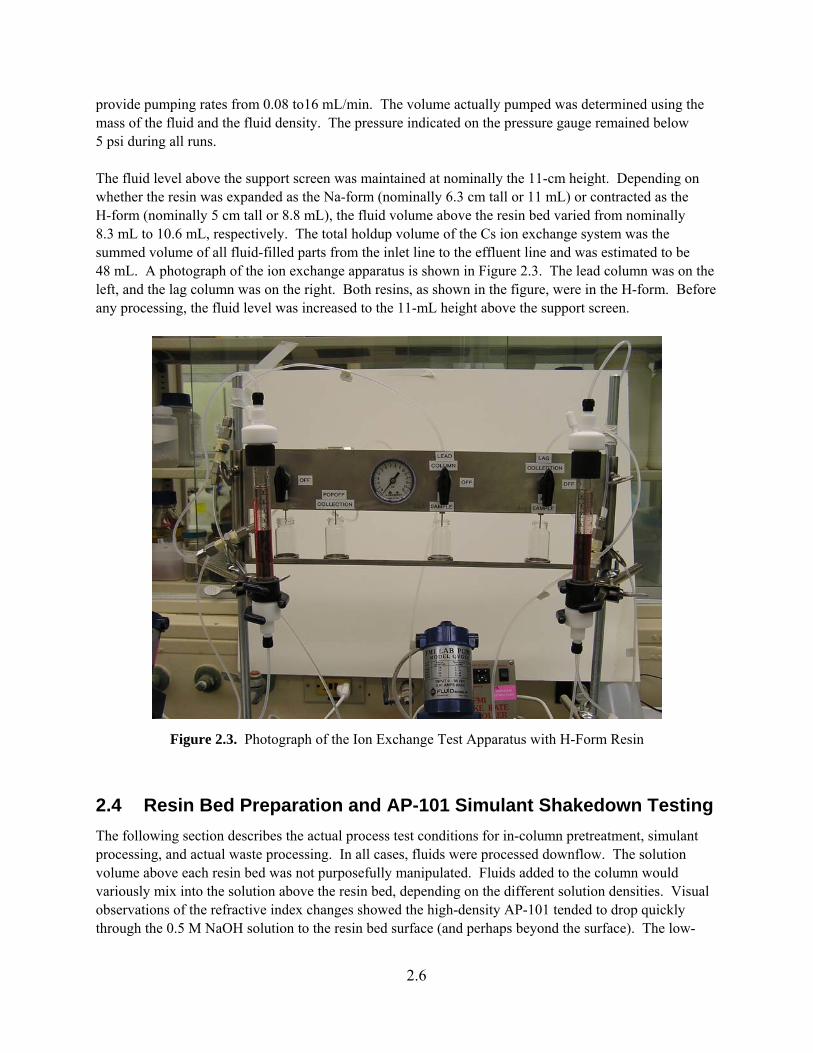
provide pumping rates from 0.08 to16 mL/min. The volume actually pumped was determined using the mass of the fluid and the fluid density. The pressure indicated on the pressure gauge remained below 5 psi during all runs. The fluid level above the support screen was maintained at nominally the 11-cm height. Depending on whether the resin was expanded as the Na-form (nominally 6.3 cm tall or 11 mL) or contracted as the H-form (nominally 5 cm tall or 8.8 mL), the fluid volume above the resin bed varied from nominally 8.3 mL to 10.6 mL, respectively. The total holdup volume of the Cs ion exchange system was the summed volume of all fluid-filled parts from the inlet line to the effluent line and was estimated to be 48 mL. A photograph of the ion exchange apparatus is shown in Figure 2.3. The lead column was on the left, and the lag column was on the right. Both resins, as shown in the figure, were in the H-form. Before any processing, the fluid level was increased to the 11-mL height above the support screen.
Figure 2.3. Photograph of the Ion Exchange Test Apparatus with H-Form Resin
2.4 Resin Bed Preparation and AP-101 Simulant Shakedown Testing The following section describes the actual process test conditions for in-column pretreatment, simulant processing, and actual waste processing. In all cases, fluids were processed downflow. The solution volume above each resin bed was not purposefully manipulated. Fluids added to the column would variously mix into the solution above the resin bed, depending on the different solution densities. Visual observations of the refractive index changes showed the high-density AP-101 tended to drop quickly through the 0.5 M NaOH solution to the resin bed surface (and perhaps beyond the surface). The low-

2.7
density 0.1 M NaOH displacement fluid, in contrast, exhibited more of a plug flow pattern in displacing the AP-101.
2.4.1 In-Column Pretreatment The in-column resin pretreatment was conducted according to test instruction TI-RPP-WTP-403.(a) The two 8-mL H-form resin sub-samples were transferred to separate beakers and contacted with 5× volumes (40 mL) of 1 M NaOH. The soak continued for 55 minutes with agitation every 10 minutes. The resin slurries were then quantitatively transferred into the columns using additional DI water to aid the transfer. The lead column was labeled “Resin A,” and the lag column was labeled “Resin B.” Each resin bed was individually pretreated in the column by processing sequentially water, 0.5 M HNO3, water, and then 0.5 M NaOH. Specific in-column pretreatment parameters are provided in Table 2.3.
2.4.2 Bed Volume The resin BV was defined as the volume of the resin bed after in-column pretreatment in the 0.5 M NaOH regeneration solution. No effort was made to compact the resin bed further by vibration. Both Resin A and Resin B BV were 11 mL.
2.4.3 AP-101 Simulant Processing The AP-101 simulant processing was conducted according to test instruction TI-RPP-WTP-403.(b) The Resin A column was placed in the lead position, and the Resin B column was placed in the lag position. Simulated AP-101 tank waste was processed sequentially through the ion exchange resin beds for a full shakedown test. After simulant processing, 0.1 M NaOH feed displacement and water rinse were passed through the system. The columns were then separated and eluted, rinsed, and regenerated individually. All processing was conducted at ambient temperature conditions, ranging from 20oC to 25oC. Test parameters, including process volumes, flowrates, and contact times, are summarized in Table 2.3. During the loading phase, nominal 10-mL samples were collected from both the lead and lag columns at the sample collection ports. The solution in the lag column remained static during the lead column sampling time of about 20 minutes. Samples were collected after the first 4 BVs were processed and again at nominal 10-BV increments. The simulant feed was processed 44 hours continuously. Sampling was not conducted over the graveyard shift; thus, two 6-h (20-BV) spans were represented without sampling. Feed displacement and water rinse samples were collected separately as composites. The eluate and follow-on water rinse were collected in nominal 1.4-BV increments.
(a) SK Fiskum. 2005. Cesium Removal from AP-101 Simulated Tank Waste (Shakedown Test) Using Spherical
Resorcinol-Formaldehyde Resin, Battelle—Pacific Northwest Division (PNWD), Richland, WA. (b) SK Fiskum. 2005. Cesium Removal from AP-101 Simulated Tank Waste (Shakedown Testing) Using Spherical
Resorcinol-Formaldehyde Resin. Battelle—Pacific Northwest Division (PNWD), Richland, WA.

2.8
Table 2.3. Column Process Testing Parameters
Total Volume Flowrate Time Process step Solution BV AV mL BV/h mL/min h
In-Column Pretreatment, Columns in Parallel, 7/14/05 (Resin A/Resin B)(a)
Water rinse DI(c) water 5.9/6.4 1.4/1.5 66/71 2.7/2.9 0.51/0.55 2.2/2.2
Acid wash 0.5 M HNO3 7.6/7.7 1.8/1.8 85/85 2.8/2.8 0.52/0.53 2.7/2.7
Water rinse DI water 2.6/2.6 0.61/0.61 29/29 1.7/1.7 0.31/0.31 1.6/1.6
Regeneration 0.5 M NaOH 5.1/5.2 1.2/1.2 57/58 2.8/2.3 0.52/0.43 1.8/2.3
Simulant AP-101 Test, Columns in Series, 7/18/05
Regeneration (cont.) 0.5 M NaOH 0.846 0.196 9.42 2.99 0.554 0.28
Loading (Resin A) AP-101 Simulant 131 30.3 1454 2.94 0.546 44.2
Loading (Resin B)(b) AP-101 Simulant 120 27.9 1338 2.94 0.546 44.2
Feed displacement 0.1 M NaOH 7.49 1.74 83.4 2.96 0.549 2.53
Water rinse DI water 7.7 1.79 85.8 3.10 0.576 2.48
Simulant AP-101 Test, Columns in Parallel (Resin A/Resin B)(a)
Elution 0.5 M HNO3 15.3/15.2 3.54/3.52 170/169 1.50/1.48 0.278/0.275 10.3/10.3
Water rinse DI water 7.97/7.96 1.85/1.85 88.8/88.6 1.38/1.41 0.256/0.261 5.78/5.67
Dual Column Actual AP-101DF Waste Test, 8/15/05
Regeneration 0.5 M NaOH 10.8 2.49 120 2.57 0.477 4.18
Loading (Resin A) AP-101DF 137 31.9 1531 2.89 0.536 47.3
Loading (Resin B)(b) AP-101DF 135 31.2 1498 2.89 0.536 47.3
Feed displacement 0.1 M NaOH 8.55 1.98 95.2 3.11 0.577 2.75
Water rinse DI water 8.67 2.01 96.5 2.86 0.545 2.38
Resin A (Lead Column) Only
Elution 0.5 M HNO3 15.6 3.63 174 1.42 0.263 11.0
Water rinse DI water 3.19 0.74 35.5 1.47 0.273 2.17 BV = bed volume (nominally 11 mL in the Na-form volume as loaded in the column). AV = apparatus volume (nominally 48 mL). (a) Two values are provided. The first value indicates the lead column parameter; the second value indicates the lag
column parameter. (b) The feed volume through the lag column is reduced because of sampling from the lead column. (c) DI = deionized water.
Cesium load and elution performance was determined from the 137Cs tracer. The collected samples were analyzed directly to determine the 137Cs concentration using gamma energy analysis (GEA) on high-purity germanium detectors. Breakthrough and elution curves were generated based on the feed 137Cs concentration (Co) and the effluent Cs concentration (C). The water rinse samples following elution were further measured for pH. The water rinse was extended beyond baseline plant operations to clarify the extent of additional Cs elution as pH increases to neutral. The sample pH was simplistically tested, using medium-range pH paper (Micro Essential Laboratory, Inc., Brooklyn NY).
2.9
2.4.4 Actual Waste AP-101 Diluted Feed Processing The resin beds had been stored undisturbed approximately 24 days in the H-form in DI water since the end of the simulant AP-101 processing. Then the ion exchange system was loaded into the SAL hot cell with the resin in the H-form in such a manner as to minimize disturbance of the resin beds. The actual AP-101DF processing was conducted according to test instruction TI-RPP-WTP-398.(a) All subsequent processing was performed in the hot cells at temperatures ranging from 25 to 27oC. A small amount (≤10 mL) of water was processed through the resin beds to remove bubbles from the lines and ascertain that the system was functioning properly. The resin beds were regenerated to the Na-form by processing the regenerant solution sequentially through the column beds. The bed conditioning, AP-101DF loading, feed displacement, and deionized (DI) water rinse steps were conducted by passing these solutions through both resin beds connected in series. The elution, elution rinse, and regeneration steps were conducted on the lead column only. The experimental conditions for each process step are shown in Table 2.3. The AP-101DF effluent was collected in two effluent bottles. The first bottle collected the first 60 BVs processed; the second bottle collected the remaining AP-101DF effluent. During the loading phase, nominal 2-mL samples were collected from both the lead and lag columns at the sample collection ports. The solution in the lag column remained static during the lead column sampling time of about 4 minutes. Samples were collected after the first 4 BVs were processed and again at nominal 10-BV increments. The AP-101 feed was processed 47 hours continuously. Feed displacement and water rinse samples were collected in 1-BV increments. The eluate and follow-on water rinse were collected in nominal 1.4-BV increments. Cesium load and elution performance were determined from 137Cs. The collected samples were analyzed directly by GEA to determine the 137Cs concentration. Breakthrough and elution curves were generated based on the feed 137Cs concentration (Co) and the effluent Cs concentration (C).
2.4.5 Sample Analysis A summary of the sample and sub-sample collections and analyses from the various tests and process steps are provided in Table 2.4.
2.4.5.1 Process Sample Analysis
All density determinations were performed in duplicate by measuring the net solution mass in 10-mL Class A volumetric flasks. Density determinations were recorded in specific test instructions. The feed, effluent, and AP-101DF elution sample 137Cs concentrations were determined using Analytical Support Operations (ASO)-calibrated GEA spectrometers. To support this analysis, all samples and sub-samples were collected and packaged in 10-mL and/or 2-mL volumes to accommodate the calibrated detector geometries. Exact volumes were calculated from the measured net mass and solution densities. Because of the high dose rate from 137Cs, the feed and eluate samples required dilution before removal from the hot cell. These samples were diluted with water. The extent of dilution was determined by mass. The sample count time was adjusted to accommodate the specific sample 137Cs concentration. The
(a) SK Fiskum. 2005. Cesium Removal from AP-101 Actual Tank Waste Using Spherical Resorcinol-Formaldehyde
Resin, Battelle—Pacific Northwest Division (PNWD), Richland, WA.

2.10
simulant elution and water rinse samples were evaluated using an automated GEA system. Only relative sample-to-feed 137Cs ratios were obtained from this system.
Table 2.4. Sampling Interval and Analyses
Process Step Lead Column Lag Column
Approximate Sample Size
(mL)
Process Sample
Analyses ASO Sample
Analysis
In-Column Pretreatment, 7/14/05 Water rinse – – – – –
Acid wash – – – – –
Water rinse – – – – –
Regeneration – – – – –
Regeneration (cont.) – – – – –
Simulant AP-101 Test, 7/18/05 Loading Every 10-20 BVs Every 10-20 BVs 10 GEA – Effluent composite 0-60 BV – 1 composite 10 GEA – Effluent composite 60-131 BV – 1 composite 10 GEA –
Feed displacement – 1 composite 10 GEA –
Water rinse – 1 composite 10 GEA –
Elution Every 1.4 BVs Every 1.4 BVs 0.1 to 2 GEA –
Water rinse Every 1.4 BVs Every 1.4 BVs 2 GEA, pH –
Actual AP-101DF Waste Test, 8/15/05 Regeneration 1 composite 2 GEA –
Loading Every 10 BVs Every 10 BVs 2 GEA –
Feed displacement – Every 1.7 BVs 2 GEA – Water rinse – Every 1.7 BVs 2 GEA –
Elution Every 1.4 BVs – 0.1 GEA GEA-selected
samples
Water rinse Every 1 BV – 2 GEA – Composite Samples
AP-101DF Effluent composite 0–60 BV – 1 composite 2/15 GEA
ICP-AES, ICP-MS, GEA, IC, free hydroxide, U, Pu, Am, Cm, total alpha, total
AP-101DF Effluent composite 60-137 BV – 1 composite 2 GEA –
AP-101DF Eluate composite 1 composite – 2/15 GEA
ICP-AES, ICP-MS, GEA, IC, U, Pu, Am, Cm, total alpha

2.11
The elution results were carefully evaluated for Cs recovery, and selected sub-samples were forwarded to the ASO for confirmatory analysis. Once the process sample GEA results were confirmed with ASO-generated results, an eluate composite was prepared according to Test Instruction TI-RPP-WTP-431(a) where the lead column eluate samples were combined in their entirety into a composite. A subsample of the composite was submitted to the ASO for analysis by GEA for gamma emitters, ICP-AES for large suite of metals and non-metals, ion chromatography (IC) for anions, kinetic phosphorescence analysis (KPA) for U, inductively coupled plasma-mass spectrometry (ICP-MS) for 133Cs and 85Rb, and radiochemistry for Pu, Am, Cm, and total alpha. The AP-101DF feed and the 1- to 60-BV effluent composite were similarly analyzed with the inclusion of free hydroxide by titration.
2.4.5.2 Analytical Services
Selected sample analyses were conducted by the ASO. The ASO was responsible for the preparation and analysis of appropriate analytical batch and instrument quality control (QC) samples and to provide any additional processing to the sub-samples that might be required (e.g., acid digestion, radiochemical separations). Preparation by direct dilution (e.g., Na-only by ICP-AES, IC, and hydroxide) did not require preparative blank and matrix spikes. A crosswalk of sample identification and analytical services requests (ASRs) is provided in Table 2.5.
Table 2.5. Sample, ASR, and RPL Identifications
Sample Identification ASR RPL ID Sample Description Purpose AP-101 Simulant
Lot 144354/1.1 top 05-01475 AP-101 simulant Lot 144354/1.1 bottom
7273 05-01476 Duplicate sample
Verify simulant composition
AP-101 Pretreatment
TI401AP-101ARComp 7127 05-00226 AP-101, as-received and as-composited Determine initial Na concentration
TI401AP101D 7192 05-01059 AP-101 diluted to 5 M Na Confirmation that 5 M Na was achieved, determine 137Cs concentration
AP-101 Ion Exchange Processing AP-101L-E2, -E3, -E4, -E5, -E6, -E11 7467 05-02511 –
05-02516 Selected elution samples Verify eluate recovery and elution profile
AP101-FEED 06-00026 AP-101 Feed Feed characterization
AP101-EFF-1 7489 06-00027 Effluent composite, 0-60 BVs Effluent characterization
AP101-LE-Comp 06-00028 Lead column elution composite Eluate characterization (lead)
The simulant subsamples were submitted to ASO under ASR 7273 for determination of free hydroxide, metals by ICP-AES, total inorganic carbon (TIC, i.e., carbonate), Cs by ICP-MS, and anions by IC. The actual AP-101 waste process streams analysis was more extensive. The Na-only analyses were conducted on direct dilutions of samples followed by ICP-AES analysis by ASO staff. Complete feed (a) SK Fiskum. 2005. Eluate and Effluent Compositing for Sample Submission Supporting A-204 AP-101 and A-
212 AN-102 Cesium Ion Exchange Processing. Battelle—Pacific Northwest Division (PNWD), Richland, WA.

2.12
composition was determined on single samples according to ASR 7489. The specific analysis methods are further discussed. Sample Preparation Hydroxide, IC, and GEA analyses were conducted directly on dilutions of the feed and effluent. A diluent blank was also distributed with the analytical sub-samples for analysis. Feed and effluent sample aliquots (nominally 1.0 mL) were acid-digested in duplicate according to procedure PNL-ALO-128, HNO3-HCl Acid Extraction of Liquids for Metals Analysis Using a Dry-Block Heater. The acid-digested solutions were brought to a nominal 25-mL volume; absolute volumes were determined based on final solution weights and densities. Along with the sample and duplicate, the ASO processed a digestion preparation blank (PB), two blank spikes (BSs) (one for ICP-AES and one for ICP-MS), and two matrix spikes (MSs) (one for ICP-AES and one for ICP-MS). Aliquots of the BS, MS, and PB, along with aliquots of the duplicate samples, were delivered to the ICP-AES and ICP-MS analytical workstations for analyses. Duplicate eluate samples were simply diluted 204.8× in 0.5 M HNO3 for distribution to the various workstations for instrumental analysis. A diluent blank was distributed with the analytical samples. Sample Analysis The hydroxide, anions, and TIC were determined directly (simulant) or on water-diluted fractions (AP-101DF). Hydroxide was determined using potentiometric titration with standardized HCl according to procedure RPG-CMC-228, Determination of Hydroxyl (OH-) and Alkalinity of Aqueous Solutions, Leachates, and Supernates and Operation of Brinkman 636 Auto-Titrator. The free hydroxide was defined as the first inflection point on the titration curve. Anions were determined using a Dionix ICS-2500 IC system equipped with a conductivity detector according to procedure PNL-ALO-212, Determination of Inorganic Anions by Ion Chromatography. The TIC was determined by using silver-catalyzed hot persulfate (HP) oxidation according to procedure PNL-ALO-381, Direct Determination of TC,(a) TOC,b and TIC in Radioactive Sludges and Liquids by Hot Persulfate Method. The ICP-AES analysis was conducted according to procedure RPG-CMC-211, Determination of Elements by Inductively Coupled Argon Plasma Atomic Emission Spectrometry (ICPAES). The ICP-MS analysis was conducted according to procedure PNNL-AGG-415, Rev. 1, ICP/MS Analysis Using Perkin Elmer Elan DRCII ICPMS. The ICP-MS was used to determine 133Cs and 85Rb. The Cs isotopic ratio was calculated from data reported by Fiskum et al. (2004a), incorporating the 137Cs decay correction and relative supernatant concentration factor of 1.03 (determined from Na concentrations of ion exchange feed supporting SL-644 testing and feed supporting the spherical RF testing). The 133Cs concentration (3.78 μg/mL) determined using the relative concentration factor agreed with the measured
(a) TC = total carbon. (b) TOC = total organic carbon.

2.13
133Cs concentration (3.66 μg/mL) within 4%. Therefore, the derived isotopic composition was applied to the current AP-101 processing. The Rb isotopic ratio in AP-101 was not known. The total Rb reported by Fiskum et al. (2004a) at 3.51 μg/mL was concentration-corrected to 3.62 μg/mL. The 85Rb determined by ICP-MS was 2.91 μg/mL. If the natural isotopic abundance of 72% is applied to the 85Rb, then the total Rb would be 4.04 μg/mL, 112% of the concentration-corrected value. The isotopic fraction of Rb was probably not natural; 87Rb has ~3% fission yield. Therefore, only the 85Rb concentrations, not the total Rb, are provided in ASR 7489 results. However, the fractionation of Rb during ion exchange processing can be assessed by evaluating 85Rb. A summary of the derived and measured Cs and Rb concentrations is provided in Table 2.6. The Na concentration is also provided because it was the basis for the applied dilution factor.
Table 2.6. Total Cs and Rb Concentrations in AP-101DF Feed
Isotope/
Measured AP-101DF
(2001)(a) Isotopic Ratio(a)
Calculated AP-101DF
(2005)(b)
Calculated Isotopic Ratio(c)
Measured AP-101DF
(ASR 7489)(c)
Element μg/mL % μg/mL % μg/mL
133Cs 3.66 60.6 3.78 61.9 3.66
135Cs 0.93 15.4 0.96 15.7 (d)
137Cs 1.45 24.0 1.37 22.4 1.34
Total Cs 6.04 -- 6.11 -- (e)
Rb 3.51 not reported 3.62 -- 2.91 (as 85Rb)(f)
Na 114,300 -- 118,000 -- 118,000
(a) Fiskum et al. 2004, reference date 11/17/01.
(b) Based on the Na results, the 2005 test AP-101 feed was slightly more concentrated (3% more concentrated) than the 2001 test feed. The Cs and Rb concentrations in the 2005 test feed were calculated based on the 3% concentration correction and 137Cs decay correction.
(c) Decay-corrected, reference date 8/15/05.
(d) The derived 135Cs concentration was 0.95 μg/mL (137Cs concentration divided by isotopic abundance 137Cs multiplied by isotopic abundance 135Cs: 1.35/0.224 * 0.157)
(e) The derived total Cs concentration was 5.96 μg/mL (sum of isotopic Cs values).
(f) Natural Rb is composed of 72% 85Rb.
2.14
Uranium was determined using a Chemchek Instruments KPA according to procedure RPG-CMC-4014, Rev. 1, Uranium by Kinetic Phosphorescence Analysis. Gamma emitters were determined on direct or diluted sample aliquots according to RPG-CMC-450, Rev. 0, GEA and Low Energy Photon Spectrometry. Long (14-h) count times were used in an attempt to discern concentrations of low-activity and low-energy gamma emitters. Isotopes of 238Pu, 239+240Pu, 241Am, 242Cm, and 243+244Cm were determined, after radiochemical separations, by alpha spectrometry. Total alpha was determined by directly plating sample aliquots onto counting planchets and counting with ZnS scintillation detectors. A high solids content in the feed and effluent samples tended to bias results low. The sum of alpha is simply the summation of measured specific alpha emitters and in these cases was a better estimation of the total alpha activity. A summary of the radiochemical alpha analytical procedures is provided in Table 2.7.
Table 2.7. Radiochemical Alpha Analysis Procedure Identification
Analyte Procedure Title
RPG-CMC-417, Rev. 1 Separation of U, Am/Cm, and Pu and Actinide Screen by Extraction Chromatography
RPG-CMC-496, Rev. 0 Precipitation Plating of Actinides for High-Resolution Alpha Spectrometry
Pu, Am, and Cm
RPG-CMC-422, Rev. 1 Solutions Analysis: Alpha Spectrometry
RPG-CMC-4001, Rev. 1 Source Preparation for Gross Alpha and Gross Beta Analysis Total alpha
RPG-CMC-408, Rev. 1 Total Alpha and Beta Analysis

3.1
3.0 Results and Discussion
This section describes results from the simulant and actual AP-101 waste processing on the dual column ion exchange system.
3.1 Feed Compositions The simulant analytical results are provided in Table 3.1. All measured simulant analytes were in good agreement with the target compositions (meeting the ±15% allowable tolerance), with one exception. The chloride concentration was 23% high in the AP-101 simulant preparation, exceeding the acceptance criterion (±15%); however, the chloride analytical uncertainty (±15%) overlapped into the acceptable target range. It was decided, in conjunction with the technical contact at BNI, to proceed with testing with no matrix modifications for chloride.
Table 3.1. Composition of Simulant AP-101 and Actual AP-101 Diluted Feed
AP-101 Simulant, Lot #144354/1.1 AP-101DF Ratio Average, Average Target % of Average, Average AP-101DF: Analyte μg/mL(a) M(a) M Target μg/mL(a) M Simulant
Cs(a) 5.82 4.37E-5 4.51E-5 97% 5.96(b) 4.45E-5 1.02
Al 6608 2.45E-1 2.59E-1 95% 6,820 2.53E-1 1.03
Cr 144 2.77E-3 2.92E-3 95% 148 2.85E-3 1.03
K 26,550 6.79E-1 7.10E-1 96% 28,800 7.37E-1 1.08
Na 112,500 4.89E+0 5.00E+0 98% 118,000 5.13E+0 1.05
P 381 1.23E-2 1.24E-2 99% 348 1.12E-2 0.91
Cl- 1,780 5.02E-2 4.09E-2 123% 1,500 4.23E-2 0.84
NO2- 33,600 7.32E-1 7.07E-1 104% 37,900 8.24E-1 1.13
NO3- 106,500 1.72E+0 1.68E+0 102% 113,000 1.82E+0 1.06
PO43- 1,105 1.16E-2 1.24E-2 94% (c) (c) (c)
SO42- 3,580 3.73E-2 3.73E-2 100% 3,300 3.44E-2 0.92
OH- 32,200 1.89E+0 1.94E+0 98% 33,600 1.98E+0 1.04
C as CO32- 5,500 4.58E-1 4.46E-1 103% NA NA NA
Physical Property Average, g/mL
Target g/mL
% of Target Average, g/mL
Ratio AP-101DF: Simulant
Density 1.251 at 22 ºC 1.26 99% 1.271 at ~27oC 1.02 (a) The overall analytical uncertainty for these analytes of interest was ±15%. (b) Based on the calculated isotopic composition. (c) Suspect data, not reported. Simulant ASR = 7273 AP-101DF ASR = 7489 NA = not analyzed

3.2
The actual AP-101 waste feed composition is also summarized in Table 3.1. Potassium in the actual waste was 8% higher than that of the simulant; chloride was 16% lower. Other analyte concentrations in the AP-101DF were on average 2% higher in concentration than those of the simulant. The total uncertainty of the ICP-AES analysis was nominally ±15%; therefore, the observed differences between the simulant and actual waste compositions could not be distinguished from the analytical uncertainty.
The AP-101DF metals and radionuclide characterization is provided in Table 3.2 (anions are provided in Table 3.1). The Na, K, Al, Cr, U (KPA), and 239+240Pu analyte results were comparable with those reported by Fiskum et al. (2004a). The other analytes were not measured or were below the method detection limit.
Table 3.2. AP-101DF Metals and Radionuclide Characterization
Analyte Conc., μg/mL Analyte Conc., μg/mL Analyte Conc., μg/mL Targeted Analytes
Ag [0.50] K 28,800 Se [2.6] As <1.70 Mn [0.086] Sr [0.32] Ba [0.78] Na 118,000 Th <1.00 Cd 1.79 Ni 3.36 U [120] Cr 148 Pb [12] U (KPA) 42.6
133Cs 3.66 85Rb 2.91 Opportunistic Analytes(b)
Al 6,820 La [1.0] Si 102 B 12.9 Li [1.5] Sn [81] Be 1.04 Mg <1.41 Te [5.3] Bi [3.1] Mo 13.9 Ti [0.26] Ca 13.6 Nd [5.4] Tl <1.52 Co [0.68] P 348 V [0.44] Cu [3.4] Pd [20] W 24.1 Dy [0.70] Rh [7.4] Y [0.15] Eu [0.33] Ru [4.6] Zn 5.26 Fe [4.6] Sb <1.95 Zr [2.7]
Radionuclide μCi/mL Radionuclide μCi/mL Radionuclide μCi/mL Targeted Analytes
137Cs 127(a) 241Am 1.42E-4 Sum of alpha 2.96E-4 238Pu 4.75E-5 242Cm <4E-7 Total alpha <5E-4
239+240Pu 1.00E-4 243+244Cm 6.15E-6 -- -- ASR 7489; reference date = 8/15/05. Analyte uncertainties were typically within ±15% (2-s); results in brackets indicate that the analyte concentration was > minimum detection limit (MDL) and < estimated quantitation limit (EQL), and uncertainties were >15%. (a) The 137Cs measured according to ASR 7127 was 117 μCi/mL (decay-corrected to 8/15/05). (b) Opportunistic analytes are reported for information only; QC requirements did not apply to these
analytes.

3.3
3.2 Cs Load The Cs load profiles were determined from the 137Cs effluent concentrations taken from the lead and lag columns. Results from the simulant and actual tests are described.
3.2.1 AP-101 Simulant Test The Cs effluent concentrations from the lead and lag columns are shown in Figure 3.1 as % C/Co vs. the BVs of feed processed through each column. The abscissa reflects BVs as a function of the resin in the expanded regeneration condition of 11 mL. The Co value for 137Cs tracer was determined to be 0.123 μCi/mL (5.86 μg/mL total Cs). The effective detection limit was nominally 1E-6 μCi/mL (varied with counting time) that was equivalent to nominally 1E-3 C/Co. The 137Cs concentrations for samples 2 to 6 (11- to 56 BVs) from the lag column were below the instrument detection limit. The C/Co is plotted on a probability scale to better show details at the low and high effluent concentration ranges. The plotted data are provided in Appendix B along with processing data.
Bed Volume
0 10 20 30 40 50 60 70 80 90 100 110 120 130 140 150
Cs C
once
ntra
tion,
% C
/Co
Prob
abili
ty P
lot
0.001
0.01
0.1
1
10
30
50 Lead Column, Resin ALag Column, Resin BContract Limit, 0.11 %C/Co
Conditions: Spherical RF Lot number 5E-370/641 Flow Rate = 2.94 BV/h Process temperature = 19 to 25oC Cs Co = 5.86 mg/L BV in 0.5 M NaOH feed condition = 11 mL Na concentration = 4.89 M.
Figure 3.1. 137Cs Breakthrough Curves for Simulant AP-101 Sample, Probability Plot
The contract 137Cs removal limit is also shown in Figure 3.1. The C/Co value of 0.11% corresponds to the contract limit of 0.3 Ci/m3 for 137Cs in the LAW glass. The C/Co value corresponding to this limit was determined using the Na concentration of 4.9 M in the AP-101DF, a 137Cs feed concentration of 117 μCi/mL, a 14 wt% waste Na2O loading in the glass, and a glass product density of 2.66 g/mL. (See Appendix C for an example calculation.)

3.4
Breakthrough on the lead column was virtually immediate. The 50% Cs breakthrough value is the point at which the C/Co is 50% (0.5) and is normally a direct indicator of the effective capacity of the resin. The 50% breakthrough was reached on the lead column after processing nominally 123 BVs. Nominally 7.4 mg Cs were loaded on the lead column at 50% breakthrough. The Cs concentration correlated to 0.67 mg Cs/mL expanded resin bed and 2.6 mg Cs/g dry H-form resin. The lag column reached 0.35% C/Co after processing 121 BVs. The lead column load profile resulted in curvature indicating non-ideal load processing. The observed Cs load curvature may be associated with channeling. Ideally the resin conversion processes (and Cs loading) will be level across the bed. Figure 3.2 shows the lead and lag column conversion fronts from Na-form resin to H-form resin during preconditioning. They were generally level across the bed as the conversion front proceeded down the bed. Figure 3.3 shows the lead and lag column conversion fronts during the simulant processing test elution step where the lead column resin displayed obvious finger-like extensions down the bed. The lag column, in contrast, showed a more level conversion front. The observed elution channeling on the lead resin bed may be associated with oxidative attack on the upper resin surface. Once the columns were connected in series, the lag column resin bed would have subsequently been exposed to significantly less dissolved oxygen (and thus less oxidative attack) than the lead resin bed. Simulant processing with 2-cm diameter columns did not exhibit load profile curvature (based on data to be reported supporting Technical Scoping Statement A-225), although there was similar evidence of oxidative attack at the resin surface.
Figure 3.2. Lead and Lag Column Conversion Fronts During Preconditioning
Figure 3.3. Lead and Lag Column Conversion Fronts During Simulant AP-101 Test Elution
The DFs were calculated on composites from each of the two effluent collection bottles. The first 60-BV composite DF was >1.27E+5: the second effluent composite bottle collected 60- to 121-BVs, resulting in a DF of 1.63E+3. These may be compared to the contractual limit of C/Co = 0.11% (DF= 910). The contract limit for Cs removal was met for the entire volume processed through both the lead and lag columns.

3.5
3.2.2 AP-101 Actual Waste Processing The actual waste test Cs effluent concentrations from the lead and lag columns are shown in Figure 3.4 as % C/Co vs. the BVs of feed processed through each column. Again, the abscissa reflects BVs as a function of the resin in the expanded regeneration condition of 11 mL. The Co value for 137Cs was determined to be 117 μCi/mL (5.92 μg/mL total Cs). All sample 137Cs results were greater than the method detection limit. The plotted data are provided in Appendix D.
Bed Volume
0 10 20 30 40 50 60 70 80 90 100 110 120 130 140 150 160
Cs C
once
ntra
tion,
% C
/Co
Prob
abili
ty P
lot
0.001
0.01
0.1
1
10
30
50
70
90
Lag Column, Resin BLead Column, Resin A
Contract Limit, 0.11% C/Co
Feed DisplacementWater Rinse
Lead column modelLag column model
Conditions: Spherical RF Lot number 5E-370/641 Flow Rate = 2.89 BV/h Process temperature = 26 to 27oC 137Cs Co = 117 μCi/mL BV in 0.5 M NaOH feed condition = 11 mL Na concentration = 5.13 M.
Figure 3.4. 137Cs Breakthrough Curves for Actual Waste AP-101DF Sample, Probability Plot
The contract 137Cs removal limit is also shown in Figure 3.4. The C/Co value of 0.11% corresponds to the contract limit of 0.3 Ci/m3 for 137Cs in the LAW glass. The C/Co value corresponding to this limit was determined using the Na concentration of 5.2 M in the AP-101DF, a 137Cs feed concentration of 117 μCi/mL, a 14 wt% waste Na2O loading in the glass, and a glass product density of 2.66 g/mL. As observed during simulant testing, Cs breakthrough on the lead column was virtually immediate. The 50% breakthrough was reached on the lead column after processing nominally 93 BVs. Nominally

3.6
0.11 Ci 137Cs or 5.4 mg total Cs were loaded onto the lead column at 50% breakthrough. The Cs concentration correlated to 0.49 mg Cs/mL expanded resin bed and 1.9 mg Cs/g dry H-form resin. As with the simulant processing, the lead column load profile resulted in a small amount of curvature, indicating non-ideal loading. Processing continued well beyond the 50% breakthrough point because of test constraints associated with timing of sample removal from cell and sample counting. The total 137Cs loading onto the lead column was 0.113 Ci 137Cs. The lag column reached 5% C/Co after processing 135 BVs. A total of 0.057 Ci 137Cs, equivalent to 2.91 mg Cs, were loaded onto the lag column Resin B. Therefore, the lag column was loaded to nearly 50% capacity. The mass transfer zone was not clear. The Cs appeared to break through the lead column within 10 BVs. Breakthrough from the lag column was not evident until 40 BVs were processed. The lead column mass transfer zone is theoretically half that demonstrated by the lag column performance, in this case, 20 BVs. Because the lead column breakthrough was evident in 10 BVs, some channeling through the lead column resin bed may be indicated. Rosen (1952) developed a model to predict breakthrough profiles in fixed bed adsorption and ion exchange processes. The model was derived by considering the mass balance around a spherical particle and leads to an equation involving the error function below.
( )
⎥⎥⎥⎥
⎦
⎤
⎢⎢⎢⎢
⎣
⎡
⎪⎪⎭
⎪⎪⎬
⎫
⎪⎪⎩
⎪⎪⎨
⎧
λψ+
⎟⎠⎞
⎜⎝⎛ −
λτ
+=
5512
12
3erf1
21
CC
0 (3.1)
Here ⎟⎠⎞
⎜⎝⎛
ε′
′=λ
uz
r
mD32
i
p , is the length parameter, ⎟⎠⎞
⎜⎝⎛ −=τ
uzt
r
D22
i
p is the time parameter, and li
p
krmD ′
=ψ is
the resistance parameter. The variables in these parameters are defined below: where Dp = particle diffusivity m’ = modified equilibrium coefficient (volume of waste processed at 50% breakthrough divided
by volume of resin, or ε−
=′1
mm , where ε is the voidage
ε’ = inter-particle void ratio,
ε−ε
=ε′1
ri = outer radius of particle kl = film mass transfer coefficient z = distance along bed u = inter-particle fluid velocity t = time.

3.7
Thus, Rosen’s solution provides the value of C at time “t” from start of feed at distance “z” along the bed. This solution shows that the breakthrough profile becomes sharper as the residence time increases, consistent with experimental observation. The Rosen model can therefore be fitted to the experimental data with the particle diffusivity, film mass transfer coefficient, and modified equilibrium coefficient parameters that are solved to provide the best fit to the data. However, the model was found to be relatively insensitive to the range of expected values for the particle diffusivity. Therefore, a value of 1.84×10⁻¹⁰ m2/s was derived from the data presented by Perry and Green (1984) for the Dowex-50 ion exchange resin (a sulfonate cation exchange resin). A least-squares fit (weighted towards low values of C/Co to better predict contract limit breakthrough) of the Rosen model to the experimental data from the lead and lag columns provides values for the film mass transfer coefficient and modified equilibrium coefficient (defined above) of 3.89×10⁻⁶ m/s and 158, respectively. The derived value for the modified equilibrium coefficient is identical to the experimentally determined value at the 50% breakthrough point. Comparison of the best-fit model with the experimental data is illustrated in Figure 3.4 and shows that the model fit the experimental data well at the low values of C/Co, close to the contract limit breakthrough. The poor fit of the model at very low C/C0 values in the lag column may be explained by either 1) residual cesium, which had loaded onto the resin from the simulated AP-101 LAW tested before the test with actual AP-101 LAW, contaminating the effluent or 2) some minor flow bypassing or channeling. The DF for the first 60 BVs of combined effluent was 1.79E+5, well within the threshold for success. The DF for the 61 to 137 BVs of combined effluent was only 114, significantly less than the 910 DF required. Consistent with these results, integration of the lag column effluent 137Cs concentration as a function of BVs processed showed that nominally 115 BVs could have been processed while still meeting the contract limit in the effluent composite (DF = 914). This effect is illustrated in Figure 3.5 where the cumulative effluent DF is plotted as a function of BVs processed. Also shown in this figure is the cumulative effluent composite 137Cs concentration and how it increases with increasing BVs processed. The effect of feed displacement (0.1 M NaOH) and water rinse are also shown in Figure 3.4 as additional BVs processed sequentially through both the lead and lag columns. The first five BVs of feed displacement essentially flushed the apparatus volume of AP-101DF from the system. The C/Co rose (first three samples collected) as the apparatus volume of AP-101DF continued to process through the lag column. The two subsequent samples showed a dramatic drop in effluent 137Cs concentration after the feed was flushed from the system. The 137Cs concentration in the water rinse continued to drop; however, the decrease appeared to come to a steady-state at 0.1% C/Co.

3.8
1E+1
1E+2
1E+3
1E+4
1E+5
1E+6
1E+7
0 20 40 60 80 100 120 140BV Processed
Cum
ulat
ive
Eff
luen
t DF
1E-5
1E-4
1E-3
1E-2
1E-1
1E+0
1E+1
Eff
luen
t Cs-
137
Con
c., u
Ci/m
L
AP-101 actual waste DF Contract LimitExperimentally-measured Effluent [Cs-137]
Figure 3.5. Cumulative Effluent DF as a Function of BVs Processed
The AP-101 simulant load profile is compared directly to the AP-101DF actual waste load profile on a probability-log plot in Figure 3.6. The load profile on a log-probability scale results in a straight line if the resin performs according to ideal ion exchange theory. When plotted using this format, the standard sigmoidal load curve is represented by a straight line (Buckingham 1967). The general shapes of the load profiles track well. The differences between the simulant and the actual waste test results were attributed to 1) the slight difference in concentration where Na, K, and Cs concentrations were each slightly higher in the actual waste, and 2) the slightly higher temperature during the actual waste test processing. Bray et al. reported a slight inverse temperature effect on ground-gel RF Cs capacity (Bray et al. 1992). The actual waste 50% BT at 93 BVs was 24% lower than obtained with the simulant at 123 BVs. The extrapolated 50% BT from the lag column was estimated to be 200 BVs during actual waste testing, which was 30% lower than the estimated 300 BVs from simulant waste processing. Processing with SL-644 resulted in significantly less Cs breakthrough into the lag column. After processing 115 BVs through the lead SL-644 column, the lead column effluent was only 0.193% C/Co (compared to 77.9% C/Co for the spherical RF lead column), and only 0.023% of the total Cs was loaded on the lag column (compared to 33% Cs for the spherical RF lag column) (Fiskum et al. 2004a). The relatively high K concentration had a greater detrimental effect on Cs ion exchange performance of the spherical RF resin compared to that of SL-644.
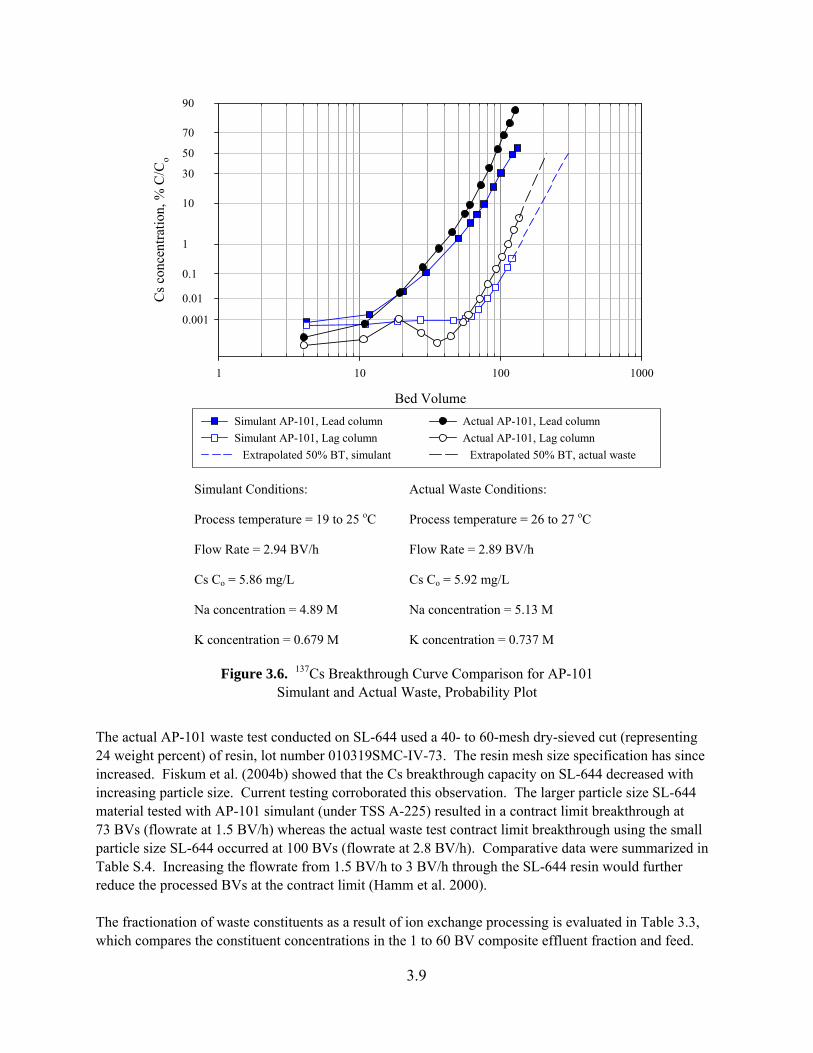
3.9
Bed Volume
1 10 100 1000
Cs c
once
ntra
tion,
% C
/Co
0.001
0.01
0.1
1
10
30
50
70
90
Simulant AP-101, Lead columnSimulant AP-101, Lag column
Actual AP-101, Lead columnActual AP-101, Lag column
Extrapolated 50% BT, actual wasteExtrapolated 50% BT, simulant
Simulant Conditions:
Process temperature = 19 to 25 oC
Flow Rate = 2.94 BV/h
Cs Co = 5.86 mg/L
Na concentration = 4.89 M
K concentration = 0.679 M
Actual Waste Conditions:
Process temperature = 26 to 27 oC
Flow Rate = 2.89 BV/h
Cs Co = 5.92 mg/L
Na concentration = 5.13 M
K concentration = 0.737 M
Figure 3.6. 137Cs Breakthrough Curve Comparison for AP-101 Simulant and Actual Waste, Probability Plot
The actual AP-101 waste test conducted on SL-644 used a 40- to 60-mesh dry-sieved cut (representing 24 weight percent) of resin, lot number 010319SMC-IV-73. The resin mesh size specification has since increased. Fiskum et al. (2004b) showed that the Cs breakthrough capacity on SL-644 decreased with increasing particle size. Current testing corroborated this observation. The larger particle size SL-644 material tested with AP-101 simulant (under TSS A-225) resulted in a contract limit breakthrough at 73 BVs (flowrate at 1.5 BV/h) whereas the actual waste test contract limit breakthrough using the small particle size SL-644 occurred at 100 BVs (flowrate at 2.8 BV/h). Comparative data were summarized in Table S.4. Increasing the flowrate from 1.5 BV/h to 3 BV/h through the SL-644 resin would further reduce the processed BVs at the contract limit (Hamm et al. 2000). The fractionation of waste constituents as a result of ion exchange processing is evaluated in Table 3.3, which compares the constituent concentrations in the 1 to 60 BV composite effluent fraction and feed.

3.10
The effluent (1 to 60 BV collected volume of 672 mL), however, was diluted with one apparatus volume of 0.5 M NaOH regeneration fluid resident in the ion exchange system (48 mL). Therefore, the AP-101 effluent was effectively diluted by a factor of 0.93 and Table 3.3 also presents the dilution-corrected effluent analyte concentrations for a more accurate comparison with the feed. Where the ratio of feed to effluent concentrations equals 1, the ion exchanger is shown to have no effect on the analyte. Where the ratio exceeds 1, the analyte is shown to have an affinity for the resin.
Table 3.3. AP-101DF Cs-Decontaminated Product Effluent
Dilution-Corrected
Component Feed
Conc., M Effluent
Conc., M Ratio Feed to Effluent
Effluent Conc., M
Ratio Feed Conc. To Effluent Conc.
Ag [4.6E-6] [4.2E-6] [1.11] [4.5E-6] [1.03] As <2.3E-5 <2.3E-5 na <2.4E-5 na Ba [5.7E-6] [3.1E-6] [1.86] [3.3E-6] [1.73] Cd 1.59E-5 1.41E-5 1.13 1.52E-5 1.05 Cr 2.85E-3 2.71E-3 1.05 2.92E-3 0.98 133Cs 2.75E-5 7.37E-9 3735 7.92E-9 3473 K 7.37E-1 6.73E-1 1.10 7.23E-1 1.02 Mn [1.6E-6] [1.8E-6] [0.86] [2.0E-6] [0.80] Na 5.13E+0 4.87E+0 1.05 5.24E+0 0.98 Ni 5.72E-5 6.30E-5 0.91 6.78E-5 0.84 Pb [5.8E-5] [3.7E-5] [1.56] [4.0E-5] [1.45] 85Rb 3.43E-5 2.80E-5 1.22 3.01E-5 1.14 Se [3.3E-5] [3.4E-5] [0.96] [3.7E-5] [0.90] Sr [3.7E-6] [2.7E-6] [1.33] [2.9E-6] [1.24] Th <4.3E-6 <4.3E-6 na <4.6E-6 na U [5.0E-4] [4.2E-4] [1.20] [4.5E-4] [1.12] U (KPA)(a) 1.79E-4 1.57E-4 1.14 1.69E-4 1.06 Chloride 4.23E-2 3.95E-2 1.07 4.25E-2 1.00 Nitrite 8.24E-1 7.59E-1 1.09 8.16E-1 1.01 Nitrate 1.82E+0 1.69E+0 1.08 1.81E+0 1.00 Sulfate 3.44E-2 3.12E-2 1.10 3.36E-2 1.02 Free hydroxide 1.98 1.87 1.06 2.01E+0 0.98
Opportunistic Analytes(b) Al 2.53E-1 2.37E-1 1.07 2.55E-1 0.99 P 1.12E-2 1.07E-2 1.05 1.15E-2 0.97 Dilution-Corrected
Radionuclides Feed
μCi/mL Effluent μCi/mL
Ratio Feed to Effluent
Effluent, μCi/mL
Ratio Feed To Effluent
60Co <3E-3 1.29 E-3 na 1.39E-3 na 137Cs 1.27E+2 5.29E-4 2.40E+5 5.69E-4 2.23E+5 238Pu(c) [4.7E-5] [7.6E-5] [0.62] [8.2E-5] [0.58] 239+240Pu 1.00E-4 1.07E-4 0.93 1.15E-4 0.87

3.11
Table 3.3 (Contd)
Dilution-Corrected
Radionuclides Feed
μCi/mL Effluent μCi/mL
Ratio Feed to Effluent
Effluent, μCi/mL
Ratio Feed To Effluent
241Am 1.42E-4 1.89E-4 0.75 2.03E-4 0.70 242Cm <4.E-7 <5.E-7 na <5.E-7 na 243+244Cm(c) [6.1E-6] [5.9E-5] [0.10] [6.3E-5] [0.10]
Total alpha <5.E-4 <5.E-4 na <5.E-4 na
Sum of alpha 2.96E-4 4.32E-4 0.69 4.65E-4 0.64 (a) U results by KPA were flagged as estimated. (b) Opportunistic analytes are reported for information only; QC requirements did not apply to
these analytes. (c) The digestion blank was high, nearly equal to the analyte concentration. Notes: The overall error was estimated to be within ±15%. Values in brackets were within 10× the detection limit, and errors were likely to exceed ±15%. na = not applicable, not detected in feed or effluent. Analysis results from ASR 7489.
Major constituents (Na, K, Al, NO3, and NO2) in the effluent were similar in concentration to the feed within experimental error. Detectable Resource Conservation and Recovery Act (RCRA)-listed metals (Ag, Cd, Cr, and Se) were also equivalent to the feed concentrations. Elements Ba and Pb appeared to potentially have some affinity for the resin. The U and Pu (based on 239+240Pu) appeared to be unaffected by the resin, unlike the SL-644 processing where the U and Pu appeared to be nearly quantitatively removed from the feed. The Pu, Am, and total alpha feed:effluent ratios were significantly <1 and were considered to be associated with analytical uncertainty.
3.3 Elution and Eluant Rinse The Cs elution profiles were determined from the 137Cs effluent concentrations taken from the lead and lag (simulant only) columns. Results from the simulant and actual tests are described.
3.3.1 AP-101 Simulant Test The lead and lag column C/Co values for 137Cs are shown in Figure 3.7 for the elution and the eluant rinse steps. The ordinate is a logarithmic scale to clearly show the large range of C/Co values obtained. The abscissa is given in BVs relative to the regeneration condition on a linear scale. The flowrate was initially higher than the targeted flowrate of 1.4 BV/h. The majority of the 137Cs was contained in elution BVs 4 to 6. The lead column peak value of C/Co was found to be 56. The elution profile had a normal bell-shape curve through the first 8 BVs processed, and then the elution manifested tailing. The C/Co values for the eluant rinse with DI water dropped rapidly in 137Cs concentration after the first two BVs of water were processed. This corresponded to the displacement of nominally 1 AV (26 mL for the lead column and 21 mL for the lag column) and indicated that DI water did not continue Cs elution. The effluent pH is also indicated in Figure 3.7 with reference to the right y-axis. The pH increased as the

3.12
effluent 137Cs concentration decreased. The standard three BVs of water rinse effectively removed much of the 0.5 M HNO3 from the system; however, the solution in contact with the resin was still slightly acidic (nominally pH 2). This final pH was influenced by the resin BV, the fluid hold-up volume, and the
1E-6
1E-5
1E-4
1E-3
1E-2
1E-1
1E+0
1E+1
1E+2
0 2 4 6 8 10 12 14 16 18 20 22 24
Bed Volume
Cs
Con
cent
ratio
n,C
/Co
0
1
2
3
4
5
6
7
8
Efflu
ent p
H
Lead column elution Lag column elution Lead DI water rinse Lag DI water rinseDetection limit pH (lead column) pH (lag column)
Conditions: • Spherical RF Microbeads 5E-370/641 • BV in 0.5 M NaOH feed condition = 11 mL • Process temperature = 20-22oC • Eluant = 0.5 M HNO3 • Co = 0.123 μCi/mL 137Cs;
= 5.86 μg/mL Cs • Flow Rate = 1.57 BV/h for first 6.7 BV, and
then 1.41 BV/h
1.57 BV/h 1.41 BV/h
Figure 3.7. Cs Elution and Eluant Rinse from the Lead and Lag Columns
From AP-101 Simulant Processing
mixing volumes. In this case, the three-BV rinse volume (33 mL) represented about 1.3× the fluid hold-up volume (26 mL with most of the holdup in the space above the resin bed). If the fluid volume relative to the resin BV was much smaller, then the final solution pH in contact with the rinsed resin would be proportionately higher after processing 3 BVs. The reverse would also be true.
3.3.2 AP-101 Actual Waste Test The lead column C/Co values for 137Cs are shown in Figure 3.8 for the elution and the water rinse steps. The majority of the 137Cs was contained in elution BVs 4 to 6. The lead column peak value of C/Co was found to be 32, less than that found for the simulant processing, indicating the peak Cs concentration was split between the third and fourth sample. The elution profile was virtually identical to the profile generated during simulant processing.

3.13
Bed Volume
0 2 4 6 8 10 12 14 16 18 20
Cs C
once
ntra
tion,
C/C
o
0.001
0.01
0.1
1
10
100
Elution, leadWater rinse, leadASO analysis confirmation
Conditions: • Spherical RF Microbeads 5E-370/641 • Process temperature = 20-22oC
• BV in 0.5 M NaOH feed condition = 11 mL • Eluant = 0.5 M HNO3
• Co = 115 μCi/mL 137Cs; 5.92 μg/mL Cs • Flow Rate = 1.42 BV/h
Figure 3.8. Lead Column Elution and Rinse Profile from Actual AP-101DF Waste Processing
The analytical results from the composite eluate are shown in Table 3.4 and Table 3.5. Sodium was the dominant component detected using ICP-AES. Some K, Rb, U, and Pu were detected in the eluate as well. Most (67%) of the Cs was found in the eluate, as expected. Table 3.4 and Table 3.5 also provide the recovered percentages of these analytes. Other analytes recovered to a much smaller or unmeasureable percentage in the eluate, given analytical uncertainties. As expected, 137Cs was the dominant radionuclide detected. Chloride was detected in the eluate at ~9.1 μg/mL.
The total Na quantity in the eluate was calculated to be 10.9 millimoles. Using the Na molar basis, the resin capacity was calculated to be 3.8 milliequivalents per gram dry H-form resin. The molar contributions from K, Cs, and Rb were small compared to Na.

3.14
Table 3.4. Analysis Results from Composite Eluate
Diluent Blank Cs eluate %
Diluent Blank Cs eluate %
Analyte Method μg/mL μg/mL recovered Analyte Method μg/mL μg/mL recovered
Targeted Analytes
Ag ICP-AES <3.4 <3.4 <77 Ni ICP-AES <2.4 <2.4 <8.2
As ICP-AES <14 <14 <90 Pb ICP-AES <15 [28] [26]
Ba(a) ICP-AES [6.0] [1.95] [28] 85Rb ICP-AES [3.6E-3] 0.556 2.2
Cd ICP-AES <1.0 [1.08] [6.9] Se(a) ICP-AES [16] [17] [72]
Cr ICP-AES [1.8] [4.6] [0.35] Sr(a) ICP-AES [0.63] [0.66] [23] 133Cs ICP-MS [1E-3] 21.6 67.1 Th ICP-AES <8.0 <8.0 <90
K ICP-AES <730 [910] [0.36] U ICP-AES <440 <440 <42
Mn ICP-AES <0.4 <0.4 <51 U KPA 1.52E-3 9.47 2.5
Na ICP-AES <91 1,440 0.14 -- -- -- -- --
Chloride IC 0.069 [9.1] 0.069 Nitrate IC <0.20 26,400(b) na
Nitrite IC <0.048 <4.9 <0.002 Sulfate IC <0.20 <20 <0.07
Opportunistic Analytes(C)
Al ICP-AES <22 [23] [0.04] P ICP-AES <16 [17] [0.56]
B ICP-AES <2.9 [7.5] [6.6] Pd ICP-AES <74 <74 <42
Be ICP-AES <0.082 [0.13] [1.4] Rh ICP-AES <34 <34 <52
Bi ICP-AES <13 <13 <49 Ru ICP-AES <8.8 <8.8 <22
Ca ICP-AES <8.2 [14] [12] Sb(a) ICP-AES [20] [22] [128]
Co ICP-AES <2.4 <2.4 <40 Si ICP-AES <23 <23 <2.5
Cu ICP-AES <6.2 <6.2 <21 Sn ICP-AES <94 <94 <13
Dy ICP-AES <4.3 <4.3 <70 Te ICP-AES <19 [20] [42]
Eu ICP-AES <1.4 <1.4 <47 Ti ICP-AES <1.3 <1.3 <57
Fe ICP-AES <3.9 <3.9 <10 Tl ICP-AES <12 <12 <90
La ICP-AES <6.0 <6.0 <68 V ICP-AES <2.5 <2.5 <65
Li ICP-AES <4.4 <4.4 <33 W ICP-AES <8.2 <8.2 <3.9
Mg ICP-AES <11 <11 <90 Y ICP-AES <1.1 <1.1 <87
Mo(a) ICP-AES [3.2] [3.15] [2.6] Zn(a) ICP-AES 12.9 14.4 31
Nd ICP-AES <28 <28 <58 Zr ICP-AES <3.2 <3.2 <14 (a) The diluent blank result was nearly equal to that of the sample. (b) The measured nitrate concentration of 0.426 M was consistent with the calculated molarity incorporating
dilution from the lead column AV of 26 mL water: ((174 – 26) mL * 0.5 M HNO3)/ 174 mL = 0.425 M HNO3.
(c) Opportunistic analytes are reported for information only; QC requirements did not apply to these analytes. Notes: The overall error was estimated to be within ±15%. Values in brackets were within 10× the detection limit and/or were associated with a high diluent blank result, and errors were likely to exceed ±15%. “—” = not applicable; ASR = 7489; total eluate volume = 174 mL.

3.15
Table 3.5. Radionuclides in the Lead Column Eluate Composite
Cs eluate Error % Analyte Method μCi/mL % recovered
137Cs GEA 7.03 E+2 3 68.3 238Pu Radchem 1.87E-5 20 4.5
239+240Pu Radchem 7.79E-5 10 8.8 241Am Radchem 3.00E-5 17 2.4 242Cm Radchem <5.E-6 -- na
243+244Cm Radchem 9.99E-4 40 11 Total alpha Radchem <4.E-3 -- na
Alpha sum(a) Radchem 1.37E-4 8 5.3 (a) The alpha sum (total of individually-measured Pu, Am, and Cm alpha emitters) provides the best estimate of the total alpha activity in the sample. Note: na = not applicable, not measured in feed or eluate
The fates of Pu and Cr are of particular concern to the WTP. The Pu and Cr recoveries in the effluents and eluates were compared for the SL-644 (Fiskum et al. 2004a) and RF process tests with AP-101 actual waste. The recoveries are summarized in Table 3.6. In each case, most of the Cr was recovered in the effluent (LAW). Residual Cr was higher in the SL-644 eluate on both a % recovery and total mass basis by a factor of 3 relative to that of the RF processing. The Cr recovery in the eluate was normalized to the H-form resin mass basis.(a) For 1 g dry H-form SL-644 resin, 1.2 mg Cr was recovered in the eluate. For 1 g dry H-form spherical RF resin, ~0.28 mg Cr was recovered in the eluate.
Table 3.6. Comparative Recoveries for Pu and Cr
Process Feed Effluent Recovery Eluate Recovery Resin Volume, L Pu, % Cr, % Pu, % Pu, μCi Cr, % Cr, mg SL-644 1.19 16 92 72 0.094 1.4 2.4
RF 1.53 107 95 8.8 0.014 [0.35] [0.80] Notes: Pu was measured as 239+240Pu. Bracketed Cr results were measured at < EQL.
The Pu fate presented a more dramatic difference between the two ion exchangers. The Pu was nearly quantitatively (72%) recovered in the SL-644 eluate whereas only about 9% of Pu was recovered in the RF eluate.
3.3.3 Activity Balance for 137Cs An activity balance for 137Cs was completed to compare the 137Cs recovered in various process streams to the 137Cs present in the feed sample and verify that all 137Cs was accounted for, thus supporting overall experimental integrity. Table 3.7 summarizes the simulant and actual AP101DF Cs recoveries.
(a) The SL-644 resin bed consisted of ~2 g dry H-form resin. The spherical RF resin bed consisted of
~2.87 g dry H-form resin.

3.16
The lag column Cs loading was calculated by integrating the lead column Cs breakthrough and subtracting the lag column effluent Cs breakthrough. The simulant test lag column 137Cs loading was calculated to be 25.3 μCi. The sum of lag column eluate samples 137Cs activity was 28.4 μCi, indicating fairly good agreement with the calculated value. After actual waste processing, the lag column remained significantly loaded with a calculated 5.67E+4 μCi 137Cs. The activity sum for the various process streams resulted in 101% and 107% recovery for the simulant and actual waste processing, respectively. The overall analysis uncertainty was estimated to be 8%, and the calculated high bias was within the experimental uncertainty.
Table 3.7. Activity Balance for 137Cs
Simulant Actual Waste Solution 137Cs, μCi 137Cs, % 137Cs, μCi 137Cs, % Input Feed Sample 180.5 1.00 E+2 1.71 E+5 1.00 E+2 Output Effluent-1 (0-60 BVs) <5.5E-4 <3.0E-4 3.96E-1 2.31E-4 Effluent-2 (61-135 BVs) 4.89E-2 2.71E-2 8.13E+2 4.75E-1 Load samples 2.27E+0 1.26E+0 1.51E+2 8.82E-2 Feed displacement 2.97E-2 1.65E-2 3.81E+1 2.23E-2 Water rinse 6.98E-4 3.87E-4 1.60E+0 9.32E-4 Eluate lead column 1.521E+2 8.43E+1 1.25E+5 7.30E+1 Water rinse, lead column 7.69E-3 4.26E-3 5.46E+0 3.19E-3 Eluate lag column 2.84E+1 1.57E+1 na na Water rinse, lag column 1.51E-3 8.36E-4 na na Lag column Cs loading 2.53E+1 (eluted) 1.40E+1 (eluted) 5.67E+4 3.31E+1 Total 137Cs Recovery 180.8 1.01E+2 1.83E+5 1.07E+2
3.3.4 Resin Volume Changes Like SL-644, the RF resin is known to change in volume as a function of the solution pH and ionic strength. The resin BV change history for all processing from the initial in-column bed conditioning steps and the two process cycles (simulant AP-101 and actual waste AP-101DF) is shown in Table 3.8. Over the limited number of cycles tested, the volume changes from conversion between the Na-form and the H-form were fairly consistent. The variation in BV as a function of the process step (given in Table 3.8) for both resin beds is shown in Figure 3.9a and b. In Figure 3.9a, the BVs are normalized to the volume in the 0.5 M NaOH regeneration condition just before loading the simulant. The ~23% shrinkage from the Na-form to H-form is clearly demonstrated. In Figure 3.9b, the absolute volume is shown. Figure 3.9 also indicates the volume measurement error of 0.35 mL associated with Resin A steps 1 through 10 (height measurement uncertainty of 0.2 mm). All data points had similar errors.

3.17
Table 3.8. RF Resin Bed Volume Changes
Bed Volume, mL(a)
Feed Symbol
Process Step
Number Resin A (Lead) Resin B (Lag)
Initial packing P 1 10.8 11.1 DI water W 2 10.4 10.6 0.5 M HNO3 E 3 8.8 8.8 DI water W 4 8.7 8.8 0.5 M NaOH R 5 11.1(b) 11.1(b)
AP-101 simulant F 6 11.0 11.1 0.1 M NaOH FD 7 10.9 11.1 DI water W 8 10.4 11.0 0.5 M HNO3 E 9 8.7 8.8 DI water W 10 8.7 8.9 Transfer to Hot Cell W 11 8.7 8.5 0.5 M NaOH R 12 11.3 11.3 AP-101DF F 13 11.1 11.1 0.1 M NaOH FD 14 11.3 11.5 DI water W 15 10.8 11.0 0.5 M HNO3 E 16 9.0 — DI water W 17 9.0 — (a) Calculated pretreated resin mass dry H-form: 2.870 g. (b) Reference volume. Note: The inside diameter of each column was 1.5 cm.

3.18
a)
0.70
0.75
0.80
0.85
0.90
0.95
1.00
1.05
1.10
0 2 4 6 8 10 12 14 16 18
Feed Matrix ID
Rela
tive
Bed
Vol
ume
AP-101 Simulant, Resin A (lead) AP-101 Simulant, Resin B (lag)
AP-101 actual, Resin A (lead) AP-101 actual, Resin B (lag)
F
W
P
E
WFD
R
W
F
FD
WR
E
E W
W
b)
8.0
8.5
9.0
9.5
10.0
10.5
11.0
11.5
12.0
0 2 4 6 8 10 12 14 16 18Feed Matrix ID
Bed
Vol
ume,
mL
AP-101 Simulant, Resin A (lead) AP-101 Simulant, Resin B (lag)
AP-101 actual, Resin A (lead) AP-101 actual, Resin B (lag)
In-columnpretreatment
Simulant test AP-101 test
Figure 3.9. Comparison of Bed Volumes of the Lead and Lag Columns During Various Process Stages (a) Relative BV; (b) Actual BV

4.1
4.0 Quality Control
The following sections describe the quality assurance (QA) and QC requirements and implementation.
4.1 Quality-Assurance Requirements PNWD implemented the RPP-WTP quality requirements by performing work in accordance with the PNWD Waste Treatment Plant Support Project quality assurance project plan (QAPjP) approved by the RPP-WTP QA organization. This work was performed to the quality requirements of NQA-1-1989, Part I “Basic and Supplementary Requirements, NQA-2a-1990, Part 2.7, and DOE/RW-0333P, Rev. 13, Quality Assurance Requirements and Descriptions (QARD). These quality requirements were implemented through PNWD’s Waste Treatment Plant Support Project (WTPSP) Quality Assurance Requirements and Description Manual and to the approved test plan, TP-RPP-WTP-378, Rev. 0, and Test Exceptions 24590-PTF-TEF-RT-05-00008 and 24590-PTF-TEF-RT-05-00011. The analytical requirements were implemented through WTPSP’s Statement of Work (WTPSP-SOW-005) with the RPL ASO. Experiments that were not method-specific were performed in accordance with PNWD’s procedures QA-RPP-WTP-1101 “Scientific Investigations” and QA-RPP-WTP-1201 “Calibration Control System,” verifying that sufficient data were taken with properly calibrated measuring and test equipment (M&TE) to obtain quality results. BNI’s QAPjP, 24590-QA-0001, was not applicable since the work was not performed in support of environmental/regulatory testing, and the data should not be used as such. PNWD addressed internal verification and validation activities by conducting an independent technical review of the final data report in accordance with PNWD’s procedure QA-RPP-WTP-604. This review verified that the reported results were traceable, that inferences and conclusions were soundly based, and that the reported work satisfied the test-plan objectives. This review procedure is part of PNWD’s WTPSP Quality Assurance Requirements and Description Manual.
4.2 Analytical Results Data quality and QC are discussed for each analytical method. Analytical results and batch QC results are summarized in Table 4.1 through Table 4.5. All raw and reduced data are maintained in data files under Project 42365 at PNWD. Initial testing on the tank waste matrix for ICP-AES Na analysis and ICP-MS Cs analysis were determined directly on diluted samples. In these cases, only a diluent blank, sample duplicate, and instrument QC were required.

4.2
Table 4.1. QC Results of Metals and Anions Analysis in AP-101 Simulant
Analysis MRQ Process Blank EQL 05-1475
Average 05-1476
RPD (05-1476)
BS Recovery
MS Recovery
Serial Dilution
Analyte Method µg/mL µg/mL(a) µg/mL µg/mL(a) µg/mL(a) % % % % Criteria> <10/<15 80 - 120 75 - 125 <10
Al ICP-AES na <1.7 17 6,540 6,675 3.2 97 103 1.1 Cs ICP-MS na <0.062 0.62 5.90 5.82 2.8 99 101 2.8 Cr ICP-AES na <0.1 1.3 143 146 2.7 97 98 0.1 K ICP-AES na <64.0 640 26,300 26,800 3.2 98 106 2.4 Na ICP-AES na <6.0 60 110,000 115,000 2.3 100 -- -- P ICP-AES na <1.7 17 376 386 1.8 97 104 7.0
Chloride IC na <8 80 1,770 1,790 1 na 100 na Nitrite IC na <120 1200 33,900 33,400 1 na 104 na Nitrate IC na <150 1500 107,000 106,000 1 na Over-range na Phosphate IC na <1.9 19 1,120 1,090 3 na 96 na Sulfate IC na <12 120 3,610 3,550 2 na 101 na Hydroxide Titration na 0 nd 32,000 32,300 2.3 94 96 na CO3 (as C) Combustion na Blank-corrected 690 5,500 5,600 4 97 99 na
Opportunistic Analytes(b) Ag ICP-AES na <0.3 3.1 <0.31 <0.31 -- -- -- -- As ICP-AES na <1.0 10 <1.04 <1.04 -- -- -- -- B ICP-AES na <0.3 3.0 13.8 13.9 2.6 98 101 -- Ba ICP-AES na <0.2 1.9 [0.34] [0.31] -- 100 100 -- Be ICP-AES na <0.007 0.07 [0.035] [0.037] -- 98 105 -- Bi ICP-AES na <1.4 14 <1.37 <1.37 -- 100 106 -- Ca ICP-AES na <4.9 49 <4.94 <4.94 -- 97 100 -- Cd ICP-AES na <0.1 1.1 [1.1] [1.1] -- 98 102 -- Ce ICP-AES na <2.3 23 <2.31 <2.31 -- 95 99 -- Co ICP-AES na <0.2 2.4 <0.24 <0.24 -- -- -- -- Cu ICP-AES na <0.5 5.0 [0.97] [1.02] -- 103 107 -- Dy ICP-AES na <0.6 5.8 <0.58 <0.58 -- -- -- -- Eu ICP-AES na <0.1 1.0 <0.10 <0.10 -- -- -- -- Fe ICP-AES na <0.6 5.6 [2.7] [2.65] -- 100 101 -- La ICP-AES na <0.5 5.3 <0.53 <0.53 -- 101 104 -- Li ICP-AES na <0.4 3.8 [0.54] [0.56] -- 99 101 --

4.3
Table 4.1 (Contd)
Analysis MRQ Process Blank EQL 05-1475
05-1476 Average
RPD 05-1476
BS Recovery
MS Recovery
Serial Dilution
Analyte Method µg/mL µg/mL(a) µg/mL µg/mL(a) µg/mL(a) % % % % Criteria: <10(b) 80 - 120 75 - 125 <10
Mg ICP-AES na <1.1 11 <1.10 <1.10 -- 97 99 -- Mn ICP-AES na <0.04 0.4 [0.082] [0.130] -- 98 99 -- Mo ICP-AES na <0.2 2.3 12.5 12.9 1.4 98 101 6.4 Nd ICP-AES na <2.4 24 <2.41 <2.41 -- 101 104 -- Ni ICP-AES na <0.2 2.1 <0.21 <0.21 -- 99 100 -- Pb ICP-AES na <1.5 15 [9.6] [9.55] -- 82 84 -- Pd ICP-AES na <8.7 87 <8.73 <8.73 -- -- -- -- Rh ICP-AES na <3.1 31 <3.06 <3.06 -- -- -- -- Ru ICP-AES na <1.0 10 <0.95 <0.95 -- -- -- -- Sb ICP-AES na <1.6 16 <1.59 <1.59 -- -- -- -- Se ICP-AES na <1.6 16 <1.63 <1.63 -- -- -- -- Si ICP-AES na <2.0 20 117 120 2.2 97 104 9.0 Sn ICP-AES na <8.6 86 <8.61 <8.61 -- -- -- -- Sr ICP-AES na <0.0 0.3 [0.048] [0.051] -- 100 102 -- Te ICP-AES na <1.9 19 <1.87 <1.87 -- -- -- -- Th ICP-AES na <1.0 10 <1.01 <1.01 -- 99 101 -- Ti ICP-AES na <0.1 1.1 <0.11 <0.11 -- 98 99 -- Tl ICP-AES na <1.0 10 <1.01 <1.01 -- -- -- -- U ICP-AES na <38 383 <38.34 <38.34 -- 98 100 -- V ICP-AES na <0.2 2.3 <0.23 <0.23 -- 96 98 -- W ICP-AES na <1.0 10 22.8 23.4 2.0 101 105 -- Y ICP-AES na <0.1 1.2 <0.12 <0.12 -- -- -- -- Zn ICP-AES na [1.2] 1.3 7.99 8.12 1.2 99 104 4.7 Zr ICP-AES na <0.2 2.4 [0.42] [0.57] -- 110 115 --
(a) The overall error for values without brackets was estimated to be within ±15% (analytes greater than the EQL). Bracketed values identify sample concentrations that were <EQL but >MDL, and errors likely exceeded 15%. The MDL was typically a factor of 10 lower than the EQL.
(b) Opportunistic analytes are reported for information only; QC requirements did not apply to these analytes. BS = blank spike; EQL = estimated quantitation limit; MRQ = minimum reportable quantity; MS = matrix spike; RPD = relative percent difference “--” indicates calculation was not required Data are from ASR 7273, RPL Sample ID = 05-1475 (top of simulant lot preparation) and 05-1476 (bottom of simulant lot preparation)

4.4
Table 4.2. QC Results of ICP-AES Analysis in AP-101(As-Received) and AP-101DF
AP-101 As-Received AP-101DF
MRQ Diluent Blank
05-0226 EQL 05-0226 Average RPD
Serial Dilution
Diluent Blank 05-1061 EQL
05-1059 Average RPD
Serial Dilution
Analyte µg/mL µg/mL(a) µg/mL µg/mL(a) % % µg/mL(a) µg/mL µg/mL(a) % % Criteria: <10(b) <10 <10(b) <10
Na 180 <24 243 129,500 0.5 5.7 [31.0] 246 119,500 2.8 3.9 Opportunistic Analytes(b)
Ag na <1.2 12 <1.2 — — <1.2 12 <12 — — Al na <6.9 69 7,770 0.6 2.4 [8.5] 70 7,195 2.4 1.3 As na <4.2 42 [8.7] — — <4.3 43 [6.5] — — B na <1.2 12 20.1 0.2 — <1.2 12 [12] — — Ba na <0.8 8 <0.8 — — <0.8 7.8 <8 — — Be na <0.03 0.3 1.09 0.1 — <0.03 0.30 1.000 1.8 — Bi na <5.5 55 <5.5 — — <5.6 56 <56 — — Ca na <20 199 [41] — — [40.0] 201 [57] — — Cd na <0.4 4 [1.95] — — <0.4 4.5 [2.1] — — Ce na <9.3 93 <9.3 — — <9.4 94 <94 — — Co na <1.0 10 <1.0 — — [1.0] 10 <10 — — Cr na <0.5 5 171 0.2 2.7 [.78] 5.3 157 2.1 2.5 Cu na <2.0 20 [2.5] — — <2.0 20 [2.4] — — Dy na <2.3 23 <2.3 — — <2.4 24 <24 — — Eu na <0.4 4 <0.4 — — [.45] 4.1 <4 — — Fe na <2.3 23 [4.15] — — <2.3 23 [4.1] — — K na <258 2,575 32,850 0.3 2.3 <261 2,609 30,650 2.4 2.3 La na <2.2 22 <2.2 — — <2.2 22 <22 — — Li na <1.5 15 <1.5 — — [1.6] 16 <16 — — Mg na <4.4 44 <4.4 — — <4.5 45 <45 — — Mn na <0.2 2 <0.2 — — <0.2 1.6 <2 — — Mo na <0.9 9 15.4 2.1 — [1.2] 9.4 14.3 1.3 — Nd na <9.7 97 <9.7 — — <9.8 98 <98 — — Ni na <0.8 8 [4.15] — — <0.9 8.5 [3.85] — — P na <7.0 70 399 0.1 4.6 [8.5] 71 368 1.7 3.4 Pb na <6.2 62 [8.0] — — <6.2 62 [9.2] — — Pd na <35 351 <35.1 — — <36 356 <356 — — Rh na <12 123 <12.3 — — <12 125 <125 — — Ru na <3.8 38 <3.8 na — <3.9 39 [4.5] — —

4.5
Table 4.2 (Contd)
AP-101 As-received AP-101DF
MRQ Diluent Blank
05-0226 EQL 05-0226 Average RPD
Serial Dilution
Diluent Blank 05-1061 EQL
05-1059 Average RPD
Serial Dilution
Analyte µg/mL µg/mL(a) µg/mL µg/mL(a) % % µg/mL(a) µg/mL µg/mL(a) % % Criteria: <20(b) <10 <20(b) <10
Sb na <6.4 64 <6.4 — — [6.7] 65 <65 — — Se na <6.6 66 <6.6 — — <6.6 66 <66 — — Si na <8.2 82 nm — — <8.3 83 194 6.6 — Sn na <35 347 [76] — — <35 351 [78] — — Sr na <0.1 1 [0.28] — — [.2] 1.1 [0.30] — — Te na <7.5 75 <7.5 — — <7.6 76 <76 — — Th na <4.1 41 <4.1 — — <4.1 41 <41 — — Ti na <0.4 4 <0.4 — — <0.4 4.5 <4 — — Tl na <4.1 41 <4.1 — — <4.1 41 <41 — — U na <154 1,543 <154 — — <156 1,563 <1563 — — V na <0.9 9 <0.9 — — <0.9 9.2 <9 — — W na <4.0 40 [25] — — <4.0 40 [24] — — Y na <0.5 5 <0.5 — — <0.5 4.9 <5 — — Zn na <20 201 <20 — — [1.2] 5.2 5.44 2.7 — Zr na <1.0 10 [2.05] — — <1.0 10 [2.05] — —
(a) The overall error for values without brackets was estimated to be within ±15% (analytes greater than the EQL). Bracketed values identify sample concentrations that were <EQL but >MDL, and errors likely exceeded 15%. The MDL was typically a factor of 10 lower than the EQL.
(b) Opportunistic analytes are reported for information only; QC requirements did not apply to these analytes. EQL = estimated quantitation limit; MRQ = minimum reportable quantity; RPD = relative percent difference “—” indicates measurement/calculation was not required Data are from ASR 7127, RPL Sample ID = 05-0226 and ASR 7192, RPL Sample ID = 05-1059
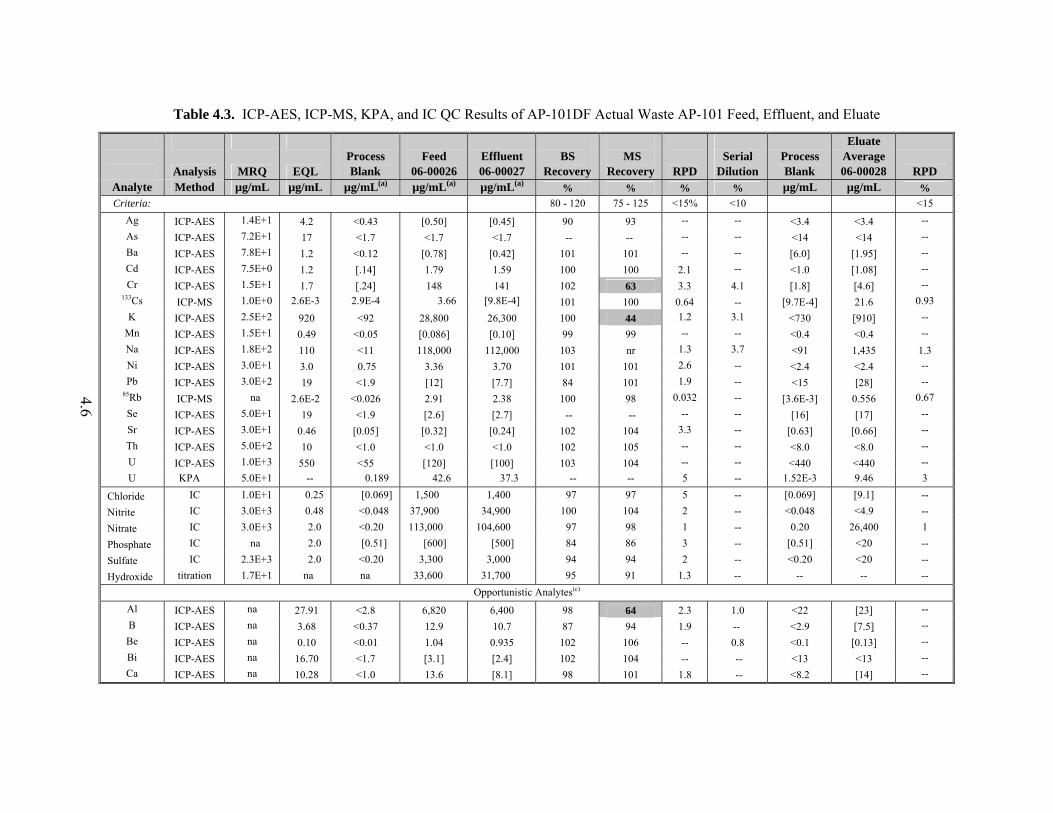
4.6
Table 4.3. ICP-AES, ICP-MS, KPA, and IC QC Results of AP-101DF Actual Waste AP-101 Feed, Effluent, and Eluate
Eluate
Analysis MRQ EQL Process Blank
Feed 06-00026
Effluent 06-00027
BS Recovery
MS Recovery RPD
Serial Dilution
Process Blank
Average 06-00028 RPD
Analyte Method µg/mL µg/mL µg/mL(a) µg/mL(a) µg/mL(a) % % % % µg/mL µg/mL % Criteria: 80 - 120 75 - 125 <15% <10 <15
Ag ICP-AES 1.4E+1 4.2 <0.43 [0.50] [0.45] 90 93 -- -- <3.4 <3.4 -- As ICP-AES 7.2E+1 17 <1.7 <1.7 <1.7 -- -- -- -- <14 <14 -- Ba ICP-AES 7.8E+1 1.2 <0.12 [0.78] [0.42] 101 101 -- -- [6.0] [1.95] -- Cd ICP-AES 7.5E+0 1.2 [.14] 1.79 1.59 100 100 2.1 -- <1.0 [1.08] -- Cr ICP-AES 1.5E+1 1.7 [.24] 148 141 102 63 3.3 4.1 [1.8] [4.6] --
133Cs ICP-MS 1.0E+0 2.6E-3 2.9E-4 3.66 [9.8E-4] 101 100 0.64 -- [9.7E-4] 21.6 0.93 K ICP-AES 2.5E+2 920 <92 28,800 26,300 100 44 1.2 3.1 <730 [910] --
Mn ICP-AES 1.5E+1 0.49 <0.05 [0.086] [0.10] 99 99 -- -- <0.4 <0.4 -- Na ICP-AES 1.8E+2 110 <11 118,000 112,000 103 nr 1.3 3.7 <91 1,435 1.3 Ni ICP-AES 3.0E+1 3.0 0.75 3.36 3.70 101 101 2.6 -- <2.4 <2.4 -- Pb ICP-AES 3.0E+2 19 <1.9 [12] [7.7] 84 101 1.9 -- <15 [28] --
85Rb ICP-MS na 2.6E-2 <0.026 2.91 2.38 100 98 0.032 -- [3.6E-3] 0.556 0.67 Se ICP-AES 5.0E+1 19 <1.9 [2.6] [2.7] -- -- -- -- [16] [17] -- Sr ICP-AES 3.0E+1 0.46 [0.05] [0.32] [0.24] 102 104 3.3 -- [0.63] [0.66] -- Th ICP-AES 5.0E+2 10 <1.0 <1.0 <1.0 102 105 -- -- <8.0 <8.0 -- U ICP-AES 1.0E+3 550 <55 [120] [100] 103 104 -- -- <440 <440 -- U KPA 5.0E+1 -- 0.189 42.6 37.3 -- -- 5 -- 1.52E-3 9.46 3
Chloride IC 1.0E+1 0.25 [0.069] 1,500 1,400 97 97 5 -- [0.069] [9.1] --
Nitrite IC 3.0E+3 0.48 <0.048 37,900 34,900 100 104 2 -- <0.048 <4.9 --
Nitrate IC 3.0E+3 2.0 <0.20 113,000 104,600 97 98 1 -- 0.20 26,400 1
Phosphate IC na 2.0 [0.51] [600] [500] 84 86 3 -- [0.51] <20 --
Sulfate IC 2.3E+3 2.0 <0.20 3,300 3,000 94 94 2 -- <0.20 <20 --
Hydroxide titration 1.7E+1 na na 33,600 31,700 95 91 1.3 -- -- -- -- Opportunistic Analytes(c)
Al ICP-AES na 27.91 <2.8 6,820 6,400 98 64 2.3 1.0 <22 [23] -- B ICP-AES na 3.68 <0.37 12.9 10.7 87 94 1.9 -- <2.9 [7.5] -- Be ICP-AES na 0.10 <0.01 1.04 0.935 102 106 -- 0.8 <0.1 [0.13] -- Bi ICP-AES na 16.70 <1.7 [3.1] [2.4] 102 104 -- -- <13 <13 -- Ca ICP-AES na 10.28 <1.0 13.6 [8.1] 98 101 1.8 -- <8.2 [14] --

4.7
Table 4.3 (Contd)
Eluate
Analysis MRQ EQL Process Blank
Feed 06-00026
Effluent 06-00027
BS Recovery
MS Recovery RPD
Serial Dilution
Process Blank
Average 06-00028 RPD
Analyte Method µg/mL µg/mL µg/mL(a) µg/mL(a) µg/mL(a) % % % % µg/mL µg/mL % Co ICP-AES na 3.01 <0.30 [0.68] [0.66] -- -- -- -- <2.4 <2.4 -- Cu ICP-AES na 7.83 <0.78 [3.4] [2.9] 104 105 0.8 -- <6.2 <6.2 -- Dy ICP-AES na 5.39 <0.54 [0.70] [0.65] -- -- -- -- <4.3 <4.3 -- Eu ICP-AES na 1.70 <0.17 [0.33] [0.31] -- -- -- -- <1.4 <1.4 -- Fe ICP-AES na 4.95 0.87 [4.6] [4.6] 103 102 -- -- <3.9 <3.9 -- La ICP-AES na 7.50 <0.75 [1.0] [0.91] 103 107 -- -- <6.0 <6.0 -- Li ICP-AES na 5.51 <0.55 [1.5] [1.3] 101 101 -- -- <4.4 <4.4 -- Mg ICP-AES na 14.12 <1.4 <1.4 <1.4 100 100 -- -- <11 <11 -- Mo ICP-AES na 3.22 <0.32 13.9 13.3 90 98 2.8 -- [3.2] [3.15] -- Nd ICP-AES na 34.66 <3.5 [5.4] [4.9] 104 108 -- -- <28 <28 -- P ICP-AES na 19.87 <2.0 348 332 88 91 2.5 2.0 <16 [17] -- Pd ICP-AES na 93.67 <9.4 [20] [18] -- -- -- -- <74 <74 -- Rh ICP-AES na 42.93 <4.3 [7.4] [6.7] -- -- -- -- <34 <34 -- Ru ICP-AES na 11.11 <1.1 [4.6] [4.4] -- -- 1.9 -- <8.8 <8.8 -- Sb ICP-AES na 19.48 <2.0 <2.0 <2.0 -- -- -- -- [20] [22] -- Si ICP-AES na 28.47 <2.9 102 82.5 74 91 1.5 -- <23 <23 -- Sn ICP-AES na 118.02 <12 [81] [82] -- -- -- -- <94 <94 -- Te ICP-AES na 24.07 <2.4 [5.3] [5.4] -- -- -- -- <19 [20] -- Ti ICP-AES na 1.65 <0.16 [0.26] [0.22] 88 97 -- -- <1.3 <1.3 -- Tl ICP-AES na 15.23 <1.5 <1.5 <1.5 -- -- -- -- <12 <12 -- V ICP-AES na 3.17 <0.32 [0.44] [0.41] 103 104 -- -- <2.5 <2.5 -- W ICP-AES na 10.28 <1.0 24.1 22.7 96 101 2.2 -- <8.2 <8.2 -- Y ICP-AES na 1.44 <0.14 [0.15] <0.14 -- -- -- -- <1.1 <1.1 -- Zn ICP-AES na 1.34 1.9 5.26 5.46 102 103 29.1 -- 12.9 14 -- Zr ICP-AES na 4.07 <0.41 [2.7] [2.6] 96 110 -- -- <3.2 <3.2 --
(a) The overall error for values without brackets was estimated to be within ±15% (analytes greater than the EQL). Bracketed values identify sample concentrations that were <EQL but >MDL, and errors likely exceeded 15%. The MDL was typically a factor of 10 lower than the EQL.
(b) Opportunistic analytes are reported for information only; QC requirements did not apply to these analytes. BS = blank spike; EQL = estimated quantitation limit; MRQ = minimum reportable quantity; MS = matrix spike; RPD = relative percent difference “—” indicates calculation was not required Tank waste matrix RPD generated from AN-102 companion sample. The bolded and shaded result indicates non-compliance with BNI acceptance criteria; see discussion.

4.8
Table 4.4. Radionuclide QC Results for AP-101DF Feed and Effluent
MRQ Process Blank Uncertainty
Feed AP-101DF Uncertainty
Effluent AP-101DF Uncertainty RPD(a)
BS Recovery
MS Recovery
Analyte µCi/g µCi/mL 1-σ µCi/mL 1-σ µCi/mL 1-σ % % % Criteria: <15 80 - 120 75 - 125
137Cs(c) 0.050 <5E-5 -- 118 3 -- -- 4 -- -- 137Cs 0.050 <9E-5 -- 127 4 1.82E-3 5 0 -- -- 238Pu 0.010 1.42E-5 10 4.75E-5 6 7.64E-5 5 80 NA NA
239/240Pu 0.010 5.12E-6 17 1.00E-4 4 1.07E-4 4 17 99 81 241Am 0.010 1.44E-5 6 1.42E-4 3 1.89E-4 3 7 107 103 242Cm 0.010 <3E-7 -- <4E-7 -- <5E-7 -- 12 -- --
243+244Cm 0.010 5.36E-6 10 6.15E-6 10 5.91E-5 4 25 -- -- Total alpha 0.010 <5E-4 -- <5E-4 -- <5E-4 -- 31 97 81
Sum of alpha -- 3.91E-5 5 2.96E-4 2 4.32E-4 2 -- -- -- Opportunistic analytes
60Co -- <8E-5 -- <3E-3 -- 1.46E-3 4 13 -- -- 125Sb -- <3E-4 -- <2E-1 -- 6.23E-4 19 -- -- --
126Sn/Sb -- <8E-5 -- <1E-1 -- 2.94E-4 9 -- -- -- (a) The RPD was determined on a companion tank waste feed sample, AN-102. (b) The bolded and highlighted results indicate the acceptance criterion was exceeded. (c) The 137Cs was initially determined according to ASR 7192, reference date 2/21/05. Subsequent analyses were conducted according to ASR 7489, reference date 8/15/05. BS = blank spike; MRQ = minimum reportable quantity; MS = matrix spike; RPD = relative percent difference
Table 4.5. Radionuclide QC Results for AP-101DF Eluate
MRQ Diluent Blank Uncertainty 06-00028 Uncertainty
06-00028 Duplicate Uncertainty RPD
BS Recovery
MS Recovery
Analyte µCi/g µCi/mL 1-σ µCi/mL 1-σ µCi/mL 1-σ % % % Criteria: <15 80 - 120 75 - 125
137Cs 0.050 <9E-5 -- 6.98E+2 3 7.08E+2 3 1 -- -- 238Pu 0.010 <4E-8 -- 1.96E-5 20 1.77E-5 24 10 -- --
239/240Pu 0.010 6.51E-8 31 7.28E-5 10 8.30E-5 10 13 99 81 241Am 0.010 <4E-8 -- 2.84E-5 17 3.16E-5 17 11 107 103 242Cm 0.010 <2E-8 -- <5E-6 -- <4E-6 -- -- -- --
243+244Cm 0.010 <2E-8 -- <6E-6 -- 5.74E-6 40 -- -- -- Total alpha 0.010 <2E-5 -- <4E-3 -- <4E-3 -- -- 97 81
Sum of alpha -- 1.61E-7 13 1.21E-4 8 1.38E-4 8 13 -- -- BS = blank spike; MRQ = minimum reportable quantity; MS = matrix spike; RPD = relative percent difference

4.9
The tank waste matrix required acid digestion before analysis by U (KPA), total alpha, Pu, Am, Cm, and ICP-AES and ICP-MS for minor and trace metal constituents. In these cases, a matrix spike, blank spike, preparation blank, sample duplicate, and instrument QC were required. For the radiochemical analytes (Pu, Am, Cm, and total alpha), the blank and matrix spikes were prepared at the analytical workstation, not during the digestion process. These were termed “post-digestion spikes.” Because of the large dilutions required of highly radioactive samples for radioisotopic analysis, spiking at the digestion stage would have required too much consumption of rare and expensive spike standards. Routine practice dictates use of these spikes at the workstation on the smaller aliquots actually submitted through the radiochemical separations and analysis process. The feed and effluent were analyzed directly by GEA, IC, and titration (hydroxide). Samples were analyzed in duplicate. The IC and titration required blank spike (BS) and matrix spike (MS) QC samples. A diluent blank was provided with all samples. The duplicate eluate samples (0.5 M HNO3 matrix) were diluted 205× and analyzed directly. Therefore, a preparative BS and MS were not required. A diluent blank was provided with all samples.
4.2.1 Inductively-Coupled Plasma–Atomic Emission Spectrometry All batch and instrument QC requirements were met. The Na concentrations in the samples overwhelmed the MS addition and thus the MS Na recoveries were not reported. The quantitation of Na was based on the serial-diluted material. With the exception of the Na-only analysis, the Na serial dilutions results were not reported. Precision for the acid-digested AP-101DF tank waste feed and effluent matrices was determined from batch duplicates prepared from AN-102 pretreated waste; the relative percent difference (RPD) of the AN-102 sample is provided. Opportunistically measured analytes are provided for information only. The AP-101DF feed Na, K, Al, and Cr composition agreed well with previously-reported values (Fiskum et al. 2004a).
4.2.2 Inductively Coupled Plasma-Mass Spectrometry All batch and instrument QC requirements were met. The 133Cs results agreed well with previously-reported data (Fiskum et al. 2004a).
4.2.3 Uranium by Kinetic Phosphorescence Analysis All instrument QC requirements were met. The preparation batch did not include a low-level U spike. The U spike prepared as part of the digestion batch was high enough to be measured by ICP-AES and included a plethora of interfering analytes that precluded direct analysis by the KPA. Therefore, U BS and MS recoveries were not reported, and the analysis results were caveated as estimates. The U measured in the AP-101DF feed agreed well with the previously reported results (Fiskum et al. 2000 and 2004a). Because the eluate was directly analyzed (no digestion preparation), a BS and MS were not required.
4.2.4 Gamma Energy Analysis Gamma energy analysis was conducted directly and non-destructively on samples. Therefore, laboratory control samples (LCSs), BS, and MS QC samples were not required. Precision for the acid-digested AP-101DF tank waste feed and effluent matrices was determined from batch duplicates prepared from AN-102 pretreated waste; the RPD of the AN-102 sample is provided.

4.10
The AP-101DF feed value of 118 μCi/mL 137Cs reported under ASR 7192 agreed well with the decay-corrected 137Cs concentration previously reported (Fiskum 2004a). The 127 μCi/mL 137Cs reported under ASR 7489 was within the 2-σ uncertainty of the previous value. The previous value was used as the basis for data calculations.
4.2.5 Americium, Curium, and Plutonium All instrument QC requirements were met. Precision for the acid-digested AP-101DF tank waste feed and effluent matrices was determined from batch duplicates prepared from AN-102 pretreated waste; the RPD of the AN-102 sample is provided. The 238Pu, 239+240Pu, 243+244Cm, and total alpha RPDs exceeded 15%. The AP-101DF feed and effluent samples may have been contaminated from processing in-cell as indicated by the 238Pu and 243+244Cm concentrations, which were similar to the process blank results. The BS and MS batch QC results met the acceptance criteria. The AP-101DF 239+240Pu concentration was in good agreement with previously-reported values (Fiskum et al. 2004a).
4.2.6 Total Alpha All instrument QC requirements were met. All sample results were less than the method detection limit. Therefore, the high RPD was not quality-affecting. The BS and MS recoveries met the acceptance criteria. The sum of alpha isotopes (Pu, Am, and Cm) measured by alpha energy analysis (AEA) was a better measure of the total alpha composition.
4.2.7 Ion Chromatography All batch and instrument QC requirements were met.
4.2.8 Hydroxide All instrument and batch QC requirements were met. The AP-101DF hydroxide concentration agreed well with previously-reported results (Fiskum et al. 2004a).
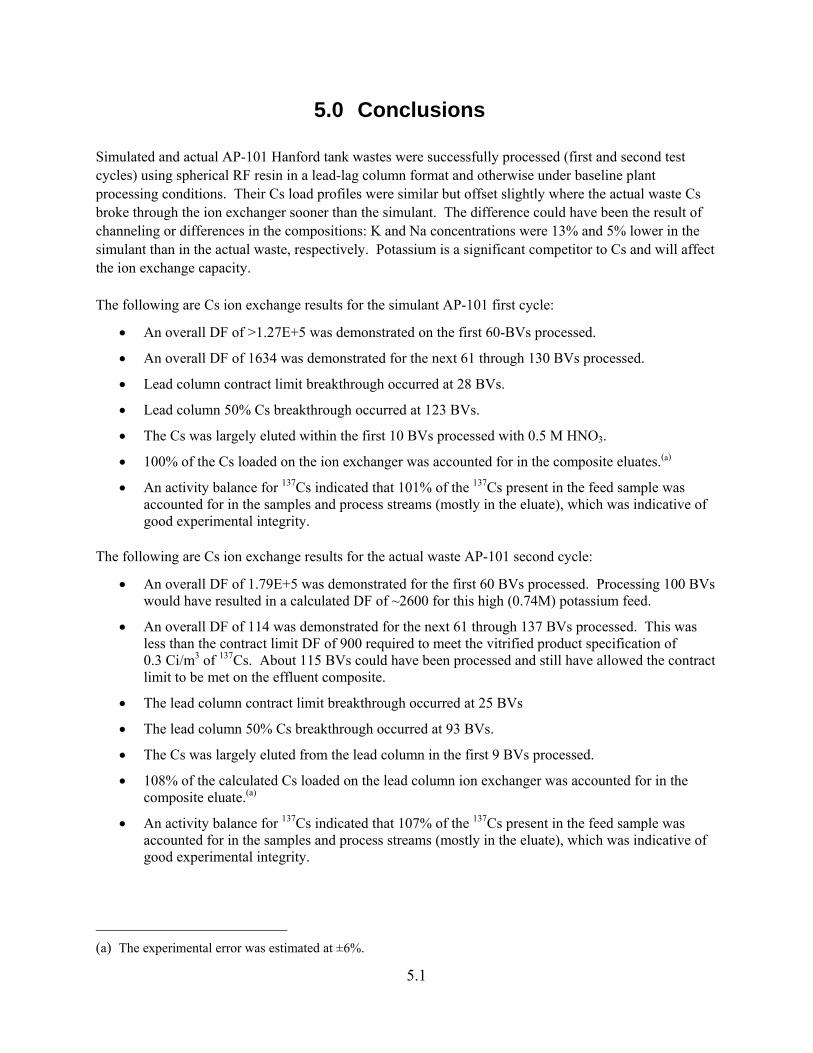
5.1
5.0 Conclusions
Simulated and actual AP-101 Hanford tank wastes were successfully processed (first and second test cycles) using spherical RF resin in a lead-lag column format and otherwise under baseline plant processing conditions. Their Cs load profiles were similar but offset slightly where the actual waste Cs broke through the ion exchanger sooner than the simulant. The difference could have been the result of channeling or differences in the compositions: K and Na concentrations were 13% and 5% lower in the simulant than in the actual waste, respectively. Potassium is a significant competitor to Cs and will affect the ion exchange capacity. The following are Cs ion exchange results for the simulant AP-101 first cycle:
• An overall DF of >1.27E+5 was demonstrated on the first 60-BVs processed.
• An overall DF of 1634 was demonstrated for the next 61 through 130 BVs processed.
• Lead column contract limit breakthrough occurred at 28 BVs.
• Lead column 50% Cs breakthrough occurred at 123 BVs.
• The Cs was largely eluted within the first 10 BVs processed with 0.5 M HNO3.
• 100% of the Cs loaded on the ion exchanger was accounted for in the composite eluates.(a)
• An activity balance for 137Cs indicated that 101% of the 137Cs present in the feed sample was accounted for in the samples and process streams (mostly in the eluate), which was indicative of good experimental integrity.
The following are Cs ion exchange results for the actual waste AP-101 second cycle:
• An overall DF of 1.79E+5 was demonstrated for the first 60 BVs processed. Processing 100 BVs would have resulted in a calculated DF of ~2600 for this high (0.74M) potassium feed.
• An overall DF of 114 was demonstrated for the next 61 through 137 BVs processed. This was less than the contract limit DF of 900 required to meet the vitrified product specification of 0.3 Ci/m3 of 137Cs. About 115 BVs could have been processed and still have allowed the contract limit to be met on the effluent composite.
• The lead column contract limit breakthrough occurred at 25 BVs
• The lead column 50% Cs breakthrough occurred at 93 BVs.
• The Cs was largely eluted from the lead column in the first 9 BVs processed.
• 108% of the calculated Cs loaded on the lead column ion exchanger was accounted for in the composite eluate.(a)
• An activity balance for 137Cs indicated that 107% of the 137Cs present in the feed sample was accounted for in the samples and process streams (mostly in the eluate), which was indicative of good experimental integrity.
(a) The experimental error was estimated at ±6%.

5.2
The fates of other metals were evaluated based on the AP-101DF tank waste feed, effluent, and eluate analysis.
• Neither Pu nor U appeared to exchange to any significant extent onto the RF resin. The Pu recovery in the RF eluate (8%) was significantly less than the eluate Pu recovery for SL-644 (72%).
• Insignificant quantities of Cr were found in the eluate. The mass of Cr in the RF eluate (~0.80 mg equal to ~0.35%) was about one third of the SL-644 eluate Cr mass (2.4 mg equal to 1.4%).

Appendix A
AP-101 Simulant Recipe

A.1
Appendix A: AP-101 Simulant Recipe
Table A.1. Chemical Addition Order and Amounts for 10-L Simulant Preparation
Compound Name Formula Mass, g Sodium acetate NaCH3CO2 20.29 Sodium oxalate Na2C2O4 23.85 Aluminum nitrate nonahydrate (60% solution) Al(NO3)3-9H2O 1617.5 Barium nitrate Ba(NO3)2 0.0055 Beryllium oxide BeO 0.0325 Cadmium nitrate tetrahydrate Cd(NO3)2-4H2O 0.0488 Calcium nitrate tetrahydrate Ca(NO3)2-4H2O 0.4036 Cesium nitrate CsNO3 0.0878 Rubidium nitrate RbNO3 0.0609 Copper nitrate trihydrate Cu(NO3)2-3H2O 0.0540 Iron nitrate nonahydrate Fe(NO3)3-9H2O 0.1606 Lead nitrate Pb(NO3)2 0.2133 Lithium nitrate LiNO3 0.0298 Nickel nitrate hexahydrate Ni(NO3)2-6H2O 0.3486 Zinc nitrate hexahydrate Zn(NO3)2-6H2O 0.2266 Boric acid H3BO3 0.8164 Molybdenum oxide MoO3 0.1930 Sodium chloride NaCl 23.90 Sodium fluoride NaF 1.180 Sodium dihydrogen phosphate Na2H2PO4 14.92 Sodium sulfate Na2SO4 52.98 Sodium nitrate NaNO3 600.0 Potassium nitrate KNO3 200.2 Sodium hydroxide (50% solution) NaOH 2384 Tungstic acid H2WO4-H2O 0.3201 Sodium meta-silicate Na2SiO3-9H2O 12.34 Sodium chromate Na2CrO4 4.735 Sodium formate HCOONa 16.14 Sodium nitrite NaNO2 487.8 Sodium carbonate Na2CO3 200.3 Potassium carbonate K2CO3 355.2

Appendix B
AP-101 Sampling Chains of Custody

B.1
Appendix B: AP-101 Sampling Chains of Custody

Appendix C
Contract Limit Calculation

C.1
Appendix C: Contract Limit Calculation
The 137Cs contract limit in AP-101 (Envelope A) vitrification feed is described below. Assumptions
1) Concentration of Na2O in Env. A glass = 14% (=14 g Na2O/100 g glass)
2) For maximum 137Cs concentration in glass, assume that all Na comes from the feed. If some Na is added to the vitrification feed, multiply the maximum 137Cs value determined below by ratio of total Na:feed Na.
3) Glass density = 2.66 MT/m3 (=2.66 g/mL)
4) Maximum 137Cs in glass = 0.3 Ci/m3 (= 0.3 Ci/1E+6 mL = 3E-7 Ci/mL)
5) AP-101DF actual waste Na concentration = 5.13 M
6) AP-101DF actual waste 137Cs concentration = 117 μCi/mL
Na Loading in Glass
14 g Na2O/100g glass * 1 mole Na2O/62 g Na2O) * (2 mole Na/mole Na2O)* (23 g Na/mole Na) * (2.66 g glass/mL glass) = 0.276 g Na/mL glass
Maximum 137Cs:Na in Glass
(3.0E-7 Ci 137Cs/mL glass)/(0.276 g Na/mL glass) = 1.09E-6 Ci 137Cs/g Na (1.09 E-6 Ci 137Cs/g Na) * (23 g Na/mole) = 2.50E-5 Ci 137Cs/mole Na
Maximum 137Cs:Na in Feed
(2.5E-5 Ci 137Cs/mole Na) * (5.13 mole Na/L feed) = 1.28E-4 Ci 137Cs/L = 128 μCi 137Cs/L = 0.128 μCi 137Cs/mL
AP-101DF Actual Waste Cs Fraction Remaining (C/Co) Contractual
Limit
(0.128 μCi 137Cs/ mL)/(117 μCi 137Cs/mL) = 1.09E-3 C/Co = 0.109 % C/Co
Decontamination Factor (DF) Contract Limit
1/(1.09E-3 C/Co) = 914 Co/C

C.2
An alternate calculation for the 137Cs contract limit in AP-101 (Envelope A) vitrification feed using higher Na2O loading and 10-year decay correction for 137Cs is described below. Assumptions
1) Concentration of Na2O in Env. A glass = 18.5% (=18.5 g Na2O/100 g glass)
2) For maximum 137Cs concentration in glass, assume that all Na comes from the feed. If some Na is added to the vitrification feed, multiply the maximum 137Cs value determined below by the ratio of total Na:feed Na.
3) Glass density = 2.66 MT/m3 (=2.66 g/mL)
4) Maximum 137Cs in glass = 0.3 Ci/m3 (= 0.3 Ci/1E+6 mL = 3E-7 Ci/mL)
5) AP-101DF actual waste Na concentration = 5.13 M
6) AP-101DF actual waste 137Cs concentration = 92.9 μCi/mL (117 μCi/mL decayed 10 years)
Na Loading in Glass
18.5 g Na2O/100g glass * 1 mole Na2O/62 g Na2O) * (2 mole Na/mole Na2O)* (23 g Na/mole Na) * (2.66 g glass/mL glass) = 0.365 g Na/mL glass
Maximum 137Cs:Na in Glass
(3.0E-7 Ci 137Cs/mL glass)/(0.365 g Na/mL glass) = 8.22E-7 Ci 137Cs/g Na (8.22 E-7 Ci 137Cs/g Na) * (23 g Na/mole) = 1.89E-5 Ci 137Cs/mole Na
Maximum 137Cs:Na in Feed
(1.89E-5 Ci 137Cs/mole Na) * (5.13 mole Na/L feed) = 9.70E-5 Ci 137Cs/L = 97.0 μCi 137Cs/L = 0.0970 μCi 137Cs/mL
AP-101DF Actual Waste Cs Fraction Remaining (C/Co) Contractual
Limit
(0.0970 μCi 137Cs/ mL)/(92.9 μCi 137Cs/mL) = 1.04E-3 C/Co = 0.104 % C/Co
Decontamination Factor (DF) Contract Limit
1/(1.07E-3 C/Co) = 958 Co/C

Appendix D
Load and Elution Process Data

D.1
Appendix D: Load and Elution Process Data
Table D.1. Lead and Lag Column Simulant Feed Processing, Feed Displacement, and Water Rinse
Lead Column Lag Column Cumulative
BV Processed Effluent (C),
μCi/mL % C/Co Cumulative BV
Processed Effluent (C),
μCi/mL % C/Co Feed
4.2 <9.36E-7 <7.70E-4 4.2 6.58E-7 5.36E-4
11.8 2.17E-6 1.77E-3 10.9 <7.10E-7 <5.78E-4
20.3 2.37E-5 1.93E-2 18.5 <9.74E-7 <7.93E-4
29.6 1.37E-4 1.12E-1 26.9 <1.20E-6 <9.76E-4
50.1 1.81E-3 1.47E+0 46.4 <1.14E-6 <9.33E-4
61.1 4.55E-3 3.70E+0 56.5 <1.39E-6 <1.13E-3
68.0 7.27E-3 5.92E+0 62.4 1.82E-6 1.48E-3
76.4 1.19E-2 9.68E+0 69.7 3.90E-6 3.18E-3
88.7 2.37E-2 1.93E+1 81.2 1.21E-5 9.88E-3
100.6 3.75E-2 3.05E+1 92.1 3.59E-5 2.93E-2
121.2 5.94E-2 4.84E+1 111.8 2.06E-4 1.68E-1
131.1 6.76E-2 5.50E+1 120.7 4.27E-4 3.48E-1
Feed Displacement
-- -- -- 128.2 1.82E+2 2.91E-1
Water Rinse
-- -- -- 135.9 4.14E+0 6.62E-3

D.2
Table D.2. Simulant Processing Lead and Lag Column Elution and Water Rinse
Lead Column Lag Column Cumulative
BV Processed C/Co Cumulative
BV Processed C/Co Elution
1.38 1.07E-2 1.33 5.18E-5
2.67 2.90E-2 2.54 1.58E-4
4.05 2.60E+1 3.89 3.14E-4
5.34 5.59E+1 5.26 1.47E+1
6.83 2.12E+0 6.71 3.67E-1
8.24 3.77E-2 8.13 1.72E-2
9.64 1.21E-2 9.52 5.16E-3
11.07 6.09E-3 10.94 2.41E-3
12.47 3.86E-3 12.33 1.27E-3
13.89 2.76E-3 13.75 8.60E-4
15.31 2.12E-3 15.18 4.71E-4
BV C/Co pH BV C/Co pH
Water Rinse
16.39 1.91E-3 < or =1 16.27 3.91E-4 < or =1
17.47 1.66E-3 < or =1 17.33 3.46E-4 < or =1
18.48 1.20E-3 < or =1 18.37 2.07E-4 < or =1
19.46 2.16E-4 2 19.41 2.46E-5 3
20.49 9.26E-5 3 20.45 5.40E-6 4
21.50 4.70E-5 4 21.49 3.26E-5 5
22.53 1.22E-4 5 22.54 1.82E-5 5
23.28 6.22E-5 5 23.13 1.90E-5 6

D.3
Table D.3. Lead and Lag Column AP-101DF Feed Processing, Feed Displacement, and Water Rinse
Lead Column Lag Column Cumulative
BV Processed Effluent (C),
μCi/mL % C/Co Cumulative
BV ProcessedEffluent (C),
μCi/mL % C/Co
Feed 4.0 1.34E-4 1.20E-4 4.0 4.95E-5 4.42E-5
10.8 7.18E-4 6.42E-4 10.6 1.06E-4 9.45E-5 19.2 1.94E-2 1.74E-2 18.8 1.25E-3 1.11E-3 27.9 1.95E-1 1.74E-1 27.3 2.40E-4 2.15E-4 36.4 8.24E-1 7.37E-1 35.5 6.92E-5 6.19E-5 45.2 2.44E+0 2.18E+0 44.1 1.53E-4 1.37E-4 55.7 6.81E+0 6.09E+0 54.3 8.24E-4 7.37E-4 60.4 1.04E+1 9.26E+0 58.9 1.97E-3 1.76E-3 72.3 2.30E+1 2.06E+1 70.6 1.10E-2 9.82E-3 82.9 3.94E+1 3.52E+1 81.0 4.46E-2 3.99E-2 95.0 6.03E+1 5.39E+1 92.8 1.70E-1 1.52E-1
104.7 7.56E+1 6.76E+1 102.3 4.49E-1 4.02E-1 115.3 8.72E+1 7.79E+1 112.7 1.12E+0 1.00E+0126.6 9.67E+1 8.64E+1 123.9 2.75E+0 2.46E+0137.5 1.05E+2 9.34E+1 134.6 5.55E+0 4.96E+0
– – – 0–60 BVs 6.23E-4 5.57E-4 – – – 60–137 BVs 9.84E-1 8.80E-1
Feed Displacement – – – 136.28 5.43E+0 4.86E+0– – – 138.02 6.31E+0 5.64E+0– – – 139.68 5.89E+0 5.26E+0– – – 141.38 1.09E+0 9.70E-1 – – – 143.12 3.62E-1 3.24E-1
Water Rinse – – – 144.67 2.45E-1 2.19E-1 – – – 146.83 1.75E-1 1.56E-1 – – – 148.49 1.44E-1 1.29E-1 – – – 150.14 1.30E-1 1.16E-1 – – – 151.79 1.04E-1 9.31E-2

D.4
Table D.4. Lead Column Elution and Water Rinse
Lead Column
Cumulative BV Processed
Eluate (C),μCi/mL C/Co
ASO Confirmation Eluate (C),
μCi/mL Elution
1.40 1.52E+0 1.36E-2
2.81 5.24E+0 4.68E-2 5.51E+0
4.24 3.71E+3 3.32E+1 3.53E+3
5.65 4.16E+3 3.72E+1 3.76E+3
7.06 2.46E+1 2.20E-1 2.80E+1
8.48 2.42E+0 2.17E-2 2.57E+0
9.88 9.05E-1 8.09E-3 –
11.28 4.99E-1 4.46E-3 –
12.71 3.28E-1 2.93E-3 –
14.16 2.48E-1 2.22E-3 –
15.61 2.18E-1 1.95E-3 2.18E-1
Water Rinse
16.6 1.84E-1 1.64E-3 –
17.7 1.66E-1 1.49E-3 –
18.8 1.16E-1 1.03E-3 –
Appendix E
Cesium Ion Exchange Testing Personnel
E.1
Appendix E: Cesium Ion Exchange Testing Personnel
Cognizant Scientists S. K. Fiskum B. K. McNamara D. L. Blanchard Data Reviewers Bryan Cook Stuart Arm Technician M. J. Steele Hot Cell Technicians J. W. Chenault R. J. Dunn F. V. Hoopes Analytical Support L. P. Darnell O. T. Farmer L. R. Greenwood D. R. Sanders C. Z. Soderquist M. J. Steele R. G. Swoboda K. K. Thomas M. L. Thomas T. L. Trang-Le

PNWD-3697 WTP-RPT-134, Rev 0
Distr. 1
Distribution No. of Copies OFFSITE
No. of Copies ONSITE
1 Savannah River National Laboratory Richard Edwards Savannah River National Laboratory Westinghouse SA Aiken, SC 29808-0001
11 Battelle—Pacific Northwest Division S. T. Arm P7-22 D. L. Blanchard P7-25 S. K. Fiskum (2) P7-22 M. S. Fountain P7-27
D. E. Kurath P7-28 M. J. Steele P7-22
Project File (2) P7-28 Information Release (2) K1-06 4 Bechtel National, Inc. J. Talbott (2) H4-02 J. L. Meehan H4-02 M. R. Thorson H4-02