spliceport—an interactive splice-site analysis tool
TRANSCRIPT

Nucleic Acids Research, 2007, 1–7doi:10.1093/nar/gkm407
SplicePort—An interactive splice-site analysis toolRezarta Islamaj Dogan1,2,*, Lise Getoor1, W. John Wilbur2 and Stephen M. Mount3,4
1Computer Science Department, University of Maryland, College Park, Maryland, 20742, 2National Center forBiotechnology Information, National Library of Medicine, National Institutes of Health, Bethesda, Maryland, 20894,3Department of Cell Biology and Molecular Genetics and 4Center for Bioinformatics and Computational Biology,University of Maryland, College Park, Maryland 20742, USA
Received January 31, 2007; Revised April 18, 2007; Accepted May 3, 2007
ABSTRACT
SplicePort is a web-based tool for splice-siteanalysis that allows the user to make splice-sitepredictions for submitted sequences. In addition,the user can also browse the rich catalog of featuresthat underlies these predictions, and which we havefound capable of providing high classificationaccuracy on human splice sites. Feature selectionis optimized for human splice sites, but the selectedfeatures are likely to be predictive for othermammals as well. With our interactive featurebrowsing and visualization tool, the user can viewand explore subsets of features used in splice-siteprediction (either the features that account for theclassification of a specific input sequence or thecomplete collection of features). Selected featuresets can be searched, ranked or displayed easily.The user can group features into clusters andfrequency plot WebLogos can be generated foreach cluster. The user can browse the identifiedclusters and their contributing elements, lookingfor new interesting signals, or can validate pre-viously observed signals. The SplicePort webserver can be accessed at http://www.cs.umd.edu/projects/SplicePort and http://www.spliceport.org.
INTRODUCTION
Accurate splice-site prediction is a critical component ofeukaryotic gene prediction. Whole genome analysis of asingle organism or comparison of genomes depends onaccurate gene annotation. However, annotation is stilllimited by our ability to properly identify splice sites (1).We have developed a feature generation algorithm (FGA)for sequence classification (2). FGA automaticallysearches through a large space of sequence-based featuresto identify the predictive features. The identified featuresare used by a support vector machine classifier andproduce accurate splice-site prediction on human
pre-mRNA sequence data. In this work, we present aweb-based interactive tool, SplicePort, which allows theuser to explore the FGA features and allows the user tomake splice-site predictions for submitted sequences basedon these features.Existing Internet resources, such as GeneSplicer (3),
NetGene (4,5), MaxEntScan (6) and SplicePredictor (7),offer online splice-site prediction, providing the user witha list of predicted constituent splice sites for each inputpre-mRNA (or genomic) sequence. However, a researchermay also be interested in identifying the signals usedby the computational method to predict the splice site.Any element in the DNA sequence of a gene that helps tospecify the accurate splicing of the pre-mRNA sequence isa splicing signal. Branch sites, pyrimidine tracts, exonsplicing enhancers and silencers are all examples of knownfunctional signals in the neighborhood of splice sitesin eukaryotic genomes (see (8) for review). SplicePort,besides splice-site prediction, allows the user to explore allthe FGA-generated features. We hope this will provide auseful resource for the identification of signals involvedin specific splicing events, and possibly for the discovery ofpreviously unappreciated splicing motifs.
THE FEATURE GENERATION ALGORITHM
In earlier work, we developed the FGA framework, whichautomatically identifies sequence-based features importantfor a sequence classification task (2). We applied thismethod to the task of splice-site prediction for the humangenome (formally, the classificiation of AG dinucleotidesinto acceptors and non-acceptors and the classification ofGT dinucleotides into donors and non-donors). FGAachieves very high accuracy compared to GeneSplicer (3),one of the leading programs in splice-site prediction.At the 95% sensitivity level, we were able to achieveimprovements of 43.0% and 50.7% in the reduction of thefalse positive rate for acceptor splice sites and donor splicesites respectively (2), [Islamaj, R. et al., submitted].Our data is a collection of 4000 pre-mRNA human
RefSeq sequences. We refer to these sequences as thetraining sequences. For our experiments, we applied a
*To whom correspondence should be addressed. Tel: (301) 405 2717; Email: [email protected]
� 2007 The Author(s)
This is an Open Access article distributed under the terms of the Creative Commons Attribution Non-Commercial License (http://creativecommons.org/licenses/
by-nc/2.0/uk/) which permits unrestricted non-commercial use, distribution, and reproduction in any medium, provided the original work is properly cited.
Nucleic Acids Research Advance Access published June 18, 2007

3-fold cross-validation scheme, and we tested our finalsplice-site model on the B2Hum data set supplied by theGeneSplicer team (3). This data set is a collection of 1115pre-mRNA human sequences which do not overlap withour training sequences.The core of the FGA method is a focused FGA that
constructs complex features from simple sequence ele-ments, such as single nucleotides and their position.Optimal features are selected after each generation step inorder to keep the number of features manageable, andmultiple rounds of feature construction and featureselection are applied in an iterative fashion. The featuretypes that we consider capture compositional and posi-tional properties of sequences. A compositional feature isa string of k consecutive nucleotides (k-mer), where kranges from 1 to 6. Compositional features includeupstream, downstream and general k-mers. For eachcompositional feature, we count the number of timesthat feature is present in the neighborhood of the splicesite. The length of the neighborhood region for theupstream or the downstream k-mer feature type is 80 nt,while that of the general k-mer is 160. The position-specifick-mer feature represents the substring appearing atpositions i, i+ 1, . . . , i+ k� 1 in the sequence.Conjunctive positional features are complex featuresconstructed from conjunctions of position-specific 1-merfeatures. An n-positional feature consists of a conjunctionof n nucleotides in n different positions co-occurring in thesequence. This type of feature is intended to capture thecorrelations between different nucleotides in non-consecutive positions in the sequence. For each positionalfeature we record the absence or presence of that featurein the neighborhood of the splice site.For the human RefSeq training sequences, the FGA
algorithm selected 3000 features for acceptor splice-siteprediction and 1600 features for donor splice-site predic-tion. The acceptor site model contains 1362 compositionalfeatures and 1638 positional features, while the donorsite model contains 764 compositional features and836 positional features. We call these sets of featuresthe acceptor model feature set and the donor modelfeature set.The model feature sets then are used as input for the
learning algorithm. The learning algorithm we use isC-modified least squares (CMLS), described by Zhangand Oles in (9). CMLS is a max-margin method similar tosupport vector machines. Relative to standard supportvector machines, CMLS has a smoother penalty functionwhich allows calculation of gradients that provide fasterconvergence (9).For the splice-site prediction problem, two separate
CMLS classifiers are required, one for acceptor and onefor donor sites. After the training phase of these classifiers,each feature fi in the model feature sets is assigned aweight wi. These weights define the decision boundary ofthe linear classifier that optimizes the performance.We also use these weights to derive feature ranking.When the classification model is given a new input
sequence (the sequence is in the format [80 nt +AG/GT+80nt]), initially it checks whether it is a candidateacceptor (AG) or a candidate donor (GT) splice-site
sequence. Then, the classifier checks the sequence if itcontains any of the features previously identified by theFGA algorithm in the corresponding model feature set.The classifier produces a final score for the input sequenceadding the weights of each present feature. This score,assigned by SplicePort and displayed in the output, is bestunderstood in terms of the splice-site classificationproblem itself.
In Figure 1, we use the B2hum data set supplied by theGeneSplicer team to show the sensitivity and specificitydifferences for different FGA score thresholds. We alsoprovide a quantitative comparison between the twoalgorithms. Figure 1A depicts acceptor splice sites andFigure 1B depicts donor splice sites.
SPLICEPORT
This feature generation and classification model is thecore of the SplicePort web server (http://www.cs.umd.edu/projects/SplicePort and http://www.spliceport.org). Fromthe SplicePort initial page, the user has two options:splice-site prediction and motif exploration. The splice-sitepredictor receives the user’s input sequence and reports allthe predicted constituent splice sites. The motif explorercan be used to investigate acceptor and donor modelfeature sets identified in the input sequence or the sets offeatures FGA has discovered in the training sequences.The latter allows the user to browse the entire collection ofpositional features identifiable during the training phase.We believe our motif exploration is novel and useful.While we illustrate its use on the FGA selected features,we believe this interface is general and can be used toexplore other feature types (10–12), and features selectedby other learning algorithms (13,14). In Figure 2, wesummarize the functionality of SplicePort and we describeits components in greater detail in the following sections.
SPLICE-SITE PREDICTION
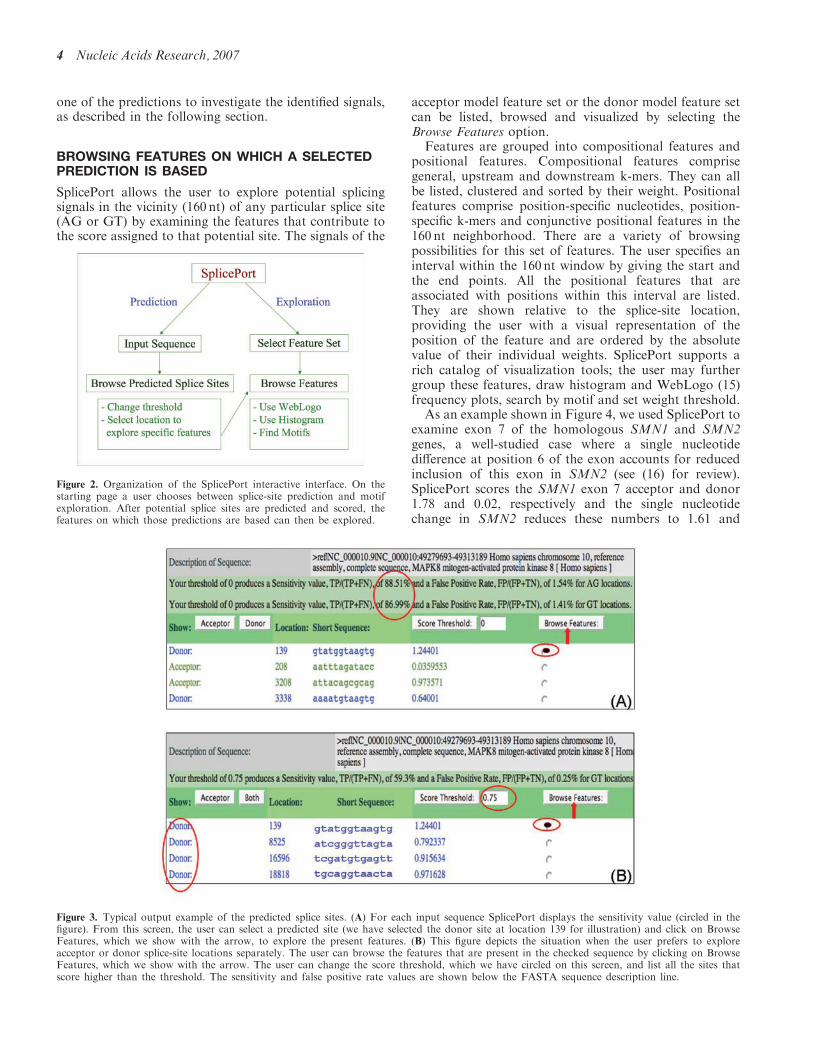
Using the splice-site predictor is straightforward. The userinputs a sequence in FASTA format. The sequence can becut and pasted directly into the window, or uploaded as aFASTA file. The server is case insensitive and acceptseither DNA (T) or RNA (U) sequences as input. Thelength of the submitted sequence determines the timerequired for prediction (�1 s/kb of submitted sequence).The predictor uses a splice-site neighborhood of80 nt upstream and 80 nt downstream for a constituentsplice-site. After the user submits the input sequence file,the results of splice-site prediction are displayed ina tabular format. Figure 3A shows a sample output.The information listed for each prediction is: donor/acceptor splice site, the location in the sequence, a shortsubsequence centered at that location and the FGA score.The sensitivity value can be changed by entering a newscore threshold. This value by default is 88.5% for donorsites and 88.8% for acceptor sites (corresponding toscore=0). After each change, the new sensitivity and falsepositive rate values are calculated and displayed to theuser, as shown in Figure 3B. Finally, the user can select
2 Nucleic Acids Research, 2007

A
B
Figure 1. Sensitivity, specificity, false positive rate and precision vary with FGA score. (A) Acceptor sites. (i) Sensitivity, TP/(TP+FN), andPrecision, TP/(TP+FP), vs FGA score. (ii) Specificity, TN/(TN+FP), and False Positive Rate, FP/(TN+FP), vs FGA score; (iii) FGA results arecompared with those of GeneSplicer. False positive rate is shown as a function of sensitivity. These results show that FGA produces fewer falsepositives for every sensitivity threshold. (iv) Precision is shown as a function of sensitivity. These results show that FGA produces higher precision forevery sensitivity threshold. These differences are highly statistically significant. (B) Donor sites (Graphs are as in A).
Nucleic Acids Research, 2007 3
one of the predictions to investigate the identified signals,as described in the following section.
BROWSING FEATURES ON WHICH A SELECTEDPREDICTION IS BASED
SplicePort allows the user to explore potential splicingsignals in the vicinity (160 nt) of any particular splice site(AG or GT) by examining the features that contribute tothe score assigned to that potential site. The signals of the
acceptor model feature set or the donor model feature setcan be listed, browsed and visualized by selecting theBrowse Features option.
Features are grouped into compositional features andpositional features. Compositional features comprisegeneral, upstream and downstream k-mers. They can allbe listed, clustered and sorted by their weight. Positionalfeatures comprise position-specific nucleotides, position-specific k-mers and conjunctive positional features in the160 nt neighborhood. There are a variety of browsingpossibilities for this set of features. The user specifies aninterval within the 160 nt window by giving the start andthe end points. All the positional features that areassociated with positions within this interval are listed.They are shown relative to the splice-site location,providing the user with a visual representation of theposition of the feature and are ordered by the absolutevalue of their individual weights. SplicePort supports arich catalog of visualization tools; the user may furthergroup these features, draw histogram and WebLogo (15)frequency plots, search by motif and set weight threshold.
As an example shown in Figure 4, we used SplicePort toexamine exon 7 of the homologous SMN1 and SMN2genes, a well-studied case where a single nucleotidedifference at position 6 of the exon accounts for reducedinclusion of this exon in SMN2 (see (16) for review).SplicePort scores the SMN1 exon 7 acceptor and donor1.78 and 0.02, respectively and the single nucleotidechange in SMN2 reduces these numbers to 1.61 and
Figure 2. Organization of the SplicePort interactive interface. On thestarting page a user chooses between splice-site prediction and motifexploration. After potential splice sites are predicted and scored, thefeatures on which those predictions are based can then be explored.
Figure 3. Typical output example of the predicted splice sites. (A) For each input sequence SplicePort displays the sensitivity value (circled in thefigure). From this screen, the user can select a predicted site (we have selected the donor site at location 139 for illustration) and click on BrowseFeatures, which we show with the arrow, to explore the present features. (B) This figure depicts the situation when the user prefers to exploreacceptor or donor splice-site locations separately. The user can browse the features that are present in the checked sequence by clicking on BrowseFeatures, which we show with the arrow. The user can change the score threshold, which we have circled on this screen, and list all the sites thatscore higher than the threshold. The sensitivity and false positive rate values are shown below the FASTA sequence description line.
4 Nucleic Acids Research, 2007

�0.18. The feature browser shows that the difference indonor scores is primarily due to the negatively scoringupstream feature TAG (�0.18).
MOTIF EXPLORATION TOOL
Users can explore general features discovered by FGA forhuman RefSeq sequences using the Motif ExplorationTool. In order to facilitate motif discovery, the MotifExploration Tool presents a much richer set of featuresthan the sequence-specific feature browser (which presentsonly those features used to score the submitted sequence).We use a much richer set of features than existing splice-site tools, and focus on these rather than the simplecompositional features. Each feature set we considered isthe conjunction of a k-mer and a number of arbitraryposition-specific nucleotides. We denote a specific setusing the notation K-mer+X; for example, 4-mer+2 isthe set of 4-mers together with two position-specificnucleotides.
Features of this type may be useful to discover non-adjacent correlations between the different nucleotides indifferent positions. Each of these sets contains 5000 topranking features according to the Information Gaincriterion.
Figure 5 illustrates a portion of the Motif Explorer.The figure on the top shows how the user selects a featureset and specifies an interval to browse the features.The figure on the bottom shows the results. The featuresare shown with respect to the splice-site location, and theyare ordered according to the absolute value of theirweight. The weight of a feature is learned by theclassification algorithm during training. These weightscan be used to order and group the features. A positivelyweighted feature is a feature mostly found in splice-sitesequences, and a negatively weighted feature is a featuremore commonly found in non-splice-site sequences.Figure 6 shows the results of WebLogo and Histogramfunctions. The user can view a depiction of the positivelyand negatively weighted features in the specified intervalby generating a WebLogo frequency plot. The histogramallows the user to visualize the role of each nucleotide foreach position in the specified interval. We represent thiswith four different bars, one for each nucleotide, for eachposition. The height of each bar is the accumulated weightfor that position-specific nucleotide and is calculated usingthe weights of all the features that have that nucleotide atthat position.Because the features generated with the FGA algorithm
are position-specific features, we may find the samepattern of nucleotides repeated in a given interval.
Figure 4. Splice-site prediction output of SplicePort for SMN1 (A) and SMN2 (B) exon 7 gene sequences with 1kb nucleotides flanking region. Theacceptor site of exon 7 is at position 1,000 and the donor site is at position 1,054. We see that the single nucleotide difference at position 6 of theexon reduces the acceptor score from 1.78 to 1.61 and the donor score from 0.02 to �0.18.
Nucleic Acids Research, 2007 5

Interval Features refer to a set of features which share thesame pattern of nucleotides but differ in starting positions.The user can list all the interval features for a specifiedinterval and feature set. SplicePort displays the number ofindividual features as well as their average weight. Toobtain the list of all individual features shown relative to asplice site in their respective locations, the user can use theSearch by Motif option. This option also facilitates thesearch for known motifs or partial motifs. The user entersa short sequence and is returned a list of all features in thespecified interval that contain that sequence.
In addition, for each feature set and specified intervalwe perform a clustering procedure based on edit distance.We identify similar features and the tool groups themtogether generating WebLogo frequency plots to representthem. The user can browse these identified clustersand their individual elements by selecting IdentifiedMotifs. This option may help the user identify knownfunctional motifs and may guide them in the search fornew ones.
An illustrative example inspired by the case of SMN1and SMN2 is a comparison of TAG and CAG among5-mer features located in the �60 to �30 interval relativeto donor sites. Features containing TAG are all negative,with multiple examples of TTTAG. Conversely, CAGshows primarily positive features. This example is shownin Figure 7.
SUMMARY
The SplicePort server is a versatile tool with two mainfunctions. First, the user can perform accurate splice-siteprediction on a sequence which they input to the tool,with the flexibility of exploring all the putative splice-site locations, their score, corresponding sensitivity andfalse positive rate values. Second, the user can explore themotifs for the requested location in the input sequenceand browse the complete collection of identified motifsfor both acceptor and donor splice sites. This tool canboth help a user decide whether there is a splice site inthe given sequence, and it can also allow the user toidentify elements of functional motifs. An additionalbenefit of a computational exploration approach such asSplicePort is that it can be readily implemented in othergenomes.
Figure 6. Typical outputs for motif exploration. These are features generated for acceptor splice-site prediction: (A) shows WebLogo frequency plotsof features when we select the interval [�20,1], and (B) shows the histogram generated from accumulated weights of features when we select theinterval [�15, 6]. The little arrows denote the location of acceptor splice-site consensus dinucleotide AG
Figure 5. Motif Exploration Tool. This figure shows initially theselection of the feature set 4mer+2 in the branch site interval.SplicePort outputs the list of features in the specified interval. Eachfeature is aligned to the splice-site position and has a weight assigned toit by the FGA algorithm. The acceptor splice site is depicted in theoutput with the capitalized dinucleotide AG.
6 Nucleic Acids Research, 2007

In summary, SplicePort allows the user to discover usefulinsight in pre-mRNA splicing signals. This data analysistool provides the community of researchers investigatingpre-mRNA splicing with a powerful and flexible resourcefor the identification of functional elements. Motif explora-tion enables researchers to rapidly explore the space ofcomputationally identified signals and effectively posehypotheses for experimental test and validation.
ACKNOWLEDGEMENTS
This research was supported in part by an appointmentto the National Center for Biotechnology Information(NCBI) Scientific Visitors Program sponsored by theNational Library of Medicine and administered bythe Oak Ridge Institute for Science and Education (RI).This work was supported in part by the National ScienceFoundation under grant number 0544309 (SMM).Funding to pay the Open Access publication charge wasprovided by NCBI.
Conflict of interest statement. None declared.
REFERENCES
1. Guigo,R., Flicek,P., Abril,J.F., Reymond,A., Lagarde,J.,Denoeud,F., Antonarakis,S., Ashburner,M., Bajic,V.B. et al. (2006)EGASP: the human ENCODE Genome Annotation AssessmentProject. Genome Biol., 7, S21–S31.
2. Islamaj,R., Getoor,L. and Wilbur,W.J. (2006) A featuregeneration algorithm for sequences with application to splice-siteprediction. In Proceedings of European Conference on Principles andPractice of Knowledge Discovery in Databases, 553–560.
3. Pertea,M., Lin,X. and Salzberg,S. (2001) GeneSplicer: a newcomputational method for splice site prediction. Nucleic Acids Res.,29, 1185–1190.
4. Hebsgaard,S.M., Korning,P.G., Tolstrup,N., Engelbrecht,J.,Rouze,P. and Brunak,S. (1996) Splice site prediction in Arabidopsisthaliana DNA by combining local and global sequence information.Nucleic Acids Res., 24, 3439–3452.
5. Brunak,S., Engelbrecht,J. and Knudsen,S. (1991) Prediction ofhuman mRNA donor and acceptor sites from the DNA sequence.J. Mol. Biol., 220, 49–65.
6. Yeo,G. and Burge,C. (2004) Maximum entropy modelling of shortsequence motifs with application to RNA splicing signals. J.Comput. Biol., 11, 377–394.
7. Brendel,V. and Kleffe,J. (1998) Prediction of locally optimal splicesites in plant pre-mRNA with applications to gene identification inArabidopsis thaliana genomicDNA.Nucleic Acids Res., 26, 4748–4757.
8. Ladd,A. and Cooper,T. (2002) Finding signals that regulatealternative splicing in the post-genomic era. Genome Res., 3,reviews0008.1–0008.16.
9. Zhang,T. and Oles,F. (2001) Text categorization based onregularized linear classification methods. Inform. Retriev., 4, 5–31.
10. Fairbrother,W.G., Yeo,G.W., Yeh,R., Goldstein,P., Mawson,M.,Sharp,P.A. and Burge,C.B. (2004) RESCUE-ESE identifies candi-date exonic splicing enhancers in vertebrate exons. Nucleic AcidsRes., 32, W187–W190.
11. Cartegni,L., Wang,J., Zhu,Z., Zhang,M.Q. and Krainer,A.R. (2003)ESEfinder: a web resource to identify exonic splicing enhancers.Nucleic Acids Res., 31, 3568–3571.
12. Wang,Z., Rolish,M.E., Yeo,G., Tung,V., Mawson,M. andBurge,C.B. (2004) Systematic identification and analysis of exonicsplicing silencers. Cell, 119, 831–845.
13. Goren,A., Ram,O., Amit,M., Keren,H., Lev-Maor,G., Vig,I.,Pupko,T. and Ast,G. (2006) Comparative analysis identifies exonicsplicing regulatory sequences-the complex definition of enhancersand silencers. Mol. Cell, 23, 769–781.
14. Zhang,X.H.,Heller,K.A.,Hefter,I.,Leslie,C.S.andChasin,L.A. (2003)Sequence information for the splicing of human pre-mRNA identifiedby support vector machine classification. Genome Res., 13, 2637–2650.
15. Crooks,G.E., Hon,G., Chandonia,J.M. and Brenner,S.E. (2004)WebLogo: a sequence logo generator. Genome Res., 14, 1188–1190.
16. Cartegni,L, Hastings,ML, Calarco,JA, de Stanchina,E. andKrainer,AR. (2006) Determinants of exon 7 splicing in the muscularatrophy genes SMN1 and SMN2. Am. J. Hum. Genet., 78, 63–77.
Figure 7. Outputs for 5mer feature set of donor splice-site prediction in the selected interval [�60,�30], using the SMN1 exon 7 example. In (A) welist features which contain the motif ‘‘tag’’. Note that all these features have a negative weight. In (B), we list features which contain the motif ‘‘cag’’.Note that these features are mostly positive. The little arrows denote the location of donor splice-site consensus dinucleotide GT.
Nucleic Acids Research, 2007 7