split-interest trusts, filing year 005 trusts, filing year 2005 63 nongrantor charitable lead...
TRANSCRIPT
61
T he Split-Interest Trust Information Return (Form 5227) is filed by entities with both charitable and noncharitable beneficiaries. The
number of Forms 5227 filed increased by 0.9 percent from Filing Year 2004 to more than 124,000 in Filing Year 2005 [1]. In total, $8.4 billion in distributions were reported for split-interest trusts in 2005. The total end-of-year book value of assets in Filing Year 2005 was more than $106.5 billion.
A split-interest trust (SIT) can be created by a will or a trust instrument. The trust instrument speci-fies the term of the trust, designates the trustee(s) as well as the beneficiaries, and provides parameters for managing assets and distributing income to the beneficiaries. The instrument usually specifies the contents of the trust. The individual who owns, and then transfers, the assets that make up the trust cor-pus is known as the grantor.
A trustee is charged with holding, investing, and distributing the income and assets of the trust. A trustee may be an individual, a group of individuals, or an entity such as a bank or charity. Each trustee must ensure that all transactions, including distri-butions, conform to the requirements of the trust document and to any applicable laws. Additionally, trustees must coordinate the preparation, verification, and submission of all required State and Federal tax forms.
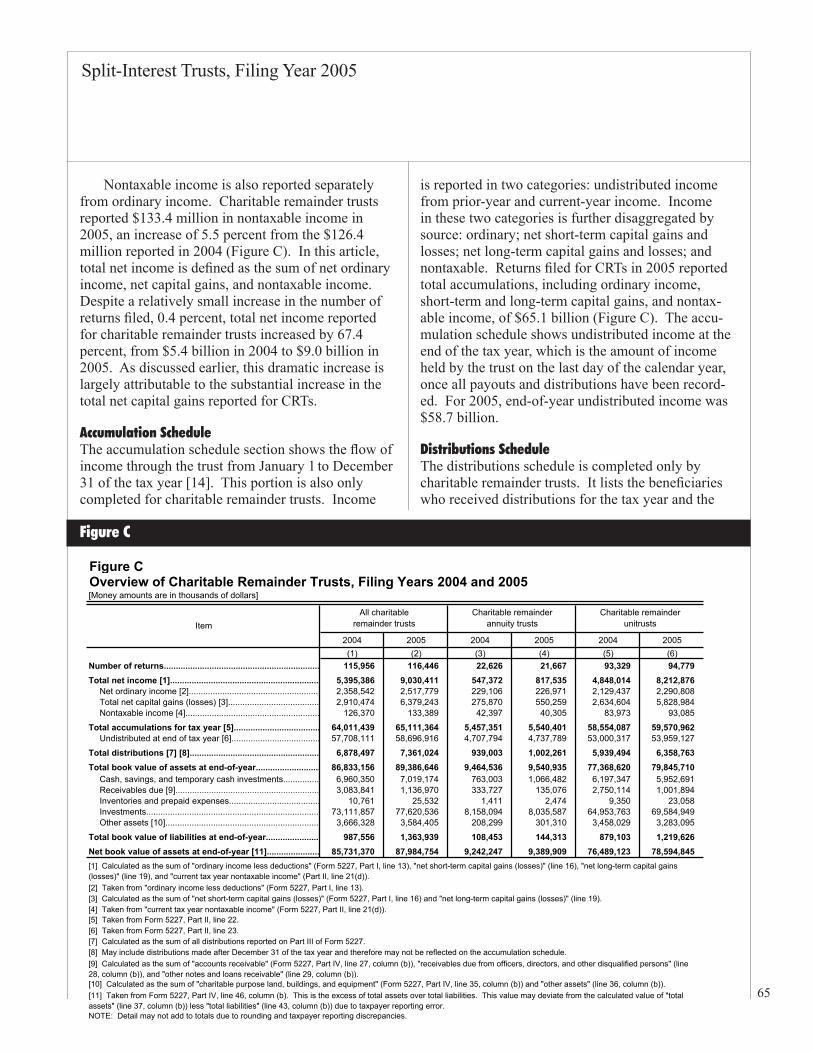
There are three distinct types of split-interest trusts: charitable remainder trusts, charitable lead trusts, and pooled income funds. In 2005, some 116,446 returns were filed for charitable remainder trusts (Figure A). Trustees for charitable lead trusts submitted 6,168 returns in 2005, while trustees for pooled income funds submitted 1,677 returns.
Charitable Remainder TrustsUnder a charitable remainder trust (CRT) agreement, an income stream is distributed annually to one or more noncharitable beneficiaries for a defined period of time. The period may be either a fixed duration, statutorily limited to 20 years, or the lifetime of a noncharitable beneficiary [2]. At the conclusion of the period, the trust is dissolved, and the remaining value is distributed to predetermined charitable ben-
eficiaries [3]. The charitable distribution must equal at least 10.0 percent of the initial fair market value of the assets placed in the trust [4].
The donor must file a U.S. Gift Tax Return (Form 709) for all assets contributed to the trust. Any gift exceeding $11,000 is taxable and is included in the donor’s lifetime exclusion. At the time of trust cre-ation, the donor receives an income tax deduction based on an estimate of the charitable distribution. The donor is also eligible for a gift tax deduction if the charitable beneficiary has been named. A beneficiary must report the distributions as gross income on his or her U.S. Individual Income Tax Return (Form 1040).
There are two types of charitable remainder trusts. Charitable remainder annuity trusts (CRATs) and charitable remainder unitrusts (CRUTs) differ in the calculation of the noncharitable distribution amount. Charitable remainder annuity trusts annu-ally distribute a fixed percentage, between 5.0 per-cent and 50.0 percent, of the initial fair market value of the property in the trust. As a result, the amount of the distribution to noncharitable beneficiaries from a CRAT should be the same each year. Charitable remainder unitrusts distribute a fixed percentage, between 5.0 percent and 50.0 percent, of the fair market value of the trust property, valued annually. Therefore, the value of the distribution to nonchari-table beneficiaries from a CRUT, called the unitrust amount, may vary from year to year, depending on the value of the assets in the trust.
There are two common variants of charitable remainder unitrusts that allow for added flexibility of noncharitable distributions. One variant, a net income charitable remainder unitrust (NI-CRUT), permits the trustee to distribute only the amount of trust income for that year, should that amount be less than the distribution that would otherwise be required [5]. This allows the trustee to limit distributions in years when the trust's income is low, so as to not de-plete the trust corpus. A related variant is called the net income with makeup charitable remainder uni-trust (NIM-CRUT) [6]. A NIM-CRUT works like a NI-CRUT, in that the trustee is allowed to distribute the lesser of the trust income or the required percent-age of fair market value. However, the reductions in required distributions accumulate. The trustee must make up for previous distribution deficiencies when trust income permits.
by Lisa Schreiber
Split-Interest Trusts, Filing Year �005
Lisa Schreiber is an economist with the Special Studies Special Projects Section. This article was prepared under the direction of Barry W. Johnson, Chief.
62
Split-Interest Trusts, Filing Year 2005
Charitable remainder unitrusts may accept prop-erty transfers throughout the life of the trust. These are called “additional contributions.” These contri-butions may be in the form of any asset, including cash and stock. All additional contributions must be detailed on an attachment to the Form 5227 filed for the year in which the contribution was received. The presence of additional contributions complicates the calculation of the unitrust amount. Preparers must prorate the value of the contributions based on the date they were donated to the trust [7]. The unitrust amount is then calculated by multiplying the sum of the balance sheet fair market value and the prorated value of the additional contributions by the unitrust percentage.
Charitable Lead TrustsUnder a charitable lead trust (CLT) agreement, a charitable organization receives the income inter-est in the trust assets, while the remainder interest is assigned to a noncharitable beneficiary or the donor. Annual distributions are made to a predetermined charitable beneficiary. The amount of CLT distribu-tions is not constrained by minimum or maximum payout restrictions. The distributions continue for the lifetime of an individual, who is usually the grantor or the grantor’s spouse [8].
Charitable lead trusts are classified as annuity trusts or unitrusts depending on the calculation of the distribution amount. Charitable lead annuity trusts (CLATs) distribute a fixed dollar amount or a fixed percentage of the initial fair market value of the trust property. Charitable lead unitrusts (CLUTs) distrib-ute a fixed percentage of the net fair market value of the trust property, determined annually. CLATs tend to be favored over CLUTs. CLATs do not require that the trust property be revalued annually, therefore reducing the trustee’s costs, and allow the nonchari-table remainder beneficiaries to benefit from the appreciation of trust assets.
CLTs are further classified by the role of the grantor or donor. If the donor of the trust assets is the noncharitable beneficiary, the trust is classi-fied as a grantor charitable lead trust. In this case, the grantor will receive an income tax deduction up to the amount of the present value of the chari-table distributions as well as a gift tax deduction [9]. Because a grantor CLT is not considered to be a separate taxable entity, the grantor must pay tax on income earned by the trust. Grantor CLTs are gener-ally used to convert future charitable contributions into a current tax deduction. A trust is classified as a nongrantor charitable lead trust if the donor of the trust property is not a beneficiary. In the case of
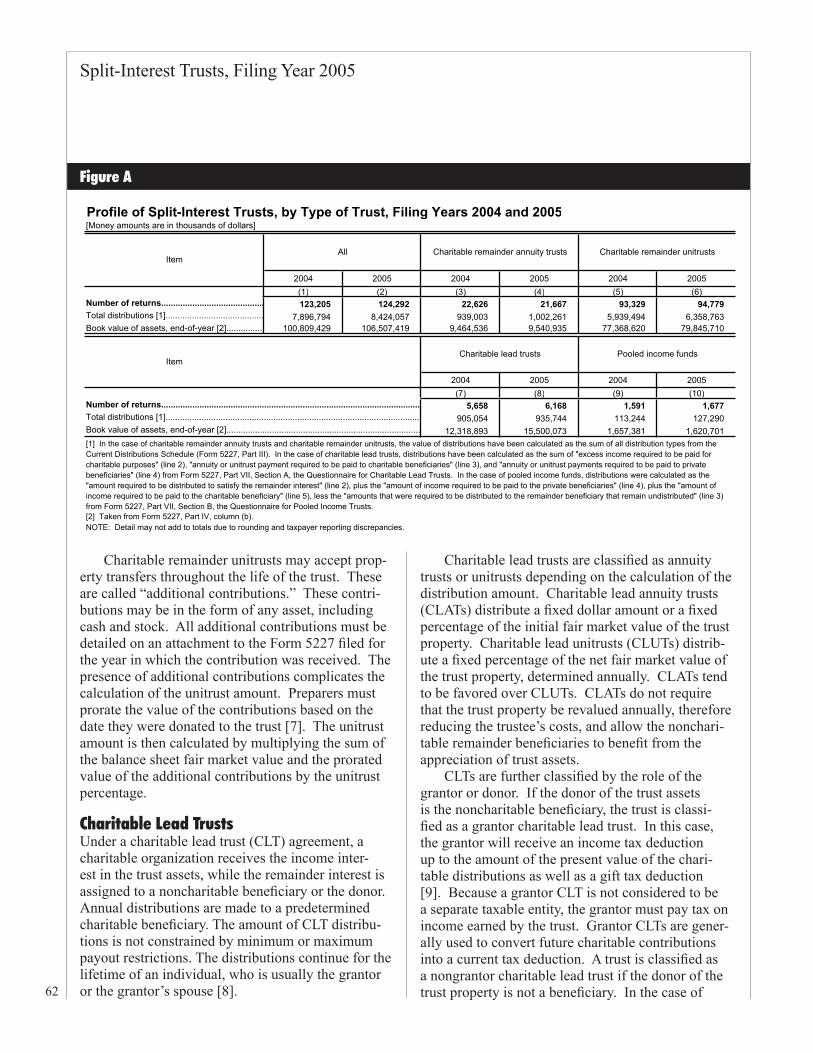
Profile of Split-Interest Trusts, by Type of Trust, Filing Years 2004 and 2005[Money amounts are in thousands of dollars]
2004 2005 2004 2005 2004 2005(1) (2) (3) (4) (5) (6)
Number of returns........................................... 123,205 124,292 22,626 21,667 93,329 94,779 Total distributions [1]......................................... 7,896,794 8,424,057 939,003 1,002,261 5,939,494 6,358,763 Book value of assets, end-of-year [2]............... 100,809,429 106,507,419 9,464,536 9,540,935 77,368,620 79,845,710
Charitable lead trusts Pooled income funds
2004 2005 2004 2005(7) (8) (9) (10)
Number of returns............................................................................................................ 5,658 6,168 1,591 1,677 Total distributions [1]........................................................................................................... 905,054 935,744 113,244 127,290 Book value of assets, end-of-year [2]................................................................................. 12,318,893 15,500,073 1,657,381 1,620,701 [1] In the case of charitable remainder annuity trusts and charitable remainder unitrusts, the value of distributions have been calculated as the sum of all distribution types from the Current Distributions Schedule (Form 5227, Part III). In the case of charitable lead trusts, distributions have been calculated as the sum of "excess income required to be paid for charitable purposes" (line 2), "annuity or unitrust payment required to be paid to charitable beneficiaries" (line 3), and "annuity or unitrust payments required to be paid to private beneficiaries" (line 4) from Form 5227, Part VII, Section A, the Questionnaire for Charitable Lead Trusts. In the case of pooled income funds, distributions were calculated as the "amount required to be distributed to satisfy the remainder interest" (line 2), plus the "amount of income required to be paid to the private beneficiaries" (line 4), plus the "amount of income required to be paid to the charitable beneficiary" (line 5), less the "amounts that were required to be distributed to the remainder beneficiary that remain undistributed" (line 3) from Form 5227, Part VII, Section B, the Questionnaire for Pooled Income Trusts.
NOTE: Detail may not add to totals due to rounding and taxpayer reporting discrepancies.[2] Taken from Form 5227, Part IV, column (b).
ItemAll Charitable remainder annuity trusts
Item
Charitable remainder unitrusts
Figure A
Split-Interest Trusts, Filing Year 2005
63
nongrantor charitable lead trusts, the grantor receives only a gift tax charitable deduction at the time of the trust creation equal to the present value of the chari-table distributions. The nongrantor CLT is consid-ered to be a fully taxable separate entity for income tax purposes. As a result, the grantor is not liable for tax owed on trust income. Nongrantor CLTs are generally used as a transfer tax reduction technique.
Pooled Income FundsUnder a pooled income fund (PIF) arrangement, do-nors to a charitable organization contribute assets to a pool of donated assets and in return receive income payments for the remainder of the grantors’ lifetimes [10]. The transfer of assets to the fund must be ir-revocable, meaning it cannot be altered or cancelled without consent of the beneficiary. Generally, donors make contributions to existing pooled income funds, thus incurring far lower administrative costs to the grantor than a charitable remainder trust. At the time of donation, the grantor receives income and gift tax deductions equal to the estimated value of the final charitable contribution. The donee charity, com-monly a large educational institution, is responsible for the maintenance of the fund, including investing assets and making distributions to beneficiaries. PIFs are prohibited from investing in tax-exempt securi-ties. Each year, grantors receive a distribution from the fund based on the ratio of their contributions to the value of the investment pool and the return on the fund assets for that year. These distributions are reported as gross income on the grantor’s Form 1040. At the time of the donor’s death, the charity receives the grantor’s prorated share of the value of the PIF.
Filing and Reporting RequirementsA Split-Interest Trust Information Return (Form 5227) must be submitted for each calendar year a split-interest trust is in existence [11]. Form 5227 must be filed with the IRS by April 15 of the year following the applicable calendar year. Form 5227 is used to disclose the financial activities of the trust, not to calculate tax liability. If a trust incurred any taxable income during the calendar year, a Form 1041, United States Income Tax Return for Estates and Trusts, must be completed.
Form 5227 is divided into several parts, many of which are only completed for one type of split-inter-est trust. The first section of the return outlines the
identification details of the SIT, and is the only por-tion of the return that is completed in its entirety for all trust types. The trust name, identification number, the type of trust, and the creation date of the trust are included in this section. Trustee information, such as name and address, is also included. Additionally, the end-of-year fair market values of the trust assets are reported. A checkbox allows preparers of charitable remainder trust returns to declare any unrelated busi-ness taxable income (UBIT), thus indicating their need to file a Form 1041.
This article primarily focuses on split-inter-est trust reporting for Filing Year 2005, reporting, primarily, information and activities that occurred in Calendar Year 2004. Throughout this article, trusts are described in terms of size as being small, medium, or large, based on the trust’s reported end-of-year total book value of assets. Small trusts are defined as those that reported total assets of $500,000 or less, including those trusts that either did not report end-of-year book value of total assets, or that reported the amount as zero [12]. Medium trusts are defined as those with between $500,000 and $3.0 million in total assets. Large trusts are defined as those which reported total assets of $3.0 million or more.
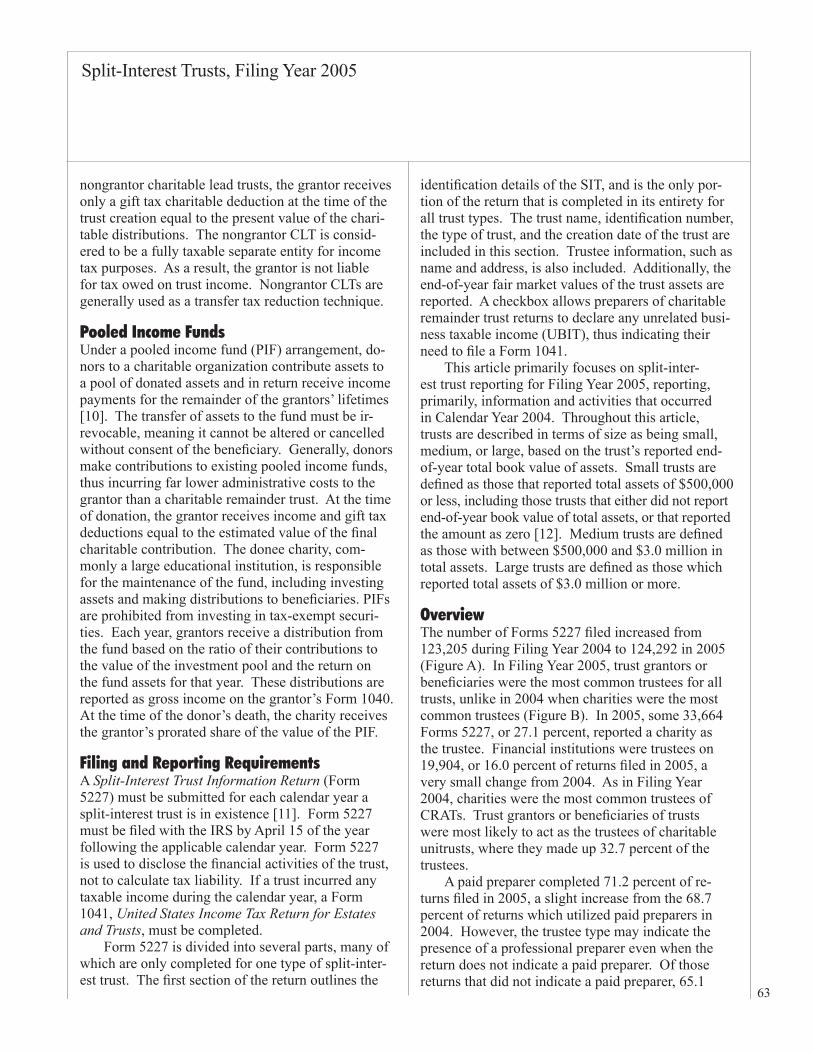
OverviewThe number of Forms 5227 filed increased from 123,205 during Filing Year 2004 to 124,292 in 2005 (Figure A). In Filing Year 2005, trust grantors or beneficiaries were the most common trustees for all trusts, unlike in 2004 when charities were the most common trustees (Figure B). In 2005, some 33,664 Forms 5227, or 27.1 percent, reported a charity as the trustee. Financial institutions were trustees on 19,904, or 16.0 percent of returns filed in 2005, a very small change from 2004. As in Filing Year 2004, charities were the most common trustees of CRATs. Trust grantors or beneficiaries of trusts were most likely to act as the trustees of charitable unitrusts, where they made up 32.7 percent of the trustees.
A paid preparer completed 71.2 percent of re-turns filed in 2005, a slight increase from the 68.7 percent of returns which utilized paid preparers in 2004. However, the trustee type may indicate the presence of a professional preparer even when the return does not indicate a paid preparer. Of those returns that did not indicate a paid preparer, 65.1
64
Split-Interest Trusts, Filing Year 2005
percent reported financial institutions or charities as the trustee. When entities such as these are acting as trustee, it is likely that the return was profession-ally prepared even if a paid preparer did not sign the return. CLTs were the type of trust most likely to be completed by a paid preparer; in 2005, a paid pre-parer did not complete only 19.8 percent of returns filed for CLTs.
Ordinary Income and DeductionsThe ordinary income and deductions portion of Form 5227 is completed only for charitable remainder trusts, for which 116,446 returns were filed in 2005 (Figure C). Reported income is divided into seven classifications which include interest income, ordi-nary dividends, and business income or loss. For 2005, a total ordinary income of $3.1 billion was reported for CRTs, of which $2.9 million, or 93.5 percent, was reported for CRUTs. Deductions al-locable to ordinary income are divided into three classifications: interest, taxes, and other and totaled $623.5 million in 2005 [13]. The total value of deductions is subtracted from the total value of or-dinary income, resulting in the ordinary income less
deductions, referred to in this article as “net ordinary income.” In 2005, this amount was $2.5 billion.
Capital gains and losses are not included in net ordinary income. The total short-term capital gain or loss amount, as well as the total long-term capital gain or loss amount, is taken from Form 1041 Schedule D, Capital Gains and Losses, for the corresponding tax year. Deductions reduce the short- and long-term amounts, resulting in a “net short-term capital gain” and a “net long-term capital gain.” Charitable remainder trust returns reported total net capital gains of $6.4 billion in 2005 (Figure C). This is an increase of 119.2 percent from $2.9 billion in 2004. A possible explanation for such a remarkable change could be the Jobs and Growth Tax Relief Reconciliation Act of 2003, which reduced the long-term capital gain tax from 20.0 percent to 15.0 percent, and therefore spurred the sales of capital assets. As the lower tax rate was effective on May 6, 2003, the 2004 tax year, reflected on returns filed in 2005, was the first full year the change was in effect. Net long-term capital gains made up approximately 94.0 percent, or $6.0 billion, of total net capital gains reported for CRTs in 2005.
Utilization of Paid Preparers and Distribution of Trustee Type, by Type of Trust, Filing Years 2004 and 2005
2004 2005 2004 2005 2004 2005 2004 2005 2004 2005(1) (2) (3) (4) (5) (6) (7) (8) (9) (10)
All returns.................................. 123,205 124,292 22,626 21,667 93,329 94,779 5,658 6,168 1,591 1,677 Grantor or beneficiary............. 32,115 34,309 2,236 2,466 28,949 31,029 850 ** 3,136 * 80 ** 739 Other individual....................... 5,721 6,254 655 749 3,941 4,228 1,124 ** 0 ** Financial institution................. 19,930 19,904 3,644 3,491 14,735 14,627 913 ** 638 ** Charity..................................... 33,262 33,664 9,802 9,410 22,905 23,528 * 94 187 461 539 Other entity [1]........................ 32,178 30,161 6,289 5,552 22,800 21,365 2,677 2,845 412 399
Paid preparer [2]....................... 84,581 88,442 12,359 12,883 66,762 69,794 4,690 4,950 771 815 Grantor or beneficiary............. 30,409 32,253 2,162 2,362 27,395 29,128 772 ** 2,553 * 80 ** 340 Other individual....................... 5,242 5,797 534 683 3,605 3,849 1,104 ** 0 ** Financial institution................. 8,757 9,181 1,403 1,392 6,606 6,924 497 ** 251 ** Charity..................................... 19,531 21,047 4,410 5,003 14,701 15,526 * 70 125 350 393 Other entity [1]........................ 20,642 20,163 3,850 3,443 14,455 14,368 2,246 2,271 91 * 81
Unpaid preparer........................ 38,624 35,850 10,268 8,785 26,568 24,984 968 1,219 820 862 Grantor or beneficiary............. 1,706 2,056 74 105 1,554 1,902 * 78 ** 582 0 ** 399 Other individual....................... 478 457 * 122 66 336 380 20 ** 0 ** Financial institution................. 11,173 10,723 2,241 2,098 8,129 7,703 415 ** 387 ** Charity..................................... 13,730 12,617 5,392 4,406 8,203 8,003 * 24 * 62 111 145 Other entity [1]........................ 11,537 9,998 2,439 2,109 8,345 6,997 431 574 322 318* Estimate should be used with caution because of the small number of sample returns on which it is based.** Data are combined to prevent disclosure of individual taxpayer data. However, the data are included in the appropriate totals.[1] Other entities include trusts and noncharitable organizations.[2] The presence of a paid preparer is indicated on Form 5227 by the completion of the paid preparer section found on page 4 of the return.NOTE: Figure B for Filing Year 2004, as it appeared in the Spring 2006 SOI Bulletin, was revised in the Fall 2006 SOI Bulletin. The corrected 2004 Filing Year values are included here.
Charitable lead trusts Pooled income fundsType of trustee/preparer status
All Charitable remainder annuity trusts
Charitable remainder unitrusts
Figure B
Split-Interest Trusts, Filing Year 2005
65
Nontaxable income is also reported separately from ordinary income. Charitable remainder trusts reported $133.4 million in nontaxable income in 2005, an increase of 5.5 percent from the $126.4 million reported in 2004 (Figure C). In this article, total net income is defined as the sum of net ordinary income, net capital gains, and nontaxable income. Despite a relatively small increase in the number of returns filed, 0.4 percent, total net income reported for charitable remainder trusts increased by 67.4 percent, from $5.4 billion in 2004 to $9.0 billion in 2005. As discussed earlier, this dramatic increase is largely attributable to the substantial increase in the total net capital gains reported for CRTs.
Accumulation Schedule The accumulation schedule section shows the flow of income through the trust from January 1 to December 31 of the tax year [14]. This portion is also only completed for charitable remainder trusts. Income
is reported in two categories: undistributed income from prior-year and current-year income. Income in these two categories is further disaggregated by source: ordinary; net short-term capital gains and losses; net long-term capital gains and losses; and nontaxable. Returns filed for CRTs in 2005 reported total accumulations, including ordinary income, short-term and long-term capital gains, and nontax- able income, of $65.1 billion (Figure C). The accu-mulation schedule shows undistributed income at the end of the tax year, which is the amount of income held by the trust on the last day of the calendar year, once all payouts and distributions have been record-ed. For 2005, end-of-year undistributed income was $58.7 billion.
Distributions ScheduleThe distributions schedule is completed only by charitable remainder trusts. It lists the beneficiaries who received distributions for the tax year and the
Figure COverview of Charitable Remainder Trusts, Filing Years 2004 and 2005[Money amounts are in thousands of dollars]
2004 2005 2004 2005 2004 2005(1) (2) (3) (4) (5) (6)
Number of returns................................................................. 115,956 116,446 22,626 21,667 93,329 94,779 Total net income [1].............................................................. 5,395,386 9,030,411 547,372 817,535 4,848,014 8,212,876
Net ordinary income [2]....................................................... 2,358,542 2,517,779 229,106 226,971 2,129,437 2,290,808 Total net capital gains (losses) [3]...................................... 2,910,474 6,379,243 275,870 550,259 2,634,604 5,828,984 Nontaxable income [4]........................................................ 126,370 133,389 42,397 40,305 83,973 93,085
Total accumulations for tax year [5].................................... 64,011,439 65,111,364 5,457,351 5,540,401 58,554,087 59,570,962 Undistributed at end of tax year [6]..................................... 57,708,111 58,696,916 4,707,794 4,737,789 53,000,317 53,959,127
Total distributions [7] [8]...................................................... 6,878,497 7,361,024 939,003 1,002,261 5,939,494 6,358,763 Total book value of assets at end-of-year........................... 86,833,156 89,386,646 9,464,536 9,540,935 77,368,620 79,845,710
Cash, savings, and temporary cash investments............... 6,960,350 7,019,174 763,003 1,066,482 6,197,347 5,952,691Receivables due [9]............................................................ 3,083,841 1,136,970 333,727 135,076 2,750,114 1,001,894 Inventories and prepaid expenses...................................... 10,761 25,532 1,411 2,474 9,350 23,058 Investments........................................................................ 73,111,857 77,620,536 8,158,094 8,035,587 64,953,763 69,584,949 Other assets [10]................................................................ 3,666,328 3,584,405 208,299 301,310 3,458,029 3,283,095
Total book value of liabilities at end-of-year...................... 987,556 1,363,939 108,453 144,313 879,103 1,219,626Net book value of assets at end-of-year [11]...................... 85,731,370 87,984,754 9,242,247 9,389,909 76,489,123 78,594,845
[2] Taken from "ordinary income less deductions" (Form 5227, Part I, line 13).[3] Calculated as the sum of "net short-term capital gains (losses)" (Form 5227, Part I, line 16) and "net long-term capital gains (losses)" (line 19).[4] Taken from "current tax year nontaxable income" (Form 5227, Part II, line 21(d)).[5] Taken from Form 5227, Part II, line 22.[6] Taken from Form 5227, Part II, line 23.[7] Calculated as the sum of all distributions reported on Part III of Form 5227.[8] May include distributions made after December 31 of the tax year and therefore may not be reflected on the accumulation schedule.
[10] Calculated as the sum of "charitable purpose land, buildings, and equipment" (Form 5227, Part IV, line 35, column (b)) and "other assets" (line 36, column (b)).
NOTE: Detail may not add to totals due to rounding and taxpayer reporting discrepancies.
[11] Taken from Form 5227, Part IV, line 46, column (b). This is the excess of total assets over total liabilities. This value may deviate from the calculated value of "total assets" (line 37, column (b)) less "total liabilities" (line 43, column (b)) due to taxpayer reporting error.
[1] Calculated as the sum of "ordinary income less deductions" (Form 5227, Part I, line 13), "net short-term capital gains (losses)" (line 16), "net long-term capital gains (losses)" (line 19), and "current tax year nontaxable income" (Part II, line 21(d)).
[9] Calculated as the sum of "accounts receivable" (Form 5227, Part IV, line 27, column (b)), "receivables due from officers, directors, and other disqualified persons" (line 28, column (b)), and "other notes and loans receivable" (line 29, column (b)).
ItemAll charitable
remainder trustsCharitable remainder
annuity trustsCharitable remainder
unitrusts
Figure C
66
Split-Interest Trusts, Filing Year 2005
Charitable Remainder Annuity Trusts: Income and Deductions, by Size of End-of-Year Book Value of Total Assets, Filing Year 2005[Money amounts are in thousands of dollars]
Under $500,000 [1] $500,000 under $3,000,000 $3,000,000 or more
(1) (2) (3) (4)Number of returns................................................................... 21,667 17,735 3,528 405 Total net income [2]................................................................ 817,535 141,884 276,091 399,560 Net ordinary income [3]......................................................... 226,971 58,969 82,243 85,759 Total ordinary income........................................................ 282,731 75,810 105,871 101,050 Deductions allocable to ordinary income.......................... 55,760 16,841 23,629 15,291 Net short-term capital gains or (losses) [4]........................... 43,166 6,647 10,033 26,486 Net long-term capital gains or (losses) [5]............................. 507,093 68,575 163,858 274,660 Nontaxable income [6].......................................................... 40,305 7,693 19,957 12,655
NOTE: Detail may not add to totals due to rounding and taxpayer reporting discrepancies.
Item TotalSize of end-of-year book value of total assets
[5] Taken from Form 5227, Part I, line 19. [6] Taken from Form 5227, Part II, line 21, column (d).
[1] Includes returns that did not report end-of-year book value of total assets (Form 5227, Part IV, line 37, column (b)) from the balance sheet, or that reported the amount as zero. Often, these zero amounts are explained by trusts filing a final return. [2] Calculated as the sum of "ordinary income less deductions" (Form 5227, Part I, line 13), "net short-term capital gains (losses)" (line 16), "net long-term capital gains (losses)" (line 19), and "current tax year nontaxable income" (Part II, line 21, column (d)).[3] Taken from "ordinary income less deductions" (Form 5227, Part I, line 13). This amount may not equal "total ordinary income" (line 8) less "total deductions allocable to ordinary income" (line 12) due to taxpayer reporting discrepancies.[4] Taken from Form 5227, Part I, line 16.
amounts they received [15]. Distributions to both charitable and noncharitable beneficiaries are listed on this schedule. The distributions are divided into five categories: ordinary income, short-term capital gains, long-term capital gains, nontaxable income, and corpus. Trusts are required to distribute ordi-nary income first, followed by short-term and then long-term capital gains, nontaxable income, and finally distributions from corpus [16]. Each distribu-tion to a beneficiary is reported on a Schedule K-1, Beneficiary’s Share of Income, Deductions, Credits, Etc. CRTs reported $7.4 billion in distributions in Filing Year 2005. PIFs and CLTs report distributions on Part VII of Form 5227. The value of distribu-tions made by all SITs increased from $7.9 billion in Filing Year 2004, to $8.4 billion in 2005 (Figure A).
Balance SheetThe balance sheet portion of Split-Interest Trust Information Return is a detailed listing of the assets and liabilities of the trust. There are three separate valuations for each asset and liability category: beginning-of-year book value; end-of-year book value; and fair market value. The beginning- and end-of-year book values are reported for all types of trusts. The fair market valuation is only required for charitable remainder unitrusts. Tax law requires the
fair market value to be assessed on the same date and using the same method each year that a Form 5227 is filed for a CRUT. Assets are apportioned into several categories, including cash, receivables, and invest-ments. Investments are further separated into five categories: U.S. and State government obligations; corporate stock; corporate bonds; land, buildings, and equipment; and other. Liabilities are also sepa-rated into four categories, including accounts payable and deferred revenue. As shown in Figure C, returns filed for charitable remainder trusts reported end-of-year book value of assets of $89.4 billion. For all SITs, the end-of-year book value of trust assets increased by 5.7 percent, from $100.8 billion in 2004 to $106.5 billion in Filing Year 2005.
Analysis by Type of Trust
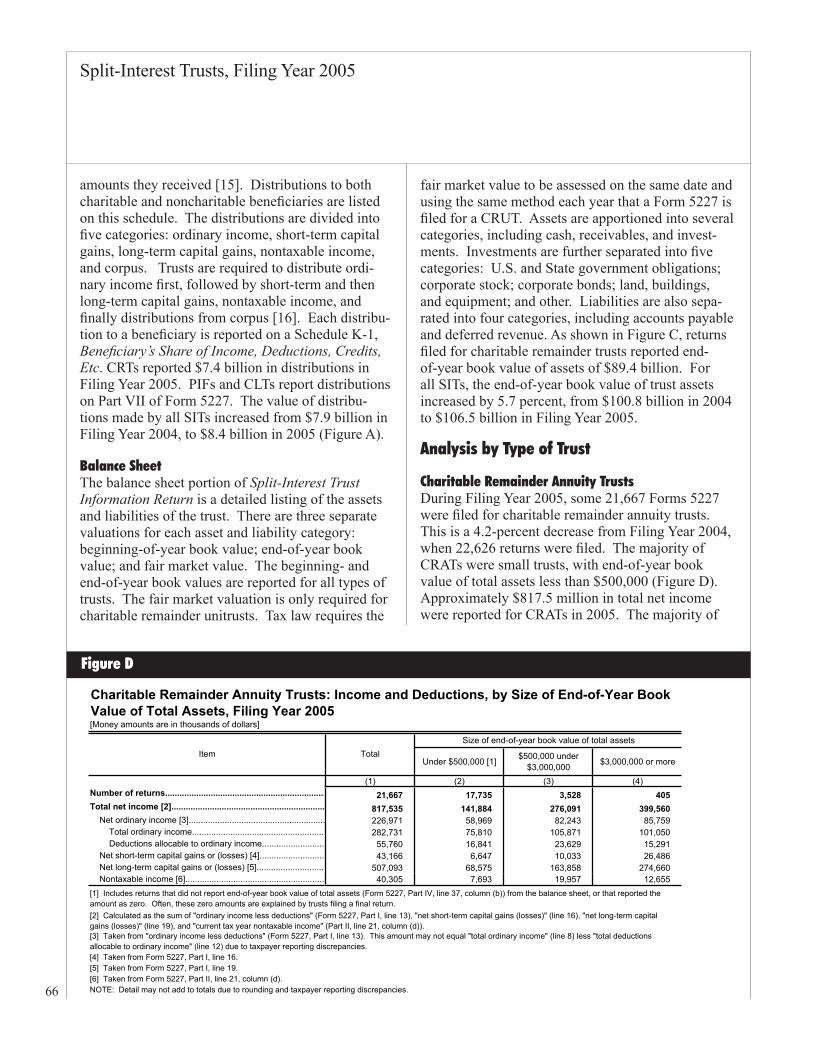
Charitable Remainder Annuity TrustsDuring Filing Year 2005, some 21,667 Forms 5227 were filed for charitable remainder annuity trusts. This is a 4.2-percent decrease from Filing Year 2004, when 22,626 returns were filed. The majority of CRATs were small trusts, with end-of-year book value of total assets less than $500,000 (Figure D). Approximately $817.5 million in total net income were reported for CRATs in 2005. The majority of
Figure D
Split-Interest Trusts, Filing Year 2005
67
Charitable Remainder Annuity Trusts: Distributions, by Size of End-of-Year Book Value of Total Assets, Filing Year 2005[Money amounts are in thousands of dollars]
Under $500,000 [1] $500,000 under $3,000,000 $3,000,000 or more
(1) (2) (3) (4)Number of returns.......................................................... 21,667 17,735 3,528 405 Total distributions [2].................................................... 1,002,261 412,848 319,853 269,560
Ordinary income [3]..................................................... 227,475 66,312 82,781 78,382 Short-term capital gains [4]......................................... 28,789 9,984 9,566 9,239 Long-term capital gains [5].......................................... 433,026 143,224 152,101 137,701 Nontaxable income [6]................................................. 33,414 9,360 14,844 9,210 Corpus [7].................................................................... 279,556 183,969 60,560 35,027
[2] May include distributions made after December 31 of the tax year and therefore may not be reflected on the accumulation schedule.[3] Reported on Form 5227, Part III, column (a).[4] Reported on Form 5227, Part III, column (b).[5] Reported on Form 5227, Part III, column (c).[6] Reported on Form 5227, Part III, column (d).[7] Reported on Form 5227, Part III, column (e).NOTE: Detail may not add to totals due to rounding.
Item TotalSize of end-of-year book value of total assets
[1] Includes returns that did not report end-of-year book value of total assets (Form 5227, Part IV, line 37, column (b)) from the balance sheet, or that reported the amount as zero. Often, these zero amounts are explained by trusts filing a final return.
Charitable Remainder Annuity Trusts: Accumulation Information, by Type of Income, Filing Year 2005[Money amounts are in thousands of dollars]
Net short-term Net long-term(1) (2) (3) (4) (5)
Total accumulations [1].................................................. 5,540,401 455,465 54,094 4,843,295 187,547 Prior-year accumulations [2]......................................... 4,722,866 228,494 -805 4,347,935 147,242 Current-year accumulations [3].................................... 817,535 226,971 43,166 507,093 40,305
Undistributed at end of tax year [4]............................... 4,737,789 221,577 24,634 4,341,672 149,905 [1] Taken from Form 5227, Part II, line 22.[2] Taken from Form 5227, Part II, line 20.[3] Taken from Form 5227, Part II, line 21.[4] Taken from Form 5227, Part II, line 23.NOTE: Detail may not add to totals due to rounding and taxpayer reporting discrepancies.
Item Total
Type of income
Net ordinary incomeCapital gains (losses)
Nontaxable income
net income can be attributed to net long-term capital gains, reported to be $507.1 million. Nontaxable income accounted for the smallest portion of total net income.
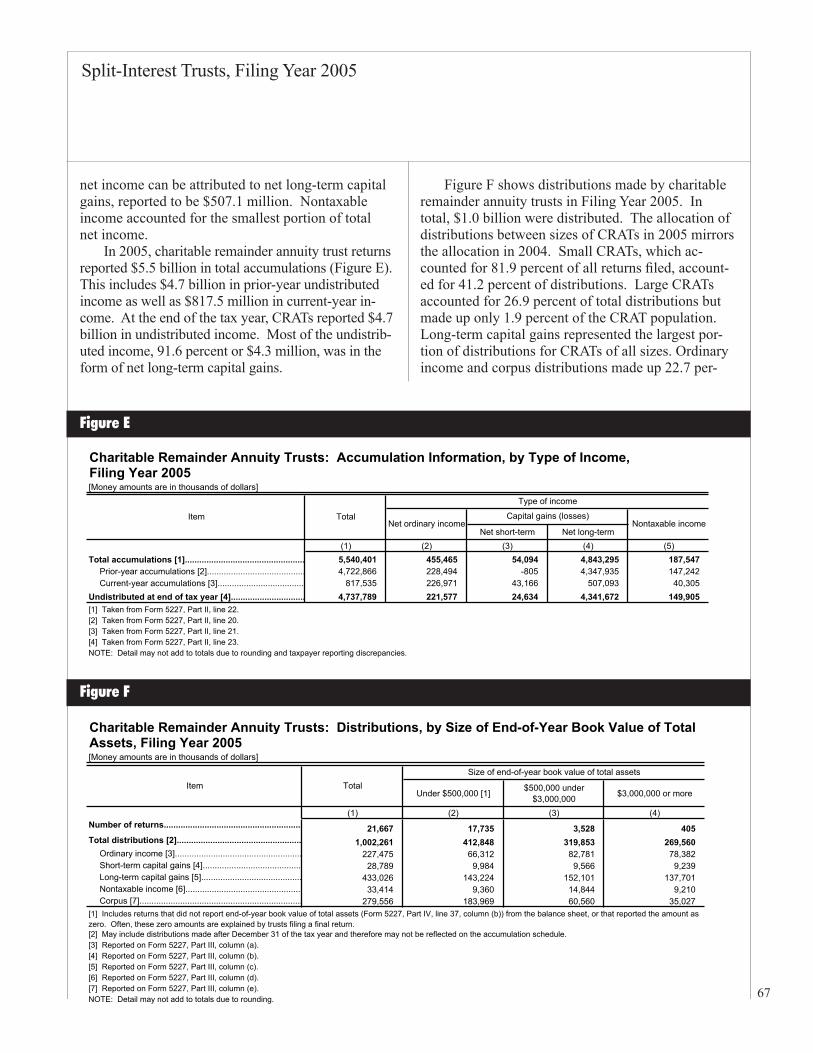
In 2005, charitable remainder annuity trust returns reported $5.5 billion in total accumulations (Figure E). This includes $4.7 billion in prior-year undistributed income as well as $817.5 million in current-year in-come. At the end of the tax year, CRATs reported $4.7 billion in undistributed income. Most of the undistrib-uted income, 91.6 percent or $4.3 million, was in the form of net long-term capital gains.
Figure F shows distributions made by charitable remainder annuity trusts in Filing Year 2005. In total, $1.0 billion were distributed. The allocation of distributions between sizes of CRATs in 2005 mirrors the allocation in 2004. Small CRATs, which ac-counted for 81.9 percent of all returns filed, account-ed for 41.2 percent of distributions. Large CRATs accounted for 26.9 percent of total distributions but made up only 1.9 percent of the CRAT population. Long-term capital gains represented the largest por-tion of distributions for CRATs of all sizes. Ordinary income and corpus distributions made up 22.7 per-
Figure E
Figure F
68
Split-Interest Trusts, Filing Year 2005
[Money amounts are in thousands of dollars]
2004 2005 Percent change 2004 2005 Percent change(1) (2) (3) (4) (5) (6)
Total distributions [2].................................... 939,003 1,002,261 6.7 726,226 707,579 -2.6Ordinary income [3]..................................... 240,675 227,475 -5.5 197,221 186,642 -5.4Short-term capital gains [4].......................... 26,686 28,789 7.9 22,884 20,768 -9.2Long-term capital gains [5].......................... 453,059 433,026 -4.4 353,589 346,398 -2.0Nontaxable income [6]................................. 33,996 33,414 -1.7 29,765 26,181 -12.0Corpus [7].................................................... 184,587 279,556 51.4 122,766 127,590 3.9
[2] May include distributions made after December 31 of the tax year and therefore may not be reflected on the accumulation schedule.[3] Reported on Form 5227, Part III, column (a).[4] Reported on Form 5227, Part III, column (b).[5] Reported on Form 5227, Part III, column (c).[6] Reported on Form 5227, Part III, column (d).[7] Reported on Form 5227, Part III, column (e).NOTE: Detail may not add to totals due to rounding.
[1] This category includes only returns included in both the 2004 and 2005 filing year samples and only those returns that did not make initial or final distributions in either period.
Charitable Remainder Annuity Trusts: Distributions, Filing Years 2004 and 2005
ItemAll returns Trusts for which returns filed in both 2004 and 2005 [1]
of Total Assets, Filing Year 2005[Money amounts are in thousands of dollars]
Amount Percent of total Amount Percent of
total Amount Percent of total Amount Percent of
total(1) (2) (3) (4) (5) (6) (7) (8)
Total investments.................................................. 8,035,587 100.0 1,752,416 100.0 3,238,468 100.0 3,044,703 100.0 U.S. and State government obligations [2].......... 1,418,350 17.7 193,636 11.0 654,223 20.2 570,490 18.7 Corporate stock [3].............................................. 4,050,244 50.4 940,428 53.7 1,593,142 49.2 1,516,674 49.8 Corporate bonds [4]............................................ 1,233,241 15.3 291,307 16.6 475,601 14.7 466,333 15.3 Land, buildings, and equipment [5]..................... 105,727 1.3 23,483 1.3 35,540 1.1 46,703 1.5 Other investments [6].......................................... 1,228,026 15.3 303,562 17.3 479,961 14.8 444,502 14.6
[2] Taken from Form 5227, Part IV, line 32a, column (b).[3] Taken from Form 5227, Part IV, line 32b, column (b).[4] Taken from Form 5227, Part IV, line 32c, column (b).[5] Taken from Form 5227, Part IV, line 33, column (b).[6] Taken from Form 5227, Part IV, line 34, column (b).NOTE: Detail may not add to totals due to rounding and taxpayer reporting discrepancies.
[1] Includes returns that did not report end-of-year book value of total assets (Form 5227, Part IV, line 37, column (b)) from the balance sheet, or that reported the amount as zero.Often, these zero amounts are explained by trusts filing a final return.
Charitable Remainder Annuity Trusts: Investment Allocations, by Size of End-of-Year Book Value
ItemTotal
Size of end-of-year book value of total assetsUnder $500,000 [1] $500,000 under $3,000,000 $3,000,000 or more
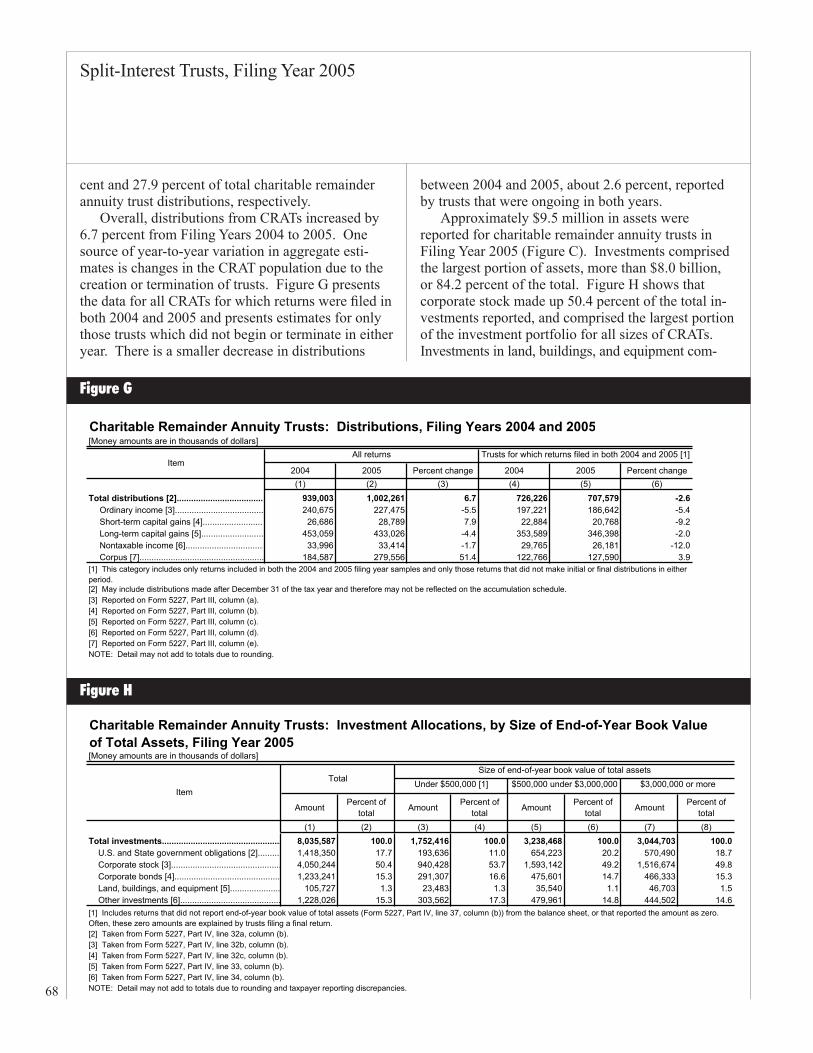
cent and 27.9 percent of total charitable remainder annuity trust distributions, respectively. Overall, distributions from CRATs increased by 6.7 percent from Filing Years 2004 to 2005. One source of year-to-year variation in aggregate esti-mates is changes in the CRAT population due to the creation or termination of trusts. Figure G presents the data for all CRATs for which returns were filed in both 2004 and 2005 and presents estimates for only those trusts which did not begin or terminate in either year. There is a smaller decrease in distributions
between 2004 and 2005, about 2.6 percent, reported by trusts that were ongoing in both years. Approximately $9.5 million in assets were reported for charitable remainder annuity trusts in Filing Year 2005 (Figure C). Investments comprised the largest portion of assets, more than $8.0 billion, or 84.2 percent of the total. Figure H shows that corporate stock made up 50.4 percent of the total in-vestments reported, and comprised the largest portion of the investment portfolio for all sizes of CRATs. Investments in land, buildings, and equipment com-
Figure G
Figure H
Split-Interest Trusts, Filing Year 2005
69
Charitable Remainder Unitrusts: Income and Deductions, by Size of End-of-Year Book Value of Total Assets, Filing Year 2005[Money amounts are in thousands of dollars]
Under $500,000 [1] $500,000 under $3,000,000 $3,000,000 or more
(1) (2) (3) (4)Number of returns.......................................................................... 94,779 66,517 24,852 3,410 Total net income [2]........................................................................ 8,212,876 1,152,788 2,210,260 4,849,829
Net ordinary income [3]................................................................ 2,290,808 289,091 641,610 1,360,106 Total ordinary income.............................................................. 2,858,595 394,164 813,427 1,651,005 Deductions allocable to ordinary income................................. 567,785 105,071 171,816 290,899
Net short-term capital gains or (losses) [4].................................. 340,783 65,393 86,661 188,729 Net long-term capital gains or (losses) [5]................................... 5,488,201 786,896 1,442,270 3,259,035 Nontaxable income [6]................................................................. 93,085 11,408 39,718 41,958
NOTE: Detail may not add to totals due to rounding and taxpayer reporting discrepancies.
Item TotalSize of end-of-year book value of total assets
[1] Includes returns that did not report end-of-year book value of total assets (Form 5227, Part IV, line 37, column (b)) from the balance sheet, or that reported the amount as zero. Often, these zero amounts are explained by trusts filing a final return.
[6] Taken from Form 5227, Part II, line 21, column (d).
[2] Calculated as the sum of "ordinary income less deductions" (Form 5227, Part I, line 13), "net short-term capital gains (losses)" (line 16), "net long-term capital gains (losses)" (line 19), and "current tax year nontaxable income" (Part II, line 21, column (d)).[3] Taken from "ordinary income less deductions" (Form 5227, Part I, line 13). This amount may not equal "total ordinary income" (line 8) less "total deductions allocable to ordinary income" (line 12) due to taxpayer reporting discrepancies.[4] Taken from Form 5227, Part I, line 16.[5] Taken from Form 5227, Part I, line 19.
Charitable Remainder Unitrusts: Accumulation Information, by Type of Income,Filing Year 2005[Money amounts are in thousands of dollars]
Net short-term Net long-term(1) (2) (3) (4) (5)
Total accumulations [1].................................................. 59,570,962 4,703,324 2,278,030 52,175,668 413,940
Prior-year accumulations [2]......................................... 51,358,084 2,412,516 1,749,385 46,875,328 320,855
Current-year accumulations [3].................................... 8,212,876 2,290,808 340,783 5,488,201 93,085
Undistributed at end of tax year [4]............................... 53,959,127 2,995,670 1,895,022 48,701,134 367,301[1] Taken from Form 5227, Part II, line 22.[2] Taken from Form 5227, Part II, line 20.[3] Taken from Form 5227, Part II, line 21.[4] Taken from Form 5227, Part II, line 23.NOTE: Detail may not add to totals due to rounding and taxpayer reporting discrepancies.
Item TotalType of income
Net ordinary incomeCapital gains (losses)
Nontaxable income
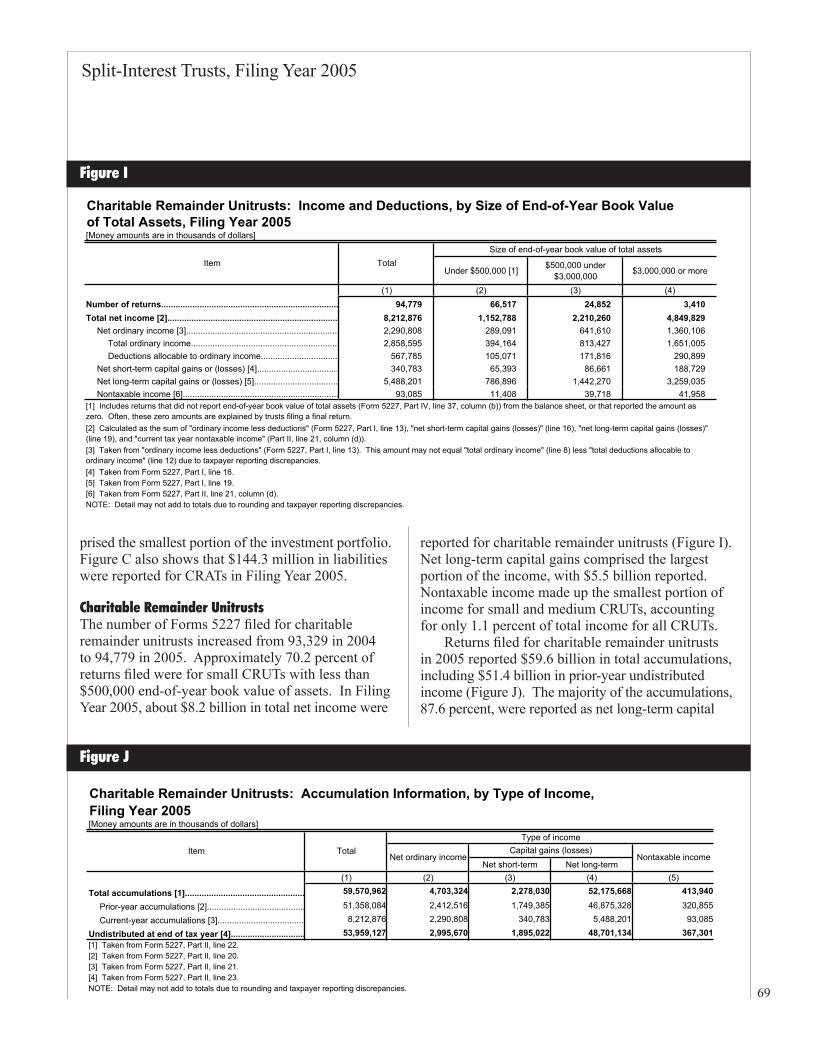
prised the smallest portion of the investment portfolio. Figure C also shows that $144.3 million in liabilities were reported for CRATs in Filing Year 2005.
Charitable Remainder UnitrustsThe number of Forms 5227 filed for charitable remainder unitrusts increased from 93,329 in 2004 to 94,779 in 2005. Approximately 70.2 percent of returns filed were for small CRUTs with less than $500,000 end-of-year book value of assets. In Filing Year 2005, about $8.2 billion in total net income were
reported for charitable remainder unitrusts (Figure I). Net long-term capital gains comprised the largest portion of the income, with $5.5 billion reported. Nontaxable income made up the smallest portion of income for small and medium CRUTs, accounting for only 1.1 percent of total income for all CRUTs.
Returns filed for charitable remainder unitrusts in 2005 reported $59.6 billion in total accumulations, including $51.4 billion in prior-year undistributed income (Figure J). The majority of the accumulations, 87.6 percent, were reported as net long-term capital
Figure I
Figure J
70
Split-Interest Trusts, Filing Year 2005
Charitable Remainder Unitrusts: Distributions, by Size of End-of-Year Book Value of Total Assets, Filing Year 2005[Money amounts are in thousands of dollars]
Under $500,000 [1] $500,000 under $3,000,000 $3,000,000 or more
(1) (2) (3) (4)
Number of returns................................................................... 94,779 66,517 24,852 3,410 Total distributions [2]............................................................. 6,358,763 2,120,391 1,912,677 2,325,695
Ordinary income [3].............................................................. 1,706,843 292,281 623,538 791,024 Short-term capital gains [4]................................................... 342,579 36,189 113,157 193,234 Long-term capital gains [5]................................................... 3,706,584 1,463,053 983,240 1,260,291 Nontaxable income [6].......................................................... 44,359 10,463 20,217 13,678 Corpus [7]............................................................................. 558,398 318,405 172,525 67,469
[2] May include distributions made after December 31 of the tax year and therefore may not be reflected on the accumulation schedule.[3] Reported on Form 5227, Part III, column (a).[4] Reported on Form 5227, Part III, column (b).[5] Reported on Form 5227, Part III, column (c).[6] Reported on Form 5227, Part III, column (d).[7] Reported on Form 5227, Part III, column (e).NOTE: Detail may not add to totals due to rounding.
Item TotalSize of end-of-year book value of total assets
[1] Includes returns that did not report end-of-year book value of total assets (Form 5227, Part IV, line 37, column (b)) from the balance sheet, or that reported the amount as zero. Often, these zero amounts are explained by trusts filing a final return.
gains. Nontaxable income made up the smallest per-centage of accumulations. CRUTs reported $54.0 bil-lion in undistributed income at the end of the tax year.
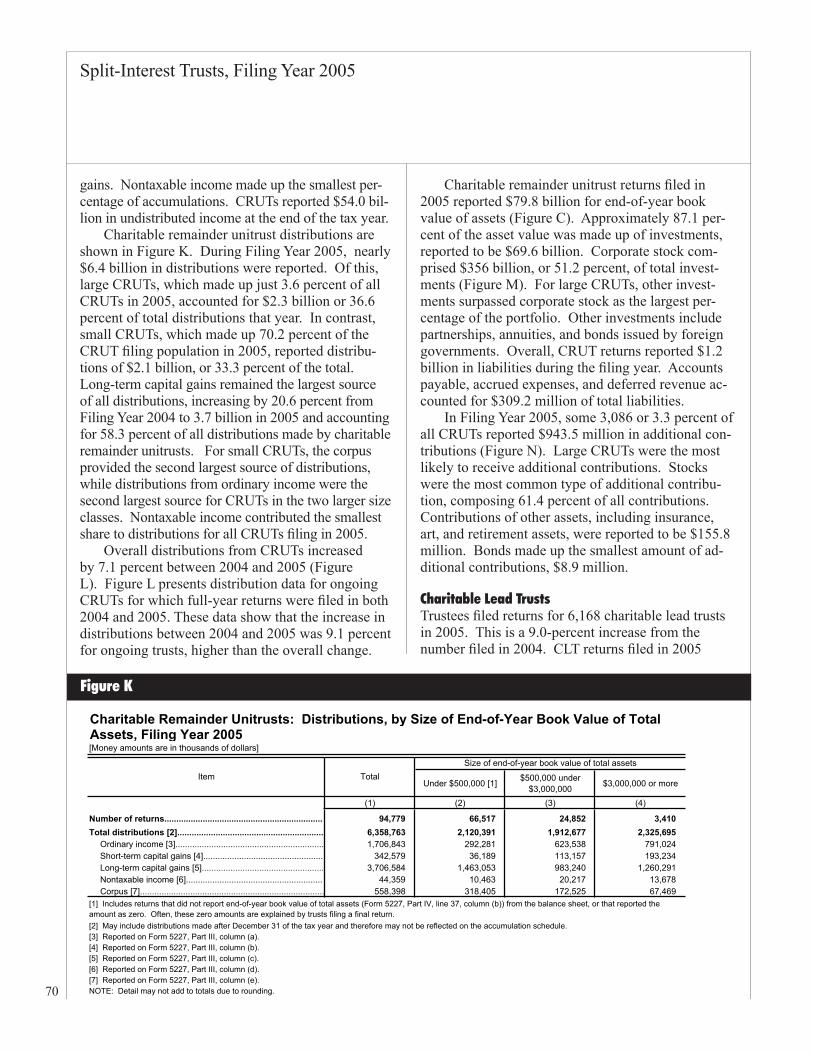
Charitable remainder unitrust distributions are shown in Figure K. During Filing Year 2005, nearly $6.4 billion in distributions were reported. Of this, large CRUTs, which made up just 3.6 percent of all CRUTs in 2005, accounted for $2.3 billion or 36.6 percent of total distributions that year. In contrast, small CRUTs, which made up 70.2 percent of the CRUT filing population in 2005, reported distribu-tions of $2.1 billion, or 33.3 percent of the total. Long-term capital gains remained the largest source of all distributions, increasing by 20.6 percent from Filing Year 2004 to 3.7 billion in 2005 and accounting for 58.3 percent of all distributions made by charitable remainder unitrusts. For small CRUTs, the corpus provided the second largest source of distributions, while distributions from ordinary income were the second largest source for CRUTs in the two larger size classes. Nontaxable income contributed the smallest share to distributions for all CRUTs filing in 2005.
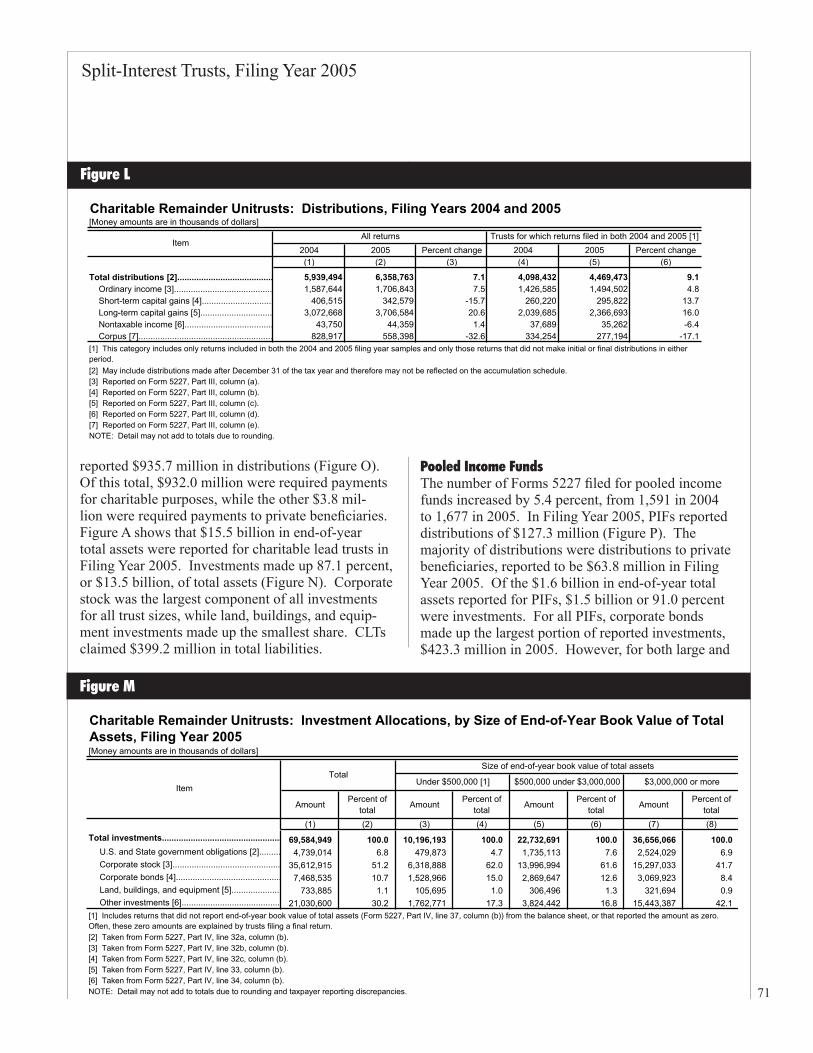
Overall distributions from CRUTs increased by 7.1 percent between 2004 and 2005 (Figure L). Figure L presents distribution data for ongoing CRUTs for which full-year returns were filed in both 2004 and 2005. These data show that the increase in distributions between 2004 and 2005 was 9.1 percent for ongoing trusts, higher than the overall change.
Charitable remainder unitrust returns filed in 2005 reported $79.8 billion for end-of-year book value of assets (Figure C). Approximately 87.1 per-cent of the asset value was made up of investments, reported to be $69.6 billion. Corporate stock com-prised $356 billion, or 51.2 percent, of total invest-ments (Figure M). For large CRUTs, other invest-ments surpassed corporate stock as the largest per-centage of the portfolio. Other investments include partnerships, annuities, and bonds issued by foreign governments. Overall, CRUT returns reported $1.2 billion in liabilities during the filing year. Accounts payable, accrued expenses, and deferred revenue ac-counted for $309.2 million of total liabilities.
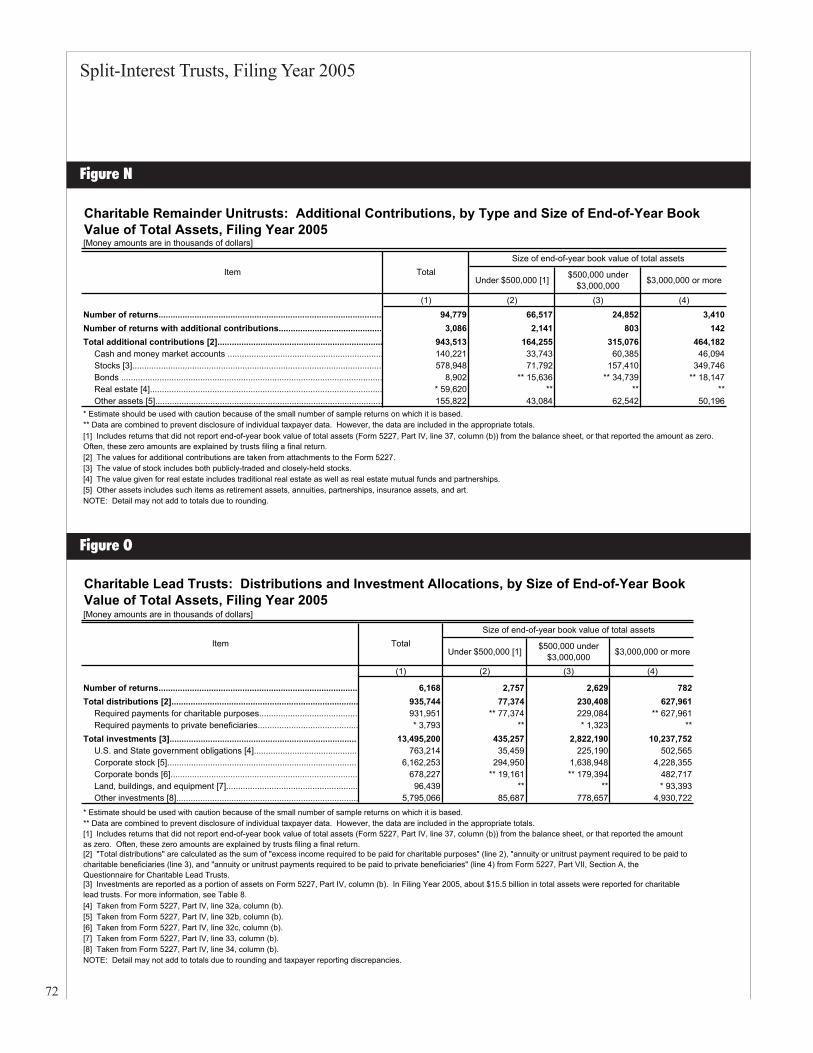
In Filing Year 2005, some 3,086 or 3.3 percent of all CRUTs reported $943.5 million in additional con-tributions (Figure N). Large CRUTs were the most likely to receive additional contributions. Stocks were the most common type of additional contribu-tion, composing 61.4 percent of all contributions. Contributions of other assets, including insurance, art, and retirement assets, were reported to be $155.8 million. Bonds made up the smallest amount of ad-ditional contributions, $8.9 million.
Charitable Lead TrustsTrustees filed returns for 6,168 charitable lead trusts in 2005. This is a 9.0-percent increase from the number filed in 2004. CLT returns filed in 2005
Figure K
Split-Interest Trusts, Filing Year 2005
71
[Money amounts are in thousands of dollars]
2004 2005 Percent change 2004 2005 Percent change(1) (2) (3) (4) (5) (6)
Total distributions [2]........................................ 5,939,494 6,358,763 7.1 4,098,432 4,469,473 9.1 Ordinary income [3]......................................... 1,587,644 1,706,843 7.5 1,426,585 1,494,502 4.8 Short-term capital gains [4].............................. 406,515 342,579 -15.7 260,220 295,822 13.7 Long-term capital gains [5].............................. 3,072,668 3,706,584 20.6 2,039,685 2,366,693 16.0 Nontaxable income [6]..................................... 43,750 44,359 1.4 37,689 35,262 -6.4 Corpus [7]........................................................ 828,917 558,398 -32.6 334,254 277,194 -17.1
[2] May include distributions made after December 31 of the tax year and therefore may not be reflected on the accumulation schedule.[3] Reported on Form 5227, Part III, column (a).[4] Reported on Form 5227, Part III, column (b).[5] Reported on Form 5227, Part III, column (c).[6] Reported on Form 5227, Part III, column (d).[7] Reported on Form 5227, Part III, column (e).NOTE: Detail may not add to totals due to rounding.
[1] This category includes only returns included in both the 2004 and 2005 filing year samples and only those returns that did not make initial or final distributions in either period.
Charitable Remainder Unitrusts: Distributions, Filing Years 2004 and 2005
ItemAll returns Trusts for which returns filed in both 2004 and 2005 [1]
Charitable Remainder Unitrusts: Investment Allocations, by Size of End-of-Year Book Value of Total Assets, Filing Year 2005[Money amounts are in thousands of dollars]
Amount Percent of total Amount Percent of
total Amount Percent of total Amount Percent of
total(1) (2) (3) (4) (5) (6) (7) (8)
Total investments.................................................. 69,584,949 100.0 10,196,193 100.0 22,732,691 100.0 36,656,066 100.0 U.S. and State government obligations [2]......... 4,739,014 6.8 479,873 4.7 1,735,113 7.6 2,524,029 6.9 Corporate stock [3]............................................. 35,612,915 51.2 6,318,888 62.0 13,996,994 61.6 15,297,033 41.7 Corporate bonds [4]............................................ 7,468,535 10.7 1,528,966 15.0 2,869,647 12.6 3,069,923 8.4 Land, buildings, and equipment [5]..................... 733,885 1.1 105,695 1.0 306,496 1.3 321,694 0.9 Other investments [6]......................................... 21,030,600 30.2 1,762,771 17.3 3,824,442 16.8 15,443,387 42.1
ItemTotal
Size of end-of-year book value of total assets
Under $500,000 [1] $500,000 under $3,000,000 $3,000,000 or more
[5] Taken from Form 5227, Part IV, line 33, column (b).[6] Taken from Form 5227, Part IV, line 34, column (b).NOTE: Detail may not add to totals due to rounding and taxpayer reporting discrepancies.
[1] Includes returns that did not report end-of-year book value of total assets (Form 5227, Part IV, line 37, column (b)) from the balance sheet, or that reported the amount as zero.Often, these zero amounts are explained by trusts filing a final return. [2] Taken from Form 5227, Part IV, line 32a, column (b).[3] Taken from Form 5227, Part IV, line 32b, column (b).[4] Taken from Form 5227, Part IV, line 32c, column (b).
reported $935.7 million in distributions (Figure O). Of this total, $932.0 million were required payments for charitable purposes, while the other $3.8 mil-lion were required payments to private beneficiaries. Figure A shows that $15.5 billion in end-of-year total assets were reported for charitable lead trusts in Filing Year 2005. Investments made up 87.1 percent, or $13.5 billion, of total assets (Figure N). Corporate stock was the largest component of all investments for all trust sizes, while land, buildings, and equip-ment investments made up the smallest share. CLTs claimed $399.2 million in total liabilities.
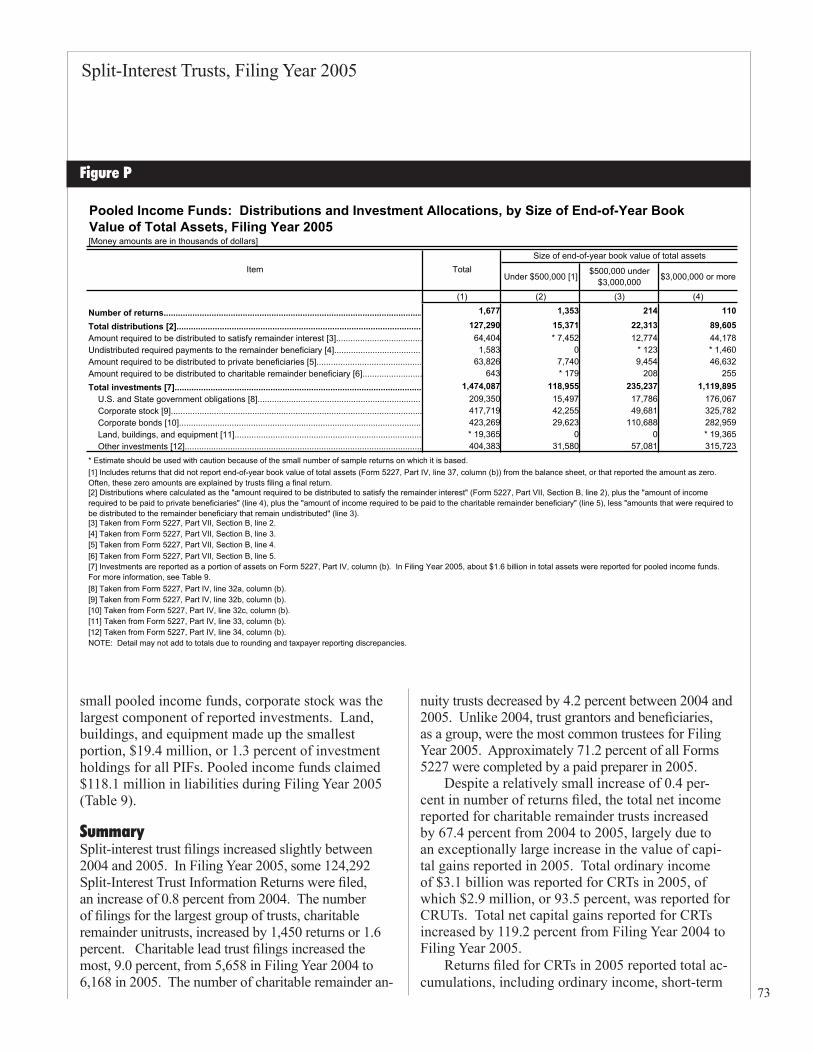
Pooled Income FundsThe number of Forms 5227 filed for pooled income funds increased by 5.4 percent, from 1,591 in 2004 to 1,677 in 2005. In Filing Year 2005, PIFs reported distributions of $127.3 million (Figure P). The majority of distributions were distributions to private beneficiaries, reported to be $63.8 million in Filing Year 2005. Of the $1.6 billion in end-of-year total assets reported for PIFs, $1.5 billion or 91.0 percent were investments. For all PIFs, corporate bonds made up the largest portion of reported investments, $423.3 million in 2005. However, for both large and
Figure L
Figure M
72
Split-Interest Trusts, Filing Year 2005
Charitable Remainder Unitrusts: Additional Contributions, by Type and Size of End-of-Year Book Value of Total Assets, Filing Year 2005[Money amounts are in thousands of dollars]
Under $500,000 [1] $500,000 under $3,000,000 $3,000,000 or more
(1) (2) (3) (4)
Number of returns.............................................................................................. 94,779 66,517 24,852 3,410Number of returns with additional contributions........................................... 3,086 2,141 803 142Total additional contributions [2]..................................................................... 943,513 164,255 315,076 464,182
Cash and money market accounts ................................................................. 140,221 33,743 60,385 46,094Stocks [3]........................................................................................................ 578,948 71,792 157,410 349,746Bonds ............................................................................................................. 8,902 ** 15,636 ** 34,739 ** 18,147Real estate [4]................................................................................................. * 59,620 ** ** **Other assets [5]............................................................................................... 155,822 43,084 62,542 50,196
* Estimate should be used with caution because of the small number of sample returns on which it is based.** Data are combined to prevent disclosure of individual taxpayer data. However, the data are included in the appropriate totals.
[2] The values for additional contributions are taken from attachments to the Form 5227.[3] The value of stock includes both publicly-traded and closely-held stocks.[4] The value given for real estate includes traditional real estate as well as real estate mutual funds and partnerships.[5] Other assets includes such items as retirement assets, annuities, partnerships, insurance assets, and art.NOTE: Detail may not add to totals due to rounding.
Item TotalSize of end-of-year book value of total assets
[1] Includes returns that did not report end-of-year book value of total assets (Form 5227, Part IV, line 37, column (b)) from the balance sheet, or that reported the amount as zero.Often, these zero amounts are explained by trusts filing a final return.
Charitable Lead Trusts: Distributions and Investment Allocations, by Size of End-of-Year Book Value of Total Assets, Filing Year 2005[Money amounts are in thousands of dollars]
Under $500,000 [1] $500,000 under $3,000,000 $3,000,000 or more
(1) (2) (3) (4)
Number of returns................................................................................... 6,168 2,757 2,629 782Total distributions [2].............................................................................. 935,744 77,374 230,408 627,961
Required payments for charitable purposes......................................... 931,951 ** 77,374 229,084 ** 627,961Required payments to private beneficiaries.......................................... * 3,793 ** * 1,323 **
Total investments [3]............................................................................... 13,495,200 435,257 2,822,190 10,237,752U.S. and State government obligations [4]............................................ 763,214 35,459 225,190 502,565Corporate stock [5]................................................................................ 6,162,253 294,950 1,638,948 4,228,355Corporate bonds [6].............................................................................. 678,227 ** 19,161 ** 179,394 482,717Land, buildings, and equipment [7]....................................................... 96,439 ** ** * 93,393Other investments [8]............................................................................ 5,795,066 85,687 778,657 4,930,722
* Estimate should be used with caution because of the small number of sample returns on which it is based.** Data are combined to prevent disclosure of individual taxpayer data. However, the data are included in the appropriate totals.
[4] Taken from Form 5227, Part IV, line 32a, column (b).[5] Taken from Form 5227, Part IV, line 32b, column (b).[6] Taken from Form 5227, Part IV, line 32c, column (b).[7] Taken from Form 5227, Part IV, line 33, column (b).[8] Taken from Form 5227, Part IV, line 34, column (b).NOTE: Detail may not add to totals due to rounding and taxpayer reporting discrepancies.
Item TotalSize of end-of-year book value of total assets
[3] Investments are reported as a portion of assets on Form 5227, Part IV, column (b). In Filing Year 2005, about $15.5 billion in total assets were reported for charitable lead trusts. For more information, see Table 8.
[2] "Total distributions" are calculated as the sum of "excess income required to be paid for charitable purposes" (line 2), "annuity or unitrust payment required to be paid to charitable beneficiaries (line 3), and "annuity or unitrust payments required to be paid to private beneficiaries" (line 4) from Form 5227, Part VII, Section A, the Questionnaire for Charitable Lead Trusts.
[1] Includes returns that did not report end-of-year book value of total assets (Form 5227, Part IV, line 37, column (b)) from the balance sheet, or that reported the amount as zero. Often, these zero amounts are explained by trusts filing a final return.
Figure O
Figure N
Split-Interest Trusts, Filing Year 2005
73
Pooled Income Funds: Distributions and Investment Allocations, by Size of End-of-Year Book Value of Total Assets, Filing Year 2005[Money amounts are in thousands of dollars]
Under $500,000 [1] $500,000 under $3,000,000 $3,000,000 or more
(1) (2) (3) (4)
Number of returns............................................................................................................ 1,677 1,353 214 110
Total distributions [2]....................................................................................................... 127,290 15,371 22,313 89,605Amount required to be distributed to satisfy remainder interest [3].................................... 64,404 * 7,452 12,774 44,178Undistributed required payments to the remainder beneficiary [4]..................................... 1,583 0 * 123 * 1,460Amount required to be distributed to private beneficiaries [5]............................................ 63,826 7,740 9,454 46,632Amount required to be distributed to charitable remainder beneficiary [6]......................... 643 * 179 208 255Total investments [7]....................................................................................................... 1,474,087 118,955 235,237 1,119,895 U.S. and State government obligations [8]..................................................................... 209,350 15,497 17,786 176,067 Corporate stock [9]......................................................................................................... 417,719 42,255 49,681 325,782 Corporate bonds [10]..................................................................................................... 423,269 29,623 110,688 282,959 Land, buildings, and equipment [11].............................................................................. * 19,365 0 0 * 19,365 Other investments [12]................................................................................................... 404,383 31,580 57,081 315,723* Estimate should be used with caution because of the small number of sample returns on which it is based.
[6] Taken from Form 5227, Part VII, Section B, line 5.
[8] Taken from Form 5227, Part IV, line 32a, column (b).[9] Taken from Form 5227, Part IV, line 32b, column (b).[10] Taken from Form 5227, Part IV, line 32c, column (b).[11] Taken from Form 5227, Part IV, line 33, column (b).[12] Taken from Form 5227, Part IV, line 34, column (b).NOTE: Detail may not add to totals due to rounding and taxpayer reporting discrepancies.
[7] Investments are reported as a portion of assets on Form 5227, Part IV, column (b). In Filing Year 2005, about $1.6 billion in total assets were reported for pooled income funds. For more information, see Table 9.
[5] Taken from Form 5227, Part VII, Section B, line 4.
Item TotalSize of end-of-year book value of total assets
[1] Includes returns that did not report end-of-year book value of total assets (Form 5227, Part IV, line 37, column (b)) from the balance sheet, or that reported the amount as zero.Often, these zero amounts are explained by trusts filing a final return. [2] Distributions where calculated as the "amount required to be distributed to satisfy the remainder interest" (Form 5227, Part VII, Section B, line 2), plus the "amount of income required to be paid to private beneficiaries" (line 4), plus the "amount of income required to be paid to the charitable remainder beneficiary" (line 5), less "amounts that were required to be distributed to the remainder beneficiary that remain undistributed" (line 3).[3] Taken from Form 5227, Part VII, Section B, line 2.[4] Taken from Form 5227, Part VII, Section B, line 3.
small pooled income funds, corporate stock was the largest component of reported investments. Land, buildings, and equipment made up the smallest portion, $19.4 million, or 1.3 percent of investment holdings for all PIFs. Pooled income funds claimed $118.1 million in liabilities during Filing Year 2005 (Table 9).
SummarySplit-interest trust filings increased slightly between 2004 and 2005. In Filing Year 2005, some 124,292 Split-Interest Trust Information Returns were filed, an increase of 0.8 percent from 2004. The number of filings for the largest group of trusts, charitable remainder unitrusts, increased by 1,450 returns or 1.6 percent. Charitable lead trust filings increased the most, 9.0 percent, from 5,658 in Filing Year 2004 to 6,168 in 2005. The number of charitable remainder an-
nuity trusts decreased by 4.2 percent between 2004 and 2005. Unlike 2004, trust grantors and beneficiaries, as a group, were the most common trustees for Filing Year 2005. Approximately 71.2 percent of all Forms 5227 were completed by a paid preparer in 2005.
Despite a relatively small increase of 0.4 per-cent in number of returns filed, the total net income reported for charitable remainder trusts increased by 67.4 percent from 2004 to 2005, largely due to an exceptionally large increase in the value of capi-tal gains reported in 2005. Total ordinary income of $3.1 billion was reported for CRTs in 2005, of which $2.9 million, or 93.5 percent, was reported for CRUTs. Total net capital gains reported for CRTs increased by 119.2 percent from Filing Year 2004 to Filing Year 2005.
Returns filed for CRTs in 2005 reported total ac-cumulations, including ordinary income, short-term
Figure P
74
Split-Interest Trusts, Filing Year 2005
and long-term capital gains, and nontaxable income, of $65.1 billion. As in Filing Year 2004, prior-year accumulations comprised the majority of total accu-mulations, 85.2 percent for CRATs and 86.2 percent for CRUTs. End-of-year undistributed income was reported as $58.7 billion for charitable remainder trusts. The value of distributions made by all SITs increased from $7.9 billion in Filing Year 2004, to $8.4 billion in 2005. CRTs reported $7.4 billion in distributions in Filing Year 2005. CLTs and PIFs reported distributions of $935.7 million and 127.3 million, respectively.
For all SITs, the end-of-year book value of trust as-sets increased from $100.8 billion in Filing Year 2004 to $106.5 billion in Filing Year 2005. CLTs reported the largest increase in end-of-year book value of assets, 25.8 percent, while the value reported for PIF assets decreased by 2.2 percent between 2004 and 2005. As in prior years, investments made up the largest percent-age of assets for all SITs in 2005. Corporate stocks were the most common type of investments for all types of split-interest trusts, while land, buildings, and equipment were the least common.
Data Sources and LimitationsThe data presented in this article were collected from a sample of Forms 5227, Split-Interest Trust Information Returns, from Filing Year 2005. A filing year includes returns received by IRS for processing between January 1 and December 31 of a given year. A filing year file is primarily comprised of returns for the tax year immediately prior, though it may include returns for numerous other tax years. For Filing Year 2005, approximately 97.9 percent of returns included in the sample are for Tax Year 2004, while Tax Year 2003 returns comprised 1.6 percent of the sampled returns. Partial-year returns, for either initial or final reporting periods, were included in the SOI sample. All returns included in the sample were computer-designated at the IRS Ogden Submission Processing Center after posting to the IRS Master File.
For Filing Year 2005, a sample of 12,382 returns was drawn from an estimated population of 124,647 trusts that filed Form 5227. The sample size ex-cludes returns that were selected for the sample but later rejected. Returns could be rejected if they were not one of the four types of trusts included in the study or if no money amounts were reported. The sample was stratified by the type of the trust (chari-
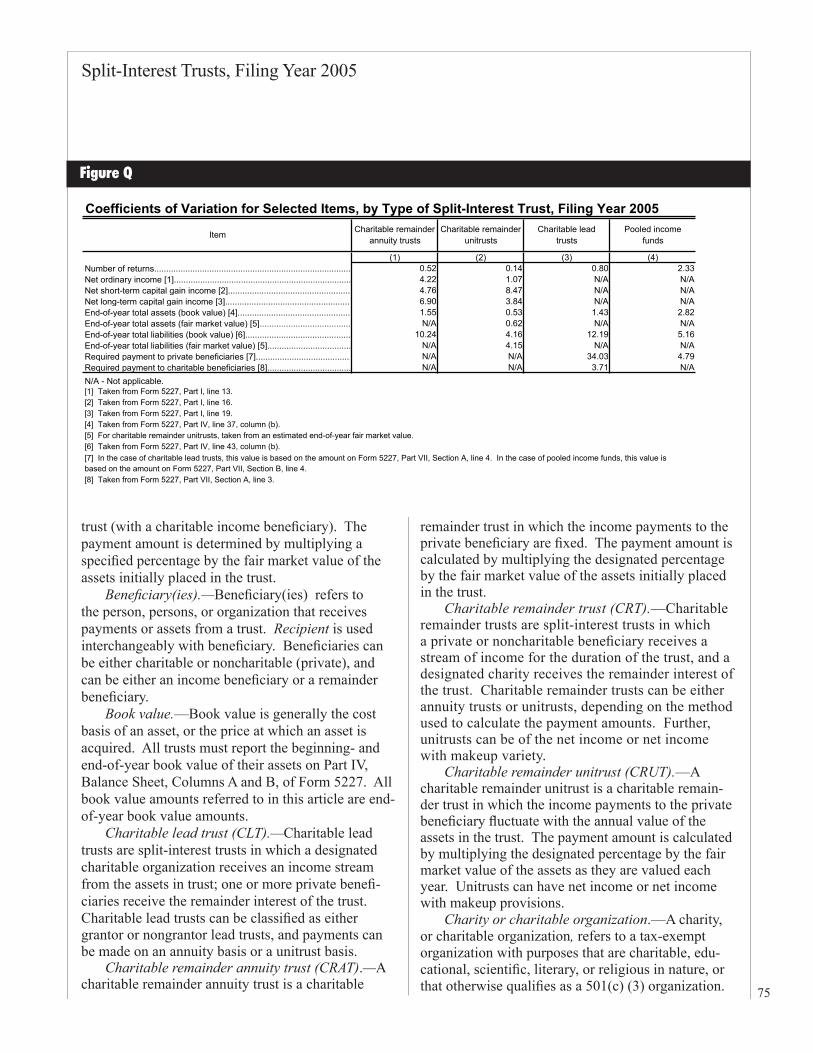
table remainder annuity trust, charitable remainder unitrust, charitable lead trust, or pooled income fund) and the reported book value of end-of-year total as-sets. The asset strata were: total assets of less than $1.0 million, from $1.0 million to less than $10.0 million, and more than $10.0 million. A fourth asset category included all trusts that reported end-of-year book value of total assets as less than $10.0 million, but reported end-of-year fair market value of total assets in excess of $50.0 million, for a total of 16 strata. There were 21,618 charitable remainder annu-ity trusts, which were sampled at rates ranging from 6.3 percent (for the smallest) to 100.0 percent (for the largest), resulting in a sample of 2,118 returns. There were 95,146 charitable remainder unitrusts, sampled at rates from 5.0 percent to 100.0 percent, creating a sample of 9,438 returns. There were 6,233 chari-table lead trusts, from which a sample of 637 was drawn. Lead trusts were sampled at rates ranging from 3.6 percent to 100.0 percent. There were 1,650 pooled income funds, of which 189 were included in the sample. Pooled income funds had sample rates from 4.9 percent to 100.0 percent. For all trust types, trusts in the fourth asset category were sampled at 100.0 percent. The magnitude of sampling error for selected items, measured by coefficients of variation, is shown in Figure Q.
All samples were designed to provide reliable estimates of financial activity. All data were col-lected from original returns as they were filed. All edited returns were subjected to comprehensive testing and data verification procedures to ensure the highest quality of data. Changes that were made to the return after filing, either by the taxpayer (on an amended return) or during IRS processing, were not generally incorporated. A complete discussion of the reliability of estimates based on samples, methods for evaluating the magnitude for both sampling and nonsampling error, and the precision of the sample estimates can be found in the Appendix in this issue of the SOI Bulletin.
Explanation of Selected TermsAnnuity trust.—An annuity trust is a trust in
which the payments for the duration of the trust, either to a private or charitable beneficiary, are of a fixed amount. In the context of this article, an an-nuity trust can be either a charitable remainder trust (with a private income beneficiary) or charitable lead
Split-Interest Trusts, Filing Year 2005
75
Item Charitable remainder annuity trusts
Charitable remainder unitrusts
Charitable lead trusts
Pooled income funds
(1) (2) (3) (4)Number of returns.................................................................................. 0.52 0.14 0.80 2.33Net ordinary income [1].......................................................................... 4.22 1.07 N/A N/ANet short-term capital gain income [2]................................................... 4.76 8.47 N/A N/ANet long-term capital gain income [3]..................................................... 6.90 3.84 N/A N/AEnd-of-year total assets (book value) [4]............................................... 1.55 0.53 1.43 2.82End-of-year total assets (fair market value) [5]...................................... N/A 0.62 N/A N/AEnd-of-year total liabilities (book value) [6]............................................ 10.24 4.16 12.19 5.16End-of-year total liabilities (fair market value) [5]................................... N/A 4.15 N/A N/ARequired payment to private beneficiaries [7]........................................ N/A N/A 34.03 4.79Required payment to charitable beneficiaries [8]................................... N/A N/A 3.71 N/AN/A - Not applicable.[1] Taken from Form 5227, Part I, line 13.[2] Taken from Form 5227, Part I, line 16.[3] Taken from Form 5227, Part I, line 19.[4] Taken from Form 5227, Part IV, line 37, column (b).[5] For charitable remainder unitrusts, taken from an estimated end-of-year fair market value.[6] Taken from Form 5227, Part IV, line 43, column (b).
[8] Taken from Form 5227, Part VII, Section A, line 3.
Coefficients of Variation for Selected Items, by Type of Split-Interest Trust, Filing Year 2005
[7] In the case of charitable lead trusts, this value is based on the amount on Form 5227, Part VII, Section A, line 4. In the case of pooled income funds, this value is based on the amount on Form 5227, Part VII, Section B, line 4.
trust (with a charitable income beneficiary). The payment amount is determined by multiplying a specified percentage by the fair market value of the assets initially placed in the trust.
Beneficiary(ies).—Beneficiary(ies) refers to the person, persons, or organization that receives payments or assets from a trust. Recipient is used interchangeably with beneficiary. Beneficiaries can be either charitable or noncharitable (private), and can be either an income beneficiary or a remainder beneficiary.
Book value.—Book value is generally the cost basis of an asset, or the price at which an asset is acquired. All trusts must report the beginning- and end-of-year book value of their assets on Part IV, Balance Sheet, Columns A and B, of Form 5227. All book value amounts referred to in this article are end-of-year book value amounts.
Charitable lead trust (CLT).—Charitable lead trusts are split-interest trusts in which a designated charitable organization receives an income stream from the assets in trust; one or more private benefi-ciaries receive the remainder interest of the trust. Charitable lead trusts can be classified as either grantor or nongrantor lead trusts, and payments can be made on an annuity basis or a unitrust basis.
Charitable remainder annuity trust (CRAT).—A charitable remainder annuity trust is a charitable
remainder trust in which the income payments to the private beneficiary are fixed. The payment amount is calculated by multiplying the designated percentage by the fair market value of the assets initially placed in the trust.
Charitable remainder trust (CRT).—Charitable remainder trusts are split-interest trusts in which a private or noncharitable beneficiary receives a stream of income for the duration of the trust, and a designated charity receives the remainder interest of the trust. Charitable remainder trusts can be either annuity trusts or unitrusts, depending on the method used to calculate the payment amounts. Further, unitrusts can be of the net income or net income with makeup variety.
Charitable remainder unitrust (CRUT).—A charitable remainder unitrust is a charitable remain-der trust in which the income payments to the private beneficiary fluctuate with the annual value of the assets in the trust. The payment amount is calculated by multiplying the designated percentage by the fair market value of the assets as they are valued each year. Unitrusts can have net income or net income with makeup provisions.
Charity or charitable organization.—A charity, or charitable organization, refers to a tax-exempt organization with purposes that are charitable, edu-cational, scientific, literary, or religious in nature, or that otherwise qualifies as a 501(c) (3) organization.
Figure Q
76
Split-Interest Trusts, Filing Year 2005
Donor.—A donor, also referred to as a grantor or contributor, is the individual who transfers personal assets into the trust or fund.
Fair market value.—Fair market value is de-fined, for the purposes of this article, as the market price of the asset (or liability) as of a certain point in time. The fair market value of assets and liabilities is reported by charitable remainder unitrusts in Part IV, Balance Sheet, Column C, of Form 5227.
Grantor charitable lead trust.—Charitable grantor lead trusts name the donor (grantor) as the remainder beneficiary. In establishing a grantor lead trust, the donor is entitled to an income tax deduction for the year in which the trust was created, but he or she must also pay taxes on the income generated by the trust’s assets. The income generated is paid to a designated charitable beneficiary.
Income beneficiary.—The income beneficiary of a split-interest trust is the recipient of the stream of payments made over the duration of the trust. The income beneficiary of charitable remainder trusts and pooled income funds is the private (noncharitable) beneficiary; in charitable lead trusts, the income ben-eficiary is the designated charitable organization.
Income interest.—Income interest refers to the right to receive payments made to beneficiaries dur-ing the life of the trust. Income interest is paid to the income beneficiary.
Investments.—Investments refer to the sum of “Government obligations” (line 32a); “corporate stock” (line 32b); “corporate bonds” (line 32c); “land, buildings, and equipment that is not held for charitable purposes” (line 33); and “other invest-ments” (line 34) reported on Form 5227.
Net income charitable remainder unitrust (NI-CRUT).—Net income charitable remainder unitrusts are charitable remainder unitrusts that allow the annual payment to the private beneficiary to be the lesser of either the unitrust amount or the trust’s net income.
Net income with makeup charitable remainder unitrusts (NIM-CRUT).—Net income with makeup charitable remainder unitrusts are charitable remain-der unitrusts that allow the annual payment to the pri-vate beneficiary to be the lesser of either the unitrust amount or the trust’s net income. Deficiencies in the distributions, which occur when the net income is
less than the unitrust payment amount, are then made up in subsequent years when the net income of the trust is greater than the unitrust amount.
Nongrantor charitable lead trust.—Charitable nongrantor lead trusts name as the remainder ben-eficiary a recipient other than the grantor (donor). Usually, the remainder beneficiary is a child or grandchild of the grantor.
Ordinary income.—Ordinary income is income from the following sources: interest; dividends; busi-ness income; rents, royalties, partnerships, and other estates and trusts; farm income; ordinary gain; and “other income.” Ordinary income is reported in Part I, Ordinary Income, of Form 5227.
Pooled income fund (PIF).—A pooled income fund is a fund established and maintained by a char-ity to invest and manage assets donated by multiple donors. Income from the assets is distributed annu-ally on a prorated basis to the named beneficiaries. Upon the termination of an income interest (due to the death of one of the beneficiaries), a prorated part of the basis of the fund is removed and given to the charity.
Remainder beneficiary.—The remainder ben-eficiary of a split-interest trust is the recipient of the trust’s assets at the conclusion of the trust. In the case of charitable remainder trusts, the remainder beneficiary is the selected charity; in charitable lead trusts, the remainder beneficiary is the designated private beneficiary.
Remainder interest.—The remainder interest of a trust is the right to receive assets remaining at the conclusion of the trust, after all liabilities have been settled and prior payments to beneficiaries have been made. This interest is then distributed to the remain-der beneficiary.
Securities.—Securities refer to the sum of “Government obligations” (line 32a); “corporate stock” (line 32b); and “corporate bonds” (line 32c) reported on Form 5227.
Short-term investments.—Short-term investments are securities that mature in 1 year or less. Treasury bills and short-term corporate notes are common examples of a short-term investment.
Split-interest trust.—A split-interest trust, ac-cording to the 2003 Instructions for Form 5227, is a trust that “is not exempt from tax under Internal
Split-Interest Trusts, Filing Year 2005
77
Revenue Code section 501(a); has some unexpired interests that are devoted to purposes other than religious, charitable, or similar purposes described in Code section 170(c)(2)(B); and has amounts trans-ferred in trust after May 26, 1969, for which a de-duction was allowed under one of the Code sections listed in section 4947(a)(2).”
Trust.—A trust is a legal arrangement between its creator (donor or grantor), the manager of the trust (trustee), and the beneficiary or beneficiaries of the trust. Trusts are legal entities in their own right, and can be responsible for any tax liabilities separate from the liabilities of the grantor and beneficiary. The conditions and provisions of a trust are defined in the trust document.
Unitrust.—A unitrust is a trust in which the income interest, paid either to a private or charitable beneficiary, varies with the annual fair market value of the total assets of the trust in a given year. In the context of this article, a unitrust can be either of the charitable remainder trust (with income payments to a private beneficiary) or charitable lead trust (with income payments to a charitable beneficiary) variety. The payment amount is determined by multiplying a specified percentage by the fair market value of the assets of the trust as they are valued annually.
Notes and References
[1] A filing year includes all returns submit-ted to IRS processing between January 1 and December 31 of that year. Returns filed in 2005 were primarily for Tax Year 2004.
[2] For more information on the allowable dura-tion of charitable remainder trusts, see Internal Revenue Code section 664(d)(1)(A) and 664(d)(2)(A).
[3] The qualifications for a “charitable beneficiary” are detailed in Internal Revenue Code section 170(c).
[4] The method of valuation of the fair market value of a trust is given in Internal Revenue Code sec-tion 7520.
[5] For more information regarding net income charitable remainder unitrusts, see Internal Revenue Code section 664(d)(3)(A).
[6] For more information regarding net income with makeup charitable remainder unitrusts, see Internal Revenue Code section 664(d)(3)(B).
[7] Prorating requires the preparer to calculate the number of days remaining in the year when the additional contribution is made. This number is then divided by the total number of days in the calendar year. The resulting percentage is then multiplied by the value of the additional contribution to determine the prorated value of the additional contributions.
[8] In order to qualify, the individual or individu-als must be the donor, the donor’s spouse, a linear ancestor of a noncharitable beneficiary, or the spouse of a linear ancestor of a nonchari-table beneficiary. For more information, see Treasury Regulations 1.1170A-6(c)(2)(i).
[9] This charitable deduction is not without limit. In general, individuals may not receive a de-duction for a charitable contribution in excess of 50.0 percent of the taxpayer’s contribu-tion base, usually equal to the adjusted gross income. This and other related limitations on charitable deductions are further described in Internal Revenue Code section 170(b).
[10] Pooled income funds are further discussed under Internal Revenue Code section 642(c)(5).
[11] Split-interest trusts created before May 27, 1969, are exempt from having to file a Form 5227, as long as no amounts have been trans-ferred to the trust since May 27, 1969.
[12] Trusts that do not report end-of-year total assets, or that report the amount as zero, are often final-year filers. In those instances, the trusts usually report asset amounts for the beginning of the year, but, as they have terminated, there are no trust assets to report for the end of the year.
[13] Charitable remainder trusts are not allowed deductions for personal exemptions, charitable contributions, net operating losses, income dis-tributions, capital loss carryforwards, Federal income taxes, or Federal excise taxes.
78
Split-Interest Trusts, Filing Year 2005
[14] Those distributions made after December 31 of a tax year, for that tax year, will be included as undistributed at the end of the tax year on the Accumulation Schedule.
[15] This schedule includes all distributions made for the tax year, even if the beneficiary received those distributions after December 31 of that year. Some trust documents may allow for
calendar-year distributions to be made within a certain period of time following the end of the calendar year.
[16] Ordering distribution rules differ for certain types of ordinary income and long-term capital gains. For comprehensive ordering rules, see Form 5227 Instructions.
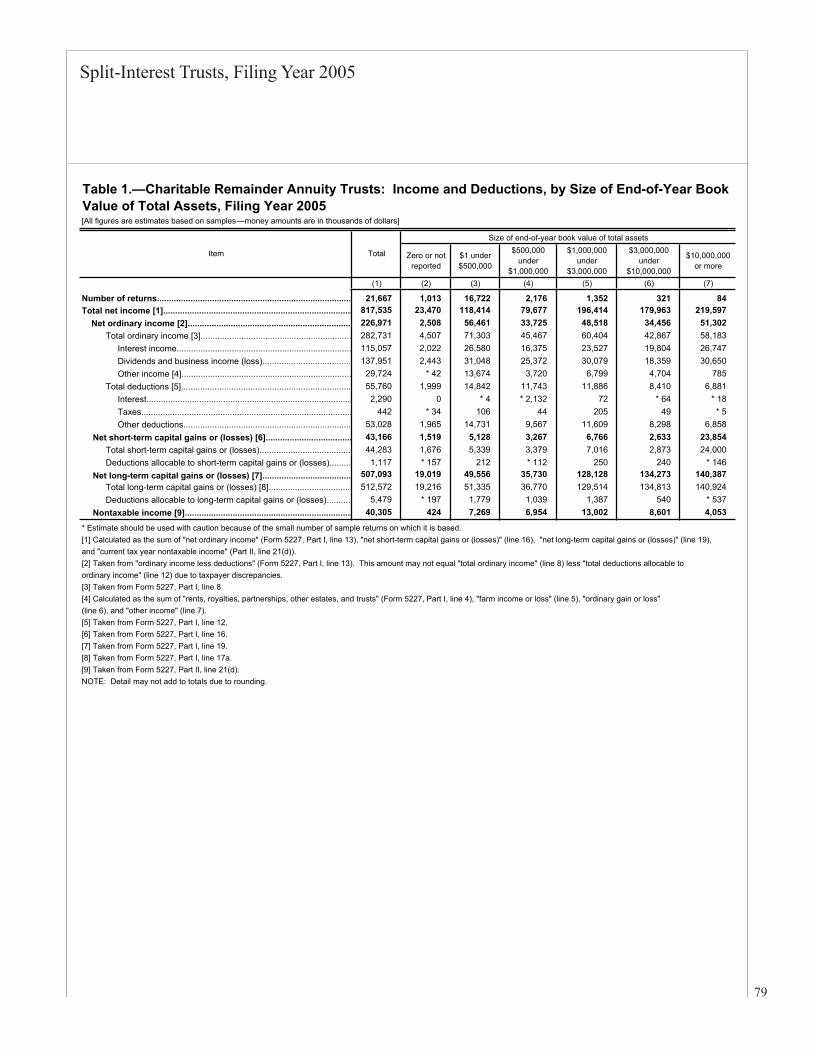
Split-Interest Trusts, Filing Year 2005
79
[All figures are estimates based on samples—money amounts are in thousands of dollars]
Zero or not reported
$1 under $500,000
$500,000under
$1,000,000
$1,000,000under
$3,000,000
$3,000,000under
$10,000,000
$10,000,000or more
(1) (2) (3) (4) (5) (6) (7)
Number of returns................................................................................. 21,667 1,013 16,722 2,176 1,352 321 84 Total net income [1]............................................................................... 817,535 23,470 118,414 79,677 196,414 179,963 219,597 Net ordinary income [2].................................................................... 226,971 2,508 56,461 33,725 48,518 34,456 51,302 Total ordinary income [3]............................................................... 282,731 4,507 71,303 45,467 60,404 42,867 58,183 Interest income......................................................................... 115,057 2,022 26,580 16,375 23,527 19,804 26,747 Dividends and business income (loss)..................................... 137,951 2,443 31,048 25,372 30,079 18,359 30,650 Other income [4]....................................................................... 29,724 * 42 13,674 3,720 6,799 4,704 785 Total deductions [5]....................................................................... 55,760 1,999 14,842 11,743 11,886 8,410 6,881 Interest...................................................................................... 2,290 0 * 4 * 2,132 72 * 64 * 18 Taxes........................................................................................ 442 * 34 106 44 205 49 * 5 Other deductions...................................................................... 53,028 1,965 14,731 9,567 11,609 8,298 6,858
Net short-term capital gains or (losses) [6].................................... 43,166 1,519 5,128 3,267 6,766 2,633 23,854 Total short-term capital gains or (losses)...................................... 44,283 1,676 5,339 3,379 7,016 2,873 24,000 Deductions allocable to short-term capital gains or (losses)......... 1,117 * 157 212 * 112 250 240 * 146
Net long-term capital gains or (losses) [7]..................................... 507,093 19,019 49,556 35,730 128,128 134,273 140,387 Total long-term capital gains or (losses) [8]................................... 512,572 19,216 51,335 36,770 129,514 134,813 140,924 Deductions allocable to long-term capital gains or (losses).......... 5,479 * 197 1,779 1,039 1,387 540 * 537
Nontaxable income [9]...................................................................... 40,305 424 7,269 6,954 13,002 8,601 4,053
* Estimate should be used with caution because of the small number of sample returns on which it is based.[1] Calculated as the sum of "net ordinary income" (Form 5227, Part I, line 13), "net short-term capital gains or (losses)" (line 16), "net long-term capital gains or (losses)" (line 19),and "current tax year nontaxable income" (Part II, line 21(d)).[2] Taken from "ordinary income less deductions" (Form 5227, Part I, line 13). This amount may not equal "total ordinary income" (line 8) less "total deductions allocable to ordinary income" (line 12) due to taxpayer discrepancies.[3] Taken from Form 5227, Part I, line 8.[4] Calculated as the sum of "rents, royalties, partnerships, other estates, and trusts" (Form 5227, Part I, line 4), "farm income or loss" (line 5), "ordinary gain or loss"(line 6), and "other income" (line 7).[5] Taken from Form 5227, Part I, line 12.[6] Taken from Form 5227, Part I, line 16. [7] Taken from Form 5227, Part I, line 19. [8] Taken from Form 5227, Part I, line 17a.[9] Taken from Form 5227, Part II, line 21(d).NOTE: Detail may not add to totals due to rounding.
Item Total
Size of end-of-year book value of total assets
Table 1.—Charitable Remainder Annuity Trusts: Income and Deductions, by Size of End-of-Year Book Value of Total Assets, Filing Year 2005
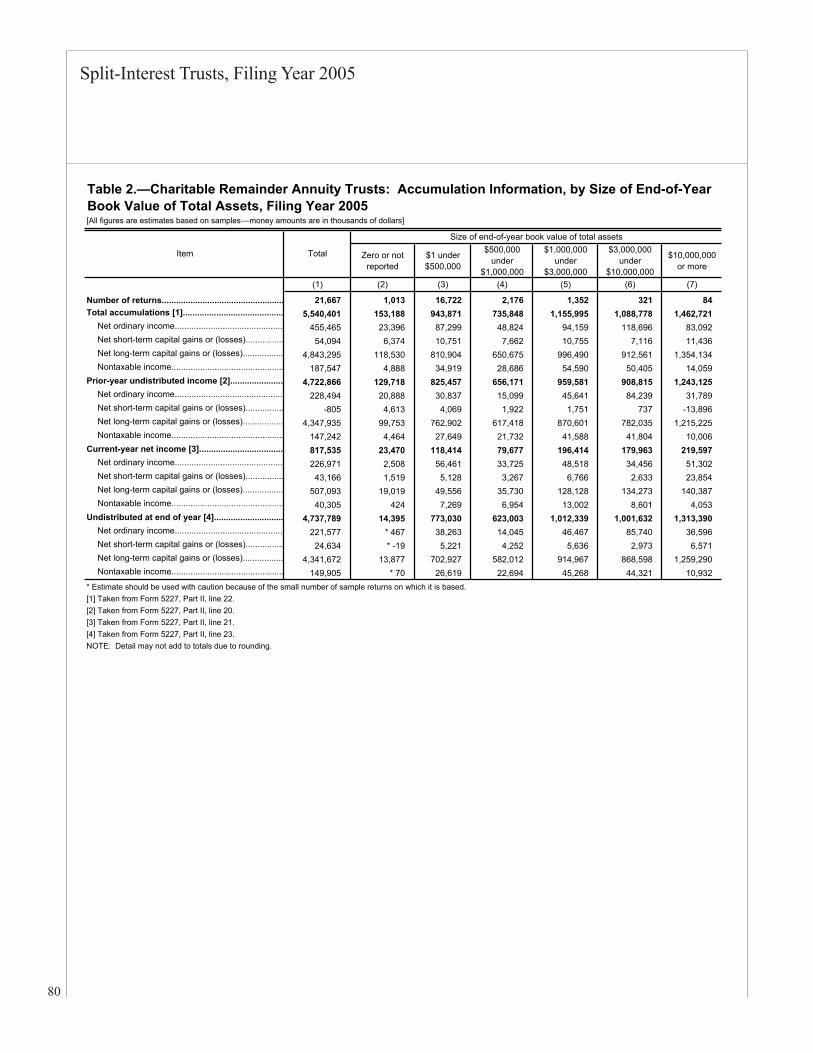
Split-Interest Trusts, Filing Year 2005
80
[All figures are estimates based on samples—money amounts are in thousands of dollars]
Zero or not reported
$1 under $500,000
$500,000under
$1,000,000
$1,000,000under
$3,000,000
$3,000,000under
$10,000,000
$10,000,000or more
(1) (2) (3) (4) (5) (6) (7)
Number of returns................................................... 21,667 1,013 16,722 2,176 1,352 321 84 Total accumulations [1].......................................... 5,540,401 153,188 943,871 735,848 1,155,995 1,088,778 1,462,721
Net ordinary income.............................................. 455,465 23,396 87,299 48,824 94,159 118,696 83,092 Net short-term capital gains or (losses)................ 54,094 6,374 10,751 7,662 10,755 7,116 11,436 Net long-term capital gains or (losses)................. 4,843,295 118,530 810,904 650,675 996,490 912,561 1,354,134 Nontaxable income............................................... 187,547 4,888 34,919 28,686 54,590 50,405 14,059
Prior-year undistributed income [2]...................... 4,722,866 129,718 825,457 656,171 959,581 908,815 1,243,125 Net ordinary income.............................................. 228,494 20,888 30,837 15,099 45,641 84,239 31,789 Net short-term capital gains or (losses)................ -805 4,613 4,069 1,922 1,751 737 -13,896 Net long-term capital gains or (losses)................. 4,347,935 99,753 762,902 617,418 870,601 782,035 1,215,225 Nontaxable income............................................... 147,242 4,464 27,649 21,732 41,588 41,804 10,006
Current-year net income [3]................................... 817,535 23,470 118,414 79,677 196,414 179,963 219,597 Net ordinary income.............................................. 226,971 2,508 56,461 33,725 48,518 34,456 51,302 Net short-term capital gains or (losses)................ 43,166 1,519 5,128 3,267 6,766 2,633 23,854 Net long-term capital gains or (losses)................. 507,093 19,019 49,556 35,730 128,128 134,273 140,387 Nontaxable income............................................... 40,305 424 7,269 6,954 13,002 8,601 4,053
Undistributed at end of year [4]............................. 4,737,789 14,395 773,030 623,003 1,012,339 1,001,632 1,313,390 Net ordinary income.............................................. 221,577 * 467 38,263 14,045 46,467 85,740 36,596 Net short-term capital gains or (losses)................ 24,634 * -19 5,221 4,252 5,636 2,973 6,571 Net long-term capital gains or (losses)................. 4,341,672 13,877 702,927 582,012 914,967 868,598 1,259,290 Nontaxable income............................................... 149,905 * 70 26,619 22,694 45,268 44,321 10,932
[1] Taken from Form 5227, Part II, line 22.[2] Taken from Form 5227, Part II, line 20.[3] Taken from Form 5227, Part II, line 21.[4] Taken from Form 5227, Part II, line 23.
Table 2.—Charitable Remainder Annuity Trusts: Accumulation Information, by Size of End-of-Year Book Value of Total Assets, Filing Year 2005
NOTE: Detail may not add to totals due to rounding.
Item Total
Size of end-of-year book value of total assets
* Estimate should be used with caution because of the small number of sample returns on which it is based.
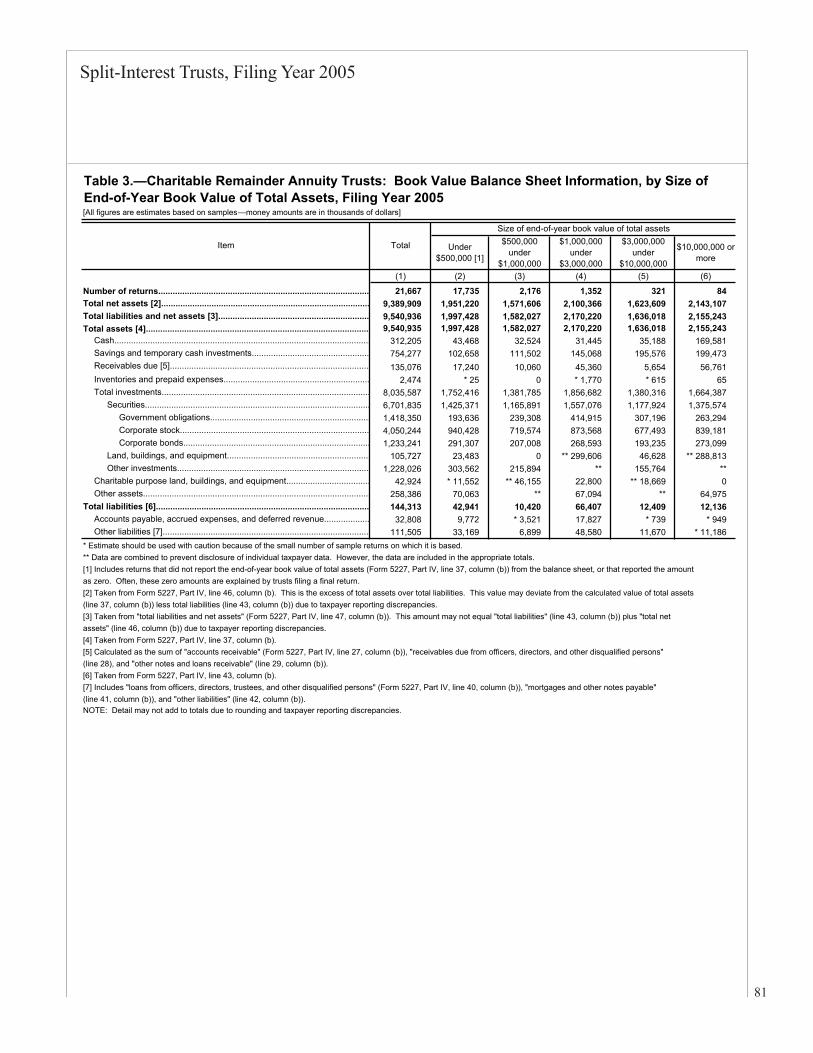
Split-Interest Trusts, Filing Year 2005
81
[All figures are estimates based on samples—money amounts are in thousands of dollars]
Under$500,000 [1]
$500,000under
$1,000,000
$1,000,000under
$3,000,000
$3,000,000under
$10,000,000
$10,000,000 or more
(1) (2) (3) (4) (5) (6)
Number of returns........................................................................................ 21,667 17,735 2,176 1,352 321 84 Total net assets [2]....................................................................................... 9,389,909 1,951,220 1,571,606 2,100,366 1,623,609 2,143,107 Total liabilities and net assets [3]............................................................... 9,540,936 1,997,428 1,582,027 2,170,220 1,636,018 2,155,243 Total assets [4]............................................................................................. 9,540,935 1,997,428 1,582,027 2,170,220 1,636,018 2,155,243
Cash........................................................................................................... 312,205 43,468 32,524 31,445 35,188 169,581 Savings and temporary cash investments................................................. 754,277 102,658 111,502 145,068 195,576 199,473 Receivables due [5]................................................................................... 135,076 17,240 10,060 45,360 5,654 56,761 Inventories and prepaid expenses............................................................. 2,474 * 25 0 * 1,770 * 615 65 Total investments....................................................................................... 8,035,587 1,752,416 1,381,785 1,856,682 1,380,316 1,664,387
Securities.............................................................................................. 6,701,835 1,425,371 1,165,891 1,557,076 1,177,924 1,375,574 Government obligations................................................................... 1,418,350 193,636 239,308 414,915 307,196 263,294 Corporate stock............................................................................... 4,050,244 940,428 719,574 873,568 677,493 839,181 Corporate bonds.............................................................................. 1,233,241 291,307 207,008 268,593 193,235 273,099 Land, buildings, and equipment............................................................ 105,727 23,483 0 ** 299,606 46,628 ** 288,813 Other investments................................................................................ 1,228,026 303,562 215,894 ** 155,764 **
Charitable purpose land, buildings, and equipment................................... 42,924 * 11,552 ** 46,155 22,800 ** 18,669 0 Other assets............................................................................................... 258,386 70,063 ** 67,094 ** 64,975
Total liabilities [6]......................................................................................... 144,313 42,941 10,420 66,407 12,409 12,136 Accounts payable, accrued expenses, and deferred revenue................... 32,808 9,772 * 3,521 17,827 * 739 * 949 Other liabilities [7]...................................................................................... 111,505 33,169 6,899 48,580 11,670 * 11,186
* Estimate should be used with caution because of the small number of sample returns on which it is based.** Data are combined to prevent disclosure of individual taxpayer data. However, the data are included in the appropriate totals.[1] Includes returns that did not report the end-of-year book value of total assets (Form 5227, Part IV, line 37, column (b)) from the balance sheet, or that reported the amount as zero. Often, these zero amounts are explained by trusts filing a final return.[2] Taken from Form 5227, Part IV, line 46, column (b). This is the excess of total assets over total liabilities. This value may deviate from the calculated value of total assets(line 37, column (b)) less total liabilities (line 43, column (b)) due to taxpayer reporting discrepancies.[3] Taken from "total liabilities and net assets" (Form 5227, Part IV, line 47, column (b)). This amount may not equal "total liabilities" (line 43, column (b)) plus "total net assets" (line 46, column (b)) due to taxpayer reporting discrepancies.[4] Taken from Form 5227, Part IV, line 37, column (b).[5] Calculated as the sum of "accounts receivable" (Form 5227, Part IV, line 27, column (b)), "receivables due from officers, directors, and other disqualified persons"(line 28), and "other notes and loans receivable" (line 29, column (b)).[6] Taken from Form 5227, Part IV, line 43, column (b).[7] Includes "loans from officers, directors, trustees, and other disqualified persons" (Form 5227, Part IV, line 40, column (b)), "mortgages and other notes payable"(line 41, column (b)), and "other liabilities" (line 42, column (b)).NOTE: Detail may not add to totals due to rounding and taxpayer reporting discrepancies.
Item Total
Size of end-of-year book value of total assets
Table 3.—Charitable Remainder Annuity Trusts: Book Value Balance Sheet Information, by Size of End-of-Year Book Value of Total Assets, Filing Year 2005
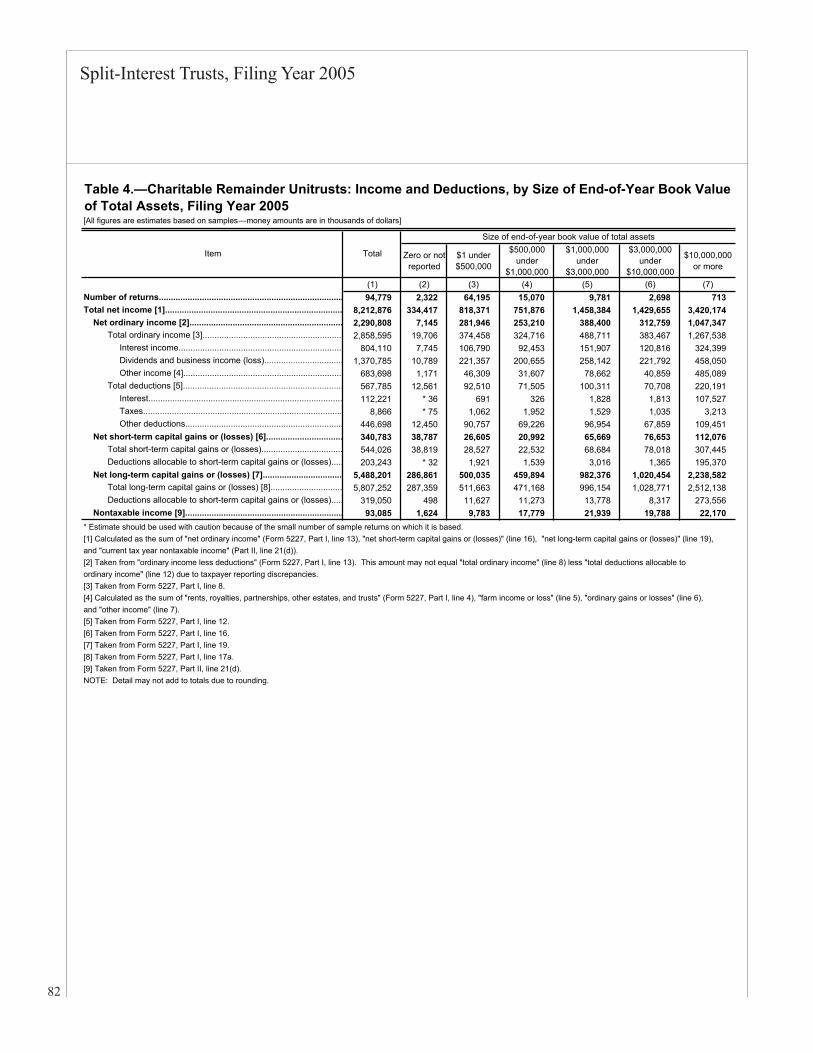
Split-Interest Trusts, Filing Year 2005
82
[All figures are estimates based on samples—money amounts are in thousands of dollars]
Zero or not reported
$1 under $500,000
$500,000under
$1,000,000
$1,000,000under
$3,000,000
$3,000,000under
$10,000,000
$10,000,000or more
(1) (2) (3) (4) (5) (6) (7)Number of returns............................................................................. 94,779 2,322 64,195 15,070 9,781 2,698 713 Total net income [1].......................................................................... 8,212,876 334,417 818,371 751,876 1,458,384 1,429,655 3,420,174 Net ordinary income [2]................................................................ 2,290,808 7,145 281,946 253,210 388,400 312,759 1,047,347 Total ordinary income [3]........................................................... 2,858,595 19,706 374,458 324,716 488,711 383,467 1,267,538 Interest income..................................................................... 804,110 7,745 106,790 92,453 151,907 120,816 324,399 Dividends and business income (loss)................................. 1,370,785 10,789 221,357 200,655 258,142 221,792 458,050 Other income [4]................................................................... 683,698 1,171 46,309 31,607 78,662 40,859 485,089 Total deductions [5]................................................................... 567,785 12,561 92,510 71,505 100,311 70,708 220,191 Interest................................................................................. 112,221 * 36 691 326 1,828 1,813 107,527 Taxes................................................................................... 8,866 * 75 1,062 1,952 1,529 1,035 3,213 Other deductions.................................................................. 446,698 12,450 90,757 69,226 96,954 67,859 109,451 Net short-term capital gains or (losses) [6]................................ 340,783 38,787 26,605 20,992 65,669 76,653 112,076 Total short-term capital gains or (losses).................................. 544,026 38,819 28,527 22,532 68,684 78,018 307,445 Deductions allocable to short-term capital gains or (losses)..... 203,243 * 32 1,921 1,539 3,016 1,365 195,370 Net long-term capital gains or (losses) [7]................................. 5,488,201 286,861 500,035 459,894 982,376 1,020,454 2,238,582 Total long-term capital gains or (losses) [8].............................. 5,807,252 287,359 511,663 471,168 996,154 1,028,771 2,512,138 Deductions allocable to short-term capital gains or (losses)..... 319,050 498 11,627 11,273 13,778 8,317 273,556 Nontaxable income [9].................................................................. 93,085 1,624 9,783 17,779 21,939 19,788 22,170 * Estimate should be used with caution because of the small number of sample returns on which it is based.[1] Calculated as the sum of "net ordinary income" (Form 5227, Part I, line 13), "net short-term capital gains or (losses)" (line 16), "net long-term capital gains or (losses)" (line 19), and "current tax year nontaxable income" (Part II, line 21(d)).[2] Taken from "ordinary income less deductions" (Form 5227, Part I, line 13). This amount may not equal "total ordinary income" (line 8) less "total deductions allocable to ordinary income" (line 12) due to taxpayer reporting discrepancies.[3] Taken from Form 5227, Part I, line 8.[4] Calculated as the sum of "rents, royalties, partnerships, other estates, and trusts" (Form 5227, Part I, line 4), "farm income or loss" (line 5), "ordinary gains or losses" (line 6),and "other income" (line 7).[5] Taken from Form 5227, Part I, line 12.[6] Taken from Form 5227, Part I, line 16. [7] Taken from Form 5227, Part I, line 19. [8] Taken from Form 5227, Part I, line 17a.[9] Taken from Form 5227, Part II, line 21(d).NOTE: Detail may not add to totals due to rounding.
Item Total
Size of end-of-year book value of total assets
Table 4.—Charitable Remainder Unitrusts: Income and Deductions, by Size of End-of-Year Book Value of Total Assets, Filing Year 2005
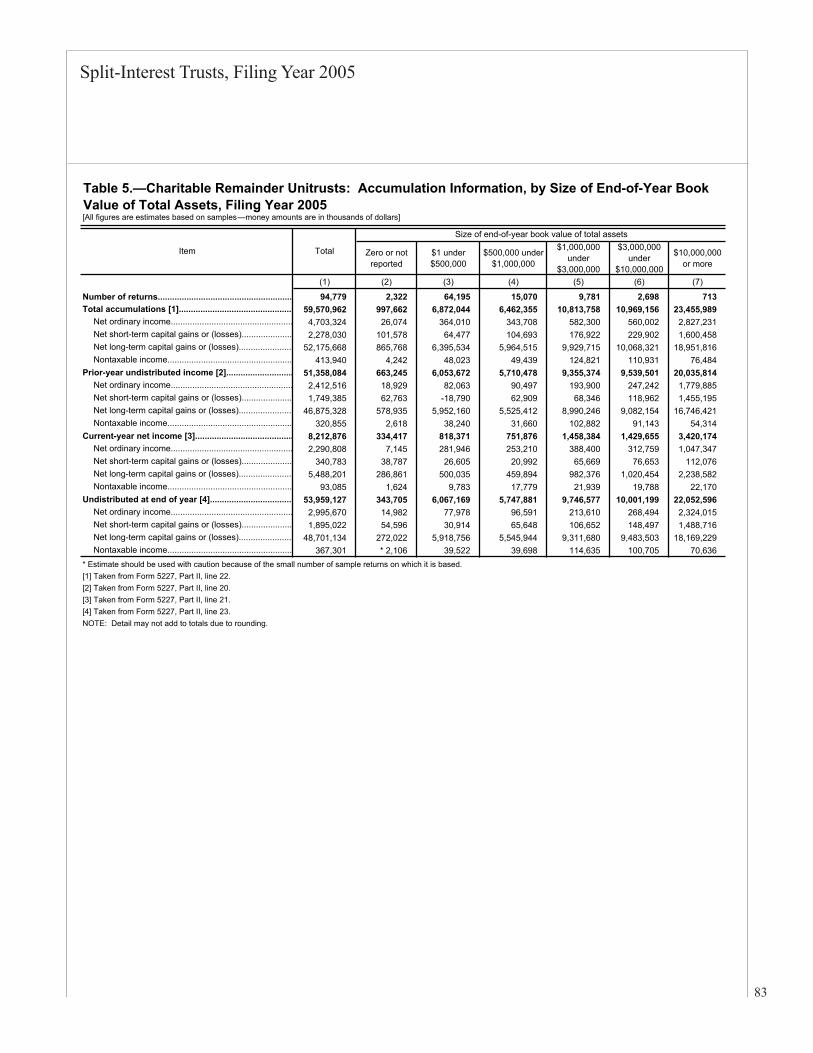
Split-Interest Trusts, Filing Year 2005
83
[All figures are estimates based on samples—money amounts are in thousands of dollars]
Zero or not reported
$1 under $500,000
$500,000 under $1,000,000
$1,000,000under
$3,000,000
$3,000,000under
$10,000,000
$10,000,000or more
(1) (2) (3) (4) (5) (6) (7)
Number of returns........................................................ 94,779 2,322 64,195 15,070 9,781 2,698 713Total accumulations [1]............................................... 59,570,962 997,662 6,872,044 6,462,355 10,813,758 10,969,156 23,455,989
Net ordinary income................................................... 4,703,324 26,074 364,010 343,708 582,300 560,002 2,827,231 Net short-term capital gains or (losses)..................... 2,278,030 101,578 64,477 104,693 176,922 229,902 1,600,458 Net long-term capital gains or (losses)...................... 52,175,668 865,768 6,395,534 5,964,515 9,929,715 10,068,321 18,951,816 Nontaxable income.................................................... 413,940 4,242 48,023 49,439 124,821 110,931 76,484
Prior-year undistributed income [2]............................ 51,358,084 663,245 6,053,672 5,710,478 9,355,374 9,539,501 20,035,814 Net ordinary income................................................... 2,412,516 18,929 82,063 90,497 193,900 247,242 1,779,885 Net short-term capital gains or (losses)..................... 1,749,385 62,763 -18,790 62,909 68,346 118,962 1,455,195 Net long-term capital gains or (losses)...................... 46,875,328 578,935 5,952,160 5,525,412 8,990,246 9,082,154 16,746,421 Nontaxable income.................................................... 320,855 2,618 38,240 31,660 102,882 91,143 54,314
Current-year net income [3]......................................... 8,212,876 334,417 818,371 751,876 1,458,384 1,429,655 3,420,174 Net ordinary income................................................... 2,290,808 7,145 281,946 253,210 388,400 312,759 1,047,347 Net short-term capital gains or (losses)..................... 340,783 38,787 26,605 20,992 65,669 76,653 112,076 Net long-term capital gains or (losses)...................... 5,488,201 286,861 500,035 459,894 982,376 1,020,454 2,238,582 Nontaxable income.................................................... 93,085 1,624 9,783 17,779 21,939 19,788 22,170
Undistributed at end of year [4].................................. 53,959,127 343,705 6,067,169 5,747,881 9,746,577 10,001,199 22,052,596 Net ordinary income................................................... 2,995,670 14,982 77,978 96,591 213,610 268,494 2,324,015 Net short-term capital gains or (losses)..................... 1,895,022 54,596 30,914 65,648 106,652 148,497 1,488,716 Net long-term capital gains or (losses)...................... 48,701,134 272,022 5,918,756 5,545,944 9,311,680 9,483,503 18,169,229 Nontaxable income.................................................... 367,301 * 2,106 39,522 39,698 114,635 100,705 70,636
[1] Taken from Form 5227, Part II, line 22.[2] Taken from Form 5227, Part II, line 20.[3] Taken from Form 5227, Part II, line 21.[4] Taken from Form 5227, Part II, line 23.
Table 5.—Charitable Remainder Unitrusts: Accumulation Information, by Size of End-of-Year Book Value of Total Assets, Filing Year 2005
NOTE: Detail may not add to totals due to rounding.
Item Total
Size of end-of-year book value of total assets
* Estimate should be used with caution because of the small number of sample returns on which it is based.
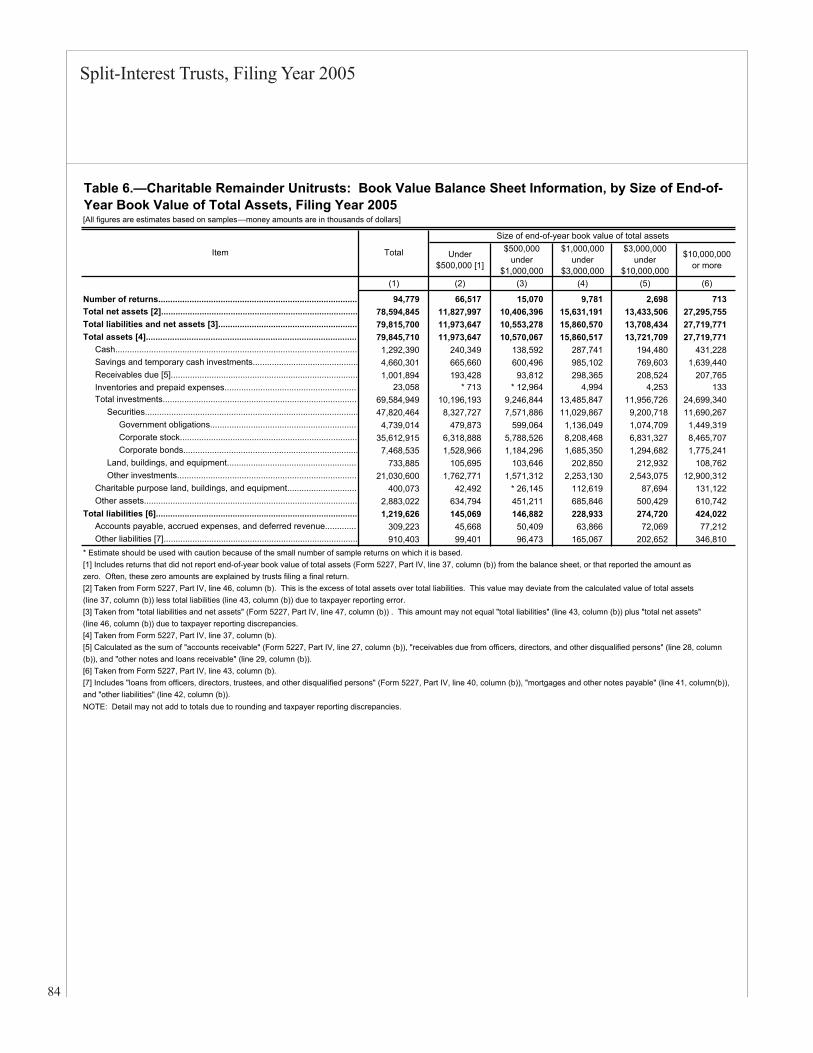
Split-Interest Trusts, Filing Year 2005
84
[All figures are estimates based on samples—money amounts are in thousands of dollars]
Under$500,000 [1]
$500,000under
$1,000,000
$1,000,000under
$3,000,000
$3,000,000under
$10,000,000
$10,000,000or more
(1) (2) (3) (4) (5) (6)
Number of returns................................................................................... 94,779 66,517 15,070 9,781 2,698 713 Total net assets [2].................................................................................. 78,594,845 11,827,997 10,406,396 15,631,191 13,433,506 27,295,755 Total liabilities and net assets [3].......................................................... 79,815,700 11,973,647 10,553,278 15,860,570 13,708,434 27,719,771 Total assets [4]......................................................................................... 79,845,710 11,973,647 10,570,067 15,860,517 13,721,709 27,719,771 Cash..................................................................................................... 1,292,390 240,349 138,592 287,741 194,480 431,228 Savings and temporary cash investments............................................ 4,660,301 665,660 600,496 985,102 769,603 1,639,440 Receivables due [5].............................................................................. 1,001,894 193,428 93,812 298,365 208,524 207,765 Inventories and prepaid expenses........................................................ 23,058 * 713 * 12,964 4,994 4,253 133 Total investments.................................................................................. 69,584,949 10,196,193 9,246,844 13,485,847 11,956,726 24,699,340 Securities......................................................................................... 47,820,464 8,327,727 7,571,886 11,029,867 9,200,718 11,690,267 Government obligations.............................................................. 4,739,014 479,873 599,064 1,136,049 1,074,709 1,449,319 Corporate stock.......................................................................... 35,612,915 6,318,888 5,788,526 8,208,468 6,831,327 8,465,707 Corporate bonds......................................................................... 7,468,535 1,528,966 1,184,296 1,685,350 1,294,682 1,775,241 Land, buildings, and equipment....................................................... 733,885 105,695 103,646 202,850 212,932 108,762 Other investments............................................................................ 21,030,600 1,762,771 1,571,312 2,253,130 2,543,075 12,900,312 Charitable purpose land, buildings, and equipment.............................. 400,073 42,492 * 26,145 112,619 87,694 131,122 Other assets......................................................................................... 2,883,022 634,794 451,211 685,846 500,429 610,742 Total liabilities [6].................................................................................... 1,219,626 145,069 146,882 228,933 274,720 424,022 Accounts payable, accrued expenses, and deferred revenue.............. 309,223 45,668 50,409 63,866 72,069 77,212 Other liabilities [7]................................................................................. 910,403 99,401 96,473 165,067 202,652 346,810 * Estimate should be used with caution because of the small number of sample returns on which it is based.[1] Includes returns that did not report end-of-year book value of total assets (Form 5227, Part IV, line 37, column (b)) from the balance sheet, or that reported the amount as zero. Often, these zero amounts are explained by trusts filing a final return. [2] Taken from Form 5227, Part IV, line 46, column (b). This is the excess of total assets over total liabilities. This value may deviate from the calculated value of total assets (line 37, column (b)) less total liabilities (line 43, column (b)) due to taxpayer reporting error.[3] Taken from "total liabilities and net assets" (Form 5227, Part IV, line 47, column (b)) . This amount may not equal "total liabilities" (line 43, column (b)) plus "total net assets" (line 46, column (b)) due to taxpayer reporting discrepancies.[4] Taken from Form 5227, Part IV, line 37, column (b).[5] Calculated as the sum of "accounts receivable" (Form 5227, Part IV, line 27, column (b)), "receivables due from officers, directors, and other disqualified persons" (line 28, column (b)), and "other notes and loans receivable" (line 29, column (b)).[6] Taken from Form 5227, Part IV, line 43, column (b).[7] Includes "loans from officers, directors, trustees, and other disqualified persons" (Form 5227, Part IV, line 40, column (b)), "mortgages and other notes payable" (line 41, column(b)), and "other liabilities" (line 42, column (b)).NOTE: Detail may not add to totals due to rounding and taxpayer reporting discrepancies.
Item Total
Size of end-of-year book value of total assets
Table 6.—Charitable Remainder Unitrusts: Book Value Balance Sheet Information, by Size of End-of-Year Book Value of Total Assets, Filing Year 2005
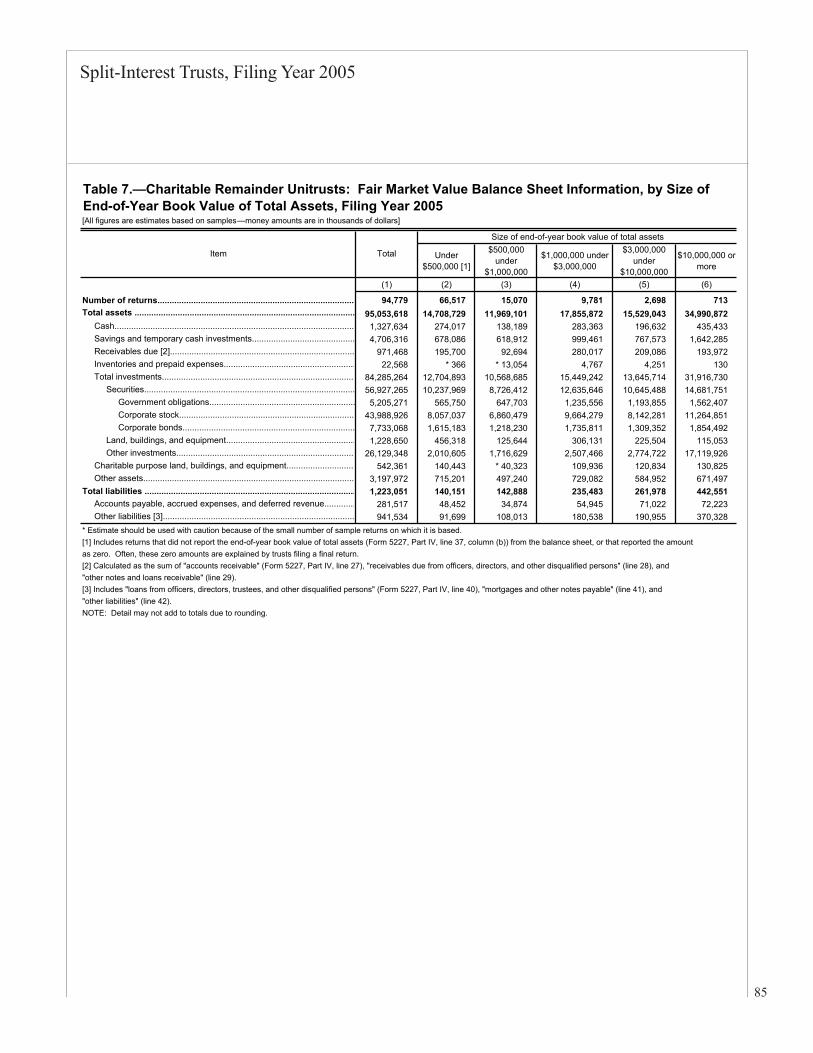
Split-Interest Trusts, Filing Year 2005
85
[All figures are estimates based on samples—money amounts are in thousands of dollars]
Under$500,000 [1]
$500,000under
$1,000,000
$1,000,000 under $3,000,000
$3,000,000under
$10,000,000
$10,000,000 or more
(1) (2) (3) (4) (5) (6)
Number of returns................................................................................... 94,779 66,517 15,070 9,781 2,698 713 Total assets ............................................................................................ 95,053,618 14,708,729 11,969,101 17,855,872 15,529,043 34,990,872 Cash.................................................................................................... 1,327,634 274,017 138,189 283,363 196,632 435,433 Savings and temporary cash investments........................................... 4,706,316 678,086 618,912 999,461 767,573 1,642,285 Receivables due [2]............................................................................. 971,468 195,700 92,694 280,017 209,086 193,972 Inventories and prepaid expenses....................................................... 22,568 * 366 * 13,054 4,767 4,251 130 Total investments................................................................................. 84,285,264 12,704,893 10,568,685 15,449,242 13,645,714 31,916,730 Securities........................................................................................ 56,927,265 10,237,969 8,726,412 12,635,646 10,645,488 14,681,751 Government obligations............................................................. 5,205,271 565,750 647,703 1,235,556 1,193,855 1,562,407 Corporate stock......................................................................... 43,988,926 8,057,037 6,860,479 9,664,279 8,142,281 11,264,851 Corporate bonds........................................................................ 7,733,068 1,615,183 1,218,230 1,735,811 1,309,352 1,854,492 Land, buildings, and equipment...................................................... 1,228,650 456,318 125,644 306,131 225,504 115,053 Other investments........................................................................... 26,129,348 2,010,605 1,716,629 2,507,466 2,774,722 17,119,926 Charitable purpose land, buildings, and equipment............................. 542,361 140,443 * 40,323 109,936 120,834 130,825 Other assets........................................................................................ 3,197,972 715,201 497,240 729,082 584,952 671,497 Total liabilities ........................................................................................ 1,223,051 140,151 142,888 235,483 261,978 442,551 Accounts payable, accrued expenses, and deferred revenue............. 281,517 48,452 34,874 54,945 71,022 72,223 Other liabilities [3]................................................................................ 941,534 91,699 108,013 180,538 190,955 370,328 * Estimate should be used with caution because of the small number of sample returns on which it is based.[1] Includes returns that did not report the end-of-year book value of total assets (Form 5227, Part IV, line 37, column (b)) from the balance sheet, or that reported the amount as zero. Often, these zero amounts are explained by trusts filing a final return.[2] Calculated as the sum of "accounts receivable" (Form 5227, Part IV, line 27), "receivables due from officers, directors, and other disqualified persons" (line 28), and "other notes and loans receivable" (line 29).[3] Includes "loans from officers, directors, trustees, and other disqualified persons" (Form 5227, Part IV, line 40), "mortgages and other notes payable" (line 41), and "other liabilities" (line 42).NOTE: Detail may not add to totals due to rounding.
Table 7.—Charitable Remainder Unitrusts: Fair Market Value Balance Sheet Information, by Size of End-of-Year Book Value of Total Assets, Filing Year 2005
Item Total
Size of end-of-year book value of total assets
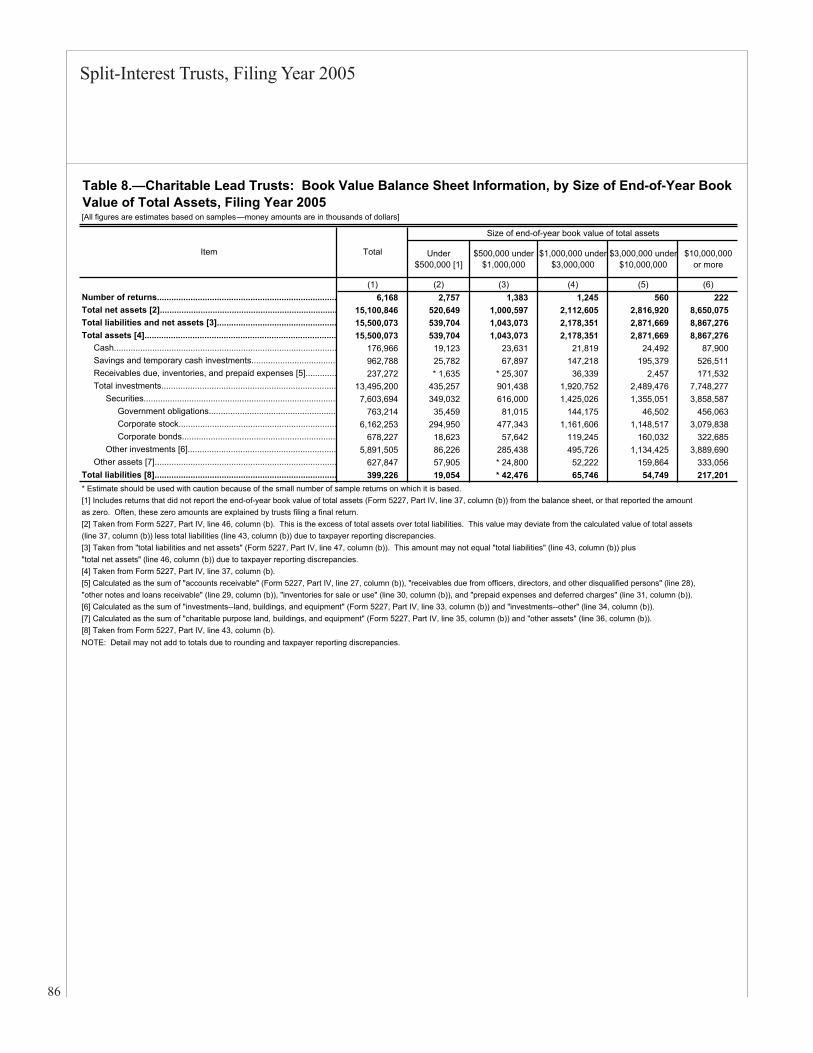
Split-Interest Trusts, Filing Year 2005
86
[All figures are estimates based on samples—money amounts are in thousands of dollars]
Under$500,000 [1]
$500,000 under $1,000,000
$1,000,000 under$3,000,000
$3,000,000 under$10,000,000
$10,000,000or more
(1) (2) (3) (4) (5) (6)Number of returns........................................................................... 6,168 2,757 1,383 1,245 560 222 Total net assets [2].......................................................................... 15,100,846 520,649 1,000,597 2,112,605 2,816,920 8,650,075 Total liabilities and net assets [3].................................................. 15,500,073 539,704 1,043,073 2,178,351 2,871,669 8,867,276 Total assets [4]................................................................................ 15,500,073 539,704 1,043,073 2,178,351 2,871,669 8,867,276 Cash............................................................................................. 176,966 19,123 23,631 21,819 24,492 87,900 Savings and temporary cash investments.................................... 962,788 25,782 67,897 147,218 195,379 526,511 Receivables due, inventories, and prepaid expenses [5]............. 237,272 * 1,635 * 25,307 36,339 2,457 171,532 Total investments......................................................................... 13,495,200 435,257 901,438 1,920,752 2,489,476 7,748,277 Securities................................................................................. 7,603,694 349,032 616,000 1,425,026 1,355,051 3,858,587 Government obligations..................................................... 763,214 35,459 81,015 144,175 46,502 456,063 Corporate stock.................................................................. 6,162,253 294,950 477,343 1,161,606 1,148,517 3,079,838 Corporate bonds................................................................. 678,227 18,623 57,642 119,245 160,032 322,685 Other investments [6].............................................................. 5,891,505 86,226 285,438 495,726 1,134,425 3,889,690 Other assets [7]............................................................................ 627,847 57,905 * 24,800 52,222 159,864 333,056 Total liabilities [8]............................................................................ 399,226 19,054 * 42,476 65,746 54,749 217,201
[1] Includes returns that did not report the end-of-year book value of total assets (Form 5227, Part IV, line 37, column (b)) from the balance sheet, or that reported the amount as zero. Often, these zero amounts are explained by trusts filing a final return.[2] Taken from Form 5227, Part IV, line 46, column (b). This is the excess of total assets over total liabilities. This value may deviate from the calculated value of total assets(line 37, column (b)) less total liabilities (line 43, column (b)) due to taxpayer reporting discrepancies.
"total net assets" (line 46, column (b)) due to taxpayer reporting discrepancies.
"other notes and loans receivable" (line 29, column (b)), "inventories for sale or use" (line 30, column (b)), and "prepaid expenses and deferred charges" (line 31, column (b)).
NOTE: Detail may not add to totals due to rounding and taxpayer reporting discrepancies.
Item Total
Size of end-of-year book value of total assets
Table 8.—Charitable Lead Trusts: Book Value Balance Sheet Information, by Size of End-of-Year Book Value of Total Assets, Filing Year 2005
* Estimate should be used with caution because of the small number of sample returns on which it is based.
[3] Taken from "total liabilities and net assets" (Form 5227, Part IV, line 47, column (b)). This amount may not equal "total liabilities" (line 43, column (b)) plus
[8] Taken from Form 5227, Part IV, line 43, column (b).
[4] Taken from Form 5227, Part IV, line 37, column (b).[5] Calculated as the sum of "accounts receivable" (Form 5227, Part IV, line 27, column (b)), "receivables due from officers, directors, and other disqualified persons" (line 28),
[6] Calculated as the sum of "investments--land, buildings, and equipment" (Form 5227, Part IV, line 33, column (b)) and "investments--other" (line 34, column (b)).[7] Calculated as the sum of "charitable purpose land, buildings, and equipment" (Form 5227, Part IV, line 35, column (b)) and "other assets" (line 36, column (b)).
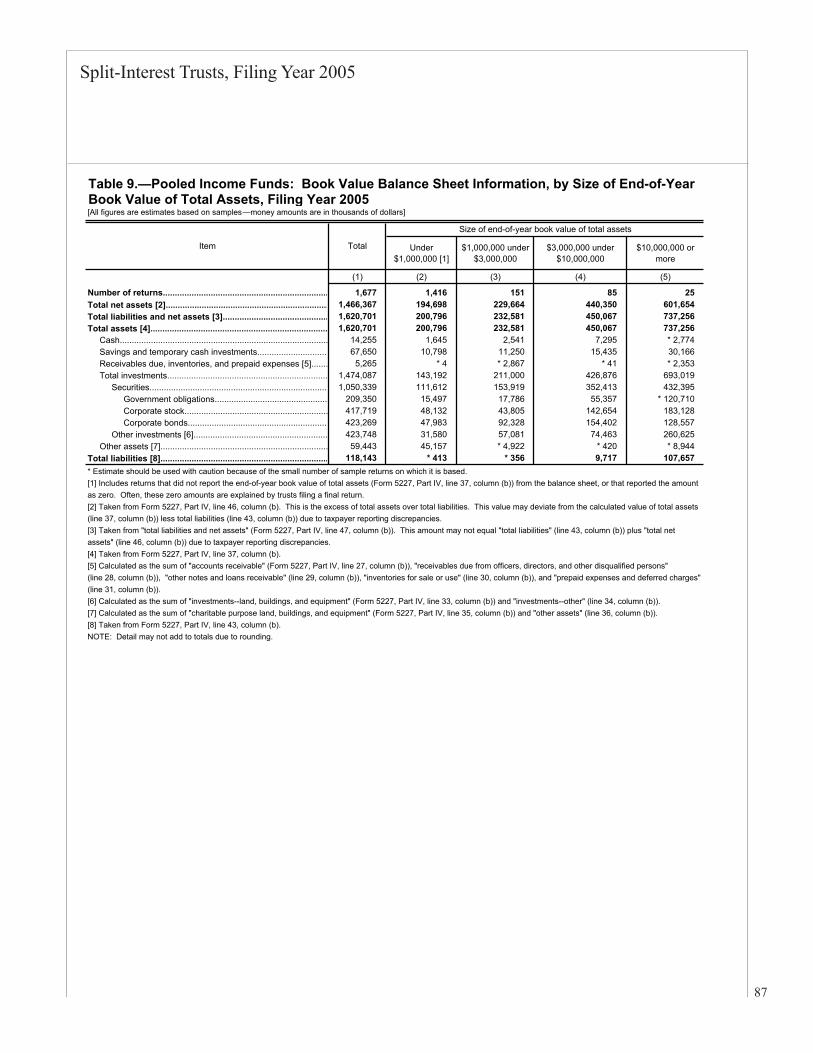
Split-Interest Trusts, Filing Year 2005
87
Book Value of Total Assets, Filing Year 2005[All figures are estimates based on samples—money amounts are in thousands of dollars]
Under$1,000,000 [1]
$1,000,000 under $3,000,000
$3,000,000 under $10,000,000
$10,000,000 or more
(1) (2) (3) (4) (5)
Number of returns..................................................................... 1,677 1,416 151 85 25 Total net assets [2].................................................................... 1,466,367 194,698 229,664 440,350 601,654 Total liabilities and net assets [3]............................................ 1,620,701 200,796 232,581 450,067 737,256 Total assets [4].......................................................................... 1,620,701 200,796 232,581 450,067 737,256 Cash....................................................................................... 14,255 1,645 2,541 7,295 * 2,774 Savings and temporary cash investments.............................. 67,650 10,798 11,250 15,435 30,166 Receivables due, inventories, and prepaid expenses [5]....... 5,265 * 4 * 2,867 * 41 * 2,353 Total investments................................................................... 1,474,087 143,192 211,000 426,876 693,019 Securities........................................................................... 1,050,339 111,612 153,919 352,413 432,395 Government obligations............................................... 209,350 15,497 17,786 55,357 * 120,710 Corporate stock............................................................ 417,719 48,132 43,805 142,654 183,128 Corporate bonds........................................................... 423,269 47,983 92,328 154,402 128,557 Other investments [6]........................................................ 423,748 31,580 57,081 74,463 260,625 Other assets [7]...................................................................... 59,443 45,157 * 4,922 * 420 * 8,944 Total liabilities [8]...................................................................... 118,143 * 413 * 356 9,717 107,657
[1] Includes returns that did not report the end-of-year book value of total assets (Form 5227, Part IV, line 37, column (b)) from the balance sheet, or that reported the amount as zero. Often, these zero amounts are explained by trusts filing a final return.[2] Taken from Form 5227, Part IV, line 46, column (b). This is the excess of total assets over total liabilities. This value may deviate from the calculated value of total assets(line 37, column (b)) less total liabilities (line 43, column (b)) due to taxpayer reporting discrepancies.
assets" (line 46, column (b)) due to taxpayer reporting discrepancies.
(line 28, column (b)), "other notes and loans receivable" (line 29, column (b)), "inventories for sale or use" (line 30, column (b)), and "prepaid expenses and deferred charges" (line 31, column (b)).
[3] Taken from "total liabilities and net assets" (Form 5227, Part IV, line 47, column (b)). This amount may not equal "total liabilities" (line 43, column (b)) plus "total net
Item Total
Size of end-of-year book value of total assets
[8] Taken from Form 5227, Part IV, line 43, column (b).NOTE: Detail may not add to totals due to rounding.
Table 9.—Pooled Income Funds: Book Value Balance Sheet Information, by Size of End-of-Year
[4] Taken from Form 5227, Part IV, line 37, column (b).[5] Calculated as the sum of "accounts receivable" (Form 5227, Part IV, line 27, column (b)), "receivables due from officers, directors, and other disqualified persons"
[6] Calculated as the sum of "investments--land, buildings, and equipment" (Form 5227, Part IV, line 33, column (b)) and "investments--other" (line 34, column (b)).[7] Calculated as the sum of "charitable purpose land, buildings, and equipment" (Form 5227, Part IV, line 35, column (b)) and "other assets" (line 36, column (b)).
* Estimate should be used with caution because of the small number of sample returns on which it is based.