spreadsheets: a tool for e-learning a case of matrices in ... · as a powerful learning tool for...
TRANSCRIPT

Abstract—Spreadsheets made their first appearance for
personal computers in 1979 in the form of VisiCalc, an
application designed to help with accounting tasks. Over the
years the application area for spreadsheets has multiplied. One
application that is becoming more pronounced is in the teaching
and learning of pupils and students. A Spreadsheet can be used
as a powerful learning tool for both primary and secondary
school pupils. Spreadsheets offer concrete ways to explore
abstract concepts in mathematics and other subjects.
Mathematical ideas are conveyed in several different ways
using pictures, colored squares, and number lines. A
spreadsheet can be a helpful tool for visual learning. Using
spreadsheets also promotes higher order thinking skills.
Spreadsheets contain a variety of formulas, which can be used
in teaching mathematics. These formulas can be generalized, so
that students can see how the outcome is changed when one of
the variables in the formula is altered. The spreadsheet tool also
promotes the development of problem solving skills and
supports "What if..." type questions. Apart from using
ready-made formulas pupils can make up their own formulas to
manipulate numbers. This paper proposes the use of Ms Excel in
the teaching and learning of Algebra in secondary schools. The
paper gives a specific example on how a topic such as matrices
can be delivered using Ms excel.
Index Terms—Algebra, education, matrices, Microsoft Excel
(Ms Excel), spreadsheets.
I. INTRODUCTION
Recent trends in Teacher education have emphasized the
importance of teaching and learning with technology rather
than learning about technology. This implies that teachers
should learn to use ICT related technology as a cognitive tool
to enhance pupil or student learning of content material other
than acquiring isolated skills in basic computation application
or merely learning a specific programming language [1]. To
promote this usage of Technology for pupils or students
conceptual development, Teachers should learn how to use
readily available software like spreadsheets as a tool for
E-learning purposes.
E-learning can be defined as the delivery of a learning,
training or education program by electronic means.
E-learning involves the use of a computer or electronic device
(e.g. a mobile phone) in some way to provide training,
educational or learning material [2].
A spreadsheet can be defined as an electronic worksheet
used to organize and manipulate numbers and display options
for what-if analysis. The basic construct of an electronic
Manuscript received September 24, 2014; revised January 23, 2015.
The authors are with the Copperbelt University, Zambia (e-mail:
spreadsheet is an array of rows and columns with automatic
update and display of results. This paradigm has been
extended with libraries of mathematical and statistical
functions, versatile graphing and charting facilities, powerful
add-ins such as Microsoft Excel’s Solver, attractive and
highly functional graphical user interfaces, and the ability to
write custom code in languages such as Microsoft’s Visual
Basic for applications [3]. Users can manipulate numbers by
using stored formulas and calculate different outcomes and
this capability makes a spreadsheet an ideal tool for the
teaching and learning of mathematics. Popular electronic
spreadsheet packages include Lotus 1-2-3, Quattro Pro, and
Ms Excel. The first electronic spreadsheet though was
VisiCalc which appeared in 1979. It was created by Dan
Bricklin and Bob Frankston for the Apple II platform. The
creators later sold the rights in VisiCalc to Lotus
Development Corporation, which developed Lotus 1-2-3 for
the IBM PC in 1982. Then came Microsoft Excel, which was
developed first for the Apple Macintosh, but which was also
the first real Microsoft Windows application [3]-[5].
The use of spreadsheets allows pupils or students to
explore solution alternative processes that go beyond
symbolic manipulations and provide students with a deeper
understanding of concepts embedded in a problem. One
unique use of spreadsheets is the ability to interactively model
and simulate mathematical situations. Mathematics teachers
can use spreadsheets to create experimental environments for
discovering mathematical relationships. These experiments
can assist pupils or students in their conceptualization of
relationships among numerical, graphical and algebraic
representations [6].
This paper particularly investigates Ms Excel as a tool for
the teaching and learning of mathematics. The paper
demonstrates how matrices can be manipulated using excel.
The rest of the paper is organized as follows: Section II
reviews literature on similar work, Section III gives the
demonstration of how excel can be used to teach matrices and
Section IV demonstrates the solving of systems of equation
using matrices in Ms excel and Section V concludes the
paper.
II. LITERATURE REVIEW
ICTs and particularly spreadsheets in teaching mathematics
has increased significantly in recent years. Spreadsheets can
be used to implement mathematical algorithms, models,
visualizations, and applications naturally and effectively
through interactive constructions and creative graphical
displays [7]. Scholars have studied the impact of integrating
ICTs in the teaching and learning of mathematics. Studies on
Nchimunya Chaamwe and Langstone Shumba
International Journal of Information and Education Technology, Vol. 6, No. 7, July 2016
570DOI: 10.7763/IJIET.2016.V6.753
Spreadsheets: A Tool for e-Learning — A Case of Matrices
in Microsoft Excel

the teaching and learning of mathematics using spreadsheets
have also been done. This section discusses and analyses
these studies as they relate to this paper.
A study was done to investigate the effect of integrating
Microsoft Excel into a high school algebra class. The results
from the study indicated a slight increase in student
achievement when Excel was used. A teacher-created final
exam and two Criterion Referenced Tests were used to
measure the level of success. One of the Criterion Referenced
Tests indicated that the variability of the students scores were
reduced considerably in the class using Excel, indicating that
possibly an interest in the course was generated and that
student’ interests were spurred by the use of the software [8].
Another study was done which looked at the learning
activity in middle school which made use of a spreadsheet to
mediate students' construction of meanings for statistical
conceptions. The study illustrated the integration of
computers in teaching and learning statistics as it brings about
a cascade of changes in curriculum materials, classroom
praxis, and students' ways of learning. The study also looked
at the impact of technological tools on teaching and learning
statistics by emphasizing how the computer lends itself to
supporting cognitive and sociocultural processes. The authors
concluded that the use of spreadsheets in the teaching of
statistical concepts enhances the understanding of these
concepts by students [9].
A further study was done that looked at the use of Excel in
the introductory course in statistics in a business school. An
attempt was made to identify how business school programs
differ, and how the use of Excel to work cases or examples
can contribute to a business statistics course that is in keeping
with the schools and the instructor's learning objectives. The
study presented some ideas for using spreadsheets that may be
appropriate in teaching statistics in the business school. The
study concluded that the use of Excel together with realistic
business examples and exercises can contribute greatly to
students understanding of both business and statistics [10].
A study was carried out study that included the
demonstration of techniques that enable educators to design
animated graphical displays in their spreadsheet constructions
in order to produce powerful classroom demonstrations to
enhance mathematical understanding. The study
demonstrated how Ms Excel can be used to create animated
and interactive graphs of functions [7].
A review that was done on the using of spreadsheets in the
learning and teaching of mathematics suggested that one way
that seems to help pupils move from a non-algebraic to an
algebraic approach is through work with spreadsheets. The
paper argued that, in using such a tool, compared to using
paper and pencil, pupils appear to be able to learn more
readily to express general mathematical relationships using
the symbolic language in the spreadsheet environment which
is a key to making progress in algebra. The review suggested
that the other teaching advantages of spreadsheets are that
pupils are likely to be relatively familiar with them as these
are used in other lessons in school and that pupils are also
likely to have access to spreadsheet software outside of school,
including at home [11].
Ref. [12] in her paper challenges mathematics teachers to
rethink the mathematics they teach and investigate
technological tools for learning mathematics, and consider
how they can support students in learning mathematics with
technology as a tool. The author suggest that mathematics
teachers must redesign their curriculum and instruction to
help students learn about the technology they will use to learn
mathematics and one such tool is a spreadsheet. Mathematics
teachers are challenged to think about scaffolding students
learning about spreadsheets while they are also learning
mathematics.
III. SOLVING MATRICES IN MS EXCEL
The main purpose of this chapter is to show how to work
with matrices in Excel and use matrices to solve linear
systems of equations
A. Matrices and Matrix Operations
This section shows how matrices can be represented in
Excel. A matrix may be thought of as a two-dimensional table.
Fig. 1 below shows how matrices A, B and C may be
represented in a spreadsheet. We will adopt a convention that
a matrix is enclosed with lines on the left and right hand sides.
Fig. 1. Examples of matrices as they are represented in Excel.
When working with matrices in Excel, special array
formulas and array functions are used. There are special rules
that apply to these functions. The reason for this is that array
functions return arrays. For example, adding two m n
matrices the result is an m n matrix. When entering the
formulas for solving matrices we must take this into account.
We do this by entering the formula for solving matrices
directly into a matrix.
B. Matrix Addition
As an example, consider the following addition of matrices.
International Journal of Information and Education Technology, Vol. 6, No. 7, July 2016
571
The reviewed research and other researches seem to agree
on one point that spreadsheets can enhance the teaching,
learning and understanding of mathematics in both primary
and secondary school. Ref. [3] argues that there is no longer a
need to question the potential for spreadsheets to enhance the
quality and experience of learning that is offered to students.
Traditional barriers (particularly the lack of facilities to use
spreadsheets in assessment contexts) need to be removed,
either by ensuring that access to computers is improved or by
changing assessment methods. Further expansion is needed of
the types of topics that can be effectively covered by
spreadsheet examples. This paper therefore will aim at
highlighting a few examples of using spreadsheets by teachers
to teach algebra and specifically matrices in class.

4 6 4 5
6 7 4 3
In order to perform this summation, Write a formula that
adds the two ranges. Write =C3:D4+G3:H4 directly. Do not
press <Enter> at this point and the spreadsheet should look
something like Fig. 2. Note that the entire range C7:D8 is
selected.
Fig. 2. Showing the addition formula and the selected range.
Then press <Ctrl> + <Shift > + <Enter> and the
spreadsheet will look something like in Fig. 3.
Fig. 3. Showing the final matrix addition answer.
C. Matrix Scalar Multiplication
We can multiply any matrix with a scalar. As an example
consider the following scalar multiplication of a matrix:
2 4
4 34 .
In order to multiply a matrix by a scalar, write =4*C3:D4.
The spreadsheet should look like Fig. 4.
Fig. 4. Showing the scalar multiplication formular and the selected range.
Then press <Ctrl> + <Shift> + <Enter> the spreadsheet
will look something like in Fig. 5.
Fig. 5. The spreadsheet showing the answer after scalar multiplication.
D. Matrix Multiplication
To perform matrix multiplication's in Excel, we must use
the function =MMULT(arg1, arg2). This function takes two
matrices as arguments and returns their product. As an
example consider the following multiplication of matrices.
3 4 5 2 2 2
2 3 3 4 3 3
3 2 2 2 2 3
.
In order to multiply the two, rite=MMULT(C3:E5,H3:J5)
directly in the spreadsheet and it will look something like Fig.
6.
Fig. 6. Showing the matrix multiplication formular and selected range.
After pressing <Ctrl> + <Shift> + <Enter> the spreadsheet
will look something like in Fig. 7.
Fig. 7. Showing the final answer for matrix multiplication.
When using the MMULT function you must make sure that
International Journal of Information and Education Technology, Vol. 6, No. 7, July 2016
572
when you multiply an m n matrix with a k h matrix, n
must equal k. If not, the result will give a #VALUE message
which means that the input is not correct. It must be taken care
that the cells where the answer will be entered is an m h
matrix.
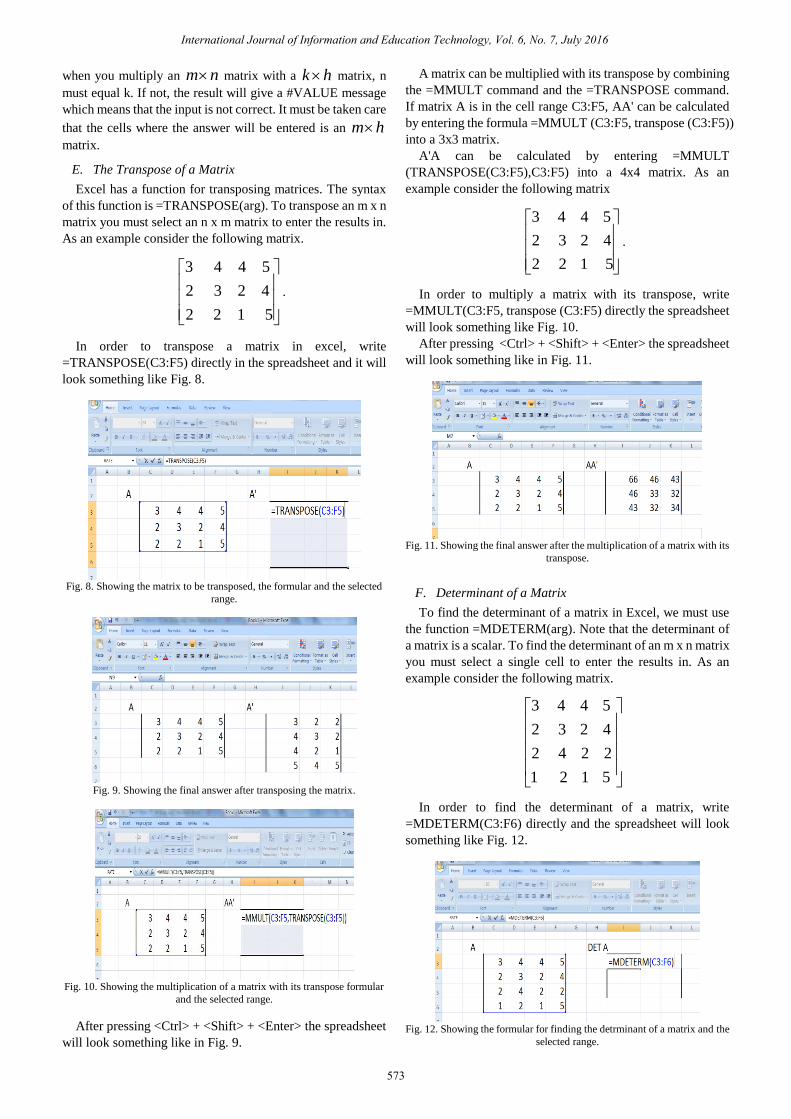
E. The Transpose of a Matrix
Excel has a function for transposing matrices. The syntax
of this function is =TRANSPOSE(arg). To transpose an m x n
matrix you must select an n x m matrix to enter the results in.
As an example consider the following matrix.
3 4 4 5
2 3 2 4
2 2 1 5
.
In order to transpose a matrix in excel, write
=TRANSPOSE(C3:F5) directly in the spreadsheet and it will
look something like Fig. 8.
Fig. 8. Showing the matrix to be transposed, the formular and the selected
range.
Fig. 9. Showing the final answer after transposing the matrix.
Fig. 10. Showing the multiplication of a matrix with its transpose formular
and the selected range.
After pressing <Ctrl> + <Shift> + <Enter> the spreadsheet
will look something like in Fig. 9.
A matrix can be multiplied with its transpose by combining
the =MMULT command and the =TRANSPOSE command.
If matrix A is in the cell range C3:F5, AA' can be calculated
by entering the formula =MMULT (C3:F5, transpose (C3:F5))
into a 3x3 matrix.
A'A can be calculated by entering =MMULT
(TRANSPOSE(C3:F5),C3:F5) into a 4x4 matrix. As an
example consider the following matrix
5 1 2 2
4 2 3 2
5 4 4 3
.
In order to multiply a matrix with its transpose, write
=MMULT(C3:F5, transpose (C3:F5) directly the spreadsheet
will look something like Fig. 10.
After pressing <Ctrl> + <Shift> + <Enter> the spreadsheet
will look something like in Fig. 11.
Fig. 11. Showing the final answer after the multiplication of a matrix with its
transpose.
F. Determinant of a Matrix
To find the determinant of a matrix in Excel, we must use
the function =MDETERM(arg). Note that the determinant of
a matrix is a scalar. To find the determinant of an m x n matrix
you must select a single cell to enter the results in. As an
example consider the following matrix.
5 1 2 1
2 2 4 2
4 2 3 2
5 4 4 3
In order to find the determinant of a matrix, write
=MDETERM(C3:F6) directly and the spreadsheet will look
something like Fig. 12.
Fig. 12. Showing the formular for finding the detrminant of a matrix and the
selected range.
International Journal of Information and Education Technology, Vol. 6, No. 7, July 2016
573
After pressing <Ctrl> + <Shift> + <Enter> the spreadsheet
will look something like in Fig. 13.
Fig. 13. Showing the derteminant of a matrix.
G. The Inverse of a Matrix
The inverse of a matrix can be found in Ms excel by using
the function =MINVERSE(arg) function. To find the inverse
of a m x n matrix, select m x n cells to enter the results in. As
an example consider the following matrix
5 1 2 1
2 2 4 2
4 2 3 2
5 4 4 3
In order to find the inverse of this matrix, write
=MINVERSE(C3:F6) directly and the spreadsheet will look
something like Fig. 14.
Fig. 14. Showing the formular for finding the invesre of a matrix and the
selected range.
After pressing <Ctrl> + <Shift> + <Enter> the spreadsheet
will look something like in Fig. 15.
Fig. 15. Showing the inverse of a matrix.
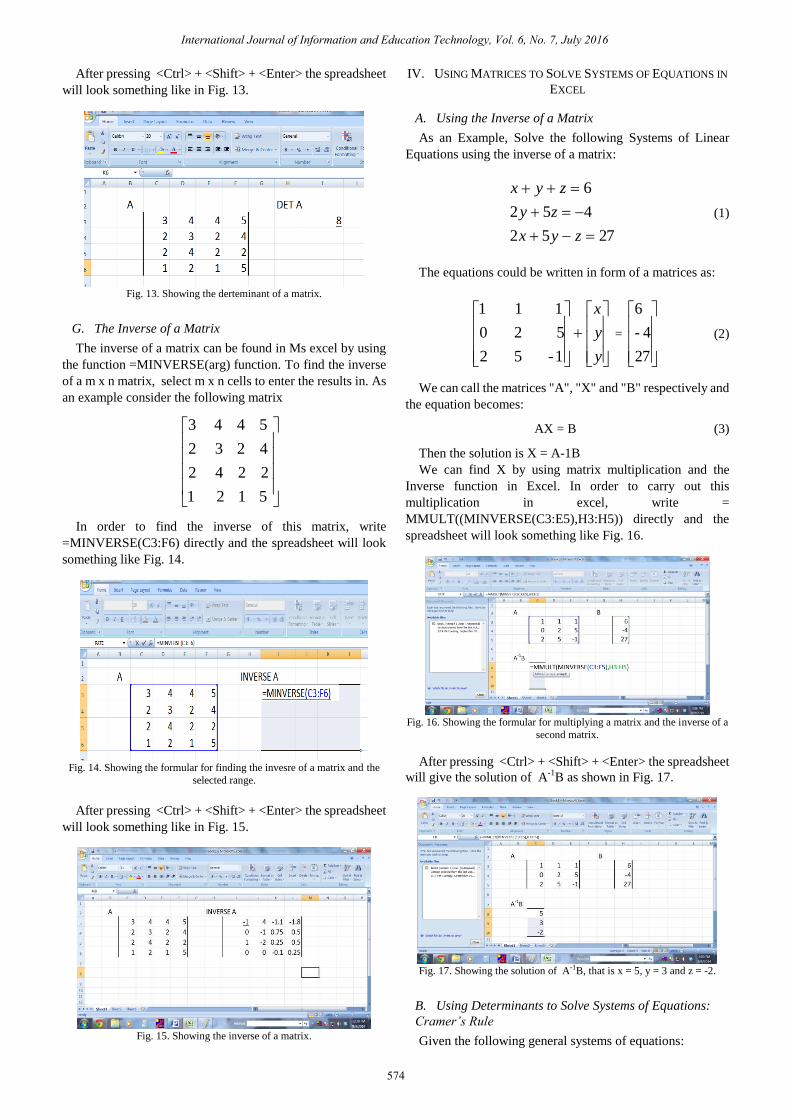
IV. USING MATRICES TO SOLVE SYSTEMS OF EQUATIONS IN
EXCEL
A. Using the Inverse of a Matrix
As an Example, Solve the following Systems of Linear
Equations using the inverse of a matrix:
2752
452
6
zyx
zy
zyx
(1)
The equations could be written in form of a matrices as:
y
y
x
1- 5 2
5 2 0
1 1 1
=
27
4-
6
(2)
We can call the matrices "A", "X" and "B" respectively and
the equation becomes:
AX = B (3)
Then the solution is X = A-1B
We can find X by using matrix multiplication and the
Inverse function in Excel. In order to carry out this
multiplication in excel, write =
MMULT((MINVERSE(C3:E5),H3:H5)) directly and the
spreadsheet will look something like Fig. 16.
Fig. 16. Showing the formular for multiplying a matrix and the inverse of a
second matrix.
After pressing <Ctrl> + <Shift> + <Enter> the spreadsheet
will give the solution of A-1
B as shown in Fig. 17.
Fig. 17. Showing the solution of A-1B, that is x = 5, y = 3 and z = -2.
B. Using Determinants to Solve Systems of Equations:
Cramer’s Rule
Given the following general systems of equations:
International Journal of Information and Education Technology, Vol. 6, No. 7, July 2016
574

International Journal of Information and Education Technology, Vol. 6, No. 7, July 2016
575
3333
2222
1111
d c b
c
c
zyxa
dzybxa
dzybxa
(4)
The solution of three linear equations in three unknowns is
given by
, ,x y z
x y z
where is the determinant of the coefficients x, y and z.
And x , y , z are determinants in which the column
of x - coefficients, y - coefficients and z - coefficients are
replaced by the column constants respectively.
We can find x, y and z by using determinant function in
Excel. In order to determine these values in excel, write
=MDDETERM(I2:K4)/MDETERM(C2:E4) directly and the
spreadsheet will look something like Fig. 18.
Fig. 18. Showing the formular for solving systems of equations using
cramers rule.
After pressing <Ctrl> + <Shift> + <Enter> the spreadsheet
will give the solutions as shown in Fig. 19.
Fig. 19. The spreadsheet showing the solution of systems of equations using
cramers rule, that is x = 5, y = 3 and z = -2.
V. CONCLUSION
A Researchers world over have agreed that the use of
technology enhances the understanding of mathematics and
other similar subjects by pupils and students primary and
Secondary schools. There are a number of software tools that
can be used for this purpose on the market. One such tool
which is usually overlooked by most educators is Microsoft
Excel. Ms Excel has an advantage over other tools in that it is
widely available and relatively easy to use. This paper
demonstrated how Ms Excel can be used to teach Matrices
and their use in solving systems of equations.
REFERENCES
[1] S. Abramovich and H. S. Drier, ―Preparing K-12 mathematics teachers
to use a spreadsheet as an instructional tool, in Proc. from the
International Meeting of the Society for Informational Technology
and Teacher Education, pp. 950-954, San Antonio Texas, 1999. [2] D. Stockley. (2003). E-learning definition and explanation. [Online].
Available: http://www.derekstockley.com.au/elearn.html [3] J. Baker and S. J. Sugden, ―Spreadsheets in education – The first 25
years,‖ Spreadsheets in Education (eJSiE), vol. 1, no. 1, 2007. [4] D. Bricklin. [Online]. Available: http://bricklin.com/
[5] Excel Trik. History of Microsoft Excel 1978–2013. [Online].
Available: http://www.exceltrick.com/others/history-of-excel/
[6] H. S. Drier, ―Teaching and learning mathematics with interactive
spreadsheets,‖ School Science and Mathematics, vol. 101, no. 4, pp.
170–179, 2001.
[7] D. Arganbright, ―Enhancing mathematical graphical displays in excel
through animation,‖ Spreadsheets in Education (eJSiE), vol. 2, no. 1,
article 8. [8] R. A. Neurath and L. J. Stephens, ―The effect of using Microsoft Excel
in a high school algebra class,‖ International Journal of Mathematical
Education in Science and Technology, vol. 37, no. 6, pp. 721-726,
2006. [9] D. Ben-Zvi, ―Toward understanding the role of technological tools in
statistical learning,‖ Mathematical Thinking and Learning, vol. 2, no.
1-2, pp. 127-155, 2000. [10] P. C. Bell, ―Teaching business statistics with Microsoft Excel,‖
Informs Transactions on Education, vol. 1, no. 1, pp. 18-26, 2000.
[11] K. Jones, ―Using spreadsheets in the teaching and learning of
mathematics: a research bibliography,‖ MicroMath, vol. 21, no. 1, pp.
30-31, 2005.
[12] M. L. Niess, ―Scaffolding math learning with spreadsheets. learning
connections—mathematics,‖ Learning & Leading with Technology,
vol. 32, no. 5, pp. 24-25, 2005.
Nchimunya Chaamwe
was born in Choma,
Zambia, in 1974.
He received his BSc in
mathematics at University of Zambia, in
2001; and
the MSc in information technology systems at the
University of Strathclyde in Glasgow Scotland, UK
in
2003; and the PhD in information and
communication engineering at Huazhong
University of Science and Technology (HUST) in
China
in
2011.
From 2003 to
2013, he worked as a lecturer
in the Copperbelt University
in Zambia. From 2007 to 2008, he worked as a assistand dean of school
with
the same affiliation. And from 2013 to now, he worked as a senior lecturer.
He has been published many articles, such as ―Mathematical analysis
(Algebra, calculus and trigonometry),‖
Nandanam Publishing House, etc.
Dr. Nhimunya Chaamwe is a member of
the Computer Society of Zambia.
He has served as a reviewer for the many
conferences and journals, such as
SAICSIT 2010, Journal of Engineering and Computer innovations
and so on.
Langstone Shumba
was born in Mberengwa
district in the Midlands province,
Zimbabwe, on
April 26,
1955.
He got the Certificate in PC maintenance
from
July to
August 2006. And from October 1987
to
February
29,
1988, he studied in University of
Zimbabw
and received the Certificate in Computer
Engineering
of Maintenance. Then, he continued
his study in Control Data Institute, in London, UK.
Later, he got his Msc in computer science engineering degree
from Vinnitsa
Polytechnic Institute (USSR).
He is
currently employed by
the Copperbelt
University (Kitwe, Zambia),
as a lecturer in the Computer Science
Department.
Mr Shumba’s research interests are in
computer science
of
computer
security, computer networking and computer architecture. He is
a member of
the Computer Society of Zimbabwe.