st. bernardine medical center - dignityhealth.org · st. bernardine medical center has undertaken a...
TRANSCRIPT
St. Bernardine Medical Center
Community Health Needs Assessment
2014
St. Bernardine Medical Center FY2014 Community Health Needs Assessment Page 2
Contents
Introduction .................................................................................................................................................. 6
Background and Purpose ................................................................................................................. 6
Service Area ........................................................................................................................................ 6
Map ....................................................................................................................................................... 7
Consultant ........................................................................................................................................... 8
Methods ....................................................................................................................................................... 9
Secondary Data Collection ............................................................................................................... 9
Primary Data Collection ..................................................................................................................... 9
Identification and Prioritization of Significant Health Needs .............................................................. 10
Potential Measures and Resources to Address Significant Needs .......................................... 10
Priority Health Needs ....................................................................................................................... 12
Community Profile .................................................................................................................................... 14
Population .......................................................................................................................................... 14
Population by Age ............................................................................................................................ 14
Race/Ethnicity ................................................................................................................................... 17
Unemployment .................................................................................................................................. 19
Poverty ............................................................................................................................................... 20
Households and Household Income ............................................................................................. 23
Housing .............................................................................................................................................. 24
Homelessness .................................................................................................................................. 27
Language ........................................................................................................................................... 28
Linguistic Isolation ............................................................................................................................ 29
Education ........................................................................................................................................... 30
Crime and Community Safety ........................................................................................................ 30
School Safety .................................................................................................................................... 31
Gang Involvement ............................................................................................................................ 32
Birth Indicators .......................................................................................................................................... 33
Births .................................................................................................................................................. 33
Teen Births ........................................................................................................................................ 33
Prenatal Care .................................................................................................................................... 34
Low Birth Weight .............................................................................................................................. 35

St. Bernardine Medical Center FY2014 Community Health Needs Assessment Page 3
Infant Mortality .................................................................................................................................. 36
Breastfeeding .................................................................................................................................... 37
Leading Causes of Death ....................................................................................................................... 39
Leading Causes of Death ............................................................................................................... 39
Heart Disease Mortality ................................................................................................................... 40
Cancer Mortality ............................................................................................................................... 41
Chronic Lower Respiratory Disease .............................................................................................. 42
Unintentional Injury Mortality .......................................................................................................... 44
Diabetes Mortality ............................................................................................................................. 45
Access to Care ......................................................................................................................................... 46
Health Insurance .............................................................................................................................. 46
Eligibility of Uninsured ..................................................................................................................... 47
Usual Source of Care ...................................................................................................................... 47
Use of the Emergency Room ......................................................................................................... 47
Delayed Medical Care ..................................................................................................................... 48
Dental Care ....................................................................................................................................... 48
Access to Primary Care Community Clinics................................................................................. 49
Access to Social Services ............................................................................................................... 50
Chronic Disease ....................................................................................................................................... 51
Chronic Diseases ............................................................................................................................. 51
Adult Asthma ..................................................................................................................................... 51
Pediatric Asthma .............................................................................................................................. 51
Diabetes ............................................................................................................................................. 52
Cancer ................................................................................................................................................ 53
Communicable Disease .......................................................................................................................... 55
Tuberculosis ...................................................................................................................................... 55
HIV/AIDS ........................................................................................................................................... 55
Sexually Transmitted Diseases ...................................................................................................... 55
Health Behaviors ...................................................................................................................................... 56
Childhood Immunizations ................................................................................................................ 56
Preventive Practices ........................................................................................................................ 56
Overweight and Obesity .................................................................................................................. 57

St. Bernardine Medical Center FY2014 Community Health Needs Assessment Page 4
Physical Activity ................................................................................................................................ 58
Smoking ............................................................................................................................................. 58
Social Issues ............................................................................................................................................. 60
Fast Food Consumption .................................................................................................................. 60
Soda Consumption ........................................................................................................................... 60
Fresh Fruits and Vegetables .......................................................................................................... 60
Mental Health .................................................................................................................................... 61
Alcohol Use ....................................................................................................................................... 61
School and Student Characteristics ...................................................................................................... 62
School Enrollment ............................................................................................................................ 62
Student Race/Ethnicity .................................................................................................................... 62
Free and Reduced Price Meal Program ....................................................................................... 62
English Learners ............................................................................................................................... 63
Student Proficiency .......................................................................................................................... 63
High School Graduation and College Readiness ........................................................................ 63
Key Stakeholder Interviews .................................................................................................................... 64
Focus Groups ........................................................................................................................................... 84
Attachment 1. CNI Scores by Zip Code ............................................................................................... 94
Attachment 2. Benchmark Comparisons ............................................................................................. 95
Attachment 3. Key Stakeholder Interviewees ..................................................................................... 96
Attachment 4. Focus Group Participants ............................................................................................. 97
Attachment 5. CBIC Member Roster .................................................................................................... 98

St. Bernardine Medical Center FY2014 Community Health Needs Assessment Page 5
St. Bernardine Medical Center FY2014 Community Health Needs Assessment Page 6
Introduction
Background and Purpose
St. Bernardine Medical Center (SBMC) is a 463-bed, nonprofit hospital that serves San
Bernardino County, California. The hospital is a member of Dignity Health, the fifth
largest hospital provider in the nation and the largest hospital system in California. We
have a culture based on a strong set of core values, driven by a mission of service, and
expressed through compassion and care of body, mind and spirit.
St. Bernardine Medical Center has undertaken a Community Health Needs Assessment
as required by California State Senate Bill 697. As well, the passage of the Patient
Protection and Affordable Care Act requires tax exempt hospitals to conduct Community
Health Needs Assessments and develop Implementation Strategies every three years.
This Community Health Needs Assessment was carried out in partnership with
Community Hospital of San Bernardino, a sister hospital in Dignity Health Inland Empire
service area.
The Community Health Needs Assessment is a tool used by SBMC to determine its
community benefit plan, which outlines how it will give back to the community in the
form of health care and other community services to address unmet community health
needs. This assessment incorporates components of primary data collection and
secondary data analysis that focus on the health and social needs of the service area.
Service Area
St. Bernardine Medical Center is located at 2101 N. Waterman Avenue, San
Bernardino, CA 92404. The service area encompasses 27 zip codes representing 15
cities.
Banning 92220 Redlands 92373
Beaumont 92223 Redlands 92374
Bloomington 92316 Rialto 92376
Colton 92324 Rialto 92377
Crestline 92325 San Bernardino 92401
Fontana 92335 San Bernardino 92404
Fontana 92336 San Bernardino 92405
Fontana 92337 San Bernardino 92407
Hemet 92543 San Bernardino 92408
Hemet 92544 San Bernardino 92410
Hemet 92545 San Bernardino 92411
Hesperia 92345 Victorville 92392
Highland 92346 Yucaipa 92399
Rancho Cucamonga 91730
St. Bernardine Medical Center FY2014 Community Health Needs Assessment Page 7
SBMC‟s Decision Support Department tracks zip codes of origin for all patient
admissions and includes all who received care without regard to insurance coverage or
eligibility for financial assistance. The service area was determined from the zip codes
that reflect 80% of patient admissions.
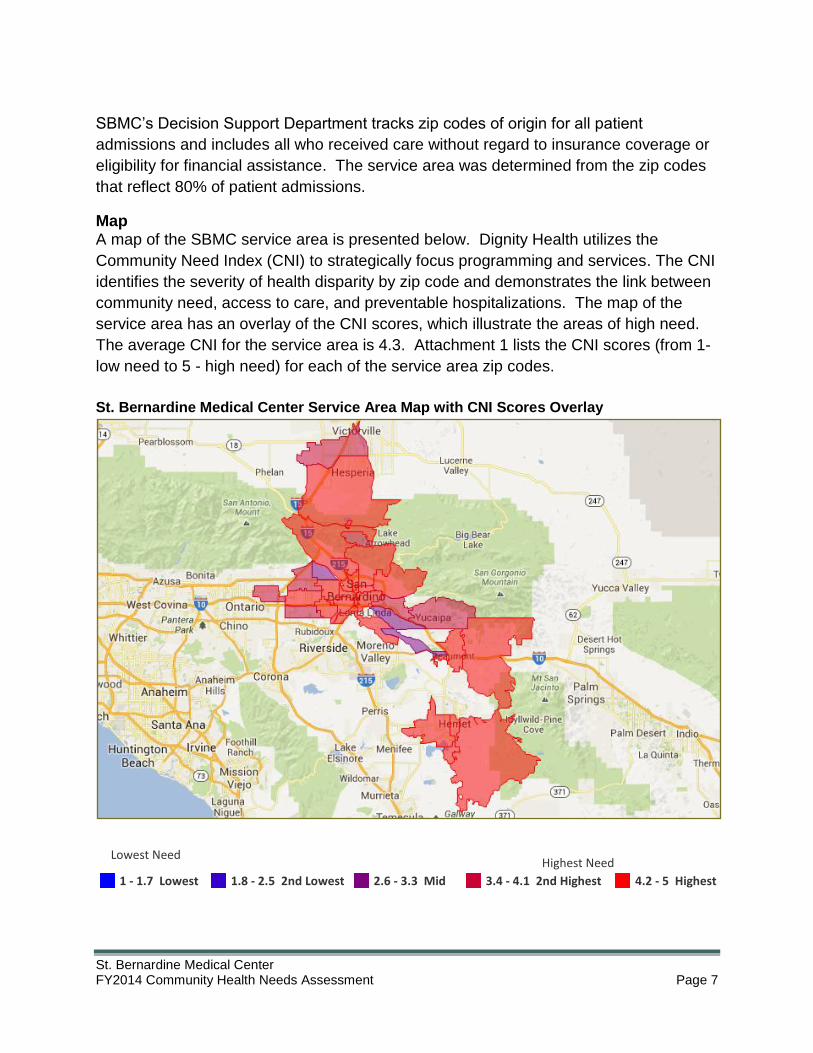
Map A map of the SBMC service area is presented below. Dignity Health utilizes the
Community Need Index (CNI) to strategically focus programming and services. The CNI
identifies the severity of health disparity by zip code and demonstrates the link between
community need, access to care, and preventable hospitalizations. The map of the
service area has an overlay of the CNI scores, which illustrate the areas of high need.
The average CNI for the service area is 4.3. Attachment 1 lists the CNI scores (from 1-
low need to 5 - high need) for each of the service area zip codes.
St. Bernardine Medical Center Service Area Map with CNI Scores Overlay
Lowest Need
Highest Need
1 - 1.7 Lowest
1.8 - 2.5 2nd Lowest
2.6 - 3.3 Mid
3.4 - 4.1 2nd Highest
4.2 - 5 Highest
St. Bernardine Medical Center FY2014 Community Health Needs Assessment Page 8
Consultant
Melissa Biel of Biel Consulting, Inc. conducted the Community Health Needs
Assessment. She was joined by Deborah Silver, MS. Biel Consulting, Inc. is an
independent consulting firm that works with hospitals, clinics and community-based
nonprofit organizations. Dr. Biel and Ms. Silver have extensive experience conducting
hospital Community Health Needs Assessments and working with hospitals on
developing, implementing, and evaluating community benefit programs.
www.bielconsulting.com
St. Bernardine Medical Center FY2014 Community Health Needs Assessment Page 9
Methods Secondary Data Collection
Secondary data were collected from a variety of local, county, and state sources to
present a community profile, birth indicators, leading causes of death, access to care,
chronic disease, communicable disease, health behaviors, social issues, and school
and student characteristics. When available, these data sets are presented in the
context of San Bernardino County and California, framing the scope of an issue as it
relates to the broader community.
Analyses were conducted at the most local level possible for the Hospital primary
service area, given the availability of the data. For example, demographic data, birth
and death data are based on zip codes. Economic indicators and homelessness data
are available by city. Other data are only available by county. The report includes
benchmark comparison data, comparing St. Bernardine Medical Center community data
findings with Healthy People 2020 objectives (Attachment 2).
Primary Data Collection
Targeted interviews were used to gather information and opinions from persons who
represent the broad interests of the community served by the Hospital. Twenty
interviews were completed during February - March, 2014. Community stakeholders,
identified by the Community Benefit Initiative Committee, were contacted and asked to
participate in the needs assessment. Interview participants included leaders and
representatives of medically underserved, low-income, and minority populations, as well
as the local health department that has “current data or information relevant to the
health needs of the community served by the hospital facility,” per IRS requirements.
The interviews took into account input from a broad range of persons located in or
serving its community including, health care consumers, nonprofit and community-
based organizations, academic experts, local government officials, local school districts,
health care providers and community health centers. A list of the stakeholder interview
respondents, including their titles and organizations can be found in Attachment 3.
Additionally, six focus groups were conducted. Participants include members of
medically underserved populations, health care consumers, nonprofit and community-
based organizations, and persons representing the broad interests of the community.
Fifty-four people participated in the focus groups. Two of the focus groups were
conducted in Spanish, utilizing a bilingual interpreter. Focus group participants were
provided with gift cards as a thank you for their input. Attachment 4 lists the focus group
participants who represent medically underserved, low-income and minority populations
in the service area. This report presents a detailed narrative that examines each of the
data sets, presents key needs and opportunities for action.
St. Bernardine Medical Center FY2014 Community Health Needs Assessment Page 10
Identification and Prioritization of Significant Health Needs
Based on the results of the primary and secondary data collection, significant health
needs were identified. Each health need was confirmed by more than one indicator or
data source (i.e., the health need was suggested by more than one source of secondary
or primary data). In addition, the health needs were based on the size of the problem
(relative portion of population afflicted by the problem); or the seriousness of the
problem (impact at individual, family, and community levels). To determine size or
seriousness of a problem, the health needs identified in the secondary data were
measured against benchmark data, specifically county or state rates or Healthy People
2020 objectives. Indicators related to the health needs that performed poorly against
these benchmarks were considered to have met the size or seriousness criteria.
Additionally, primary data sources were asked to identify community and health issues
based on the perceived size or seriousness of a problem.
The identified significant health needs included:
Access to care
Alcohol/drugs/tobacco
Chronic diseases (asthma, cancer, cardiovascular disease, diabetes)
Community growth and enrichment (safety, homelessness, education,
economic development)
Dental health
Mental health
Overweight/obesity (healthy eating and physical activity)
Preventive health care (screenings, immunizations)
Potential Measures and Resources to Address Significant Needs
A description of potential measures and resources to address the significant health
needs, which were identified through the CHNA by the interview and focus group
participants, follows.
Significant Health Needs Potential Measures Community Resources
Access to Health Care Population with health insurance coverage.
Population with a usual source of primary care.
Reduced use of ER for routine care.
Reduced barriers to accessing care or delaying access to care.
Community Hospital of San Bernardino, Arrowhead Regional Medical Center, Kaiser Permanente Fontana, Loma Linda University Medical Center, County Public Health Clinics, H Street Clinic, SACH Clinics, La Salle, El Sol Neighborhood Educational Center, Al-Shifa Clinic, Whitney Young Family Health Clinic, Buddhist Tzu Chi Free Medical Clinic, Latino

St. Bernardine Medical Center FY2014 Community Health Needs Assessment Page 11
Health Collaborative, Healthy San Bernardino, Community Clinic Association of San Bernardino County, VA, Inland Family Community Health Center D Street Clinic, WIC, Metropolitan Family Medical Clinics
Alcohol/Drugs/Tobacco Smoking incidence.
Binge drinking incidence.
Drug use incidence.
Chronic disease incidence.
Death rates.
County Department of Public Health, American Lung Association, American Heart Association, Arrowhead Regional Medical Center, VA, County Department of Behavioral Health, Salvation Army, Catholic Charities
Chronic Disease (Asthma, Cancer, Cardiovascular Disease, Diabetes)
Incidence rates.
Hospitalization rates.
Use of the ER.
Death rates.
Inland Empire Heart & Vascular Institute at St. Bernardine Medical Center, Community Hospital of San Bernardino, Arrowhead Regional Medical Center, Kaiser Permanente Fontana, Loma Linda University Medical Center, County Public Health Clinics, H Street Clinic, El Sol, SACH Clinics, American Heart Association, American Diabetes Association, Al-Shifa Clinic, Whitney Young Family Health Clinic, Buddhist Tzu Chi Free Medical Clinic, Inland Empire Asthma Coalition, Inland Family Community Health Center D Street Clinic, American Lung Association
Community Growth and Enrichment (Safety, Homelessness, Education, Economic Development)
Unemployment rates.
High school graduation rates.
Rates of homelessness.
Crime rates.
Perceptions of safety among area residents.
Access to affordable housing.
School districts, police departments, CSRI, Boys & Girls Club, Boy Scouts, Girl Scouts, Rim Family Services, Young Visionaries, Department of Public Health, San Bernardino Guns and Drugs Task Force, Healthy San Bernardino, Time for Change Foundation, Mil Mujeres, Catholic Charities, Rialto Community Center, Red Cross, Salvation Army, Goodwill Industries, Mary‟s Mercy Center, Option House, Office of Homeless Services Department of Behavioral Health, U.S. Veterans Initiative, Restoration House of Refuge, Operation Grace, Turrill Transitional Assistance Program
Dental Health Population with insurance coverage.
Reduced barriers to
Loma Linda University School of Dentistry, Inland Family Community Health Center D Street Clinic, Dr.

St. Bernardine Medical Center FY2014 Community Health Needs Assessment Page 12
accessing dental care. Earl R. Crane Children‟s Dental Center, Whitney Young Family Health Clinic, SAC Clinics (Norton, Arrowhead, Frazee), New Hope Free Clinic
Mental Health Population with insurance coverage.
Reduced barriers to accessing mental health care.
County Department of Behavioral Health, Salvation Army, Catholic Charities, San Bernardino Sexual Assault Services, Native American Resource Center, VA, Inland Family Community Health Center D Street Clinic, Phoenix Clinic, Arrowhead Regional Medical Center
Overweight and Obesity
Healthy Eating
Physical Activity
Access to healthy foods.
Body Mass Index (BMI).
Access to open spaces and safe places for exercise.
Increase in physical activity among residents.
El Sol Promotoras, Latino Health Collaborative, Catholic Charities, St. Catherine of Siena Catholic Church, H Street Clinic, Al-Shifa Clinic, American Heart Association, WIC, Partners for Health, Healthy San Bernardino, Nutrition Network, El Sol Neighborhood Center, Credible Edible Community Garden, YMCA, Arrowhead Regional Medical Center
Preventive Health Care Population with insurance coverage.
Compliance with recommended prevention screenings, vaccines.
Community Hospital of San Bernardino, Arrowhead Regional Medical Center, Kaiser Permanente Fontana, Loma Linda University Medical Center, County Public Health Clinics, H Street Clinic, La Salle, El Sol Neighborhood Educational Center, Department of Public Health, SACH Clinics, Al-Shifa Clinic, Inland Family Community Health Center D Street Clinic
Priority Health Needs
The Community Benefit Initiative Committee (CBIC) is designated with oversight of and
decision making on community benefit issues. The Committee is responsible for
developing policies and programs that address the identified disproportionate unmet
health needs of the poor and disenfranchised in the Inland Empire Service Area. The
Committee provides oversight in the development and implementation of the triennial
Community Health Needs Assessment and annual Community Benefit Report and
Implementation Strategy, as well as continuing oversight and direction to the Inland
Empire Service Area‟s community benefit programs and projects. Membership on the
committee includes members of the Hospital Board, Vice President of Mission
Integration, key staff from St. Bernardine Medical Center and Community Hospital of
San Bernardino as well as community stakeholders (Attachment 5).

St. Bernardine Medical Center FY2014 Community Health Needs Assessment Page 13
Priority Setting Process
On April 9, 2014 the Community Benefit Initiative Committee convened to review the
significant health needs identified in the Community Health Needs Assessment and to
establish the process and criteria to prioritize the health needs. Those in attendance
had current data or other information relevant to the health needs of the community
served by the hospital.
The following criteria were used to prioritize the significant health needs:
Size of the problem – the relative portion of population afflicted by the problem.
Existing infrastructure – hospital has programs, systems, staff and support
resources in place to address the issue.
Ongoing investment - existing resources are committed to the issue. Staff time
and financial resources for this issue are counted as part of our community
benefit effort.
Focus area – hospital has acknowledged competencies and expertise to address
the issue and the issue fits with the organizational mission.
Each of the criteria was ranked as low, medium or high for each of the significant health
needs. Application of the criteria resulted in the following prioritization of the significant
health needs:
1. Chronic diseases (asthma, cancer, cardiovascular disease, diabetes)
2. Access to care
3. Mental health
4. Overweight/Obesity
5. Preventive health care
6. Community growth and enrichment (safety, homelessness, education, economic
development)
7. Alcohol/drugs/tobacco
8. Dental health

St. Bernardine Medical Center FY2014 Community Health Needs Assessment Page 14
Community Profile
Population
At the time of the 2000 Census, the population for the SBMC service area was
1,038,844. The population in the SBMC service area increased to 1,231,262 in 2010,
an increase of 18.5%. Beaumont saw the largest growth, with an increase of 146% in
their population. Victorville lost 13.2% of their population.
Population, per Census
Geographic Area Zip Code 2000 2010 % Change 2000 - 2010
Banning 92220 25,848 31,638 22.4%
Beaumont 92223 17,716 43,605 146.1%
Bloomington 92316 25,987 30,830 18.6%
Colton 92324 52,198 56,505 8.3%
Crestline 92325 10,477 9,391 -10.4%
Fontana 92335 82,612 95,397 15.5%
Fontana 92336 54,585 88,419 62.0%
Fontana 92337 29,845 37,849 26.8%
Hemet 92543 29,674 33,555 13.1%
Hemet 92544 39,254 44,734 14.0%
Hemet 92545 25,687 39,457 53.6%
Hesperia 92345 68,501 78,715 14.9%
Highland 92346 48,227 54,923 13.9%
Rancho Cucamonga 91730 51,969 66,925 28.8%
Redlands 92373 31,228 33,423 7.0%
Redlands 92374 36,658 40,267 9.8%
Rialto 92376 75,875 81,516 7.4%
Rialto 92377 18,499 19,989 8.1%
San Bernardino 92401 1,768 1,932 9.3%
San Bernardino 92404 53,634 58,271 8.6%
San Bernardino 92405 24,637 28,873 17.2%
San Bernardino 92407 49,349 56,689 14.9%
San Bernardino 92408 12,138 15,271 25.8%
San Bernardino 92410 44,540 49,410 10.9%
San Bernardino 92411 23,144 26,214 13.3%
Victorville 92392 63,228 54,858 -13.2%
Yucaipa 92399 41,566 52,606 26.6%
SBMC Service Area 1,038,844 1,231,262 18.5%
San Bernardino County 1,709,434 2,035,210 19.1% Source: U.S. 2000 and 2010 Census
Population by Age Children and youth, ages 0-19, make up one-third (33.7%) of the population; 34.5% are
20-44 years of age; 22% are 45-64; and 9.7% of the population are seniors, 65 years of
age and older. The service area has a higher percentage of children and youth than
found in the county and the state.

St. Bernardine Medical Center FY2014 Community Health Needs Assessment Page 15
Population by Age
SBMC Service Area San Bernardino County California
Number Percent Number Percent Number Percent
Age 0-4 100,234 8.1% 158,790 7.8% 2,531,333 6.8%
Age 5-19 314,794 25.7% 505,787 24.9% 7,920,709 21.3%
Age 20-24 94,954 7.7% 159,908 7.9% 2,765,949 7.4%
Age 25-44 330,382 26.8% 555,040 27.2% 10,500,587 28.2%
Age 45-64 271,228 22.0% 474,337 23.3% 9,288,864 24.9%
Age 65+ 119,670 9.7% 181,348 8.9% 4,246,514 11.4%
Total 1,231,262 100% 2,035,210 100% 37,253,956 100%
Source: U.S. 2010 Census
Comparing the age of the population from 2000 to 2010, there was a slight decrease in
the percentage of young children, ages 0-4, youth 5-19, and seniors, age 65 and older.
The adults population, ages 20-64, increased from 2000 to 2010.
Population of Service Area, by Age, Percent of the Total Population 2000 / 2010 Comparison
2000 2010
Age 0-4 8.6% 8.1%
Age 5-19 27.4% 25.6%
Age 20-64 53.4% 56.6%
Age 65+ 10.6% 9.7%
Total 100% 100% Source: U.S. 2000 and 2010 Census
When children and youth are examined by area, San Bernardino holds the communities
with the largest proportions of youth in the service area, with 36.9% in 92410 and 35.6%
in 92411. Redlands 92373 (21.1%) and Crestline (22.1%) have the lowest percentages
of youth in the service area.

St. Bernardine Medical Center FY2014 Community Health Needs Assessment Page 16
Children and Youth, 0 to 17, as a Percent of Population
Geographic Area Zip Code Percent of Youth
Banning 92220 23.1%
Beaumont 92223 28.2%
Bloomington 92316 32.8%
Colton 92324 31.7%
Crestline 92325 22.1%
Fontana 92335 34.4%
Fontana 92336 32.0%
Fontana 92337 32.8%
Hemet 92543 26.9%
Hemet 92544 27.0%
Hemet 92545 24.4%
Hesperia 92345 31.4%
Highland 92346 28.2%
Rancho Cucamonga 91730 25.2%
Redlands 92373 21.1%
Redlands 92374 25.8%
Rialto 92376 33.8%
Rialto 92377 29.1%
San Bernardino 92401 33.3%
San Bernardino 92404 32.3%
San Bernardino 92405 33.0%
San Bernardino 92407 30.1%
San Bernardino 92408 28.1%
San Bernardino 92410 36.9%
San Bernardino 92411 35.6%
Victorville 92392 33.6%
Yucaipa 92399 26.0%
SBMC Service Area 30.2%
San Bernardino County 29.2%
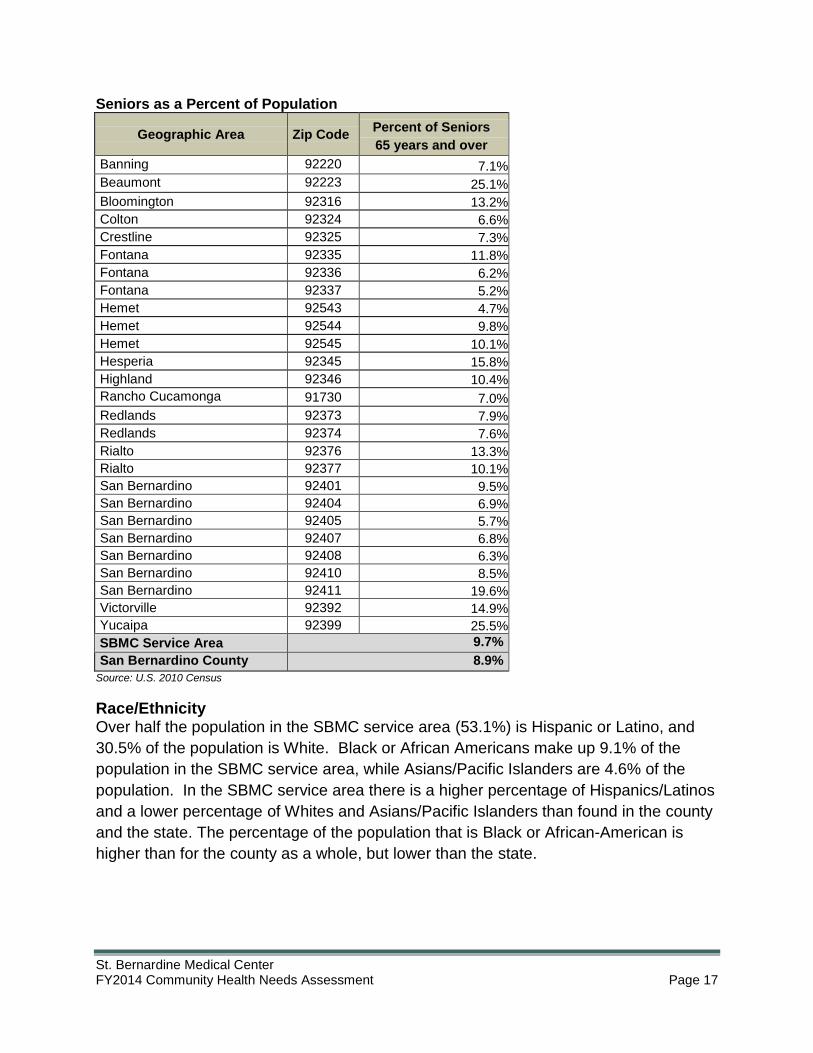
Source: U.S. 2010 Census The percentage of seniors in the service area is higher than found in the county. Hemet
92545 has the highest concentration of seniors in the area, with 25.5%, while Banning
has 25.1%. Fontana 92336 (5.2%) and 92337 (4.7%) have the smallest percentage of
seniors.
St. Bernardine Medical Center FY2014 Community Health Needs Assessment Page 17
Seniors as a Percent of Population
Geographic Area Zip Code Percent of Seniors
65 years and over
Banning 92220 7.1%
Beaumont 92223 25.1%
Bloomington 92316 13.2%
Colton 92324 6.6%
Crestline 92325 7.3%
Fontana 92335 11.8%
Fontana 92336 6.2%
Fontana 92337 5.2%
Hemet 92543 4.7%
Hemet 92544 9.8%
Hemet 92545 10.1%
Hesperia 92345 15.8%
Highland 92346 10.4%
Rancho Cucamonga 91730 7.0%
Redlands 92373 7.9%
Redlands 92374 7.6%
Rialto 92376 13.3%
Rialto 92377 10.1%
San Bernardino 92401 9.5%
San Bernardino 92404 6.9%
San Bernardino 92405 5.7%
San Bernardino 92407 6.8%
San Bernardino 92408 6.3%
San Bernardino 92410 8.5%
San Bernardino 92411 19.6%
Victorville 92392 14.9%
Yucaipa 92399 25.5%
SBMC Service Area 9.7%
San Bernardino County 8.9%
Source: U.S. 2010 Census
Race/Ethnicity Over half the population in the SBMC service area (53.1%) is Hispanic or Latino, and
30.5% of the population is White. Black or African Americans make up 9.1% of the
population in the SBMC service area, while Asians/Pacific Islanders are 4.6% of the
population. In the SBMC service area there is a higher percentage of Hispanics/Latinos
and a lower percentage of Whites and Asians/Pacific Islanders than found in the county
and the state. The percentage of the population that is Black or African-American is
higher than for the county as a whole, but lower than the state.

St. Bernardine Medical Center FY2014 Community Health Needs Assessment Page 18
Population by Race and Ethnicity Race/Ethnicity SBMC Service Area San Bernardino County California
Hispanic or Latino 53.1% 49.2% 37.6%
White 30.5% 33.3% 40.1%
Black or African American 9.1% 8.4% 5.8%
Asian or Pacific Islander 4.6% 6.4% 13.2%
American Indian / Alaskan 0.5% 0.4% 0.4%
Other Race/Multiracial 2.2% 2.3% 2.9% Source: U.S. 2010 Census
When race and ethnicity are examined by place, areas with high percentages of
Hispanics/Latinos are Bloomington, Colton, Rialto, Fontana, and San Bernardino.
Fontana 92335 has a population that is 81.7% Hispanic/Latino. In Redlands, 19.5% of
the population is Hispanic/Latino, and in Crestline only 16.8% of the population is
Hispanic/Latino.
Crestline (76.9%), Yucaipa (66.1%) and Redlands 92373 (64.2%) have the largest
percentage of Whites; San Bernardino 92410 and 92411 the lowest (9.6% and 3.5%,
respectively). San Bernardino 92401 and Rialto 92377 have the highest percentage of
Blacks/African Americans (21.3% and 20.4%), and San Bernardino 92408 and Fontana
92336 have the highest percentages of Asians/Pacific Islanders (15.1% and 10.5%).
Banning has the highest percentage of Native Americans (2.7%).

St. Bernardine Medical Center FY2014 Community Health Needs Assessment Page 19
Racial/Ethnic Distribution by Place
Geographic Area Zip
Code Hispanic
Latino White
Black/ African
American
Asian/ Pacific
Islander
American Indian
Other
Banning 92220 39.9% 43.5% 6.5% 5.1% 2.7% 2.3%
Beaumont 92223 37.4% 47.5% 5.1% 6.7% 0.8% 2.5%
Bloomington 92316 78.8% 14.4% 3.9% 1.6% 0.3% 1.0%
Colton 92324 70.7% 14.0% 8.4% 4.8% 0.2% 1.9%
Crestline 92325 16.8% 76.9% 0.9% 0.9% 1.0% 3.5%
Fontana 92335 81.7% 11.4% 4.2% 1.8% 0.2% 0.7%
Fontana 92336 55.2% 19.2% 12.5% 10.5% 0.2% 2.4%
Fontana 92337 70.2% 11.6% 9.9% 6.5% 0.3% 1.5%
Hemet 92543 42.0% 47.2% 5.8% 1.8% 0.7% 2.5%
Hemet 92544 32.9% 58.5% 3.5% 1.9% 1.0% 2.2%
Hemet 92545 30.9% 55.5% 5.8% 4.3% 0.6% 2.9%
Hesperia 92345 48.0% 43.0% 4.8% 1.7% 0.5% 2.0%
Highland 92346 40.6% 37.3% 11.2% 7.5% 0.5% 2.9%
Rancho Cucamonga 91730 41.2% 35.3% 10.7% 9.5% 0.3% 3.0%
Redlands 92373 19.5% 64.2% 4.0% 8.8% 0.4% 3.1%
Redlands 92374 38.8% 44.7% 5.9% 7.6% 0.3% 2.7%
Rialto 92376 71.0% 10.6% 14.6% 2.1% 0.2% 1.5%
Rialto 92377 52.8% 20.8% 20.4% 3.5% 0.2% 2.3%
San Bernardino 92401 61.0% 12.5% 21.3% 2.2% 0.9% 2.1%
San Bernardino 92404 55.1% 24.5% 14.8% 2.8% 0.4% 2.4%
San Bernardino 92405 63.4% 20.1% 12.5% 1.4% 0.5% 2.1%
San Bernardino 92407 54.3% 26.3% 12.4% 4.1% 0.4% 2.5%
San Bernardino 92408 53.0% 16.4% 12.2% 15.1% 0.5% 2.8%
San Bernardino 92410 73.6% 9.6% 12.0% 3.0% 0.3% 1.5%
San Bernardino 92411 75.9% 3.5% 16.7% 2.6% 0.3% 1.0%
Victorville 92392 47.0% 31.6% 13.5% 4.3% 0.4% 3.2%
Yucaipa 92399 26.9% 66.1% 1.5% 2.7% 0.5% 2.3%
SBMC Service Area 53.1% 30.5% 9.1% 4.6% 0.5% 2.2%
San Bernardino County 49.2% 33.3% 8.4% 6.4% 0.4% 2.3%
Source: U.S. 2010 Census
Unemployment
Within the service area unemployment had risen to 16.2% in 2010; by 2012 it had
dropped to 12.7%. Areas with the highest unemployment were: San Bernardino
(16.0%) and Bloomington (15.9%). Redlands (8.8%) and Rancho Cucamonga (7.8%)
had the lowest unemployment rates.

St. Bernardine Medical Center FY2014 Community Health Needs Assessment Page 20
Unemployment Rate, 2012
Percent
Banning Not Available
Beaumont Not Available
Bloomington 15.9%
Colton 12.9%
Crestline 10.9%
Fontana 12.5%
Hemet Not Available
Hesperia 15.4%
Highland 15.1%
Rancho Cucamonga 7.8%
Redlands 8.8%
Rialto 15.3%
San Bernardino 16.0%
Victorville 14.4%
Yucaipa 9.6%
SBMC Service Area* 12.7%
San Bernardino County 12.0%
California 10.5%
Source: California Employment Development Department, Labor Market Information Division * For those parts of the service area for which data were available
Poverty
Poverty thresholds are used for calculating all official poverty population statistics. They
are updated each year by the Census Bureau. For 2010, the federal poverty threshold
for one person was $11,139 and for a family of four $22,113. Poverty rates paint an
important picture of the population within the SBMC service area. From 7.5% to 48.5%
of the population live at or below 100% of the Federal Poverty Level. Grimly,
close-to or over one-third of the population in San Bernardino 92401, 92404, 92405,
92408, 92410 and 92411 live in poverty, more than double the rate of poverty found at
the state level, and close-to or more-than double the rate in the county overall.
Many of the neighborhoods served by SBMC have more than half of the residents living
at or below 200% of the Federal Poverty Level. In San Bernardino 92401, 88.5% of the
population is at this level of poverty, followed by San Bernardino 92411 (72.5%), San
Bernardino 92410 (71.0%), and Hemet 92543 (65.7%).

St. Bernardine Medical Center FY2014 Community Health Needs Assessment Page 21
Ratio of Income to Poverty Level
Geographic Area Zip Code Below 100%
Poverty Below 200%
Poverty
Banning 92220 19.3% 43.7%
Beaumont 92223 11.1% 27.0%
Bloomington 92316 19.9% 59.8%
Colton 92324 22.1% 51.9%
Crestline 92325 18.2% 42.4%
Fontana 92335 23.8% 59.1%
Fontana 92336 9.3% 28.1%
Fontana 92337 10.8% 35.3%
Hemet 92543 30.3% 65.7%
Hemet 92544 18.9% 43.8%
Hemet 92545 14.0% 38.6%
Hesperia 92345 23.5% 49.0%
Highland 92346 17.0% 35.9%
Rancho Cucamonga 91730 7.5% 27.6%
Redlands 92373 8.5% 22.0%
Redlands 92374 14.0% 31.0%
Rialto 92376 22.8% 54.0%
Rialto 92377 9.2% 29.1%
San Bernardino 92401 48.5% 88.5%
San Bernardino 92404 31.0% 57.1%
San Bernardino 92405 32.3% 55.7%
San Bernardino 92407 18.2% 41.2%
San Bernardino 92408 32.4% 59.5%
San Bernardino 92410 41.4% 71.0%
San Bernardino 92411 35.8% 72.5%
Victorville 92392 18.3% 37.1%
Yucaipa 92399 11.3% 28.6%
SBMC Service Area 19.7% 27.6%
San Bernardino County 17.6% 40.5%
California 15.3% 35.1% Source: U.S. Bureau of the Census, 2008-2012 American Community Survey, 5-year average
Families in Poverty San Bernardino has the largest percentage of families living in poverty, ranging from
13.7% in 92407 to 44.8% of families in poverty in 92401. Of interest is the dichotomy of
poverty in Rialto and Fontana. Both cities have high levels of poverty in one zip code
and lower levels of poverty in the cities‟ other zip codes.

St. Bernardine Medical Center FY2014 Community Health Needs Assessment Page 22
Families Living in Poverty
Geographic Area Zip Code Percent
Banning 92220 15.0%
Beaumont 92223 7.7%
Bloomington 92316 19.0%
Colton 92324 19.1%
Crestline 92325 15.6%
Fontana 92335 21.5%
Fontana 92336 6.8%
Fontana 92337 8.4%
Hemet 92543 26.5%
Hemet 92544 13.5%
Hemet 92545 11.3%
Hesperia 92345 18.8%
Highland 92346 10.9%
Rancho Cucamonga 91730 5.9%
Redlands 92373 5.6%
Redlands 92374 10.7%
Rialto 92376 20.4%
Rialto 92377 7.1%
San Bernardino 92401 44.8%
San Bernardino 92404 26.4%
San Bernardino 92405 30.2%
San Bernardino 92407 13.7%
San Bernardino 92408 25.5%
San Bernardino 92410 38.3%
San Bernardino 92411 33.4%
Victorville 92392 13.6%
Yucaipa 92399 8.7%
San Bernardino County 14.1% Source: U.S. Bureau of the Census, 2008-2012 American Community Survey, 5-year average
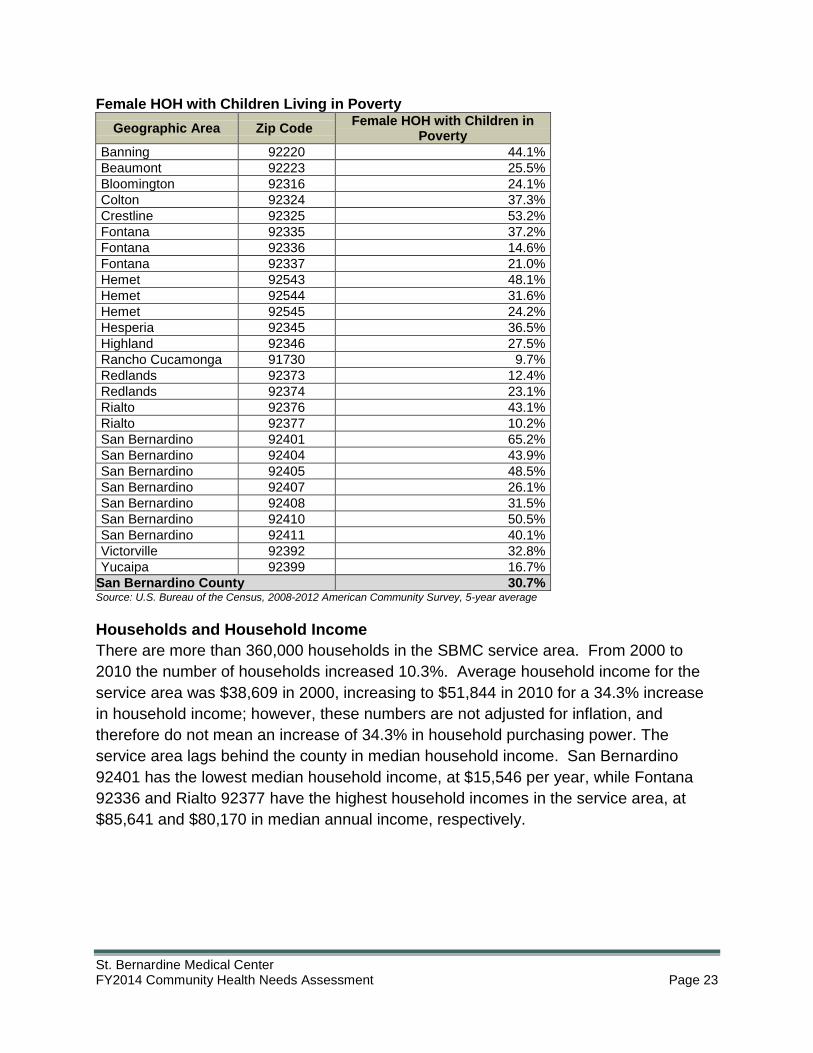
Among families where the female is the head of household (HOH) (a female maintains a
household with no husband present), San Bernardino has the largest percentage of
families with female heads of household and accompanying high rates of children in
poverty. Almost a third (30.7%) of all families in the county that have a female HOH,
live in poverty. The rate is more than double the county rate in San Bernardino 92401 –
where 65.2% of all female HOH families live below 100% of the Federal Poverty
Threshold.
St. Bernardine Medical Center FY2014 Community Health Needs Assessment Page 23
Female HOH with Children Living in Poverty
Geographic Area Zip Code Female HOH with Children in
Poverty
Banning 92220 44.1%
Beaumont 92223 25.5%
Bloomington 92316 24.1%
Colton 92324 37.3%
Crestline 92325 53.2%
Fontana 92335 37.2%
Fontana 92336 14.6%
Fontana 92337 21.0%
Hemet 92543 48.1%
Hemet 92544 31.6%
Hemet 92545 24.2%
Hesperia 92345 36.5%
Highland 92346 27.5%
Rancho Cucamonga 91730 9.7%
Redlands 92373 12.4%
Redlands 92374 23.1%
Rialto 92376 43.1%
Rialto 92377 10.2%
San Bernardino 92401 65.2%
San Bernardino 92404 43.9%
San Bernardino 92405 48.5%
San Bernardino 92407 26.1%
San Bernardino 92408 31.5%
San Bernardino 92410 50.5%
San Bernardino 92411 40.1%
Victorville 92392 32.8%
Yucaipa 92399 16.7%
San Bernardino County 30.7% Source: U.S. Bureau of the Census, 2008-2012 American Community Survey, 5-year average
Households and Household Income
There are more than 360,000 households in the SBMC service area. From 2000 to
2010 the number of households increased 10.3%. Average household income for the
service area was $38,609 in 2000, increasing to $51,844 in 2010 for a 34.3% increase
in household income; however, these numbers are not adjusted for inflation, and
therefore do not mean an increase of 34.3% in household purchasing power. The
service area lags behind the county in median household income. San Bernardino
92401 has the lowest median household income, at $15,546 per year, while Fontana
92336 and Rialto 92377 have the highest household incomes in the service area, at
$85,641 and $80,170 in median annual income, respectively.

St. Bernardine Medical Center FY2014 Community Health Needs Assessment Page 24
Households and Median Household Income
Geographic Area Zip
Code
Households Median Household
Income
2000 2010 2000 2010
Banning 92220 9,487 13,011 $32,825 $39,382
Beaumont 92223 6,428 14,485 $34,254 $63,198
Bloomington 92316 6,608 6,878 $38,290 $47,352
Colton 92324 16,167 15,985 $35,984 $43,109
Crestline 92325 4,101 3,249 $44,647 $48,173
Fontana 92335 21,418 22,533 $35,008 $43,946
Fontana 92336 13,961 21,723 $55,340 $85,641
Fontana 92337 7,831 8,722 $52,883 $69,553
Hemet 92543 12,357 13,036 $23,397 $26,986
Hemet 92544 14,352 15,047 $37,086 $44,397
Hemet 92545 11,682 14,836 $31,065 $40,609
Hesperia 92345 21,933 23,139 $41,423 $44,184
Highland 92346 15,539 16,850 $45,560 $64,763
Rancho Cucamonga 91730 16,842 22,563 $50,047 $62,613
Redlands 92373 13,346 13,634 $47,970 $69,130
Redlands 92374 12,011 12,750 $45,516 $63,600
Rialto 92376 20,334 20,378 $37,568 $43,815
Rialto 92377 5,107 4,935 $57,922 $80,170
San Bernardino 92401 707 678 $12,625 $15,546
San Bernardino 92404 17,304 17,496 $31,162 $36,913
San Bernardino 92405 7,750 8,599 $30,217 $40,699
San Bernardino 92407 14,646 15,868 $40,018 $53,918
San Bernardino 92408 3,635 3,863 $23,785 $35,830
San Bernardino 92410 11,877 12,429 $23,538 $28,495
San Bernardino 92411 6,127 6,462 $23,498 $30,491
Victorville 92392 21,131 14,871 $38,199 $59,138
Yucaipa 92399 15,300 17,892 $39,286 $60,642
SBMC Service Area 327,981 361,912 $38,609 $51,844
San Bernardino County 528,839 599,698 $42,066 $54,750 Source: U.S. Bureau of the Census, 2000 Census and 2008-2012 ACS 5-year average
Housing
Over half of the housing units in the service area are owner-occupied. From 2000 to
2010 owner-occupied housing decreased from 60% to 56.9%; renter-occupied housing
increased from 32.6% to 34.2%; and housing vacancies increased from 7.3% to 8.9%.
San Bernardino 92401 has the highest percentage of renters, at 76.2%. San
Bernardino, in general, has a low rate of owner-occupancy. Rialto 92377 and Fontana
92336 and 92337 have the highest rates of owner-occupancy (84.7%, 78.7% and
73.9%, respectively).

St. Bernardine Medical Center FY2014 Community Health Needs Assessment Page 25
Housing Units
Geographic Area Zip
Code Owner Occupied Renter Occupied Vacant
2000 2010 2000 2010 2000 2010
Banning 92220 67.3% 62.7% 24.9% 27.3% 7.8% 10.0%
Beaumont 92223 61.4% 70.5% 31.0% 22.0% 7.6% 7.5%
Bloomington 92316 70.8% 67.4% 23.4% 27.4% 5.7% 5.3%
Colton 92324 50.3% 49.2% 42.4% 42.8% 7.3% 8.1%
Crestline 92325 77.0% 70.4% 16.5% 17.6% 6.5% 12.0%
Fontana 92335 53.5% 48.9% 41.1% 45.1% 5.4% 5.9%
Fontana 92336 76.9% 78.7% 17.3% 16.9% 5.8% 4.4%
Fontana 92337 76.4% 73.9% 19.6% 21.1% 4.0% 5.0%
Hemet 92543 53.1% 47.5% 37.0% 39.3% 9.9% 13.2%
Hemet 92544 69.2% 62.7% 24.7% 27.3% 6.1% 10.0%
Hemet 92545 65.5% 61.5% 20.5% 25.7% 13.9% 12.7%
Hesperia 92345 69.6% 61.1% 24.5% 31.0% 5.9% 7.9%
Highland 92346 65.1% 66.0% 27.3% 28.1% 7.6% 5.9%
Rancho Cucamonga 91730 55.5% 45.7% 40.8% 49.5% 3.7% 4.8%
Redlands 92373 51.8% 50.5% 44.0% 43.2% 4.1% 6.3%
Redlands 92374 61.5% 60.4% 33.7% 32.9% 4.9% 6.7%
Rialto 92376 59.9% 54.9% 34.7% 37.0% 5.5% 8.0%
Rialto 92377 88.8% 84.7% 8.2% 12.2% 3.1% 3.1%
San Bernardino 92401 12.7% 10.8% 69.8% 76.2% 17.5% 13.0%
San Bernardino 92404 47.4% 43.8% 41.6% 46.1% 11.1% 10.1%
San Bernardino 92405 47.2% 43.4% 40.9% 45.5% 11.9% 11.1%
San Bernardino 92407 53.4% 55.8% 39.5% 36.8% 7.1% 7.4%
San Bernardino 92408 31.9% 34.4% 56.0% 56.6% 12.1% 9.0%
San Bernardino 92410 38.1% 38.3% 45.8% 52.1% 16.2% 9.6%
San Bernardino 92411 48.1% 45.4% 40.1% 45.4% 11.8% 9.1%
Victorville 92392 63.8% 63.6% 30.1% 26.7% 6.1% 9.7%
Yucaipa 92399 70.5% 69.6% 24.2% 23.7% 5.3% 6.7%
SBMC Service Area 60.0% 56.9% 32.6% 34.2% 7.3% 8.9%
San Bernardino County 62.0% 59.7% 31.2% 32.6% 6.8% 7.7% Source: U.S. Census, 2000 and 2010
The Housing Authority of San Bernardino County handles subsidized housing stock for
the county. There are a number of programs that include:
Housing Choice Voucher Units: 8,506
These units are privately owned, with rent subsidies paid directly to owners by the
Housing Authority.
Public Housing Units: 1,294
These units are owned and managed by the Housing Authority.
Authority-Owned Units: 1,199
These units were either acquired or developed through a variety of partnerships with
the State of California, San Bernardino County Department of Community
Development and Housing, various cities throughout the county, and Housing
Partners I, Inc.

St. Bernardine Medical Center FY2014 Community Health Needs Assessment Page 26
Within the service area, there are 8,155 units: 6,450 units that use Housing Choice
Voucher (Section 8) subsidies, 1,015 public housing units and 690 Authority-owned
units.
Subsidized Housing Stock
Geographic Area Housing Choice
Vouchers Public Housing
Authority-Owned Units
Banning N/A N/A N/A
Beaumont N/A N/A N/A
Bloomington 54 2 0
Colton 345 125 49
Crestline 26 0 0
Fontana 704 2 84
Hemet N/A N/A N/A
Hesperia 293 0 100
Highland 426 13 0
Rancho Cucamonga 240 5 0
Redlands 421 189 45
Rialto 584 0 24
San Bernardino 2,247 677 65
Victorville 944 2 168
Yucaipa 166 0 155
SBMC Service Area 6,450 1,015 690
Source: Housing Authority of San Bernardino County, 2012 Annual Report
There are 23,105 people living in subsidized housing in the SBMC service area. The
wait to obtain housing ranges from 2 months in Beaumont and Rancho Cucamonga to
94 months in Yucaipa, and averages 33 months at a county-wide level.
Subsidized Households All Programs
Geographic Area Number
of People Months on
Waiting List* Percent Minority
Percent Female HOH
Banning 436 16 66% 82%
Beaumont 267 2 49% 76%
Bloomington 79 N/A 67% 73%
Colton 1,199 4 74% 68%
Crestline 24 N/A 24% 41%
Fontana 2,138 3 71% 72%
Hemet 1,913 26 50% 77%
Hesperia 771 5 60% 68%
Highland 1,159 3 71% 67%
Rancho Cucamonga 732 2 63% 72%
Redlands 1,471 4 53% 71%
Rialto 1,844 5 78% 72%
San Bernardino 8,614 10 75% 68%
Victorville 2,190 34 76% 78%
Yucaipa 268 94 29% 60%
San Bernardino County 32,803 33 71% 71%
Source: HUD, 2012; * Average months on waiting list among admissions
St. Bernardine Medical Center FY2014 Community Health Needs Assessment Page 27
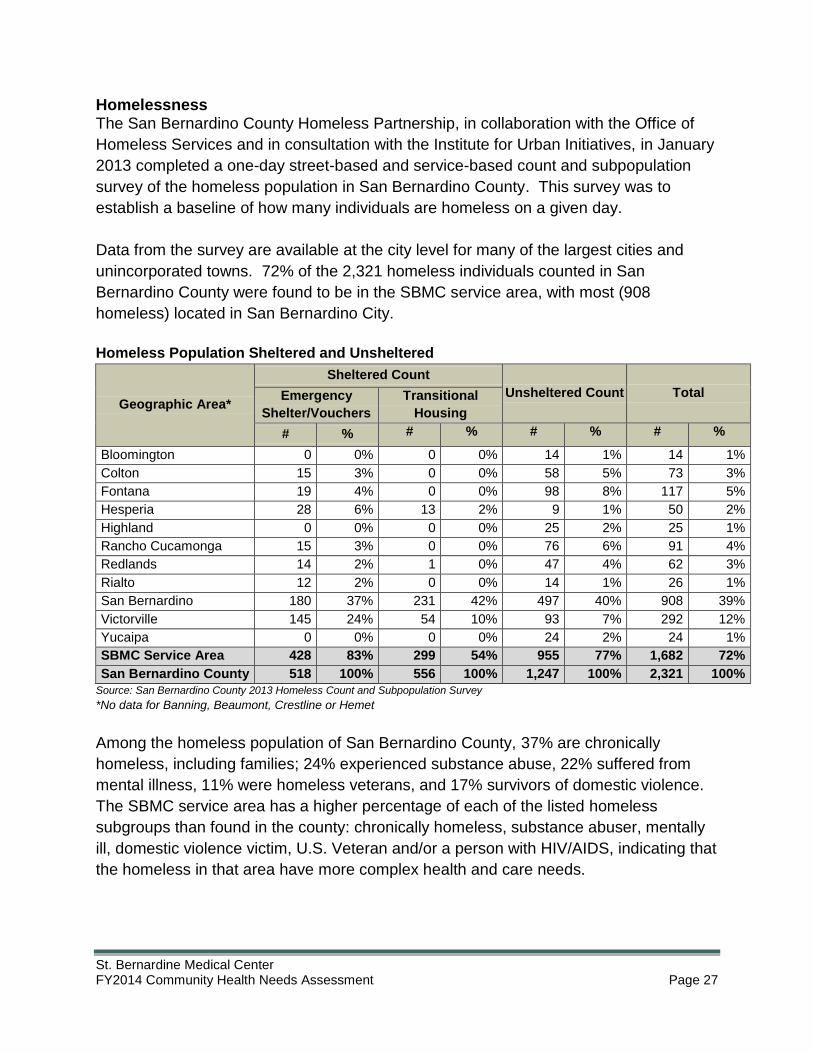
Homelessness The San Bernardino County Homeless Partnership, in collaboration with the Office of
Homeless Services and in consultation with the Institute for Urban Initiatives, in January
2013 completed a one-day street-based and service-based count and subpopulation
survey of the homeless population in San Bernardino County. This survey was to
establish a baseline of how many individuals are homeless on a given day.
Data from the survey are available at the city level for many of the largest cities and
unincorporated towns. 72% of the 2,321 homeless individuals counted in San
Bernardino County were found to be in the SBMC service area, with most (908
homeless) located in San Bernardino City.
Homeless Population Sheltered and Unsheltered
Geographic Area*
Sheltered Count
Unsheltered Count Total Emergency
Shelter/Vouchers
Transitional
Housing
# % # % # % # %
Bloomington 0 0% 0 0% 14 1% 14 1%
Colton 15 3% 0 0% 58 5% 73 3%
Fontana 19 4% 0 0% 98 8% 117 5%
Hesperia 28 6% 13 2% 9 1% 50 2%
Highland 0 0% 0 0% 25 2% 25 1%
Rancho Cucamonga 15 3% 0 0% 76 6% 91 4%
Redlands 14 2% 1 0% 47 4% 62 3%
Rialto 12 2% 0 0% 14 1% 26 1%
San Bernardino 180 37% 231 42% 497 40% 908 39%
Victorville 145 24% 54 10% 93 7% 292 12%
Yucaipa 0 0% 0 0% 24 2% 24 1%
SBMC Service Area 428 83% 299 54% 955 77% 1,682 72%
San Bernardino County 518 100% 556 100% 1,247 100% 2,321 100%
Source: San Bernardino County 2013 Homeless Count and Subpopulation Survey
*No data for Banning, Beaumont, Crestline or Hemet
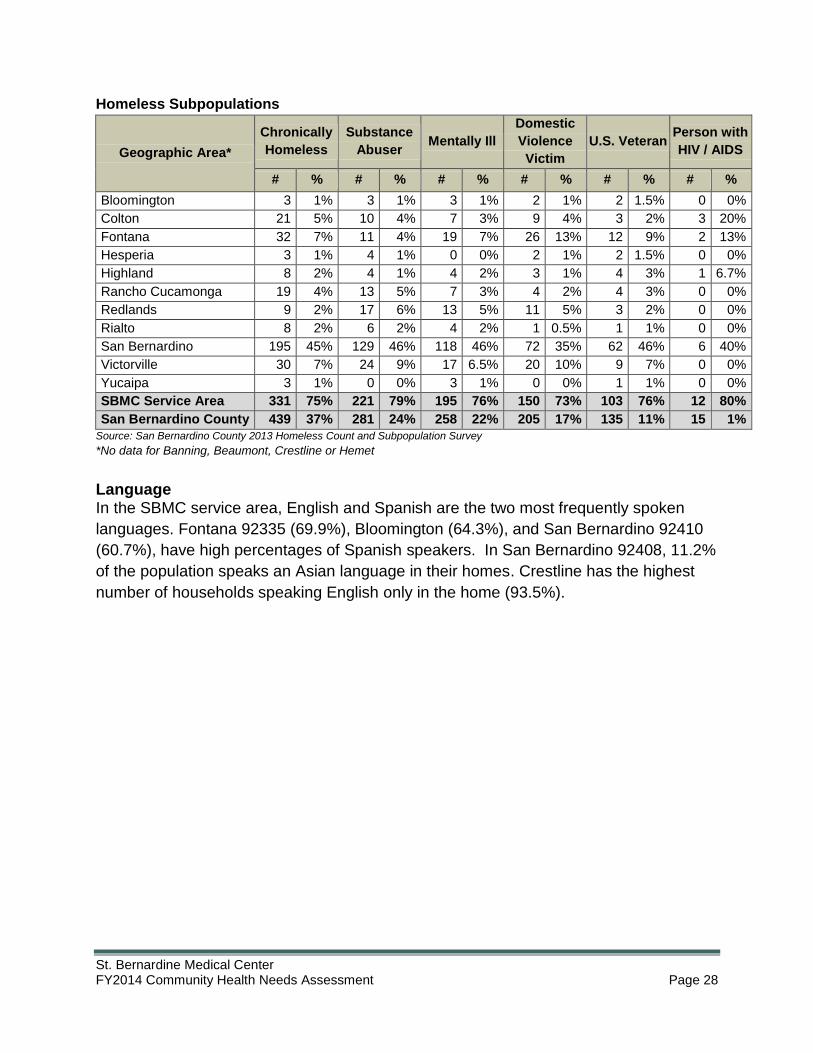
Among the homeless population of San Bernardino County, 37% are chronically
homeless, including families; 24% experienced substance abuse, 22% suffered from
mental illness, 11% were homeless veterans, and 17% survivors of domestic violence.
The SBMC service area has a higher percentage of each of the listed homeless
subgroups than found in the county: chronically homeless, substance abuser, mentally
ill, domestic violence victim, U.S. Veteran and/or a person with HIV/AIDS, indicating that
the homeless in that area have more complex health and care needs.
St. Bernardine Medical Center FY2014 Community Health Needs Assessment Page 28
Homeless Subpopulations
Geographic Area*
Chronically
Homeless
Substance
Abuser Mentally Ill
Domestic
Violence
Victim
U.S. Veteran Person with
HIV / AIDS
# % # % # % # % # % # %
Bloomington 3 1% 3 1% 3 1% 2 1% 2 1.5% 0 0%
Colton 21 5% 10 4% 7 3% 9 4% 3 2% 3 20%
Fontana 32 7% 11 4% 19 7% 26 13% 12 9% 2 13%
Hesperia 3 1% 4 1% 0 0% 2 1% 2 1.5% 0 0%
Highland 8 2% 4 1% 4 2% 3 1% 4 3% 1 6.7%
Rancho Cucamonga 19 4% 13 5% 7 3% 4 2% 4 3% 0 0%
Redlands 9 2% 17 6% 13 5% 11 5% 3 2% 0 0%
Rialto 8 2% 6 2% 4 2% 1 0.5% 1 1% 0 0%
San Bernardino 195 45% 129 46% 118 46% 72 35% 62 46% 6 40%
Victorville 30 7% 24 9% 17 6.5% 20 10% 9 7% 0 0%
Yucaipa 3 1% 0 0% 3 1% 0 0% 1 1% 0 0%
SBMC Service Area 331 75% 221 79% 195 76% 150 73% 103 76% 12 80%
San Bernardino County 439 37% 281 24% 258 22% 205 17% 135 11% 15 1%
Source: San Bernardino County 2013 Homeless Count and Subpopulation Survey
*No data for Banning, Beaumont, Crestline or Hemet
Language In the SBMC service area, English and Spanish are the two most frequently spoken
languages. Fontana 92335 (69.9%), Bloomington (64.3%), and San Bernardino 92410
(60.7%), have high percentages of Spanish speakers. In San Bernardino 92408, 11.2%
of the population speaks an Asian language in their homes. Crestline has the highest
number of households speaking English only in the home (93.5%).

St. Bernardine Medical Center FY2014 Community Health Needs Assessment Page 29
Language Spoken at Home for the Population 5 Years and Over
Geographic Area Zip
Code Speaks
English Only Speaks Spanish
Speaks Asian/PI
Speaks Indo European
Speaks Other Language
Banning 92220 68.2% 24.0% 5.9% 1.5% 0.4%
Beaumont 92223 70.4% 20.8% 6.8% 1.4% 0.6%
Bloomington 92316 33.9% 64.3% 0.6% 0.8% 0.4%
Colton 92324 48.3% 47.4% 3.0% 0.7% 0.6%
Crestline 92325 93.5% 4.9% 0.7% 0.8% 0.0%
Fontana 92335 27.5% 69.9% 1.5% 0.6% 0.5%
Fontana 92336 52.1% 36.9% 8.2% 1.2% 1.6%
Fontana 92337 37.3% 54.3% 5.2% 1.9% 1.4%
Hemet 92543 71.0% 27.0% 0.4% 1.3% 0.2%
Hemet 92544 78.2% 19.5% 1.0% 0.9% 0.4%
Hemet 92545 78.4% 16.2% 3.6% 1.1% 0.7%
Hesperia 92345 66.7% 30.5% 0.8% 1.7% 0.3%
Highland 92346 66.3% 25.3% 5.7% 1.9% 0.8%
Rancho Cucamonga 91730 62.1% 25.0% 8.9% 2.8% 1.2%
Redlands 92373 80.2% 9.0% 5.8% 3.8% 1.2%
Redlands 92374 69.7% 21.1% 4.5% 2.4% 2.2%
Rialto 92376 40.2% 57.4% 1.6% 0.4% 0.5%
Rialto 92377 55.5% 39.2% 3.3% 1.5% 0.5%
San Bernardino 92401 47.3% 45.5% 0.4% 2.6% 4.2%
San Bernardino 92404 58.6% 37.3% 2.9% 0.5% 0.6%
San Bernardino 92405 53.0% 44.0% 1.8% 0.9% 0.2%
San Bernardino 92407 59.9% 34.8% 3.1% 1.3% 0.9%
San Bernardino 92408 43.1% 41.8% 11.2% 1.7% 2.1%
San Bernardino 92410 35.7% 60.7% 2.7% 0.8% 0.0%
San Bernardino 92411 43.1% 53.1% 1.8% 0.6% 1.4%
Victorville 92392 67.4% 28.5% 2.2% 1.4% 0.5%
Yucaipa 92399 81.6% 14.6% 0.9% 2.3% 0.5%
SBMC Service Area 57.2% 37.1% 3.6% 1.4% 0.7%
San Bernardino County 59.0% 33.7% 4.7% 1.7% 0.8%
California 56.5% 28.6% 9.6% 4.4% 0.9% Source: U.S. Bureau of the Census, 2008-2012 ACS 5-year average
Linguistic Isolation
In communities within the Hospital service area, linguistic isolation can be examined by
those residents age 14 and over in households who do not speak English or do not
speak English “very well.” In San Bernardino County, 7.2% of households have
residents age 14 and over who do not speak English or do not speak English very well.
Fontana (9.7%), Rialto (10.7%) and San Bernardino (11.2%) have higher rates of
linguistic isolation than found in the county and the state (9.6%).

St. Bernardine Medical Center FY2014 Community Health Needs Assessment Page 30
Households with Residents who Do Not Speak English or Do Not Speak
English Very Well
Geographic Area* Percent of Households
Fontana 9.7%
Hemet 5.2%
Hesperia 4.2%
Rancho Cucamonga 6.9%
Redlands 2.3%
Rialto 10.7%
San Bernardino 11.2%
Victorville 7.7%
San Bernardino County 7.2%
California 9.6%
Source: U.S. Bureau of the Census, 2012 ACS 1-year average
*No data for Banning, Beaumont, Bloomington, Colton, Crestline, Highland or Yucaipa
Education
Of the population age 25 and over, 24.8% have less than a high school diploma; this is
a higher incompletion rate than the county (22.0%) or state (19.0%). For 27% of area
adults, high school graduation was their highest level of educational attainment.
Educational Attainment (Age 25+)
SBMC
Service Area San Bernardino
County California
Less than 9th Grade 11.6% 10.2% 10.3%
9th to 12th grade, no diploma 13.2% 11.8% 8.7%
High School Graduate 27.0% 26.1% 20.7%
Some College, no degree 24.7% 25.4% 22.2%
Associate‟s Degree 7.5% 8.1% 7.7%
Bachelor‟s Degree 10.4% 12.1% 19.4%
Graduate/Profess. Degree 5.6% 6.4% 11.1% Source: U.S. Bureau of the Census, 2008-2012 ACS 5-year average
Crime and Community Safety
Violent crimes include homicide, rape, robbery (of an individual or individuals, not a
home or business) and aggravated assault. Crime, including violent crime, has been on
a decline in San Bernardino County as well as California. In 2010, there were 31 crimes
per 1,000 residents in San Bernardino County, down from 35.7 per 1,000 in 2006.
There were 104 homicides in the county in 2010. Other violent crimes in 2010 included
aggravated assault (5,672), robbery (2,751) and rape (490). Among property crimes in
2010, there were 14,828 burglaries, 10,800 cases of larceny over $400 and 8,623 motor
vehicle thefts. There were also 405 cases of arson, down from 557 in 2006.

St. Bernardine Medical Center FY2014 Community Health Needs Assessment Page 31
Crime Rates
Year
San Bernardino County California
All Crime Crimes per 1,000
persons Violent Crime
Violent Crime per
1,000 persons
Violent Crime per
1,000 persons
2006 71,883 35.7 9,912 4.9 5.2
2007 72,301 35.5 10,238 5.0 5.1
2008 72,323 35.1 10,489 5.1 4.9
2009 67,155 32.5 10,038 4.9 4.5
2010 64,616 31.0 9,017 4.3 4.2
Source: San Bernardino County: Our Community Vital Signs Data Report, 2013
San Bernardino City, Victorville, Rialto and Highland experienced higher rates of violent
crime than seen at the county level. Yucaipa and Rancho Cucamonga enjoy lower
rates of violent crime. Rates of crime overall are higher in the City of San Bernardino,
Redlands, Victorville, Colton and Highland than in the county.
Crime Rates per 1,000 Persons in Selected Jurisdictions, 2010
Violent Crime Rate Total Crime Rate
Colton 3.3 33.5
Fontana 3.9 23.1
Hesperia * 3.3 25.1
Highland * 4.6 33.1
Rancho Cucamonga * 2.1 24.9
Redlands 3.5 40.5
Rialto 5.0 30.9
San Bernardino City 7.7 50.7
Victorville * 6.1 39.2
Yucaipa * 2.7 18.7
Unincorporated * 3.8 23.2
San Bernardino County 4.3 31.0
Source: San Bernardino County: Our Community Vital Signs Data Report, 2013 * Sheriff's Department rather than City jurisdictions
School Safety
The ability to feel safe in school impacts attendance, school performance, and learning.
Students in the 7th, 9th and 11th grades were asked how safe they felt at their schools
in 2009-2010 and over half (54%) of San Bernardino County students responded that
they felt "safe" or "very safe" (ranging from 50% to 58% across the 3 grades). These
numbers are lower than those seen at the state level (60% to 63%).
Feeling safe in San Bernardino County has a great deal to do with where students go to
school: 70-73% of students in Redlands Unified School District felt safe or very safe,
whereas only 36%-37% of 9th and 11th graders felt safe in Victor Valley Union High
District.

St. Bernardine Medical Center FY2014 Community Health Needs Assessment Page 32
Students who Feel "Very Safe" or "Safe" in School, 2009-2010
7th Grade 9th Grade 11th Grade
Colton Joint Unified 56% 42% 37%
Fontana Unified 52% 51% 54%
Hesperia Unified 56% 56% 59%
Redlands Unified 73% 70% 71%
Rialto Unified 49% 41% 41%
San Bernardino City Unified 52% 41% 42%
Victor Valley Union High 53% 36% 37%
Yucaipa-Calimesa Joint
Unified 65%
49% 60%
San Bernardino County 58% 50% 54%
California 63% 60% 63%
Source: San Bernardino County: Our Community Vital Signs Data Report, 2013
Gang Involvement There were 748 gangs in San Bernardino County in 2011, with 17,401 gang members.
This number is up from 2007 when there were 700 gangs with 12,645 members.
Students in the 7th, 9th and 11th grades were asked about their gang involvement.
Claims of gang involvement rose with age at Redlands Unified, while they fell with age
at Colton Joint Unified, San Bernardino City Unified, and Victor Valley Union High
schools.
Students who Reported Gang Involvement, 2009-2010
7th Grade 9th Grade 11th Grade
Colton Joint Unified 12% 11% 10%
Fontana Unified 9% 11% 9%
Hesperia Unified 11% 12% 8%
Redlands Unified 6% 9% 10%
Rialto Unified 9% 10% 7%
San Bernardino City Unified 12% 10% 7%
Victor Valley Union High 11% 9% 9%
Yucaipa-Calimesa Joint Unified 8% 13% 10%
San Bernardino County 9% 10% 9%
California 8% 9% 8%
Source: San Bernardino County: Our Community Vital Signs Data Report, 2013
St. Bernardine Medical Center FY2014 Community Health Needs Assessment Page 33
Birth Indicators
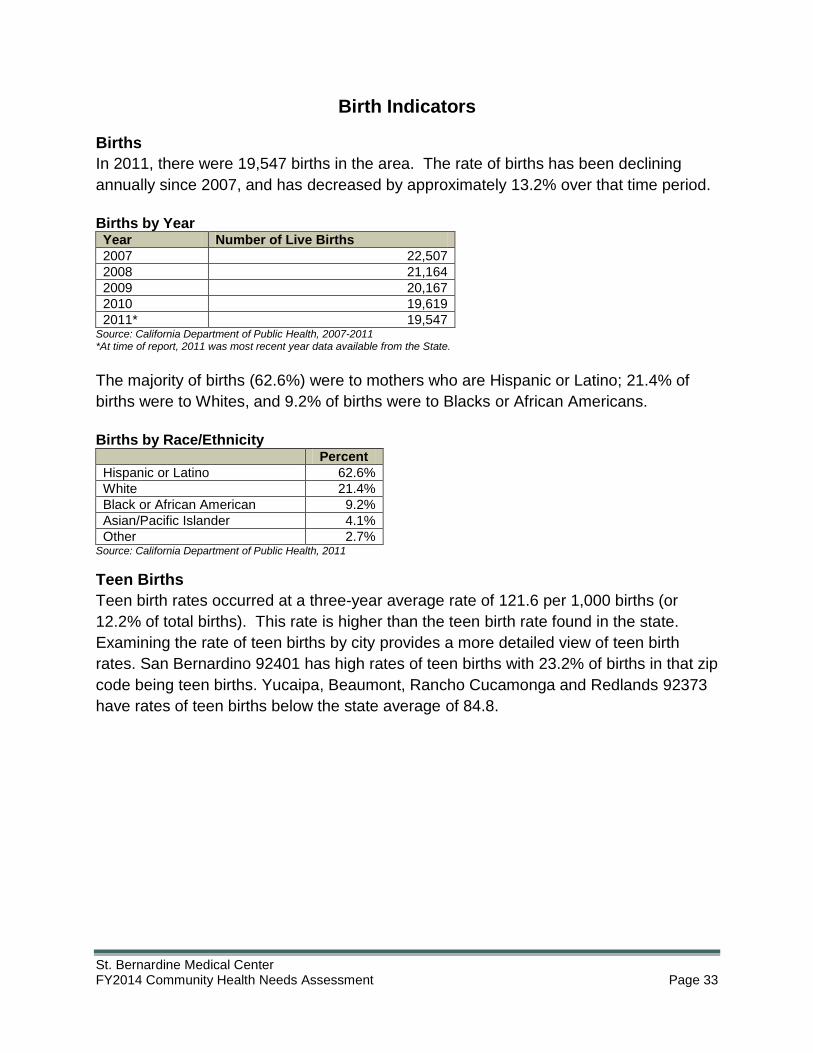
Births
In 2011, there were 19,547 births in the area. The rate of births has been declining
annually since 2007, and has decreased by approximately 13.2% over that time period.
Births by Year Year Number of Live Births
2007 22,507
2008 21,164
2009 20,167
2010 19,619
2011* 19,547 Source: California Department of Public Health, 2007-2011 *At time of report, 2011 was most recent year data available from the State. The majority of births (62.6%) were to mothers who are Hispanic or Latino; 21.4% of
births were to Whites, and 9.2% of births were to Blacks or African Americans.
Births by Race/Ethnicity Percent
Hispanic or Latino 62.6%
White 21.4%
Black or African American 9.2%
Asian/Pacific Islander 4.1%
Other 2.7% Source: California Department of Public Health, 2011
Teen Births
Teen birth rates occurred at a three-year average rate of 121.6 per 1,000 births (or
12.2% of total births). This rate is higher than the teen birth rate found in the state.
Examining the rate of teen births by city provides a more detailed view of teen birth
rates. San Bernardino 92401 has high rates of teen births with 23.2% of births in that zip
code being teen births. Yucaipa, Beaumont, Rancho Cucamonga and Redlands 92373
have rates of teen births below the state average of 84.8.

St. Bernardine Medical Center FY2014 Community Health Needs Assessment Page 34
Births to Teens (Under Age 20), Three-Year Average, 2009-2011
Geographic Area Zip Code Births to Teens* Live Births Rate per 1,000
Live Births
Banning 92220 58 406 142.7
Beaumont 92223 46 709 64.4
Bloomington 92316 69 539 128.0
Colton 92324 118 1,001 118.2
Crestline 92325 10 95 101.4
Fontana 92335 258 1,878 137.4
Fontana 92336 115 1,315 87.4
Fontana 92337 59 560 106.0
Hemet 92543 74 539 137.3
Hemet 92544 75 594 126.2
Hemet 92545 50 460 108.6
Hesperia 92345 166 1,252 132.9
Highland 92346 91 767 118.2
Rancho Cucamonga 91730 56 964 58.4
Redlands 92373 16 372 42.1
Redlands 92374 45 511 88.7
Rialto 92376 193 1,430 135.2
Rialto 92377 24 245 99.2
San Bernardino 92401 15 65 232.0
San Bernardino 92404 166 1,094 151.7
San Bernardino 92405 92 588 155.9
San Bernardino 92407 125 961 130.4
San Bernardino 92408 45 284 158.6
San Bernardino 92410 179 1,051 170.3
San Bernardino 92411 107 568 188.5
Victorville 92392 109 904 120.2
Yucaipa 92399 44 623 70.6
SBMC Service Area 2,406 19,778 121.6
California 43,615 514,087* 84.8
Source: California Department of Public Health, 2009-2011
*Where age of mother is known
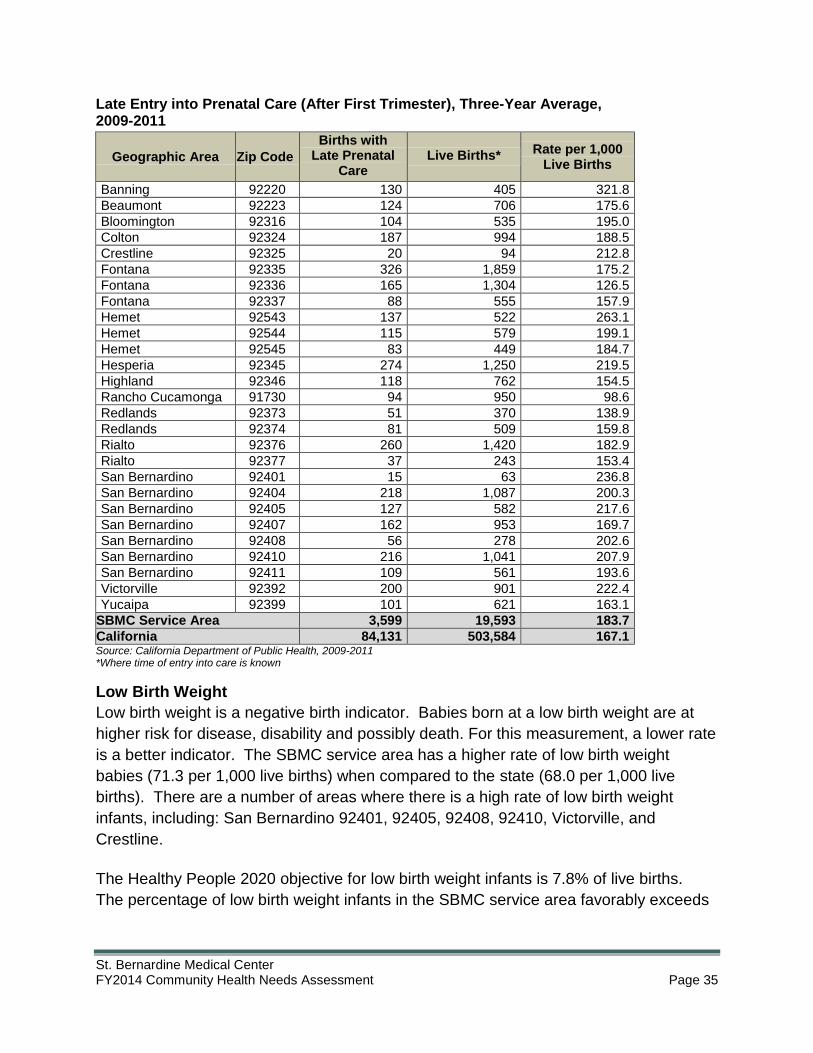
Prenatal Care
When averaged over three years from 2009-2011, pregnant women in the service area
entered prenatal care late - after the first trimester - at a rate of 183.7 per 1,000 live
births. This rate of late entry into prenatal care in the service area translates to 81.6%
of women entering prenatal care within the first trimester.
The area rate of early entry into prenatal care exceeds the Healthy People 2020
objective of 78% of women entering prenatal care in the first trimester. However,
Banning, Hemet, Victorville, and San Bernardino 92401 do not meet the Healthy People
2020 objective for early entry into prenatal care.
St. Bernardine Medical Center FY2014 Community Health Needs Assessment Page 35
Late Entry into Prenatal Care (After First Trimester), Three-Year Average, 2009-2011
Geographic Area Zip Code
Births with Late Prenatal
Care Live Births*
Rate per 1,000 Live Births
Banning 92220 130 405 321.8
Beaumont 92223 124 706 175.6
Bloomington 92316 104 535 195.0
Colton 92324 187 994 188.5
Crestline 92325 20 94 212.8
Fontana 92335 326 1,859 175.2
Fontana 92336 165 1,304 126.5
Fontana 92337 88 555 157.9
Hemet 92543 137 522 263.1
Hemet 92544 115 579 199.1
Hemet 92545 83 449 184.7
Hesperia 92345 274 1,250 219.5
Highland 92346 118 762 154.5
Rancho Cucamonga 91730 94 950 98.6
Redlands 92373 51 370 138.9
Redlands 92374 81 509 159.8
Rialto 92376 260 1,420 182.9
Rialto 92377 37 243 153.4
San Bernardino 92401 15 63 236.8
San Bernardino 92404 218 1,087 200.3
San Bernardino 92405 127 582 217.6
San Bernardino 92407 162 953 169.7
San Bernardino 92408 56 278 202.6
San Bernardino 92410 216 1,041 207.9
San Bernardino 92411 109 561 193.6
Victorville 92392 200 901 222.4
Yucaipa 92399 101 621 163.1
SBMC Service Area 3,599 19,593 183.7
California 84,131 503,584 167.1 Source: California Department of Public Health, 2009-2011 *Where time of entry into care is known
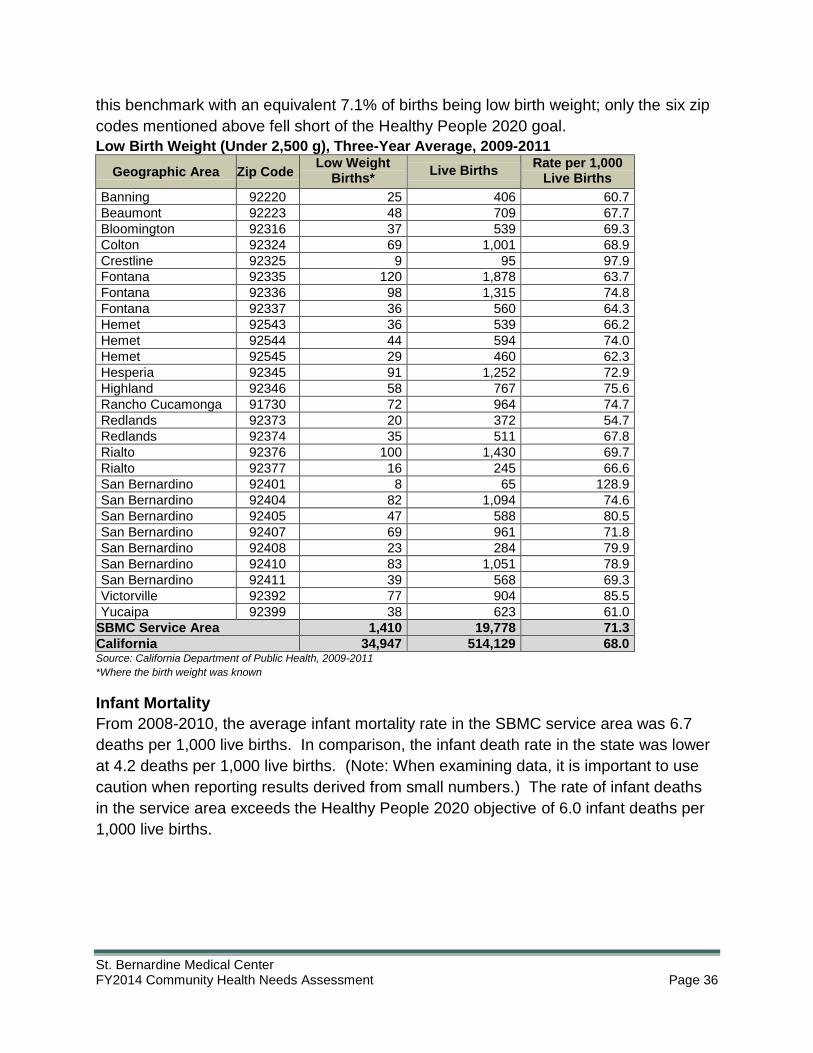
Low Birth Weight
Low birth weight is a negative birth indicator. Babies born at a low birth weight are at
higher risk for disease, disability and possibly death. For this measurement, a lower rate
is a better indicator. The SBMC service area has a higher rate of low birth weight
babies (71.3 per 1,000 live births) when compared to the state (68.0 per 1,000 live
births). There are a number of areas where there is a high rate of low birth weight
infants, including: San Bernardino 92401, 92405, 92408, 92410, Victorville, and
Crestline.
The Healthy People 2020 objective for low birth weight infants is 7.8% of live births.
The percentage of low birth weight infants in the SBMC service area favorably exceeds
St. Bernardine Medical Center FY2014 Community Health Needs Assessment Page 36
this benchmark with an equivalent 7.1% of births being low birth weight; only the six zip
codes mentioned above fell short of the Healthy People 2020 goal.
Low Birth Weight (Under 2,500 g), Three-Year Average, 2009-2011
Geographic Area Zip Code Low Weight
Births* Live Births
Rate per 1,000 Live Births
Banning 92220 25 406 60.7
Beaumont 92223 48 709 67.7
Bloomington 92316 37 539 69.3
Colton 92324 69 1,001 68.9
Crestline 92325 9 95 97.9
Fontana 92335 120 1,878 63.7
Fontana 92336 98 1,315 74.8
Fontana 92337 36 560 64.3
Hemet 92543 36 539 66.2
Hemet 92544 44 594 74.0
Hemet 92545 29 460 62.3
Hesperia 92345 91 1,252 72.9
Highland 92346 58 767 75.6
Rancho Cucamonga 91730 72 964 74.7
Redlands 92373 20 372 54.7
Redlands 92374 35 511 67.8
Rialto 92376 100 1,430 69.7
Rialto 92377 16 245 66.6
San Bernardino 92401 8 65 128.9
San Bernardino 92404 82 1,094 74.6
San Bernardino 92405 47 588 80.5
San Bernardino 92407 69 961 71.8
San Bernardino 92408 23 284 79.9
San Bernardino 92410 83 1,051 78.9
San Bernardino 92411 39 568 69.3
Victorville 92392 77 904 85.5
Yucaipa 92399 38 623 61.0
SBMC Service Area 1,410 19,778 71.3
California 34,947 514,129 68.0 Source: California Department of Public Health, 2009-2011
*Where the birth weight was known
Infant Mortality
From 2008-2010, the average infant mortality rate in the SBMC service area was 6.7
deaths per 1,000 live births. In comparison, the infant death rate in the state was lower
at 4.2 deaths per 1,000 live births. (Note: When examining data, it is important to use
caution when reporting results derived from small numbers.) The rate of infant deaths
in the service area exceeds the Healthy People 2020 objective of 6.0 infant deaths per
1,000 live births.

St. Bernardine Medical Center FY2014 Community Health Needs Assessment Page 37
Infant Mortality Rate, Three-Year Average, 2008-2010
Geographic Area Zip Code Infant Deaths Live Births Rate per 1,000
Live Births
Banning 92220 3 408 7.4
Beaumont 92223 2 688 2.9
Bloomington 92316 2 552 3.6
Colton 92324 10 1,027 9.7
Crestline 92325 0 108 0.0
Fontana 92335 13 1,977 6.6
Fontana 92336 9 1,351 6.7
Fontana 92337 2 578 3.5
Hemet 92543 4 549 7.3
Hemet 92544 3 561 5.3
Hemet 92545 4 454 8.8
Hesperia 92345 8 1,306 6.1
Highland 92346 7 785 8.9
Rancho Cucamonga 91730 7 974 7.2
Redlands 92373 2 382 5.2
Redlands 92374 3 528 5.7
Rialto 92376 10 1,499 6.7
Rialto 92377 1 248 4.0
San Bernardino 92401 - 69 0.0
San Bernardino 92404 7 1,142 6.1
San Bernardino 92405 4 591 6.8
San Bernardino 92407 6 998 6.0
San Bernardino 92408 1 289 3.5
San Bernardino 92410 8 1,082 7.4
San Bernardino 92411 7 591 11.9
Victorville 92392 10 932 10.7
Yucaipa 92399 5 648 7.7
SBMC Service Area 137 20,317 6.7
California 2,228 530,055 4.2
Source: California Department of Public Health, 2008-2010
Breastfeeding
Breastfeeding has been proven to have considerable benefits to baby and mother. The
California Department of Public Health (CDPH) highly recommends babies be fed only
breast milk for the first six months of life. Data on breastfeeding are collected by
hospitals on the Newborn Screening Test Form. In 2012, SBMC had 1,807 births.
Breastfeeding rates at SBMC show 86.1% of new mothers use some breastfeeding and
59.6% use breastfeeding exclusively. The rates of breastfeeding at SBMC exceed the
Healthy People 2020 objective of 81.9% of mothers who breastfeed.

St. Bernardine Medical Center FY2014 Community Health Needs Assessment Page 38
In-Hospital Breastfeeding, 2012
Any Breastfeeding Exclusive Breastfeeding
Number Percent Number Percent
St. Bernardine Medical Center 1,555 86.1% 1,077 59.6%
San Bernardino County 19,712 86.9% 13,388 59.0%
California 400,099 92.2% 270,767 62.4% Source: California Department of Public Health, Breastfeeding Hospital of Occurrence, 2012

St. Bernardine Medical Center FY2014 Community Health Needs Assessment Page 39
Leading Causes of Death
Leading Causes of Death
The leading causes of death in the service area are heart disease, cancer and lung
disease. Rates of death in the SBMC service area for heart disease, lung disease,
stroke, diabetes, liver disease and suicide exceed the state rates for these causes of
death. A more complete picture of disease risk and mortality is seen when the service
area is examined by disease.
Leading Causes of Death, Three-Year Average, per 100,000 Persons, 2008-2010
SBMC Service Area California Healthy People 2020
Number Rate Rate Rate
Diseases of the Heart 2,164 175.7 158.9 100.8
Cancer 1,732 140.6 148.9 160.6
Chronic Lower Respiratory Disease 559 45.4 35.1 No comparable rate
Stroke 465 37.8 36.5 33.8
Unintentional Injuries 297 25.7 26.9 36.0
Diabetes 315 25.6 19.1 65.8
Alzheimer's Disease 314 23.9 28.7 No comparable rate
Liver Disease 140 11.4 11.3 No comparable rate
Influenza/Pneumonia 139 11.3 16.8 No comparable rate
Suicide 125 10.2 10.1 10.2
Source: California Department of Public Health, 2008-2010
St. Bernardine Medical Center FY2014 Community Health Needs Assessment Page 40
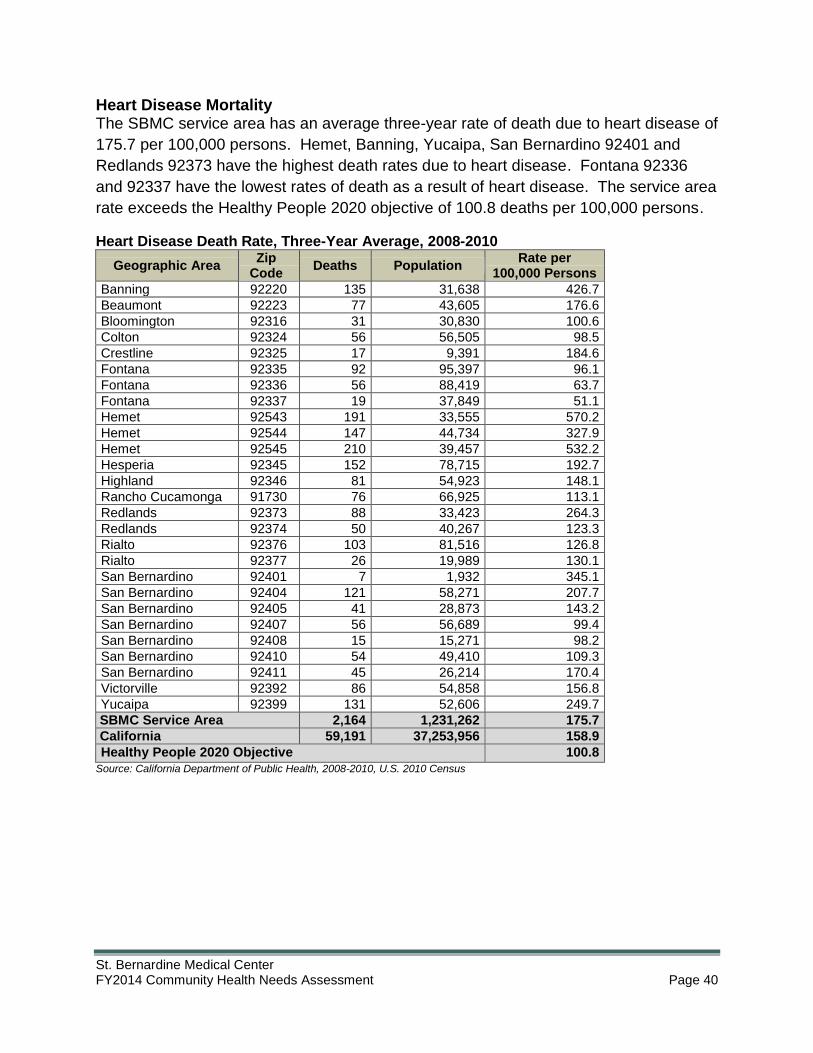
Heart Disease Mortality The SBMC service area has an average three-year rate of death due to heart disease of
175.7 per 100,000 persons. Hemet, Banning, Yucaipa, San Bernardino 92401 and
Redlands 92373 have the highest death rates due to heart disease. Fontana 92336
and 92337 have the lowest rates of death as a result of heart disease. The service area
rate exceeds the Healthy People 2020 objective of 100.8 deaths per 100,000 persons.
Heart Disease Death Rate, Three-Year Average, 2008-2010
Geographic Area Zip
Code Deaths Population
Rate per 100,000 Persons
Banning 92220 135 31,638 426.7
Beaumont 92223 77 43,605 176.6
Bloomington 92316 31 30,830 100.6
Colton 92324 56 56,505 98.5
Crestline 92325 17 9,391 184.6
Fontana 92335 92 95,397 96.1
Fontana 92336 56 88,419 63.7
Fontana 92337 19 37,849 51.1
Hemet 92543 191 33,555 570.2
Hemet 92544 147 44,734 327.9
Hemet 92545 210 39,457 532.2
Hesperia 92345 152 78,715 192.7
Highland 92346 81 54,923 148.1
Rancho Cucamonga 91730 76 66,925 113.1
Redlands 92373 88 33,423 264.3
Redlands 92374 50 40,267 123.3
Rialto 92376 103 81,516 126.8
Rialto 92377 26 19,989 130.1
San Bernardino 92401 7 1,932 345.1
San Bernardino 92404 121 58,271 207.7
San Bernardino 92405 41 28,873 143.2
San Bernardino 92407 56 56,689 99.4
San Bernardino 92408 15 15,271 98.2
San Bernardino 92410 54 49,410 109.3
San Bernardino 92411 45 26,214 170.4
Victorville 92392 86 54,858 156.8
Yucaipa 92399 131 52,606 249.7
SBMC Service Area 2,164 1,231,262 175.7
California 59,191 37,253,956 158.9
Healthy People 2020 Objective 100.8
Source: California Department of Public Health, 2008-2010, U.S. 2010 Census
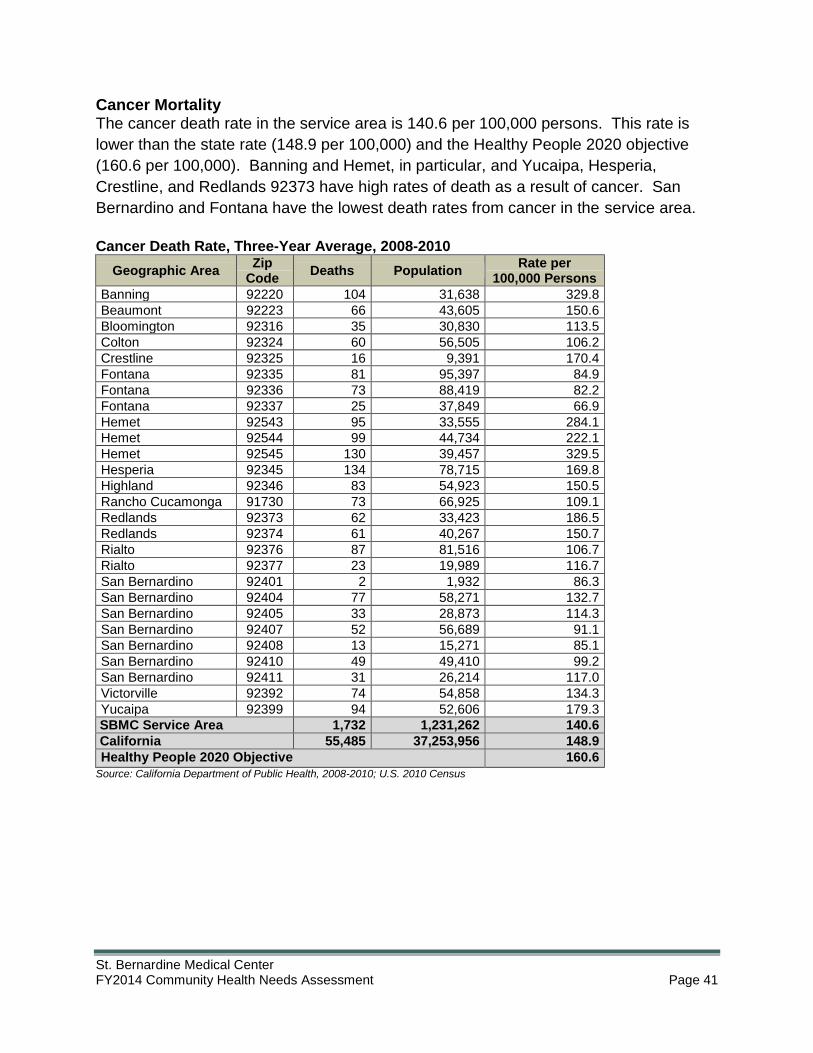
St. Bernardine Medical Center FY2014 Community Health Needs Assessment Page 41
Cancer Mortality The cancer death rate in the service area is 140.6 per 100,000 persons. This rate is
lower than the state rate (148.9 per 100,000) and the Healthy People 2020 objective
(160.6 per 100,000). Banning and Hemet, in particular, and Yucaipa, Hesperia,
Crestline, and Redlands 92373 have high rates of death as a result of cancer. San
Bernardino and Fontana have the lowest death rates from cancer in the service area.
Cancer Death Rate, Three-Year Average, 2008-2010
Geographic Area Zip
Code Deaths Population
Rate per 100,000 Persons
Banning 92220 104 31,638 329.8
Beaumont 92223 66 43,605 150.6
Bloomington 92316 35 30,830 113.5
Colton 92324 60 56,505 106.2
Crestline 92325 16 9,391 170.4
Fontana 92335 81 95,397 84.9
Fontana 92336 73 88,419 82.2
Fontana 92337 25 37,849 66.9
Hemet 92543 95 33,555 284.1
Hemet 92544 99 44,734 222.1
Hemet 92545 130 39,457 329.5
Hesperia 92345 134 78,715 169.8
Highland 92346 83 54,923 150.5
Rancho Cucamonga 91730 73 66,925 109.1
Redlands 92373 62 33,423 186.5
Redlands 92374 61 40,267 150.7
Rialto 92376 87 81,516 106.7
Rialto 92377 23 19,989 116.7
San Bernardino 92401 2 1,932 86.3
San Bernardino 92404 77 58,271 132.7
San Bernardino 92405 33 28,873 114.3
San Bernardino 92407 52 56,689 91.1
San Bernardino 92408 13 15,271 85.1
San Bernardino 92410 49 49,410 99.2
San Bernardino 92411 31 26,214 117.0
Victorville 92392 74 54,858 134.3
Yucaipa 92399 94 52,606 179.3
SBMC Service Area 1,732 1,231,262 140.6
California 55,485 37,253,956 148.9
Healthy People 2020 Objective 160.6
Source: California Department of Public Health, 2008-2010; U.S. 2010 Census

St. Bernardine Medical Center FY2014 Community Health Needs Assessment Page 42
Chronic Lower Respiratory Disease
CLRD comprises three major diseases: chronic bronchitis, emphysema, and asthma.
Tobacco smoking is the most important risk factor for chronic bronchitis and
emphysema, accounting for about 80% of cases. The rate of death from CLRD in the
service area is 45.4 per 100,000 persons, which is higher than the state rate of 35.1.
Banning and Hemet 92543 and 92545 have high rates of CLRD. There is no Healthy
People 2020 objective that matches this cause of death.
Chronic Lower Respiratory Disease, Three-Year Average, 2008-2010
Geographic Area Zip
Code Deaths Population
Rate per 100,000 Persons
Banning 92220 35 31,638 111.7
Beaumont 92223 23 43,605 52.7
Bloomington 92316 9 30,830 28.1
Colton 92324 12 56,505 20.6
Crestline 92325 4 9,391 46.1
Fontana 92335 21 95,397 22.0
Fontana 92336 15 88,419 16.6
Fontana 92337 7 37,849 17.6
Hemet 92543 54 33,555 160.9
Hemet 92544 30 44,734 67.1
Hemet 92545 43 39,457 109.8
Hesperia 92345 45 78,715 56.7
Highland 92346 29 54,923 52.8
Rancho Cucamonga 91730 19 66,925 28.4
Redlands 92373 22 33,423 65.8
Redlands 92374 14 40,267 34.8
Rialto 92376 22 81,516 26.6
Rialto 92377 6 19,989 31.7
San Bernardino 92401 1 1,932 51.8
San Bernardino 92404 34 58,271 57.8
San Bernardino 92405 14 28,873 47.3
San Bernardino 92407 14 56,689 24.1
San Bernardino 92408 6 15,271 41.5
San Bernardino 92410 16 49,410 33.1
San Bernardino 92411 9 26,214 35.6
Victorville 92392 18 54,858 32.8
Yucaipa 92399 38 52,606 71.6
SBMC Service Area 559 1,231,262 45.4
California 13,060 37,253,956 35.1 Source: California Department of Public Health, 2008-2010; U.S. 2010 Census

St. Bernardine Medical Center FY2014 Community Health Needs Assessment Page 43
Stroke Mortality
The SBMC service area has a higher rate of death per 100,000 persons by stroke (37.8)
than found in the state (36.5); it is also higher than the Healthy People 2020 objective
(33.8). Banning, Hemet 92543 and 92545, and Redlands 92373 have the highest rates
of death due to stroke. San Bernardino 92401, Fontana 92336 and 92337, and
Crestline have the lowest rates of death due to stroke in the service area.
Stroke Death Rate, Three-Year Average, 2008-2010
Geographic Area Zip
Code Deaths Population
Rate per 100,000 Persons
Banning 92220 80 31,638 84.3
Beaumont 92223 20 43,605 45.9
Bloomington 92316 22 30,830 23.8
Colton 92324 16 56,505 28.9
Crestline 92325 2 9,391 7.1
Fontana 92335 26 95,397 27.3
Fontana 92336 46 88,419 17.3
Fontana 92337 7 37,849 17.6
Hemet 92543 34 33,555 100.3
Hemet 92544 89 44,734 66.3
Hemet 92545 37 39,457 92.9
Hesperia 92345 107 78,715 45.3
Highland 92346 12 54,923 22.5
Rancho Cucamonga 91730 13 66,925 19.9
Redlands 92373 80 33,423 79.8
Redlands 92374 12 40,267 30.6
Rialto 92376 77 81,516 31.5
Rialto 92377 6 19,989 28.3
San Bernardino 92401 1 1,932 17.3
San Bernardino 92404 22 58,271 38.3
San Bernardino 92405 25 28,873 28.9
San Bernardino 92407 14 56,689 25.3
San Bernardino 92408 10 15,271 21.8
San Bernardino 92410 11 49,410 21.6
San Bernardino 92411 35 26,214 44.5
Victorville 92392 59 54,858 35.9
Yucaipa 92399 24 52,606 45.0
SBMC Service Area 465 1,231,262 37.8
California 13,589 37,253,956 36.5
Healthy People 2020 Objective 33.8
Source: California Department of Public Health, 2008-2010; U.S. 2010 Census

St. Bernardine Medical Center FY2014 Community Health Needs Assessment Page 44
Unintentional Injury Mortality
The SBMC service area has a rate of death as a result of unintentional injuries (25.7 per
100,000 persons) that is lower than the state (26.9 deaths per 100,000 persons) and the
Healthy People 2020 objective (36.0). Crestline, Hemet 92543 and 92545, and Banning
have the highest rate of death from unintentional injuries. Fontana 92336 and 92337
and Rancho Cucamonga have the lowest levels.
Unintentional Injury Death Rate, Three-Year Average, 2008-2010
Geographic Area Zip
Code Deaths Population
Rate per 100,000 Persons
Banning 92220 12 31,638 36.9
Beaumont 92223 12 43,605 26.8
Bloomington 92316 6 30,830 20.5
Colton 92324 12 56,505 20.6
Crestline 92325 4 9,391 46.1
Fontana 92335 19 95,397 19.9
Fontana 92336 11 88,419 12.1
Fontana 92337 5 37,849 13.2
Hemet 92543 21 33,555 61.6
Hemet 92544 17 44,734 38.0
Hemet 92545 16 39,457 41.4
Hesperia 92345 23 78,715 28.8
Highland 92346 13 54,923 24.3
Rancho Cucamonga 91730 9 66,925 13.9
Redlands 92373 12 33,423 34.9
Redlands 92374 11 40,267 28.1
Rialto 92376 16 81,516 19.6
Rialto 92377 5 19,989 26.7
San Bernardino 92401 1 1,932 34.5
San Bernardino 92404 17 58,271 28.6
San Bernardino 92405 9 28,873 30.0
San Bernardino 92407 10 56,689 18.2
San Bernardino 92408 3 15,271 17.5
San Bernardino 92410 8 49,410 16.9
San Bernardino 92411 8 26,214 31.8
Victorville 92392 20 54,858 36.5
Yucaipa 92399 17 52,606 31.7
SBMC Service Area 297 1,231,262 25.7
California 10,028 37,253,956 26.9
Healthy People 2020 Objective 36.0
Source: California Department of Public Health, 2008-2010, U.S. 2010 Census
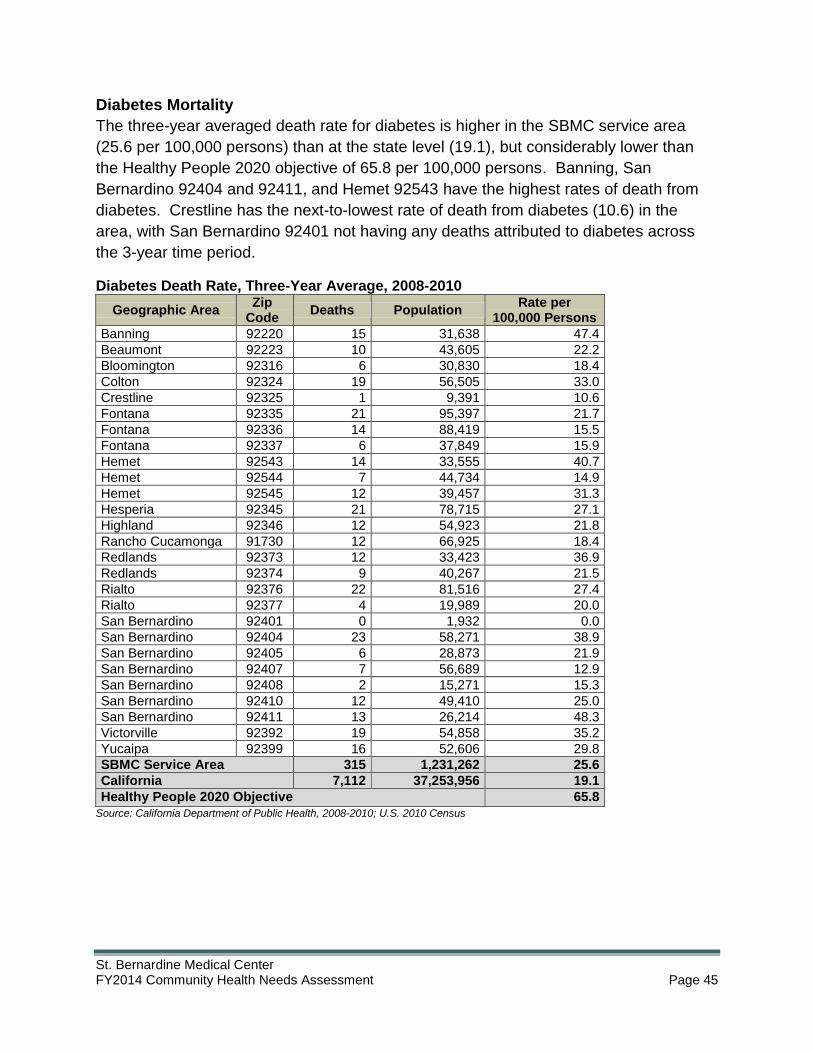
St. Bernardine Medical Center FY2014 Community Health Needs Assessment Page 45
Diabetes Mortality
The three-year averaged death rate for diabetes is higher in the SBMC service area
(25.6 per 100,000 persons) than at the state level (19.1), but considerably lower than
the Healthy People 2020 objective of 65.8 per 100,000 persons. Banning, San
Bernardino 92404 and 92411, and Hemet 92543 have the highest rates of death from
diabetes. Crestline has the next-to-lowest rate of death from diabetes (10.6) in the
area, with San Bernardino 92401 not having any deaths attributed to diabetes across
the 3-year time period.
Diabetes Death Rate, Three-Year Average, 2008-2010
Geographic Area Zip
Code Deaths Population
Rate per 100,000 Persons
Banning 92220 15 31,638 47.4
Beaumont 92223 10 43,605 22.2
Bloomington 92316 6 30,830 18.4
Colton 92324 19 56,505 33.0
Crestline 92325 1 9,391 10.6
Fontana 92335 21 95,397 21.7
Fontana 92336 14 88,419 15.5
Fontana 92337 6 37,849 15.9
Hemet 92543 14 33,555 40.7
Hemet 92544 7 44,734 14.9
Hemet 92545 12 39,457 31.3
Hesperia 92345 21 78,715 27.1
Highland 92346 12 54,923 21.8
Rancho Cucamonga 91730 12 66,925 18.4
Redlands 92373 12 33,423 36.9
Redlands 92374 9 40,267 21.5
Rialto 92376 22 81,516 27.4
Rialto 92377 4 19,989 20.0
San Bernardino 92401 0 1,932 0.0
San Bernardino 92404 23 58,271 38.9
San Bernardino 92405 6 28,873 21.9
San Bernardino 92407 7 56,689 12.9
San Bernardino 92408 2 15,271 15.3
San Bernardino 92410 12 49,410 25.0
San Bernardino 92411 13 26,214 48.3
Victorville 92392 19 54,858 35.2
Yucaipa 92399 16 52,606 29.8
SBMC Service Area 315 1,231,262 25.6
California 7,112 37,253,956 19.1
Healthy People 2020 Objective 65.8
Source: California Department of Public Health, 2008-2010; U.S. 2010 Census

St. Bernardine Medical Center FY2014 Community Health Needs Assessment Page 46
Access to Care
Health Insurance
Health insurance coverage is considered a key component to accessing health care.
County level data are examined to gain a picture of the availability of insurance and a
source of care for area residents. Among adults 18-64 years old, 25.7% of area
residents report being uninsured, which is higher than the 21.4% found in California.
About half (49.8%) of adults have health insurance through their employers; this is less
than the state rate of employment-based health insurance (54.1%).
Insurance Coverage for Adults, Ages 18-64
San Bernardino County California
Employment based 49.8% 54.1%
Uninsured 25.7% 21.4%
Medi-Cal 14.8% 12.2%
Private purchase 5.0% 6.8%
Other Public 2.4% 3.4%
Medi-Cal + Medicare 1.8% 1.4%
Medicare 0.6% 0.7%
Source: California Health Interview Survey, 2011-2012
According to data from the 2011-2012 California Health Interview Survey, 97.7% of
children in San Bernardino County, ages 0-17, are insured. Medi-Cal covers 43.5% of
children, which is higher than for California and 38.8% have employment-based
insurance; 2.3% are uninsured.
Insurance Coverage for Children, Ages 0-17
San Bernardino County California
Employment based 38.8% 46.9%
Medi-Cal 43.5% 35.8%
Healthy Families (CHIP) 10.0% 7.6%
Uninsured 2.3% 4.2%
Private purchase 3.6% 4.1%
Other Public 1.8% 1.5%
Source: California Health Interview Survey, 2011-2012
Medicare with other coverage continues to be the largest source of health care
coverage for seniors, and is rising even as Medicare + Medi-Cal rates are dropping.

St. Bernardine Medical Center FY2014 Community Health Needs Assessment Page 47
Insurance Coverage for Seniors
San Bernardino County
California 2005 2009 2011-2012
Medicare + other coverage 61.7% 68.5% 71.5% 69.5%
Medicare + Medi-Cal 23.8% 20.3% 18.2% 17.0%
Other coverage only 6.3% 6.1% 2.9% 8.2%
Medicare only 8.1% 4.6% 6.5% 4.4%
Source: California Health Interview Survey, 2005, 2009, 2011-2012
Eligibility of Uninsured
Eligibility status takes into account age, insurance, family type, and citizenship
information. For the uninsured in San Bernardino County under age 65, 13.6% are
Medi-Cal eligible and 0.7% are eligible for Healthy Families. However, 85.7% of the
uninsured are not eligible for coverage.
Eligibility of Uninsured, Ages 0-65
San Bernardino County California
Medi-Cal eligible 13.6% 7.9%
Healthy Families eligible 0.7% 2.6%
Not eligible 85.7% 89.4%
Source: California Health Interview Survey, 2011-2012
Usual Source of Care Residents who have a medical home and access to a primary care provider improve the
continuity of care and decrease unnecessary ER visits. Among the residents of San
Bernardino County, 84.2% indicate they have a usual source of care.
Usual Source of Care
San Bernardino County California
Has a usual source of care 84.2% 85.7%
0-17 years old 89.1% 92.2%
18-64 years old 80.1% 81.4%
65 and older 94.7% 95.4%
Source: California Health Interview Survey, 2011-2012
Use of the Emergency Room Over one-fifth (21.9%) of the population of San Bernardino County visited the
Emergency Room in the last 12 months. In a notable departure from the pattern seen
at the state level, the rate is highest among adults ages 18-64; at the state level,
individuals 18-64 are the lowest utilizers of the ER. Poverty-level residents use the ER
at higher rates, both at the county and state levels. Seniors in San Bernardino County
visit the ER at rates (19.0%) lower than found in the state (19.7%).

St. Bernardine Medical Center FY2014 Community Health Needs Assessment Page 48
Use of Emergency Room
San Bernardino County California
Visited ER in last 12 months 21.9% 17.9%
0-17 years old 19.5% 19.1%
18-64 years old 23.5% 17.0%
65 and older 19.0% 19.7%
<100% of poverty level 29.2% 21.3%
<200% of poverty level 21.2% 19.1%
Source: California Health Interview Survey, 2011-2012
Delayed Medical Care
Overall, 11.2% of the population of San Bernardino County delayed or did not get
needed medical care. When examined by age group, adults, ages 18-64, delay care at
much higher rates than children or seniors. This may be a result of higher rates of
health insurance for children and seniors. Poverty-level residents also have higher
rates of delaying access to medical care, although surprisingly low-income (<200%
FPL) county residents did not, a difference from results seen at the state level.
Delayed or Did Not Get Needed Medical Care
San Bernardino County California
Delayed medical care 11.2% 12.2%
0-17 years old 5.5% 4.3%
18-64 years old 14.7% 16.4%
65 and older 6.7% 6.1%
<100% of poverty level 13.5% 13.0%
<200% of poverty level 11.0% 13.4%
Source: California Health Interview Survey, 2011-2012
Dental Care Among children 3-11, and 2-year-olds with teeth, 12.3% had never been to a dentist,
and the main reason that all 2-11 year olds had not seen a dentist in the past year was
due to affordability and lack of insurance. These were both higher than the state rates.
San Bernardino County teens, 12-19, were seeing the dentist at a higher rate than their
California counterparts, and when they hadn't seen a dentist in the past year it was less
likely to have been primarily due to cost.

St. Bernardine Medical Center FY2014 Community Health Needs Assessment Page 49
Access to Dental Care
San Bernardino
County California
Children, Ages 2-11, Never Been to a Dentist 12.3% 10.3%
Children, Ages 12-19, Never Been to a Dentist 0% 1.4%
Children, Ages 2-11, Main Reason Didn't See Dentist in Past Year: Could not Afford / Lack of Insurance 23.7%
10.4%
Children, Ages 12-19, Main Reason Didn't See Dentist in Past Year: Cost / Could not Afford / Lack of Insurance 17.4%
30.6%
Source: California Health Interview Survey, 2009, 2011-2012
Access to Primary Care Community Clinics Community clinics provide primary care (including medical, dental and mental health
services) for uninsured and medically underserved populations. Large portions of the
Service Area are categorized as a Health Professions Shortage Area (HPSA) and a
Medically Underserved Area (MUA).
Using the service area zip codes and information from the Uniform Data System
(UDS)1, there were a number of Section 330 funded grantees (Federally Qualified
Health Centers – FQHCs) identified that serve the SBMC service area, including:
Community Health Systems, Inc., SAC Health System, Inland Behavioral & Health
Services, Inc., East Valley Community Health Center, the County of Riverside
Community Health Agency, and the San Bernardino County Public Health Department.
Even with Section 330 funded Community Health Center providers in the area, there are
a significant number of low-income residents who are not served by one of these clinic
providers. The FQHCs have a total of 31,401 patients in the service area, which
equates to 6.2% penetration among low-income patients and 2.6% penetration among
the total population. There remain 479,074 low-income residents, approximately 94% of
the population at or below 200% FPL that are not served by a Section 330-funded
grantee.
Low-Income Patients Served and Not Served by FQHCs
Patients served by Section 330 Grantees
In the Service Area
Penetration among Low-Income Patients
Penetration of Total Population
Low-Income Not Served
Number Percent
31,401 6.2% 2.6% 479,074 93.8% Source: UDS Mapper, 2012
1 The UDS is an annual reporting requirement for grantees of HRSA primary care programs:
• Community Health Center, Section 330 (e) • Migrant Health Center, Section 330 (g) • Health Care for the Homeless, Section 330 (h) • Public Housing Primary Care, Section 330 (i)

St. Bernardine Medical Center FY2014 Community Health Needs Assessment Page 50
Access to Social Services
2-1-1 is a toll-free phone number that provides information and referrals for health and
social services. A review of 2-1-1 calls in San Bernardino identified the top needs
(consolidated below) in the area by number of calls, by month. (Note: October 2013
data were unavailable).
Needs December 2013 November 2013 September 2013
Utilities 743 903 1,007
Food/Meals 530 726 512
Holiday Gifts / Toys / Internet 338 258 175
Shelter 326 287 342
Information Services 281 408 438
Rent Payment 239 415 532
Housing 169 N/A 275
Homeless Motel Vouchers N/A 202 277 Source: Inland Empire United Way, February 2014
Another function of 2-1-1 is to identify gaps in service. Most of the gaps for San
Bernardino County are for basic services with requests for utility, rent and shelter,
including cold weather, emergency, and homeless shelter.
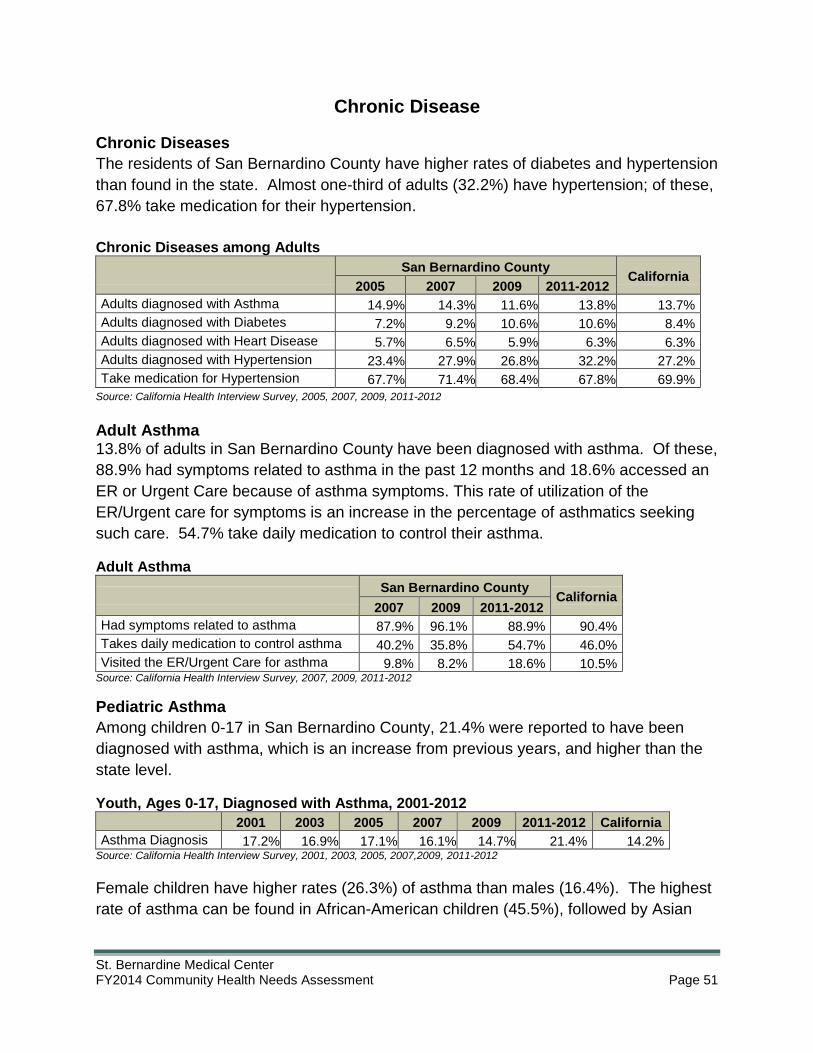
St. Bernardine Medical Center FY2014 Community Health Needs Assessment Page 51
Chronic Disease
Chronic Diseases
The residents of San Bernardino County have higher rates of diabetes and hypertension
than found in the state. Almost one-third of adults (32.2%) have hypertension; of these,
67.8% take medication for their hypertension.
Chronic Diseases among Adults
San Bernardino County
California 2005 2007 2009 2011-2012
Adults diagnosed with Asthma 14.9% 14.3% 11.6% 13.8% 13.7%
Adults diagnosed with Diabetes 7.2% 9.2% 10.6% 10.6% 8.4%
Adults diagnosed with Heart Disease 5.7% 6.5% 5.9% 6.3% 6.3%
Adults diagnosed with Hypertension 23.4% 27.9% 26.8% 32.2% 27.2%
Take medication for Hypertension 67.7% 71.4% 68.4% 67.8% 69.9%
Source: California Health Interview Survey, 2005, 2007, 2009, 2011-2012
Adult Asthma 13.8% of adults in San Bernardino County have been diagnosed with asthma. Of these,
88.9% had symptoms related to asthma in the past 12 months and 18.6% accessed an
ER or Urgent Care because of asthma symptoms. This rate of utilization of the
ER/Urgent care for symptoms is an increase in the percentage of asthmatics seeking
such care. 54.7% take daily medication to control their asthma.
Adult Asthma
San Bernardino County
California 2007 2009 2011-2012
Had symptoms related to asthma 87.9% 96.1% 88.9% 90.4%
Takes daily medication to control asthma 40.2% 35.8% 54.7% 46.0%
Visited the ER/Urgent Care for asthma 9.8% 8.2% 18.6% 10.5% Source: California Health Interview Survey, 2007, 2009, 2011-2012
Pediatric Asthma
Among children 0-17 in San Bernardino County, 21.4% were reported to have been
diagnosed with asthma, which is an increase from previous years, and higher than the
state level.
Youth, Ages 0-17, Diagnosed with Asthma, 2001-2012
2001 2003 2005 2007 2009 2011-2012 California
Asthma Diagnosis 17.2% 16.9% 17.1% 16.1% 14.7% 21.4% 14.2% Source: California Health Interview Survey, 2001, 2003, 2005, 2007,2009, 2011-2012
Female children have higher rates (26.3%) of asthma than males (16.4%). The highest
rate of asthma can be found in African-American children (45.5%), followed by Asian

St. Bernardine Medical Center FY2014 Community Health Needs Assessment Page 52
children (38.5%). Asthma rates have increased among Latino youth. The rates of
pediatric asthma for the county are higher than for the state, in every subset.
Youth Diagnosed with Asthma, Gender and Race/Ethnicity
San Bernardino County
California 2005 2009 2011-2012
Female 17.9% 15.2% 26.3% 13.8%
Male 16.4% 12.2% 16.4% 16.9%
Asian 35.3% 22.0% 38.5% 19.6%
African American 24.5% 20.3% 45.5% 20.5%
Latino 12.2% 13.0% 18.4% 14.9%
White 19.2% 11.5% 15.8% 12.7%
Source: California Health Interview Survey, 2005, 2009, 2011-2012
Of the youth diagnosed with asthma, 85% had symptoms related to asthma in the past
12 months and 10.6% accessed an ER or Urgent Care because of asthma symptoms.
31.9% take daily medication to control their symptoms, which is lower than the rate of
utilization state-wide. Despite that, visits to the ER for asthma have decreased over the
last five years, and are at levels lower than the state.
Youth Asthma
San Bernardino County
California 2005 2007 2009 2011-2012
Had symptoms related to asthma 86.0% 94.0% 98.1% 85.0% 88.3%
Takes daily medication to control asthma 36.3% 44.2% 28.7% 31.9% 39.6%
Visited the ER/Urgent Care for asthma 21.3% 41.0% 16.8% 10.6% 21.2% Source: California Health Interview Survey, 2005, 2007, 2009, 2011-2012
Most children with asthma missed no school because of their asthma (95%), which may indicate that for these children their asthma was controlled.
Youth with Asthma, Missed School Days
San Bernardino County
California 2005 2007 2009 2011-2012
0 Days Missed in Last 12 Months 68.2% 75.3% 77.8% 94.9% 77.0%
1-2 Days Missed 8.5% 7.6% 9.7% 0.5% 10.4%
3-4 Days Missed 8.0% 5.9% 3.0% 3.8% 3.5%
5-10 Days Missed 15.3% 11.2% 9.4% N/A 6.1% Source: California Health Interview Survey, 2005, 2007, 2009, 2011-2012
Diabetes
Among adults in San Bernardino County, 10.6% of the population has been diagnosed
with diabetes; this is higher than the state rate of 8.4%. Of those with diabetes, 10.9%
have Type I diabetes and 83% have Type II diabetes.

St. Bernardine Medical Center FY2014 Community Health Needs Assessment Page 53
Among Latinos, 14% have been diagnosed with diabetes, the highest of all ethnic
groups in the area, and higher than Latinos in California in general.
Adults Diagnosed with Diabetes, Gender and Race/Ethnicity
San Bernardino County
California 2005 2009 2011-2012
All genders and groups 7.2% 10.6% 10.6% 8.4%
Female 6.0% 8.6% 12.0% 8.1%
Male 8.6% 12.8% 9.2% 8.7%
Latino 8.7% 11.3% 14.0% 9.9%
White 6.3% 10.6% 7.9% 7.2%
African American 7.9% 9.2% 4.9% 11.4%
Asian 6.5% 5.4% 8.5% 7.1%
Source: California Health Interview Survey, 2005, 2009, 2011-2012
Most adults with diabetes take an oral anti-hypoglycemic medication to control diabetes
(67.8%); one-fifth of the diabetic population uses insulin (20.9%).
Adults with Diabetes, Treatment
San Bernardino County
California 2005 2007 2009
Take pills for high blood sugar 69.3% 70.9% 67.8% 72.0%
Take insulin for high blood sugar 25.8% 24.1% 20.9% 22.1% Source: California Health Interview Survey, 2005, 2007, 2009
Standards of care for diabetics recommend annual foot exams, and regular hemoglobin
A1c testing. Among the adults diagnosed with diabetes, 5.5% have not had HgA1c
testing and 22.3%% have not had foot checks. The rate of diabetes screening in San
Bernardino County has increased from 2005 to 2009, and exceeds that among diabetics
in the state.
Adults with Diabetes, Screening
San Bernardino County
California 2005 2009
Never had doctor check feet for sores 29.4% 22.3% 27.0%
Never had HgA1C test 10.3% 5.5% 10.6% Source: California Health Interview Survey, 2005 + 2009
Cancer
The cancer incidence rate in San Bernardino County is 425.8 cases per 100,000
persons; this is lower than the state rate of 435.4 per 100,000 persons. When
compared to state cancer incidence rates, San Bernardino County has higher rates of
prostate, lung and bronchus cancer, colorectal cancer, cervical cancer and esophageal
cancer.

St. Bernardine Medical Center FY2014 Community Health Needs Assessment Page 54
Cancer Incidence per 100,000 Persons, 5-Year Average San Bernardino County California
All Cancers 425.8 435.4
Prostate Cancer 147.0 140.3
Breast Cancer 110.6 122.0
Lung and Bronchus Cancer 54.3 51.2
Colorectal Cancer 45.6 42.7
Cervical Cancer 9.1 8.0
Esophageal Cancer 4.8 3.9 Source: National Cancer Institute, 2006-2010

St. Bernardine Medical Center FY2014 Community Health Needs Assessment Page 55
Communicable Disease
Tuberculosis The rates of TB rose slightly in San Bernardino County from 2011 to 2012; however,
compared to the 3.7 cases per 100,000 persons seen in 2009, rates continue to decline
overall. The rates in the county continue to be about half those of the state.
Tuberculosis, 2011-2012
2011 2012
Cases Rate per 100,000 Persons
Cases Rate per 100,000 Persons
San Bernardino County 53 2.6 58 2.8
California 2,322 6.2 2,191 5.8 Source: Source: California Department of Public Health, Tuberculosis Control Branch, July 2013 Report
HIV/AIDS
San Bernardino County has 1,620 total cases of HIV, making it the 7th highest among
the 58 counties in the state based on number of diagnosed HIV cases. It is the 9th
highest in the state among 58 counties with the most diagnosed AIDS cases, at 4,359
cases.
HIV/AIDS Cases, Cumulative through December 31, 2013
San Bernardino
County Percent Deceased
San Bernardino County Percent Deceased
California
HIV Total Cases 1,620 8% 5%
AIDS Total Cases 4,359 53% 56%
Source: California Department of Public Health, Office of AIDS, HIV/AIDS Surveillance Section, 2014
Sexually Transmitted Diseases
San Bernardino County has a higher rate of Chlamydia, and a higher rate of Gonorrhea,
as compared to state rates. Females have the highest rates of Chlamydia and
Gonorrhea. Young adults, ages 20-24, and Blacks or African Americans have the
highest rates of sexually transmitted infections.
STD Cases, 2012
San Bernardino
County California San Bernardino County
Rate per 100,000 Persons
Rate per 100,000 Persons
Rate per 100,000 15-24 year-olds
Male Female
Chlamydia 571.6 448.9 1,105.0 3,654.2
Gonorrhea 90.3 89.3 241.9 379.8
Primary & Secondary Syphilis 2.6 7.8 N/A N/A
Early Latent Syphilis 1.8 6.6 N/A N/A Source: California Department of Public Health, STD Control Branch, 2012

St. Bernardine Medical Center FY2014 Community Health Needs Assessment Page 56
Health Behaviors
Health screenings and immunizations are widely accepted methods to help identify and
prevent disease.
Childhood Immunizations
For the 2012-2013 school year, 94.1% of students in San Bernardino County enrolled in
reporting kindergartens received all required immunizations (4+ DTP, 3+ Polio, 2+
MMR, 3+ Hep B, and 1+ Var or physician documented varicella disease). This rate is
higher than the state rate of 90.3%.
Kindergarten Immunization Rates, 2012-2013
San Bernardino County California
Kindergartners with required immunizations
94.1% 90.3%
Source: California Department of Health Services, Immunization Branch, 2012-2013
Preventive Practices
Seniors are particularly vulnerable to communicable respiratory diseases, and are
recommended to obtain yearly flu shots. In San Bernardino County, 62.8% of seniors
have obtained a flu shot.
Occult blood tests, sigmoidoscopy and colonoscopy screen for colorectal cancer. In
San Bernardino County, 23.8% of adults, age 50 and over, had been screened for
colorectal cancer. Pap smears screen for cervical cancer. Among adult women, 90.8%
received a Pap smear in the last three years. Mammograms are used for detection of
breast cancer and 78.3% of women, 40 years and over, received a mammogram in the
last two years. The rate of engaging in these health prevention activities is at a rate
below Healthy People 2020 objectives.
Preventive Practices
San Bernardino County
California Healthy People
2020
Senior flu shot 62.8% 68.3% 90%
Screening for colorectal cancer* 23.8%* 22.0%* 70.5%
Pap smear in last 3 years** 90.8** 89.9%** 93%
Mammogram in the last 2 years 78.3% 80.0% 81.1%
Source: California Health Interview Survey, 2011-2012, *2009, or **2007; Healthy People 2020 Objectives

St. Bernardine Medical Center FY2014 Community Health Needs Assessment Page 57
Overweight and Obesity
In San Bernardino County, 35.9% of adults are overweight and 33.2% are obese.
These percentages are higher than the state levels, and equate to well over two-thirds
of the adult population (69.1%) being overweight or obese. The percentage of
overweight has decreased but the level of obesity has increased over the last 7 years.
Overweight and Obese Adults
San Bernardino County California
2005 2007 2009 2011-2012
Overweight 37.5% 36.4% 36.0% 35.9% 35.0%
Obese 27.2% 26.5% 32.1% 33.2% 24.8% Source: California Health Interview Survey, 2005, 2007, 2009, 2011-2012
Youth in San Bernardino County also have high rates of obesity, although they are
lower than statewide levels – 15.6% are considered overweight or obese (Body Mass
Index in the top 5th percentile), with an additional 13.1% considered 'at risk of
overweight', with Body Mass Indexes in the 85th – 95th percentiles.
In addition, 15.6% of children 0 to 11 are considered overweight for their age (a
measurement which does not factor in height). This is higher than at the state level, and
has been trending up dramatically over the past 7 years.
Overweight and Obese Children 2-11, and Youth 12-17
San Bernardino County California
2005 2007 2009 2011-2012
Youth At Risk of Overweight (85th up to 95th Percentile BMI) 15.8% 14.6% 11.2% 13.1% 16.6%
Youth Overweight / Obese (Top 5% Body Mass Index) 11.9% 10.5% 21.4% 15.6% 15.8%
Children Overweight for Age (does not factor in height) 9.8% 11.5% 14.0% 15.6% 12.6% Source: California Health Interview Survey, 2005, 2007, 2009, 2011-2012
When levels of overweight and obesity among children were examined by city in the
service area, Colton was the poorest performing city at 46.1%. San Bernardino had
43.9% of children who were overweight or obese; this exceeds both county and state
rates.

St. Bernardine Medical Center FY2014 Community Health Needs Assessment Page 58
Overweight and Obesity among Children by City, 2010
City Percent
Colton 46.1%
Rialto 45.0%
Fontana 44.9%
San Bernardino 43.9%
Hesperia 41.0%
Highland 32.8%
Redlands 30.8%
Rancho Cucamonga 30.0%
Yucaipa 27.4%
San Bernardino County 39.3%
California 38.0% Source: California Center for Public Health Advocacy, 2012
Physical Activity
A sedentary lifestyle can lead to overweight and obesity and is a contributing factor to
many chronic diseases and disabilities. In San Bernardino County, 21.4% of children,
19% of teens and 16.2% of adults did not engage in at least one hour a day of physical
activity.
No Physical Activity
San Bernardino County California
Children, Ages 5-11 5.0% 8.4%
Teens 11.6% 9.3% Source: California Health Interview Survey, 2011-2012
One source of activity for kids is visiting a park, playground or open space. In San
Bernardino County, 76.2% of children and 67.8% of teens visited parks, playgrounds or
open spaces.
Visited a Park, Playground or Open Space
San Bernardino County California
Children 76.2% 85.1%
Teens 67.8% 73.0% Source: California Health Interview Survey, 2011-2012
Smoking Smoking continues to be a leading cause of preventable death in the United States.
Among adults in San Bernardino County, 14.5% are current smokers and 21.2% are
former smokers.

St. Bernardine Medical Center FY2014 Community Health Needs Assessment Page 59
Smoking Prevalence among Adults
San Bernardino County California
Current Smokers 14.5% 13.6%
Former Smokers 21.2% 22.9% Source: California Health Interview Survey, 2011-2012
Among current smokers in San Bernardino County, 35.1% of adults smoke 6-10
cigarettes a day, 19.8% smoke 11-19 per day, and 22.7% smoke 20 or more a day;
smokers in San Bernardino County tend to be heavier smokers than Californians in
general.
Number of Cigarettes Smoked per Day
San Bernardino County California
One or less 4.3% 1.6%
2-5 cigarettes 18.2% 21.6%
6-10 cigarettes 35.1% 41.4%
11-19 cigarettes 19.8% 14.6%
20 or more cigarettes 22.7% 20.8% Source: California Health Interview Survey, 2011-2012
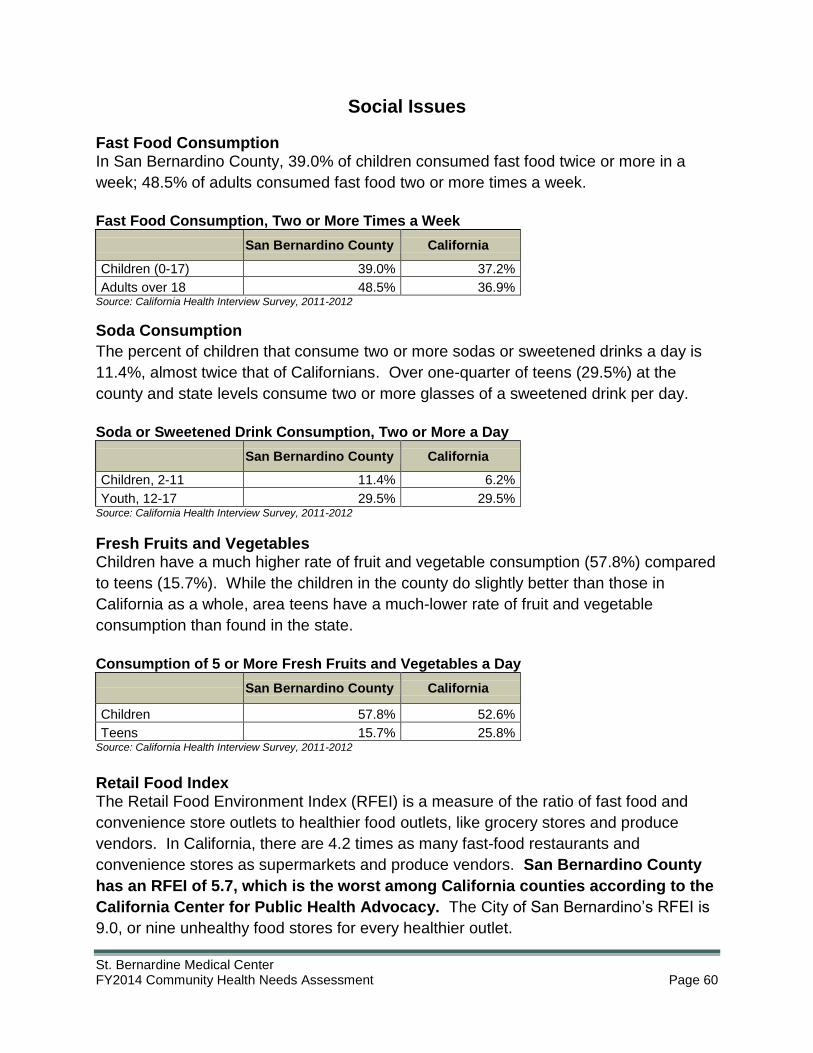
St. Bernardine Medical Center FY2014 Community Health Needs Assessment Page 60
Social Issues
Fast Food Consumption In San Bernardino County, 39.0% of children consumed fast food twice or more in a
week; 48.5% of adults consumed fast food two or more times a week.
Fast Food Consumption, Two or More Times a Week
San Bernardino County California
Children (0-17) 39.0% 37.2%
Adults over 18 48.5% 36.9% Source: California Health Interview Survey, 2011-2012
Soda Consumption
The percent of children that consume two or more sodas or sweetened drinks a day is
11.4%, almost twice that of Californians. Over one-quarter of teens (29.5%) at the
county and state levels consume two or more glasses of a sweetened drink per day.
Soda or Sweetened Drink Consumption, Two or More a Day
San Bernardino County California
Children, 2-11 11.4% 6.2%
Youth, 12-17 29.5% 29.5% Source: California Health Interview Survey, 2011-2012
Fresh Fruits and Vegetables Children have a much higher rate of fruit and vegetable consumption (57.8%) compared
to teens (15.7%). While the children in the county do slightly better than those in
California as a whole, area teens have a much-lower rate of fruit and vegetable
consumption than found in the state.
Consumption of 5 or More Fresh Fruits and Vegetables a Day
San Bernardino County California
Children 57.8% 52.6%
Teens 15.7% 25.8% Source: California Health Interview Survey, 2011-2012
Retail Food Index The Retail Food Environment Index (RFEI) is a measure of the ratio of fast food and
convenience store outlets to healthier food outlets, like grocery stores and produce
vendors. In California, there are 4.2 times as many fast-food restaurants and
convenience stores as supermarkets and produce vendors. San Bernardino County
has an RFEI of 5.7, which is the worst among California counties according to the
California Center for Public Health Advocacy. The City of San Bernardino‟s RFEI is
9.0, or nine unhealthy food stores for every healthier outlet.
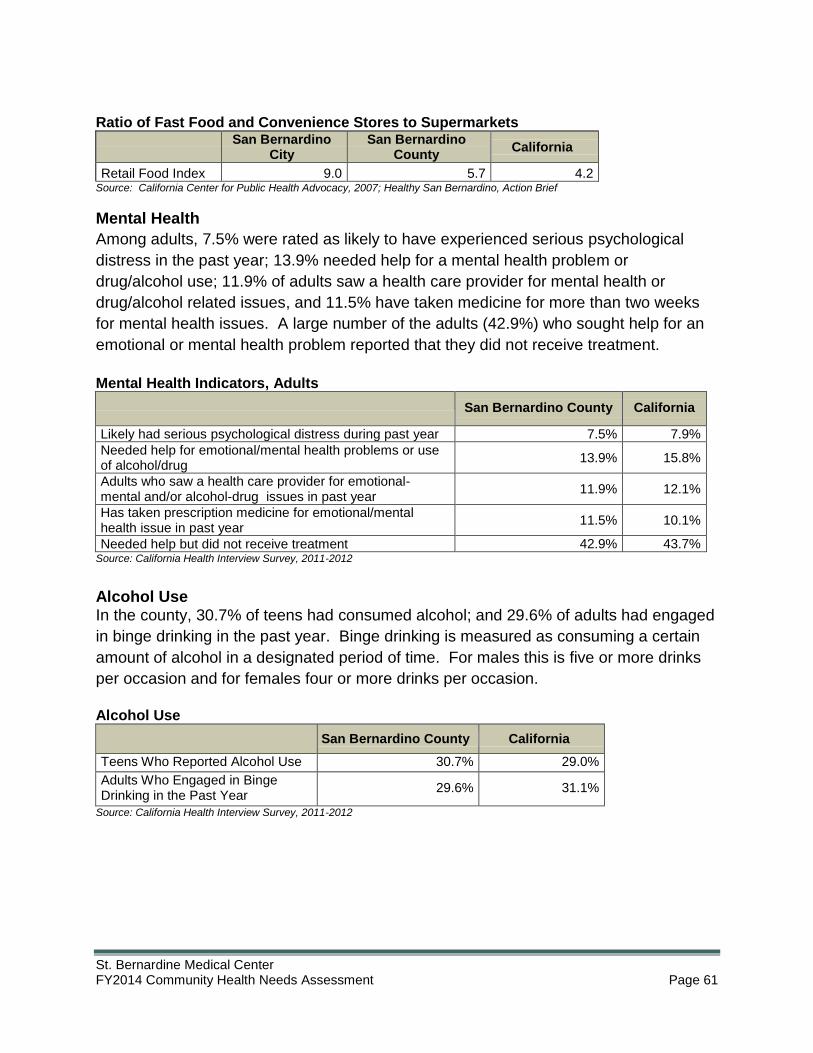
St. Bernardine Medical Center FY2014 Community Health Needs Assessment Page 61
Ratio of Fast Food and Convenience Stores to Supermarkets
San Bernardino
City San Bernardino
County California
Retail Food Index 9.0 5.7 4.2 Source: California Center for Public Health Advocacy, 2007; Healthy San Bernardino, Action Brief
Mental Health
Among adults, 7.5% were rated as likely to have experienced serious psychological
distress in the past year; 13.9% needed help for a mental health problem or
drug/alcohol use; 11.9% of adults saw a health care provider for mental health or
drug/alcohol related issues, and 11.5% have taken medicine for more than two weeks
for mental health issues. A large number of the adults (42.9%) who sought help for an
emotional or mental health problem reported that they did not receive treatment.
Mental Health Indicators, Adults
San Bernardino County California
Likely had serious psychological distress during past year 7.5% 7.9%
Needed help for emotional/mental health problems or use of alcohol/drug
13.9% 15.8%
Adults who saw a health care provider for emotional-mental and/or alcohol-drug issues in past year
11.9% 12.1%
Has taken prescription medicine for emotional/mental health issue in past year
11.5% 10.1%
Needed help but did not receive treatment 42.9% 43.7% Source: California Health Interview Survey, 2011-2012
Alcohol Use In the county, 30.7% of teens had consumed alcohol; and 29.6% of adults had engaged
in binge drinking in the past year. Binge drinking is measured as consuming a certain
amount of alcohol in a designated period of time. For males this is five or more drinks
per occasion and for females four or more drinks per occasion.
Alcohol Use
San Bernardino County California
Teens Who Reported Alcohol Use 30.7% 29.0%
Adults Who Engaged in Binge Drinking in the Past Year
29.6% 31.1%
Source: California Health Interview Survey, 2011-2012

St. Bernardine Medical Center FY2014 Community Health Needs Assessment Page 62
School and Student Characteristics
The San Bernardino City Unified School District (SBCU) was examined for selected
demographic and performance characteristics.
School Enrollment
School enrollment for 2012/2013 school year for San Bernardino City Unified totals
54,102 students.
Student Race/Ethnicity
The student population of SBCU District schools is overwhelmingly Latino (72.6%).
African Americans are the next most prevalent (14.1%). SBCU schools have a higher
percentage of Latinos and Blacks/African Americans and a smaller percentage of
Whites and Asians/Pacific Islanders than found in the county.
Race and Ethnicity of Students
San Bernardino
City Unified
San Bernardino
County
Hispanic or Latino 72.6% 62.5%
Black or African American 14.1% 9.2%
White 7.9% 20.5%
Asian/Pacific Islander 2.5% 5.1%
American Indian/Alaska Native 0.5% 0.5%
Other 2.4% 2.2%
Source: California Department of Education, 2012-2013
Free and Reduced Price Meal Program
The number of students eligible for the free and reduced price meal program is one
indicator of the socioeconomic status of a school district‟s student population. The
majority of students in SBCU are eligible for the free or reduced price lunch program
(91.5%), indicating a very high level of low-income families. This rate is significantly
higher than the county rate (68.4%).
Free and Reduced Price Meals
SBCU District San Bernardino County
Children eligible for free or reduced price lunch program 91.5%
68.4%
Source: California Department of Education, 2012-2013

St. Bernardine Medical Center FY2014 Community Health Needs Assessment Page 63
English Learners
The percentage of students who are English learners in the SBCU District is 27.2%,
greater than the rate of English Learners in the county (19.3%). When examining
district level data it is important to keep in mind that within each district there are a
number of schools with higher and lower rates of English Learners.
English Learners
SBCU District San Bernardino County
English Learners 27.2% 19.3%
Source: California Department of Education, 2012-2013
Student Proficiency
Testing for student proficiency indicates that 41.5% of students in all grades tested are
proficient in language arts, and almost half (49.5%) in math.
Language Arts and Math Proficiency
SBCU District
Language Arts proficient all grades 41.5%
Math proficient all grades 49.5%
Source: California Department of Education, 2012- 2013
High School Graduation and College Readiness
Among the schools in the SBCU District, the rate of graduation is 73.5%. This is lower
than the county graduation rate (77.2%).
High school students wishing to attend University of California or California State
University schools must complete a group of courses called the A-G college prep
curriculum. Among students in the SBCU District, 17.2% of the graduates are UC/CSU
eligible. This is much lower than the county rate of 31.1% of students.
High School Graduates and UC/CSU Ready Graduates
SBCU District San Bernardino County
Graduation Rate 73.5% 77.2%
UC/CSU Ready *17.2% *31.1%
Source: California Department of Education, 2011-2012 and *2012-2013
St. Bernardine Medical Center FY2014 Community Health Needs Assessment Page 64
Key Stakeholder Interviews
INTRODUCTION
Twenty telephone interviews were conducted for the Dignity Health Inland Empire
Community Hospital of San Bernardino and St. Bernardine Medical Center Community
Health Needs Assessment in February and March 2014. Interview participants included
stakeholders who represent medically underserved, low-income, and minority
populations, as well as the local health department, who spoke to issues and needs in
the communities served by the hospitals. Attachment 2 lists the interview participants
and their organizational affiliations.
INTERVIEW TOPICS
Interview participants were asked to share their perspectives on a number of topics,
including:
Biggest issues or concerns facing the community.
Changes in the economy and its impact on individuals and families.
Barriers to improving education and recommendations for supporting educational
attainment.
Challenges faced in accessing health care and mental health services and where
people go to access these services.
Client experiences in obtaining insurance from California‟s Health Insurance
Exchange.
Changes people are making to increase healthy foods in their diets along with
challenges to making these changes and resources being accessed to improve
nutrition.
Community and school safety concerns.
Services and programs to reduce and prevent violence as well as
recommendations for additional needed actions.
Services and programs that are effectively addressing community health issues
Community‟s strongest health care and social service assets.
Other notes and comments.
COMMUNITY ISSUES AND CONCERNS
The biggest issues and concerns in the community were identified as:
The economy, including high rates of unemployment, underemployment, lack of
jobs, low median income and large number of low-wage jobs.

St. Bernardine Medical Center FY2014 Community Health Needs Assessment Page 65
High rates of poverty and related issues, such as lack of access to health care
and limited access to other services, poor education levels, lack of affordable
housing, focus on meeting basic needs (e.g., food, shelter, clothing), inability to
purchase healthier food or gym memberships for exercise, poor life skills, and
chronic stress.
Poor health outcomes, including high rates of cardiovascular disease, diabetes
and obesity. Reasons given for poor health status included high poverty rates,
shortage of affordable health care resources for primary care, safety concerns
that prevent outdoor exercise, lack of access to healthy and affordable food (i.e.,
a food desert), air quality, smoking rates, chronic stress, lack of understanding of
how to navigate the system and access available resources, large numbers of
poor and undocumented people in the area who do not qualify for health
coverage, under-resourced health department and distance to Arrowhead
Regional Medical Center in Rialto.
High crime rates and lack of public safety, including thefts and violent crime,
resulting in fear among residents.
Poor education levels and limited educational opportunities.
Other concerns also identified:
Lack of affordable housing.
Unsettled city government (i.e., City Council and Mayor) that is struggling to
address current needs and issues.
Perceived lack of voice/empowerment among Latino population to organize, to
advocate for their issues and concerns, and to effect policy change.
Lack of funding to the community from local and statewide foundations.
THE ECONOMY
Economic Shifts or Changes
Interview participants were asked to share any shifts or changes they have seen over
the past few years in the economy of San Bernardino County.
Only one interview participant reported seeing positive shifts occurring in the
economy, including that people are becoming more philanthropic again and
employers are showing renewed interest in offering wellness opportunities for their
employees.
Four interviewees had mixed thoughts about the economic recovery, with positive
comments including that the economy is improving, there are fewer foreclosures
than before, and there is some job growth and new businesses countywide;
however, they also said that there are limited jobs for college-educated people in the
area, incomes in the area are not growing, the new Amazon distribution center hired
St. Bernardine Medical Center FY2014 Community Health Needs Assessment Page 66
many people but at minimum wage and in temporary positions, and the City of San
Bernardino is not showing the economic recovery seen in other parts of the county.
Fifteen of the 20 interviewees reported that the economy has stayed the same (very
bad) or even gotten worse over the past few years, with one person saying that
there has been “no change, it‟s as bad as it‟s ever been;” another saying, “it‟s gotten
worse, going downhill, not changed for the better;” and another saying, “The
economic situation is pretty dire in the City of San Bernardino.” Some of the
comments expressed by the interview participants included:
o Many jobs have been lost and it is a challenge for people to find jobs for
which they have the right skill set, including jobs in warehousing and at
distribution centers.
o The City of San Bernardino is in bankruptcy and so there is no financial
stability within the City itself. Many businesses are closing and leaving the
area, reducing job opportunities further.
o There is no middle class in San Bernardino. People are either rich or poor.
o Since the implementation of Health Care Reform, it has been harder for
people to find full-time jobs as employers are cutting back hours in order
to avoid providing insurance. As a result, people are now working 2-3 part-
time jobs to make the same income they formerly earned with one job.
Impact of the Economy on Individuals and Families
Participants were asked what the impact of the economy is on individuals and families.
Their responses included:
Greater number of uninsured.
High use of public assistance programs and difficulty purchasing healthy, fresh
food with food stamps.
Transience and unstable housing, including evictions and multiple families living
together.
Homelessness.
People working 2-3 part-time jobs in order to survive, which both compromises
quality family time and also results in earnings that are too high to qualify for
benefits or free services (though they are still sorely needed).
Unstable households/family environments, including children not being cared for
and witnessing drug and alcohol use as well as violent crimes, domestic
violence, high levels of frustration and stress, and increased incidence of elder
abuse.
As a result of the lack of employment opportunities and income, some people are
turning to crime, including selling drugs and prostitution.

St. Bernardine Medical Center FY2014 Community Health Needs Assessment Page 67
Employment is even more difficult to find for recently released parolees with
felony convictions, creating higher risk for them to re-engage in negative
behaviors.
People delay seeking medical care because they cannot afford it and prioritize
food or shelter over medical needs.
EDUCATION
Barriers to Improving Education
Interview participants were asked about the barriers that area residents face in
improving their education. The primary barriers reported by participants included the
following:
Many respondents focused on the lack of family support for children in primary
and secondary education, related to a number of economic and cultural issues,
and the resulting low graduation rates and significant lack of preparation in basic
skills (i.e., reading, writing, math) needed for successful applications to and
completion of higher education.
The lack of support for children in primary and secondary education was defined
to include not helping children with homework and not valuing homework or
education; lack of involvement with the school; not supporting children to get
sleep or to get basic nutrition or to get them to school on time; not encouraging
their children to stay in school and graduate; not reading to children from an early
age; and not helping children to consider career paths or higher education. The
economic and cultural barriers that impact this lack of support were identified to
include:
o Lack of education, English-language skills and literacy in any language
among many immigrant parents, as well as a tendency to value getting
a job over education.
o Lack of family history of going to college.
o Fear of school involvement due to being undocumented.
o Homelessness among families (there are a large number of homeless
children in San Bernardino schools) or parents working multiple jobs
and focused on addressing basic needs such as food and shelter
rather than their children‟s education.
o Lack of stability in the home environment, including poverty, violence,
alcohol and drug use, and overcrowded living situations.
In addition to economic and cultural barriers among families, school systems are
also not set-up for or able to adapt to the needs of children from unstable, chaotic
and homeless families.
St. Bernardine Medical Center FY2014 Community Health Needs Assessment Page 68
Cost of higher education, which is unaffordable for many in the City and County
of San Bernardino. Related issues are the small number of public higher
education facilities that are more affordable relative to the population size and
difficulty for many in navigating the student loan process. There are several high-
quality private schools in the area (e.g., Loma Linda University, University of
Redlands, University of La Verne), but these are unaffordable for many local
residents.
Poor quality of the K-12 school system, including very low rankings statewide.
Schools in the San Bernardino City School District have suffered budget cuts that
have resulted in class sizes that sometimes include 40-50 children, lay-offs of
many teachers, and cuts to classes in sports or the arts as resources are used to
teach the skills that will be tested. Hope for improvement to the school system
was expressed by several interviewees, due to the hiring of a new
superintendent.
Additional barriers to improving education were cited by interviewees as:
Adult School at the San Bernardino Unified School District offers good resources
to families, but space is limited and there is always a waiting list for these
programs.
Some families see their children‟s student loans as a source of income and use
those funds for the household rather than for their intended purpose.
It is difficult to complete college in a timely way as the number of classes
available in any given semester has been reduced and it can be difficult to get
the needed credits.
Lack of focus on education for women in Title One, which is focused instead on
education among different ethnic groups.
Some kids need to become financially stable before they can consider going to
college.
Rise in asthma among children, a leading cause of absenteeism in K-12.
Lack of opportunities for low-cost, affordable training for students in a wide
variety of health professions. There are few slots available in the more affordable
community colleges, so some students end up getting big loans to attend the
private colleges and their eventual income is not sufficient to repay the debt.
Suggestions to Improve Educational Attainment
Interview participants were asked to share their suggestions for supporting educational
attainment. Several positive programs and activities already in place were noted:
Resources offered at the Adult School.
St. Bernardine Medical Center FY2014 Community Health Needs Assessment Page 69
New District Superintendent who is seeking to develop partnerships with
businesses for internships and jobs and to identify kids not in school and at-risk
of dropping out.
Pipeline program in middle and high schools to educate students about the
health professions and encourage them to consider these options.
Programs to work with parents of young children to encourage students to
pursue their education.
CAPS and other after-school programs that assist students with homework and
provide a safe place for them to be after school.
Mayor‟s Educational Roundtable, which brings together community colleges,
CSU San Bernardino and the school district. The Roundtable also offers the
Golden Apple award to exemplary teachers and administrators as a way to
encourage others to strive for the award.
Recommendations for improving educational attainment within primary and secondary
education included:
Work more with and develop partnerships with parents to help them better
understand what is happening in the school environment and how they can
support their children at home. Also, invite them to school and assess their needs
and share information about resources.
Support the creation of a vision among families that includes high school
graduation and college, and where parents can encourage their kids to pursue
education.
Add physical education, arts and music classes back into the school curriculum
to better stimulate the intelligence and interest of more students and to foster
their interest in staying in school.
Add teachers to the classrooms.
Provide some vocational training in the schools.
Better educate students on basic skills of reading, writing and math so they can
be better prepared for higher education and adult life.
Separate English and Spanish learners so they can focus on where they are at
educationally.
Provide more ESL classes and encourage parents and grandparents to learn
English, the primary language spoken in this country.
Support and expand existing after school programs that provide a safe place for
students to go after school to complete their homework and get other support.
Current programs get filled quickly and more capacity is needed. Individualized
tutoring can make a big difference.
St. Bernardine Medical Center FY2014 Community Health Needs Assessment Page 70
Provide counseling for students so they can talk about the difficult things
happening in their home environment and develop more of an understanding of
the importance of getting sleep and good nutrition to support their ability to be
successful in school.
Teach students about the value of education in elementary school and educate
families about this as well.
Recommendations for improving educational attainment included:
Make higher education more affordable. For example, create more access to
lower cost, affordable higher education institutions.
Create more opportunities for affordable education in the health professions and
encourage kids to pursue these opportunities and then to work locally, to keep
local talent in the area.
Provide more educational guidance and support to students in higher education.
Work with them to develop a plan so that they are on a track and take the
courses needed to graduate in four years.
Create better access to electronic equipment and training for adults on its use.
Revive and strengthen the Mayor‟s Educational Roundtable and continue it within
the new Mayor‟s administration.
ACCESS TO HEALTH CARE AND MENTAL HEALTH SERVICES
Barriers to Accessing Services
Interview respondents were asked about the problems and challenges children and
families face in accessing health care and mental health services. Several interviewees
expressed uncertainty about how implementation of the ACA will ultimately impact
access and whether it will improve access over time. The most frequently identified
challenges in obtaining primary care were identified as:
Transportation to services for people without cars or who lack appropriate
transportation, including cost of the bus system, needing multiple bus lines to get
to services, families covered under different insurance plans requiring them to
go to multiple providers, and distance to services for people living in the High
Desert or for people who need specialty care services outside San Bernardino.
Cultural and immigration issues, including language barriers, fear of accessing
services associated with lack of documentation, ineligibility for Medi-Cal
coverage due to being undocumented, people not being treated with respect and
lack of cultural competency among health care professionals.
Shortage of low-cost, affordable primary care providers and community clinics to
meet the needs of the population. It was noted that San Bernardino has been
St. Bernardine Medical Center FY2014 Community Health Needs Assessment Page 71
designated a Medically Underserved Area; i.e., there is an insufficient number of
health care providers to meet the demand of the population.
Lack of insurance or ability to pay for insurance.
Challenges in navigating the health care system, understanding coverage (who,
what, where) or knowing how to access care and use coverage.
Additional challenges included:
Family members on multiple plans, creating hardships for families needing to go
to different providers in different locations with different paperwork requirements.
Lack of education or understanding about the importance of prevention, resulting
in people not accessing care until health problems are emergent, and then only
accessing the emergency room.
Continued use of the emergency room for primary care and non-emergent health
needs. Lack of education about the appropriate place to access care depending
on the health problem.
Lack of priority on health care for families struggling to meet basic needs.
Lack of hospitals that offer specialized services in San Bernardino, requiring
people to travel outside the area for some specialty care.
Long wait times for appointments at Arrowhead Regional Medical Center.
Limited clinic hours, with most open when people are at work or kids are at
school.
Needs among veterans in the area that are not being adequately met.
The primary difficulty identified to access mental health services was the shortage of
mental health providers and facilities for counseling, treatment and medication. A
particular need was identified for counseling services, as the County‟s Behavioral
Health Department is more focused on people with serious mental illness or who are
suicidal. It was noted that, “lower level counseling services are pretty much
unavailable… there‟s a huge, gaping hole in these services” and that, “most families
don‟t need psychiatric services, but could use basic counseling services related to
stress and to help prevent domestic violence, child abuse, etc.” Several mental health
service providers have closed due to lack of funding.
Other barriers to accessing mental health services were identified as:
Transportation.
Cultural/immigration issues, including the stigma associated with needing or
accessing mental health services among the Latino population and the need for
bilingual and bicultural providers.
St. Bernardine Medical Center FY2014 Community Health Needs Assessment Page 72
Restrictions to the mental health services covered under Medi-Cal and other
private insurance and that attempting to use these benefits is cumbersome.
People are unaware they have a mental health condition that could benefit from
services as they do not have a regular primary care provider who could make the
diagnosis and refer for further treatment and care provided in the emergency
room does not look to identify other needs among patients beyond the presenting
problem.
Where People Access Care
Interviewees were asked where people go to access health and mental health services.
The number one place identified for health care services was the emergency room,
including the emergency rooms at Community Hospital of San Bernardino, St.
Bernardine Medical Center, Arrowhead Regional Medical Center, and other area
hospitals. Reasons that people access the emergency room for care were identified as:
Open during evening and weekend hours when people are not working, so easier
for them to access.
People are caregivers for others and ignore their own health problems until they
become emergencies. Usually these are conditions that could have been treated
earlier on at the primary care level.
Homeless know they can access care at the emergency room without having to
pay. In addition, it gives them some place to be inside for the 3-4 hours they wait
to be seen.
Other sources of health care identified by interviewees included:
Low-cost clinics, including H Street Clinic, La Salle, and others that offer sliding
fee scale options.
Urgent care centers.
County Public Health clinics.
Arrowhead Regional Medical Center.
El Sol Neighborhood Educational Center‟s Promotoras Program provides
education to people in neighborhoods on health care resources. They are trusted
because they are also from the neighborhood and speak Spanish.
It was noted by several interview participants that some people do not access mental
health services at all. Some of the locations where people do access mental health
services included:
Emergency rooms are used to access anti-anxiety medications.
County Behavioral Health Department for severely mental ill (e.g., schizophrenia)
and people who are suicidal.

St. Bernardine Medical Center FY2014 Community Health Needs Assessment Page 73
Catholic Charities offers counseling services for low-income and uninsured, but is
limited to what can be offered.
San Bernardino Sexual Assault Services offers some walk-in counseling services
in the evenings that are dependent on grant funding and that fill-up quickly, and
also a 24-hour crisis hotline.
Experiences Accessing Coverage through the Health Insurance Exchange (Covered
California)
Interview participants were asked if people had attempted to obtain health insurance
coverage through Covered California, and what their experiences had been. A couple of
interviewees shared that people who had been able to obtain coverage were pleased
with the outcome. One participant noted a trend that people who were previously
insured and able to get coverage through the exchange at a lower rate were quite
happy, whereas those who had never been insured and were not familiar with the
culture of insurance were struggling with affordability concerns. As one person said,
“picking a plan and determining affordability is difficult to assess for those have not been
previously insured.”
Barriers experienced in the community to seeking coverage through Covered California
included:
The Covered California website was not ready initially, so people who tried to
enroll early on got frustrated with system problems. The website has improved
significantly over the past couple months.
People getting locked out of the system and unable to get back in.
Files created on earlier visits are gone when reentering site.
Instructions in languages other than English were not effective initially, leading to
a lot of frustration. There has been some improvement in this area.
Uncertainty about whether enrollment is confirmed. In some cases, people‟s
checks are not cashed.
Lack of tolerance/capacity for the process of enrolling online resulting in few
people who have followed through to completion. People are not sure how to pick
a plan, get frustrated, and give up.
Reluctance to provide personal information online.
People don‟t know where to get help with enrollment, including where to go or
who to call. They get overwhelmed and don‟t do anything at all.
Young people don‟t feel they can afford any cost at all for premiums and co-pays.
“Anything is too much.”

St. Bernardine Medical Center FY2014 Community Health Needs Assessment Page 74
Lack of education about the penalties of not enrolling and also about why having
health insurance is important. It is new for many, and so there is uncertainty
about whether it will help them or not.
Barriers that have been faced by community organizations include:
Long wait times to get Spanish-speaking enrollers trained. Bilingual enrollers are
much needed.
Difficulty in general getting enrollment counselors authorized, which caused
delays in being able to assist clients.
Much confusion initially about which entities were authorized to enroll people into
Medi-Cal.
Resources and support for people with education and enrollment were also identified,
including:
Presentations for parents at the school district.
Nonprofits such as Goodwill, Catholic Charities, Teachers for Healthy Kids,
Community Clinic Association of San Bernardino County, Central City Lutheran
Mission, Latino Health Coalition and other Latino advocacy organizations are
assisting with education and/or enrolment.
San Bernardino Sexual Assault Services provides computers that people can use
to enroll online.
Lung Health Line of the American Lung Association is helping people to enroll
nationwide, and has familiarity with all the State exchanges.
HEALTHY EATING/HEALTHY LIVING
Barriers to Accessing Healthy Foods and Improving Healthy Eating Habits
Interview participants were asked to share the barriers that people face in accessing
healthy foods and improving healthy eating habits. The primary barriers were identified:
Lack of grocery stores in the western part of the city of San Bernardino (i.e., a
food desert), creating transportation barriers for people without cars. People
need to either carry groceries on the bus, or walk, or not buy food at grocery
stores.
Prevalence of fast food outlets, liquor stores and convenience stores, where it is
difficult to find and purchase affordable fresh, healthy food.
Fresh produce and organic foods are expensive as well as not easy to locate in
lower-income neighborhoods. There are few if any stores geared toward
providing healthier foods at affordable prices (e.g., Trader Joe‟s, Sprouts, Fresh
„n Easy).
St. Bernardine Medical Center FY2014 Community Health Needs Assessment Page 75
Fast food is more convenient and affordable for those trying to stretch food
stamps or limited dollars to feed a whole family and who are working multiple
jobs with limited time to shop and prepare healthy meals, or who are living in
hectic and chaotic households.
o One interviewee characterized the appeal of fast food establishments
as follows: “The kids get a toy and get to play and are happy, the
family spends less money than if they bought and prepared food, the
place has air conditioning, everyone eats and gets full, and there are
no dishes to wash.”
o Another interviewee said that parents “Take the simple route and don‟t
take time to plan and prepare healthy meals. They want the quick fix
and offer what is quick and easy, such as potato chips, sugary cereals,
candy, pizza, fast food, hot dogs, macaroni & cheese, etc.”
Additional barriers to accessing healthy food and improving healthy eating habits
included:
Parents say that their kids do not like vegetables and will not eat them.
It is difficult to change habits, and takes time.
Constant advertising of fast food and sugary food.
The Latino culture views eating and being “fat” as signs of prosperity and
success.
Changes to Increase Healthy Foods in Diets and Resources for Improving Nutrition
Interview participants were asked what changes people are making to increase healthy
foods in their diets. Five of the respondents said that people are not making any
changes in this direction at all. Other respondents indicated that public awareness has
increased significantly around this issue, due in part to the Healthy San Bernardino and
other Healthy Cities initiatives that have adopted Increasing Access to Healthy Food as
a goal. These initiatives have fostered several programs toward this end, including:
Farm Share Program, which links local farmers with residents for drop-offs of
fresh produce at residents‟ homes on a weekly or biweekly basis for a fixed fee.
There is an effort underway to augment the produce with additional foods such
as rice, beans and milk to “complete their nutritional needs.”
Community Gardens, including one 10-acre garden that has 60-80 plot owners
and a waiting list. There is a one-time fee and participants do not have to pay for
water.
Farmer‟s Markets started in a number of cities.
Fruit orchard at Nicholson Community Center.
Corner store conversions aimed at getting convenience stores to sell healthier
foods at affordable prices.

St. Bernardine Medical Center FY2014 Community Health Needs Assessment Page 76
While these programs represent community-wide action across several cities to achieve
the goal of greater access to healthy food, utilization of these programs by lower-income
communities is still thought to be minimal – and access to affordable, fresh produce is
still considered difficult.
In addition to these initiatives, a number of efforts are underway to provide outreach and
education to the community to raise awareness of nutrition and teach skills such as how
to shop, read food labels, and prepare healthy food that is culturally relevant. These
outreach and education efforts include:
Promotoras Program through El Sol offers education to community members on
how to shop, nutrition, physical activity, etc.
Catholic Charities is encouraging clients to start by making a few basic nutritional
changes, such as increasing fresh produce and water intake, and decreasing
soda consumption.
Latino Health Collaborative is encouraging potlucks where clients can share
healthy recipes and has made a policy change to only offer healthy snacks at
meetings.
Several organizations, including St. Catherine of Siena Catholic Church, Catholic
Charities and H Street Clinic, have offered cooking classes to help Latino families
incorporate healthier ingredients into traditional recipes.
Information available on the internet, such as the American Heart Association
website that includes information on how to read food labels, how to shop for
healthy food, and how to substitute healthier food options when preparing cultural
foods.
Education to students and families through the schools to promote healthier
choices.
Other resources, programs and initiatives that are promoting healthy eating include:
WIC.
Offering healthier food at soup kitchens and reducing the amount of sugary and
processed food that is accepted.
Availability of food pantries through churches to make food more available to
people with limited access to food, and an effort to coordinate these food
distributions across the participating churches.
Advertisements and promotional materials from health providers, including:
Dignity Health Hospitals, Loma Linda University Medical Center, Kaiser
Permanente, Healthy San Bernardino Collaboratives, schools, Community Vital
Signs project, and others.
Calorie counts on restaurant menus.
St. Bernardine Medical Center FY2014 Community Health Needs Assessment Page 77
COMMUNITY AND SCHOOL SAFETY
Community and School Safety Issues
Interview participants were asked to share the community and school safety issues that
people in the community are facing. One interviewee said there is a “culture of violent
crime in the area” and that much of the crime goes unreported, as people are “afraid of
retaliation.” Several participants indicated that the generally high crime rate in the area,
including significant gang and drug involvement, is related to the high rates of
unemployment and poverty, leaving people with too much idle and time and creating
desperation for income. Several interviewees commented on the fact that kids living in
the more impoverished areas are being exposed to and witnessing considerable
violence in their homes and on the streets, and that in some cases parents are using
alcohol or drugs or are gang members themselves, leaving kids to basically raise
themselves. It was additionally noted that many kids are left home alone, as child care
is very expensive.
The most frequently identified community and school safety issues were identified to
include:
Gang involvement.
Drug use and trafficking.
Bullying.
Prostitution and human trafficking.
Lack of sidewalks and lighting that compromises pedestrian safety for kids
walking to school, or for people walking in their neighborhood.
Inability for children to play or walk outside due to fear of violence. Sometimes
kids have to cross gang territories to get to school, putting them at risk.
Weapons on school grounds.
Large number of registered sex offenders living in the county.
Ex-felons being released into the area with nowhere to live and without resources
to assist them in their re-entry process, putting them at higher risk for recidivism.
Graffiti and trash.
Lack of confidence in the police due to extremely slow response times; often,
there are so many burglaries that they are unable to respond in a timely way.
Sexting and negative use of social media.
Increases in elder abuse by their own families.
Fear associated with random acts of violence that happen frequently in the city.
St. Bernardine Medical Center FY2014 Community Health Needs Assessment Page 78
Services, Programs and Community Efforts Working to Prevent and Stop Violence
Interview participants were asked to identify the services, programs and community
efforts they are aware of that are working to prevent, reduce and stop violence in the
community. Their responses included:
Education occurring through the schools to teach positive behavior to youth,
conflict management, and safety.
Partnerships between police departments in several cities and schools, such as
gang intervention programs for at-risk youth, youth policing, and engaging with
youth in other, positive activities.
Better communication and coordination among law enforcement agencies (e.g.,
city police, school police and parole officers).
Partnerships between police in several cities, faith organizations and other
agencies to help people recently released from prison to get back on their feet.
This is also a focus of the Cal State University San Bernardino Re-Entry Initiative
(CSRI).
A number of organizations that are helping prevent violence through programs
that offer activities for youth involvements and/or provide other youth and family
support, such as:
o Boys & Girls Club
o Boy Scouts and Girl Scouts
o Rim Family Services
o Young Visionaries
o Cal State University San Bernardino Re-Entry Initiative (CSRI)
Programs that are working to improve neighborhoods, such as the former
Operation Phoenix that brought code enforcement teams into neighborhoods;
Safe Routes to School programs through Young Visionaries; a program to keep
parks safer by providing lighting on basketball courts in the evenings; work by the
Department of Public Health to minimize liquor outlets and thereby reduce
associated crime; and an initiative underway by the Latino Health Collaborative
to develop a Good Neighbor program in the unincorporated area of Muscoy (i.e.,
to create a neighborhood where people look out for each and help to deter
crime).
Several community partnerships were also identified that are working to prevent
and reduce violence, such as:
o San Bernardino Guns and Drugs Task Force, working with schools on
parent education.
o Healthy San Bernardino Coalition and other Healthy Cities initiatives,
helping to improve community infrastructure (e.g., sidewalks) and
starting community gardens.
St. Bernardine Medical Center FY2014 Community Health Needs Assessment Page 79
Increased police presence at schools, which are now “locking down campuses
like little forts,” which has helped reduce violence in the schools.
Additional Actions Needed to Prevent or Reduce Community and School Violence
Interview participants were asked what else is needed to prevent or reduce community
and school violence. Their responses included:
Provide more extra-curricular activities for youth, including arts and sports, to
engage them in healthy and positive activities and keep them busy after school. It
was noted that schools should remain open and offer these activities during after-
school hours rather than locking up and sending kids out to the community – in
many cases to empty homes and to opportunities to get into trouble with gangs
or drugs or crime.
Strengthening the family unit. Several interviewees talked about the importance
of parent presence and involvement and caring for their kids‟ welfare and
wellbeing. One strategy suggested to achieve this was having conversations with
parents and providing education and tools to help build healthy relationships,
ensure there is time for families to connect, learn appropriate ways of disciplining
children and generally promote a positive family environment. More involvement
of fathers in their families was also recommended.
Address the underlying causes of violence, such as poverty, substance addiction,
culture of gangs and unemployment. Create more jobs and employment
opportunities.
Education and training for students and teachers on how to prevent bullying.
Remove graffiti and trash and generally clean up the city to create a cleaner and
safer-looking community.
Address the specific needs of first generation Latino families, where huge
disconnects can develop between immigrant parents and their kids. It is
important to engage these parents and help them to understand their kids and to
get more involved.
Provide more support to the many parolees and sex offenders who live in San
Bernardino to help prevent recidivism.

St. Bernardine Medical Center FY2014 Community Health Needs Assessment Page 80
SERVICES THAT ARE EFFECTIVELY ADDRESSING COMMUNITY HEALTH
ISSUES
Interview participants were asked to identify the community‟s strongest health care
and/or social service assets as well as the services, programs and community efforts
they think are effectively addressing community health issues in the area.
Strongest Community Health Care and Social Service Assets
The strongest health care and social service assets were identified to include:
Dignity Health Hospitals, including St. Bernardine Medical Center and
Community Hospital of San Bernardino, as they are located in the middle of the
community, have a history in the community and are trusted by the community.
People “feel cared for” by these hospitals, and are “drawn to them.” St.
Bernardine Medical Center has also initiated an after-school program and links
patients who have experienced violent crimes to mental health counselors.
Other hospitals in the area, including Kaiser Permanente Fontana, Loma Linda
University Medical Center and Arrowhead Regional Medical Center. Several
people expressed appreciation that all the smaller hospitals in San Bernardino
have remained open and kept their emergency services open 24-hours per day
(despite operating at a loss), creating access to health care for the community at
all times.
Loma Linda University Medical Center was noted for being a teaching facility that
is world renown and also offers some community-based programs, including
Partners for Better Health, which is looking to expand the Farm Share program at
a low-income housing project called Waterman Gardens, and dental services
through their School of Dentistry.
Community clinics that offer low-cost, affordable health care, including SACH
Clinics, La Salle, H Street Clinic, Al-Shifa Clinic, Whitney Young Family Health
Clinic, Assistance League of San Bernardino, Buddhist Tzu Chi Free Medical
Clinic.
Promotoras program out of El Sol Neighborhood Education Center, which
provides health-related education and resources in Spanish to neighborhood
residents.
Some of the strongest social service organizations were identified as:
o Time for Change Foundation – works with formerly incarcerated
women through their Positive Futures Project to help them re-enter into
society.
o Young Visionaries – promotes positive youth development and
emergency shelter for at-risk youth.

St. Bernardine Medical Center FY2014 Community Health Needs Assessment Page 81
o Catholic Charities – provides mental health services, youth
development programs, immigration services, and other programs.
o El Sol Neighborhood Education Center – Runs the Promotoras
program to provide health education and resources to neighborhood
residents.
o Latino Health Collaborative – Works to improve the health of Latinos
and the community by addressing barriers that impact health and
access to care.
Healthy San Bernardino and the other Healthy Cities collaboratives throughout
the county, which have all “taken it upon themselves to look at opportunities for
change and are doing good things.” Approximately 18 cities are a part of the San
Bernardino Healthy Community initiative through the San Bernardino Department
of Public Health. It was reported that they have collaborated well to “get the word
out to their communities.”
Healthy San Bernardino is a partnership between the City of San Bernardino,
Latino Health Collaborative and other local agencies. Healthy San Bernardino
has provided leadership on a number of programs designed to improve health,
including:
o Striders, a weekly program that includes education and a physical
activity. One focus of the education is civic engagement, to build
advocacy skills among residents.
o Fruit Orchard at Nicholson Community Center, developed out of a
partnership that included Latino Health Collaborative, El Sol
Neighborhood Center, and Credible Edible Community Garden.
o A community garden for veterans, designed to stimulate job/skills
development and other programs.
Other Community Programs that are Impacting Health
Other community programs, services and collaborative efforts that are making a
difference in the community were identified to include:
American Heart Association, which has programs to promote physical activity
and healthy eating among youth, worksite wellness programs, blood pressure
screenings, education of women on signs of stroke and risk for cardiovascular
disease, and that also lobbies for reduction in exposure to second-hand smoke
and provides culturally relevant resources for Latinos.
Programs to help recently released prisoners, including a collaborative out of the
Rialto Police Department and the Barrios Unidos program, run by the Catholic
Church.
Sexual Assault Services in San Bernardino, which offers after-school programs,
counseling services and free dental services.
St. Bernardine Medical Center FY2014 Community Health Needs Assessment Page 82
Goodwill Industries, which helps provide employment opportunities and has a
veteran‟s initiative.
Native American Resource Center, run by Riverside-San Bernardino County
Indian Health, which provides peer support groups, talking circles and other
resources of people working on behavioral health issues.
Community Clinic Association of San Bernardino County.
Incredible Edible Community Gardens.
YMCA, which operates the CAPS after-school program.
New collaborative of area nonprofits which have come together to attract more
funding in order to better serve the community.
Inland Empire Asthma Coalition.
Rim Family Services.
Faith communities and efforts to build their capacity.
Veteran‟s services.
Nutrition Network.
San Bernardino County Capacity Building Consortium.
Funders Alliance.
Mary‟s Mercy Center – Provides residential services to pregnant women and
their children.
Collaborations that have come together between police and other nonprofits to
coordinate homeless services and address the needs of the homeless.
COMMENTS
At the close of the interview, participants were given an opportunity to share any final
thoughts or comments. Several participants expressed their support for the Dignity
Health Hospitals, including comments such as “keep up the good work,” “they are an
important part of the community they serve,” and “we are always pleased with the
services from these hospitals.” They also expressed appreciation for the ability to
participate in the needs assessment process and their hopes that it will improve the
health of the community. Several also requested a copy of the final Community Health
Needs Assessment.
Other comments:
Several longer-term strategies are underway that should ultimately result in
community improvement, including:
o Business community is looking to make some improvements to the
downtown area.
o New transit line and a new transit center will make San Bernardino
more a center.

St. Bernardine Medical Center FY2014 Community Health Needs Assessment Page 83
o Newly elected Mayor and City Council appear to have a positive
attitude.
o Newly hired Superintendent of the school district is implementing some
new strategies to improve the district.
Resident involvement in many of the City and County collaborations is missing
and is a necessary component for making decisions that will be relevant to and
accepted by community residents.
All people need to be treated with dignity. It is important to become inclusive
instead of exclusive, and not judge people by how they look or smell.
Parenting programs are needed to help parents understand their children‟s
needs and respond to them. More of a focus for parents is needed on putting
their children first, instead of themselves.
Mental health care resources are sorely needed. Some people need to be on
medication and can‟t get them. They could probably be functioning adults if they
were able to access medications.
It is important that there be an understanding that violence in the home impacts
the whole community, and especially children. Kids are severely impacted,
affecting their mental health, physical health, ability to learn and do homework,
etc.
Hospitals are the “heartbeat” of the community – they are where people go. A
suggestion is to co-locate more services at or near the hospitals (e.g., mental
health counselors, crisis counselors, translation services) to create more one-
stop like centers at hospitals.
The area needs some larger hospitals that can provide more specialized services
so people don‟t need to travel to Los Angeles for these services.
Politicians do not yet fully understand the relationship of many community ills
(e.g., poverty, unemployment) to health.
People do not understand the value of prevention and delay seeking care until
they are very sick and need emergency services.
Catholic Charities expressed their appreciation of the partnership with
Community Hospital, which has benefited the whole neighborhood and allowed
Catholic Charities to develop and offer programs that they couldn‟t offer
otherwise.
Families are very much valued in the Latino culture and this should be taken into
account when designing programs.
The presence of the Dignity Health hospitals helps to keep the communities
moving forward. Loss of these hospitals would be devastating to the communities
where they are located.
St. Bernardine Medical Center FY2014 Community Health Needs Assessment Page 84
Focus Groups
INTRODUCTION
Six focus groups were conducted for the Dignity Health Inland Empire Community
Health Needs Assessment in February and March 2014. A total of 54 people
participated in the groups, including 10 males and 44 females. Two of the groups were
conducted in Spanish and the other four groups were conducted in English.
Focus group participants were asked to share their perspectives related to topics within
the following issue areas:
Overall Community Issues and Health Concerns
Access to Health Care and Mental Health Services.
Healthy Eating.
Community and School Safety.
Hospital Involvement in the Community.
Additional Comments.
OVERALL COMMUNITY ISSUES AND HEALTH CONCERNS
A number of significant community-wide issues and concerns were raised across all
focus groups. The overall biggest issues facing the community were identified to
include:
Poverty and joblessness, including overall downturn in economy, unemployment,
loss of jobs and homes, lack of jobs for the unemployed, mostly part-time work
without insurance benefits, homelessness and low-wage jobs (i.e., “wages not
sufficient to survive”).
Concerns about education, including dropouts, a poor school system, and lack of
understanding about the importance of education.
Cultural and immigration issues expressed by participants in the Spanish-
language groups, including losing ties to culture, discrimination against Latinos,
deportations, and people without papers/lack of documentation.
Family stress, including kids raising kids because parents are on drugs and a
disproportionate burden on women.
Crime and drug issues, such as gang activity, car theft, public drug abuse and
sales, prostitution, violence and graffiti.
Lack of activities for youth.
Lack of awareness of available community resources.
Infrastructure concerns, such as potholes that cause flooding when it rains,
uneven sidewalks, and lack of sidewalks.

St. Bernardine Medical Center FY2014 Community Health Needs Assessment Page 85
Lack of support for ex-felons who get dumped into the streets, and so are likely
to act out again.
Transportation.
The biggest health concerns for people and their families were identified as:
Chronic diseases, such as asthma, cancer, diabetes, obesity among children and
adults, high blood pressure and high cholesterol.
Depression and stress.
Hunger.
Dental problems and difficulty accessing dental care.
Alcoholism and drug dependency.
Presence of liquor stores on every corner and a lot of alcohol advertisements.
Lack of health insurance.
Homeless who are required to leave the shelter during daytime hours and fend
for themselves on the street, sometimes in extreme temperatures.
Lack of money to buy medications or pay for medication co-pays.
Long waits for specialty care services.
ACCESS TO HEALTH CARE AND MENTAL HEALTH SERVICES
Focus group participants were asked if they have had insurance over the past year and
if they have a regular source of care. Responses included:
Of the 13 participants in the two Spanish-speaking groups, one had private
insurance and another had Medi-Cal. Most of the women indicated that they do
not go a doctor unless they have to, due to cost; however, some reported that
they access community clinics or Arrowhead Regional Medical Center for care.
In contrast, 10 of the 12 Goodwill employee participants indicated that they have
Kaiser Permanente insurance through their employment and that they use these
services. One participant was a veteran and accesses VA services. Another
participant said she uses Arrowhead Regional Medical Center for her children
only, but does not access any care for herself.
Eight of the 12 participants in the Catholic Charities Youth Program indicated that
they have insurance. Participants in this group access the following resources for
care:
o Arrowhead Regional Medical Center.
o Any emergency room.
o Free clinics.
o Public health clinic.
o Metropolitan Clinic.
o Loma Linda University Medical Center.

St. Bernardine Medical Center FY2014 Community Health Needs Assessment Page 86
o Community Hospital of San Bernardino physicians and emergency room.
o Kaiser Permanente.
Of the 12 homeless participants in the Salvation Army group, 9 reported having
Medi-Cal and two had coverage through the VA. These participants access the
following resources:
o Hospitals, including Community Hospital of San Bernardino, St.
Bernardine Medical Center, Arrowhead Regional Medical Center, and the
VA.
o Inland Family Community Health Center D Street Clinic (family practice,
mental health and dental services).
o Metropolitan Clinic at Highland & G Street, which has long waits for people
without an appointment.
Half of the participants in the Al-Shifa Clinic group said they did not have private
insurance. The others have Medi-Cal or the Ability to Pay (ATP) program through
the Los Angeles Department of Health Services. (LAC-DHS). These participants
reported using:
o Al-Shifa Clinic.
o El Monte Comprehensive Health Center through the LAC-DHS, as this
clinic has the ATP program and enables the participant at her daughter
(both undocumented) to access affordable specialty care in addition to
primary care.
For mental health, focus group participants reported that they access the following
service location:
Behavioral Health Clinic on D Street.
Phoenix Clinic.
Meza Clinic.
VA.
Inland Health.
Focus group participants were asked if they had accessed health insurance through the
State‟s Insurance Exchange, Covered California. Their responses included a
combination of successful applicants who obtained coverage (3); people who attempted
to access coverage and either got confused or felt the costs were too high and so did
not pursue the application (2); one who is still in the application process; and people
who said they were undocumented and so ineligible for coverage (5). None of the youth
participants, Goodwill employees or homeless participants had attempted to access the
Exchange, as most were already insured. The only two problems participants identified
accessing health insurance were (a) cost; and (b) immigration status (i.e., those who
are undocumented).
St. Bernardine Medical Center FY2014 Community Health Needs Assessment Page 87
Focus group participants were also asked about the problems or challenges they face
obtaining needed health care and mental health services. Their responses included:
Long wait times at clinics, in emergency rooms, and at the Department of
Behavioral Health.
Cost issues, including:
o High cost of health care services and medications.
o Income too much to qualify for Medi-Cal, but cost of care too
expensive.
o Hospitals overcharge for services.
o Co-pays and deductibles for services and medications are too high.
Immigration issues, including:
o Fear among undocumented workers of accessing services.
o Inability to access insurance due to immigration status.
Limited access issues, including:
o Inability to access dental services under Medi-Cal over age 18.
o Insurance coverage is often limited and excludes some medications.
o Veterans have limited access to their doctors due to overextended
caseloads, and are only able to see their primary care physician once
every six months. Veterans are also required to access VA services at
Loma Linda, and will not be seen at local hospitals.
Poor treatment by health professionals, including:
o Rude workers and being “treated terribly.”
o Doctors and nurses are impersonal and have poor relationships with
patients.
o Lack of cultural proficiency among health professionals.
o Stereotyping and profiling reported by the homeless participants,
including (a) getting less service than other people; (b) only getting
generic medications; and (c) assumption that they are all addicts.
Transportation issues, including:
o Distance of walk to bus stop can be prohibitive depending on weather
or physical condition of person.
o Cost of using the bus can be prohibitive (some participants said they
can only use the bus if they have a voucher).
o Referrals from Arrowhead Regional Medical Center to multiple places
for tests and services.
Poor quality services at Behavioral Health clinic.
See different doctors at each visit and so providers do not know the patients.
Lack of knowledge about available services and how to access them.
St. Bernardine Medical Center FY2014 Community Health Needs Assessment Page 88
Focus group participants were asked what would make it easier for families to obtain
health care and mental health services. Their responses included:
All people covered by health insurance.
A good job with insurance.
More Spanish language capability and cultural competency among providers.
More affordable care with fewer income restrictions.
One-stop health care services, where services are co-located and easier to
access.
Updated and readily accessible electronic information about doctors‟ credentials
for patients to make choices about which doctor to select.
Electronic information for doctors about patients so they can see patient histories
and issues.
Bus passes/vouchers to facilitate transportation to services.
VA contracts with local hospitals so area veterans can access services locally.
Mobile clinics that go the areas where people live.
More clinics in the area like Al-Shifa.
More help enrolling people into health insurance.
HEALTHY EATING
Focus group participants were asked to share healthy changes they and their families
have made to the way they eat. Responses included:
Drink less soda.
Eat less sweets, red meat, oil, salt, fried food, less junk food, candy, chips,
gluten, flour, dairy, tortillas, bread and sugar.
Vegetarian diet.
Eat more fruits and vegetables, salads, chicken and fish.
Eat smaller portions/moderation in food consumed.
More conscious of calories and cholesterol consumed.
Weekly weigh-in to help lose weight.
Drink more water.
Started eating breakfast.
Trying to eat more organic food, but it‟s expensive.
More exercise, including walking more, going to gym and working out with videos
on You Tube.
Barriers faced in staying healthy were identified by focus groups to include:
Lack of knowledge and education.
St. Bernardine Medical Center FY2014 Community Health Needs Assessment Page 89
o Parents not educated about how to eat healthy and do not feed their
children healthy food.
o No nutrition classes in schools for children.
o Culture/expectation of “cleaning your plate.”
Change is difficult
o Children resist change and will often throw away fruits and vegetables
provided to them at school.
o Difficult to cut back on sweets and to control portion sizes.
Cost/Affordability
o Healthy food and organic food is too expensive.
o Difficult to find healthy food that is inexpensive/affordable.
o Fast food is everywhere, cheap, filling and feeds more people than
healthy food for the dollar.
Homeless participants living in the shelter said they are required to eat what is
provided at the shelter and cannot bring food into the shelter unless there is
enough to share with all residents or they have a doctor‟s note.
Barriers to exercising included:
o Takes time to exercise and too tired after getting home from work
(gone from 6am – 8pm and use public transportation to get to/from
work).
o Too dangerous to walk outside at night.
o Physical disabilities (knee pain, hip problems).
Participants were asked whether they have access to fresh produce and if so, where
they purchase fresh produce and their mode of transportation to these locations. A
number of local places were identified where people purchase fresh produce, including:
Super A, Superior, Food for Less, Trader Joe‟s, Clark‟s, Cardenas Market, El Super,
Stater Bros. grocery store, Walmart Store (new store that is selling fresh produce),
Fresh „n Easy, Sprouts, Costco, El Super, and a local Swap Meet near Valley College.
Some comments about these locations included:
Healthy food is just too expensive to buy.
Trader Joe‟s can be expensive.
Will shop anywhere where there are sales or specials.
Fresh „n Easy is only located in Rancho Cucamonga and Rialto, the San
Bernardino location closed down.
Cardenas has well-priced produce but it is ripe and needs to be eaten quickly.
The Stater Brothers downtown closed and other markets are far away, making
access difficult for people living in the homeless shelter.
Have access to many small liquor stores/convenience stores that cost more and
don‟t sell healthy food.

St. Bernardine Medical Center FY2014 Community Health Needs Assessment Page 90
Use of Farmer‟s Markets is minimal at best. Participants in the Spanish-language
groups, youth group and most of the clinic participants were not aware of any local
Farmer‟s Markets. The Goodwill employees, homeless shelter participants and one
participant from Al-Shifa were aware of Farmer‟s Markets at Perris Hill Park and City
Hall, but all said that the markets are located in unsafe areas and do not carry a lot of
fresh produce. In addition, the homeless shelter participants noted that they are unable
to bring food into the shelter, which limits what they purchase.
Focus group participants were asked to share where they get information about
nutrition, exercise and overall health. Responses included:
WIC.
Doctor‟s office or community clinic.
Local agencies, including Boys & Girls Club, Catholic Charities, El Sol and
Salvation Army shelter.
Television.
Internet and You Tube.
Magazines and newspaper.
Employer (Goodwill Industries).
School.
Amway.
COMMUNITY AND SCHOOL SAFETY
Participants were asked about community and school violence they have witnessed or
experienced or that they are aware of in their neighborhoods. Participants in all groups
reported a high degree of violence in their neighborhoods, and shared that much of this
occurs openly on the street as well as in schools, in parking lots, in parks, by bus stops,
and by liquor stores. The only places were participants reported feeling safe are at
home (primarily), at the agency sites where the focus groups were held (e.g., El Sol,
Catholic Charities, Salvation Army), at church, the library, or at work.
They types of violence that participants reported as occurring frequently in their
community included:
Shootings and homicides.
Drug use and trafficking; “people doing crack on the street, just everywhere.”
Prostitution – near schools and on the streets.
Fighting in general, and between different ethnic groups (e.g., African Americans
and Latinos; Anglos and Latinos).
Domestic violence.
Home invasions and robberies.
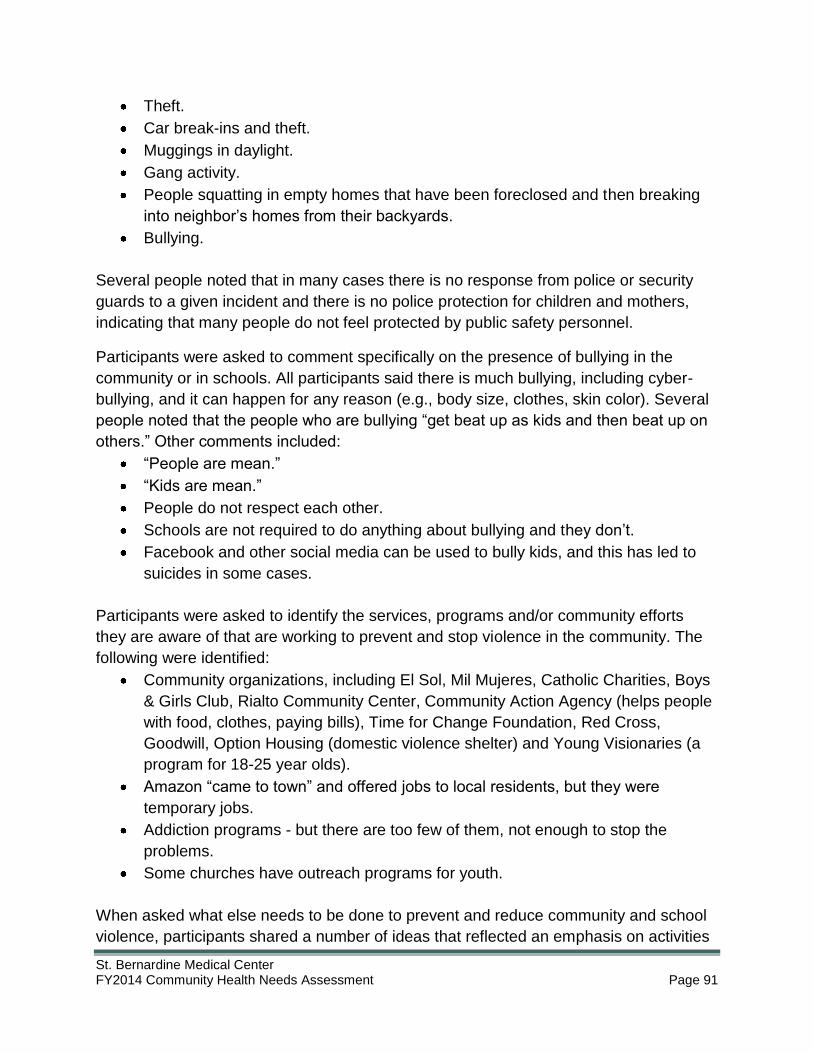
St. Bernardine Medical Center FY2014 Community Health Needs Assessment Page 91
Theft.
Car break-ins and theft.
Muggings in daylight.
Gang activity.
People squatting in empty homes that have been foreclosed and then breaking
into neighbor‟s homes from their backyards.
Bullying.
Several people noted that in many cases there is no response from police or security
guards to a given incident and there is no police protection for children and mothers,
indicating that many people do not feel protected by public safety personnel.
Participants were asked to comment specifically on the presence of bullying in the
community or in schools. All participants said there is much bullying, including cyber-
bullying, and it can happen for any reason (e.g., body size, clothes, skin color). Several
people noted that the people who are bullying “get beat up as kids and then beat up on
others.” Other comments included:
“People are mean.”
“Kids are mean.”
People do not respect each other.
Schools are not required to do anything about bullying and they don‟t.
Facebook and other social media can be used to bully kids, and this has led to
suicides in some cases.
Participants were asked to identify the services, programs and/or community efforts
they are aware of that are working to prevent and stop violence in the community. The
following were identified:
Community organizations, including El Sol, Mil Mujeres, Catholic Charities, Boys
& Girls Club, Rialto Community Center, Community Action Agency (helps people
with food, clothes, paying bills), Time for Change Foundation, Red Cross,
Goodwill, Option Housing (domestic violence shelter) and Young Visionaries (a
program for 18-25 year olds).
Amazon “came to town” and offered jobs to local residents, but they were
temporary jobs.
Addiction programs - but there are too few of them, not enough to stop the
problems.
Some churches have outreach programs for youth.
When asked what else needs to be done to prevent and reduce community and school
violence, participants shared a number of ideas that reflected an emphasis on activities

St. Bernardine Medical Center FY2014 Community Health Needs Assessment Page 92
for youth, building relationships with public safety, increasing jobs and economic
opportunities, and education to raise public awareness. Their suggestions included:
Engage churches.
More activities for youth.
More recreation centers.
Community policing programs where police interact with the community.
Self-defense classes.
Places in community to go talk about these issues and learn about how to deal
with them.
Greater police presence.
Schools need to crack down on kids who are bullying.
Fix up streets and neighborhoods.
More jobs for local residents, particularly unskilled labor jobs.
Less discrimination in hiring.
Remodel and reopen empty/vacant storefronts as a way to attract more
businesses and prevent thefts.
Education to help raise awareness among children and more public awareness in
general.
Institute a panic button for kids with a GPS to track where they are if something
occurs.
HOSPITAL INVOLVEMENT IN THE COMMUNITY
Focus group participants were asked to identify both what local hospitals are currently
doing to benefit and improve the community as well as what else they could or should
be doing toward this end. Most participants were unaware of hospital activities in the
community, but the following programs and services were identified:
Various programs offered by Arrowhead Regional Medical Center, including their
5k run, free mammograms, and an Asthma Mobile that goes to schools to help
kids and their parents.
Free glasses in Redlands.
Dental work offered by Loma Linda School of Dentistry.
Hospitals staying open/not closing down.
Vision screening.
Suggestions for what roles hospitals could play to help address community needs
included:
Programs and services for the undocumented.
Programs for the unemployed.
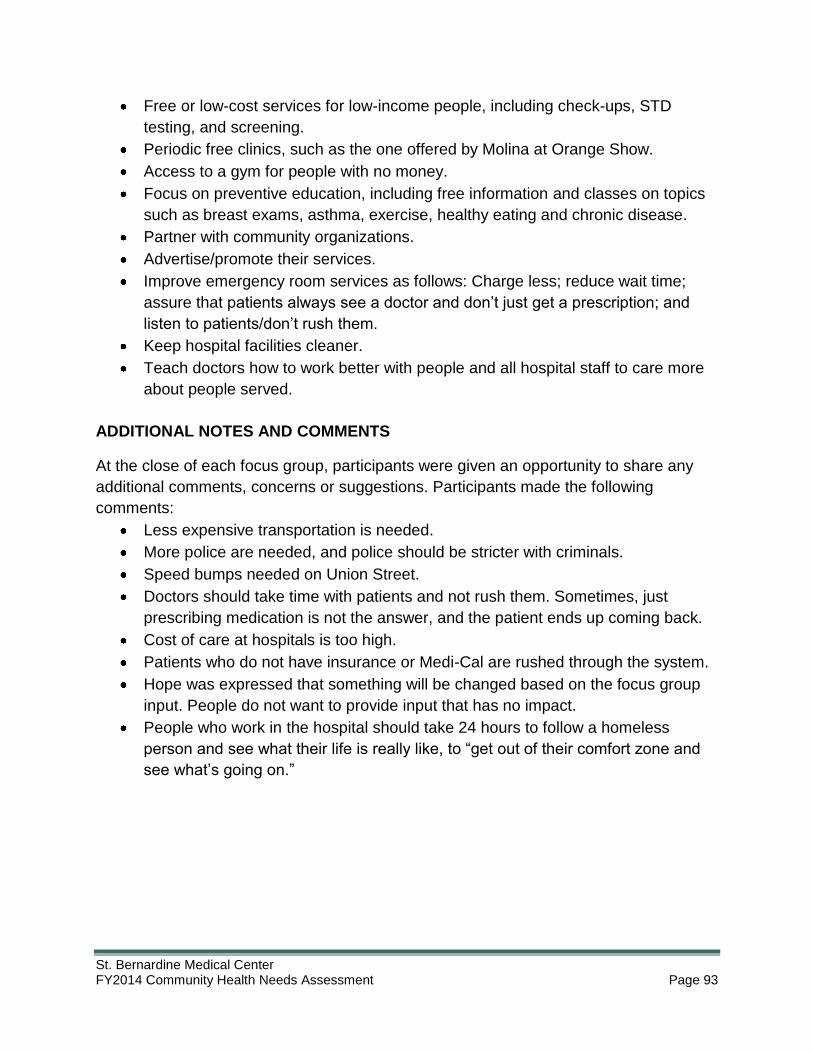
St. Bernardine Medical Center FY2014 Community Health Needs Assessment Page 93
Free or low-cost services for low-income people, including check-ups, STD
testing, and screening.
Periodic free clinics, such as the one offered by Molina at Orange Show.
Access to a gym for people with no money.
Focus on preventive education, including free information and classes on topics
such as breast exams, asthma, exercise, healthy eating and chronic disease.
Partner with community organizations.
Advertise/promote their services.
Improve emergency room services as follows: Charge less; reduce wait time;
assure that patients always see a doctor and don‟t just get a prescription; and
listen to patients/don‟t rush them.
Keep hospital facilities cleaner.
Teach doctors how to work better with people and all hospital staff to care more
about people served.
ADDITIONAL NOTES AND COMMENTS
At the close of each focus group, participants were given an opportunity to share any
additional comments, concerns or suggestions. Participants made the following
comments:
Less expensive transportation is needed.
More police are needed, and police should be stricter with criminals.
Speed bumps needed on Union Street.
Doctors should take time with patients and not rush them. Sometimes, just
prescribing medication is not the answer, and the patient ends up coming back.
Cost of care at hospitals is too high.
Patients who do not have insurance or Medi-Cal are rushed through the system.
Hope was expressed that something will be changed based on the focus group
input. People do not want to provide input that has no impact.
People who work in the hospital should take 24 hours to follow a homeless
person and see what their life is really like, to “get out of their comfort zone and
see what‟s going on.”

St. Bernardine Medical Center FY2014 Community Health Needs Assessment Page 94
Attachment 1. CNI Scores by Zip Code Lowest Need
Highest Need
1 - 1.7 Lowest
1.8 - 2.5 2nd Lowest
2.6 - 3.3 Mid
3.4 - 4.1 2nd Highest
4.2 - 5 Highest
Zip Code CNI Score City County State
91730 4 Rancho Cucamonga San Bernardino California
92220 4.4 Banning Riverside California
92223 4.6 Beaumont Riverside California
92316 4.6 Bloomington San Bernardino California
92324 4.8 Colton San Bernardino California
92325 3.6 Crestline San Bernardino California
92335 4.8 Fontana San Bernardino California
92336 3.6 Fontana San Bernardino California
92337 3.8 Fontana San Bernardino California
92345 4.4 Hesperia San Bernardino California
92346 4.2 Highland San Bernardino California
92373 3.2 Redlands San Bernardino California
92374 4 Redlands San Bernardino California
92376 4.6 Rialto San Bernardino California
92377 2.6 Rialto San Bernardino California
92392 3.6 Victorville San Bernardino California
92399 3.8 Yucaipa San Bernardino California
92401 5 San Bernardino San Bernardino California
92404 5 San Bernardino San Bernardino California
92405 5 San Bernardino San Bernardino California
92407 4.6 San Bernardino San Bernardino California
92408 5 San Bernardino San Bernardino California
92410 5 San Bernardino San Bernardino California
92411 5 San Bernardino San Bernardino California
92543 4.8 Hemet Riverside California
92544 4.4 Hemet Riverside California
92545 4.2 Hemet Riverside California
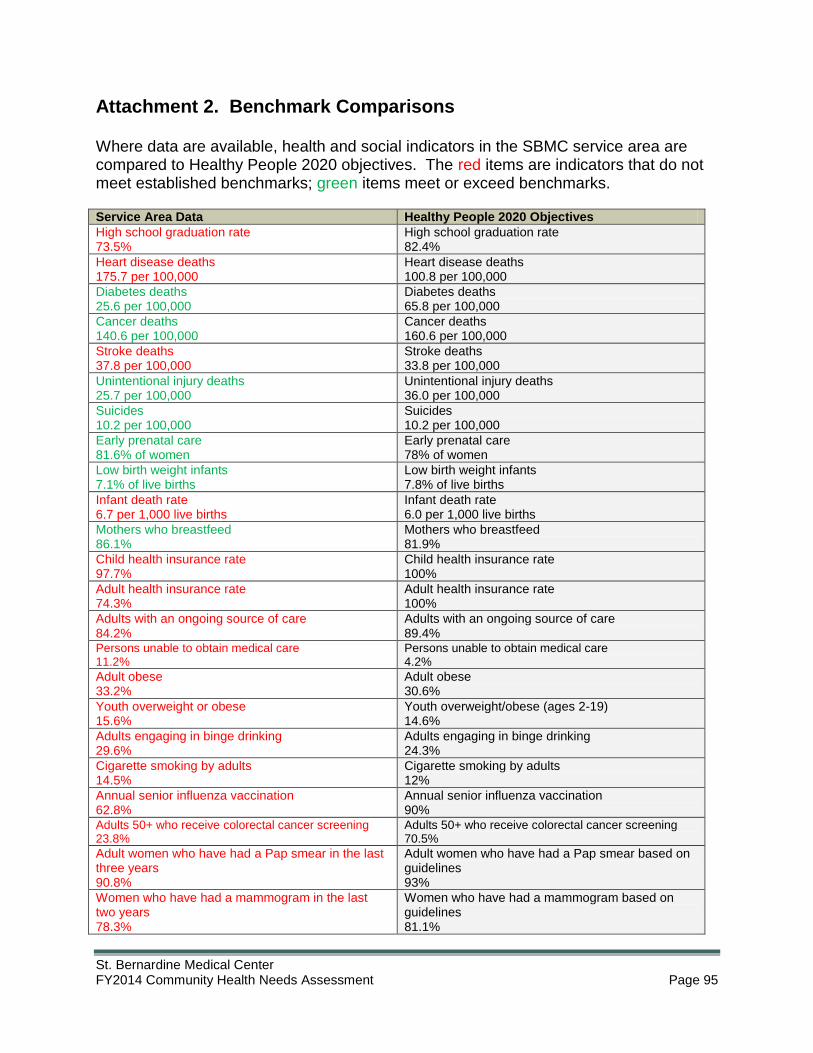
St. Bernardine Medical Center FY2014 Community Health Needs Assessment Page 95
Attachment 2. Benchmark Comparisons
Where data are available, health and social indicators in the SBMC service area are compared to Healthy People 2020 objectives. The red items are indicators that do not meet established benchmarks; green items meet or exceed benchmarks. Service Area Data Healthy People 2020 Objectives
High school graduation rate 73.5%
High school graduation rate 82.4%
Heart disease deaths 175.7 per 100,000
Heart disease deaths 100.8 per 100,000
Diabetes deaths 25.6 per 100,000
Diabetes deaths 65.8 per 100,000
Cancer deaths 140.6 per 100,000
Cancer deaths 160.6 per 100,000
Stroke deaths 37.8 per 100,000
Stroke deaths 33.8 per 100,000
Unintentional injury deaths 25.7 per 100,000
Unintentional injury deaths 36.0 per 100,000
Suicides 10.2 per 100,000
Suicides 10.2 per 100,000
Early prenatal care 81.6% of women
Early prenatal care 78% of women
Low birth weight infants 7.1% of live births
Low birth weight infants 7.8% of live births
Infant death rate 6.7 per 1,000 live births
Infant death rate 6.0 per 1,000 live births
Mothers who breastfeed 86.1%
Mothers who breastfeed 81.9%
Child health insurance rate 97.7%
Child health insurance rate 100%
Adult health insurance rate 74.3%
Adult health insurance rate 100%
Adults with an ongoing source of care 84.2%
Adults with an ongoing source of care 89.4%
Persons unable to obtain medical care 11.2%
Persons unable to obtain medical care 4.2%
Adult obese 33.2%
Adult obese 30.6%
Youth overweight or obese 15.6%
Youth overweight/obese (ages 2-19) 14.6%
Adults engaging in binge drinking 29.6%
Adults engaging in binge drinking 24.3%
Cigarette smoking by adults 14.5%
Cigarette smoking by adults 12%
Annual senior influenza vaccination 62.8%
Annual senior influenza vaccination 90%
Adults 50+ who receive colorectal cancer screening 23.8%
Adults 50+ who receive colorectal cancer screening 70.5%
Adult women who have had a Pap smear in the last three years 90.8%
Adult women who have had a Pap smear based on guidelines 93%
Women who have had a mammogram in the last two years 78.3%
Women who have had a mammogram based on guidelines 81.1%

St. Bernardine Medical Center FY2014 Community Health Needs Assessment Page 96
Attachment 3. Key Stakeholder Interviewees
Contact Title Organization
Leslie Bramson, Dr.PH Assistant Professor Department of Pediatrics, Loma Linda University Medical Center
Aviana Cerezo Mayor‟s Office Legislative Aide/ Healthy San Bernardino Coalition Co-Chair
City of San Bernardino
Ellen Daroszewski, NP Executive Director H Street Clinic
Deborah Davis Executive Director Legal Aid Society of San Bernardino
Alexander Fajardo Executive Director El Sol Neighborhood Educational Center
Alton Garrett, Jr. President of Board of Directors African American Health Institute of San Bernardino County
Eric Goddard Director of Administration California State University San Bernardino, Re-Entry Initiative (CSRI)
Salvador Gutierrez Program Manager Latino Health Collaborative
Tom Hernandez Homeless Services Manager Office of Homeless Services, Department of Behavioral Health
Angela Jones, RN Health Services Coordinator San Bernardino City Unified School District
Matthew Keane Executive Director Community Clinic Association of San Bernardino County
Chuck Leming Staff Analyst II San Bernardino County Department of Public Health, Healthy Communities Program
David Nagler Pastor/CEO Central City Lutheran Mission
Faye Pointer Board Member St. Bernardine Medical Center
Fr. Stephen Porter Pastor St. Catherine of Siena Catholic Church
Terry Roberts Area Director American Lung Association of California
Ken Sawa CEO Catholic Charities San Bernardino & Riverside Counties
Candy Stallings Executive Director San Bernardino Sexual Assault Services
Monique Stensrud Business Development Director, Inland Empire Division Office
American Heart Association
Michael Wright Community Services Supervisor City of Fontana, Community Services Department
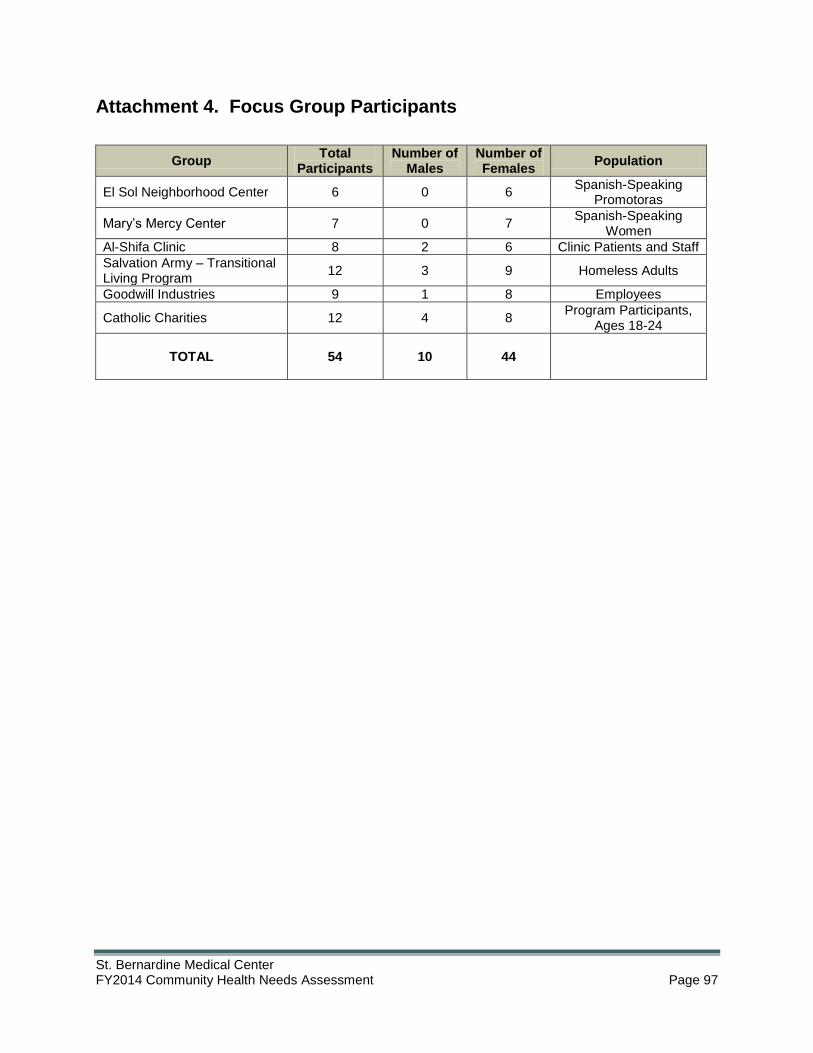
St. Bernardine Medical Center FY2014 Community Health Needs Assessment Page 97
Attachment 4. Focus Group Participants
Group Total
Participants Number of
Males Number of Females
Population
El Sol Neighborhood Center 6 0 6 Spanish-Speaking
Promotoras
Mary‟s Mercy Center 7 0 7 Spanish-Speaking
Women
Al-Shifa Clinic 8 2 6 Clinic Patients and Staff
Salvation Army – Transitional Living Program
12 3 9 Homeless Adults
Goodwill Industries 9 1 8 Employees
Catholic Charities 12 4 8 Program Participants,
Ages 18-24
TOTAL
54 10 44

St. Bernardine Medical Center FY2014 Community Health Needs Assessment Page 98
Attachment 5. CBIC Member Roster
Nick Calero District Director Office of Senator Mike Morrell Redlands, CA
Lowell King Regional Operations Officer Goodwill Southern California San Bernardino, CA
Aviana Cerezo Assistant to the Mayor City of San Bernardino San Bernardino, CA
Chuck Leming Department of Public Health San Bernardino, CA
Joanne Claytor, LCSW Social Services Supervisor SBMC San Bernardino, CA
Cynthia Luna Partner LF Leadership Claremont, CA
Deborah Davis Legal Aid of San Bernardino San Bernardino, CA
Linda McDonald Inland Empire Service Area VP Mission Services SBMC San Bernardino, CA
Beverly Earl Director, Family & Community Services Catholic Charities San Bernardino/Riverside San Bernardino, CA
Kathleen McDonnell Inland Empire Service Area Manager Community Benefit SBMC San Bernardino, CA
Val Head Inland Empire Service Area Director Strategic Business Development, CHSB San Bernardino, CA
Elizabeth Moran Inland Empire Service Area Manager Communications/Media/Advocacy CHSB San Bernardino, CA
Michael J. Hein Vice President/Administrator Mary‟s Mercy Center San Bernardino, CA
Renee Paramo, RN, IBCLC Manager, Baby & Family Center SBMC San Bernardino, CA
Sr. Deenan Hubbard, CCVI SBMC Board Member Villa de Matel Houston, TX
Faye Pointer SBMC Board Member Rialto, CA
Jackie Kimball, RN Manager, Clinical Support Services SBMC San Bernardino, CA
Michelle Rainer, MPA, MSG VP/Executive Director SBMC Foundation San Bernardino, CA

St. Bernardine Medical Center FY2014 Community Health Needs Assessment Page 99
Sandra Rodriguez, Principal San Bernardino High School San Bernardino, CA
Margo Young, C.PP.S., MD Inland Empire Service Area Director Community Health SBMC San Bernardino, CA
Carrie Schmidt Manager, Volunteer Services CHSB San Bernardino, CA
Sandee Zschomler VP/Executive Director CHSB Foundation San Bernardino, CA