stakeholder perception survey
DESCRIPTION
Managed by IFC, in partnership with the UK Government and NoradTRANSCRIPT
StakeholderPerceptionSurvey
Managed by IFC, in partnership with the UK Government and NoradSouthAsia Enterprise Development Facility
January 2013
IFC Advisory Services in South Asia


Stakeholder PercePtion Survey | January 2013
This is the final report of the survey of stakeholder perceptions of private sector development in Nepal,
undertaken to support the SouthAsia Enterprise Development Facility and National Business Initiative
Nepal. The work was carried out by Solutions Consultant Pvt. Ltd. led by Ashish Shrestha, who designed
the methodology and developed the report. Substantial inputs to the survey design and report were
provided by Laura Watson (IFC), Vazha Nadareishvili (IFC), Syed Estem Dadul Islam (IFC), Sayef Tanzeem
Qayyum (IFC), Catrin Froehlich (NBI), and Padma Jyoti (NBI).

Stakeholder PercePtion Survey | January 2013
ContentsExecutive Summary .................................................................................................................................................................. 7
Key Findings ................................................................................................................................................................................... 8
Perceptions of the current economic scenario ................................................................................................................ 8
Perceptions of the priority areas for reform, government, and regulations ........................................................ 8
Business and labor reforms .................................................................................................................................................... 9
Private sector ............................................................................................................................................................................... 9
Information sources and knowledge about priority investment areas ................................................................. 10
Key Insights .................................................................................................................................................................................... 10
Introduction ..................................................................................................................................................................................... 11
Background to the survey ................................................................................................................................................... 11
Survey objectives ........................................................................................................................................................................ 12
Methodology ................................................................................................................................................................................. 13
Stakeholder Groups ................................................................................................................................................................. 13
Survey Sample ............................................................................................................................................................................. 14
Private businesses .................................................................................................................................................................... 14
Opinion makers ........................................................................................................................................................................ 15
Labor representatives.............................................................................................................................................................. 15
Data Collection and Fieldwork ........................................................................................................................................ 16
Data collection method ......................................................................................................................................................... 16
Findings ................................................................................................................................................................................................. 17
Perceptions of the Current Economic Scenario .................................................................................................. 17
Business and the economy in Nepal ................................................................................................................................. 17
Perceptions of the Priority Areas for Reform, Government, and Regulations ........................... 22
Priority areas for reform ......................................................................................................................................................... 22
Government in relation to business and the economy .............................................................................................. 23
Business perceptions of government policy and regulations ................................................................................... 26
Business and Labor Reforms .............................................................................................................................................. 34
Perceptions of business reforms ......................................................................................................................................... 34
Perceptions of labor reforms ............................................................................................................................................... 36
Private Sector ................................................................................................................................................................................ 38
The private sector and its activities .................................................................................................................................... 38
Private sector issues that need to be addressed ........................................................................................................... 39
Activities to improve the private sector’s reputation ................................................................................................... 40
Levels of trust across industries and the reliability of products/services ............................................................. 41
Obstacles to business growth.............................................................................................................................................. 42
Nepal Investment Year 2012-13 ...................................................................................................................................... 44
Awareness of Nepal Investment Year 2012-13 ............................................................................................................ 44
Focus areas for Nepal Investment Year 2012-13.......................................................................................................... 44
Investment and benefits of the development of priority sectors (hydropower, tourism, agriculture) ..... 45
List of FiguresFigure 1: Perceptions of the current direction of business and the economy in Nepal .......................................................... 18
Figure 2: Perceptions of Nepal’s economy compared to five years ago ......................................................................................... 18
Figure 3: Perceptions of stakeholders’ financial situation (business or personal) now and in the previous year ....... 19
Figure 4: Current personal concerns ............................................................................................................................................................. 20
Figure 5: Current concerns with respect to business and the economy ......................................................................................... 21
Figure 6: Priority areas for reform .................................................................................................................................................................. 22
Figure 7: Government and the ease of doing business ......................................................................................................................... 23
Figure 8: Government as a facilitator for doing business ..................................................................................................................... 24
Figure 9: Government as an obstacle to doing business ....................................................................................................................... 26
Figure 10: Government response to the economic crisis through fiscal policies and banking regulations (businesses only) .................................................................................................................................................................................. 27
Figure 11: Perceptions of Nepal’s economic policies with regard to business (businesses only) ........................................... 27
Figure 12: Reasons for favorable perceptions of economic policies/environment (businesses only) ................................... 28
Figure 13: Reasons for unfavorable perceptions of economic policies/environment (businesses only) ............................. 29
Figure 14: Perceptions of current levels of business regulation (businesses only) ....................................................................... 30
Figure 15: Perceptions of current business regulations in Nepal (businesses only) ..................................................................... 30
Figure 16: Reasons for favorable perceptions of business regulations (businesses only) ......................................................... 31
Figure 17: Reasons for unfavorable perceptions of business regulations (businesses only) .................................................... 32
Figure 18: Perceived barriers to investment (businesses only) .............................................................................................................. 33
Figure 19: Perceived problems with government regulations related to investment (businesses only) ............................ 33
Figure 20: Perceived meaning(s) of business reforms ............................................................................................................................... 34
Figure 21: Perceptions of business reforms ................................................................................................................................................... 35
Figure 22: Perceptions of the impacts of business reforms .................................................................................................................... 36
Figure 23: Perceptions of labor reforms (labor only) ................................................................................................................................ 37
Figure 24: Priority areas for labor reforms (labor only) ........................................................................................................................... 37
Figure 25: Perceptions of the private sector ................................................................................................................................................. 38
Figure 26: Issues that the private sector needs to address (top priority only) ............................................................................... 39
Figure 27: Activities to improve the reputation of the private sector ............................................................................................... 40
Figure 28: Perceptions of the responsible behavior of businesses (labor and opinion makers only) .................................. 41
Figure 29: Perceptions of product/service quality ....................................................................................................................................... 42
Figure 30: Obstacles to business growth (businesses only) ..................................................................................................................... 43
Figure 31: Awareness about Nepal Investment Year 2012-13 ............................................................................................................... 44
Figure 32: Focus areas for Nepal Investment Year 2012-13 .................................................................................................................... 45
Figure 33: Awareness and perceptions of government initiatives for investment in hydropower ...................................... 46
Figure 34: Reasons why the development of the hydropower sector is beneficial to Nepal .................................................. 47
Figure 35: Reasons why the development of the tourism sector is beneficial to Nepal ........................................................... 48
Figure 36: Reasons why the development and commercialization of the agriculture sector is beneficial to Nepal .... 49
Figure 37: Frequently used sources of information on business and the economy .................................................................... 50
Figure 38: Trusted sources of information on business and the economy ...................................................................................... 51
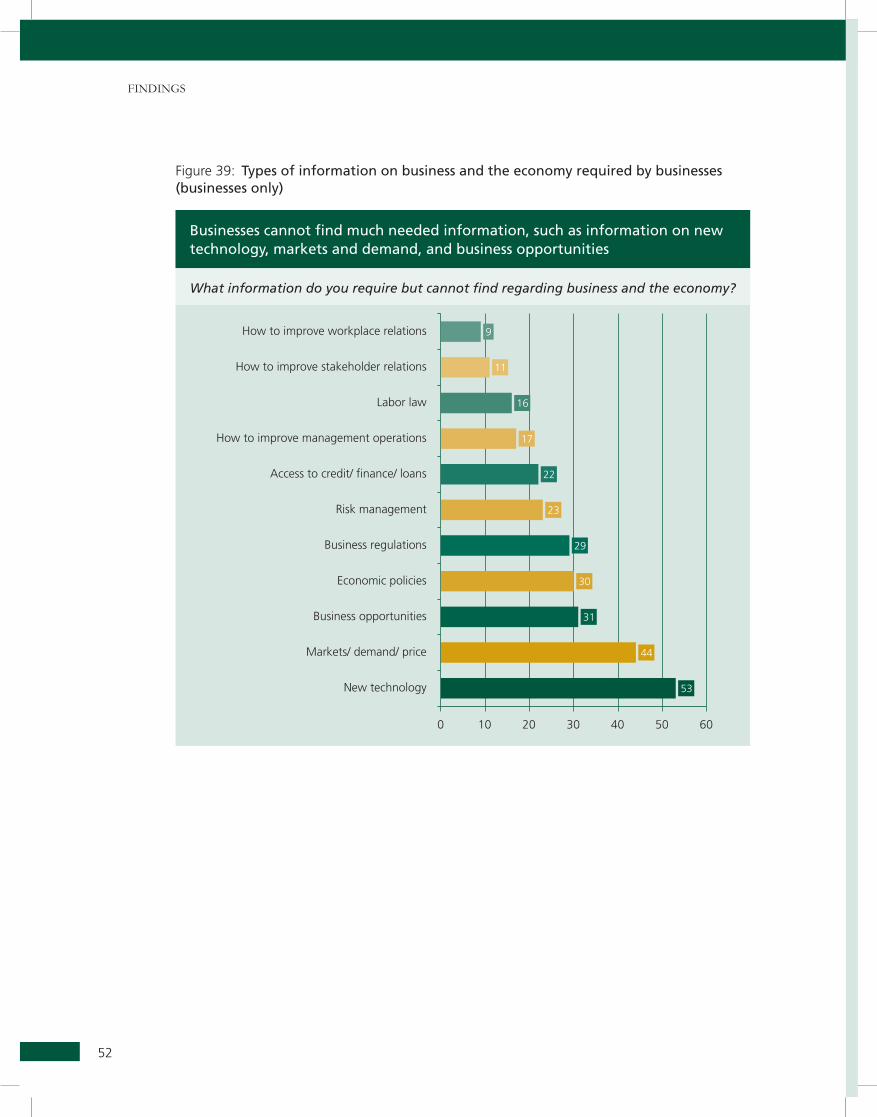
Figure 39: Types of information on business and the economy required by businesses (businesses only) ....................... 52
List of TablesTable 1: Sample distribution of private businesses .................................................................................................................................... 14
Table 2: Sample distribution of opinion makers ......................................................................................................................................... 15
Stakeholder PercePtion Survey | January 2013
This report is the outcome of a collaboration between National Business Initiative and the SouthAsia Enterprise Development Facility.
About NBI in NepalNational Business Initiative is an NGO founded and led by major Nepali private sector organizations. Its objective is to strengthen the role and capacity of the private sector in contributing to sustainable peace in Nepal. NBI promotes conducive stakeholder relations and inclusive economic growth in order to contribute to economic development and stability in Nepal.
About SEDFSouthAsia Enterprise Development Facility aims to create opportunities and improve lives. SEDF is managed by IFC, in partnership with the UK Government and the Norwegian Agency for Development Co-operation. SEDF facilitates the growth of small and medium enterprises by helping to improve their access to finance through a supportive financial infrastructure, financial products development and strengthening of financial institutions; and providing business services to strengthen value chains. SEDF also helps businesses adapt to the impact of climate change. SEDF operates in Bangladesh, Bhutan, Northeast India and Nepal.
About IFC IFC, a member of the World Bank Group, is the largest global development institution focused exclusively on the private sector. We help developing countries achieve sustainable growth by financing investment, mobilizing capital in international financial markets, and providing advisory services to businesses and governments. In FY12, our investments reached an all-time high of more than $20 billion, leveraging the power of the private sector to create jobs, spark innovation, and tackle the world’s most pressing development challenges. For more information, visit www.ifc.org.
DisclaimerUnder no circumstances shall IFC have any liability to [you or your clients] or any person or entity for (a) any loss or damage in whole or in part caused by, resulting from, or relating to, any error (negligent or otherwise) or other circumstance or contingency within or outside the control of IFC or any of its directors, officers, employees or agents in connection with the procurement, collection, compilation, analysis, interpretation, communication, publication or delivery of any such information contained in this publication, or (b) any direct, indirect, special, consequential, compensatory or incidental damages whatsoever (including without limitation, lost profits), even if IFC is advised in advance of the possibility of such damages, resulting from the use of or inability to use, any such information.

7
Stakeholder PercePtion Survey | January 2013
SouthAsia Enterprise Development Facility and National Business Initiative Nepal have conducted a survey of stakeholders regarding their attitudes towards private sector development in Nepal. The results are expected to contribute to the development of policy strategies and the design of interventions for public-private dialogue, as well as the improvement of the investment climate and stakeholder relations with Nepali businesses. The objectives of the survey are consistent with the Nepal Government’s vision for private sector development.
The survey depicts stakeholders’ views on the role of the private sector in the country’s development and will provide information on attitudes, relations, and trust levels as regards private sector development and business reforms in Nepal.
The target stakeholder groups for the survey were: i) opinion makers and influencers in the general population (400); ii) labor representatives (200); and iii) representatives (owners/senior management) of private businesses (400) in four regions of Nepal: i) Eastern Region (Biratnagar and Bhadrapur); (ii) Central Region (Kathmandu, Bharatpur, and Hetauda); (iii) Western Region (Pokhara and Bhairahawa); and (iv) Mid/Far Western Region (Nepalgunj and Dhangadi). The survey was carried out between May 2012 and July 2012.
Executive Summary
8
executive Summary
Key Findings
Perceptions of the current economic scenario
 All three stakeholder groups (opinion makers, labor representatives, and businesses) broadly agreed on the important issues facing the economy: political instability, lack of electricity (power), corruption, and the lack of a productive workforce are considered the top business and economic concerns.
 Similarly, political instability, lack of electricity, education, corruption, and employment are considered to be the main issues facing Nepal.
 Around 60 percent of all three stakeholder groups perceived that business and the economy were going in the wrong direction, though around 40 percent felt that the economy was improving compared to five years ago.
Perceptions of the priority areas for reform, government, and regulations
 All stakeholder groups felt that reforms in the areas of agriculture, education, corruption, and politics were most needed for Nepal.
 A higher proportion (47 percent) of businesses considered the government an obstacle to doing business; there was a general consensus that the government should focus more on helping smaller businesses.
 Stakeholders generally agreed that the government fosters corruption, does not provide a level playing field to large and small businesses, and does not protect investors’ interests. These were the major reasons for considering the government an obstacle to business.
 The government was also considered a facilitator for businesses in many ways (including by making it easy to start up businesses), for example by providing easier access to credit and working towards lowering the prices of goods. However, there is room for improvement: less than 39 percent of businesses felt that the government helps businesses.
 Though about half of businesses (51 percent) approved of the way in which the government and its agencies had handled the national economic crisis, opinions were spilt as to the favorability of economic policies towards businesses.
 Improved business regulations, easier access to credit, and political stability created favorable perceptions towards economic policies and the business environment. Conversely, political instability, lack of electricity, and poor policies/regulations led to unfavorable perceptions.
 Around 53 percent of businesses indicated that more business regulations may be needed to effectively regulate businesses. Around 26 percent of businesses indicated that the current business regulations are favorable to their own businesses, while 24 percent indicated that the current business regulations are unfavorable to them.
9
Stakeholder PercePtion Survey | January 2013
 Among the reasons for favorable perceptions of business regulations were their role in allowing businesses to run properly (33 percent), checking prices (30 percent), and preventing illegal businesses from operating (24 percent). Conversely, business regulations were considered unfavorable for similar reasons: for being ineffective in controlling prices and preventing illegal businesses, as well as for increased taxes.
Business and labor reforms
 Almost all agreed that business reforms are essential for Nepal and most agreed that business reforms benefit all Nepalis (not just businesses). Ensuring fair competition, an easier tax filing process, and the amendment of existing business regulations were considered priority business reforms.
 However, the majority of stakeholders had heard little or nothing about business reforms. Around 62 percent of businesses (40 percent of large businesses), 51 percent of opinion makers, and 68 percent of labor representatives had heard little or nothing about business reforms. Of the stakeholders who had heard about business reforms, over two thirds perceived these reforms to be favorable for businesses.
 Lack of access to loans or credit, infrastructure (power, water, information and communications technology, serviced land), political stability, and market conditions were considered to be the major obstacles to business. In particular, political instability and the lack of electricity – seen as major obstacles as well as priority concerns for stakeholders – should be addressed by the government. Additionally, internal issues like the lack of management, unproductive labor, and unmanaged supply chains are also considered obstacles to business.
 A considerable proportion (34 percent) of businesses indicated that they had decided not to make investments because of regulatory issues in recent times. For most businesses, it was not the time and cost of regulatory compliance, but the lack of certainty involved – investors are more concerned with the lack of predictability of the time and cost of complying than the actual cost.
Private sector
 Stakeholders believed that the private sector contributes to development and provides employment opportunities, but only around 30 percent, including businesses themselves, agreed that the private sector is transparent, accountable, and honest.
 An overwhelming majority of labor representatives (over 90 percent) indicated that fair wages and the welfare/security of workers are priority issues to be addressed by the private sector. Businesses and opinion makers considered the quality of products and services to be the top priority for the private sector (over 85 percent), followed by fair wages and the welfare of workers.
 The enforcement of legal/regulatory standards, certifications, and awards for well-managed firms were seen as means to improve the reputation of the private sector.
 Across 10 business sectors, the banking and financial sector, technology and communications, the media, and the health care industry were considered more responsible. Comparatively, the energy and retail/trade sectors were less trusted.
10
executive Summary
Information sources and knowledge about priority investment areas
 Compared to other stakeholders, a smaller proportion of labor (around 50 percent) had heard of the government’s investments in hydropower, though those who had were overwhelmingly positive. But it is to be noted that a significant proportion (around 25 percent) of respondents did not know of the benefits of hydropower development in Nepal.
 Similarly, many respondents – a higher proportion of the labor representatives – were unaware of the benefits of investing in agriculture (commercialization) and tourism.
 Television and newspapers were the most trusted sources of information about business and the economy across all stakeholder groups. However, businesses noted the dearth of much-needed information on new technologies, market demand, business opportunities, risk management, business regulations, and economic policies.
Key Insights � Labor representatives, businesses, and opinion makers mostly agree on the key issues facing
Nepal. This suggests that all stakeholders can come together to tackle these issues.
� There is a favorable perception of current economic policies, driven partly by knowledge of progress on key issues like political stability and business regulation. People believe business reforms are good, but most have heard little about them. The government should communicate its business reform initiatives more effectively.
� The private sector is considered to be contributing to the development of the country, more specifically by creating employment opportunities. However, it was found to be lacking in terms of accountability, transparency, and honesty, and the retail/trade and energy sectors in particular suffered from a lack of trust.
� Poor service quality is affecting stakeholder perception of the private sector. Better enforcement of standards and quality certification systems can boost its reputation.
� Poor regulations, excess paperwork, a lack of transparency, and limited access to information are linked to the issues that hinder businesses. E-governance initiatives (online information systems, payment systems, access systems) could address these issues and facilitate business.
� A significant proportion of people are not aware of or do not understand the importance of the government’s initiatives to develop investment in hydropower, agriculture, and tourism. Many important community benefits are not known to a significant portion of the stakeholders. This has to be addressed if people are to understand why certain changes are necessary, and why it is worth Nepal investing in this change. Communicating the benefits of investment is key to securing the support of stakeholders.
� Businesses identified an information gap in crucial areas for their development, including hydropower, tourism and agricultural sectors. Better communication to all groups on the part of the government, as regards their priorities and activities, will help build awareness and support for initiatives that benefit Nepal.
� TV and newspapers are trusted sources of information on business and the economy, while the Internet and radio are also important for opinion makers and businesses. This highlights the importance of working with the media to communicate about business reform issues with stakeholders.
11
Stakeholder PercePtion Survey | January 2013
Background to the survey
The International Finance Corporation, through such advisory facilities as the SouthAsia Enterprise Development Facility, provides assistance to client governments to improve the investment climate in their countries. This is meant to help developing countries address some of the key constraints to investment, including regulatory management, licensing, secured transactions, tax administration, customs facilitation and trade logistics, economic zones, investment promotion, and reform coordination.
Along with regulatory constraints, weak implementation, and political instability, the private sector in Nepal faces a multitude of challenges. Many of these are related to differences and misconceptions between the private sector and other sections of society such as a lack of understanding regarding the potential of the private sector to contribute to economic growth. There is also the problem of mistrust between the private sector and society, which contributes to a lack of stakeholder support for business reform. This lack of trust can even lead to conflicts which affect society as a whole. It is therefore necessary to assess the present state of stakeholder perceptions and attitudes towards Private Sector Development and identify major areas of conflict. This will facilitate strategies for business reform implementation and create awareness in the business community regarding the expectations of society.
SEDF and National Business Initiative Nepal therefore decided to conduct a survey of stakeholders regarding their attitudes towards PSD in Nepal. The results are expected to contribute to the development of
Introduction
introduction
12
policy strategies and the design of interventions for public-private dialogue, as well as the improvement of the investment climate and stakeholder relations with Nepali businesses. The objectives of the survey are consistent with the Nepal Government’s vision for private sector development within its poverty reduction strategy.
SEDF is managed by IFC, in partnership with the UK Government and Norad.
NBI is an NGO founded and led by major Nepali private sector organizations. Its objective is to strengthen the role and capacity of the private sector in contributing to sustainable peace in Nepal. NBI promotes conducive stakeholder relations and inclusive economic growth in order to contribute to economic development and stability in Nepal.
Survey objectives
This survey aims to obtain insights from businesses, opinion makers and influencers, and the labor force (collectively defined as stakeholders) on their perceptions of and attitudes towards PSD in Nepal and the effect of government policies and reform measures on businesses. The survey will not only depict stakeholders’ views on the role of the private sector in the country’s development, but also will provide information on attitudes, relations, and trust levels as regards PSD and business reforms in Nepal.
The results obtained will provide feedback to policy makers on stakeholder perceptions of policies and reform measures related to PSD in Nepal. This feedback will help the government understand the needs and expectations of different stakeholder groups, enabling it to tailor its policies accordingly and better communicate its objectives and achievements in the field of PSD. In this it will be working with Nepal Business Forum, a public-private dialogue program supported by IFC.
Further, the information contained in the survey can help donors and development agencies understand needs, expectations and potential conflicts to guarantee the effectiveness and sustainability of their programs. Nepal Business Forum will also be able to use the survey as a basis to prioritize its work on policy reforms.
13
Stakeholder PercePtion Survey | January 2013
Methodology
Stakeholder Groups
The survey targeted:
 opinion makers and influencers in the general population (based on active exposure to media such as newspapers, television, and radio; active interest in business and the economy, that is, an interest in discussing and communicating ideas);
 labor representatives (not necessarily union leaders, based on active exposure to media; active interest in business and the economy);
 business representatives (owners/senior management) of “formal” private business enterprises, inclusive of large, medium, small and micro/cottage enterprises, registered with the Internal Revenue Department.
methodology
14
Survey Sample
The survey sample was selected keeping in mind the geographic spread, concentration, and representativeness of registered businesses in the following areas:
 Eastern Region: (i) Biratnagar (ii) Bhadrapur;
 Central Region: (iii) Kathmandu (iv) Bharatpur (v) Hetauda;
 Western Region: (vi) Pokhara (vii) Bhairahawa;
 Mid/Far Western Region: (vii) Nepalgunj (viii) Dhangadi.
Private businesses
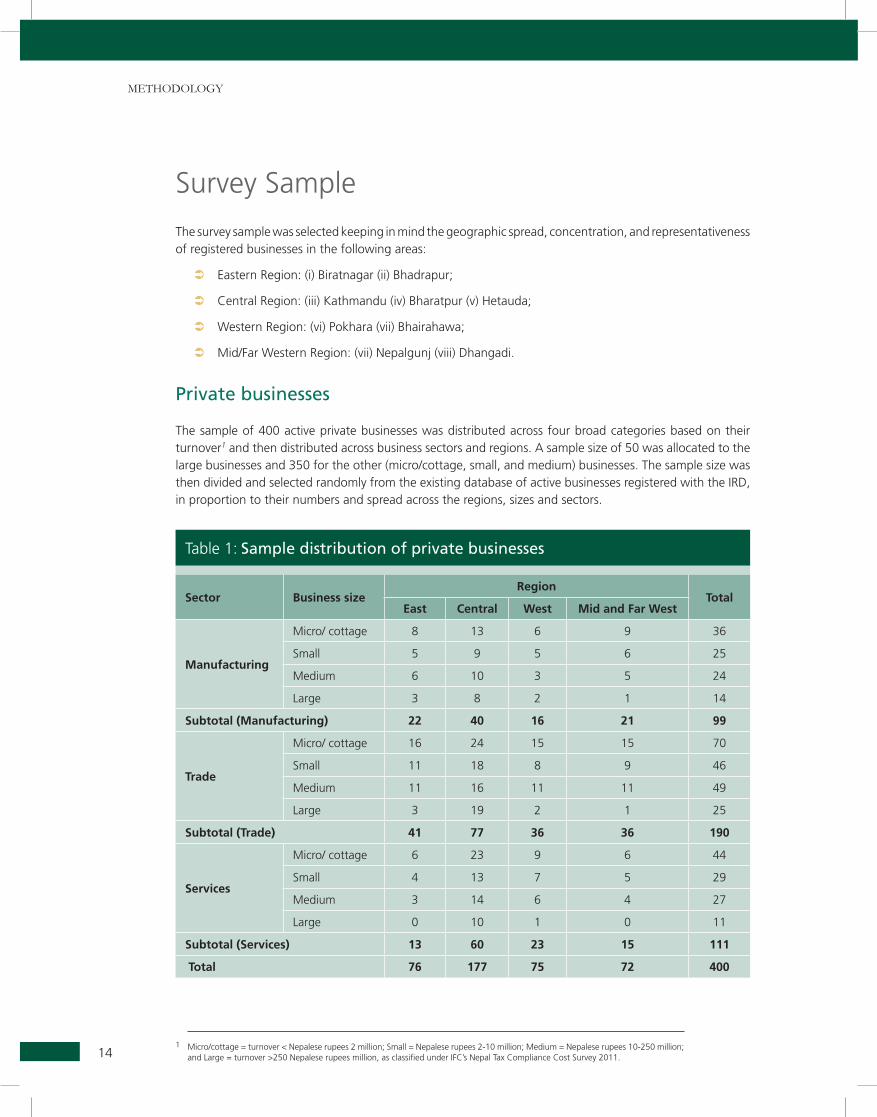
The sample of 400 active private businesses was distributed across four broad categories based on their turnover1 and then distributed across business sectors and regions. A sample size of 50 was allocated to the large businesses and 350 for the other (micro/cottage, small, and medium) businesses. The sample size was then divided and selected randomly from the existing database of active businesses registered with the IRD, in proportion to their numbers and spread across the regions, sizes and sectors.
1 Micro/cottage = turnover < Nepalese rupees 2 million; Small = Nepalese rupees 2-10 million; Medium = Nepalese rupees 10-250 million; and Large = turnover >250 Nepalese rupees million, as classified under IFC’s Nepal Tax Compliance Cost Survey 2011.
Table 1: Sample distribution of private businesses
Sector Business sizeRegion
TotalEast Central West Mid and Far West
Manufacturing
Micro/ cottage 8 13 6 9 36
Small 5 9 5 6 25
Medium 6 10 3 5 24
Large 3 8 2 1 14
Subtotal (Manufacturing) 22 40 16 21 99
Trade
Micro/ cottage 16 24 15 15 70
Small 11 18 8 9 46
Medium 11 16 11 11 49
Large 3 19 2 1 25
Subtotal (Trade) 41 77 36 36 190
Services
Micro/ cottage 6 23 9 6 44
Small 4 13 7 5 29
Medium 3 14 6 4 27
Large 0 10 1 0 11
Subtotal (Services) 13 60 23 15 111
Total 76 177 75 72 400
15
Stakeholder PercePtion Survey | January 2013
Opinion makers
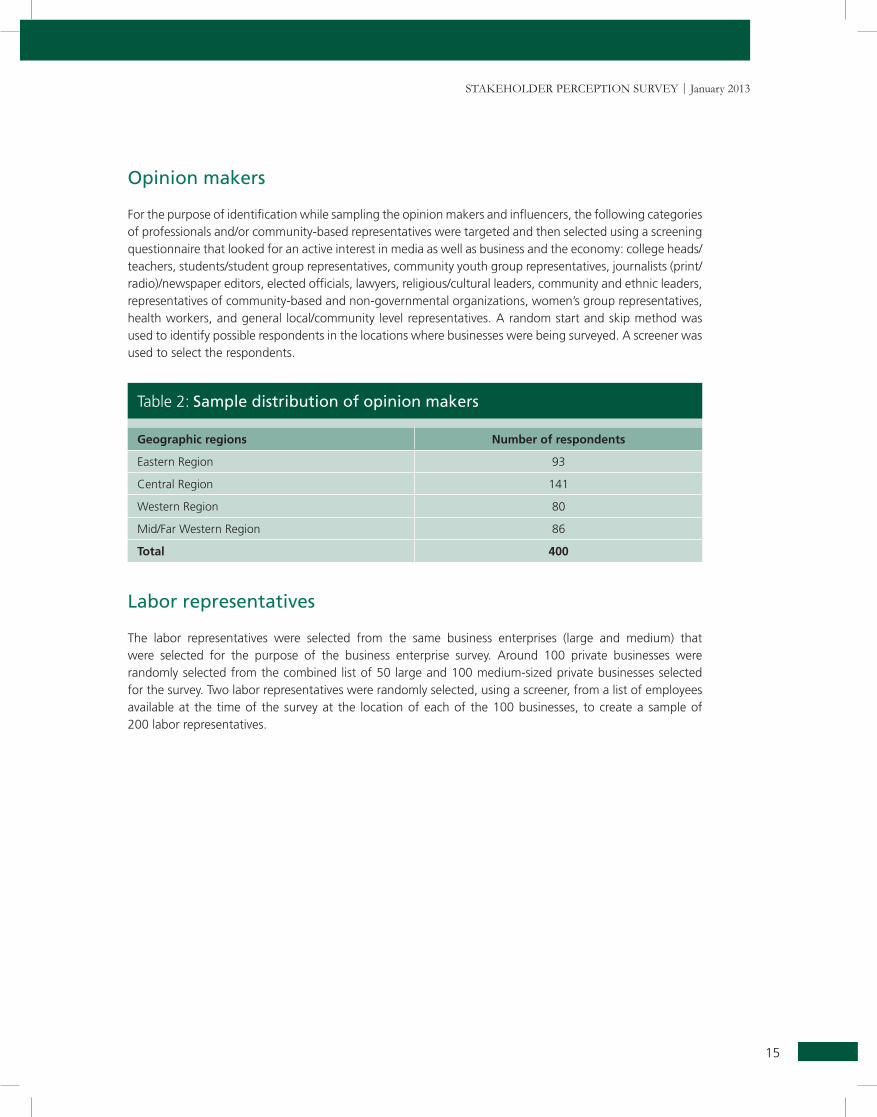
For the purpose of identification while sampling the opinion makers and influencers, the following categories of professionals and/or community-based representatives were targeted and then selected using a screening questionnaire that looked for an active interest in media as well as business and the economy: college heads/teachers, students/student group representatives, community youth group representatives, journalists (print/radio)/newspaper editors, elected officials, lawyers, religious/cultural leaders, community and ethnic leaders, representatives of community-based and non-governmental organizations, women’s group representatives, health workers, and general local/community level representatives. A random start and skip method was used to identify possible respondents in the locations where businesses were being surveyed. A screener was used to select the respondents.
Table 2: Sample distribution of opinion makers
Geographic regions Number of respondents
Eastern Region 93
Central Region 141
Western Region 80
Mid/Far Western Region 86
Total 400
Labor representatives
The labor representatives were selected from the same business enterprises (large and medium) that were selected for the purpose of the business enterprise survey. Around 100 private businesses were randomly selected from the combined list of 50 large and 100 medium-sized private businesses selected for the survey. Two labor representatives were randomly selected, using a screener, from a list of employees available at the time of the survey at the location of each of the 100 businesses, to create a sample of 200 labor representatives.
methodology
16
Data Collection and Fieldwork
Data collection method
Survey data was collected through face-to-face interviews. Appointments were set up either with senior management or the owners of the businesses in question. In the case of labor representatives and opinion makers, screening questions were used prior to selection of respondents for face-to-face interviews.
The survey was conducted between May 2012 and July 2012. Prior to the start of the fieldwork pilot tests were carried out in April 2012. This was used to improve the questionnaire. Relevant letters of introduction, including the objectives of the survey, were presented to the respondents so they would be aware of the purpose and scope of the survey.
Quantitative analysis
Within this report, reference is made to the proportions responding to the various options provided by the survey questions at both the overall level and the sub-stakeholder group level (for businesses). This is, however, done only where differences between overall responses and sub-group responses are found to be statistically significant.
Open-ended responses within the survey were coded for the purpose of analysis, that is, responses were grouped together to reflect common themes in what was being reported. This allowed for the quantification of responses so as to reflect the balance of opinion on specific questions.
It is important to bear in mind that findings throughout the study deal with “perceptions” rather than “facts”, although for the stakeholders that took part in this study these perceptions are facts.
17
Stakeholder PercePtion Survey | January 2013
Findings
Perceptions of the Current Economic Scenario
Business and the economy in Nepal
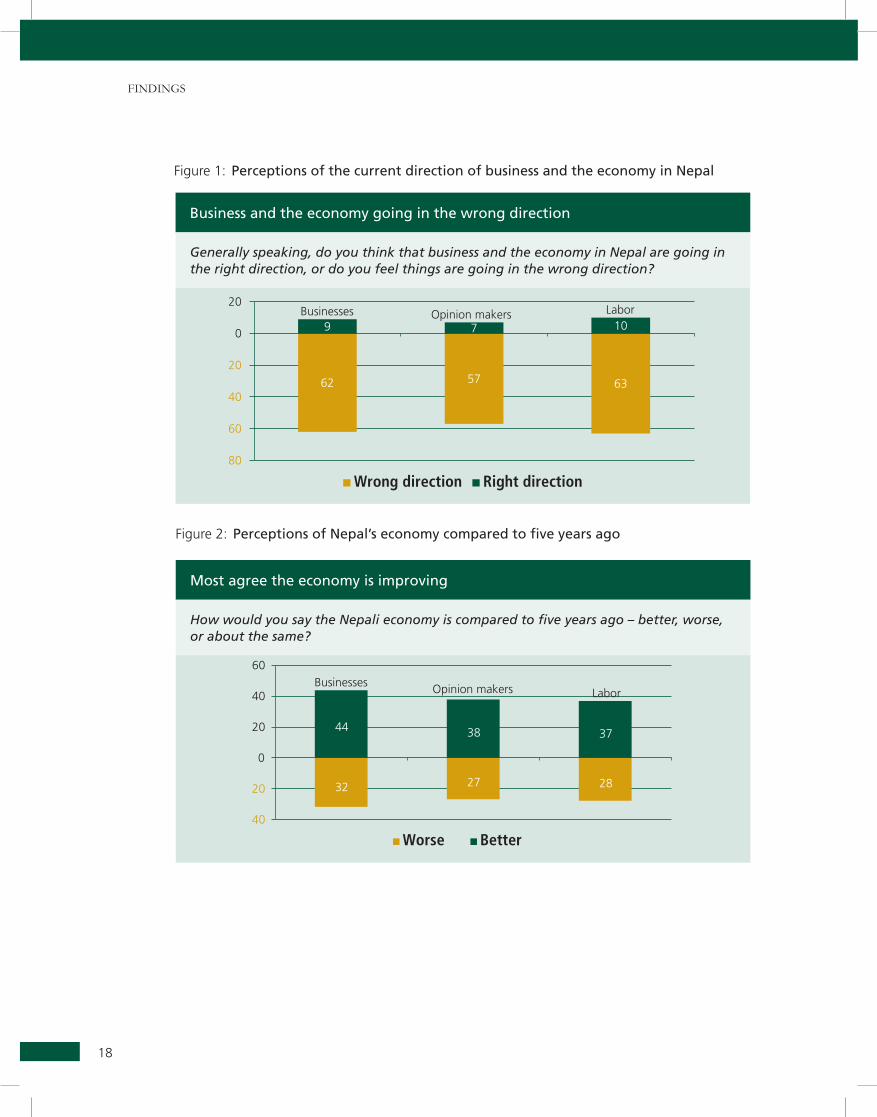
The majority of the businesses, opinion makers and labor representatives felt that business and the economy were going in the wrong direction in Nepal (see Figure 1). Only a small fraction of stakeholders (less than 10 percent across all three groups) perceived that business and the economy were moving in the right direction.
However, compared to five years ago, the country’s economy was considered to be better off by a higher proportions of the stakeholders. Around 44 percent of businesses, 38 percent of opinion makers and 37 percent of labor representatives perceived that the country’s economy was better now compared to five years back. However, a higher proportion (32 percent) of businesses considered Nepal’s economy to be in worse shape than five years back, compared to other stakeholders (see Figure 2).
FindingS
18
Business and the economy going in the wrong direction
Generally speaking, do you think that business and the economy in Nepal are going in the right direction, or do you feel things are going in the wrong direction?
Figure 1: Perceptions of the current direction of business and the economy in Nepal
Figure 2: Perceptions of Nepal’s economy compared to five years ago
Most agree the economy is improving
How would you say the Nepali economy is compared to five years ago – better, worse, or about the same?
19
Stakeholder PercePtion Survey | January 2013
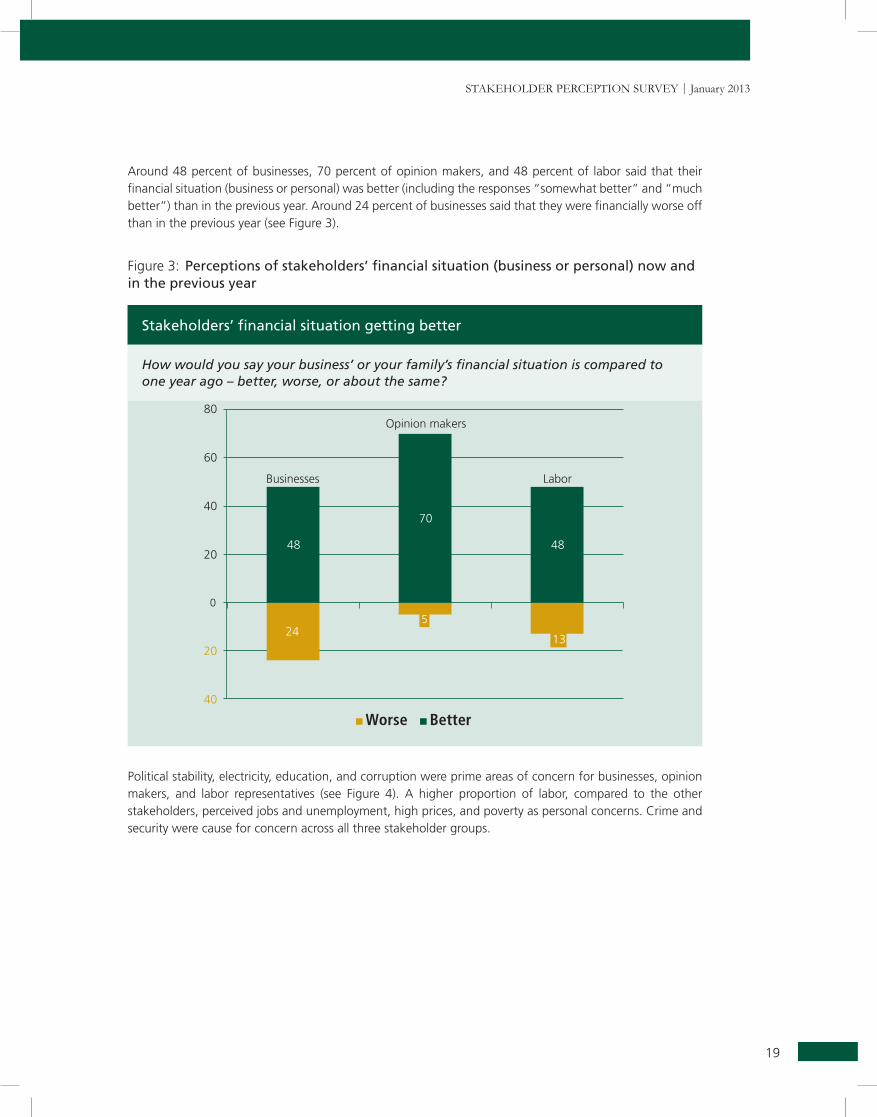
Around 48 percent of businesses, 70 percent of opinion makers, and 48 percent of labor said that their financial situation (business or personal) was better (including the responses “somewhat better” and “much better”) than in the previous year. Around 24 percent of businesses said that they were financially worse off than in the previous year (see Figure 3).
Figure 3: Perceptions of stakeholders’ financial situation (business or personal) now and in the previous year
Stakeholders’ financial situation getting better
How would you say your business’ or your family’s financial situation is compared to one year ago – better, worse, or about the same?
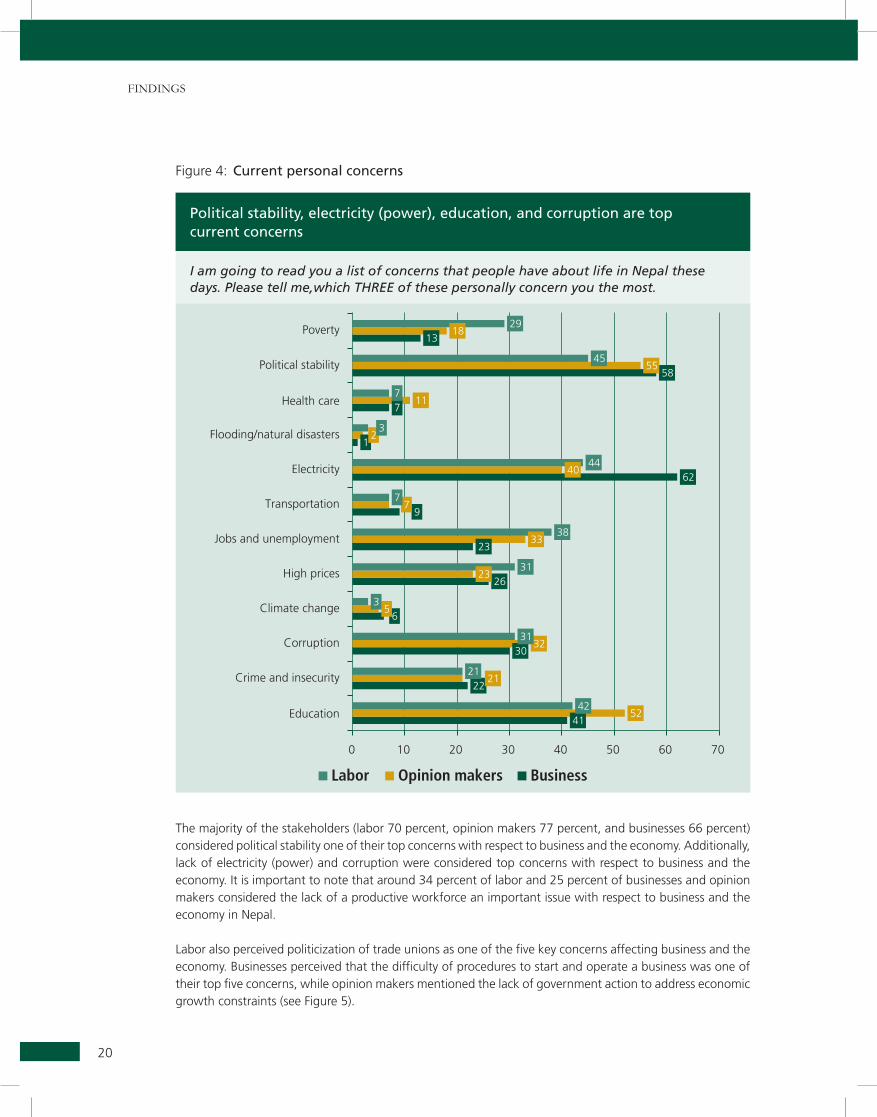
Political stability, electricity, education, and corruption were prime areas of concern for businesses, opinion makers, and labor representatives (see Figure 4). A higher proportion of labor, compared to the other stakeholders, perceived jobs and unemployment, high prices, and poverty as personal concerns. Crime and security were cause for concern across all three stakeholder groups.
FindingS
20
Figure 4: Current personal concerns
Political stability, electricity (power), education, and corruption are top current concerns
I am going to read you a list of concerns that people have about life in Nepal these days. Please tell me,which THREE of these personally concern you the most.
The majority of the stakeholders (labor 70 percent, opinion makers 77 percent, and businesses 66 percent) considered political stability one of their top concerns with respect to business and the economy. Additionally, lack of electricity (power) and corruption were considered top concerns with respect to business and the economy. It is important to note that around 34 percent of labor and 25 percent of businesses and opinion makers considered the lack of a productive workforce an important issue with respect to business and the economy in Nepal.
Labor also perceived politicization of trade unions as one of the five key concerns affecting business and the economy. Businesses perceived that the difficulty of procedures to start and operate a business was one of their top five concerns, while opinion makers mentioned the lack of government action to address economic growth constraints (see Figure 5).

21
Stakeholder PercePtion Survey | January 2013
Figure 5: Current concerns with respect to business and the economy
Political instability, lack of electricity (power), corruption, and the lack of a productive workforce are top business and economic concerns
Now, I am going to read you a list of concerns that people have about the economy and business in Nepal. Please tell me which THREE of these concern you the most when it comes to the economy and business.
FindingS
22
Perceptions of the Priority Areas for Reform, Government, and Regulations
Priority areas for reform
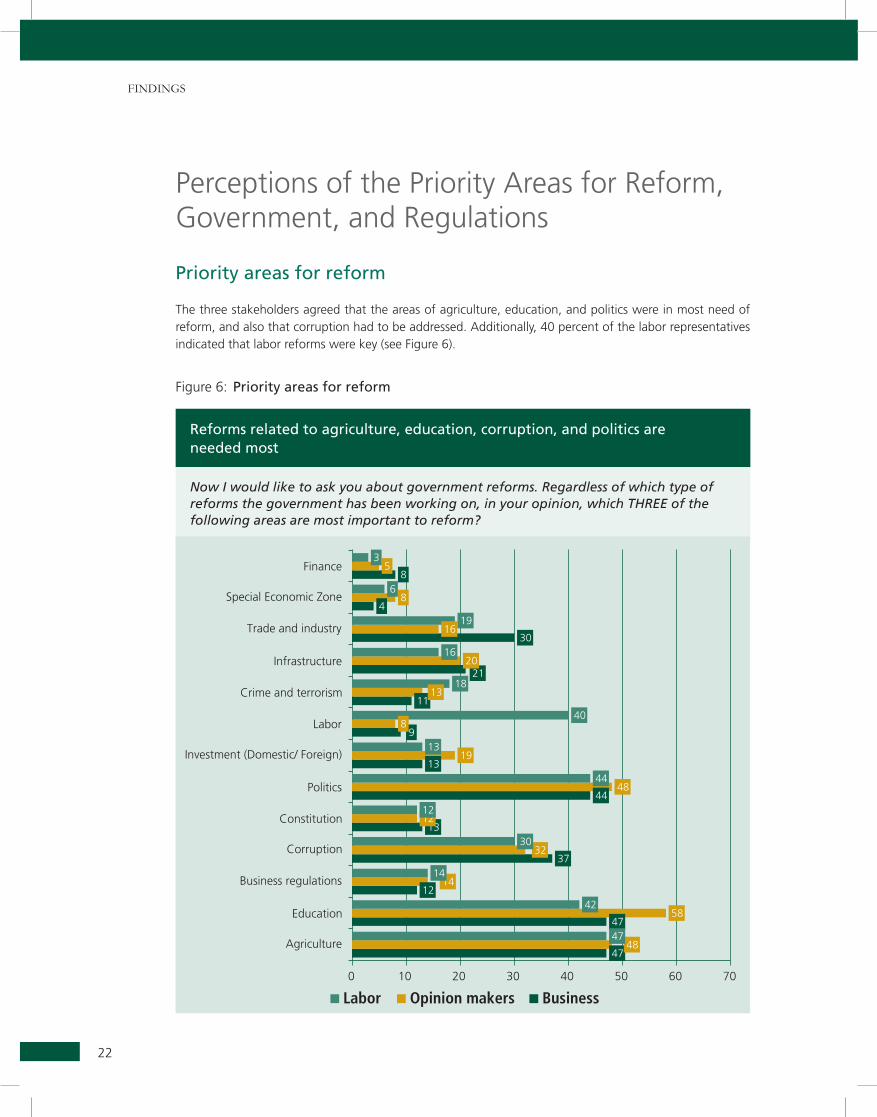
The three stakeholders agreed that the areas of agriculture, education, and politics were in most need of reform, and also that corruption had to be addressed. Additionally, 40 percent of the labor representatives indicated that labor reforms were key (see Figure 6).
Figure 6: Priority areas for reform
Reforms related to agriculture, education, corruption, and politics are needed most
Now I would like to ask you about government reforms. Regardless of which type of reforms the government has been working on, in your opinion, which THREE of the following areas are most important to reform?
23
Stakeholder PercePtion Survey | January 2013
Government in relation to business and the economy
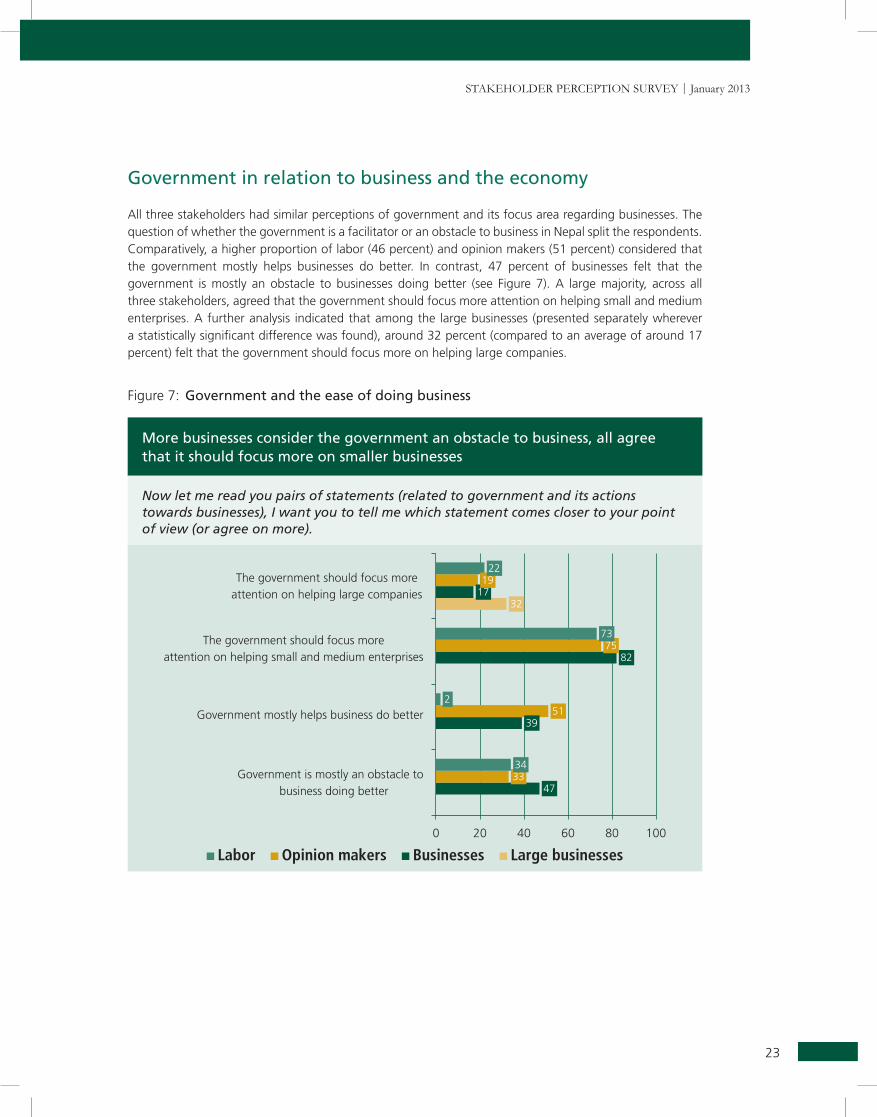
All three stakeholders had similar perceptions of government and its focus area regarding businesses. The question of whether the government is a facilitator or an obstacle to business in Nepal split the respondents. Comparatively, a higher proportion of labor (46 percent) and opinion makers (51 percent) considered that the government mostly helps businesses do better. In contrast, 47 percent of businesses felt that the government is mostly an obstacle to businesses doing better (see Figure 7). A large majority, across all three stakeholders, agreed that the government should focus more attention on helping small and medium enterprises. A further analysis indicated that among the large businesses (presented separately wherever a statistically significant difference was found), around 32 percent (compared to an average of around 17 percent) felt that the government should focus more on helping large companies.
Figure 7: Government and the ease of doing business
More businesses consider the government an obstacle to business, all agree that it should focus more on smaller businesses
Now let me read you pairs of statements (related to government and its actions towards businesses), I want you to tell me which statement comes closer to your point of view (or agree on more).
FindingS
24
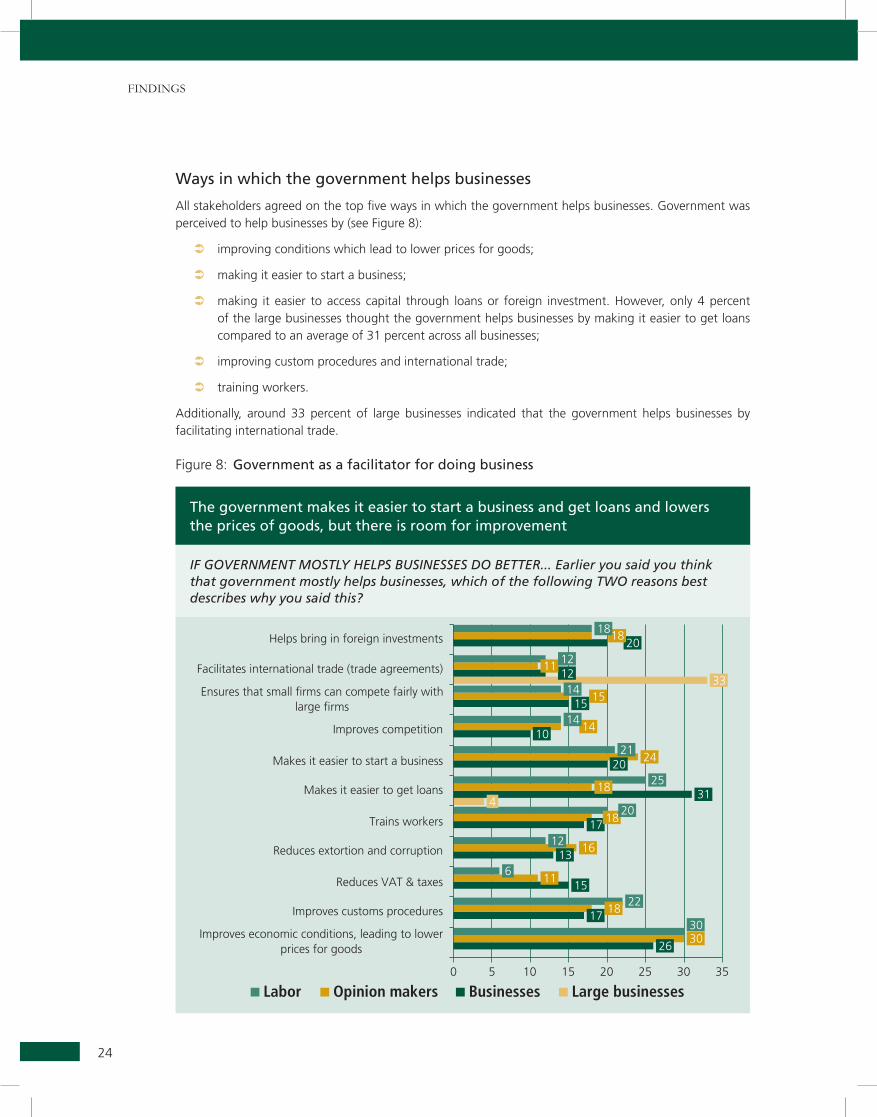
Ways in which the government helps businesses
All stakeholders agreed on the top five ways in which the government helps businesses. Government was perceived to help businesses by (see Figure 8):
 improving conditions which lead to lower prices for goods;
 making it easier to start a business;
 making it easier to access capital through loans or foreign investment. However, only 4 percent of the large businesses thought the government helps businesses by making it easier to get loans compared to an average of 31 percent across all businesses;
 improving custom procedures and international trade;
 training workers.
Additionally, around 33 percent of large businesses indicated that the government helps businesses by facilitating international trade.
Figure 8: Government as a facilitator for doing business
The government makes it easier to start a business and get loans and lowers the prices of goods, but there is room for improvement
If GovERNmENT mosTly HElPs busINEssEs do bETTER... Earlier you said you think that government mostly helps businesses, which of the following Two reasons best describes why you said this?
25
Stakeholder PercePtion Survey | January 2013
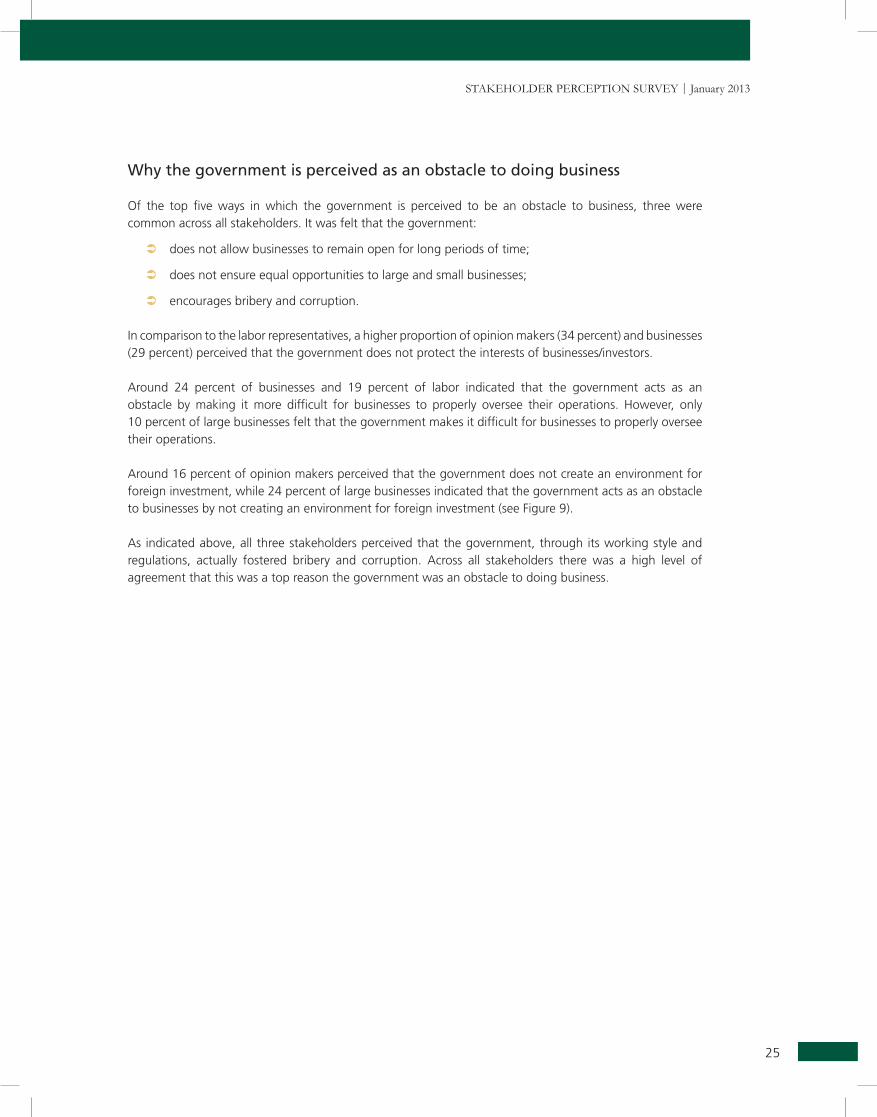
Why the government is perceived as an obstacle to doing business
Of the top five ways in which the government is perceived to be an obstacle to business, three were common across all stakeholders. It was felt that the government:
 does not allow businesses to remain open for long periods of time;
 does not ensure equal opportunities to large and small businesses;
 encourages bribery and corruption.
In comparison to the labor representatives, a higher proportion of opinion makers (34 percent) and businesses (29 percent) perceived that the government does not protect the interests of businesses/investors.
Around 24 percent of businesses and 19 percent of labor indicated that the government acts as an obstacle by making it more difficult for businesses to properly oversee their operations. However, only 10 percent of large businesses felt that the government makes it difficult for businesses to properly oversee their operations.
Around 16 percent of opinion makers perceived that the government does not create an environment for foreign investment, while 24 percent of large businesses indicated that the government acts as an obstacle to businesses by not creating an environment for foreign investment (see Figure 9).
As indicated above, all three stakeholders perceived that the government, through its working style and regulations, actually fostered bribery and corruption. Across all stakeholders there was a high level of agreement that this was a top reason the government was an obstacle to doing business.
FindingS
26
Figure 9: Government as an obstacle to doing business
Government is perceived as constraining to business in a number of ways
If GovERNmENT Is mosTly aN obsTaclE... Earlier you said you think that government mostly hampers businesses, which of the following Two reasons best describes why you said this?
Business perceptions of government policy and regulations
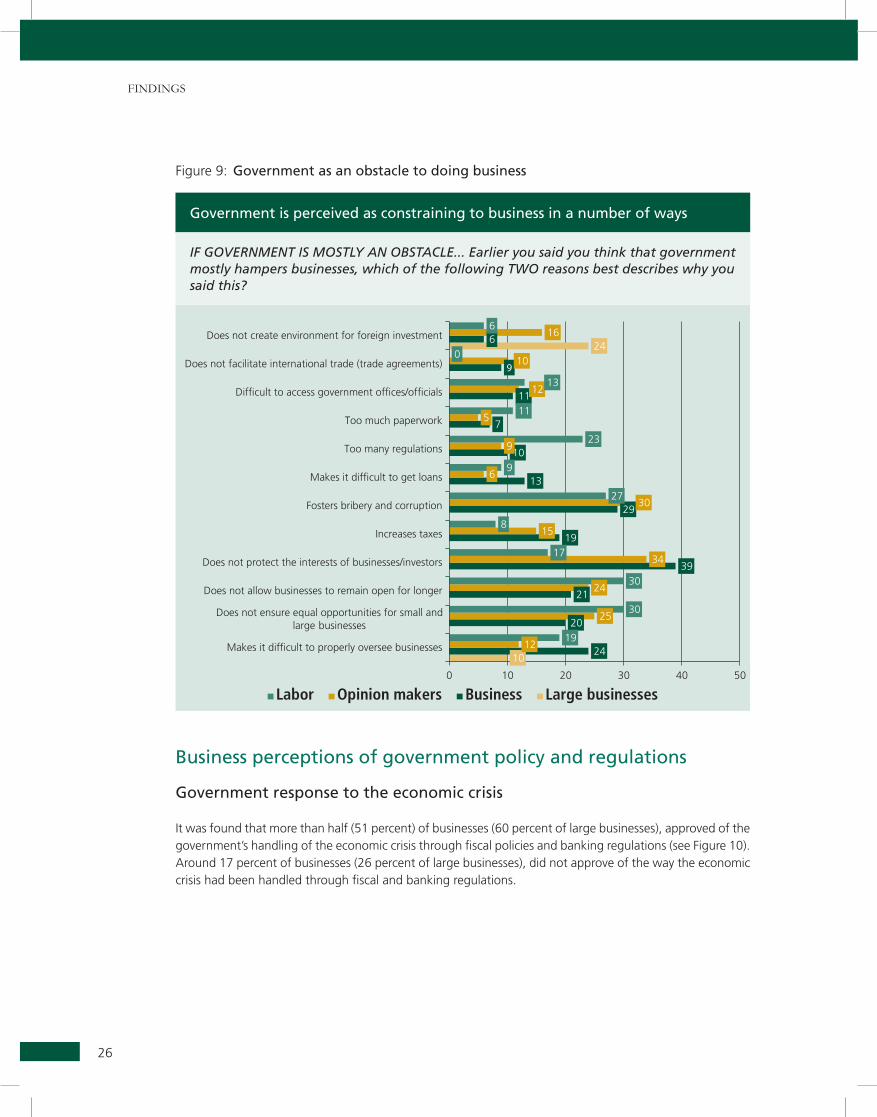
Government response to the economic crisis
It was found that more than half (51 percent) of businesses (60 percent of large businesses), approved of the government’s handling of the economic crisis through fiscal policies and banking regulations (see Figure 10). Around 17 percent of businesses (26 percent of large businesses), did not approve of the way the economic crisis had been handled through fiscal and banking regulations.
27
Stakeholder PercePtion Survey | January 2013
Figure 10: Government response to the economic crisis through fiscal policies and banking regulations (businesses only)
Most businesses approve of the way the government and its agencies handled the national economic crisis
when it comes to the current government's handling of the national economic crisis (such as lack of liquidity, lack of investment) through monetary policies, fiscal policies and banking regulations, do you approve or disapprove of the job being done, particularly by the Nepal Rastra bank and the ministry of finance?
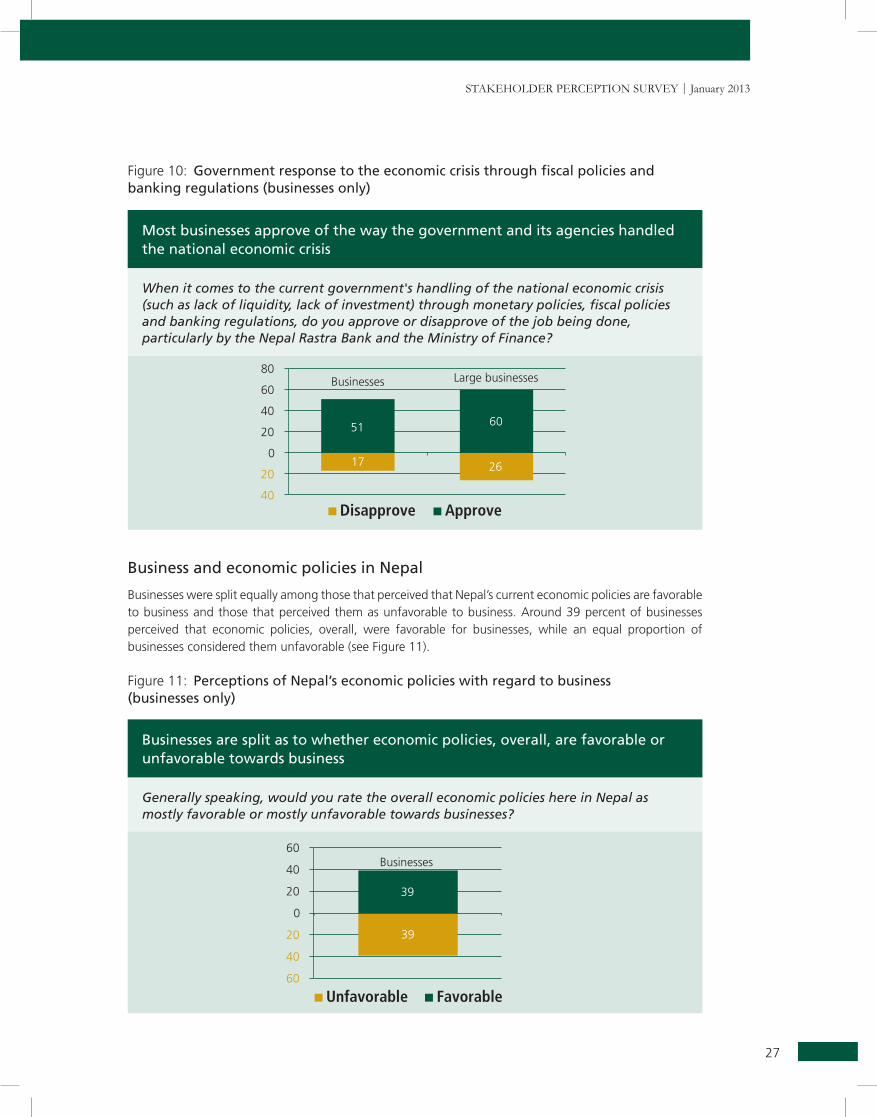
Business and economic policies in Nepal
Businesses were split equally among those that perceived that Nepal’s current economic policies are favorable to business and those that perceived them as unfavorable to business. Around 39 percent of businesses perceived that economic policies, overall, were favorable for businesses, while an equal proportion of businesses considered them unfavorable (see Figure 11).
Figure 11: Perceptions of Nepal’s economic policies with regard to business (businesses only)
Businesses are split as to whether economic policies, overall, are favorable or unfavorable towards business
Generally speaking, would you rate the overall economic policies here in Nepal as mostly favorable or mostly unfavorable towards businesses?
FindingS
28
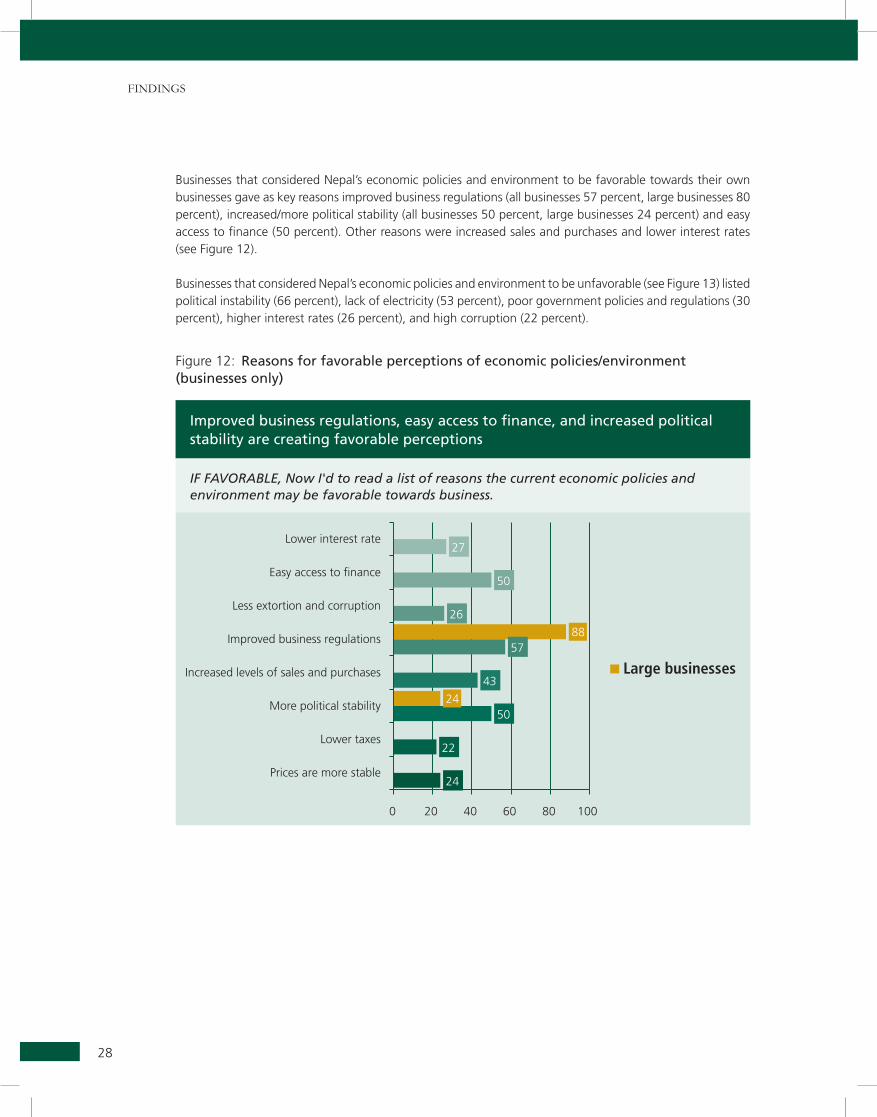
Businesses that considered Nepal’s economic policies and environment to be favorable towards their own businesses gave as key reasons improved business regulations (all businesses 57 percent, large businesses 80 percent), increased/more political stability (all businesses 50 percent, large businesses 24 percent) and easy access to finance (50 percent). Other reasons were increased sales and purchases and lower interest rates (see Figure 12).
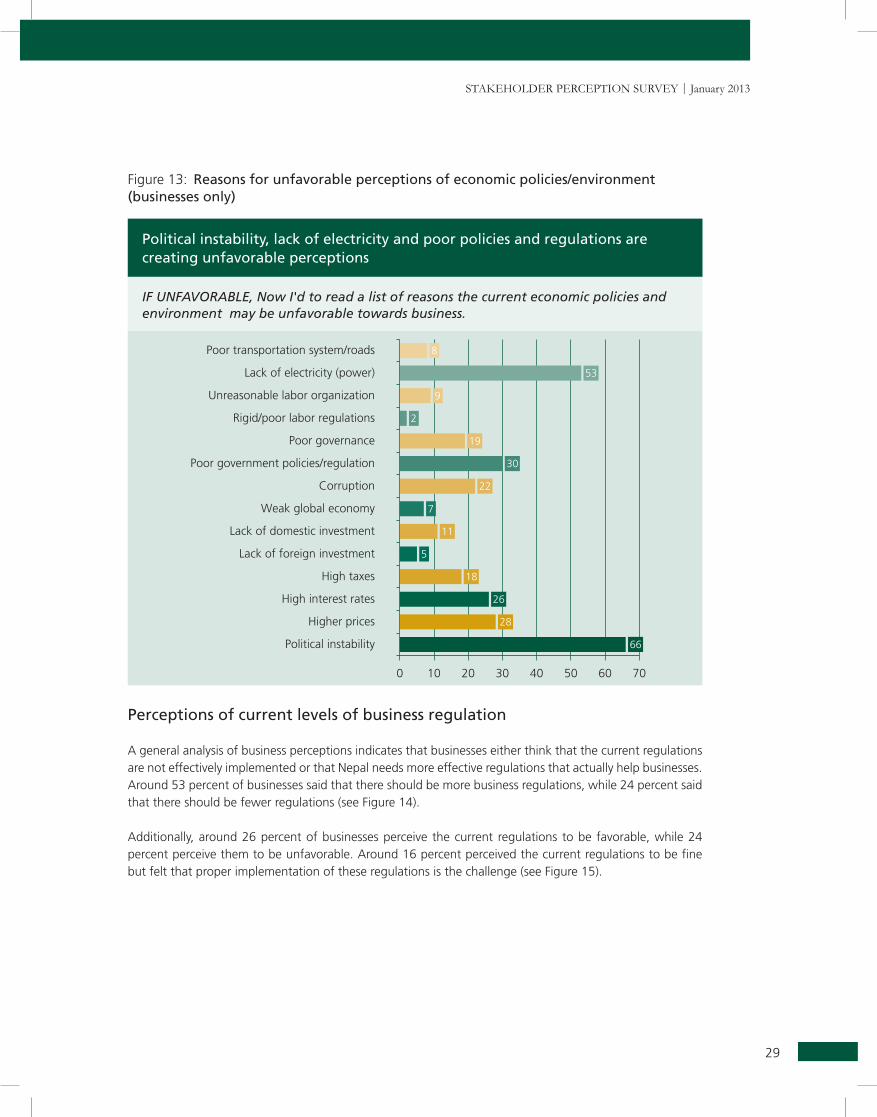
Businesses that considered Nepal’s economic policies and environment to be unfavorable (see Figure 13) listed political instability (66 percent), lack of electricity (53 percent), poor government policies and regulations (30 percent), higher interest rates (26 percent), and high corruption (22 percent).
Figure 12: Reasons for favorable perceptions of economic policies/environment (businesses only)
Improved business regulations, easy access to finance, and increased political stability are creating favorable perceptions
If favoRablE, Now I'd to read a list of reasons the current economic policies and environment may be favorable towards business.
29
Stakeholder PercePtion Survey | January 2013
Political instability, lack of electricity and poor policies and regulations are creating unfavorable perceptions
If uNfavoRablE, Now I'd to read a list of reasons the current economic policies and environment may be unfavorable towards business.
Figure 13: Reasons for unfavorable perceptions of economic policies/environment (businesses only)
Perceptions of current levels of business regulation
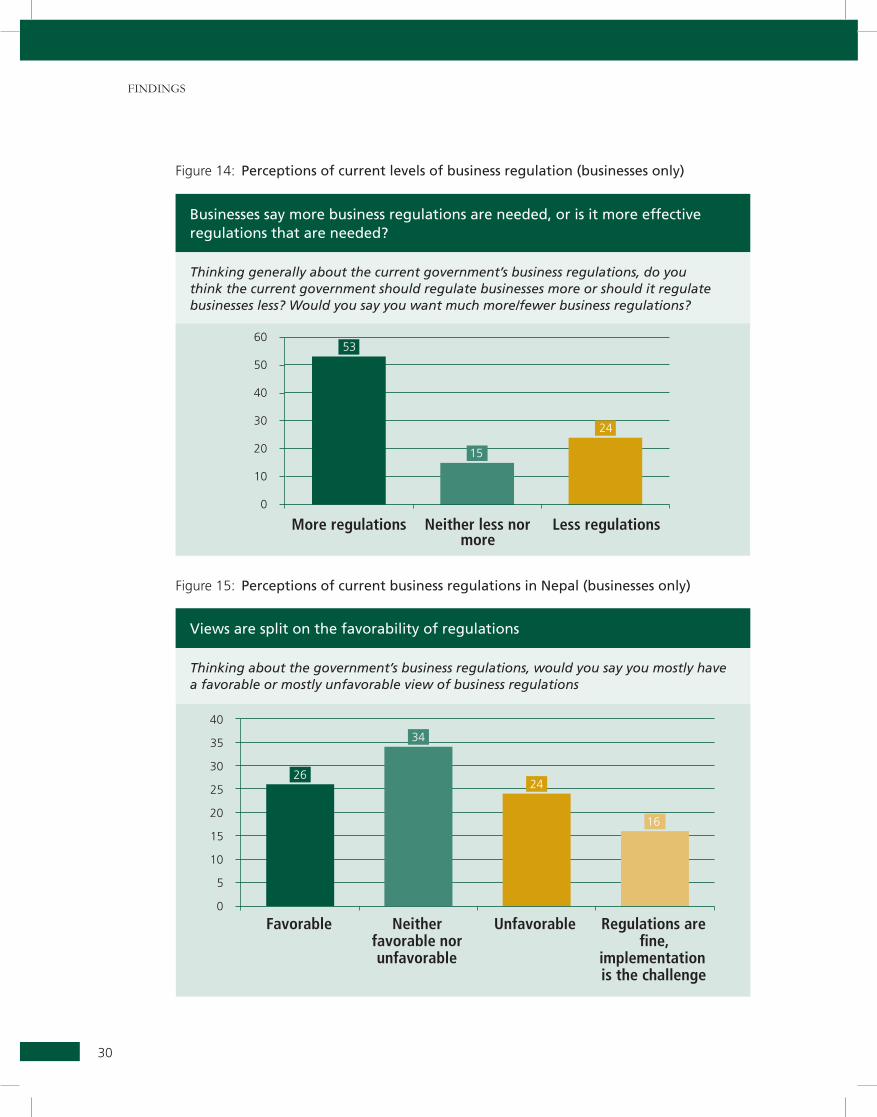
A general analysis of business perceptions indicates that businesses either think that the current regulations are not effectively implemented or that Nepal needs more effective regulations that actually help businesses. Around 53 percent of businesses said that there should be more business regulations, while 24 percent said that there should be fewer regulations (see Figure 14).
Additionally, around 26 percent of businesses perceive the current regulations to be favorable, while 24 percent perceive them to be unfavorable. Around 16 percent perceived the current regulations to be fine but felt that proper implementation of these regulations is the challenge (see Figure 15).
FindingS
30
Figure 14: Perceptions of current levels of business regulation (businesses only)
Businesses say more business regulations are needed, or is it more effective regulations that are needed?
Thinking generally about the current government’s business regulations, do you think the current government should regulate businesses more or should it regulate businesses less? would you say you want much more/fewer business regulations?
Figure 15: Perceptions of current business regulations in Nepal (businesses only)
Views are split on the favorability of regulations
Thinking about the government’s business regulations, would you say you mostly have a favorable or mostly unfavorable view of business regulations
31
Stakeholder PercePtion Survey | January 2013
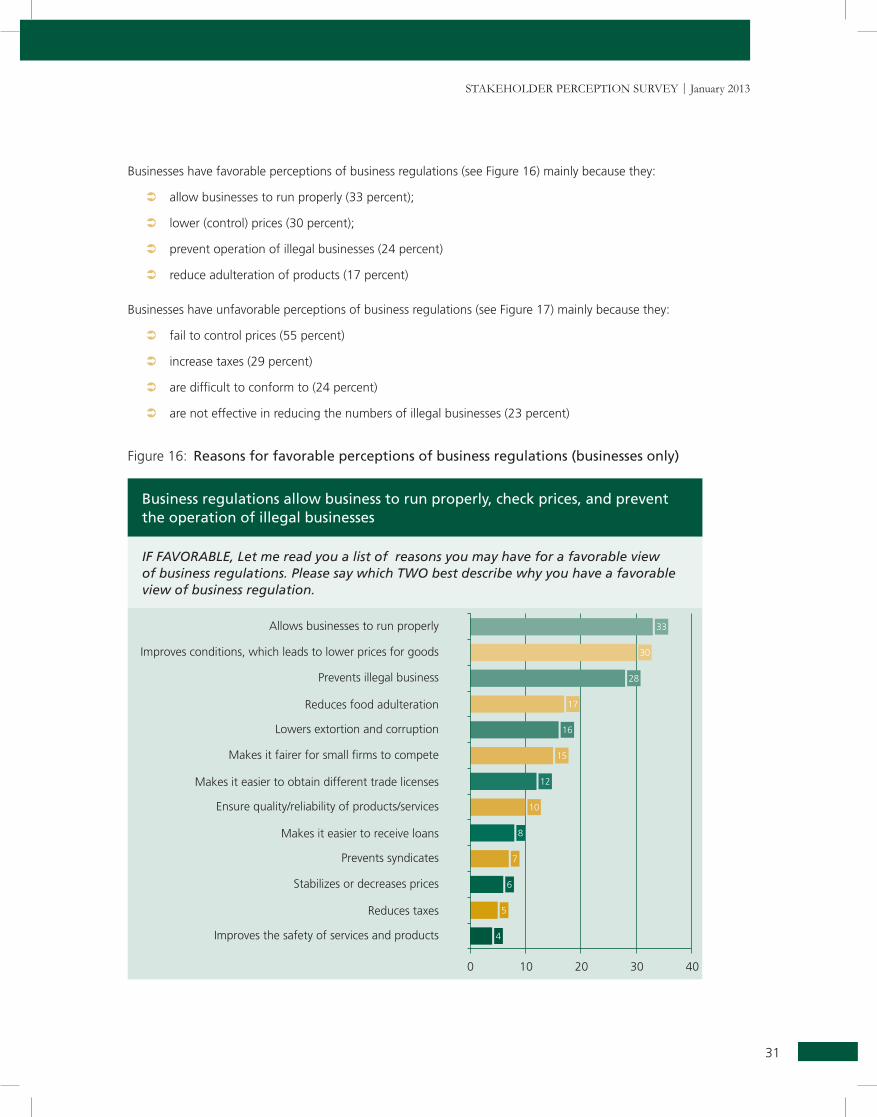
Businesses have favorable perceptions of business regulations (see Figure 16) mainly because they:
 allow businesses to run properly (33 percent);
 lower (control) prices (30 percent);
 prevent operation of illegal businesses (24 percent)
 reduce adulteration of products (17 percent)
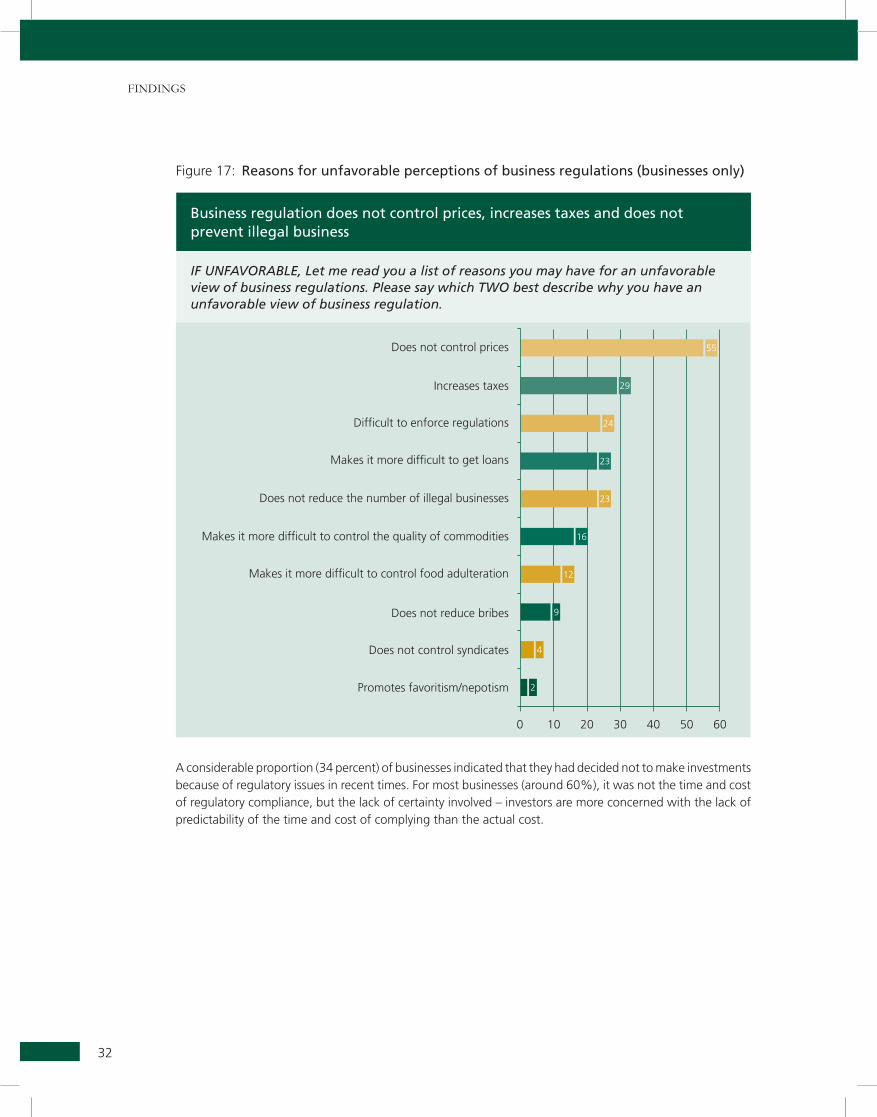
Businesses have unfavorable perceptions of business regulations (see Figure 17) mainly because they:
 fail to control prices (55 percent)
 increase taxes (29 percent)
 are difficult to conform to (24 percent)
 are not effective in reducing the numbers of illegal businesses (23 percent)
Figure 16: Reasons for favorable perceptions of business regulations (businesses only)
Business regulations allow business to run properly, check prices, and prevent the operation of illegal businesses
If favoRablE, let me read you a list of reasons you may have for a favorable view of business regulations. Please say which Two best describe why you have a favorable view of business regulation.
FindingS
32
Business regulation does not control prices, increases taxes and does not prevent illegal business
If uNfavoRablE, let me read you a list of reasons you may have for an unfavorable view of business regulations. Please say which Two best describe why you have an unfavorable view of business regulation.
Figure 17: Reasons for unfavorable perceptions of business regulations (businesses only)
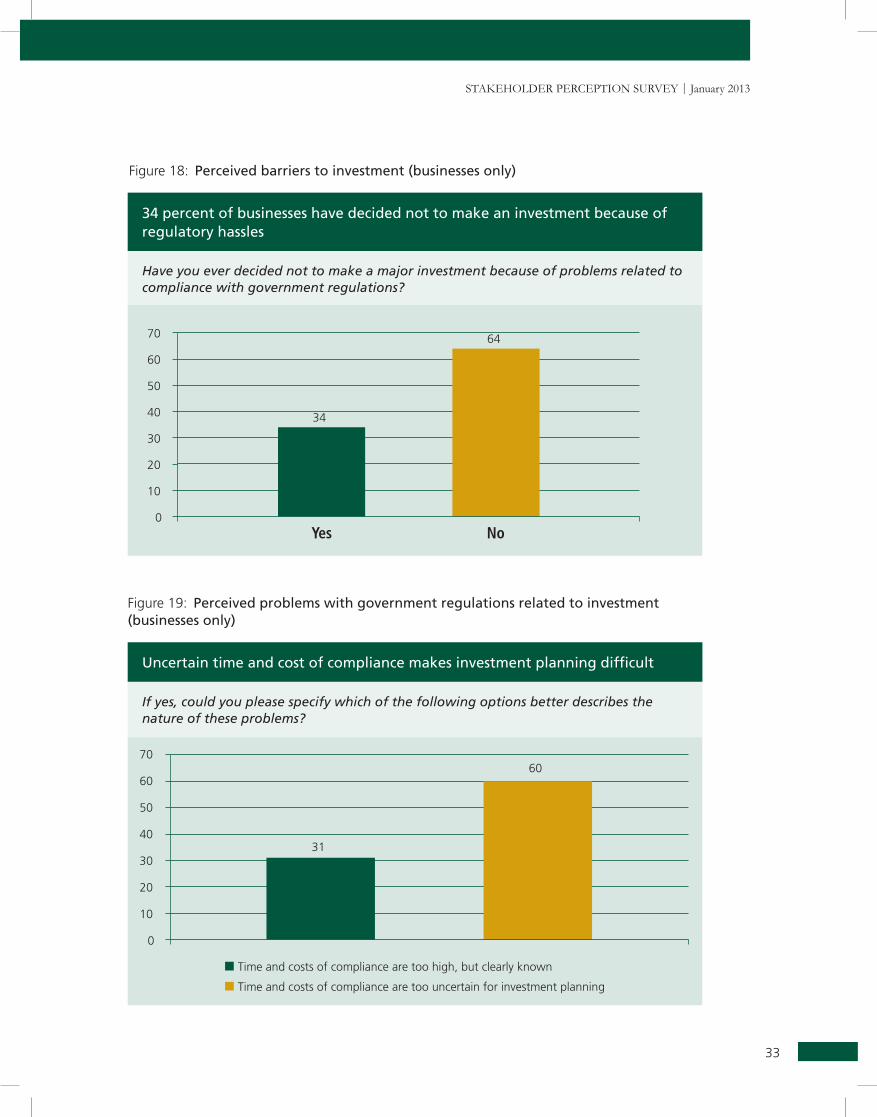
A considerable proportion (34 percent) of businesses indicated that they had decided not to make investments because of regulatory issues in recent times. For most businesses (around 60%), it was not the time and cost of regulatory compliance, but the lack of certainty involved – investors are more concerned with the lack of predictability of the time and cost of complying than the actual cost.
33
Stakeholder PercePtion Survey | January 2013
Uncertain time and cost of compliance makes investment planning difficult
If yes, could you please specify which of the following options better describes the nature of these problems?
34 percent of businesses have decided not to make an investment because of regulatory hassles
Have you ever decided not to make a major investment because of problems related to compliance with government regulations?
Figure 18: Perceived barriers to investment (businesses only)
Figure 19: Perceived problems with government regulations related to investment (businesses only)
FindingS
34
Business and Labor Reforms
Perceptions of business reforms
What are business reforms?
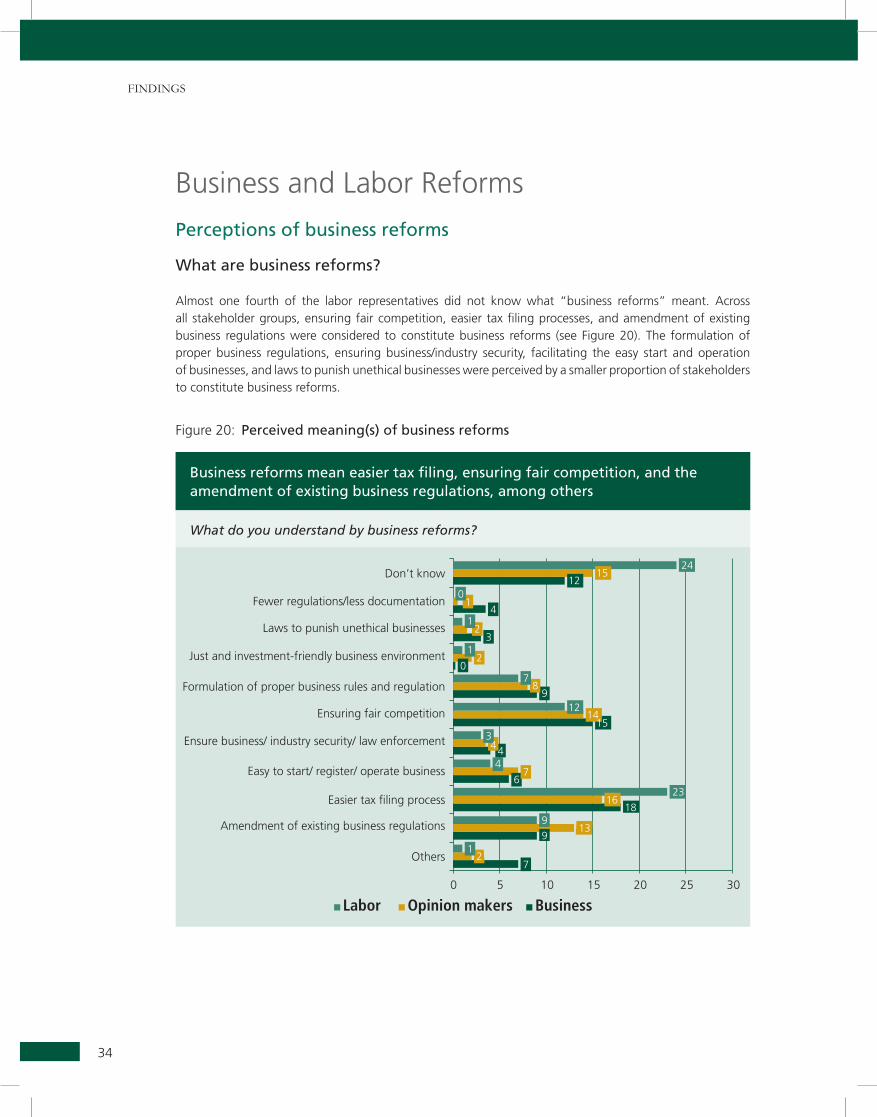
Almost one fourth of the labor representatives did not know what “business reforms” meant. Across all stakeholder groups, ensuring fair competition, easier tax filing processes, and amendment of existing business regulations were considered to constitute business reforms (see Figure 20). The formulation of proper business regulations, ensuring business/industry security, facilitating the easy start and operation of businesses, and laws to punish unethical businesses were perceived by a smaller proportion of stakeholders to constitute business reforms.
Figure 20: Perceived meaning(s) of business reforms
Business reforms mean easier tax filing, ensuring fair competition, and the amendment of existing business regulations, among others
what do you understand by business reforms?
35
Stakeholder PercePtion Survey | January 2013
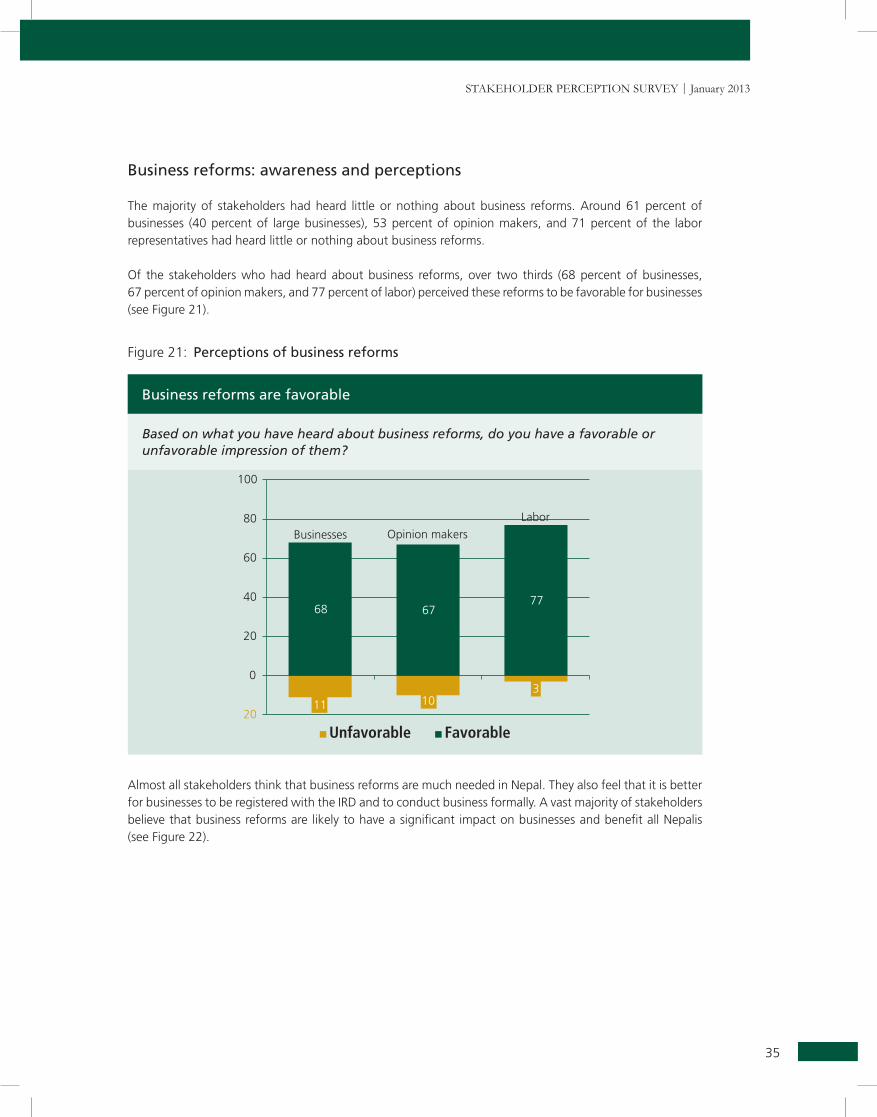
Business reforms are favorable
based on what you have heard about business reforms, do you have a favorable or unfavorable impression of them?
Business reforms: awareness and perceptions
The majority of stakeholders had heard little or nothing about business reforms. Around 61 percent of businesses (40 percent of large businesses), 53 percent of opinion makers, and 71 percent of the labor representatives had heard little or nothing about business reforms.
Of the stakeholders who had heard about business reforms, over two thirds (68 percent of businesses, 67 percent of opinion makers, and 77 percent of labor) perceived these reforms to be favorable for businesses (see Figure 21).
Figure 21: Perceptions of business reforms
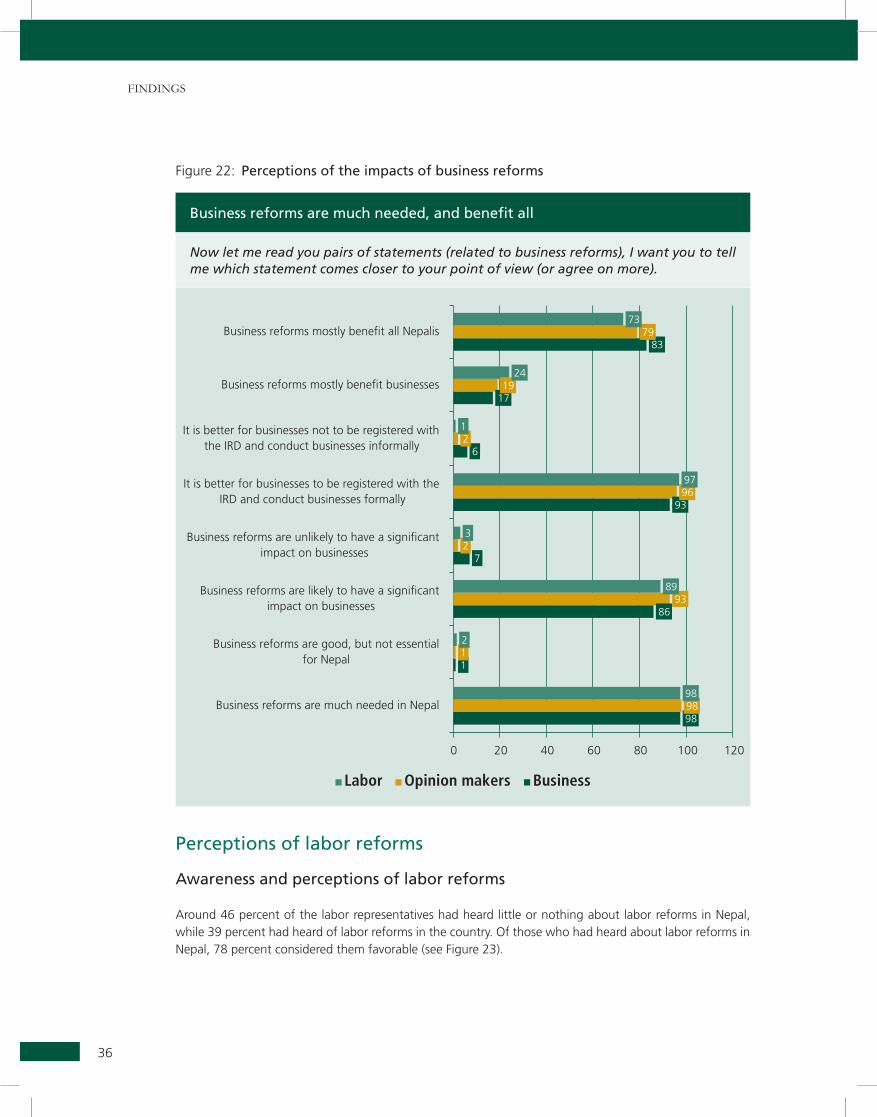
Almost all stakeholders think that business reforms are much needed in Nepal. They also feel that it is better for businesses to be registered with the IRD and to conduct business formally. A vast majority of stakeholders believe that business reforms are likely to have a significant impact on businesses and benefit all Nepalis (see Figure 22).
FindingS
36
Figure 22: Perceptions of the impacts of business reforms
Business reforms are much needed, and benefit all
Now let me read you pairs of statements (related to business reforms), I want you to tell me which statement comes closer to your point of view (or agree on more).
Perceptions of labor reforms
Awareness and perceptions of labor reforms
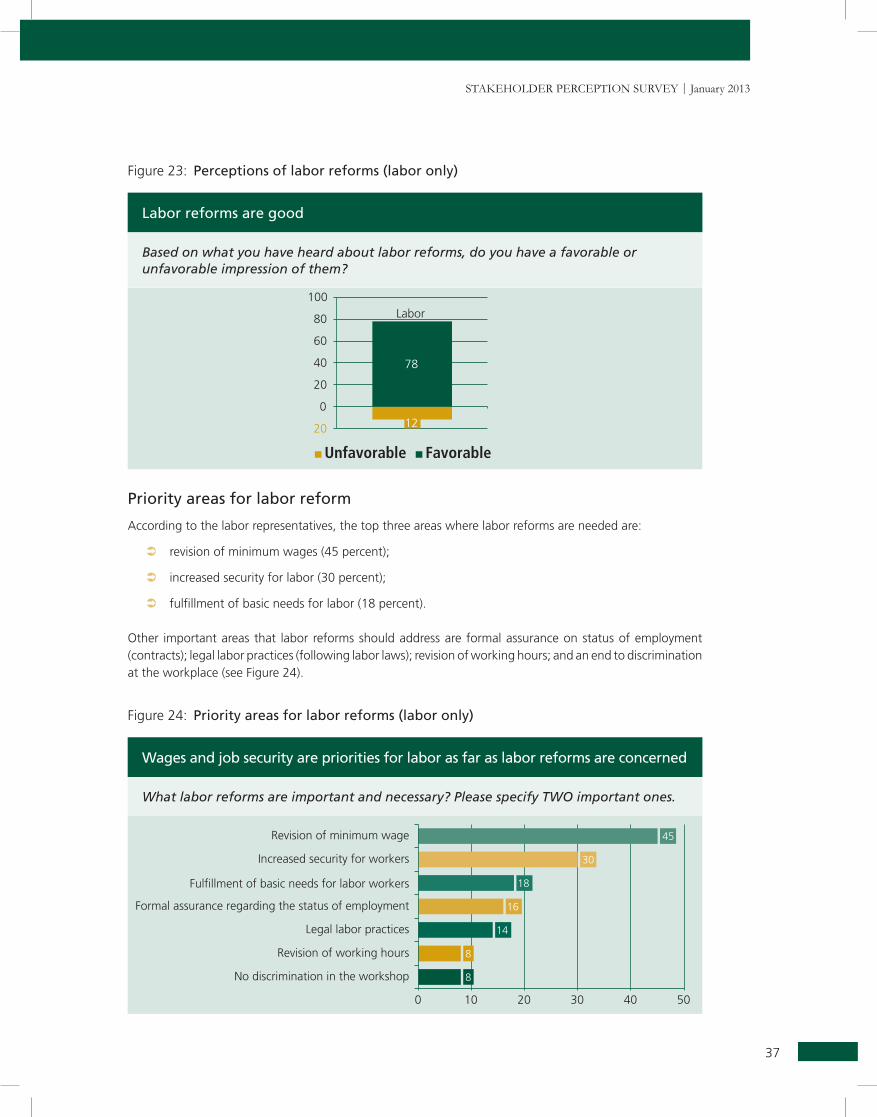
Around 46 percent of the labor representatives had heard little or nothing about labor reforms in Nepal, while 39 percent had heard of labor reforms in the country. Of those who had heard about labor reforms in Nepal, 78 percent considered them favorable (see Figure 23).
37
Stakeholder PercePtion Survey | January 2013
Figure 23: Perceptions of labor reforms (labor only)
Priority areas for labor reform
According to the labor representatives, the top three areas where labor reforms are needed are:
 revision of minimum wages (45 percent);
 increased security for labor (30 percent);
 fulfillment of basic needs for labor (18 percent).
Other important areas that labor reforms should address are formal assurance on status of employment (contracts); legal labor practices (following labor laws); revision of working hours; and an end to discrimination at the workplace (see Figure 24).
Figure 24: Priority areas for labor reforms (labor only)
Labor reforms are good
based on what you have heard about labor reforms, do you have a favorable or unfavorable impression of them?
Wages and job security are priorities for labor as far as labor reforms are concerned
what labor reforms are important and necessary? Please specify Two important ones.
FindingS
38
Private Sector
The private sector and its activities
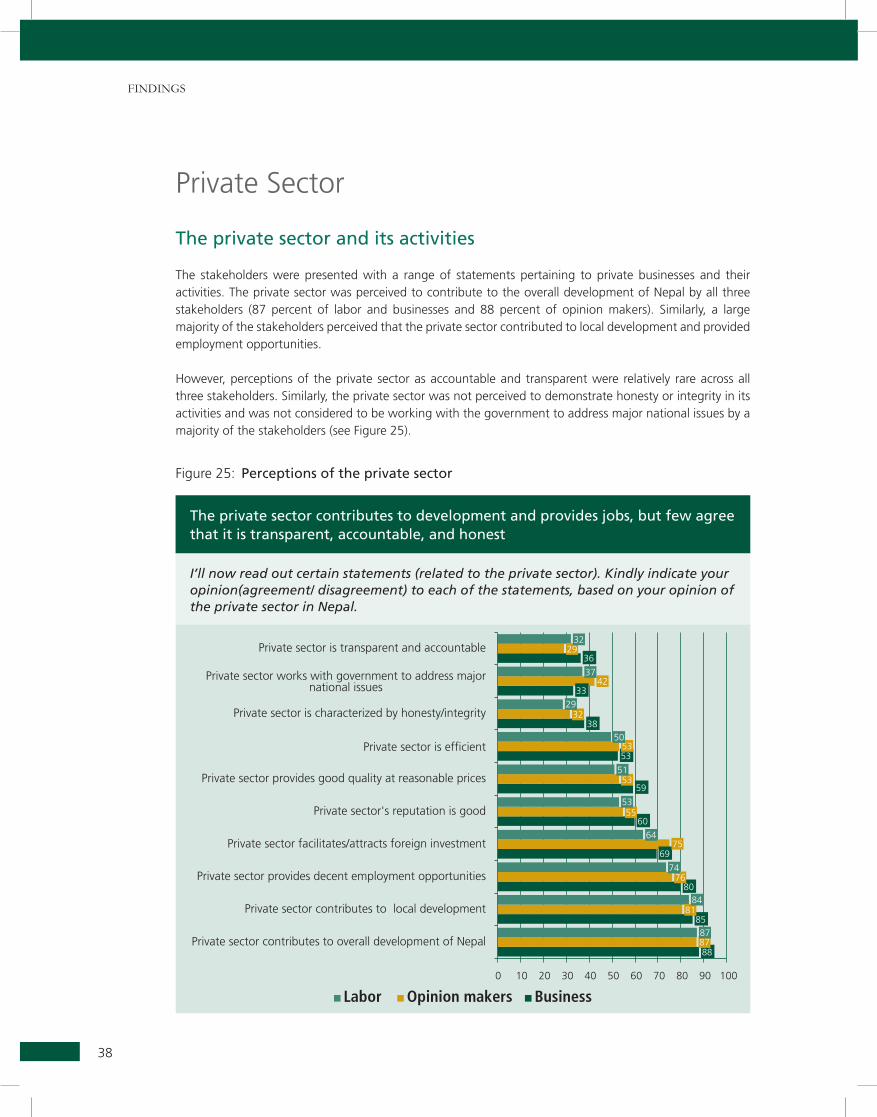
The stakeholders were presented with a range of statements pertaining to private businesses and their activities. The private sector was perceived to contribute to the overall development of Nepal by all three stakeholders (87 percent of labor and businesses and 88 percent of opinion makers). Similarly, a large majority of the stakeholders perceived that the private sector contributed to local development and provided employment opportunities.
However, perceptions of the private sector as accountable and transparent were relatively rare across all three stakeholders. Similarly, the private sector was not perceived to demonstrate honesty or integrity in its activities and was not considered to be working with the government to address major national issues by a majority of the stakeholders (see Figure 25).
Figure 25: Perceptions of the private sector
The private sector contributes to development and provides jobs, but few agree that it is transparent, accountable, and honest
I’ll now read out certain statements (related to the private sector). Kindly indicate your opinion(agreement/ disagreement) to each of the statements, based on your opinion of the private sector in Nepal.
39
Stakeholder PercePtion Survey | January 2013
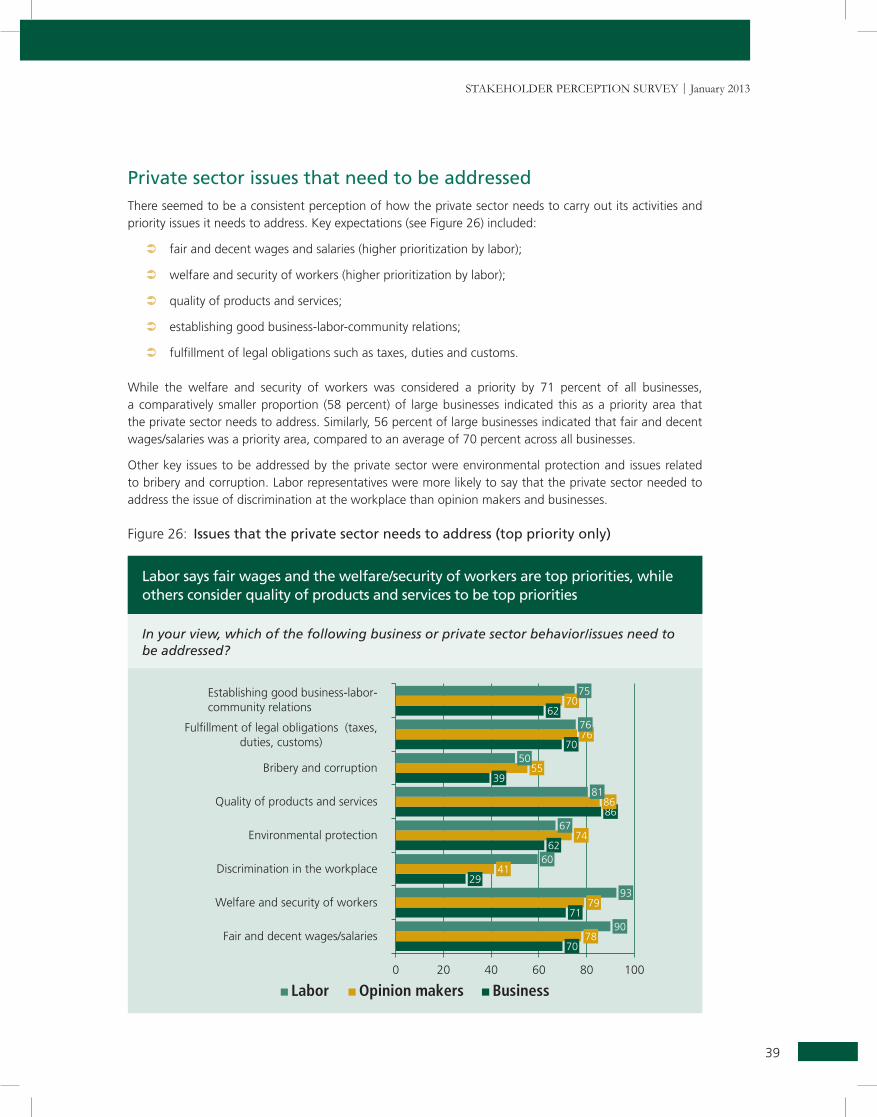
Labor says fair wages and the welfare/security of workers are top priorities, while others consider quality of products and services to be top priorities
In your view, which of the following business or private sector behavior/issues need to be addressed?
Private sector issues that need to be addressedThere seemed to be a consistent perception of how the private sector needs to carry out its activities and priority issues it needs to address. Key expectations (see Figure 26) included:
 fair and decent wages and salaries (higher prioritization by labor);
 welfare and security of workers (higher prioritization by labor);
 quality of products and services;
 establishing good business-labor-community relations;
 fulfillment of legal obligations such as taxes, duties and customs.
While the welfare and security of workers was considered a priority by 71 percent of all businesses, a comparatively smaller proportion (58 percent) of large businesses indicated this as a priority area that the private sector needs to address. Similarly, 56 percent of large businesses indicated that fair and decent wages/salaries was a priority area, compared to an average of 70 percent across all businesses.
Other key issues to be addressed by the private sector were environmental protection and issues related to bribery and corruption. Labor representatives were more likely to say that the private sector needed to address the issue of discrimination at the workplace than opinion makers and businesses.
Figure 26: Issues that the private sector needs to address (top priority only)
FindingS
40
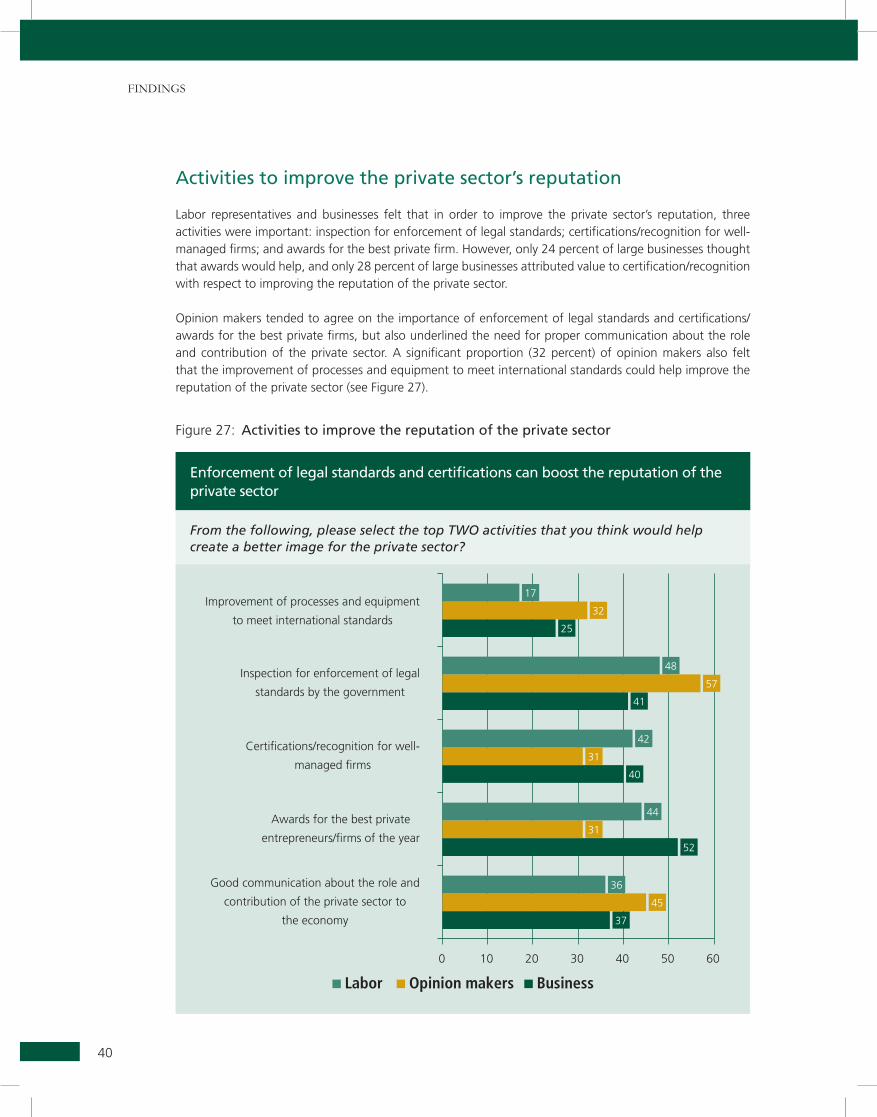
Activities to improve the private sector’s reputation
Labor representatives and businesses felt that in order to improve the private sector’s reputation, three activities were important: inspection for enforcement of legal standards; certifications/recognition for well-managed firms; and awards for the best private firm. However, only 24 percent of large businesses thought that awards would help, and only 28 percent of large businesses attributed value to certification/recognition with respect to improving the reputation of the private sector.
Opinion makers tended to agree on the importance of enforcement of legal standards and certifications/awards for the best private firms, but also underlined the need for proper communication about the role and contribution of the private sector. A significant proportion (32 percent) of opinion makers also felt that the improvement of processes and equipment to meet international standards could help improve the reputation of the private sector (see Figure 27).
Figure 27: Activities to improve the reputation of the private sector
Enforcement of legal standards and certifications can boost the reputation of the private sector
from the following, please select the top Two activities that you think would help create a better image for the private sector?
41
Stakeholder PercePtion Survey | January 2013
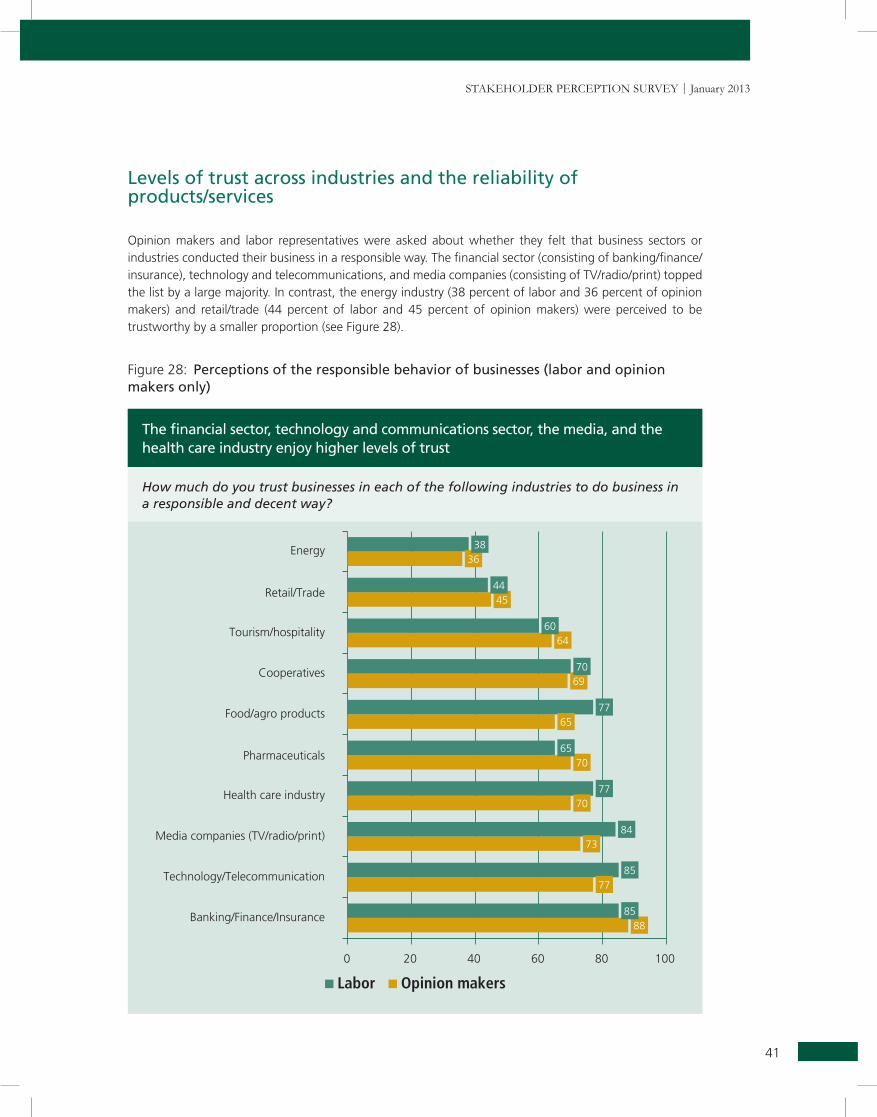
The financial sector, technology and communications sector, the media, and the health care industry enjoy higher levels of trust
How much do you trust businesses in each of the following industries to do business in a responsible and decent way?
Levels of trust across industries and the reliability of products/services
Opinion makers and labor representatives were asked about whether they felt that business sectors or industries conducted their business in a responsible way. The financial sector (consisting of banking/finance/insurance), technology and telecommunications, and media companies (consisting of TV/radio/print) topped the list by a large majority. In contrast, the energy industry (38 percent of labor and 36 percent of opinion makers) and retail/trade (44 percent of labor and 45 percent of opinion makers) were perceived to be trustworthy by a smaller proportion (see Figure 28).
Figure 28: Perceptions of the responsible behavior of businesses (labor and opinion makers only)
FindingS
42
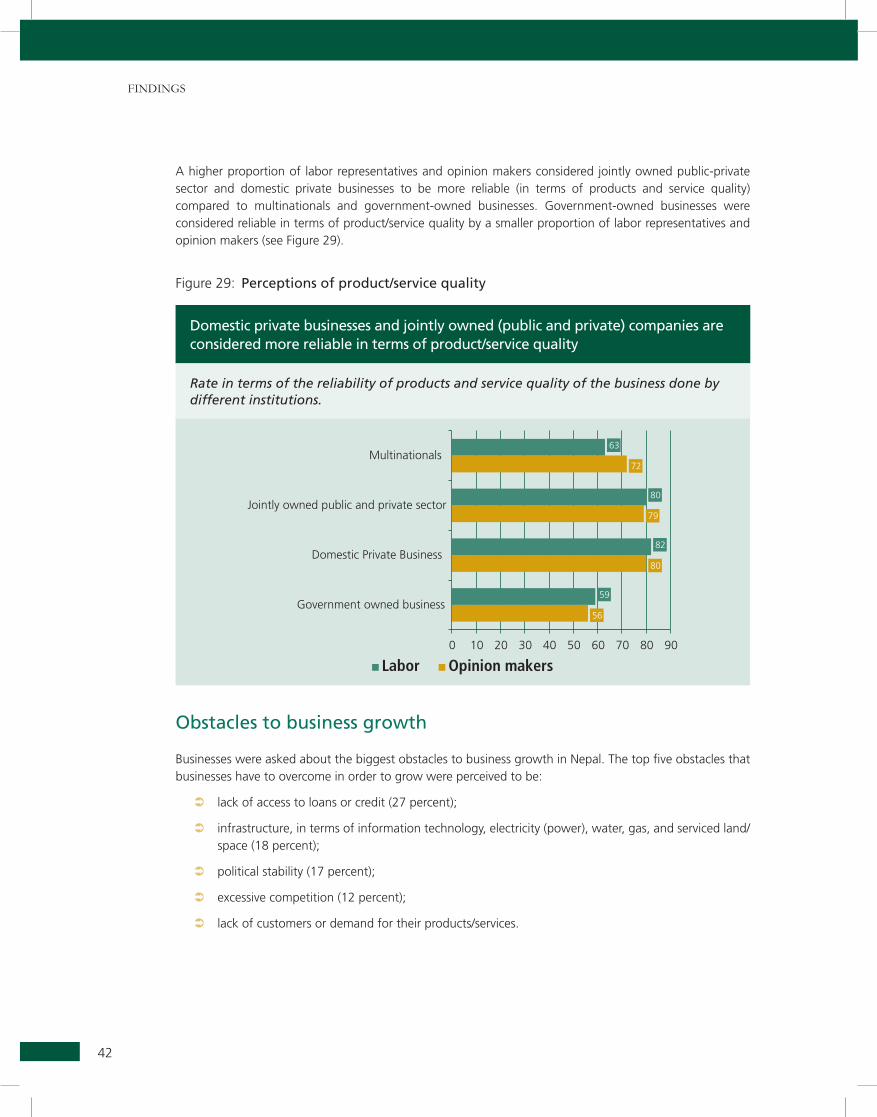
A higher proportion of labor representatives and opinion makers considered jointly owned public-private sector and domestic private businesses to be more reliable (in terms of products and service quality) compared to multinationals and government-owned businesses. Government-owned businesses were considered reliable in terms of product/service quality by a smaller proportion of labor representatives and opinion makers (see Figure 29).
Figure 29: Perceptions of product/service quality
Obstacles to business growth
Businesses were asked about the biggest obstacles to business growth in Nepal. The top five obstacles that businesses have to overcome in order to grow were perceived to be:
 lack of access to loans or credit (27 percent);
 infrastructure, in terms of information technology, electricity (power), water, gas, and serviced land/space (18 percent);
 political stability (17 percent);
 excessive competition (12 percent);
 lack of customers or demand for their products/services.
Domestic private businesses and jointly owned (public and private) companies are considered more reliable in terms of product/service quality
Rate in terms of the reliability of products and service quality of the business done by different institutions.
43
Stakeholder PercePtion Survey | January 2013
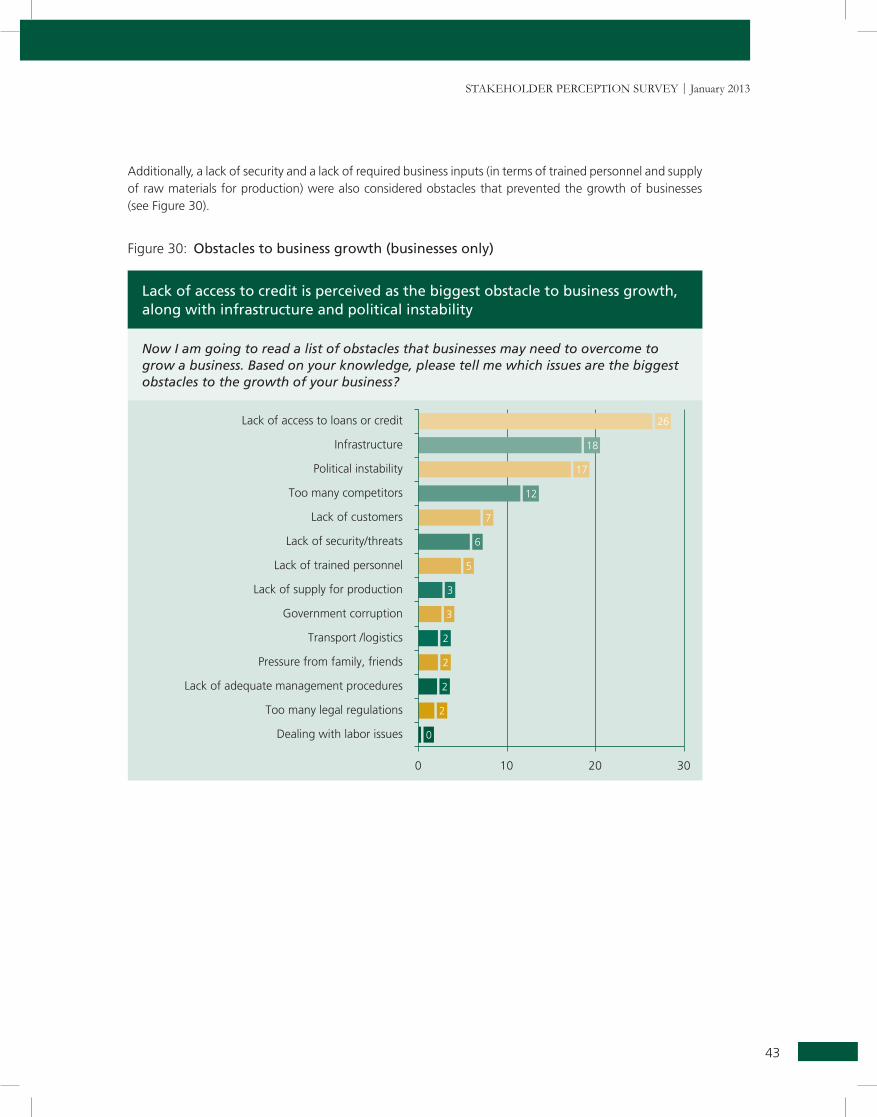
Additionally, a lack of security and a lack of required business inputs (in terms of trained personnel and supply of raw materials for production) were also considered obstacles that prevented the growth of businesses (see Figure 30).
Figure 30: Obstacles to business growth (businesses only)
Lack of access to credit is perceived as the biggest obstacle to business growth, along with infrastructure and political instability
Now I am going to read a list of obstacles that businesses may need to overcome to grow a business. based on your knowledge, please tell me which issues are the biggest obstacles to the growth of your business?
FindingS
44
Nepal Investment Year 2012-13
Awareness of Nepal Investment Year 2012-13
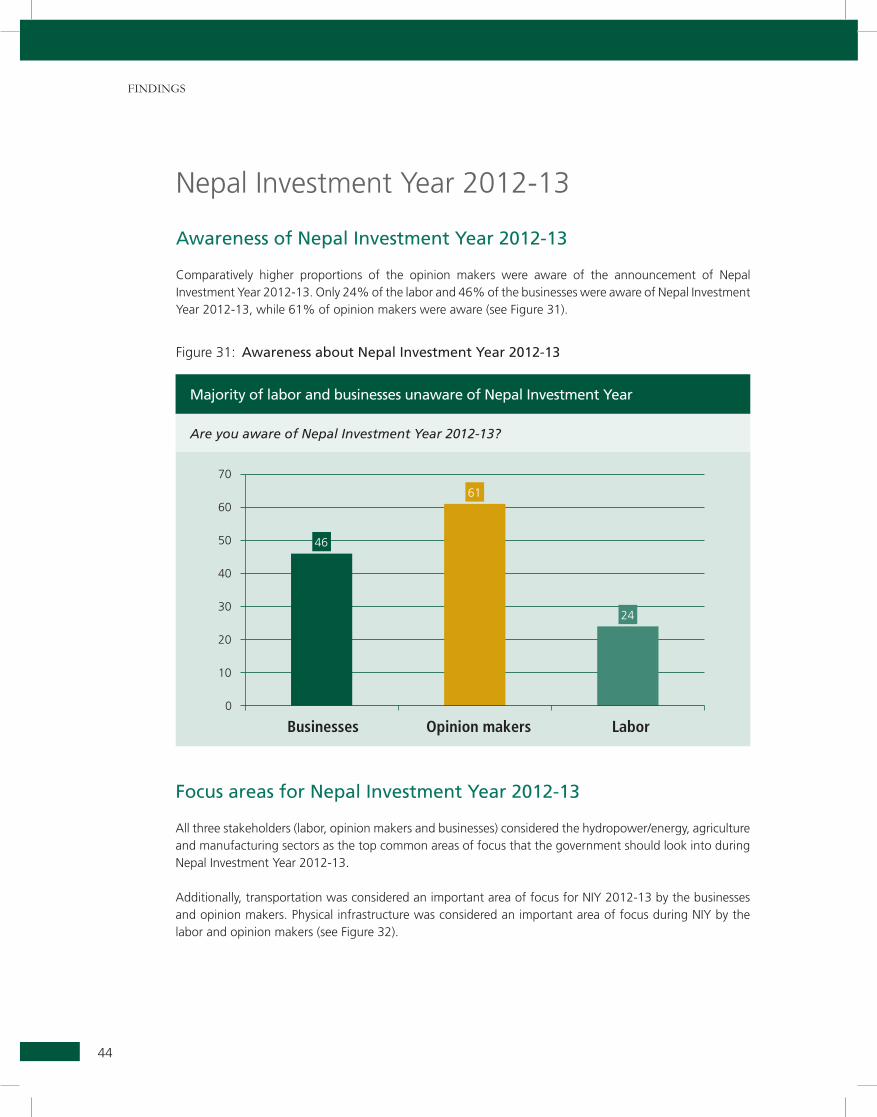
Comparatively higher proportions of the opinion makers were aware of the announcement of Nepal Investment Year 2012-13. Only 24% of the labor and 46% of the businesses were aware of Nepal Investment Year 2012-13, while 61% of opinion makers were aware (see Figure 31).
Figure 31: Awareness about Nepal Investment Year 2012-13
Majority of labor and businesses unaware of Nepal Investment Year
are you aware of Nepal Investment year 2012-13?
Focus areas for Nepal Investment Year 2012-13
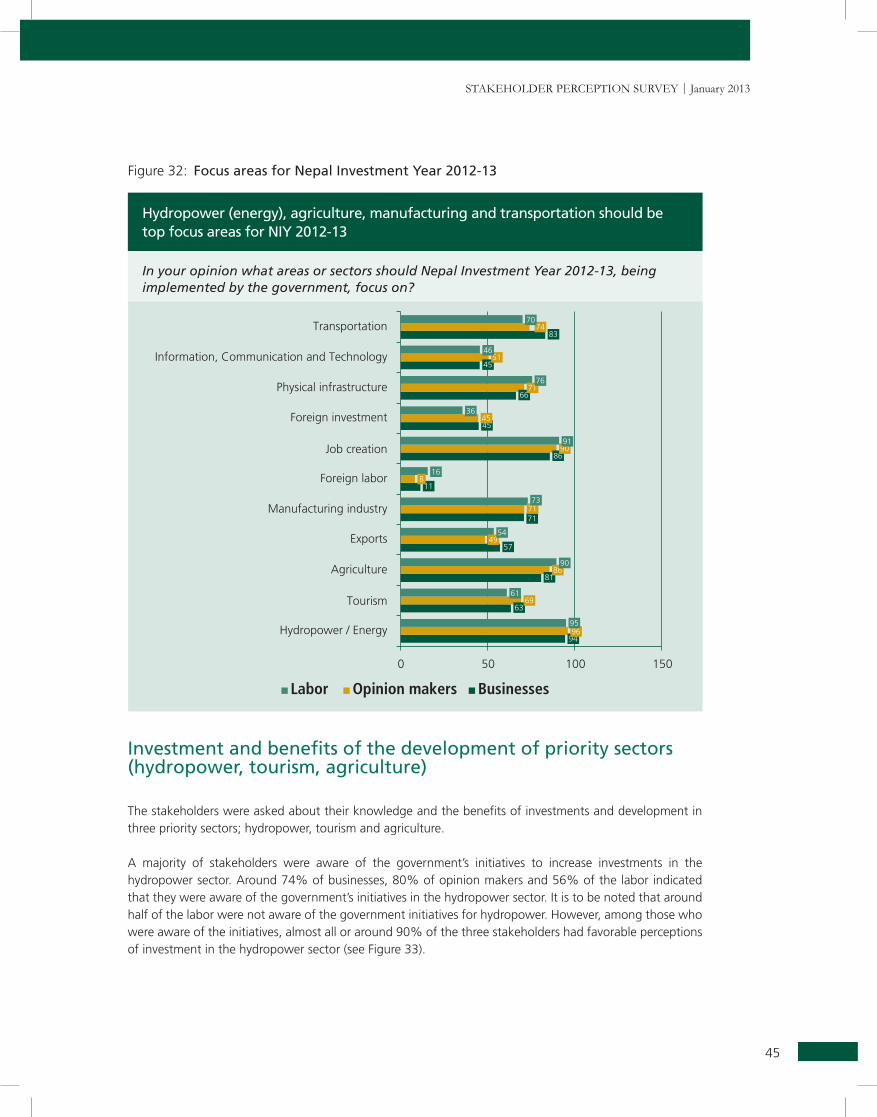
All three stakeholders (labor, opinion makers and businesses) considered the hydropower/energy, agriculture and manufacturing sectors as the top common areas of focus that the government should look into during Nepal Investment Year 2012-13.
Additionally, transportation was considered an important area of focus for NIY 2012-13 by the businesses and opinion makers. Physical infrastructure was considered an important area of focus during NIY by the labor and opinion makers (see Figure 32).
45
Stakeholder PercePtion Survey | January 2013
Hydropower (energy), agriculture, manufacturing and transportation should be top focus areas for NIY 2012-13
In your opinion what areas or sectors should Nepal Investment year 2012-13, being implemented by the government, focus on?
Figure 32: Focus areas for Nepal Investment Year 2012-13
Investment and benefits of the development of priority sectors (hydropower, tourism, agriculture)
The stakeholders were asked about their knowledge and the benefits of investments and development in three priority sectors; hydropower, tourism and agriculture.
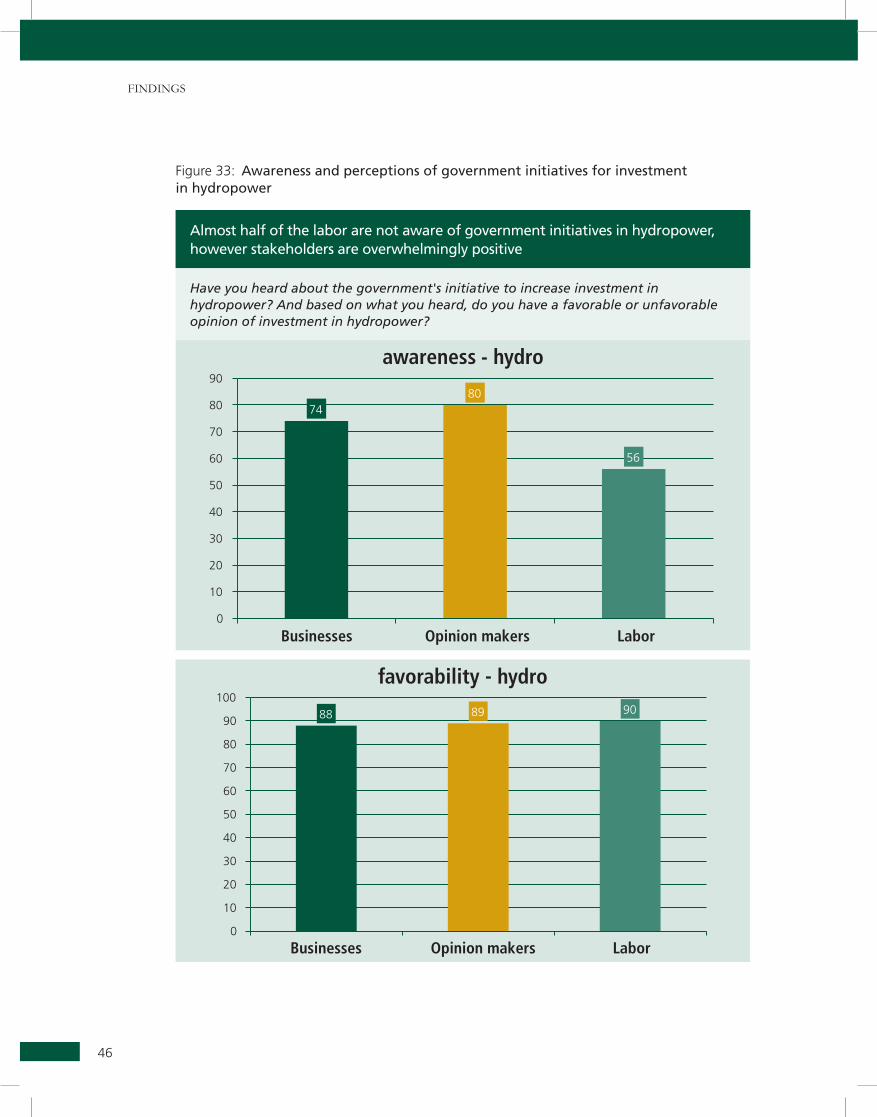
A majority of stakeholders were aware of the government’s initiatives to increase investments in the hydropower sector. Around 74% of businesses, 80% of opinion makers and 56% of the labor indicated that they were aware of the government’s initiatives in the hydropower sector. It is to be noted that around half of the labor were not aware of the government initiatives for hydropower. However, among those who were aware of the initiatives, almost all or around 90% of the three stakeholders had favorable perceptions of investment in the hydropower sector (see Figure 33).
FindingS
46
Figure 33: Awareness and perceptions of government initiatives for investment in hydropower
Almost half of the labor are not aware of government initiatives in hydropower, however stakeholders are overwhelmingly positive
Have you heard about the government's initiative to increase investment in hydropower? and based on what you heard, do you have a favorable or unfavorable opinion of investment in hydropower?
47
Stakeholder PercePtion Survey | January 2013
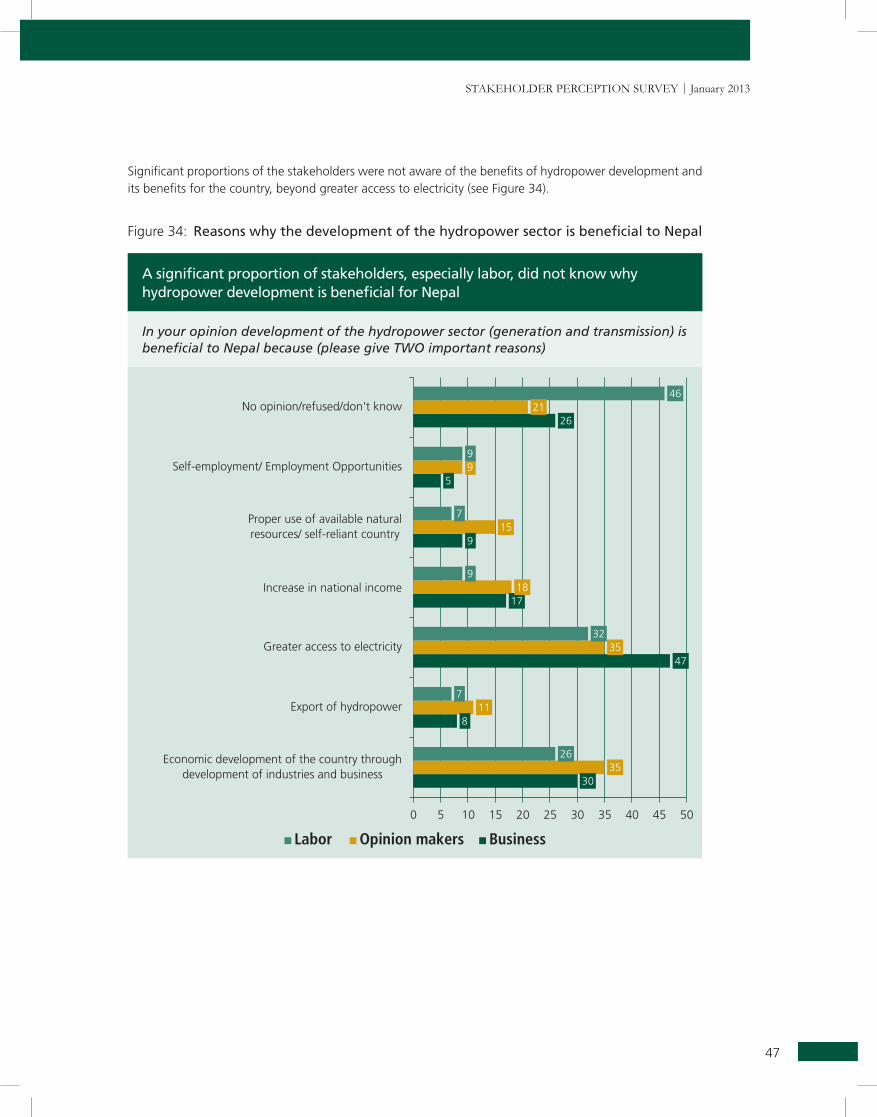
A significant proportion of stakeholders, especially labor, did not know why hydropower development is beneficial for Nepal
In your opinion development of the hydropower sector (generation and transmission) is beneficial to Nepal because (please give Two important reasons)
Significant proportions of the stakeholders were not aware of the benefits of hydropower development and its benefits for the country, beyond greater access to electricity (see Figure 34).
Figure 34: Reasons why the development of the hydropower sector is beneficial to Nepal
FindingS
48
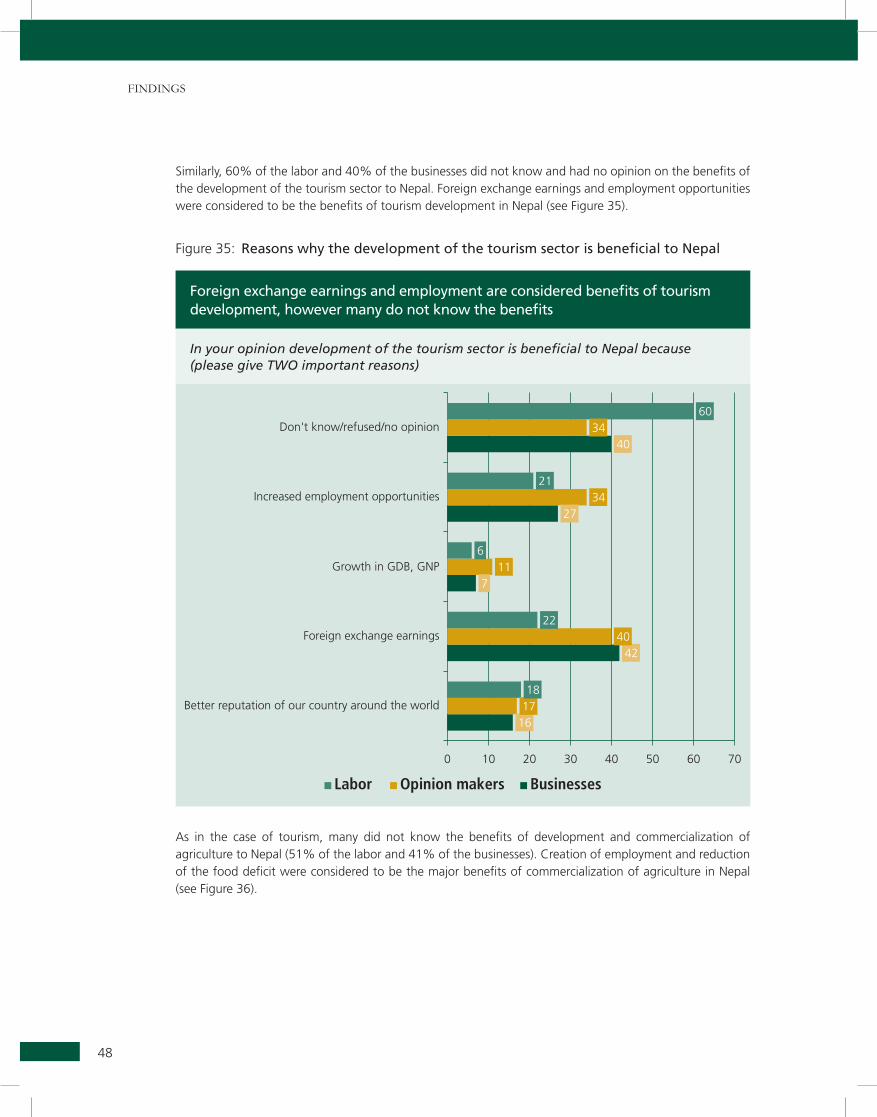
Similarly, 60% of the labor and 40% of the businesses did not know and had no opinion on the benefits of the development of the tourism sector to Nepal. Foreign exchange earnings and employment opportunities were considered to be the benefits of tourism development in Nepal (see Figure 35).
Figure 35: Reasons why the development of the tourism sector is beneficial to Nepal
Foreign exchange earnings and employment are considered benefits of tourism development, however many do not know the benefits
In your opinion development of the tourism sector is beneficial to Nepal because (please give Two important reasons)
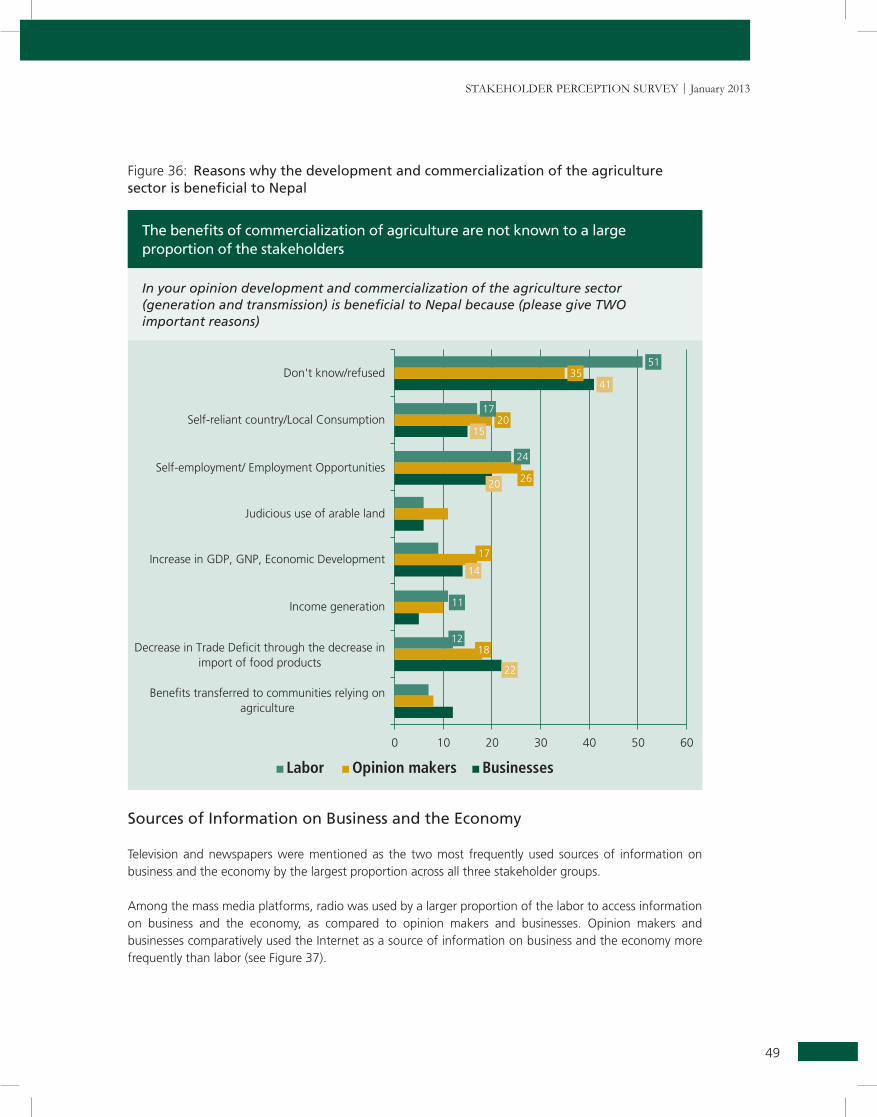
As in the case of tourism, many did not know the benefits of development and commercialization of agriculture to Nepal (51% of the labor and 41% of the businesses). Creation of employment and reduction of the food deficit were considered to be the major benefits of commercialization of agriculture in Nepal (see Figure 36).
49
Stakeholder PercePtion Survey | January 2013
The benefits of commercialization of agriculture are not known to a large proportion of the stakeholders
In your opinion development and commercialization of the agriculture sector (generation and transmission) is beneficial to Nepal because (please give Two important reasons)
Figure 36: Reasons why the development and commercialization of the agriculture sector is beneficial to Nepal
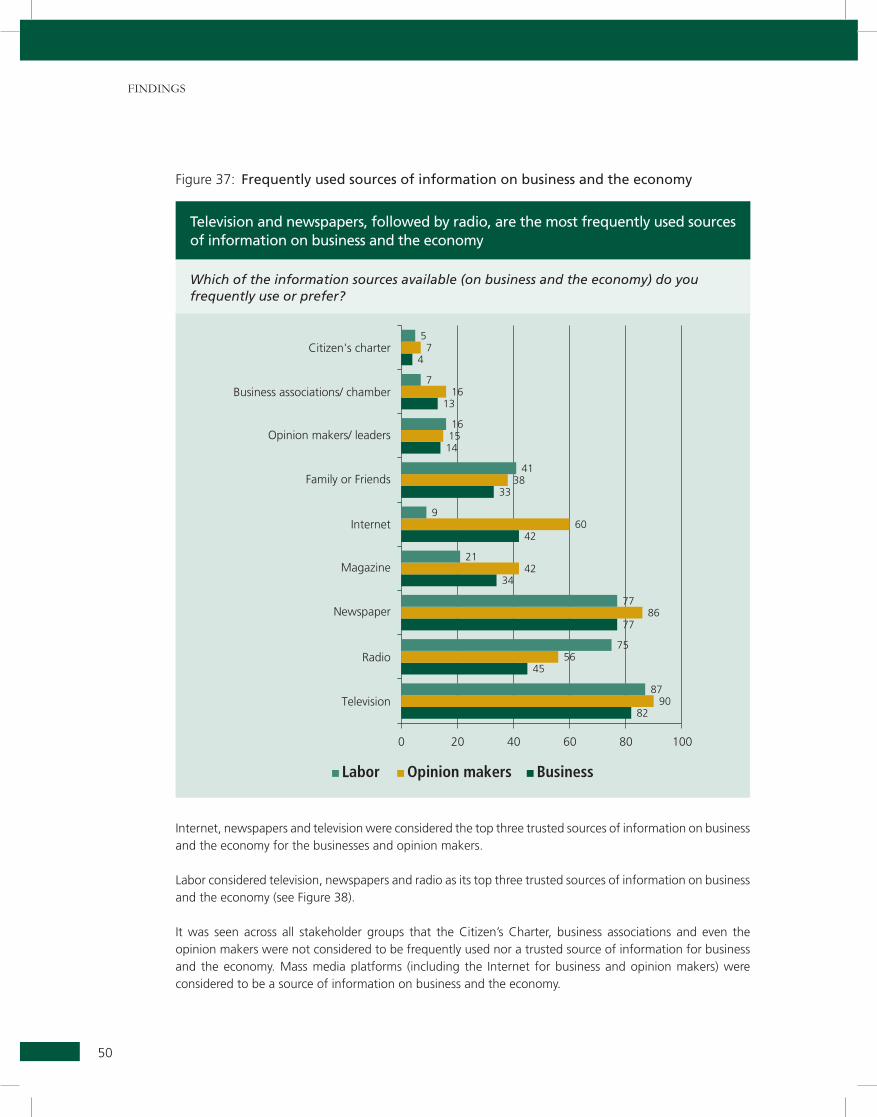
Sources of Information on Business and the Economy
Television and newspapers were mentioned as the two most frequently used sources of information on business and the economy by the largest proportion across all three stakeholder groups.
Among the mass media platforms, radio was used by a larger proportion of the labor to access information on business and the economy, as compared to opinion makers and businesses. Opinion makers and businesses comparatively used the Internet as a source of information on business and the economy more frequently than labor (see Figure 37).
FindingS
50
Figure 37: Frequently used sources of information on business and the economy
Television and newspapers, followed by radio, are the most frequently used sources of information on business and the economy
which of the information sources available (on business and the economy) do you frequently use or prefer?
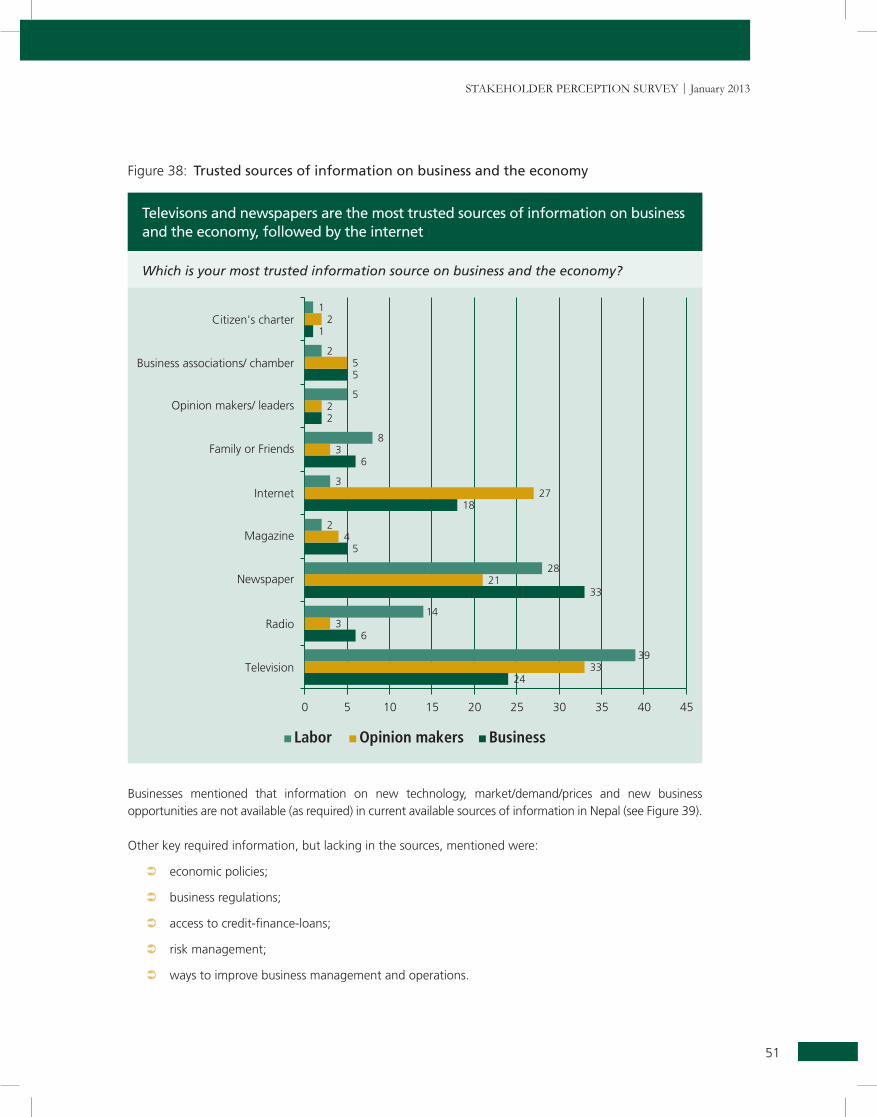
Internet, newspapers and television were considered the top three trusted sources of information on business and the economy for the businesses and opinion makers.
Labor considered television, newspapers and radio as its top three trusted sources of information on business and the economy (see Figure 38).
It was seen across all stakeholder groups that the Citizen’s Charter, business associations and even the opinion makers were not considered to be frequently used nor a trusted source of information for business and the economy. Mass media platforms (including the Internet for business and opinion makers) were considered to be a source of information on business and the economy.
51
Stakeholder PercePtion Survey | January 2013
Televisons and newspapers are the most trusted sources of information on business and the economy, followed by the internet
which is your most trusted information source on business and the economy?
Figure 38: Trusted sources of information on business and the economy
Businesses mentioned that information on new technology, market/demand/prices and new business opportunities are not available (as required) in current available sources of information in Nepal (see Figure 39).
Other key required information, but lacking in the sources, mentioned were:
 economic policies;
 business regulations;
 access to credit-finance-loans;
 risk management;
 ways to improve business management and operations.
FindingS
52
Figure 39: Types of information on business and the economy required by businesses (businesses only)
Businesses cannot find much needed information, such as information on new technology, markets and demand, and business opportunities
what information do you require but cannot find regarding business and the economy?

Stakeholder PercePtion Survey | January 2013

In partnership with