stakeholder value networks hein revision accepted
TRANSCRIPT

HAL Id: hal-01452809https://hal.inria.fr/hal-01452809
Submitted on 2 Feb 2017
HAL is a multi-disciplinary open accessarchive for the deposit and dissemination of sci-entific research documents, whether they are pub-lished or not. The documents may come fromteaching and research institutions in France orabroad, or from public or private research centers.
L’archive ouverte pluridisciplinaire HAL, estdestinée au dépôt et à la diffusion de documentsscientifiques de niveau recherche, publiés ou non,émanant des établissements d’enseignement et derecherche français ou étrangers, des laboratoirespublics ou privés.
Stakeholder Power in Industrial Symbioses: AStakeholder Value Network Approach
Andreas Hein, Marija Jankovic, Wen Feng, Romain Farel, Jeremy Yune,Bernard Yannou
To cite this version:Andreas Hein, Marija Jankovic, Wen Feng, Romain Farel, Jeremy Yune, et al.. Stakeholder Powerin Industrial Symbioses: A Stakeholder Value Network Approach. Journal of Cleaner Production,Elsevier, 2017, 148, pp.923-933. �10.1016/j.jclepro.2017.01.136�. �hal-01452809�

1
Stakeholder Power in Industrial Symbioses: A Stakeholder Value Network Approach
Andreas M. Hein1,2, Marija Jankovic1, Wen Feng3, Romain Farel2, Jeremy H. Yune2, Bernard Yannou1
1 Laboratoire Genie Industriel, CentraleSupélec, Université Paris-Saclay 2 Paris-Saclay Energy Efficiency (PS2E)
3 Global Projects Center, Stanford University
Abstract
Forming and sustaining an industrial symbiosis depends on several actors. Actors that have an interest
in the symbiosis and the possibility to influence it are called “stakeholders”. According to social
exchange theory and resource dependency theory, the power of actors in a network depends on the
dependency of other actors on the resources they control. We adapt the stakeholder value network
approach from the strategic management literature to the industrial symbiosis context as a means to
provide insights into the power of stakeholders of an industrial symbiosis. The approach is applied to
a waste incinerator steam network symbiosis case study in France, which has been successfully
operated and extended over decades. The results from the case study show that using the stakeholder
value network approach enables the assessment of the relative power of symbiosis stakeholders and
to identify key resources on which their power is based. We propose the application of the approach
to further case studies in order to identify patterns in the power distribution within symbiosis
networks.
Key words: industrial symbiosis, eco-industrial park, value networks, stakeholder analysis, social
exchange theory, power
1. Introduction
An Industrial symbiosis “engages traditionally separate industries in a collective approach to
competitive advantage involving physical exchange of materials, energy, water and byproducts.”
(Chertow, 2000) According to Deutz (2014), an industrial symbiosis is “a flow of underutilised
resource(s) (comprising substances and/or objects and/or energy), from an entity which would
otherwise discard them, to another entity which uses them as a substitute for new resources.” The
potential benefits of a symbiosis can be economical, environmental, and societal (Hein, Jankovic, Farel,
& Yannou, 2015; Hellweg & Canals, 2014). Industrial symbiosis is a “collective approach” based on
collaboration (Chertow, 2000). Two forms of collaboration can be distinguished. The first form of
collaboration happens between actors that are directly involved or plan to be involved in a material /
energy exchange. Such actors are called “symbiosis partners” in the following (Ashton & Bain, 2012;
Hein et al., 2015). The role of actors that are not symbiosis partners, such as business associations,
anchor tenants, governmental agencies, etc. has been studied in several publications (Boons, F.,
Spekkink, W., Jiao, 2014; F Boons, Spekkink, & Mouzakitis, 2011; Chertow, 2007; Heeres, Vermeulen,
& De Walle, 2004; Mirata, 2004; Paquin, R., Howard-Grenville, 2009; Paquin & Howard‐Grenville, 2012;
W Spekkink, 2015; Wouter Spekkink, 2013). However, an aspect that has been less studied is how
(potential) symbiosis partners can use this actor network for getting access to vital resources for

2
creating, maintaining, and extending a symbiosis (Brullot, Maillefert, & Joubert, 2014; Paquin, R.,
Howard-Grenville, 2009; Paquin & Howard‐Grenville, 2012). Such actors that are vital for a project or
organization’s success have been extensively treated in the strategic management literature as
“stakeholders”. Narrow and broad definitions exist for “stakeholder” (Mitchell, Agle, & Wood, 1997).
According to Freeman (1984, p.46) “any group or individual who can affect or is affected by the
achievement of the organization’s objectives” is considered a “stakeholder”. We can adapt this
definition of stakeholder by replacing “achievement of the organization’s objectives” by “creating,
maintaining, or extending a symbiosis”. Or in the context of a symbiosis, actors that have a “stake” in
a symbiosis are called “stakeholders” (Cameron, Crawley, Feng, & Lin, 2011; Hein, Tziolas, & Osborne,
2011). For evaluating stakeholder salience, we adopt the criteria of power and urgency from Mitchell,
Agle, & Wood, (1997). They use a third criteria which is legitimacy. We omit legitimacy, as the status
of legitimacy as a relevant criteria for stakeholder salience has been contested (Frooman, 1999, p.193).
Frooman (1999) and Rowley (1997) extend stakeholder theory by basing power on the resource
dependency relationsihps in a network. This theory is based on resource exchange theory, which is a
special case of exchange theory (Blau, 1964; R. Emerson, 1972b; Emerson, 1962). A “resource” in this
context is the “essentially anything an actor perceives as valuable.” (Frooman, 1999, p.195) The power
an actor holds with respect to a resource depends on the urgency (time-sensitivity, criticality) (Mitchell
et al., 1997, p.867) of another actor needing the resource, the resource’s nature, the availability of
alternatives (substitutability) (Frooman, 1999, p.195). This interpretation of power draws from
(Emerson, 1962) who defines “power” as dependence of one actor on another, where an actor may
have alternative sources for the resource needed (Cook & Emerson, 1978; Thibaut & Kelley, 1959).
Power is manifested in situations where an actor can overcome the resistance of another (Emerson,
1962, p.32). Furthermore, we distinguish between dyadic exchanges between two actors and
generalized exchanges where resources are transmitted via a chain of actors (Bearman, 1997; Cook &
Yamagishi, 1992; Ekeh, 1974; Lévi-Strauss, 1963, 1969; Takahashi, 2000; Yamagishi & Cook, 1993). An
exchange that relates actors indirectly to each other is also called “network-generalized exchange”
(Yamagishi & Cook, 1993).
In this article, we adapt the stakeholder value network approach, previously developed in (Cameron,
Crawley, et al., 2011; Cameron, Crawley, Loureiro, & Rebentisch, 2008; Cameron, Seher, & Crawley,
2011; Feng, 2013; Fu, Feng, Li, Crawley, & Ni, 2011) for exploring the distribution of power in terms of
control over resources between stakeholders of an industrial symbiosis. The goal is to illuminate the
power of specific stakeholders and key resources. Specifically, we aim at answering the following two
questions: Which stakeholders are the most powerful in a specific symbiosis stakeholder value
network? What are the resources the contribute to stakeholder power in a specific symbiosis
stakeholder value network? We start with a literature survey on existing stakeholder analysis
approaches in Section 2, assessing their appropriateness to the industrial symbiosis context and
continue with literature that explores the relationships between actors in industrial symbioses. We
then present the stakeholder value network approach in Section 3 and propose an adaptation of this
approach to industrial symbiosis. We go on to apply this approach to an industrial symbiosis case study
in France in Section 4. Finally, a discussion of the results is presented in Section 5, along with
conclusions in Section 6.
1 Literature survey The literature survey first explores existing stakeholder analysis approaches and how far they are able
to represent stakeholder power in terms of resource dependence theory. Furthermore, the industrial

3
symbiosis literature is surveyed for existing approaches to illuminate the relationships between
symbiosis actors.
A field in strategic management science that deals with relationships of stakeholders with respect to a
focal organization is called “stakeholder theory” (Freeman & McVea, 2001; Freeman, 1984). The
ranking allows for focusing efforts on the most important stakeholders. Commonly the relationships
between focal organization and stakeholders are represented in a “hub-and-spokes” model in which
only the direct relationships between the focal organization and stakeholders are considered
(Donaldson & Preston, 1995, p.69) (Freeman, 1984). Frooman (1999) extends this model to
relationships between stakeholders representing indirect relationships between focal organization
and stakeholders. In particular, he explores different strategies how the focal organization can
influence stakeholders and vice versa. In a hub-and-spokes model, the focal organization can only
engage in direct relationships with stakeholders. However, as Frooman (1999) remarks, such a limited
representation would miss the richness of real interactions. In triadic or more general relationships the
focal organization and stakeholders can influence each other indirectly via allies. For example, A and B
are stakeholders of the focal organization. The focal organization can use its power to get stakeholder
A to perform an action that leads stakeholder B to provide the focal organization with an important
resource. In such a case A is considered an ally of the focal organization. Frooman (1999) calls this an
indirect strategy.
Stakeholder theory serves as a basis for stakeholder analysis. According to Reed, Graves, Dandy, &
Posthumus (2009, p.1933), stakeholder analysis is a process that: i) defines aspects of a social and
natural phenomenon affected by a decision or action; ii) identifies individuals, groups and
organizations who are affected by or can affect those parts of the phenomenon and iii) prioritizes these
individuals and groups for involvement in the decision-making process. The results from stakeholder
analysis can support the management of stakeholders, understanding the policy context or assess the
feasibility of future policies (Brugha & Varvasovszky, 2000).
Numerous stakeholder analysis methods exist and an overviews are provided in (Reed et al., 2009) and
(Brugha & Varvasovszky, 2000). In the following, we only take methods into consideration that go
beyond dyadic relationships and deal with aspects of power. One set of methods categorizes
stakeholders with respect to their agreement and disagreement over a set of issues (Arcade, Godet,
Meunier, & Roubelat, 1999; Bendahan & Camponovo, 2004; Godet, 1991, 2001). Direct and indirect
ways of how actors can exert power is also taken into consideration. Although a solid grounding in
stakeholder theory seems to be lacking, these approaches can be loosely affiliated with exchange
theory. “Power” is used in a rather wide sense and includes cohesive, utilitarian, and symbolic power
(Etzioni, 1964; Mitchell et al., 1997).
A more recent method is the stakeholder value network approach, which is loosely grounded in
exchange and resource dependence theory. Variations of the method have been introduced in
(Cameron, Crawley, et al., 2011; Cameron et al., 2008; Cameron, Seher, et al., 2011; Feng, 2013; Fu et
al., 2011), along with applications to space programs and the Chinese energy sector. The method
focuses on resources the focal organization and stakeholder provide to each other. “Power” is used in
a restricted sense of resources that are subject to economic exchange relationships (Cameron,
Crawley, et al., 2011).
In the following, we build on the stakeholder value network approach for two reasons. First, the
approach allows for identifying the most important dyadic and more complex resource dependence
relationships along with its resources in a stakeholder network. Second, we argue that its theoretical
grounding in the more recent literature on stakeholder theory more solid than for its alternatives.

4
However, the approach needs to be adapted to the industrial symbiosis context and we attempt to
further improve the grounding in exchange and resource dependence theory.
In the second part we survey the industrial symbiosis literature for types of relationships between
symbiosis stakeholders and more specifically, how far power in terms of resource dependence theory
has been treated.
The role of symbiosis stakeholders and the different forms of relationships between them is explored
in numerous publications (Ashton & Bain, 2012; Baas & Boons, 2004; Baas, 2005; F Boons et al., 2011;
F Boons & Spekkink, 2012; FAA Boons & Baas, 1997; Frank Boons, Spekkink, & Jiao, 2014; Domenech
& Davies, 2011; Heeres et al., 2004; Hewes & Lyons, 2008; Mirata & Emtairah, 2005; Mirata, 2004;
Paquin, R., Howard-Grenville, 2009; Paquin & Howard‐Grenville, 2012; W Spekkink & Boons, 2015). A
frequent topic is the role of actors that facilitate the development of industrial symbioses by
establishing trust between actors, information exchange, and initiate discussions on symbiosis
development such as (Baas & Boons, 2004; Baas, 2005; Mirata, 2004; Paquin, R., Howard-Grenville,
2009; Paquin & Howard‐Grenville, 2012). In particular, the role of trust has been a recurring topic (Baas
& Boons, 2004; Baas, 2005, pp.218-265; Paquin, R., Howard-Grenville, 2009). Industry associations
(Baas & Boons, 2004; Baas, 2005), regional and local government (Heeres et al., 2004; W Spekkink &
Boons, 2015), or national symbiosis programs (Paquin, R., Howard-Grenville, 2009; Paquin & Howard‐
Grenville, 2012) have been identified as actors taking this role. Ashton & Bain (2012, p.76) have further
looked into the structure of informal communication within a symbiosis network where they explore
the role of social embeddedness and social capital in industrial symbiosis. However, they conclude that
the communication structure is only weakly correlated with the actual symbiotic relationships. The
role of power in industrial symbiosis has been picked up by Brullot et al. (2014), within the context of
the power, urgency, legitimacy framework of Mitchell et al. (1997). They use the notion of power, as
defined by Mitchell et al. (1997), where “a party to a relationship has power, to the extent it has or can
gain access to coercive, utilitarian, or normative means, to impose its will in the relationship.” (Mitchell
et al., 1997, p.865) They take the example of an industrial ecology association in Dunkirk and how it
has developed its technical competencies in facilitating symbioses in order to increase its power within
the Dunkirk territory and has put it into the center of the actor network. To conclude, the industrial
symbiosis literature on industrial symbiosis stakeholders has mostly dealt with the facilitating role of
certain stakeholders for developing symbioses. However, it seems that only few publications have
looked into the role and distribution of power within actors in an industrial symbiosis.
In the following, we propose the use of the “stakeholder value network” approach for exploring the
distribution of power among symbiosis stakeholders. The stakeholder value network approach was
pioneered by Cameron et al., 2011; Feng, (2013) but harkens back to earlier work on stakeholder
theory (Freeman & McVea, 2001), economic exchange and transaction theory (Luo, Baldwin, E., &
Magee, 2012), and social exchange theory (Emerson, 1962; R. M. Emerson, 1976; R. Emerson, 1972a,
1972b). Feng (2013, p.64) defines a stakeholder value network as “a multi-relational network
consisting of a focal organization, the focal organization’s stakeholders, and the tangible and intangible
value exchanges between the focal organization and its stakeholders, as well as between the
stakeholders themselves.” In stakeholder value networks economic and social exchanges are
represented by value flows between stakeholders. Within a stakeholder value network nodes
represent stakeholders and directed edges represent value flows.

5
2 Materials and Methods A stakeholder value network consists of the focal organization and its stakeholders. These are the only
actors that are represented in the model. Value flows are exchanged between the focal organization
and the stakeholders. In contrast to the hub-and-spokes model (Donaldson & Preston, 1995, p.69)
(Freeman, 1984), value flows are also exchanged between stakeholders. A value flow represents a
transfer of value from one stakeholder to another. A standard economic transaction of buying a
product can be modeled in terms of value flows. A value flow can be tangible or intangible and is based
on a resource, which is “essentially anything an actor perceives as valuable.” (Frooman, 1999, p.195)
A string of value flows that connects stakeholder(s) and starts and ends at the focal organization is
called “value loop”. Stakeholder value networks are not limited to economic transactions but can be
used for modeling social exchanges in general due to its theoretical grounding in social exchange
theory and resource dependency theory (Cameron, Crawley, et al., 2011). This is especially important
for the industrial symbiosis context, which is not limited to an economic relationship.
2.1 Research methodology
We adapt the stakeholder value network approach to industrial symbiosis. We justify the applicability
of this approach to industrial symbiosis by arguing that the underlying theory of social exchange theory
can be applied to industrial symbiosis (Cook & Whitmeyer, 1992). We assign weightings to the value
flows based on the dimensions importance and urgency from Feng (2013). However, we put
importance and urgency into the context of resource dependence theory (Frooman, 1999) and the
power, legitimacy, and urgency framework of Mitchell et al. (1997). We determine relative stakeholder
power by calculating the weighted stakeholder occurrence in all value loops, based on the algorithm
presented in Feng, Crawley, Weck, Keller, & Link, (2012) and Johnson (1975). Using the same
algorithms, key resources / value flows in all value loops can be identified.
The basic modeling steps are taken from Fu et al. (2011) and Cameron et al. (2008):
1) Find relevant stakeholders for focal organization, their objectives, and needs
The first question is what to consider as the focal project / organization. In the context of industrial
symbioses there are basically two options. The first option is to consider the symbiosis as the focal
project. The second choice is to consider the actor responsible for the symbiosis as the focal
organization. We opt for selecting the actor responsible for the symbiosis as the focal organization or
an organization in a larger hierarchy. In many cases this is the actor who takes the lead in conducting
the feasibility studies, negotiations, and coordinates the implementation and operation of the
symbiosis. In cases where two or more organizations share the responsibility, these organizations can
be collectively considered as the focal organization.
A key question in stakeholder theory is whom to consider a stakeholder. If we set the criteria loose
enough, almost any actor can be considered a stakeholder. We take two approaches for identifying
stakeholders. First, we consider the list of stakeholder types relevant for industrial symbiosis compiled
in Heeres et al. (2004, p.987) and Brullot et al. (2014). For identifying stakeholders, we use snowball
sampling (Reed et al., 2009) where we asked representatives from the focal and other organizations
to name stakeholders that are important to them during semi-structured interviews. We specifically
asked about the objectives and needs of their organization and which stakeholders are currently
contributing to these objectives or satisfying these needs. Further questions asked during these
interviews can be found in Appendix A. We validated these objectives and needs via publicly available
documents that refer to these such as the mission and vision statement. For limiting the number of

6
stakeholders, we use the stopping criteria from Clarke and Clegg (1998). Furthermore, we only take
stakeholders into consideration with which the focal organization is directly interacting (Cameron et
al., 2008; Rowley, 1997).
2) Develop qualitative model of the stakeholder value network
The qualitative stakeholder value network is created where all the value flows between stakeholders,
and between the stakeholders and the focal organization are modeled in a directed, labeled graph.
Flows are based on resources on which an organization depends, according to resource dependence
theory, presented in Frooman (1999). If a stakeholder possesses a resources that is providing value to
another stakeholder, a value flow is created from the owner of the resource to the receiver of value
from the resource.
3) Develop quantitative model of the stakeholder value network
For developing a quantitative model, utility values are assigned to each value flow. “Utility” in the
sense of multi-attribute utility theory is understood as the assignment of “a set of numbers to the
various entities and (to) predict that the entity with the largest assigned number will be chosen.”
(Alchian, 1953) The weightings for individual value flows are based on an urgency and importance scale
from Feng (2013) but is adapted to resource dependency and exchange theory. “Urgency” in this
context indicates how quickly a resource is needed by a receiving stakeholder and reflects the notion
of “time-sensitivity” in Mitchell et al. (1997). Mitchell et al. (1997) introduce time-sensitivity in order
to reflect the dynamic nature of stakeholder relationships. More specifically, how pressing an issue
such as the lack of a resource is to a stakeholder. For example, a company that lacks a critical resource
may need to hold production. The urgency score has five levels, as depicted in Table 1.
Table 1: Urgency score and levels Feng (2013)
Urgency score Urgency level
0.11 It can be fulfilled after four years from now
0.22 It should be fulfilled between the third and fourth year from now
0.33 It should be fulfilled between the second and third year from now
0.66 It must be fulfilled next year
0.98 It must be fulfilled this year
The dependency score by contrast depends on the specific stakeholder who supplies a resource. The
more the supply of a resource depends on a specific stakeholder as the source, the higher the score.
The dependency score reflects the availability of alternative sources of a resource in exchange theory
(Cook & Emerson, 1978). According to exchange theory, the more alternatives are available for a
resource, the lower the power of the actor that provides the resource (Cook & Emerson, 1978;
Emerson, 1962). The different dependency scores and levels are listed in Table 2.
Time discounting has been a controversial topic in the utility theory literature (Frederick, Loewenstein,
& O’Donoghue, 2002). From experiments with subjects, the shape of the discounting function seems
to be more similar to a hyperbolic function than the commonly used exponential function. In order to
take this controversial nature of time-discounting into consideration, we use the standard exponential
discounting function in the following, but compare the results with those obtained by a hyperbolic
function. The results for the hyperbolic function are presented in Appendix B.
Table 2: Urgency score and levels from Feng (2013)
Dependency score Dependency level

7
0.11 Not important – I do not need this source to fulfill this need
0.22 Somewhat important – It is acceptable that this source fulfills this need.
0.33 Important – It is preferable that this source fulfills this need
0.78 Very important – It is strongly desirable that this source fulfills this need
0.98 Extremely important – It is indispensable that this source fulfills this need
The urgency and dependency scale are aggregated in accordance with multi-attribute utility theory
(Keeney & Raiffa, 1993) as shown in Figure 1.
Figure 1: Aggregation of dependency and urgency score from Feng (2013)
Based on the individual weighting for each value flow, the weightings for value loops are calculated.
Within a loop, all flows start and end at a specific stakeholders only once. For calculating the weighting
of the value loop, the weightings of all value flows in the path are multiplied. The multiplicative
aggregation has the advantage that long paths are penalized as the weighting for value flows is within
the interval [0, 1[. How can value paths be interpreted in the context of resource dependence theory?
Stakeholders can be influenced indirectly by the focal organization via other stakeholders via resources
they exchange (Frooman, 1999). According to Feng (2013, p.219) the longer the value path, the more
difficult it gets to exert influence on a stakeholder, as it requires complex coordination of all the
stakeholders in the value path. For example, exerting influence on a stakeholder based on a value path
that includes 5 other stakeholders is more difficult than if the value path only includes one stakeholder.
However, this does not exclude that some long value paths can have a high importance as
demonstrated by Cameron, Seher, et al. (2011), where an governmental agency (NASA) engages in
providing material of space exploration “Firsts” to the media, which in turn entertains / informs the
public, which motivates members of the public to pursue a career in science / engineering, which in
turn leads to a skilled workforce for the economy, leading to policy support for Congress, and Congress
providing funding for NASA.
Figure 2 shows a simple value network. A value loop of length 2 would be the ordered set (a, b). Let us
assume that the dependence value for a is 0.11 and for b, 0.32. For calculating the weighting of the
value path (a, b) we simply multiply 0.11 by 0.32 which yields 0.035. For a longer value path such as (a,
c, d) with respective weightings 0.11, 0.32, and 0.32, it is clear that longer value paths have the
tendency to yield lower overall weightings.

8
Figure 2: Simple value network graph
To assess the sensitivity of the value path weightings with respect to the aggregation scheme, we
furthermore introduce “quadratic” aggregation for calculating the weighting of a value path, which has
been derived in Feng (2013, p.143) and Cameron, Crawley, et al. (2011). The quadratic metric is based
on a utility model for generalized exchanges. The only difference between the multiplicative metric
and the quadratic metric is that the latter uses the square of the weighting of the value flow that is
entering the focal organization. All other value flows in the value path are multiplied once. For the
derivation of the metric, the reader is referred to Feng (2013, p.143) and Cameron, Crawley, et al.
(2011).
4) Enumerate all value cycles for the symbiosis
In order to enumerate all value paths up to a certain length that start and end at the same or a different
actor, Johnson’s algorithm is used (Johnson, 1975) and a more specific version for stakeholder value
networks introduced in (Feng et al., 2012; Feng, 2013). The algorithm is based on the multiplication of
the matrix of value flows with the weightings for each value flow. All value paths with length 2 are for
example enumerated by multiplying the matrix by itself (A²). To obtain all value paths with length 3,
the matrix is multiplied three times (A³). We summed up all value loops up to a length n in a matrix V
in order to calculate the power of a stakeholder in the network.
𝑉 =∑𝐴𝑖𝑛
𝑖=1
n is usually limited by the number of stakeholders in the network, as according to graph theory, the
maximum length of a simple path cannot exceed the number of nodes n in a graph. Note that from the
matrix V, all value flow strings that are not paths need to be excluded, i.e. strings in which stakeholders
appear multiple times. After treating V this way, we take the diagonal of the matrix V for evaluating
the importance of a stakeholder in the value network. The power of a stakeholder i for a stakeholder
j, can be found in the entry (i, j) of the matrix. Note that as not all value flows for all stakeholders are
modeled, the importance for (i,j) is limited to the stakeholder value network of the focal organization.
5) Identify the strength of power of symbiosis stakeholders and key resources
The higher the aggregated weighting of value loops a stakeholder takes part in, the higher its power
with respect to the focal organization. Hence, we can interpret the aggregated power of a stakeholder
as the sum of the weightings of value loops it takes part in. Once the aggregated power has been
determined for each stakeholder, the relative power of each stakeholder in the network can be

9
determined by normalizing by the sum of the weightings of the value loops the focal organization takes
part in. Besides identifying the power of stakeholders, the stakeholder value network approach also
enables the detection of key resources in the network that appear most frequently in value paths with
high weightings. Stakeholders that control these resources could use these to influence stakeholders
via the associated value loops.
In Section 3 the overall approach and details for each step will be presented for a case study.
2.1.1 Case study As a case study we selected an industrial symbiosis network in France that has been successfully
operated and continuously extended over decades. At the heart of the network is a waste incineration
plant that burns chemical wastes from regional companies. Waste heat from the incineration process
is used for generating steam. The steam is subsequently distributed via a heat network to companies
close‐by as shown in Figure 3. The waste is supplied by a far larger number of companies than the ones
that receive steam. Incinerating wastes is the main business of the plant, selling steam is rather a
supplementary source of revenue. The plant is operated by a different organization than the
organization that owns it. In the following, we call the former “plant operator” and the latter “plant
owner”. The plant operator is a private company whereas the plant owner is a public‐private company,
where ownership belongs to a mix of companies that use the incinerator for waste treatment and
public institutions.
Figure 3: Symbiosis network in an industrial zone in France
2.1.2 Data collection For the case study, we used data from publicly available sources, interviews, site visits, and a workshop
in collaboration with the focal organization. Publicly available sources consist of reports published by
governmental environmental agencies in France and reports from public hearings where
environmental aspects of the incinerator were discussed with the general public. A total of 10 semi-
structured interviews and subsequent email exchanges for additional questions were conducted with
representatives of the focal organization and other stakeholders. Questions were specifically focused

10
on the objectives of the stakeholder and how other stakeholders contribute to their fulfillment, as
shown in Appendix A. We cross-validate data from the interviews and the publicly available data and
by interviewing a consultant who has repeatedly consulted stakeholder representatives of the
symbiosis network. Furthermore, two site visits were conducted. A one-week workshop during which
concepts for extending the symbiosis was conducted in collaboration with the focal organization.
3 Results: Value network models for industrial symbioses
3.1 Qualitative value network model The qualitative stakeholder value network based on the available data is shown in Figure 4, along with
the weighting for each value flow. Only value flows that are supplied and received within the
considered set of stakeholders are considered.
Figure 4: Matrix showing value flows between stakeholders. Rows represent outputs and columns inputs to stakeholders. Direct stakeholders are within the dashed box.
The plant owner allows the plant operator to exploit the incineration plant. This means that the plant
operator is free to operate the plant and to retain most of the revenues from waste incineration and
selling steam. However, part of the revenues from steam are redistributed by the plant owner to its
shareholders in the form of dividends. However, the dividend is rather a “nice-to-have” for
shareholders, as enabling waste incineration is the primary motivation for their investment. Among
the shareholders are many local companies such as company A, B, and D. Furthermore, the plant
owner pays a fee for leasing the territory on which the pipelines for the heat network are built. The
plant operator provides part of its revenues from selling steam to the plant owner. Furthermore, the
operator provides waste treatment services to regional companies and provides steam to some local
companies. By operating the plant and the steam network, the industrial zone government is able to
improve its environmental performance as less natural gas is consumed by local companies for
producing their proper steam. The national environmental agency also benefits from the steam
network via a reduction of greenhouse gas emissions. The main benefit for the industry association is
the waste treatment service to which the association has subscribed. The companies A to E are mostly

11
paying money for the waste treatment service and for the energy supplied by the steam. Some
companies are supplied with steam but have not subscribed to waste treatment. Hence, they only pay
for the energy supplied via the steam. The industrial zone government is leasing part of the territory it
governs to the plant owner. Furthermore, an improved environmental performance of the industrial
zone government also benefits the national environmental agency for which environmental
performance of local governments is a key performance indicator. The national environmental agency
has partly financed the pipelines of the heat network and has therefore contributed to enabling the
symbiosis. In general, the agency provides funding for projects that contribute to improving
environmental performance and regional development. Finally, the industry association provides
capital for the plant owner by being a shareholder of the plant owner. Furthermore, the industry
association has a subscription contract in place with the plant operator that secures plant operations,
hence providing value for the plant operator.
3.2 Quantitative value network model For each of the value flows, a dependency and urgency score were assigned and a weighting calculated.
Using Johnson’s algorithm (Johnson, 1975) and its adaptation to value networks in Feng et al. (2012),
we calculate the relative power of stakeholders in the stakeholder value network. We use two
aggregation approaches in order to test how sensitive the results are, depending on the aggregation
approach. Figure 5 shows the results for the multiplicative approach where the score of a value path is
calculated by multiplying the individual utility values of its constituting value flows. The results are
shown for value paths with a maximum length of 2, 3, 4, 6, 7. In other words, 7 means that all value
paths up to a length of 7 are taken into consideration. If only value paths with a length of 2 are taken
into consideration, the most important stakeholder is the plant A, mainly due to its direct and constant
use of steam for its processes. However, if longer value paths are taken into consideration, the plant
owner quickly gains in importance, whereas the plants A to E lose in importance.
Figure 5: Relative stakeholder importance based on a multiplicative aggregation approach
For evaluating the robustness of these results, we use an alternative aggregation approach that is
based on microeconomics theory and uses a quadratic aggregating of the value flows as mentioned in
Section 3.1 (Cameron, Crawley, et al., 2011; Feng, 2013). The results are shown in Figure 6. It can be
seen that the power of the plant owner is drastically higher than for the multiplicative approach.

12
Figure 6: Relative stakeholder importance based on a quadratic aggregation approach
The plant owner has the highest relative power among these stakeholders, followed by the industrial
zone government. The power of the industrial zone government rapidly increases with longer value
paths that are taken into account, which means that it has rather few opportunities to exert influence
directly on the plant operator but has numerous opportunities for doing so using intermediaries.
Similarly, the focal organization can use intermediaries to exert influence on the industrial zone
government. More specifically, the largest increase in power can be observed for value paths of length
3, compared to paths of length 2, which indicates that only one ally is needed for exerting influence on
the plant operator or the other way round. Furthermore, the industry association has a relatively high
power compared to the industrial companies A, B, C, D, E. Another observation is that the local
population which is not directly in contact with the incineration plant, except for public hearings, has
a similar or higher importance than company C and E for longer value path lengths. One consequence
for the focal organization could be to engage the local population actively beyond the public hearings,
e.g. when the plant capacity is increased.
In the next step we look into the contribution of specific value flows to power within the value network.
Figure 7 and Figure 8 show the top 10 value flows / resources with the highest contribution to power,
using the simple multiplicative approach and the quadratic aggregation approach from Cameron,
Crawley, et al. (2011). Most relative ranks of the value flows are consistent for both approaches, except
for a few exceptions. The value flow that is ranked first by a wide margin is the exploitation contract
between the plant owner and the incineration plant. This contract seems to be the number one key
resource of the symbiosis on which its existence depends. This makes intuitive sense, as if the plant
owner terminates the contract with the plant operator, the plant operator can no longer operate the
plant. Hence, it seems that this contract is at the core of the industrial symbiosis.
The second most important value flow is water provided by the industrial zone government for
generating steam. Again, the result makes intuitive sense, as without water, no steam can be produced.
Among the top 10 value flows, there are few material / energy flows such as the steam the incinerator
provides for plant A. The other value flows are predominantly resources that are preconditions for
developing and operating the symbiosis.

13
Figure 7 : Top 10 most important value flows in the value network using multiplicative aggregation
Figure 8 : Top 10 most important value flows in the value network using quadratic aggregation
Figure 9 shows the top 4 most highly ranked value loops in the network. Although the direct output
from the focal organization is different in all for cases, the input to the focal organization is always the
exploitation contract. This result is consistent with the results in Figure 7 and Figure 8. Consequently,
the plant owner as the provider of the exploitation contract is also present in all highly ranked loops.
Figure 9: Top 4 value loops
0 0,02 0,04 0,06 0,08 0,1 0,12 0,14
Exploitation contract (plant owner, plant operator)
Water (industrial zone gov., plant operator)
Capital (Industry association, plant owner)
Lease territory for pipelines (industrial zone gov., plant owner)
Steam (plant operator, company A)
Votes(local population, industrial zone gov.)
Money for leasing territory (company E, industrial zone gov.)
Capital (company A, Industry association)
Heat (plant operator, company E)
Waste treatment (plant operator, company E)
Relative value flow importance
0 0,02 0,04 0,06 0,08 0,1 0,12 0,14 0,16 0,18
Exploitation contract (plant owner, plant operator)
Water (industrial zone gov., plant operator)
Capital (Industry association, plant owner)
Lease territory for pipelines (industrial zone gov., plant owner)
Votes (local population, industrial zone gov.)
Steam (plant operator, company A)
Money for leasing territory (company E, industrial zone gov.)
Capital (company A, Industry association)
Heat (plant operator, company E)
Waste treatment (plant operator, company E)
Relative value flow importance

14
Although the results make intuitive sense, it is unclear if the same results could have been obtained without this method. The main challenge is to identify the important resources by evaluating all direct and indirect dependencies in which the resources takes part in. We argue similarly for estimating the relative power of symbiosis stakeholders. While for some stakeholders it is intuitively clear that they have a large influence on the symbiosis, such as the plant owner, it is less clear for other stakeholders, such as the local population. As for the key resources, the main difficulty lies in evaluating the indirect relationships between stakeholders and the focal organization without the used approach.
4 Discussion The specific research questions we wanted to answer were to identify the relative power of
stakeholders and key resources in the symbiosis case study at hand. The results shows that the plant
owner and the industrial zone government are the most important stakeholders for the incineration
plant operator. The most important value flow is the exploitation contract.
The most powerful stakeholders in this case study are the ones that finance the symbiosis (plant
owner) and provide other important resources such as leasing the territory for the symbiosis
infrastructure (industrial zone government). Furthermore, the exploitation contract is a long-term
contract that seems to stabilize the symbiosis. As long as the exploitation contract is active, the plant
is also operated.
There are several limitations to using the stakeholder value network approach for analyzing the
distribution of power within a stakeholder network. First, we have limited our definition of power to
the dependency of stakeholders and the focal organization on tangible or intangible resources. We
added urgency as a second dimension in order to express the time-sensitive nature of resource
dependencies. Other forms of power such as based on Etzioni's (1964) taxonomy of coercive,
utilitarian, and normative power are not taken into consideration. For example, coercive power, i.e.
the use of physical force is not treated in exchange and resource dependency theory and is therefore
not represented in a stakeholder value network.
Another limitation is that we generated value loops from combining value flows. Due to the large
number of value loops, we have not verified if value loops exist that are unlikely to be used for exerting
influence on the focal organization or a stakeholder. Hence, the set of value loops represents potential
opportunities of influencing the focal organization or stakeholders but we have not validated if
representatives of the focal organization or stakeholders would actually exert influence by using these
loops.
A more basic limitation of stakeholder theory and analysis is the difficulty to define whom to consider
a stakeholder or not and how to aggregate stakeholders into more abstract groups in order to limit the
complexity of the model. In the absence of a consensus, we have used approaches from the literature
that provide a guideline for stakeholder identification, as presented in Section 3.1.
Finally, we use the case study for demonstrating that the method can provide insights into the power
distribution of a particular industrial symbiosis but the method has not yet been applied to an actual
case of decision-making in a symbiosis context.
5 Conclusions This paper uses the stakeholder value network approach for eliciting the power of stakeholders in
industrial symbioses. The approach is applied to a waste incinerator steam network symbiosis in
France. We have demonstrated how the stakeholder value network approach can be adapted to the
industrial symbiosis context and have obtained results such as the resource-dependent power of

15
symbiosis stakeholders and key resources in the value network. To the authors’ knowledge only the
proposed approach is currently able to systematically obtain these results.
An area for future research is to add a temporal dimension to the value network for different phases
of symbiosis formation. Such an extension could provide insights into the changing power of
stakeholders during symbiosis formation. Furthermore, we propose the application of the approach to
further case studies in order to identify patterns in the power distribution within symbiosis networks.
6 References
Alchian, A. A. (1953). The meaning of utility measurement. The American Economic Review, 43(1), 26–50.
Arcade, J., Godet, M., Meunier, F., & Roubelat, F. (1999). Structural analysis with the MICMAC method & Actor’s strategy with MACTOR method. In Futures Research Methodology, American Council for the United Nations University: The Millennium Project (pp. 1–69).
Ashton, W., & Bain, A. (2012). Assessing the “Short Mental Distance” in Eco‐Industrial Networks. Journal of Industrial Ecology, 16(1), 70–82.
Baas, L. (2005). Cleaner production and industrial ecology: Dynamic aspects of the introduction and dissemination of new concepts in industrial practice. Eburon Academic Publishers.
Baas, L., & Boons, F. (2004). An industrial ecology project in practice: exploring the boundaries of decision-making levels in regional industrial systems. Journal of Cleaner Production, 12(8), 1073–1085.
Bearman, P. (1997). Generalized exchange. American Journal of Sociology, 102(5), 1383–1415.
Bendahan, S., & Camponovo, G. (2004). Multi-issue actor analysis: tools and models for assessing technology environments. Journal of Decision.
Blau, P. (1964). Exchange and power in social life. John Wiley & Sons, Inc.
Boons, F., Spekkink, W., Jiao, W. (2014). A Process Perspective on Industrial Symbiosis. Journal of Industrial Ecology, 18(3), 341–355.
Boons, F., & Baas, L. (1997). Types of industrial ecology: the problem of coordination. Journal of Cleaner Production, 5(1-2), 79–86.
Boons, F., & Spekkink, W. (2012). Levels of institutional capacity and actor expectations about industrial symbiosis. Journal of Industrial Ecology, 16(1), 61–69.
Boons, F., Spekkink, W., & Jiao, W. (2014). A Process Perspective on Industrial Symbiosis. Journal of Industrial Ecology, 18(3), 341–355.
Boons, F., Spekkink, W., & Mouzakitis, Y. (2011). The dynamics of industrial symbiosis: a proposal for a conceptual framework based upon a comprehensive literature review. Journal of Cleaner Production, 19(9), 905–911.
Brugha, R., & Varvasovszky, Z. (2000). Stakeholder analysis: a review. Health Policy and Planning, 15(3), 239–246.
Brullot, S., Maillefert, M., & Joubert, J. (2014). Stratégies d’acteurs et gouvernance des démarches d'écologie industrielle et territoriale. Développement Durable et Territoires. Économie, Géographie, Politique, Droit, Sociologie, 5(1).

16
Cameron, B., Crawley, E., Feng, W., & Lin, M. (2011). Strategic decisions in complex stakeholder environments: a theory of generalized exchange. Engineering Management Journal, 23(3), 37–45.
Cameron, B., Crawley, E., Loureiro, G., & Rebentisch, E. (2008). Value flow mapping: Using networks to inform stakeholder analysis. Acta Astronautica, 62, 324–333.
Cameron, B., Seher, T., & Crawley, E. (2011). Goals for space exploration based on stakeholder value network considerations. Acta Astronautica, 68, 2088–2097.
Chertow, M. R. (2000). Industrial Symbiosis : Literature and Taxonomy. Annual Review of Energy and the Environment, 25(1), 313–337.
Chertow, M. R. (2007). “Uncovering” Industrial Symbiosis. Journal of Industrial Ecology, 11(1), 11–30.
Cook, K., & Emerson, R. (1978). Power, equity and commitment in exchange networks. American Sociological Review, 43(5), 721–739.
Cook, K., & Whitmeyer, J. (1992). Two approaches to social structure: Exchange theory and network analysis. Annual Review of Sociology. Retrieved from http://www.jstor.org/stable/2083448
Cook, K., & Yamagishi, T. (1992). Power in exchange networks: A power-dependence formulation. Social Networks, 14(3-4), 245–265.
Deutz, P. (2014). Food for Thought: Seeking the Essence of Industrial Symbiosis. In R. Salomone & G. Saija (Eds.), Pathways to Environmental Sustainability (pp. 3–11). Springer.
Domenech, T., & Davies, M. (2011). Structure and morphology of industrial symbiosis networks: The case of Kalundborg. Procedia-Social and Behavioral Sciences, 10, 79–89.
Donaldson, T., & Preston, L. (1995). The stakeholder theory of the corporation: Concepts, evidence, and implications. Academy of Management Review, 20(1), 65–91.
Ekeh, P. (1974). Social exchange theory: The two traditions. (Harvard University Press, Ed.) (1st ed.).
Emerson. (1962). Power-dependence relations. American Sociological Review, 27(1), 31–41.
Emerson, R. (1972a). Exchange theory, part I: A psychological basis for social exchange. Sociological Theories in Progress, 2, 38–57.
Emerson, R. (1972b). Exchange theory, part II: Exchange relations and networks. Sociological Theories in Progress, 2, 58–87.
Emerson, R. M. (1976). Social exchange theory. Annual Review of Sociology, 2(1), 335–362.
Etzioni, A. (1964). Modern organizations.
Feng, W. (2013). Strategic Management for Large Engineering Projects: The Stakeholder Value Network Approach.
Feng, W., Crawley, E. F., Weck, O. De, Keller, R., & Link, C. (2012). Dependency structure matrix modelling for stakeholder value networks.
Frederick, Loewenstein, & O’Donoghue. (2002). Time discounting and time preference: A critical review. Journal of Economic, 40(2), 351–401.
Freeman, & McVea, J. (2001). A Stakeholder Approach to Strategic Management. (M. A. Hitt, R. E. Freeman, & J. S. Harrison, Eds.)SSRN Electronic Journal (Vol. 1). Pitman.
Freeman, R. (1984). Strategic management: A stakeholder perspective. Boston: Pitman.
Frooman, J. (1999). Stakeholder influence strategies. Academy of Management Review, 24(2), 191–205.
Fu, F., Feng, W., Li, Z., Crawley, E., & Ni, W. (2011). A network-based modeling framework for stakeholder analysis of China’s energy conservation campaign. Energy, 36, 4996–5003.

17
Godet, M. (1991). Actors’ moves and strategies: The mactor method: An air transport case study. Futures, 23(6), 605–622.
Godet, M. (2001). Manuel de prospective stratégique. 1: une indiscipline intellectuelle.
Heeres, R. R., Vermeulen, W. J. V, & De Walle, F. B. (2004). Eco-industrial park initiatives in the USA and the Netherlands: First lessons. Journal of Cleaner Production, 12(8-10), 985–995.
Hein, Jankovic, M., Farel, R., & Yannou, B. (2015). A Conceptual Framework for Eco-Industrial Parks. In Proceedings of the ASME 2015 International Design Engineering Technical Conferences & Computers and Information in Engineering Conference IDETC/CIE 2015 (pp. 987–988).
Hein, A. M., Tziolas, A. C., & Osborne, R. (2011). Project Icarus: Stakeholder Scenarios for an Interstellar Exploration Program. Journal of the British Interplanetary Society, 64(6/7), 224–233.
Hellweg, S., & Canals, L. i. (2014). Emerging approaches, challenges and opportunities in life cycle assessment. Science, 344(6188), 1109–1113.
Hewes, A., & Lyons, D. (2008). The humanistic side of eco-industrial parks: champions and the role of trust. Regional Studies, 42(10), 1329–1342.
Johnson, D. (1975). Finding all the elementary circuits of a directed graph. SIAM Journal on Computing, 4(1), 77–84.
Keeney, R., & Raiffa, H. (1993). Decisions with multiple objectives: preferences and value trade-offs. Cambridge University Press.
Lévi-Strauss, C. (1963). Structural anthropology. Basic Books.
Lévi-Strauss, C. (1969). The Elementary Structures of Kinship. Beacon Press.
Luo, J., Baldwin, C. Y., E., W. D., & Magee, C. L. (2012). The Architecture of Transaction Networks : A Comparative Analysis of Hierarchy in Two Sectors. Industrial and Corporate Change, 21(6), 1307–1335.
Mirata, M. (2004). Experiences from early stages of a national industrial symbiosis programme in the UK: determinants and coordination challenges. Journal of Cleaner Production, 12(8), 967–983.
Mirata, M., & Emtairah, T. (2005). Industrial symbiosis networks and the contribution to environmental innovation: the case of the Landskrona industrial symbiosis programme. Journal of Cleaner Production.
Mitchell, R., Agle, B., & Wood, D. (1997). Toward a theory of stakeholder identification and salience: Defining the principle of who and what really counts. Academy of Management Review, 22(4), 853–886.
Paquin, R., Howard-Grenville, J. (2009). Facilitating regional industrial symbiosis: Network growth in the UK’s National Industrial Symbiosis Programme. In J. A. H.-G. Frank Boons (Ed.), The Social Embeddedness of Industrial Ecology (pp. 103–127). Edward Elgar Publishing Limited.
Paquin, R., & Howard‐Grenville, J. (2012). The evolution of facilitated industrial symbiosis. Journal of Industrial Ecology, 16(1), 83–93.
Reed, M., Graves, A., Dandy, N., & Posthumus, H. (2009). Who’s in and why? A typology of stakeholder analysis methods for natural resource management. Journal of Environmental, 90, 1933–1949.
Rowley, T. (1997). Moving beyond dyadic ties: A network theory of stakeholder influences. Academy of Management Review, 22(4), 887–910.
Spekkink, W. (2013). Institutional capacity building for industrial symbiosis in the Canal Zone of Zeeland in the Netherlands: A process analysis. Journal of Cleaner Production, 52, 342–355.
Spekkink, W. (2015). Building capacity for sustainable regional industrial systems: an event sequence

18
analysis of developments in the Sloe Area and Canal Zone. Journal of Cleaner Production, 98(1), 133–144.
Spekkink, W., & Boons, F. (2015). The Emergence of Collaborations. Journal of Public Administration Research and Theory, 1–15.
Takahashi, N. (2000). The emergence of generalized exchange. American Journal of Sociology, 105(4), 1105–1134.
Thibaut, J. W., & Kelley, H. H. (1959). The social psychology of groups. In The social psychology of groups (p. 313). Wiley.
Yamagishi, T., & Cook, K. (1993). Generalized exchange and social dilemmas. Social Psychology Quarterly, 56(4), 235–248.
Appendix A: Interview questions
For the semi‐structured interviews, the following questions were usually asked, along with follow‐up
questions:
What are the main objectives and needs of your organization?
How do other organizations contribute to these objectives and needs?
Which resources do these organizations provide that are important for you to address your
objectives and needs?
Do you have alternatives to the resource a specific organization provides to you?
How difficult would it to change to an alternative source of a resource?
If a specific resource is not provided, how quick would that affect your organization?
Appendix B: Sensitivity analysis with alternative urgency metric
The hyperbolic urgency score values are depicted in Table 3. The difference between the score values
of the hyperbolic and exponential urgency metric is the large time‐discount on the score for the
hyperbolic metric, compared to the exponential metric.
Table 3: Urgency score and levels from Feng (2013) with hyperbolic utility function
Urgency score Urgency level
0.11 It can be fulfilled after four years from now
0.14 It should be fulfilled between the third and fourth year from now
0.2 It should be fulfilled between the second and third year from now
0.33 It must be fulfilled next year
0.98 It must be fulfilled this year
The aggregated score values for source dependency and the hyperbolic need urgency function are
shown in Figure 10. Many entries in the matrix are lower than in Figure 1.

19
Figure 10: Aggregation of dependency and hyperbolic urgency score
Using this alternative metric, we obtained results for relative stakeholder power, shown in Figure 11 for
different length of value loops starting and ending at the incineration plant operator. Compared to
Figure 6, the differences between certain stakeholders are larger, such as between the plant owner and
the industrial zone government, and company A and the industry association. The reason for this
phenomenon is the larger discount on time for the hyperbolic metric, which penalizes value flows that
are not needed within one year. However, there is no change in rank order of the stakeholders.
Figure 11: Relative stakeholder power using hyperbolic urgency metric and quadratic aggregation
Figure 12 shows the relative importance of the resources in the value network. Comparing the results
with the ones in the main article in Figure 7 and Figure 8 shows that there is no change in the set of value
flows. There is one rank reversal for water (rank 2) and capital (rank 3), compared to Figure 7 and Figure
8, where these ranks are reversed. The exploitation contract is still the most important value flow /
resource in the network.
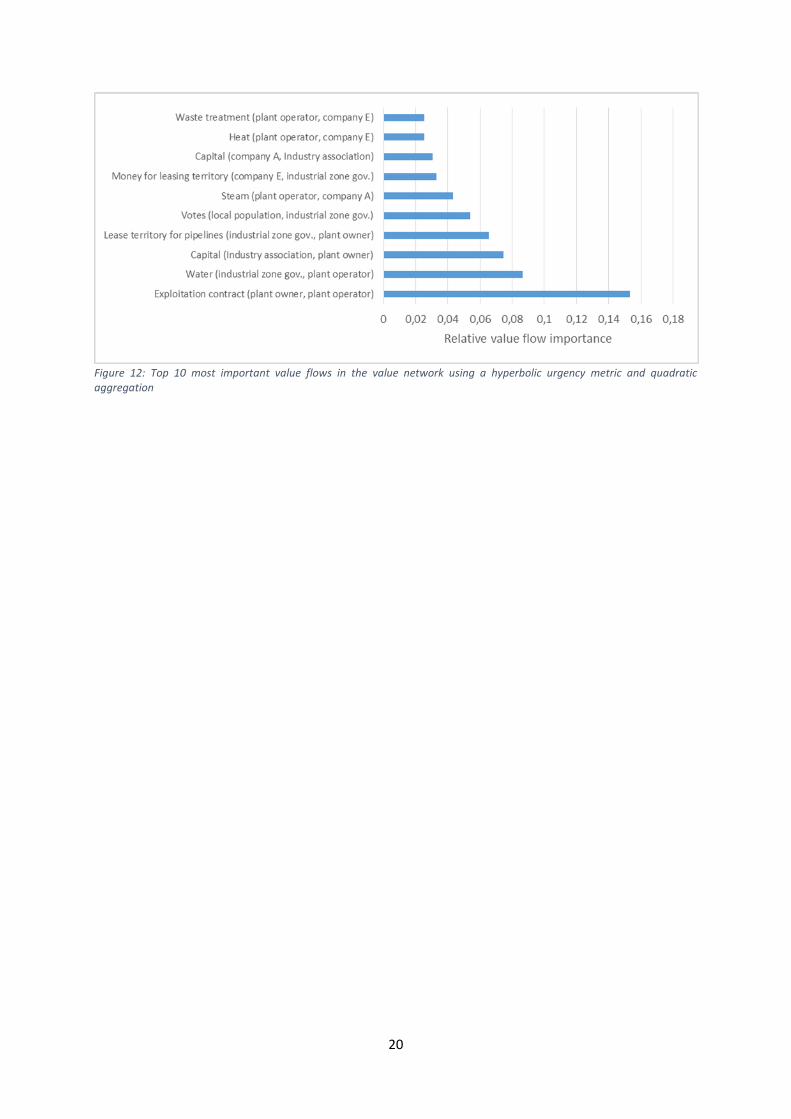
20
Figure 12: Top 10 most important value flows in the value network using a hyperbolic urgency metric and quadratic aggregation