stamina 2.0/0ptima for a typical barrier
TRANSCRIPT

24 Transportation Research Record 937
Statistical Comparison of STAMINA 1.0 and
STAMINA 2.0/0PTIMA for a Typical Barrier LOUIS F. COHN, CHARLES F. RIDDLE, AND WILLIAM BOWLBY
The FHWA has produced several computer versions of its highway noise-prediction model, including STAMINA 1.0 and STAMINA 2.0/0PTIMA. These two versions are nearly identical mathematically, but STAMINA 2.0/0PTIMA has several new features designed to enhance accuracy and, more importantly, to lead to better barrier designs. The results of a simultaneous application of STAMINA 1.0 and STAMINA 2.0/0PTIMA for the same barrier, which is located on 1-65 immediately north of the proposed 1-65/1-440 interchange in Nashville, are reported. Basic statistics are use!! to evaluate differences between program output. Also, the nonoptimized final barrier design for STAMINA 1.0 is compared with the optimized STAMINA 2.0/0PTIMA barrier design in terms of cost. Although all the results of an in-depth research endeavor are not reported in this paper, two significant conclusions are demonstrated for this application . First, STAMINA 1.0 and STAMINA 2.0 produced basically equivalent results, which is to be expected. Second, the optimization process produced a significant reduction in expected barrier costs based on cost data contained in OPTIMA.
During the past 2 years researchers have been involved in designing a comprehensive noise barrier system ·for the 8-mile I-440 project in suburban Nashville. For the first section of the project (approximately 3 miles), the STAMINA 1. 0 (!) computer program was used to predict noise levels and to design barriers. The remaining sections have been studied by using the STAMINA 2.0/0PTIMA (2) package. One unique part of the project was analyzed with both versions of STAMINA. The purpose of this paper is to discuss the similarities and differences observed by this dual analysis.
Currently, the literature on highway noise does not contain a comparative study of STAMINA 1. O and STAMINA 2.0, although a report by Anderson et al. (Jl does examine comparative data from preceding models. Thus one objective of this paper is to include a documented study of one location where both programs were used to confirm several assurnpt ions. The first assumption is that the basic prediction aspects of the models give the same results. This is significant because many highway projects in the United States have been studied by using both programs for one reason or another. Although it is
Figure 1. Location of study area in Nashville.
l -40
expected that the STAMINA 1.0 and 2.0 programs should give the same results, there are enough differences between the two programs that a comparison is ;,ppropri;,te. The ser.onn assnmpt.ion to hP r.onfirmed is whether the balanced approach to barrier design (OPTIMA) will produce significant savings when compared with the traditional STAMINA 1. O approach. The savings are determined by using the cost data contained in OPTIMA, which are based on actual barrier costs per linear foot in various height zones.
It is not the intent of this paper to report the results of a long-term, intensive research study aimed at model validation or the determination of barrier cost. Rather it is meant to illustrate, for at least one application, that the two programs are equivalent and that OPTIMA can be a money-saving tool. It is also not the intent of this paper to draw any conclusions concerning the effectiveness or cost parameters used in OPTIMA.
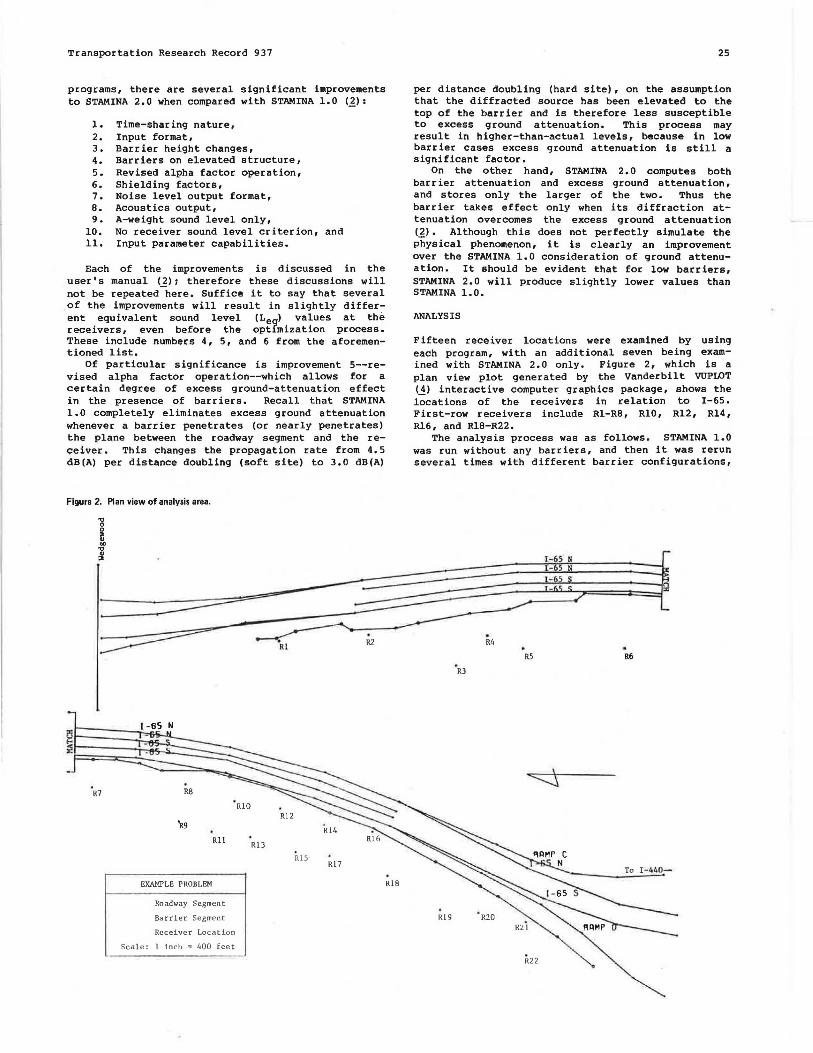
The section analyzed with both methods was locat.ed on I-65 immediately north of the I-65/I-440 interchange. The limits of the sections were Wedgewood Avenue (1 mile nor t h of I-440) and the northern portion of the interchange (see Figure 1). Thus the study area was approximately 1 mile long. Barriers were considered on the west side of I-65 only, or adjacent to the southbound lanes. Fifty singlefamily homes were classified as first- or second-row receivers, along with one school and a five-unit apartment building. The existing portion of I-65 is slightly depressed for the major portion of the project area, and slightly elevated for the rest. Construction plans call for the addition of one travel lane in each direction, as well as ramps at the I-440 interchange.
DIFFERENCES BETWEEN STAMINA 1.0 AND STAMINA 2.0
Although the basic emission, propagation, and diffraction algorithms remain unchanged between the two
I-24 & 1-440
Transportation Research Record 937
programs, there are several significant improvements to STAMINA 2.0 when compared with STAMINA 1.0 (3_):
1. Time-sharing nature, 2. Input format, 3. Barrier height changes, 4. Barriers on elevated structure, 5. Revised alpha factor operation, 6. Shielding factors, 7. Noise level output format, B. Acoustics output, 9. A-weight sound level only,
10. No receiver sound level criterion, and 11. Input parameter capabilities.
Each of the improvements is discussed in the user's manual (]) i therefore these discussions will not be repeated here. Suffice it to say that several of the improvements will result in slightly different equivalent sound level (Le) values at the receivers, even before the optlmization process. These include numbers 4, 5, and 6 from the aforementioned list.
Of particular significance is improvement 5--revised alpha factor operation--which allows for a certain degree of excess ground-attenuation effect in the presence of barriers. Recall that STAMINA 1.0 completely eliminates excess ground attenuation whenever a barrier penetrates (or nearly penetrates) the plane between the roadway segment and the receiver. This changes the propagation rate from 4. 5 dB(A) per distance doubling (soft site) to 3.0 dB(A)
Figure 2. Plan view of analysis area.
R7 RB
RII
EXAMPLE PROBLEM
Roadway Segment
Barrier Segment
Receiver Location
Scale: I inch• 400 feet
Rl R2
Rl2
RlJ
Rl5· Rl7
RIB
25
per distance doubling (hard site), on the assumption that the diffracted source has been elevated to the top of the barrier and is therefore less susceptible to excess ground attenuation. This process may result in higher-than-actual levels, because in low barrier cases excess ground attenuation is still a significant factor.
On the other hand, STAMINA 2. O computes both barrier attenuation and excess ground attenuation, and stores only the larger of the two. Thus the barrier takes effect only when its diffraction attenuation overcomes the excess ground attenuation (1_). Although this does not perfectly simulate the physical phenomenon, it is clearly an improvement over the STAMINA 1.0 consideration of ground attenuation. It should be evident that for low barriers, STAMINA 2.0 will produce slightly lower values than STAMINA 1.0.
ANALYSIS
Fifteen receiver locations were examined by using each program, with an additional seven being examined with STAMINA 2.0 only. Figure 2, which is a plan view plot generated by the Vanderbilt VUPLOT (4) interactive computer graphics package, shows the !~cations of the receivers in relation to I-65. First-row receivers include Rl-RB, RIO, R12, Rl4, Rl6, and Rl8-R22.
The analysis process was as follows. STAMINA 1.0 was run without any barriers, and then it was rerun several times with different barrier configurations,
R4
R5 R6
To I-440-
RI 9
R22
26
until the final STAMINA LO barrier was developed. This barrier represented the most efficient design obtainable from STAMINA 1.0 to meet the 67-dB(Al goal. This final STAMINA 1.0 barrier was then entered into STAMINA 2. O to obtain a cost value from OPTIMA and to compare what should be equivalent scenarios. Thus the initial STAMINA 2.0 barrier should provide the same results as the final STAMINA l. 0 barrier. OPTIMA was then used to the fullest extent possible to produce the most efficient barrier meeting the 67-dB(A) goal.
In sununary, the following values were generated and compared:
STAMINA 1.0 No barrier Final barrier Final barrier
RESULTS
STAMINA 2 .0/0PTIMA No barrier Initial barrier Optimized barrier
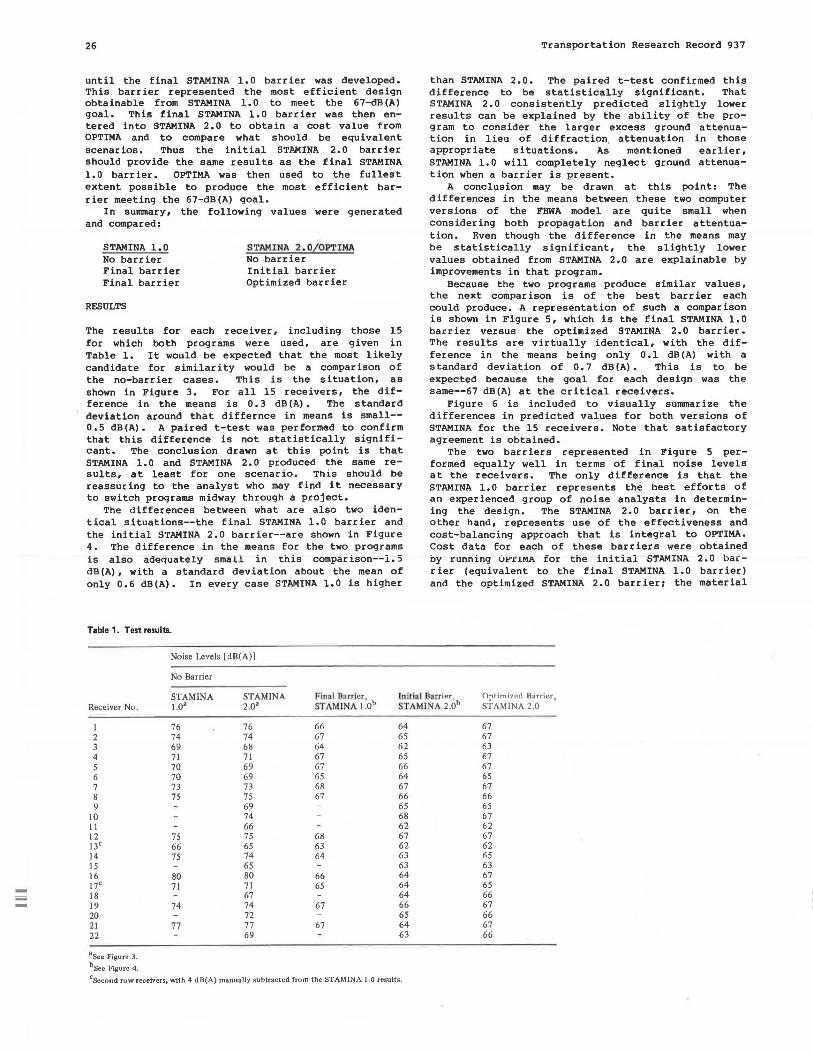
The results for each receiver, including those 15 for which both programs were used, are given in Table l. It would be expected that the most likely candidate for similarity would be a comparison of the no-barrier cases. This is the situation, as shown in Figure 3. For all 15 receivers, the difference in the means is 0.3 dB(A). The standard deviation around that differnce in means is small--0.5 dB(A). A paired t-test was performed to confirm that this difference is not statistically significant. The conclusion drawn at this point is that STAMINA l. 0 and STAMINA 2. O produced the same results, at least for one scenar i o. This should be reassuring to the analyst who may find it necessary to switch programs midway through a project.
The differences between what are also two identical situations--the final STAMINA 1.0 barrier and the initial STAMINA 2.0 barrier--are shown in Figure 4. The difference in the means for the two programs is also adequately small in tnis comparison--1.5 dB (A), with a standard deviation about the mean of only 0.6 dB(A). In every case STAMINA 1.0 is higher
Table 1. Test results.
Noise Levels [dB(A)]
No Barrier
Transportation Research Record 937
than STAMINA 2.0. The paired t-test confirmed this difference to be statistically significant. That STAMINA 2. 0 consistently predicted slightly lower results can be explained by the ability of the program to consider the larger excess ground attenuation in lieu of diffraction. attenuation in those appropriate situations. As mentioned earlier, STAMINA l. O will completely neglect ground attenuation when a barrier is present.
A conclusion may be drawn at this point: The differences in the means between these two computer versions of the FHWA model are quite small when considering both propagation and barrier attentuation. Even though the difference in the means may be statistically significant, the slightly lower values obtained from STAMINA 2.0 are explainable by improvements in that program.
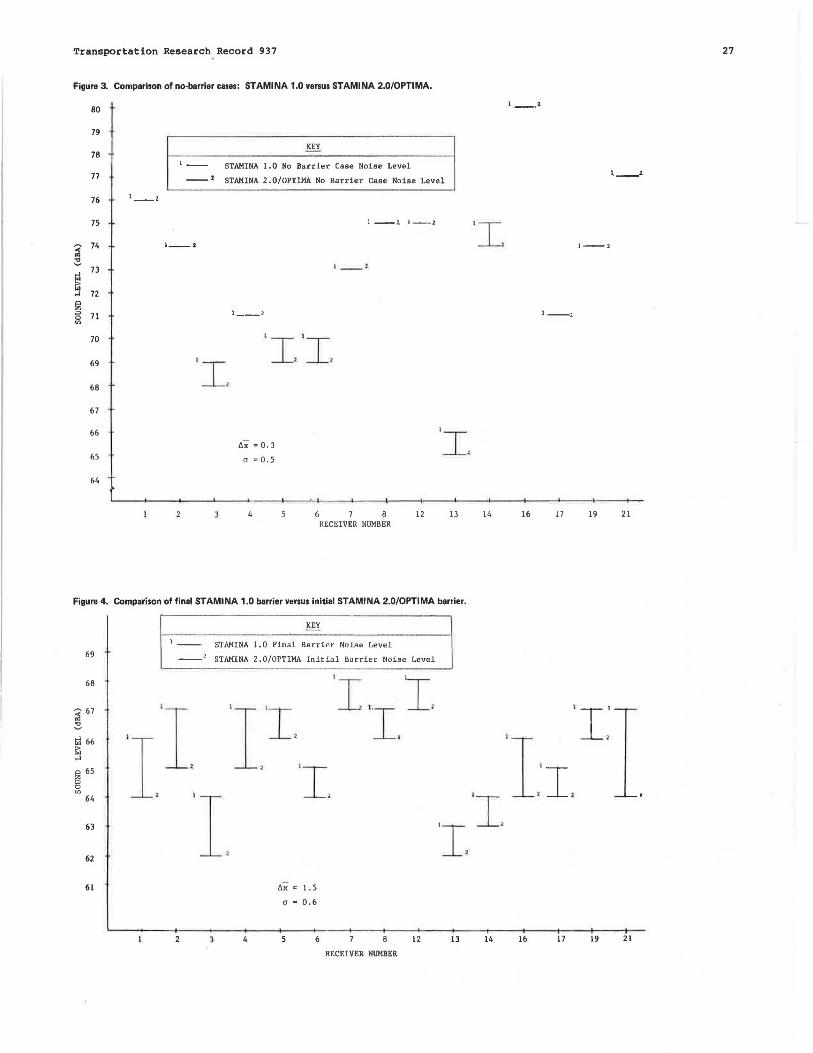
Because the two programs produce similar values, the next comparison is of the best barrier each could produce. A representation of such a comparison is shown in Figure 5, which is the final STAMINA 1,0 barrier versus the optimized STAMINA 2.0 barrier. The results are virtually identical, with the difference in the means being only O. l dB (A) with a standard deviation of 0.7 dB(A). This is to be expected because the goal for each design was the same--67 dB(A) at the critical receivers.
Figure 6 is include d to visually summarize the differences in predicted values for both versions of STAMINA for the 15 receivers. Note that satisfactory agreement is obtained.
The two barriers represented in Figure 5 performed equally well in terms of final noise levels at the receivers. The only difference is that the STAMINA l. O barrier represents the best efforts of an experienced group of noise analysts in determining the design. The STAMINA 2.0 barrier, on the other hand, represents use of the effectiveness and cost-balancing approach that is integral to OPTIMA. Cost data for each of these barriers were obtained by running OP'fiMA for the initial 5TAMINi\ :2.() bar rier {equivalent to the final STAMINA l. 0 barrier) and the optimized STAMINA 2.0 barrier; the material
STAMINA STAMINA Final Barri er, STAMINA I.Ob
lni tiol Borrie.r , STAMINA 2.0b
Optimized Barrier, Receiver No. 1.0• 2.03 STAMINA 2.0
I 76 76 66 64 67 2 74 74 67 65 67 3 6~ 68 64 62 63 4 71 71 67 65 67 5 70 69 67 66 67 6 70 69 65 64 65 7 73 73 68 67 67 8 75 75 67 66 66 9 69 65 65
10 74 68 67 11 66 62 62 12 75 75 68 67 67 13c 66 65 63 62 62 14 75 74 64 63 65 15 65 63 63 16 80 80 66 64 67 17c 71 71 65 64 65 18 67 64 66 19 74 74 67 66 67 20 72 65 66 21 77 77 67 64 67 22 69 63 66
aSee Figure 3.
bSee Figure 4.
cSccond row receivers, with 4 dB(A) manually subtracted from the STAMINA 1.0 results.
Transportation Research Record 937
Figure 3. Comparison of no-barrier cases: STAMINA 1.0 versus STAMINA 2.0/0PTIMA.
80
79
KEY 78 1 __
STAMINA 1.0 No Barrier Case Noise Level 77 --· STAMINA 2.0/0PTIMA No Barrier Case Noise Level
76 l -·
75 1--· ·--· ~
74 l--2
3 l __ t
~ 73
.., 72
~ ~ 71
1 __ 2 0 "'
70 'I. 'I . 69 'I. 68
67
66 'I. t:.x • 0.3 65 a O 0.5
64
2 3 4 5 6 8 12 13 RECEIVER NUMBER
Figure 4. Comparison of final STAMINA 1.0 barrier versus initial STAMINA 2.0/0PTIMA barrier.
69
68
~ 67
3 i;l 66 i:i .., ~ 65 0
"' 64
63
62
61
~
ST AMINA 1. 0 Final Barrier Noise Level
--2 STAMINA 2.0/0PTIMA Initial Barrier Noise Level
I
IT.I ·r , 1I. I. ·r . . I 6'"x
a =
2 3
1.5
0.6
6 8
RECEIVER NUMBER
12 13
27
I --··
~--·
'I , __ ,
'--,
14 16 17 19 21
14 16 17 19 21
-iiiii
28 Transportation Research Record 937
Figure 5. Comparison of final barrier cases: STAMINA 1.0 versus STAMINA 2.0/0PTIMA.
70 l 69
~ ... 68 3 ..,
~ 67 ,I" .., ..,
! 66 <I)
65
64
63
62 t 61
60
KEY
1-- STAMINA 1 . 0 Fin;1l f'~ r r!.e r No i se L~vel
--2 STAMINA 2 . 0/0PTIMA Optimi zed Barrier Noise Level
J
__ 2 , __ ,
, __ ,
t,;. = 0.1
a a 0.7
5
RECEIVER NUMBER
12 13
.Iz
14 16
Figure 6. Differences in noise levels for three cases of STAMINA 1.0 and STAMINA 2.0/0PTIMA.
2
6 dBA 0
-1
-2
a
0
0 0 0 0
•
No Barrier STAMINA 1.0 - No Barrier STAMINA 2 . 0/0PTIMA
Final STAMINA 1. 0 - Initial STAMINA 2 . 0/0PTIMA
Final STAMINA 1 .0 - Optimized STAMINA 2.0/0PTIMA
0
@ @ @
---o--··•---- ---···--·---···-····• ··- -·• · - a- -o --- a · G
• .
1----2 '--2
·--'
17 19 21
0
0 0
• -·• ·- --·-
~ --+---+---+---+---+-__ ,.__ _ __,___ _ _ ,_ __________ _ ._ __ +---+---+--
2 4 6 8 12 13 14 16 17 19 21
Receiver Number
used for the barrier was concrete. The results of this exercise are as follows:
Item Cost ($)
Best STAMINA 1.0 barrier 389,132 Optimized STAMINA 2.0 barrier 247,379 Savings 141,753
(Note that the STAMINA 2.0 barrier produced a sav-ings of 36 percent.)
The costs for both barriers were obtained by using the data contained in OPTIMA (1981 version)
for concrete barriers. Taken from the OPTIMA code, these costs are as follows:
Barrier Height !ft) Cost ($) 2er Linear Foot 1 9.80 5 41.50
10 81.50 15 139.00 20 183.70 25 228.30 30 277,00 35 311.20
• Transportation Research Record 937 29
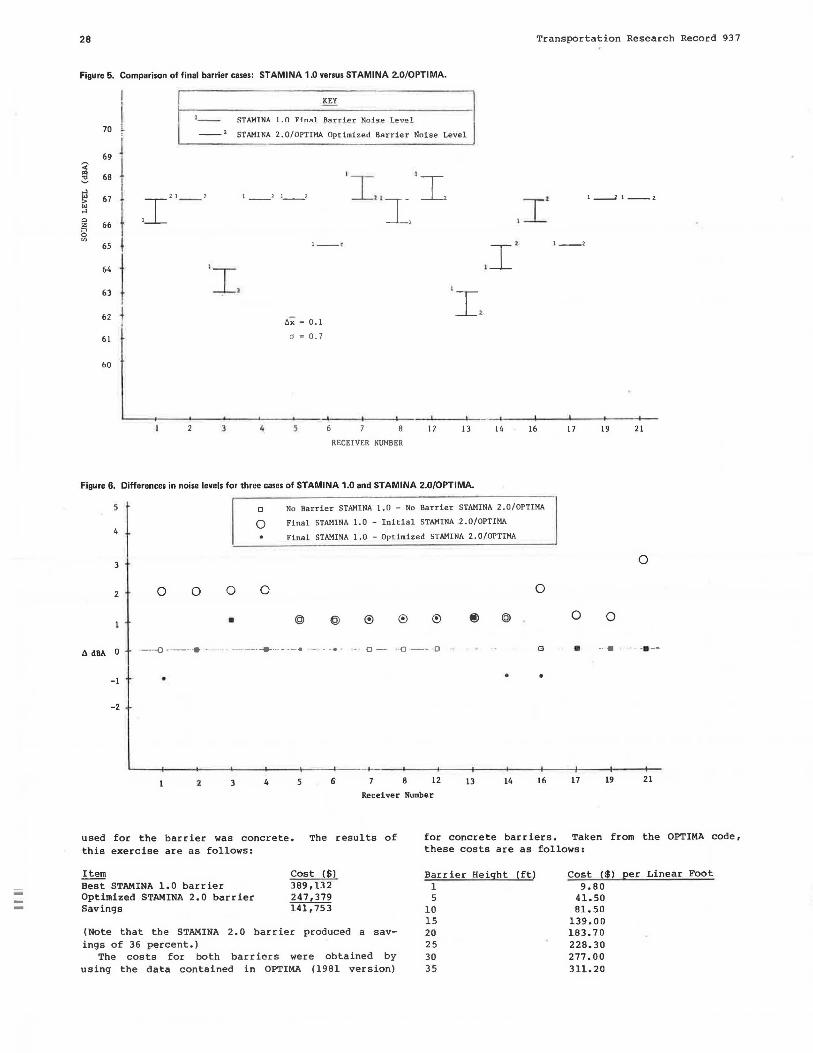
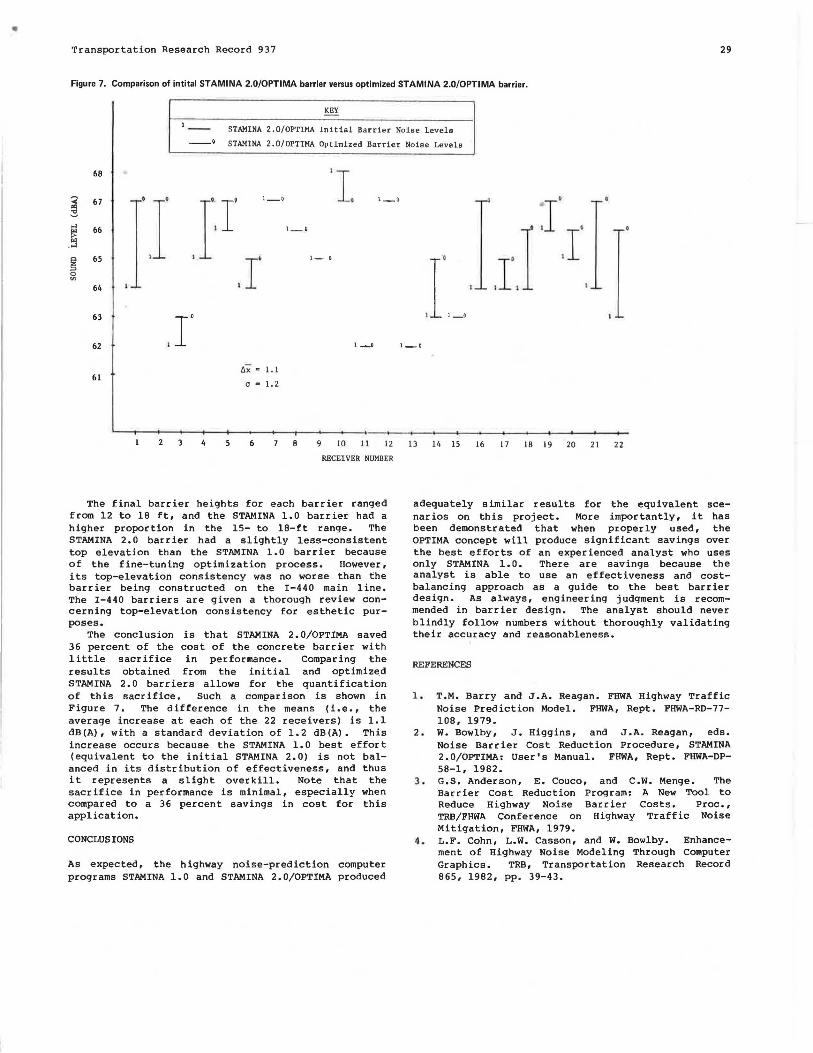
Figure 7. Comparison of intital STAMINA 2.0/0PTIMA barrier versus optimized STAMINA 2.0/0PTIMA barrier.
KEY
--· STAMINA 2.0/0PTIHA Initial Barrier Noise Levels
STAMINA 2.0/0PTIHA Optimized Barrier Noise Levels
68 ·1. ~ 67
] JI 1_, ,_,
·l'r.r ~ ..,
66 ,_, ~ "' ·'"' ~
65 ,r· ,_,
l .I. 0
"' 64
63
l r• 1_,
62 ,_, ,_,
t:."x - 1.1 61
(} a I. 2
2 3 4 6 8 9 10 11 12 13 14 15 16 17 18 19 20 21 22
RECEIVER NUMBER
The final barrier heights for each barrier ranged from 12 to 18 ft, and the STAMINA 1.0 barrier had a higher proportion in the 15- to 18-ft range. The STAMINA 2.0 barrier had a slightly less-consistent top elevation than the STAMINA 1.0 barrier because of the fine-tuning optimization process. However, its top-elevation consistency was no worse than the barrier being constructed on the I-440 main line. The I-440 barriers are given a thorough review concerning top-elevation consistency for esthetic purposes.
The conclusion is that STAMINA 2. 0/0PTIMA saved 36 percent of the cost of the concrete barrier with little sacrifice in performance. Comparing the results obtained from the initial and optimize.a STAMINA 2.0 barriers allows for the quantification of this sacrifice. Such a comparison is shown in Figure 7. The difference in the means (i.e., the average increase at each of the 22 receivers) is 1.1 dB(A), with a standard deviation of 1.2 dB(A). This increase occurs because the STAMINA 1. 0 best effort (equivalent to the initial STAMINA 2.0) is not balanced in its distribution of effectiveness, and thus it represents a slight overkill. Note that the sacrifice in performance is minimal, especially when compared to a 36 percent savings in cost for this application.
CONCLUSIONS
As expected, the highway noise-prediction computer programs STAMINA 1.0 and STAMINA 2.0/0PTIMA produced
adequately similar results for the equivalent scenarios on this project. More importantly, it has been demonstrated that when properly used, the OPTIMA concept will produce significant savings over the best efforts of an experienced analyst who uses only STAMINA 1.0. There are savings because the analyst is able to use an effectiveness and costbalancing approach as a guide to the best barrier design. As always, engineering judgment is recommended in barrier design. The analyst should never blindly follow numbers without thoroughly validating their accuracy and reasonableness.
REFERENCES
1. T.M. Barry and J.A. Reagan. FHWA Highway Traffic Noise Prediction Model, FHWA, Rept. FHWA-RD-77-108, 1979.
2. w. Bowlby, J. Higgins, and J.A. Reagan, eds. Noise Barrier Cost Reduction Procedure, STAMINA 2.0/0PTIMA: User's Manual. FHWA, Rept. FHWA-DP-58-1, 1982.
3 , G.S. Anderson, E. Couco, and c.w. Menge. The Barrier Cost Reduction Program: A New Tool to Reduce Highway Noise Barrier Costs. Proc., TRB/FHWA Conference on Highway Traffic Noise Mitigation, FHWA, 1979.
4. L.F. Cohn, L.W. Casson, and w. Bowlby. Enhancement of Highway Noise Modeling Through Computer Graphics. TRB, Transportation Research Record 865, 1982, pp. 39-43.