standard network diagramming language and corresponding
TRANSCRIPT

Georgia Southern University
Digital Commons@Georgia Southern
Electronic Theses and Dissertations Graduate Studies, Jack N. Averitt College of
Spring 2009
Standard Network Diagramming Language and Corresponding Meta-Model Ségio Jim Waldring
Follow this and additional works at: https://digitalcommons.georgiasouthern.edu/etd
Recommended Citation Waldring, Ségio Jim, "Standard Network Diagramming Language and Corresponding Meta-Model" (2009). Electronic Theses and Dissertations. 666. https://digitalcommons.georgiasouthern.edu/etd/666
This thesis (open access) is brought to you for free and open access by the Graduate Studies, Jack N. Averitt College of at Digital Commons@Georgia Southern. It has been accepted for inclusion in Electronic Theses and Dissertations by an authorized administrator of Digital Commons@Georgia Southern. For more information, please contact [email protected].

STANDARD NETWORK DIAGRAMMING LANGUAGE
AND CORRESPONDING META-MODEL
by
SÉGIO JIM WALDRING
Under the Direction of Vladan Jovanovic
ABSTRACT
This thesis will formally define and demonstrate the viability of a standardized set
of symbols to be used to represent storage network components in various mediums.
Without being formally defined, visual representations of storage network systems and
essential networking concepts have proven themselves to be quite useful to the
computer sciences industry. It is my proposition, however, that the adoption of a formally
defined standardized symbol set would improve the usefulness of these visual tools, the
goal being to create a language that is used as the visual tool for designing and
modeling storage network solutions for any given infrastructure. As a part of my thesis
discourse, I will present my suggestion for a set of standard diagramming network
symbols, formally define the syntax of the logical network diagramming language that
utilizes these symbols and provide desired semantics using a graph of its corresponding
meta-model. I will also present sample diagrams of a storage area network that has
been written in the proposed diagramming language as designed by the software
program, Microsoft Visio. Standardization follows closely the ideas put forward
experimentally by Dr. Jovanovic and his students and collaborators since 2007.
INDEX WORDS: Storage networking, Meta-model, Logical diagramming language,
Networked systems concepts, Data communication concepts
2
STANDARD NETWORK DIAGRAMMING LANGUAGE
AND CORRESPONDING META-MODEL
by
SÉGIO JIM WALDRING
B.S., Georgia Southern University, 2001
A Dissertation Submitted to the Graduate Faculty of Georgia Southern University in
Partial Fulfillment of the Requirements for the Degree
MASTER OF SCIENCE
STATESBORO, GA
2009

3
© 2009
Ségio Jim Waldring
All Rights Reserved
4
STANDARD NETWORK DIAGRAMMING LANGUAGE
AND CORRESPONDING META-MODEL
by
SÉGIO JIM WALDRING
Major Professor: Vladan Jovanovic Committee: James K. Harris
Yan Wu Electronic Version Approved: May 2009

5
ACKNOWLEDGEMENTS
Thanks to my committee members and my thesis advisor, Dr. Jovanovic, for their helpful
suggestions and brainstorming sessions. I would also like to thank my wife, Ta-Taneicia.
6
TABLE OF CONTENTS
PAGE
ACKNOWLEDGEMENTS………………….........................................................................5
LIST OF TABLES…………………………………………………………………………..……7
LIST OF FIGURES………………………………………………………………………...…….8
CHAPTER
1 INTRODUCTION………………………………………………………………….….9
2 EXAMPLE STANDARD NETWORK DIAGRAMMING SYMBOLS……………12
3 FORMALLY DEFINING THE DIAGRAMMING LANGUAGE…………….…….17
4 PRACTICAL APPLICATIONS………………………………………………….….25
5 CONCLUSION...……………………………………………………………….…....29
REFERENCES…………………………………………………………………………….…...31
APPENDIX……………………………………………………………………………………...35

7
LIST OF TABLES
PAGE
Table 1: My Example Nodal Categories……………………………………………………..13
Table 2: Examples of Functional Nodes……………………………………………………..14
Table 3: Examples of Combinable Nodes…………………………………………………...14
Table 4: Examples of Decomposable Nodes………………………………………………..15
Table 5: Examples of Annotation and Legend SANDS…………………………………….16
Table 6: Examples of Grouping Enclosure SANDS (combinable)………………………...16
Table7: SANDL Grammar Production Rules………………………………………………..18

8
LIST OF FIGURES
PAGE
Figure 1: Diagram of the Robert F. Kennedy assassination crime scene…………………9
Figure 2: A sample of the diagramming symbols of Cisco Systems, Incorporated……..10
Figure 3: Diagram of 15 clients connected to a hub………………………………………..15
Figure 4: Simple network with 4 enclosure nodes………………………………………..…19
Figure 5: Parse tree diagram of Figure 4 based on SANDS production rules…………...20
Figure 6: Chomsky’s famous phrase tree……………………………………………………20
Figure 7: SANDS Meta-model……………………………………………….…………….….22
Figure 8: Examples of some tables of this instance of the database……………………..23
Figure 9: Diagram using SANDS of the Fast & Easy convenience store………………...25
Figure 10: Diagram of multiple networks to show how much could fit on one page…....26
Figure 11: Logical diagram of SAN array, DAS and NAS (integrated and gateway).......27
Figure 12: Example showing Demilitarized Zone (DMZ)…………………………………..27
Figure 13: Fast And Easy, Inc solution………………………………………………….…...28
Figure 14: Visio Stencil image (SANDS stencil)…………………………………………….35

9
CHAPTER 1
INTRODUCTION
The synergistic nature of diagrams makes them the best instructional tool to use
when trying to capture the essence of whole entities whose architecture is
interconnected and circular. Take, for example, the crime scene of the Robert F.
Kennedy assassination, which took place at the Ambassador Hotel in Los Angeles,
California in June of 1968 [WHIT05].
Figure 1: Diagram of the Robert F. Kennedy assassination crime scene.
Notice how concisely and effectively this diagram describes both the individual
components of this event and the relationships they all share simultaneously. This is
possible with diagrams more so than with any other tool of instruction because diagrams
utilize symbols and symbols communicate succinctly. Symbols are the basis of the
languages that diagrams use to convey their lessons.
Like computers and networking devices, logical diagrams are a valuable product
of the computer sciences industry. These diagrams are very useful tools in regards to
explaining the inner workings of computer networking systems. Diagrams clarify the
relationship between the parts of a whole so that a greater understanding may be
achieved. Understand that this is the service that logical diagrams provide in relation to
computer networks. Use of logical network diagrams to clarify the design plans of
computer networks is standard practice within our industry. The use of symbols to
explain what components an existent network is comprised of or to plan what
components a future network should be composed of is concise and thorough in a way
that no other method can compare to. Being that their use is standard practice, regular
evaluation of logical diagrams as a product should be common place. But I have to state

10
that it is not. What other reason can explain why it is that the computer sciences industry
has yet to adopt a standard network diagramming language?
Unfortunately, it is becoming increasingly time consuming to learn about
computer networks through the use of logical diagrams. This can be attributed to the fact
that there are currently a considerable amount of symbols available to visually represent
a single function of a particular device. Most network diagramming software has a
master set of symbols to represent computer network devices such as servers, switches,
storage arrays, etc. An example of one of these master symbols sets that has been
adopted for use by an individual consumer of logical network diagrams is depicted here,
in Figure 2:
Figure 2: A sample of the diagramming symbols of Cisco Systems, Incorporated.
A study of Figure 2 immediately shows the problem the computer sciences industry is
facing today concerning logical network diagrams. Within the diagramming language of a
single organization, we can see four different visual representations of routers, two of
bridges and switches, three of workstations, three of personal computers and two of
servers. And this is just a small sampling of the complete master symbol set that is
currently in use at CISCO. There are many other logical network diagramming
languages in use today: SolarWinds, NetworkView, Netformx, Hewlett-Packard’s
OpenView, Ipswitch’s WhatsUp Gold and CA Incorporated’s NetViz. With each one of
these companies using their own diagramming language, the computer sciences
industry must address a problem beyond the tediousness of it all: Will a student who has
been exposed to one standard have difficulties in recognizing and adjusting to another?
What consequences will our industry suffer if the answer is yes?

11
Networking technology is rapidly evolving and is intrinsically complex, [this
makes the] need to systematically address logical network diagrams academically
urgent [JOVA08].This dissertation is a proof of concept. It will provide the computer
sciences industry with an example standardized network diagramming language
(SANDL) for the purpose of stimulating ideas and encouraging conversations on this
topic. Creating a language begins with designing its set of symbols, but a language
cannot be properly articulated without a strictly defined grammar. As a means of
describing the SANDL design process, this dissertation will provide an example set of
standardized network diagramming symbols (SANDS), formally define the grammar of
an example SANDL and present some example logical network diagrams. In conclusion,
a brief mention will be made on how diagrams can be exported and used by a program
for analytical purposes in Microsoft Visio 2007.
While it is true that the language of one diagram does not necessarily have to be
the language of another, it is also true that adopted industry standards better ensure that
the products of that industry remain valuable commodities. In order to make logical
network diagrams effective and user friendly, the computer sciences industry needs to
design a sole SANDL. Diagrams that are used to explain the architecture of computer
networks need to be compatible from company to company and individual to individual.
Adopting a policy of standardization will streamline education, training and expansion.

12
CHAPTER 2
EXAMPLE STANDARD NETWORK DIAGRAMMING SYMBOLS
A logical network diagram is a very powerful overview tool that can bring a
person up to speed very fast on a network’s physical and logical topology. A computer
network is a collection of computers and devices connected to each other. The network
allows computers to communicate with each other and share resources and information.
Visually representing a computer network in a logical manner requires symbols that are
able to convey multiple layers of information. The SANDS must be capable of illustrating
components abstractly if they are going to be interchangeable; abstract shapes are
better able to crossover from brand to brand. In other words, SANDS are meant to be
iconic. The SANDS must also be able to represent any customized data that has been
stored concerning the components on a specified computer network. In other words, the
SANDS must also be literal.
“Requirements were collected for a set of logical symbols by consulting faculty
teaching networking across the curriculum in the CS, IS, and IT programs” [JOVA08].
The efforts behind this dissertation have lead to the following list of guidelines which
should be kept in mind during the design process of a SANDL. There must be “a
selection of rules for combining and connecting symbols and/or adding annotations to
symbols as a form of syntax rules or a grammar of a symbolic language whose terminal
components are symbols” [JOVA08].
1. SANDS must be abstract and not overly representational.
2. SANDS must be able to be literal.
3. SANDS must be well defined.
4. SANDS must be two dimensional with a minimal number of lines, painted
and exposed surfaces, and no shading.
5. SANDS must be memorable and easy to recognize.
6. A set of syntax rules must guide the creation of any logical network
diagram that is constructed out of SANDS, and must specify which strings
of symbols count as well-formed (a formal grammar). The well-formed
strings of symbols are also called words, expressions, formulas, or terms
[SAKH09].
7. Methodology must be defined (semantics).

13
In terms of logical network diagrams, the computing devices that contain
electronics (hardware) and the devices that perform specific functions (software) are
referred to as nodes. The communication lines and connection devices that enable each
computing device to interact with one another are referred to as arcs. A logical network
diagram is a graph made up of arcs and nodes that visually represent a group of
functional devices that transform content and/or regulate communication traffic.
Categorizing nodes by type is the first step in creating appropriate designs that are easy
to draw by hand and computer software. When categorizing nodes, it is best to focus on
the concept of function rather than on the concept of brand name product design. The
key issue to start with is which symbols to use, and an answer to this question is to be
based on an explicit set of criteria and an academic assessment of established
practices, with an expectation that most symbols can be reused as is or abstracted into a
minimal and consistent set [JOVA08]. Shapes that are appropriate and easy to draw will
help to ensure that the number of SANDS within the domain of a diagramming language
is kept to a minimum.
For the purpose of creating an example set of SANDS symbols, this dissertation
will concentrate on the computing devices that are found on storage area networks
(SAN). In dividing these computing devices up according to type, it was found that there
were three categories of nodes and arcs.
Table 1: My Example Nodal Categories.
Type of Node Definition
Functional Performs one task.
Combinable Can combine multiple functional nodes to represent logically a multi-functional device.
Decomposable All nodes are decomposable into networks of their own.
Each node was then assigned to a category and a simple visual representation for each
node was created that would allow its function or functions to be appropriately displayed.

14
Table 2: Examples of Functional nodes.
SANDS Definition
Hub – Common connection point for multiple devices on a network; connects segments of a LAN together; copies every data packet to all ports and forwards all packets to all connected devices.
SANDS Function: To connect multiple computers on a LAN so they can communicate with one another. A path connecting device.
Additional Notes: Used as standalone or in combination with other functional node(s); for example, to show a router with hub.
Switch – A hub that reads the destination address of each data packet, copies each packet only to its specified port and forwards each packet to only the specified connected device.
SANDS Function: To connect multiple computers so they can communicate with one another. An intelligent path altering device.
Additional Notes: Used as standalone or in combination with other functional node(s); for example, to show a router with a switch.
Router – Connects various networks together and intelligently sends information back and forth between them.
SANDS Function: A subnet connecting device.
Additional Notes: Used as standalone or in combination with other functional node(s).
Storage – Device or medium on or in which data can be entered or held and retrieved at a later time. Synonymous with external memory.
SANDS Function: A persistent data saving device.
Additional Notes: For example a hard disk, tape or optical disk.
Interface – Device or protocol adapter that enables one device to communicate with another.
SANDS Function: A communications device.
Additional Notes: Add to edge of a shape to indicate a communication adapter.
Table 3: Examples of Combinable nodes.
SANDS Definition
Multi functional or single functional Catch All (templates for two and/or three functions) – Represents any computing device that performs more than one task within a specified network. Comprised of other functional nodes.
Function: Acts as a container of other shapes. A device enclosure.
Additional Notes: May be strung together to represent any given number of functional devices. To diagram disk arrays or intelligent storage arrays (SAN), multi functional printers, multifunctional routers, NAS etc.
15
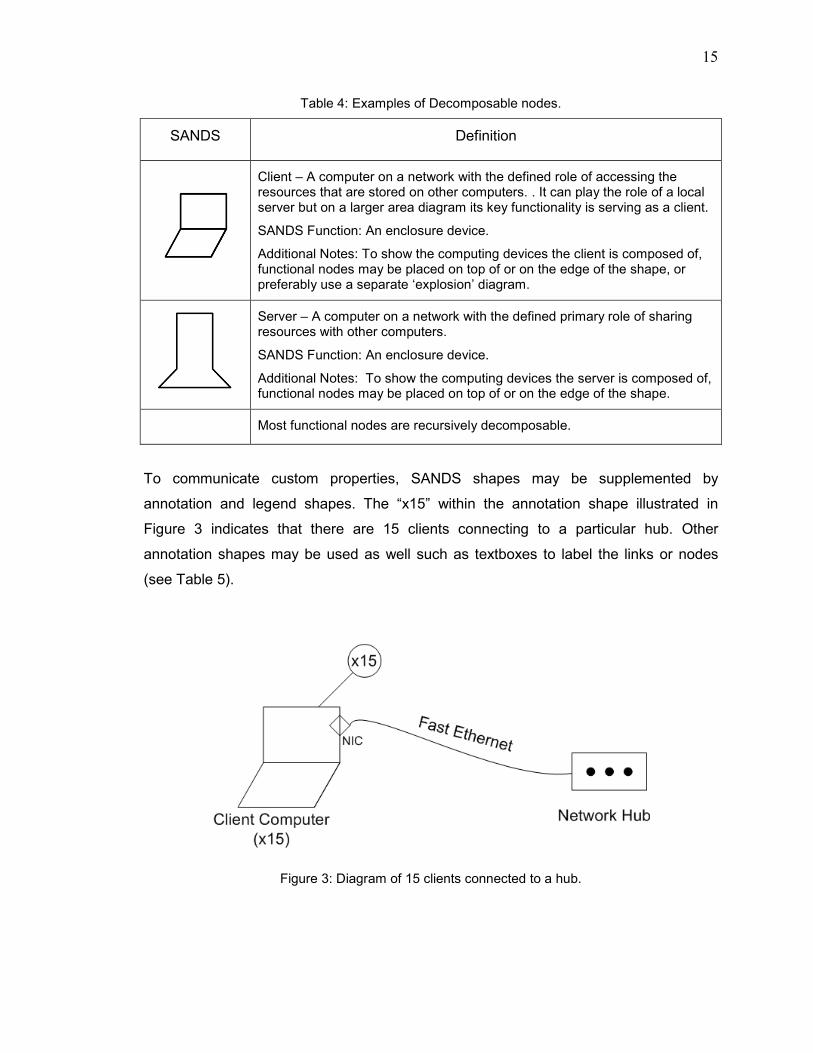
Table 4: Examples of Decomposable nodes.
SANDS Definition
Client – A computer on a network with the defined role of accessing the resources that are stored on other computers. . It can play the role of a local server but on a larger area diagram its key functionality is serving as a client.
SANDS Function: An enclosure device.
Additional Notes: To show the computing devices the client is composed of, functional nodes may be placed on top of or on the edge of the shape, or preferably use a separate ‘explosion’ diagram.
Server – A computer on a network with the defined primary role of sharing resources with other computers.
SANDS Function: An enclosure device.
Additional Notes: To show the computing devices the server is composed of, functional nodes may be placed on top of or on the edge of the shape.
Most functional nodes are recursively decomposable.
To communicate custom properties, SANDS shapes may be supplemented by
annotation and legend shapes. The “x15” within the annotation shape illustrated in
Figure 3 indicates that there are 15 clients connecting to a particular hub. Other
annotation shapes may be used as well such as textboxes to label the links or nodes
(see Table 5).
Figure 3: Diagram of 15 clients connected to a hub.

16
Table 5: Examples of Annotation and Legend SANDS.
SANDS Definition
Annotation – An explanatory short message.
SANDS Function: A supplemental node and quantifying shape.
Additional Notes: n is the number of units.
Text Box – Lettering within the field of a diagram that explains the symbols that are being used.
SANDS Function: A supplemental labeling shape.
Additional Notes: User feature on computer software; written descriptions when diagram is drawn by hand. Can be also used to indicate quantity.
Legend – Lettering within the field of a diagram that explains the computing devices that are being represented.
SANDS Function: A supplemental qualifying shape.
Additional Notes: May be used as a summarizing tool.
Table 6: Examples of Grouping Enclosure SANDS (combinable).
SANDS Definition
Network Cloud - A public or semi-public space on transmission lines that exists between given end points.
SANDS Function: A network enclosure.
Additional Notes: Shows that a particular network has a connection to an outside network that is not a part of the current drawing.
Grouping Enclosure – Compartmentalizes nodes which are collectively considered as being related.
SANDS Function: A sectioning shape.
Additional Notes: A transparent shape which allows the user to frame other nodes in order to convey individual zones.
Computing device definitions were taken from the 17th Edition of Upgrading and
Repairing PCs, by Scott Mueller [MUEL06] and from Dictionary.com [DICT09].

17
CHAPTER 3
FORMALLY DEFINING THE DIAGRAMMING LANGUAGE
A language “is a formal system of signs and symbols including rules for the
formation and transformation of admissible expressions” [MERR08]. A formal grammar
is the set of rules that form a language. Grammar “includes morphology and syntax,
often complemented by phonetics, phonology, semantics, and pragmatics” [GRAM09].
Once a set of SANDS has been agreed upon, the next step in the SANDL adoption
process will be defining its grammar. It is not enough to establish rules for the proper
usage of the diagramming shapes simply as visual representations of computing devices
within a logical network diagram “picture”. The grammar production rules of the language
must go beyond the simple dictation of where on the page a symbol should be placed. In
order for the diagramming language to be logical, rules for properly expressing the
relationship each symbol shares with one another must also be established.
Syntax
Syntax rules establish how letters form words, words form sentences, sentences
form paragraphs, etc. The “letters” of the diagramming language are the individual
symbols as they stand alone. Connecting the symbols together, for the purpose of
representing the architecture of a SAN, is the same as using the letters from the English
alphabet to form words. Some SANDS will represent the components of a SAN that
hold, or enclose, other components. These symbols are the sentences of the
diagramming language. Because they can be connected to other shapes, enclosure
shapes may also be a part of a word. Mathematically, a grammar [that defines a] formal
language L is a quadruple (N, T, R, S), where N is a finite set of non-terminals, T is a
finite set of terminal symbols, R is a finite set of productions, and S is an element of N
[SAKH09]; it is the non-terminals that define the types of words that can be produced. A
production rule is an abstract computational process of grammar-rule expansion. A user
should be able to produce a syntactically correct logical network diagram by following a
set of adopted diagram production guidelines. The terminal symbols are connected
together or placed inside other shapes. These form the non-terminal symbols
(enclosures, combinations, etc). These shapes act as a container of some nodes
combined together for the purpose of portraying one entity.
18
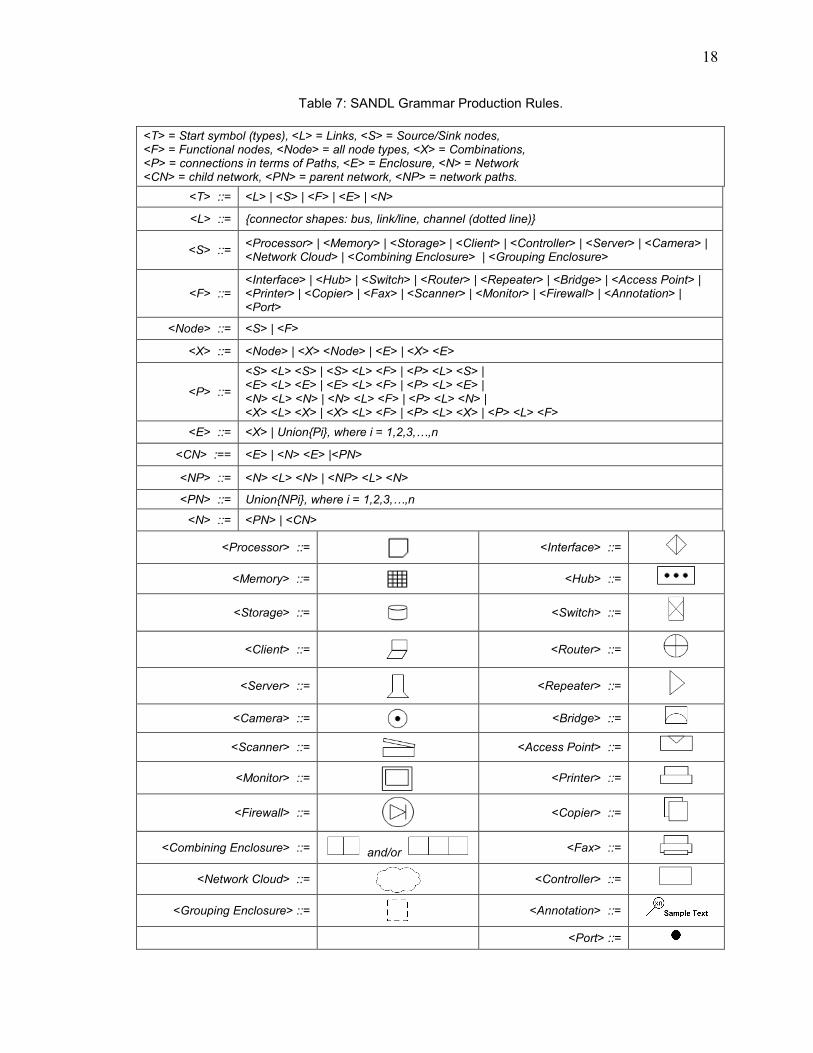
Table 7: SANDL Grammar Production Rules. <T> = Start symbol (types), <L> = Links, <S> = Source/Sink nodes, <F> = Functional nodes, <Node> = all node types, <X> = Combinations, <P> = connections in terms of Paths, <E> = Enclosure, <N> = Network <CN> = child network, <PN> = parent network, <NP> = network paths.
<T> ::= <L> | <S> | <F> | <E> | <N>
<L> ::= {connector shapes: bus, link/line, channel (dotted line)}
<S> ::= <Processor> | <Memory> | <Storage> | <Client> | <Controller> | <Server> | <Camera> | <Network Cloud> | <Combining Enclosure> | <Grouping Enclosure>
<F> ::= <Interface> | <Hub> | <Switch> | <Router> | <Repeater> | <Bridge> | <Access Point> | <Printer> | <Copier> | <Fax> | <Scanner> | <Monitor> | <Firewall> | <Annotation> | <Port>
<Node> ::= <S> | <F>
<X> ::= <Node> | <X> <Node> | <E> | <X> <E>
<P> ::=
<S> <L> <S> | <S> <L> <F> | <P> <L> <S> | <E> <L> <E> | <E> <L> <F> | <P> <L> <E> | <N> <L> <N> | <N> <L> <F> | <P> <L> <N> | <X> <L> <X> | <X> <L> <F> | <P> <L> <X> | <P> <L> <F>
<E> ::= <X> | Union{Pi}, where i = 1,2,3,…,n
<CN> :== <E> | <N> <E> |<PN>
<NP> ::= <N> <L> <N> | <NP> <L> <N>
<PN> ::= Union{NPi}, where i = 1,2,3,…,n
<N> ::= <PN> | <CN>
<Processor> ::=
<Interface> ::=
<Memory> ::=
<Hub> ::=
<Storage> ::= <Switch> ::=
<Client> ::=
<Router> ::=
<Server> ::=
<Repeater> ::=
<Camera> ::=
<Bridge> ::=
<Scanner> ::=
<Access Point> ::=
<Monitor> ::=
<Printer> ::=
<Firewall> ::=
<Copier> ::=
<Combining Enclosure> ::= and/or <Fax> ::=
<Network Cloud> ::=
<Controller> ::=
<Grouping Enclosure> ::=
<Annotation> ::=
<Port> ::=
19
The Backus–Naur Form (BNF), as depicted in Table 7, is a metasyntax that can
be used to express the grammar that produces a formal language. Link shapes (<L>)
are the lines in the diagramming language which are drawn from one node to another in
a diagram. Source/Sink nodes (<S>) are the nodes that supply the data (source –
initiator of data) or receive data (sink - a node to which all links attached to it come in,
and from which no such links go out). All of the other nodes are basically used to relay
this data and are referred to as functional nodes (<F>). The non-terminal (<X>) is used
for depicting combinations of components. The non-terminal (<P>) is used for the
creation of a path from node to node. The union of n paths is an enclosure. Union is
defined outside of BNF notation and can be seen as a list of strings separated by a
comma (see Figure 5). So for example, a logical network diagram of a local area
network would show several <E> shapes and is itself a grouping enclosure.
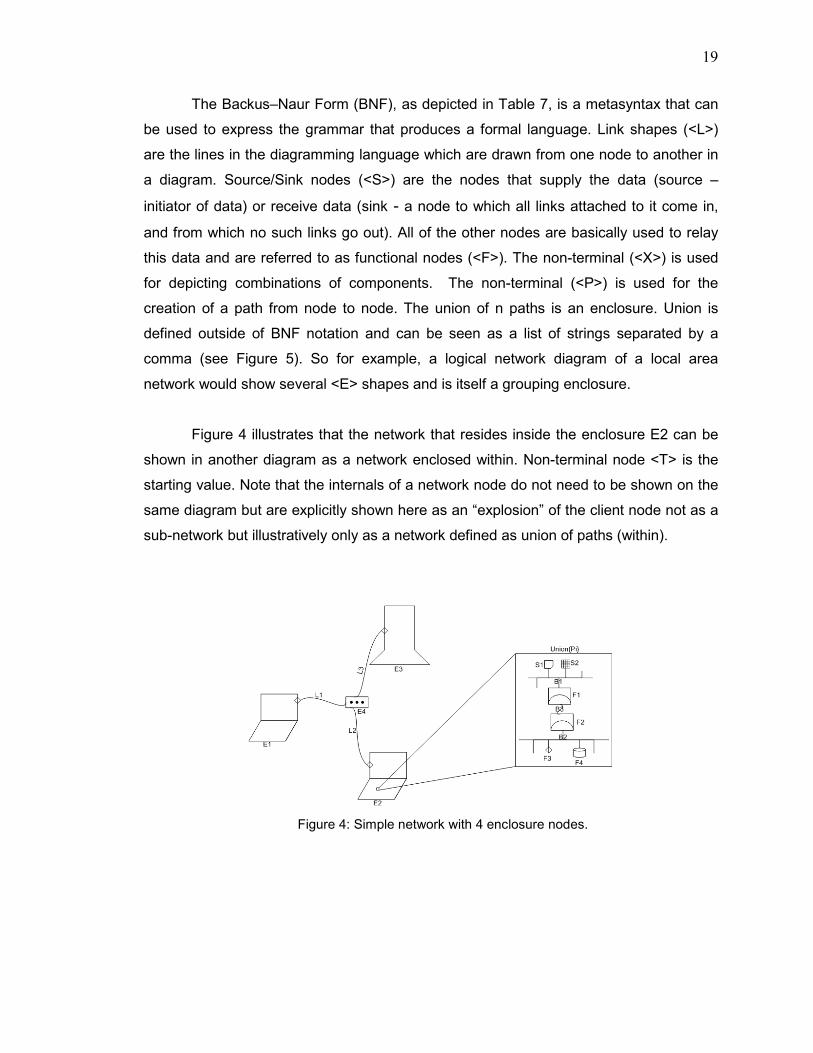
Figure 4 illustrates that the network that resides inside the enclosure E2 can be
shown in another diagram as a network enclosed within. Non-terminal node <T> is the
starting value. Note that the internals of a network node do not need to be shown on the
same diagram but are explicitly shown here as an “explosion” of the client node not as a
sub-network but illustratively only as a network defined as union of paths (within).
Figure 4: Simple network with 4 enclosure nodes.
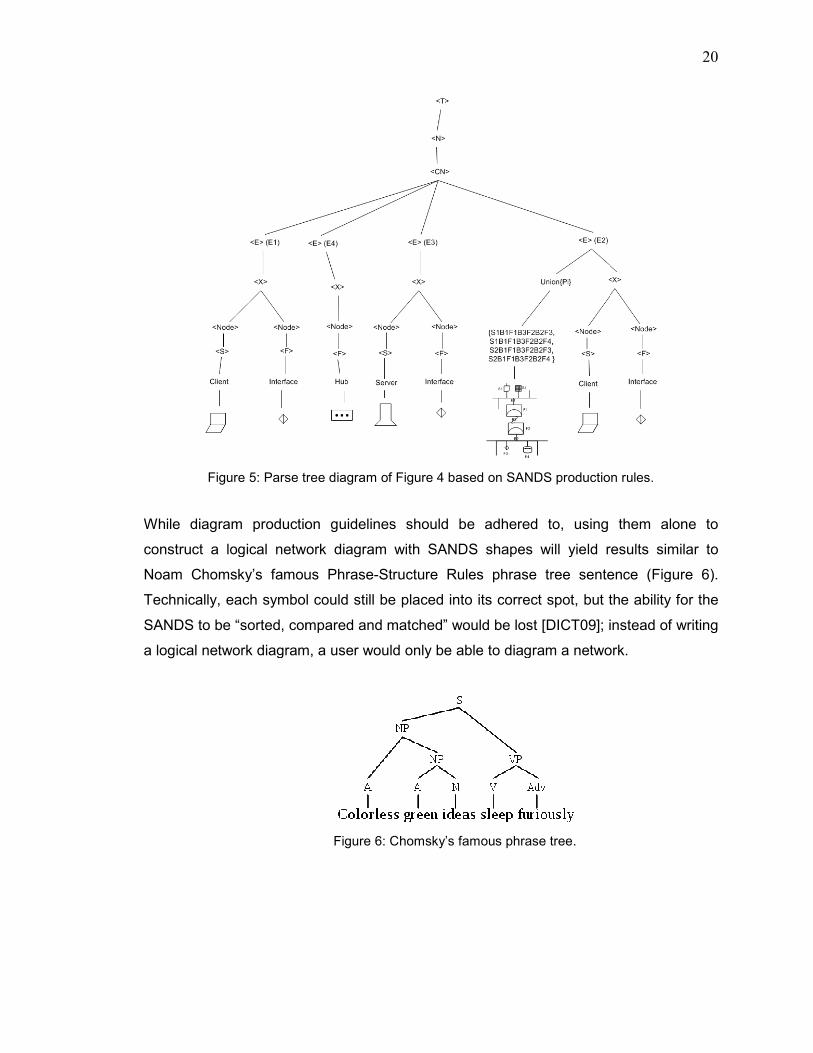
Figure 5: Parse tree diagram of F
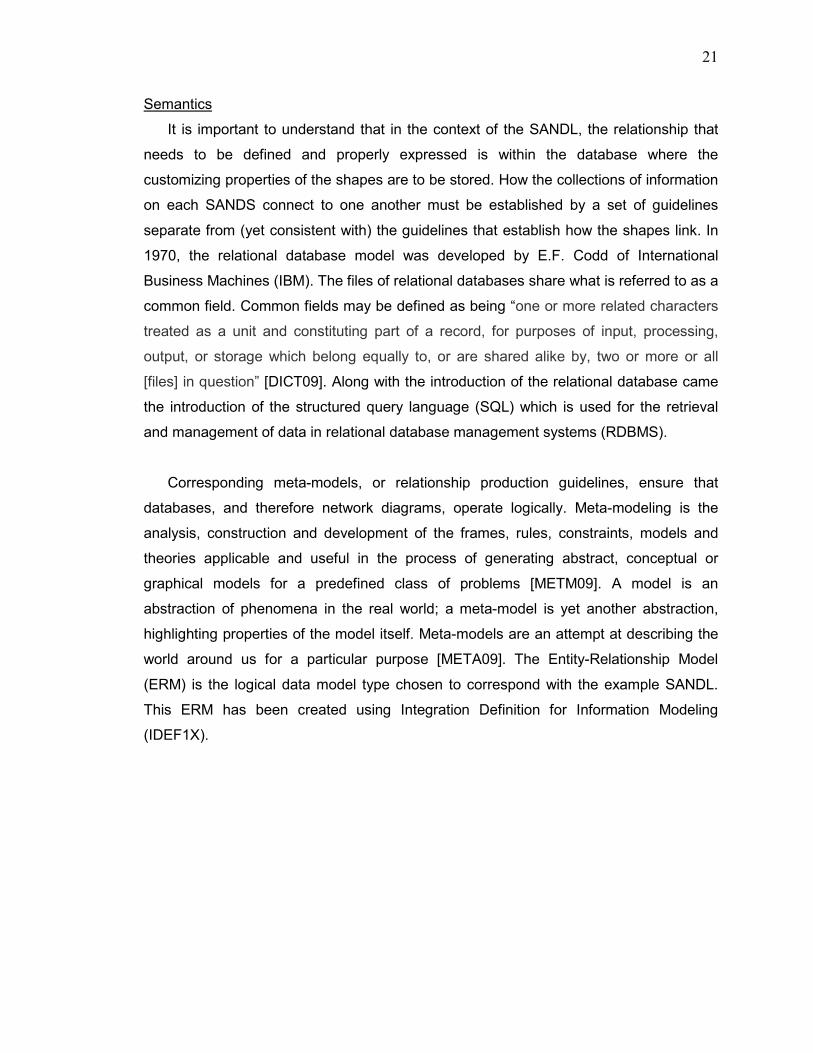
While diagram production
construct a logical network diagram with SANDS shapes will yield results similar to
Noam Chomsky’s famous Phrase
Technically, each symbol could still be placed into its correct spot, but the ability for the
SANDS to be “sorted, compared and matched” would be lost [DICT09]; instead of writing
a logical network diagram, a user would onl
: Parse tree diagram of Figure 4 based on SANDS production rules.
roduction guidelines should be adhered to, using them alone to
construct a logical network diagram with SANDS shapes will yield results similar to
Noam Chomsky’s famous Phrase-Structure Rules phrase tree sentence (Figure 6).
Technically, each symbol could still be placed into its correct spot, but the ability for the
SANDS to be “sorted, compared and matched” would be lost [DICT09]; instead of writing
network diagram, a user would only be able to diagram a network.
Figure 6: Chomsky’s famous phrase tree.
20
based on SANDS production rules.
uidelines should be adhered to, using them alone to
construct a logical network diagram with SANDS shapes will yield results similar to
tree sentence (Figure 6).
Technically, each symbol could still be placed into its correct spot, but the ability for the
SANDS to be “sorted, compared and matched” would be lost [DICT09]; instead of writing
le to diagram a network.
21
Semantics
It is important to understand that in the context of the SANDL, the relationship that
needs to be defined and properly expressed is within the database where the
customizing properties of the shapes are to be stored. How the collections of information
on each SANDS connect to one another must be established by a set of guidelines
separate from (yet consistent with) the guidelines that establish how the shapes link. In
1970, the relational database model was developed by E.F. Codd of International
Business Machines (IBM). The files of relational databases share what is referred to as a
common field. Common fields may be defined as being “one or more related characters
treated as a unit and constituting part of a record, for purposes of input, processing,
output, or storage which belong equally to, or are shared alike by, two or more or all
[files] in question” [DICT09]. Along with the introduction of the relational database came
the introduction of the structured query language (SQL) which is used for the retrieval
and management of data in relational database management systems (RDBMS).
Corresponding meta-models, or relationship production guidelines, ensure that
databases, and therefore network diagrams, operate logically. Meta-modeling is the
analysis, construction and development of the frames, rules, constraints, models and
theories applicable and useful in the process of generating abstract, conceptual or
graphical models for a predefined class of problems [METM09]. A model is an
abstraction of phenomena in the real world; a meta-model is yet another abstraction,
highlighting properties of the model itself. Meta-models are an attempt at describing the
world around us for a particular purpose [META09]. The Entity-Relationship Model
(ERM) is the logical data model type chosen to correspond with the example SANDL.
This ERM has been created using Integration Definition for Information Modeling
(IDEF1X).

22
Figure 7: SANDS M
eta-model.
23
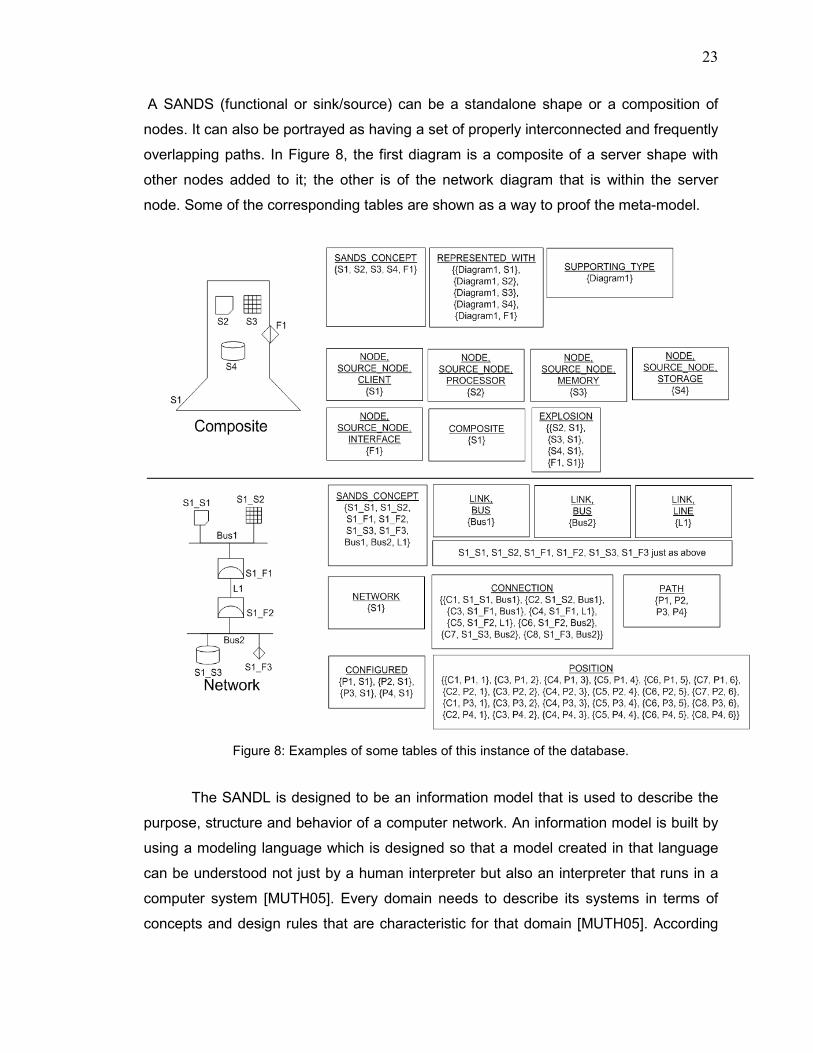
A SANDS (functional or sink/source) can be a standalone shape or a composition of
nodes. It can also be portrayed as having a set of properly interconnected and frequently
overlapping paths. In Figure 8, the first diagram is a composite of a server shape with
other nodes added to it; the other is of the network diagram that is within the server
node. Some of the corresponding tables are shown as a way to proof the meta-model.
Figure 8: Examples of some tables of this instance of the database.
The SANDL is designed to be an information model that is used to describe the
purpose, structure and behavior of a computer network. An information model is built by
using a modeling language which is designed so that a model created in that language
can be understood not just by a human interpreter but also an interpreter that runs in a
computer system [MUTH05]. Every domain needs to describe its systems in terms of
concepts and design rules that are characteristic for that domain [MUTH05]. According

24
to Thomas G. Muth and his book, Functional Structures in Networks, a modeling
language meets this task by, 1) separating functionality from connectivity, and 2)
separating the system that offers services to system users from the systems that
manage that system. He refers to this principle as a “separation of concern” [MUTH05].
Keeping the focus on the function of each computing device during the design process
will endow a SANDL with interchangeability and allow its use to be applied universally.
25
CHAPTER 4
PRACTICAL APPLICATIONS
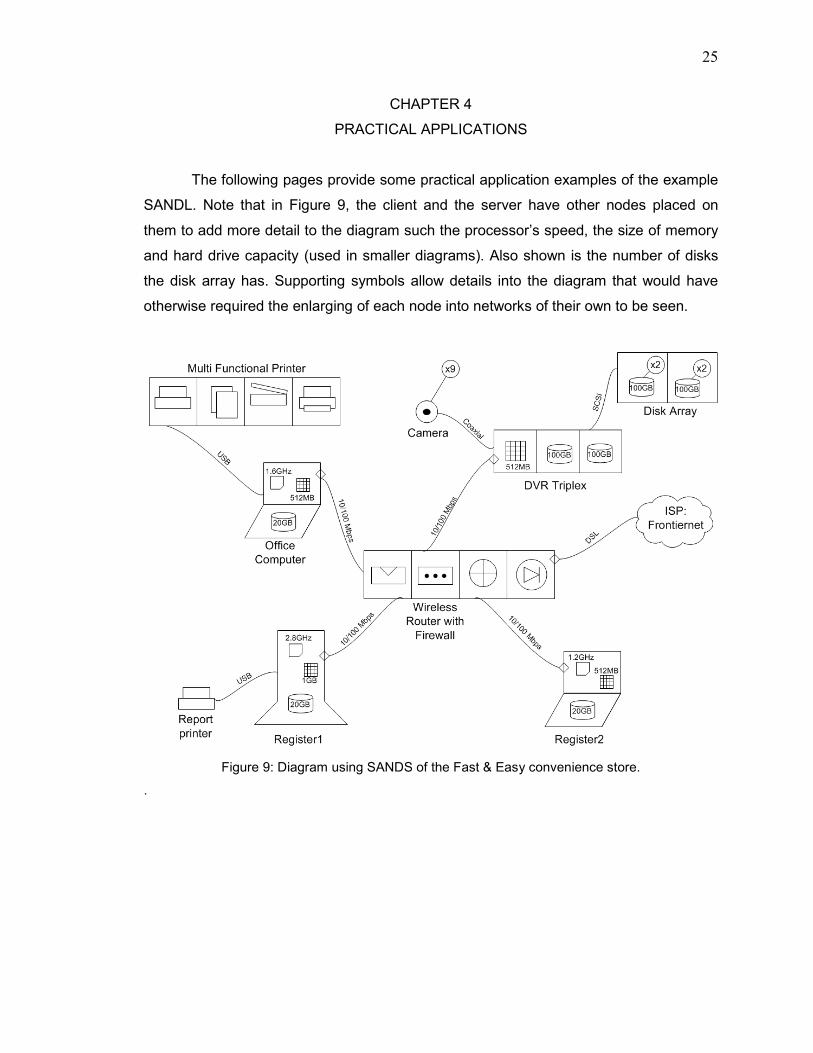
The following pages provide some practical application examples of the example
SANDL. Note that in Figure 9, the client and the server have other nodes placed on
them to add more detail to the diagram such the processor’s speed, the size of memory
and hard drive capacity (used in smaller diagrams). Also shown is the number of disks
the disk array has. Supporting symbols allow details into the diagram that would have
otherwise required the enlarging of each node into networks of their own to be seen.
Figure 9: Diagram using SANDS of the Fast & Easy convenience store.
.
26
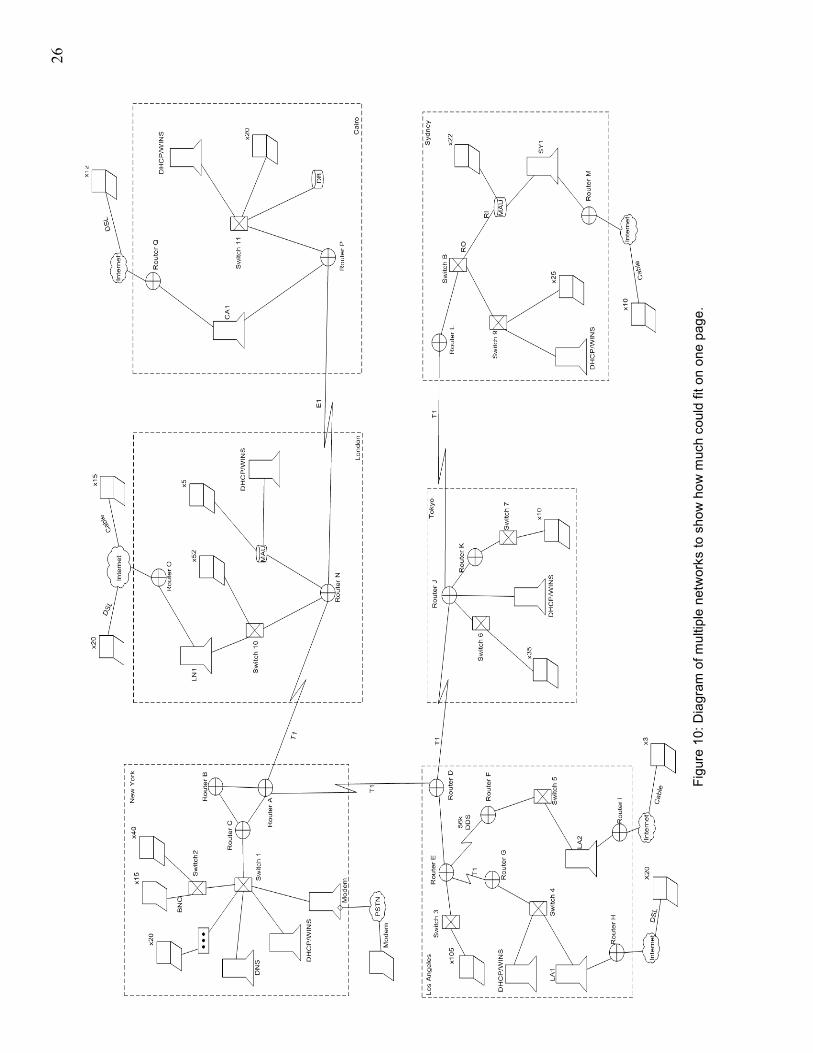
Figure 10: D
iagram
of m
ultiple networks to show how
much could fit on one page
.

27
Figure 11: Logical diagram of SAN array, DAS and NAS (integrated and gateway).
Figure 12: Example showing Demilitarized Zone (DMZ).
28
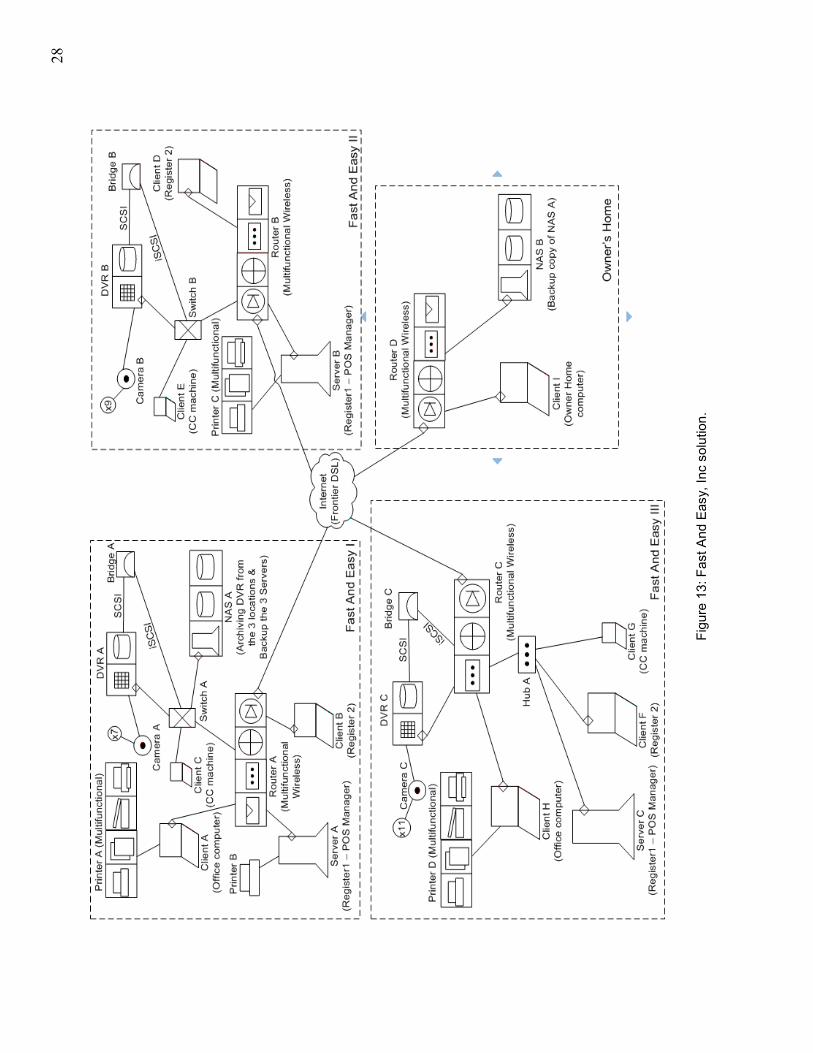
Figure 13: F
ast A
nd Easy, In
c solution.

29
CHAPTER 5
CONCLUSION
Microsoft Office Visio Professional 2007 for IT began life as a product of the
independent Visio Corporation. As of Visio 2000, this software was acquired by Microsoft
and branded as a Microsoft Office application [MICR09]. Visio’s vector graphics software
allows users to create a wide range of diagramming solutions to communicate concepts,
procedures, product information, specifications and more. Microsoft Visio has the
capability of allowing a user to store modifiable information concerning the symbols of
his or her diagramming language and then exporting these into a database or
spreadsheet. These could further be used by a program that will populate another
database. What if every action done to shapes could be done automatically? What if
there was a way to collect information from a drawing, such as through a form or an
interactive control? What if the information in a drawing could be sent to another
program for analysis automatically? With Visual Basic for Applications 6.3 (VBA)
separate programs could be written called a macro that controls actions in Visio. Visio
has an open architecture, which means that Visio exposes its objects, such as windows,
drawing pages, shapes, layers, menus, and toolbars, through a structured interface
called the object model. For example, one popular area of Visio customization is creating
automated sales tools that can generate a purchase order or bill of materials from a
Visio drawing. Custom shapes are linked to database information about the properties of
the company’s equipment. Sales personnel can then use the shapes to prototype
configurations for prospective clients in Visio. VBA macros can scan the equipment in
the drawing to create a bill of materials or purchase order on the spot. The easiest way
to create an add-in is to create a public procedure in a VBA module. VBA code is stored
as part of the drawing file and runs in the same memory space as Visio. However an
add-in can also be created as an executable (.exe) file that can be launched from Visio
or executed as an independent program, and the add-in can be written using any
programming language that supports the Component Object Model (COM).
Just as the IDEF1X diagramming language is useful because it could easily be
used to generate SQL statements that create the database tables, so must the SANDL
have a benefit beyond creating nice diagrams. In Microsoft Visio, one can use layers to
organize related shapes on a drawing page. A layer is a named category of shapes. By

30
assigning shapes to different layers, information about each shape can be selectively
imported into separate worksheets in a spreadsheet file. It could then be used to create
a database modeled after the meta-model with a tree like structure, which just means
that the information about each symbol will be organized according to relativity. Such a
database can be queried for information. To ensure that a SANDL is able to adequately
describe the domain of any computer network, the task of creating it should not be taken
on by a single person or by a homogeneous group of people. Instead, a heterogeneous
group of people who represent the many interests of the computer sciences industry,
both directly and indirectly, should take on the task together. The work should be a
combination of refinement (virtualization, storage network extensions, etc.), a broad
dissemination effort and two research challenges:
• Evaluation of Effectiveness - My example SANDS is saved as a Visio stencil
which could be used in a classroom setting. Students could learn the basic
components needed in networking and security issues. Keeping a record of the
diagrams and their use, and any opinions or recommendations would be helpful
in the evolution of the SANDL.
• Adding Analytical Capabilities - The custom properties themselves could also be
standardized. The shapes are added to layers. An example of the layers for the
proposed set of symbols is the Annotation, Connector and Node layers. The
node shapes are further divided into belonging to Sink/Source, Functional,
Combining and Grouping layers. Each layer has its own set of properties that
applies for all the shapes in that layer. Using Visio’s database export wizard any
additional properties that Visio uses could be exported and become the driving
force of an application do could be used for analysis.
For the purpose of being inspirational, this paper presented a sharp, clear example
SANDS set, formally defined the grammar of the example SANDL and provided a few
visual representations of SANs as examples of the practical application of the SANDL.
Essential networking concepts have proven themselves to be quite useful to the
computer sciences industry and the logical diagram is no exception.
31
REFERENCES
[ARNO98] Robert Arnold (1998), A Brief History of Computers: Who Did What, What They Did, When They Did It, and Why. http://www.warbaby.com/FG_test/comp_history.html (viewed 09/2008) [BACK09] Backplane (2009). In Wikipedia, The Free Encyclopedia. http://en.wikipedia.org/w/index.php?title=Backplane&oldid=272215011 (viewed 03/2009) [BRAI08] Brain, Marshall (2008). In howstuffworks.com: How Microprocessors Work. http://www.howstuffworks.com/microprocessor.htm (viewed 09/2008) [CATH09] Cathode Ray Tube. (2009). In Wikipedia, The Free Encyclopedia. http://en.wikipedia.org/w/index.php?title=Cathode_ray_tube&oldid=273412369 (viewed 02/2009) [CORE09] Marc Farley. (2009). In ed-thelen.org: Magnetic Cores, A description of magnetic core memory. http://ed-thelen.org/comp-hist/navy-core-memory-desc.html (viewed 02/2009) [DELL08] Learn About Storage: Storage Area Network (SAN). http://www.dell.com/content/topics/topic.aspx/global/products/pvaul/topics/en/learn_storage_san?c=us&cs=555&l=en&s=biz (viewed 10/2008) [DERF05] Derfler Jr., Frank & Freed, Les (2005) How Networks Work. 7th Ed. Que Publishing. pp. 40-222. [DICT09] Term definitions (2009). In Dictionary.com, LLC. http://dictionary.reference.com (viewed 4/2009). [DREW05] Drew, Robb, (2005). In enterpriseITPlanet.com, Storage. Which NAS OS? http://www.enterpriseitplanet.com/storage/features/article.php/11318_3468811_1 (viewed 03/2009) [EARL08] PCGuide.com (2008). PC Guide: Hard Disk Drives. Early Disk Drives. http://www.pcguide.com/ref/hdd/index.htm (viewed 10/2008) [ELLE02] Ellen, M (2002). Ask Yahoo Question: How does the abacus work? Is it still used today? Answered: August 2002. http://ask.yahoo.com/20020814.html (viewed 09/2008) [EMCE07] EMC Education Services (2007). Storage Technology Foundations: Participant Guide, Volume 1. pp. 17-67. [ERMO09] Entity-relationship model (2009). In Wikipedia, The Free Encyclopedia. http://en.wikipedia.org/w/index.php?title=Entity-relationship_model&oldid=278711952 (viewed 03/2009) [FARL09] Marc Farley. (2009). In SearchStorage.com: Block-Level versus File-Level. http://searchstorage.techtarget.com/expert/KnowledgebaseAnswer/0,289625,sid5_gci536960,00.html# (viewed 02/2009)
32
[GRAM09] Grammar (2009). In Wikipedia, The Free Encyclopedia. http://en.wikipedia.org/w/index.php?title=Grammar&oldid=280650792 (viewed 04/2009) [HABA04] Habraken, Joe (2004), Absolute Beginner’s Guide To: Networking. 4th Ed. Que Publishing. pp. 7-103. [IACI08] International Association for Computer Information Systems 2008 conference. http://www.iacis.org/web/call4pprs.html (viewed 04/2009) [IFAS08] Institute for Advanced Study (2008). In ias.org: von Neumann's Electronic Computer Project. http://www.ias.edu/spfeatures/john_von_neumann/electronic-computer-project (viewed 09/2008) [JFKL09] JFK Lancer (2009). President John Kennedy Latest News and Research: Presidential Limousine SS100X (HSCA Schematic). http://www.jfklancer.com/Limousine.html (viewed 03/2009) [JOHN97] Johnston, Stephan (1997). Bulletin of the Scientific Instrument Society: Making the Arithmometer Count. http://www.mhs.ox.ac.uk/staff/saj/arithmometer (viewed 09/2008) [JOVA08] Jovanovic, Vladan Dr. & Mirzoev, Timur Z Dr. (2008), Computer Science. MSc Storage Technologies Foundations, Georgia Southern University, May 2008. [KLAG08] Universitat Klagenfurt: Virtual Exhibition (2008). People behind Informatics: The History of Computer Storage. http://cs-exhibitions.uni-klu.ac.at/index.php?id=187 (viewed 10/2008) [KOPP02] Kopplin, John (2002). In Computer Science Lab: An Illustrated History of Computers Part 2. http://computersciencelab.com/ComputerHistory/HistoryPt2.htm (viewed 09/2008) [KOST05] Kostka, Tim (2005). Discovering the Arithmometer: A glance back at the history of computing machines. http://www.cis.cornell.edu/boom/2005/ProjectArchive/arithometer/index.html (viewed 09/2008) [LONG06] James Long. (2006). Storage Networking Protocol Fundamentals: a comparative analysis of Ethernet, TCP/IP, and Fibre Channel in the context of SCSI. Cisco Press, Inc. pp. 10-20. [LOWE05] Lowe, Doug (2005), Networking: All-In-One Desk Reference for Dummies. 2nd Ed. Wiley Publishing, Incorporated. pp. 9-58. [MERR08] Merriam Webster Online (2008). Merriam-Webster, Incorporated http://www.merriam-webster.com/dictionary/quantify (viewed 09/2008) [META09] metamodel.com (2009). What is metamodeling? http://www.metamodel.com/staticpages/index.php?page=20021010231056977 (viewed 03/2009)

33
[METM09] Metamodeling (2009). In Wikipedia, The Free Encyclopedia. http://en.wikipedia.org/w/index.php?title=Metamodeling&oldid=279977993 (viewed 03/2009) [MEYE08] Meyers, Jeremy (2008), ? A Short History of the Computer?. http://www.softlord.com/comp (viewed 09/2008) [MICR07] Microsoft Office Project Conference 2007 EMEA. Madird, Spain, 3 – 5 December, 2007. http://www.microsoft.com/europe/msprojectconference (viewed 04/2009) [MICR09] Microsoft Visio. (2009). In Wikipedia, The Free Encyclopedia. http://en.wikipedia.org/w/index.php?title=Microsoft_Visio&oldid=269840527 (viewed 02/2009) [MEUL06] Mueller, Scott (2006). Upgrading and Repairing PCs. Que Publishing. pp. 1360-1418. [MUTH05] Muth, Thomas G. (2005). Functional Structures in Networks. Springer. pp. 1-46. [NATI08] Nation Master (2008). NationMaster.com: Encyclopedia > Samuel Morland. http://www.nationmaster.com/encyclopedia/Samuel-Morland (viewed 09/2008) [NETD08] Network Diagram. (2008). In Wikipedia, The Free Encyclopedia. http://en.wikipedia.org/w/index.php?title=Network_diagram&oldid=252479886 (viewed 12/2008) [NORT09] Northbridge (computing). (2009). In Wikipedia, The Free Encyclopedia. http://en.wikipedia.org/w/index.php?title=Northbridge (computing)&oldid=275013980 (viewed 03/2009) [PENN08] Penn Engineering (2008). The ENIAC Museum Online. http://www.seas.upenn.edu/~museum/ (viewed 09/2008) [PETE04] Peter, Ian (2004). History of the Internet. The Internet History Project 2004. http://www.nethistory.info/index.html (viewed 09/2008) [RECK08] Wikipedia (2008). Stepped Reckoner: From Wikipedia, the free encyclopedia http://en.wikipedia.org/wiki/Stepped_Reckoner (viewed 09/2008) [SAKH09] Sakharov, Alex (2009). "Formal Language." From MathWorld--A Wolfram Web Resource, created by Eric W. Weisstein. http://mathworld.wolfram.com/FormalLanguage.html (viewed 03/2009) [SIGI08] SIGITE 2008 Conference. October 16-18, Cincinnati, OH. IT Department Chairs Forum, October 15 & Workshops, October 18. Hosted by: University of Cincinnati Department of Information Technology. http://joomla.sigite.org/index.php?option=com_content&task=view&id=12&Itemid=1 (viewed 04/2009)

34
[SOUT09] Southbridge (computing). (2009). In Wikipedia, The Free Encyclopedia. http://en.wikipedia.org/w/index.php?title=Southbridge_(computing)&oldid=272621298 (viewed 03/2009) [STAL06] Stallings, William (2006). Computer Organization & Architecture: Designing for Performance. 7th Ed. Pearson Education, Incorporated. pp. 17-48. [STEI00] Steinke, Steve (2000), Network Tutorial: A Complete Introduction to Networks. CMP Books. pp. 219-294. [STOR08] Storage Review (2008). Reference Guide - Hard Disk Drives. http://www.storagereview.com/guide2000/ref/hdd/index.html (viewed 10/2008) [TECH08] TechTarget (2008), Data Storage Technology and Management. http://searchstorage.techtarget.com (viewed 07/2008). [TRAN08] The Transistor (2008). In NobelPrize.org: The Transistor in a Century of Electronics. http://nobelprize.org/educational_games/physics/transistor/history. (viewed 09/2008) [VACC02] John Vacca (2002). The Essential Guide to Storage Area Networks. Prentice Hall PTR. [VEYG08] Gary, Vey (2008). The Mysterious Antikythera Mechanism: An Ancient Computer? http://www.mondovista.com/firstcomputer.html (viewed 10/2008) [VIRT08] Computer History Museum: Virtual Exhibition (2008). Visible Storage: Samples from the Collection (How Williams Tube Memory Works). http://www.computerhistory.org/virtualvisiblestorage/artifact_frame.php?tax_id=02.03.02.00 (viewed 10/2008) [WEBS05] V. Nichols (2005) Webster’s Pocket Dictionary and Thesaurus. Allied Publishing Group, Incorporated. pp. 229. [WHIT05] White, Thom (2005). Citizine Research: RFK Assassination Far From Resolved (Diagram of crime scene). www.citizinemag.com/politics/politics_0506_rfk_twhite.htm (viewed 03/2009) [WILS09] Tracy V. Wilson and Ryan Johnson. (2009). In howstuffworks.com: How Motherboards Work. http://computer.howstuffworks.com/motherboard.htm (viewed 02/2009) [YOUN04] Young, E.A. (2004). The Abacus: A History http://fenris.net/~lizyoung/abacus.html (viewed 09/2008)

35
APPENDIX
Figure 14: Visio Stencil image (SANDS stencil).