standard practice: estimating the of coordinated...
TRANSCRIPT
ORNUCON-390
STANDARD PRACTICE:
OF COORDINATED DSM PROGRAMS ESTIMATING THE COST-EFFECTIVENESS
Lawrence J. Hill Marilyn A. Brown
Date Published: December 1994
Prepared for
New York State Energy Research and Development Authority New York State Department of State
North Carolina Department of Commerce Carolina Power and Light Company
Duke Power Company Consolidated Edison Company of New York
Niagara Mohawk Power Corporation U.S. Department of Energy
OAK RIDGE NATIONAL LABORATORY Oak Ridge, Tennessee 37831
Managed by MARTIN MARlElTA ENERGY SYSTEMS, INC.
for the U.S. DEPARTMENT OF ENERGY
under Contract No. DE-AC05-840R21400

c
DISCLAIMER
This report was prepared as an account of work sponsored by an agency of the United States Government. Neither the United States Government nor any agency thereof, nor any of their employees, make any warranty, express or implied, or assumes any legal liability or responsibility for the accuracy, completeness, or usefulness of any information, apparatus, product, or process disclosed, or represents that its use would not infringe privately owned rights. Reference herein to any specific commercial product, process, or service by trade name, trademark, manufacturer, or otherwise does not necessarily constitute or imply its endorsement, recommendation, or favoring by the United States Government or any agency thereof. The views and opinions of authors expressed herein do not necessarily state or reflect those of the United States Government or any agency thereof.

DISCLAIMER
Portions of this document may be illegible in electronic image products. Images are produced from the best available original document.
CONTENTS
LIST OF FIGURES AND TABLES . . . . . . . . . . . . . . . . . . . . . . . . . . . . . . v
ACKNOWLEDGMENTS . . . . . . . . . . . . . . . . . . . . . . . . . . . . . . . . . . . . . vii
SUMMARY . . . . . . . . . . . . . . . . . . . . . . . . . . . . . . . . . . . . . . . . . . . . . . ix
1 . IMPORTANT ISSUES IN DETERMINING COST-EFFECTIVENESS . . . 1.1 1 . 1. Issues for Coordinated Programs in General . . . . . . . . . . . . . . . 1.1 1.2. Issues for Low-Income Programs in Particular . . . . . . . . . . . . . . 1.2
2 . USING THE TESTS IN PRACTICE . . . . . . . . . . . . . . . . . . . . . . . . . . . 2.1 2.1. An Overview . . . . . . . . . . . . . . . . . . . . . . . . . . . . . . . . . . . . . . 2.1 2.2. The Inclusive Test in More Detail . . . . . . . . . . . . . . . . . . . . . . . . 2.3 2.3. The Incremental Test in More Detail . . . . . . . . . . . . . . . . . . . . . 2.5
3 . DEFINING COORDINATED PROGRAMS . . . . . . . . . . . . . . . . . . . . . . 3.1 3.1. Types of Coordinated Programs . . . . . . . . . . . . . . . . . . . . . . . . 3.1 3.2. Data Collection and Analysis . . . . . . . . . . . . . . . . . . . . . . . . . . . 3.4
4 . PERSPECTIVES FROM WHICH TO VIEW COST-EFFECTIVENESS . . 4.1 4.1. A Hypothetical Example . . . . . . . . . . . . . . . . . . . . . . . . . . . . . . 4.1 4.2. Total Resource Perspective . . . . . . . . . . . . . . . . . . . . . . . . . . . 4.3 4.3. Participant Perspective . . . . . . . . . . . . . . . . . . . . . . . . . . . . . . . 4.4 4.4. Non-Participant Perspective . . . . . . . . . . . . . . . . . . . . . . . . . . . 4.6 4.5. Utility Perspective . . . . . . . . . . . . . . . . . . . . . . . . . . . . . . . . . . . 4.8 4.6. Societal Perspective . . . . . . . . . . . . . . . . . . . . . . . . . . . . . . . . . 4.10
5 . SYNTHESIS . . . . . . . . . . . . . . . . . . . . . . . . . . . . . . . . . . . . . . . . . . . 5.1
APPENDIX A: FRAMEWORK FOR ANALYSIS . . . . . . . . . . . . . . . . . . . . . A.l A.l. What is Cost-Effectiveness? . . . . . . . . . . . . . . . . . . . . . . . . . . . A.l A.2. An Economic Approach . . . . . . . . . . . . . . . . . . . . . . . . . . . . . . A.2 A.3. A Financial Paradigm . . . . . . . . . . . . . . . . . . . . . . . . . . . . . . . . A.6
A.3.1. Inclusive Test . . . . . . . . . . . . . . . . . . . . . . . . . . . . . . . . . A.6 A.3.2. Incremental Test . . . . . . . . . . . . . . . . . . . . . . . . . . . . . . . A.6
APPENDIX B: CALCULATION OF SAMPLE RESULTS . . . . . . . . . . . . . . . B.l
iii


LIST OF FIGURES AND TABLES
Figure Description Page
2.1 Suggested Use of Inclusive and Incremental Tests, Coordinated DSM Programs . . . . . . . . . . . . . . . . . . . . . . . . .
Break-Even Analysis, Inclusive Test under Total Resource Perspective . . . . . . . . . . . . . . . . . . . . . . . . . . . . . .
Examples of Energy and Capacity Savings Relationships . . . .
Energy and Capacity Savings, Before and After Utility Involvement . . . . . . . . . . . . . . . . . . . . . . . . . . . . . . . . . . . . .
Break-Even Analysis, Incremental Test under Total Resource Perspective . . . . . . . . . . . . . . . . . . . . . . . . . . . . . .
Three Types of Coordinated DSM Programs . . . . . . . . . . . . .
2.2
2.3
2.4
2.5
3.1
2.2
2.4
2.6
2.7
2.9
3.2
Table Description Page
4.1 Hypothetical Coordinated, Low-Income Electric Program . . . . 4.2
4.2 Benefit and Cost Categories, Total Resource Perspective . . . 4.4
4.3 4.4
4.4 Benefit and Cost Categories, Participant Perspective . . . . . . . 4.5
4.5 4.6
4.6 Benefit and Cost Categories, Non-Participant Perspective . . . 4.7
Sample Results, Total Resource Perspective . . . . . . . . . . . . .
Sample Results, Participant Perspective . . . . . . . . . . . . . . . .
V
LIST OF FIGURES AND TABLES (CONT.)
Table Description Page
4.7
4.8
4.9
4.1 0
4.1 1
Sample Results. Non-Participant Perspective . . . . . . . . . . . . . 4.8
Benefit and Cost Categories. Utility Perspective . . . . . . . . . . . 4.9
Sample Results. Utility Perspective . . . . . . . . . . . . . . . . . . . . 4.9
Benefit and Cost Categories. Societal Perspective . . . . . . . . . 4.10
Sample Results. Societal Perspective . . . . . . . . . . . . . . . . . . 4.12
vi

ACKNOWLEDGMENTS
This manual is a companion to an earlier, in-depth study on coordinated, low- income demand-side management programs entitled Low-Income DSMPrograms: The Cost-Effectiveness of Coordinated Partnerships, Oak Ridge National Laboratory, Oak Ridge, Tennessee, ORNUCON-375, May 1994. Both are collaborative efforts between the states of New York and North Carolina, with cosponsorship from the New York State Energy Research and Development Authority (Energy Authority), the North Carolina Department of Commerce, the New York State Department of State, the U.S. Department of Energy (DOE), Carolina Power and Light Company, Duke Power Company, Consolidated Edison Company of New York, and Niagara Mohawk Power Corporation. Norine Karins of the Energy Authority was project coordinator and provided valuable guidance and oversight. Rick Gerardi (NY) and Jeff Brown (NC) provided the inspiration for this project.
Guidance throughout the course of the project was provided by the Project Advisory Committee, appointed by the cosponsors. Members of the committee include Norine Karins (Energy Authority); Pat Sweeney and Rick Gerardi (New York State Department of State); Jeff Brown and Carson Culbreth (North Carolina Department of Commerce); Paul DeCotis (New York State Energy Office); Steve Pertusiello (Consolidated Edison Company of New York) ; Charles Brennan (Public Utility Law Project of New York); Meiissa Piper (Niagara Mohawk Power Corporation); Jeanne Van Vlandren (DOE); Dennis Nightingale and Allyson Duncan (North Carolina Utilities Commission); Julius Wright (formerly with the North Carolina Utilities Commission); Bob Weiss (North Carolina Alternative Energy Corporation); Ed Ernst (Duke Power Company); David Nevi1 (Carolina Power and Light Company); and Sam Swanson, Lynn Bradley, and Jim Gallagher (New York State Public Service Commission).
A Peer Review Panel also provided guidance and reviewed a draft version of the document. The panel includes Paul Berkowitz of the Wisconsin Energy Conservation Corporation, Julius Wright, formerly of the North Carolina Utilities Commission, Mary Ellen Hopkins of Pacific Northwest Laboratories, Frank Congedo of Central Hudson Gas and Electric, and John Neufeld of the University of North Carolina at Greensboro.
However, the conclusions and recommendations in the manual are not universally accepted by all members of the Project Advisory Committee and Peer Review Panel.
vi i

SUMMARY
The purpose of this document is to describe and illustrate a methodology for estimating the cost-effectiveness of coordinated demand-side management (DSM) programs, extending California "standard practice"' to address the special evaluation challenges arising from these programs. A coordinated DSM program is one that is co-administered by a state or local government agency and a gas or electric utility. Although the primary subject of this document is coordinated low-income programs, the principles are easily extended to estimating the cost- effectiveness of all coordinated programs.'
In the future, coordinated DSM programs are likely to increase in importance for two reasons. First, it is economically prudent for government agencies to leverage public conservation funds with those provided by electric and gas utilities in an environment of fiscal austerity. Two federal agencies have already created incentive programs to encourage such le~eraging.~ Second, as the electric power industry evolves from a vertically integrated regulated industry to a more competitive one, there may be increasing pressure for electric utilities to leverage DSM-program funds with those of government agencies. With leveraging, utilities can minimize the inflationary impact of their DSM programs on electric rates.
The manual addresses six important topics:
Tvpes of Coordinated Programs and Data Collection Requirements. We identify three types of coordinated DSM programs: (1) parallel, (2) supplemental, and (3) coupled. A parallel program is one in which a government agency runs two programs, one funded and designed by the agency and a parallel one funded and designed by an electric or gas utility. A supplemental Procaram relies on utility funding to support a government agency's ongoing program, with no changes in the program's design or operation. A coupled program is one in which a government agency and electric or gas utility jointly fund, design, and implement
'California Public Utilities Commission and California Energy Commission, Standard Practice Manual: Economic Analysis of Demand-Side Management Programs, December 1 987.
?he problems in estimating the cost-effectiveness of coordinated, low-income DSM programs are addressed in depth in: Marilyn A. Brown and Lawrence J. Hill, Low-Income DSM Programs: The Cost-Effectiveness of Coordinated Partnerships, Oak Ridge National Laboratory, Oak Ridge, Tennessee, ORNUCON-375, May 1994.
?he U.S. Department of Energy and the U.S. Department of Health and Human Services.
ix
a DSM program. The data required to estimate the cost-effectiveness of each of these types of programs differs.
Sunnested Inclusive and Incremental Tests. Because of the importance of isolating the financial effects of a coordinated program on an electric or gas utility's financial position, we distinguish between the benefits and costs attributable to the utility's investment in the program ("incremental test") and the total benefits and costs of the program ("inclusive test").
w Sunaested Tests in Practice. We illustrate use of the inclusive and incremental tests with a hypothetical, coordinated electric program. The results are easily extended to natural gas programs. We also address differences in estimating the cost-effectiveness of electric and natural gas coordinated programs, especially the problems of estimating avoided capacity costs for natural gas utilities and differences in the treatment of environmental externalities. Dealing with these issues is jurisdictional, depending on policies established by state commissions.
Five Perspectives in Detail. We discuss in detail the five perspectives from which cost-effectiveness can be measured. The perspectives include (1) total program costs, which reflect participants and non-participants benefits and costs (total resource perspective); (2) participants in the program (participant perspective); (3) non-participants in the program (non-participant perspective); (4) utility (utility perspective); and (5) cost-effectiveness from the standpoint of society (societal perspective). The discussion of these perspectives includes their definition, categories of benefits and costs, caveats in their use, expression of results, and sample results from a hypothetical program.
Treatment of Government Expenditures. An important consideration in estimating the cost-effectiveness of a coordinated program is the treatment of government funds. We recommend different treatments depending upon the level of government from which the funding originates. If the expenditure of government funds is distantly related to the determination of a utility's rates (as when a DSM program is co-funded by the federal government and an investor-owned utility), there is no justification for including government expenditures as non-participant costs. If government funding comes from the utility's service territory (as when a DSM program is co-funded by a municipality and a municipally owned utility), the government expenditures should be included as non-participant costs.
Economic vs. Financial Analvsis. We address special problems in applying California standard practice to estimate the cost-effectiveness of coordinated DSM
X

programs. Because California standard practice is based on financial, least-cost principles, our approach follows accordingly. However, we also discuss how this financial approach can be extended to an economic one.
The discussion throughout emphasizes conceptual underpinnings rather than algebraic rigor. We assume that readers are familiar with the calculation of such variables as net present value, life-cycle costs, and benefit-cost ratios, and, therefore, do not derive them in this document.
xi
1. IMPORTANT ISSUES IN DETERMINING COST-EFFECTNENESS
In this document, we do not attempt to retrace all of the generally accepted principles laid for estimating the cost-effectiveness of DSM programs by California standard practice.' Rather, we emphasize areas in which coordinated programs are different from typical utility-run programs under the five perspectives established by the California manual:
total resource perspective, participant perspective, non-participant perspective, utility perspective, and societal perspective.
In the remainder of this chapter, we identify features of coordinated DSM programs that distinguish them from typical DSM programs, and then identify features of coordinated low-income DSM programs that further distinguish them from typical coordinated programs in Section 1.2. In the remainder of the document, we embellish these distinctions.
In Section 2, we suggest how coordinated programs should be conceived and assessed in practice. In Section 3, we discuss the three types of coordinated programs in detail--i.e., parallel, supplemental, and coupled programs--and suggest the types of data that should be collected to define and assess these programs. In Section 4, we discuss how cost-effectiveness should be estimated under the five perspectives identified in California standard practice, emphasizing how the special features of coordinated programs impinge on the calculation of these estimates. In the same vein in Appendix A, we extend the financial least-cost assessment framework of California standard practice to an economic one. In Appendix B, we present the results of a sample calculation.
1 -1. ISSUES FOR COORDINATED PROGRAMS IN GENERAL
Treatment of government expenditures. Similar to California standard practice, we distinguish between social benefits and costs as they affect society at large and
California Public Utilities Commission and California Energy Commission, Standard Practice 1
Manual: Economic Analysis of Demand-Side Management Programs, December 1 987.
1.1
private benefits and costs as they affect an individual electric or gas utility. In this manual, we are concerned primarily with private benefits and costs.
Therefore, an important consideration in estimating the cost-effectiveness of a coordinated low-income program from the standpoint of an individual utiliw is the level of government from which the funding originates. If the expenditure of government funds is distantly related to the determination of a utility’s rates, there is no justification for including government expenditures as part of the non- participant costs of the programs. The reason is both pragmatic and conceptual: the expenditure of government funds has little bearing on the costs and rates of an individual utility. As an example, in evaluating the cost-effectiveness of a DSM program co-funded by the federal government and an investor-owned utilitv, we argue that the benefits arising from the federal government’s portion of total program costs should be included as part of the program’s total benefits, but the government’s expenditures should not be included as part of the program’s total costs. In essence, then, the government’s expenditure in the co-funded program can be viewed as a subsidy to the investor-owned utility for running the DSM program.
However, the justification for including government expenditures as costs for non- participants increases as the level of government funding comes closer to a utility’s service territory. At the extreme, a municipality’s funds expended on a coordinated program with a utility owned by that municipality should be treated as “costs” in the non-participants test. The reason is that the municipality’s expenditure of funds for a low-income program could affect the rates of the municipally owned utility.
Distinction between program (inclusive) and utility (incremental) cost-effectiveness. For an investor-owned utility running a coordinated program using federal funds, excluding the government’s expenditures from the program’s total costs is inconsequential in determining the program’s cost-effectiveness because the government’s expenditures are not part of the utility’s costs for the incremental test. And, the incremental test should be the basis for deciding whether or not the program is cost-effective from the standpoint of the utility.
In two cases, however, there is no distinction between the inclusive and incremental tests: (1) a parallel coordinated program; and (2) a totally leveraged program. A parallel program is one in which a government agency runs two programs, one funded and designed by the agency and the other funded and designed by an electric or gas utility. In this case, the total amount of energy and
1.2
capacity savings associated with the utility-funded program--but not the separate government-funded parallel program--are allocated to the utility. A totallv leveraqed program is one in which a government agency’s participation in the program is contingent on participation by an electric or gas utility. That is, if the utility does not expend funds for the program, the government agency also does not, and the utility’s customers will not have this particular DSM program available to them. In this case, the total amount of energy and capacity savings resulting from both the utility’s and government’s expenditures should be allocated to the utility’s investment in the coordinated program in the incremental test.
Allocation of energy and capacity savings among cosponsors. Parallel and totally leveraged programs underscore the importance of allocating energy and capacity savings properly to funders of the program. In determining the energy and capacity savings to be allocated to a utility’s investment in a coordinated program, it may be important to consider whether or not the program is an existinq one or a one for new clients. For the former, increasing, decreasing, and proportional returns are important considerations. For the latter, program design and leveraging of funds are usually important.
Electric vs. Gas Utilities. In theory, the principles discussed in this manual apply to gas utilities as well as electric ones. However, in practice, there are a number of pragmatic issues that are resolved on a utility-by-utility or state-by-state basis. For one, the avoided cgpacity costs of running a coordinated natural gas program may be difficult--if not impossible--to estimate in practice. Obtaining estimates of these benefits are not handled uniformly throughout the country. Second, the treatment of environmental externalities for coordinated electric and gas programs may be different across states.
1.2. ISSUES FOR LOW-INCOME PROGRAMS IN PARTICULAR
If the participants of a coordinated program are low-income households, other issues arise that are important in estimating cost-effectiveness.
Benefits to Participants. The benefits of coordinated low-income programs to participants typically are different from those obtained by participants in other utility-run, DSM programs. Instead of paying cash incentives to customers to purchase energy-eff icient durable equipment, the typical low-income program involves a payment in kind such as direct installation of new furnaces and
1.3
insulation. Besides energy-related benefits (e.g., lower gas or electric bills), these in-kind payments may also result in other types of benefits to participants (e.g., higher housing values and safer heating systems). In estimating cost- effectiveness, it is important to identify the types of participant benefits for which the tests are being applied. For example, if energy benefits are the only benefits to be measured, the annual "flow" of energy savings from the in-kind payments are the most appropriate measure of participant benefits. Participant benefits must be carefully defined to avoid double counting.
Costs to Participants. For participants in a typical low-income DSM program, out- of-pocket expenditures for materials or capital items typically are not required. However, as with most DSM programs, an expenditure of time is required to accommodate the installation of DSM measures. In estimating cost-effectiveness, the analyst can impute a cost for participants' time to use in the participant and total resource perspectives. In real-world applications, however, imputing a cost for a participant's time associated with a low-income DSM program should be consistent with the practice used for participants' time in other DSM programs. If costs are imputed for the time spent by participants in other DSM programs, they should be imputed for low-income ones. If not imputed for others, they should not be imputed for low-income programs. The same argument is applicable to imputing benefits: if they are estimated for other types of DSM programs, they should be estimated for low-income ones.
Arrearage Reduction. Arrearage reductions from running a low-income DSM program result in estimable cash-flow savings to a utility. For a utility, the savings are not the increased bill collections from low-income households. Rather, they are the cash-flow savings from efficiency improvements in administering service for low-income customers--e.g., reduced bill-collection expenses and lower costs associated with the termination and re-connection of services. Although available evidence suggests a wide range of possibilities for the value of the induced benefits of arrearage reductions across the country, individual utilities can estimate the amount through billing analysis. We recommend that the value of these efficiency savings be included as part of the benefits of running a low-income DSM program. They should be treated the same as the program's avoided energy and capacity costs.
1.4
2. USING THE TESTS IN PRACTICE
2.1. AN OVERVIEW
The suggested least-cost tests for determining the cost-effectiveness of coordinated programs are discussed in detail in Appendix A. The tests distinguish between the inclusive effects of the coordinated program and their incremental effects. The inclusive test includes all of the benefits of the coordinated program, those attributable to both the government and the utility. It also includes all of the costs that are relevant to the utility’s service territory-which may or may not include the government’s expenditures on the program. The incremental test includes only the benefits and costs attributable to the utility’s contribution to the program. It is the most important test because the results can be properly compared with the utility’s other investment opportunities.
In Figure 2.1, we suggest how the tests should be used in practice. For most state commissions, the most important perspective from which to view the cost- effectiveness of a DSM program is the total resource perspective. That is the perspective we suggest as the most important in Figure 2.1 .‘ From Figure 2.1, break-even analysis for the inclusive test should be used to screen for cost-effective opportunities. To conduct a break-even analysis, the analyst must have an estimate of the total benefits of the program and its total costs. The reason is that break-even analysis under the inclusive test maps the total benefits of the program and the amount of expenditures made by the utility under varying assumptions about the utility’s proportion of funding for the program from 0 to 100 percent. This type of analysis bounds the problem, indicatina if there is anv percentaae of utilitv investment in the program that makes the proaram cost-effective for the utilitv.
If the benefit-cost ratio does not exceed 1 .O for any portion of a utility’s investment in the program from the total resource perspective, the program should be dropped from consideration. The reason is that there is no allocation of savings from the program--Le., the benefits of running the program-that would make it cost-effective from the standpoint of the utility. If the ratio exceeds 1.0 for any
’If customer costs are not included in the cost-effectiveness calculus, the total resource and utility perspectives are identical. This is likely to be the case for most low-income coordinated programs in which customer costs must be imputed.
2.1
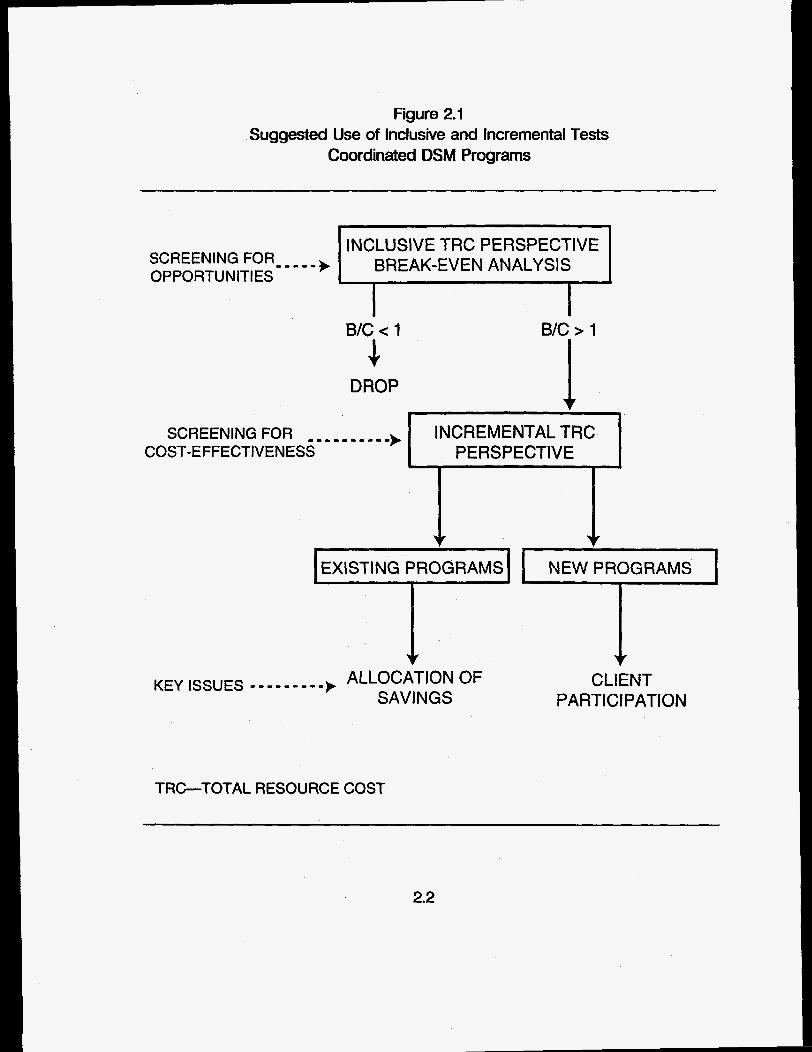
Figure 2.1 Suggested Use of Inclusive and Incremental Tests
Coordinated DSM Programs
INCLUSIVE TRC PERSPECTIVE BREAK-EVEN ANALYSIS SCREENING FOR- - - -
OPPORTUN IT1 ES
B/C c 1 .1
DROP
B/C > 1
i I SCREENING FOR I I I _ _ I I INCREMENTAL TRC
COST-EFFECTIVENESS PERSPECTIVE
KEY ISSUES
EXISTING PROGRAMS
-I- 1 - - - - - - - - - ALLOCATION OF ’ SAVINGS
CLIENT PARTlCl PATlON
TRC-TOTAL RESOURCE COST
2.2
percentage of a utility’s program-cost contribution, the program should be screened for cost-effectiveness using the incremental test.
Oftentimes, the most difficult problem in estimating incremental cost-effectiveness is to quantify the amount of benefits that should be apportioned to the utility’s investment in the program--Le., its allocated share of the program’s energy and capacity savings. In this regard, when using the incremental test, an important distinction must be made between existing coordinated programs and new ones with new client participation.
For existina coordinated Proarams, a key question is: does a utility’s incremental investment in a program for existing customers or clients result in decreasing, proportional, or increasing savings? The answer to that question depends on the features of the program and varies from one program to another.
Using the incremental test for new coordinated proarams with new clients raises a different set of questions in determining cost-effectiveness. A key consideration is the agreement between the government agency or its subgrantee and the utility on the scope of the coordinated program and how it will be administered. This agreement is crucial in determining the allocation of benefits to the utility and, hence, the incremental cost-effectiveness of the program to the utility. Should the allocated savings for a new program be proportional to the amount of the government’s and utility’s investment in the program? If the utility does not invest in it, will the program still be run by the government agency or its subgrantee?
At the extreme, if the program would not be run without a utility’s involvement, the utility’s investment can be considered “totally leveraged” and, in determining the cost-effectiveness of the program, the utility should be allocated all of the energy and capacity savings. Again, in practice, resolution of these issues depends on specific features of individual programs and must be resolved on a case-by-case basis.
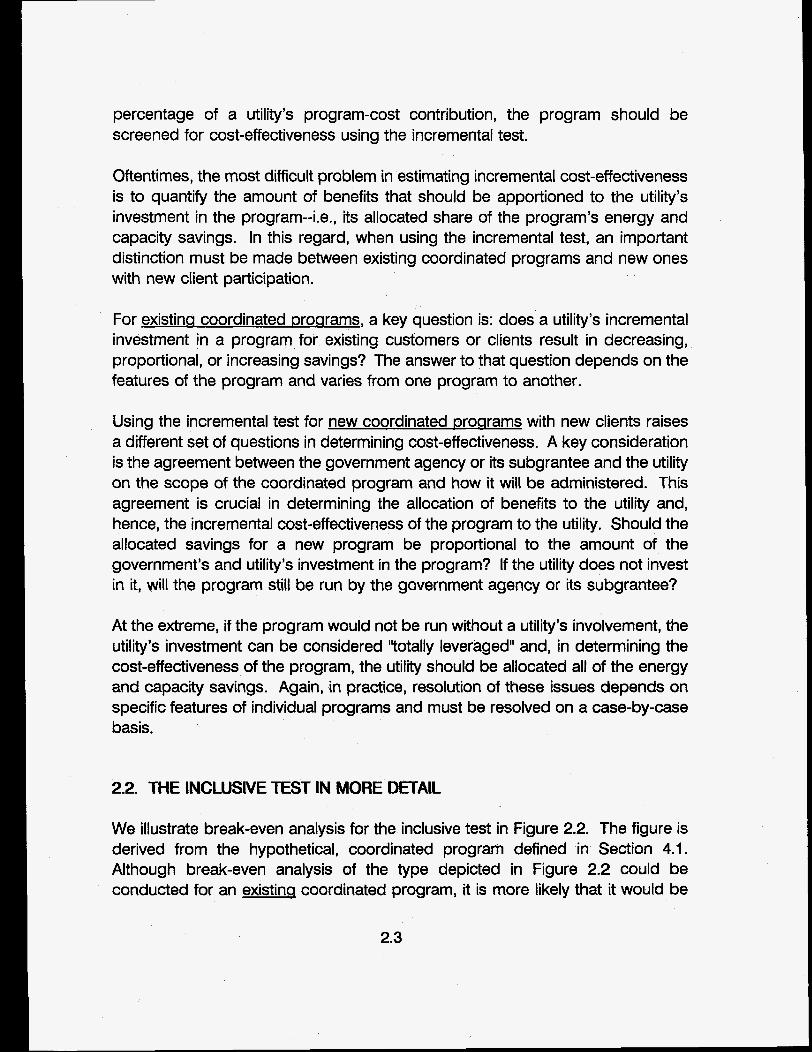
2.2. THE INCLUSIVE TEST IN MORE DETAIL
We illustrate break-even analysis for the inclusive test in Figure 2.2. The figure is derived from the hypothetical, coordinated program defined in Section 4.1. Although break-even analysis of the type depicted in Figure 2.2 could be conducted for an existinq coordinated program, it is more likely that it would be
2.3
conducted for a program.
Figure 22 Break-Even Analysis
Inclusive Test under Total Resource Perspective
3.0
0 F a 2.0 U I--
0 II. ii
m
8
g 1.0 w
0
TOTAL AVOIDED COSTS $8,154 ARREARAGE REDUCTION $1,000 TOTAL PROGRAM COSTS $ t98,000 IMPUTED PARTICIPANT COSTS $ 0 DISCOUNT RATE 6%
I I I I I
0 20 40 60 80 100 UTILITY’S PROGRAM CONTRIBUTION (%)
The curve in Figure 2.2 depicts the relationship between the benefit-cost ratios of the hypothetical program under various assumptions about the utility’s percentage contribution to the total program costs. In this calculation, the total benefits of the program are included for each assumed portion of the utility’s funding. As such,
2.4

the analysis represents the most favorable circumstances for the electric or gas utility. If the benefit-cost ratio does not exceed 1 .O for any percentage of a utility’s investment across the horizontal axis, the program should not be considered further. If it does exceed 1 .O, it should be considered further using our suggested incremental analysis.
From Figure 2.2, any utility investment in the program beyond 56 percent results in a benefit-cost ratio less than 1.0. Therefore, if a utility invests more than 56 percent in the program, there is no way in which the program can be cost-effective for the utility under the total resource perspective, even if the utility is allocated all of the program’s benefits for the incremental test. If the utility accounts for less than 56 percent of the the programs’ total costs, there is some allocation of benefits that will result in a benefit-cost ratio exceeding 1 .O from an incremental standpoint. Therefore, the program depicted in Figure 2.2 should be screened further using the incremental test.
2.3. THE INCREMENTAL TEST IN MORE DETAIL
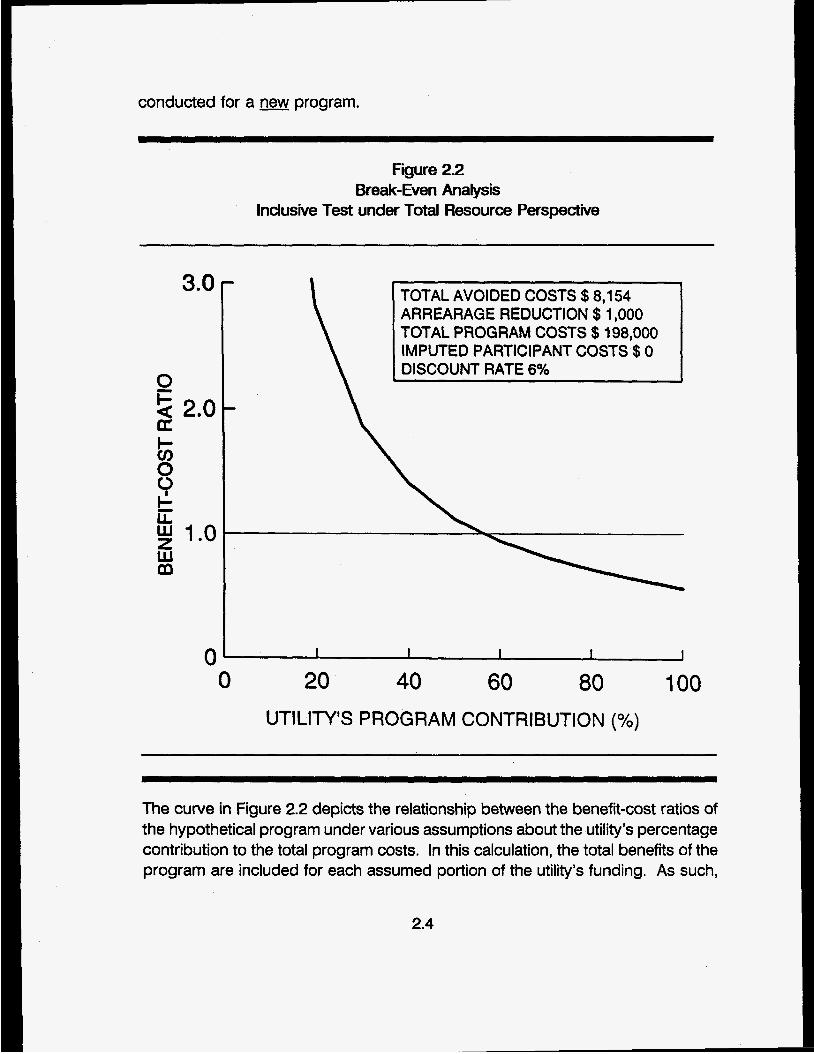
The incremental test measures the cost-effectiveness of the program from the standpoint of the utility exclusively. The most important challenge associated with implementing this test is to estimate accurately the amount of savings attributable to the utility’s investment in the program. For an existina oroaram, different relationships exist between a utility’s program funding and the amount of savings induced by that funding. We illustrate four of these in Figure 2.3.
The top two relationships between energy savings and program funding illustrate increasing (upper left) and decreasing (upper right) returns to funding. That is, in the increasing returns case, each dollar of funding results in greater energy savings. For the decreasing returns case, each dollar of funding results in less energy savings.
The lower left relationship is a combination of the upper two, providing a logistic relationship between funding and savings. It reflects the existence of start-up costs, which result in an initially slow growth in energy savings, followed by a range of accelerated savings in which each additional dollar expended results in increasing energy savings. Finally, at some critical point, program funding switches from increasing to decreasing returns.
2.5
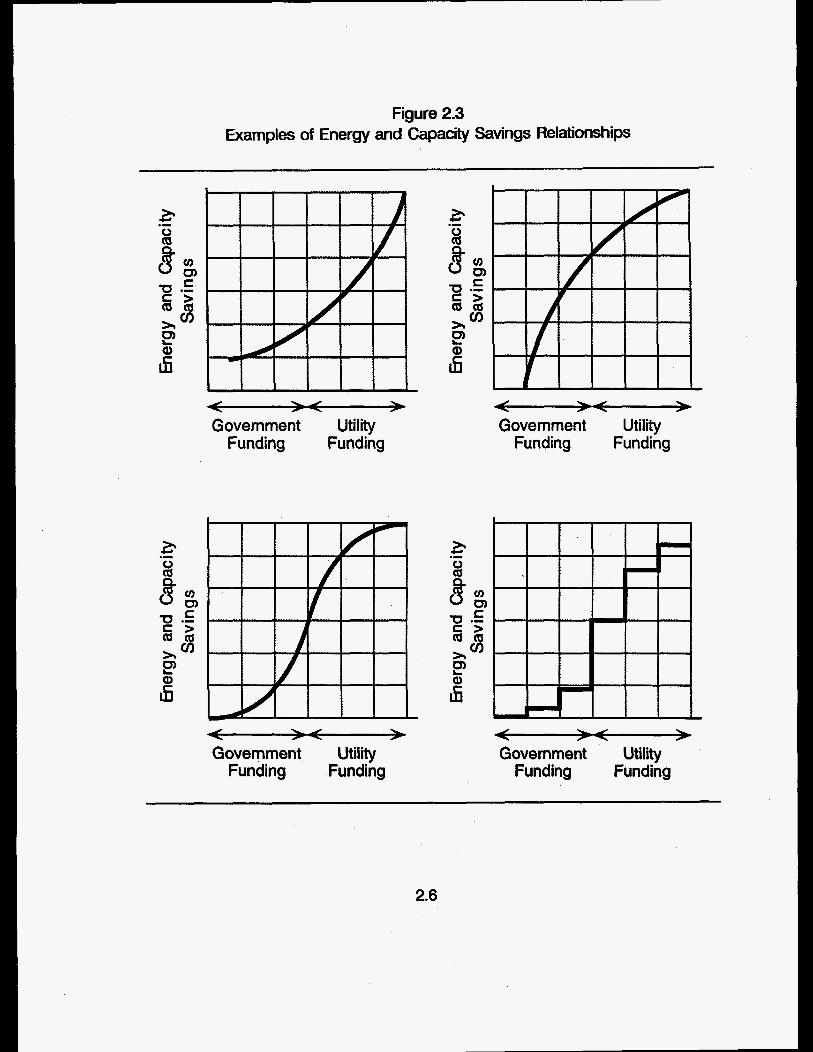
Figure 2.3 Examples of Energy and Capacity Savings Relationships
Government Utility Funding Funding
< > Government Utility
Funding Funding
4 > Government Utility
Funding Funding
.- E
< > Government Utility
Funding Funding
2.6
The lower right diagram in Figure 2.3 is a step function relationship. This type of relationship between energy savings and funding indicates that some critical conservation measure results in a dramatic amount of savings. An example is the installation of a high-eff iciency furnace, which often generates dramatic savings but is too expensive for many agencies to install without other funding sources.
In practice, of course, different programs result in different relationships between funding and energy savings. And, in some cases, the same program run by different combinations of government agencieslutilities may result in different savings patterns. For example, the involvement of a utility in the operation of a local agency’s weatherization program may cause the expenditure of government resources to generate greater energy and capacity savings. This could occur as the result of (1) stricter investment criteria, (2) a greater focus on energy conservation and less on health and safety, or (3) the selection of clients with a greater potential for savings. We illustrate these relationships in Figure 2.4.
Figure 2.4 Energy and Capacity Savings
Before and After U t i l i Involvement
Government Funding
Before
; Government Utility
Funding Funding After
2.7

Lacking a thorough program evaluation, the assumption made about the relationship between funding and energy savings is crucial in estimating the cost- effectiveness of low-income DSM programs co-administered by electric or gas utilities. Assuming a linear relationship for an incremental contribution to an existing government-run program, for example, may make the low-income program seem more or less attractive to a utility than it is in reality.
We illustrate the importance of this allocation in Figure 2.5 which shows the incremental benefit-cost ratio under different assumptions about the percentage savings allocation to the utility, given that the utility funds 33 percent of total program costs. The data are based on the hypothetical coordinated program defined in Section 4.1.
From Figure 2.5, if the allocation of savings to the utility were proportional to its 33 percent investment in the program, the incremental benefit-cost ratio is 0.56. Therefore, the program is cost-ineffective from the standpoint of the utility. In fact, any savings allocation less than 60 percent results in cost-ineffectiveness from the standpoint of the total resource perspective.
The simple assumption is that savings are proportional to the expenditures of each of the co-funders--i.e., a third of the total funding induces a third of the savings, a half induces a half, and so forth. And, in designing a new Droaram, that may be the best initial assumption.
However, there is a limiting case that must be considered in evaluating the cost- effectiveness of new programs. The limiting case is one in which the program is totally leveraged. That is, if a utility does not invest in the program, the program will not be undertaken, or it will not serve the utility’s customers. The utility is allocated all of the benefits of the program and the inclusive and incremental tests yield the same result. In this case, the inclusive test results depicted in Figure 2.1 are the same as the incremental results.
2.8
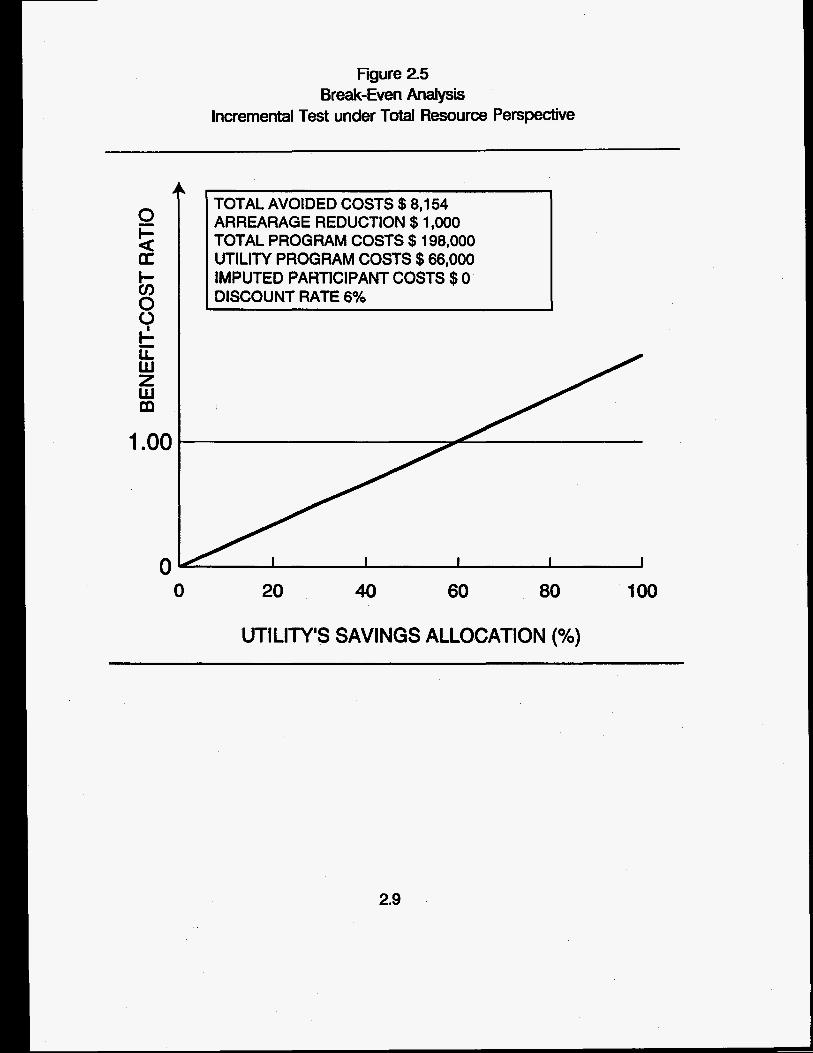
Figure 2.5 Break-Even Analysis
Incremental Test under Total Resource Perspective
0 F= a U I- C / ) 0 0 & iz W z W m
1 .oo
0
TOTAL AVOIDED COSTS $8,154 ARREARAGE REDUCTION $1,000 TOTAL PROGRAM COSTS $198,000 UTILITY PROGRAM COSTS $66,000 IMPUTED PARTICIPANT COSTS $0 DISCOUNT RATE 6%
0 20 40 60 80 100
UTILITY'S SAVINGS ALLOCATION ("/.)
2.9

3. DEFINING COORDINATED PROGRAMS
3.1. TYPES OF COORDINATED PROGRAMS
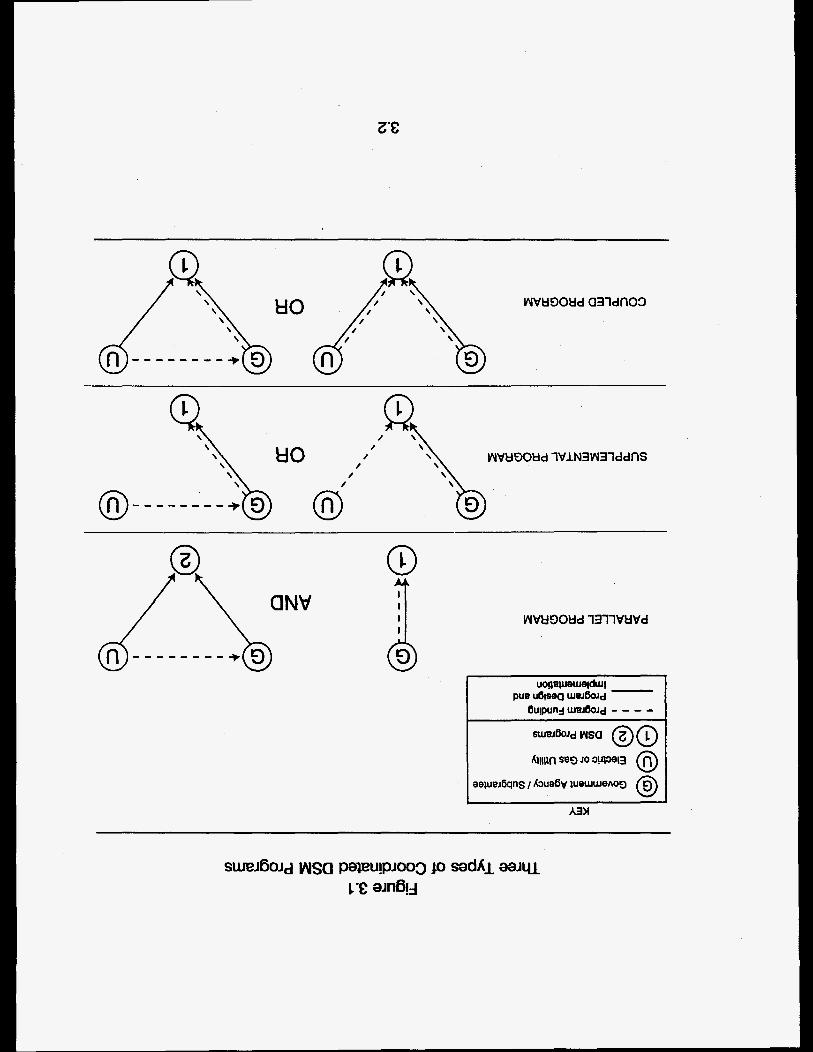
In Figure 3.1, we show the three types of coordinated DSM programs. As the legend indicates, the dashed lines indicate funding sources; the solid lines indicate responsibility for implementing the program. For the sake of clarity, we do not include all possible relationships between: (1) levels of government funding; (2) types of government agencies; and (3) government subgrantees in Figure 3.1. For example, depending on the type of program, the "GI' could signify the federal government, a state or local government agency, or a subgrantee of a government agency.
A parallel proclram is one in which a government agency runs two programs, one funded and designed by the agency (labelled "1" in Figure 3.1) and a parallel one funded and designed by an electric or gas utility (labelled "2" in Figure 3.1). The second program is implemented by the government agency, but its design is strongly influenced by the utility. Thus, it may differ significantly from the design of the agency-funded program. The utility-funded program is coordinated because some of the same staff and equipment are used in both programs. However, in estimating cost-effectiveness of a parallel program, the two programs are segregated and calculations proceed as if there were only the utility-run program.
A supplemental proclram relies on utility funding to support a government agency's ongoing program, with no changes in the program's design and operation. The result is that the DSM program is applied to more customers, is more comprehensive, or a combination of both. In Figure 3.1, we show the electric or gas utility's funding in two ways. First, the utility could make its contribution directly to the government agency running the program. Second, it could help finance portions of the program itself, such as purchasing equipment, materials, and the like. In both cases, however, the key is that the utility's funding does not alter the basic design or implementation of the program, with the exception of its scale.
A couded promam is one in which a government agency and electric or gas utility jointly fund, design, and implement a DSM program. This type of program is typically distinct from the agency's pre-existing government-funded program(s). In real-world applications, the possibilities for types of coupling are numerous. In Figure 3.1, we show two variants: one in which the utility provides funding to the
3.1
HO
8--- HO
aNv
6UlDUll4lUW6OJd - - - -
government agency and helps implement the program and the other in which the utility funds and implements its part of the program.
In determining the cost-effectiveness of a parallel program, the expenditures madeby a utility on the program are the only costs. Therefore, in our terminology, there is no distinction between the inclusive and incremental tests. The issue of allocating energy and capacity savings between the government and utility does not exist: all savings for the program funded by the utility are allocated to the utility .
This is not the case for supplemental programs. In these programs, the appropriate allocation of energy and capacity savings may not be obvious, yet it is critical to determine the incremental cost-effectiveness of the program. For example, the agency in a government-funded program could be limited by statute or regulation to a prespecified ceiling on the amount it can spend for any one customer. An electric or gas utility may then supplement the amount expended by the government. The questions become: Of the total savings resulting from the program, how much is due to the utility’s investment? Does a utility’s investment lead to increasing returns? Decreasing returns? Proportional returns? The answer is an empirical one, depending on the type and amount of the utility’s investment.
The feature differentiating a coupled program and a supplemental one is the impact of the utility on the design and implementation of the program. Different types of customers may be served, different measures may be installed, and the amount invested per participant may be different than in the pre-existing government-funded program. The same energy and capacity savings allocation problem arises for coupled programs as that for supplemental programs. Does the utility’s investment lead to increasing, decreasing, or proportional energy and capacity savings?
An important consideration in determining the cost-effectiveness of many types of supplemental and coupled programs is the length of time that a program has been in existence. For existinn Droarams that a government agency is running, the arguments presented above apply. The allocation of energy and capacity savings to a utility depends on the amount of program costs incurred by the utility and the type of program.
For new Droarams contemplated by a government-utility partnership, however, the
3.3
allocation issue may be more complex. In the simplest case, the government agency and utility pool their funds, jointly develop the program, and jointly share the energy and capacity savings. The utility’s allocation is proportional to its investment in the program. If it contributes one-third of the program’s total cost, it is allocated one-third of the program savings. In more complex cases, the program may not exist without utility funding. For example, a government agency may not initiate a new program or an existing program may not serve a particular geographical area without the financial support of an electric or gas utility. In cases such as this, the utility’s contribution should be considered totally leveraged and it should be allocated all of the energy and capacity savings from the program.
3.2. DATA COLLECTION AND ANALYSIS
The data collection activities of government agencies and utilities involved in most coordinated programs must be strengthened if valid estimates of their cost- effectiveness are to be obtained. Three areas should be stressed.
First, using net bill reductions as the primary participant benefit necessitates the collection of additional data. To estimate net reductions requires knowledge of the levels of energy consumption that would have occurred in the absence of participation in the coordinated DSM program. Control groups are typically used for this purpose. Program-eligible nonparticipants, applicants waiting to participate, and past program participants are all possible control group options; each has a unique set of advantages and disadvantages. Alternatively, economic- engineering models can be used to estimate the impact of changing conditions on fuel consumption, such as prices and the aging of heating systems.
Second, both government and utility expenditures need to be subdivided into program outlays and administrative costs, so that their benefits can be properly treated in the cost-effectiveness calculations. The National Weatherization Evaluation’ defined administrative costs to include:
program management costs (including intake and eligibility screening, audits, inspections, contractor and crew management, and program evaluation) and
1 Marilyn A. Brown et al., National Impacts of the Weatherization Assistance Program in Single-Family and Small Multifamily Dwellings, Oak Ridge National Laboratory, Oak Ridge, Tennessee, ORNUCON-326, May 1993.
3.4

installation-related overhead costs (including vehicles, travel time, equipment, field supervision, insurance, training, and contractor profit).
Excluded from this definition are the direct labor and materials costs dedicated to the on-site installation of DSM measures.
Third, data collection and analysis must enable estimation of the energy and capacity savings attributable to a utility’s contribution. Estimation procedures will depend upon the nature of the program.
The simplest cases are parallel programs, where all of the savings achieved by participants in the utility-funded program are attributed to the utility, and totally leveraged programs, where all of the savings achieved by participants in the jointly funded program are attributed to the utility.
The allocation of savings due to supplemental programs depends on whether the utility’s funds are used to make the program available to more households or to make it more comprehensive for households already participating in the program. In the first case, savings can be divided according to the proportion of costs invested by each cosponsor in the direct installation of energy-conservation and demand-reducing measures. This necessitates recordkeeping that enables these expenditures to be distinguished from expenditures on home repairs, rehabilitation, health, and safety measures. In the second case, savings per home before vs after the introduction of utility funds can be compared to estimate the impact of the utility’s involvement. Alternatively, it may be possible to calibrate the relationship between investment level and savings in order to estimate the increment of savings attributable to the utility’s expenditure.
Existing coupled programs represent the most complicated case for allocating savings because the low-income program has been transformed by the involvement of the utility. One method of allocating savings is to compare savings per home before vs after the introduction of utility funds. If no baseline is available, it becomes necessary to estimate the savings that are due to each of the program’s new features relative to its old ones (e.g., weatherizing high energy users vs. first-come, first served; installing new furnaces vs. lower expenditures on building envelope measures).
3.5

4. PERSPECTIVES FROM WHICH TO VIEW COST-EFFECTIVENESS
4.1. A HYPOTHETICAL EXAMPLE
In Table 4.1, we present the values of variables defining a hypothetical coordinated electric DSM program that will be used throughout this section. The coordinated program is a low-income one. We select a low-income program to illustrate concepts because low-income DSM programs typically result in arrearage reductions which are an important part of this type of program. Although we choose an electric program, the principles are easily extended to gas programs.
The information for the hypothetical program in Table 4.1 shows that the program consists of 100 participants with net annual energy savings of 2,500 kWh each. We assume that the amount of savings attributable to the utility’s investment in the program exhibits increasing returns. That is, although the utility contributes one- third of the program outlays (Le., $66,000 for the utility and $132,000 for the government), it is assigned one-half of the energy, capacity, and arrearage- reduction savings for the incremental test. As discussed in Sections 2 and 3, this is an example of a utility buy-in to an existing program in real-world situations.
The average residential price of electricity is 5e/kWh. Therefore, the annual reduction in utility bills is $12,500 ($0.05*2,500 kWh*lOO participants). The avoided cost of energy is 2.5c/kWh, one-half the residential price of electricity. Therefore, avoided energy costs are $6,250 per year (2,500 kWh*$0.025*100).
Assuming a 60 percent conservation load factor,’ the 250 MWh of annual electricity savings for the 100 participants translates into 47.6 kW of load savings. Assuming a combustion turbine is the avoided generating unit with an annual levelized cost of $40.00/kW/year, the avoided capacity savings are $1,904. Recognizing that the avoided generating unit on an electric power system is unique to that system, we change the assumption of a combustion turbine to a coal unit in the sensitivity study.
We assume that the costs of administering the programs for both the utility and government are one-half of the program expenditures. Therefore, the utility and government expend $22,000 and $44,000, respectively, on administration.
The conservation load factor is the ratio of average savings from the program (Le., total savings divided by 8,760 burs) to peak sawings. 1
4.1
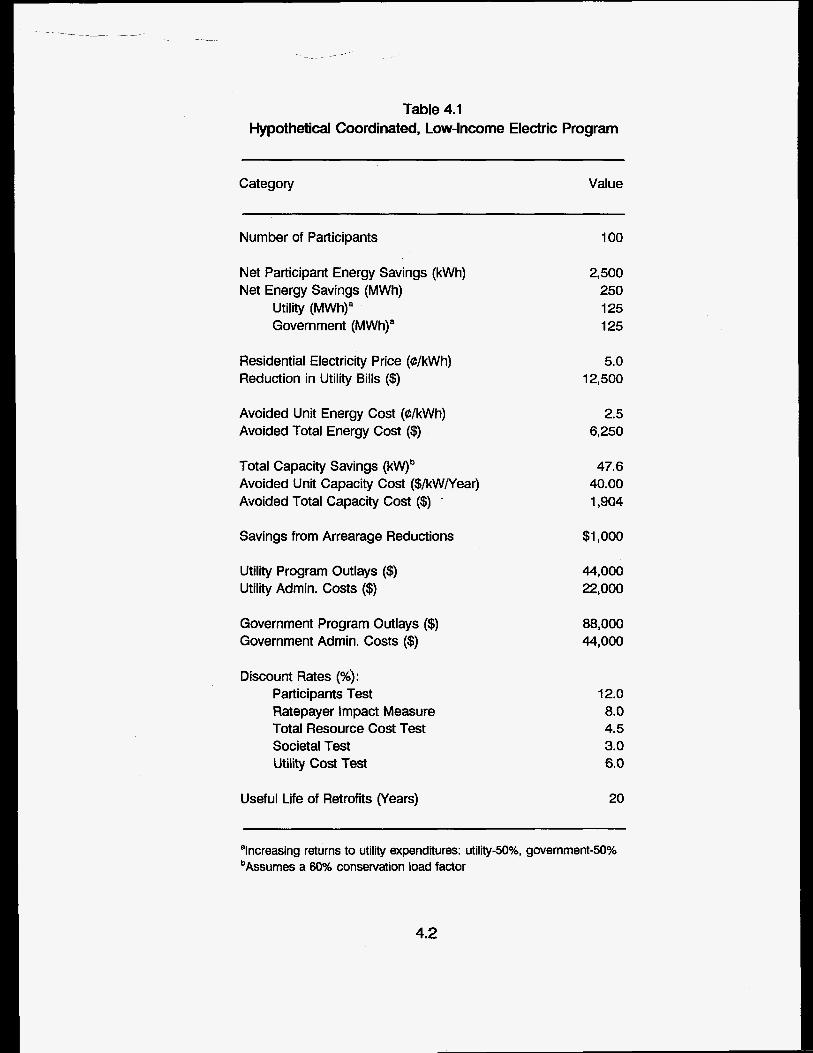
Table 4.1 Hypothetical Coordinated, Low-Income Electric Program
~ ~ ~
Category Value
Number of Participants
Net Participant Energy Savings (kWh) Net Energy Savings (MWh)
Utility (MWh)" Government (MWh)"
Residential Electricity Price (C/kWh) Reduction in Utility Bills ($)
Avoided Unit Energy Cost (dkWh) Avoided Total Energy Cost ($)
Total Capacity Savings ( k V b Avoided Unit Capacity Cost ($/kW/Year) Avoided Total Capacity Cost ($) ~
Savings from Arrearage Reductions
Utility Program Outlays ($) Utility Admin. Costs ($)
Government Program Outlays ($) Government Admin. Costs ($)
Discount Rates (93): Participants Test Ratepayer Impact Measure Total Resource Cost Test Societal Test Utility Cost Test
Useful Life of Retrofits (Years)
100
2,500 250 125 125
5.0 12,500
2.5 6,250
47.6 40.00 1,904
$1,000
44,000 22,000
88,000 44,000
12.0 8.0 4.5 3.0 6.0
20
ahcreasing returns to utility expenditures: utility-50%, government-50% bAssumes a 60% conservation load factor
4.2
The discount rates chosen for each of the tests are indicative of relationships between the rates--and not a prescription for the amounts to be used when evaluating real-world programs. The rate used for the participant test is the largest of the five because individuals have relatively higher discount rates than a utility or society as a whole. In the low-income DSM program application, it could be argued that the rate should be much higher because we are dealing with low- income households, who require much shorter payback periods on their investments. The rates used for the societal and total resource cost tests are lower than the others.
Finally, we assume that the useful lives of the retrofits made to the low-income homes are 20 yearst Therefore, the energy and capacity savings for the utility lasts 20 years.
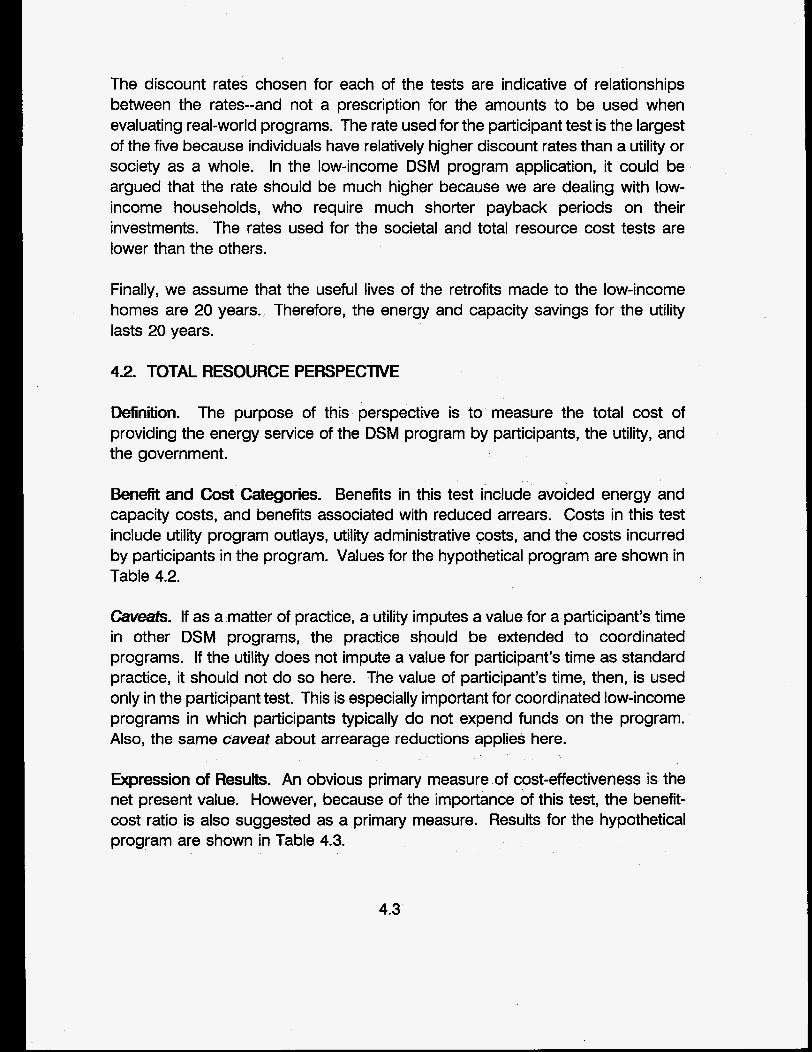
4.2. TOTAL RESOURCE PERSPECTIVE
Definition. The purpose of this perspective is to measure the total cost of providing the energy service of the DSM program by participants, the utilty, and the government.
Benefit and Cost Categories. Benefits in this test include avoided energy and capacity costs, and benefits associated with reduced arrears. Costs in this test include utility program outlays, utility administrative costs, and the costs incurred by participants in the program. Values for the hypothetical program are shown in Table 4.2.
Caveats. If as a matter of practice, a utility imputes a value for a participant’s time in other DSM programs, the practice should be extended to coordinated programs. If the utility does not impute a value for participant’s time as standard practice, it should not do so here. The value of participant’s time, then, is used only in the participant test. This is especially important for coordinated low-income programs in which participants typically do not expend funds on the program. Also, the same caveat about arrearage reductions applies here.
Expression of Results. An obvious primary measure of cost-effectiveness is the net present value. However, because of the importance of this test, the benefit- cost ratio is also suggested as a primary measure. Results for the hypothetical program are shown in Table 4.3.
4.3

Table 4.2 Benefit and Cost Categories Total Resource Perspective
Category inclusive incremental
Benefits: Reduction in Arrears $1,000 $500 Avoided Costs $8,154 $4,077
costs: Utility Program Outlays $44,000 $44,000 Utility Admin. Costs $22,000 $22,000
Table 4.3 Sample Resutts
Total Resource Perspective
Category inclusive Incremental
Net Present Value $5591 7 ($3,621) Benefit-Cost Ratio 1 .aa 0.94
4.3. PAFtllClPANT PERSPECTIVE
Definition. This test determines whether or not a DSM program will be financially attractive to those participating in the program--i.e., the target group of the program.
4.4
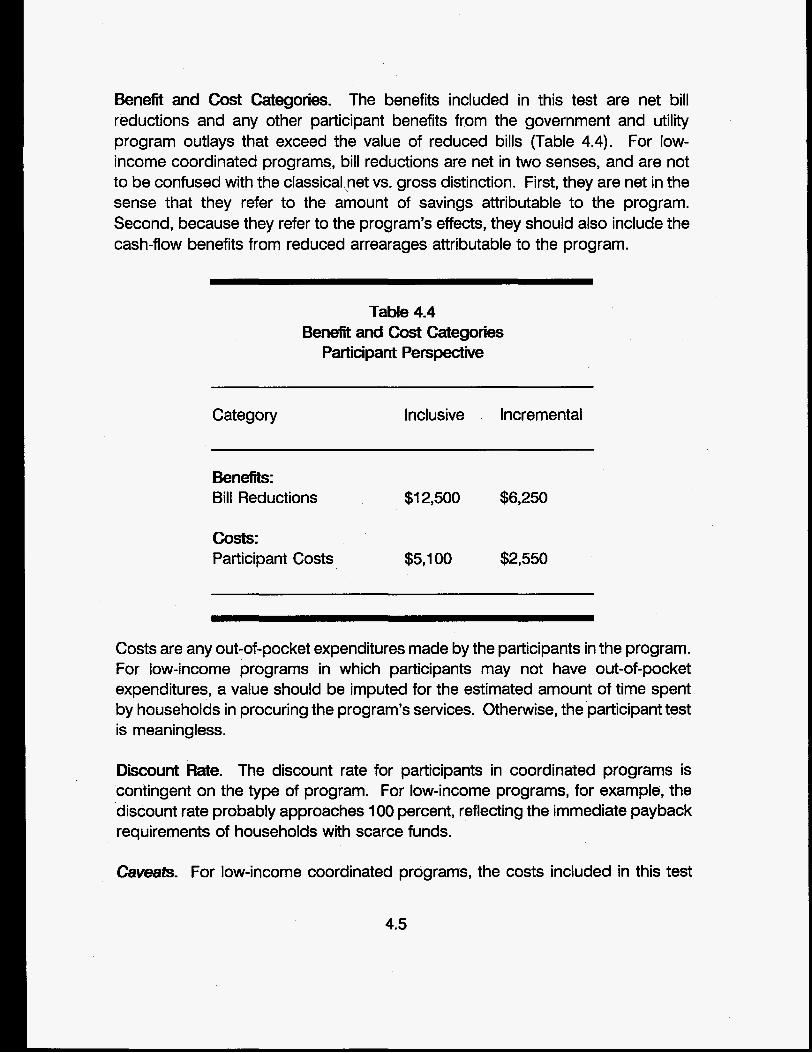
Benefit and Cost Categories. The benefits included in this test are net bill reductions and any other participant benefits from the government and utility program outlays that exceed the value of reduced bills (Table 4.4). For low- income coordinated programs, bill reductions are net in two senses, and are not to be confused with the classica1,net vs. gross distinction. First, they are net in the sense that they refer to the amount of savings attributable to the program. Second, because they refer to the program’s effects, they should also include the cash-flow benefits from reduced arrearages attributable to the program.
Table 4.4 Benefit and Cost Categories
Participant Perspective
Category Inclusive Incremental
Benefits: Bill Reductions $1 2,500 $6,250
Costs: Participant Costs $5,100 $2,550
Costs are any out-of-pocket expenditures made by the participants in the program. For low-income programs in which participants may not have out-of-pocket expenditures, a value should be imputed for the estimated amount of time spent by households in procuring the program’s services. Otherwise, the‘participant test is meaningless.
Discount Rate. The discount rate for participants in coordinated programs is contingent on the type of program. For low-income programs, for example, the discount rate probably approaches 100 percent, reflecting the immediate payback requirements of households with scarce funds.
Caveats. For low-income coordinated programs, the costs included in this test
4.5

generally are limited to the imputed value of a participant’s time. Imputed costs should only be used as an indicator of cost-effectiveness if imputed participant costs are not part of the benefit-cost calculations of other DSM programs that a utility may run.
Expression of Results. The benefit-cost ratio is the primary measure of cost- effectiveness for this test. However, if an added objective is to estimate the program’s magnitude to compare with other prospective programs, net present value is also a good measure (Table 4.5).
Table 4.5 Sample Results
Participant Perspective
Category Inclusive incremental
Net Present Value $88,815 $29,607 Benefit-Cost Ratio 20.50 20.50
4.4. NON-PARTICIPANT PERSPECTIVE
Definition. Estimated cost-effectiveness under this perspective measures the effect of DSM programs on all ratepayers. It is an important measure because all ratepayers are affected by any DSM program, even if some classes of ratepayers do not participate in the program.
Benefit and Cost Categories. Benefits for this perspective are the same as those for the utility-cost perspective discussed below. They include the reduction in utility costs that result from reduced arrears, as well as the avoided energy and capacity costs that result from running the program. Costs in this test include utility program and administrative costs as well as the revenues lost from reduced utility sales. Table 4.6 shows the values for the hypothetical program.
4.6

Table 4.6 Benefit and Cost Categories Non-Participant Perspective
Category Inclusive Incremental
Benefits: Reduction in Arrears $1,000 $500 Avoided Costs $8,154 $4,077
Costs: Utility Program Outlays $44,000 $44,000 Utility Admin. Costs $22,000 $22,000 Revenue Loss $1 2,500 $6,250
Discount Rate. The applicable discount rate is the one affecting rate level. In practice, the participant discount rate is often used. However, caution must be used in applying the participant discount rate if the coordinated program is a low- income one.
Caveats. The caveat for arrearage reductions discussed in the context of the utility-cost perspective applies here also. There are two effects of arrearage reductions: (1) increased revenues for the utility (reflected as reduced revenue loss in this test) and (2) reduced administrative costs of not having to deal with arrears.
Expression of Results. Because the primary purpose of this test is to measure rate or revenue impacts, it is the only one of the five tests in which revenues are part of the calculus. This suggests that some measure of initial-year or lifecycle revenue impact is the best measure for this test. Table 4.7 shows results for the hypothetical program.
4.7

Table 4.7 Sample Results
Non-Participant Perspective
Category Inclusive Incremental
Net Present Value ($93,963) ($77,537) Benefit-Cost Ratio 0.49 0.37
4.5. unuw PERSPECTNE
Definition. Cost-effectiveness under this perspective is measured from the standpoint of the utility. As such, it measures the change in revenue requirements from running the DSM program.
Benefit and Cost Categories. The primary benefit for this perspective is the avoided energy and capacity costs of the program. Another important benefit is the reduction in costs associated with reduced arrearages if the coordinated program under consideration is a low-income one. Program costs are the out-of- pocket expenditures made by the utility for equipment and annual expenses associated with running the program. In our example, these costs include program outlays and administrative costs that apply only to the one year in which the program outlays were’ assumed to be made. For other programs, administrative costs may apply to more than just that one year. Values for the hypothetical program are shown in Table 4.8.
Discount Rate. The discount rate used for the utility’s perspective should reflect the utility’s risk-adjusted, incremental cost of capital.
Caveats. An important cash-flow benefit of some coordinated programs--e.g., low- income programs--is the amount of cost savings experienced by the utility from lower arrearages induced by the program.
4.0

Table 4.8 Benefit and Cost Categories
Utility Perspective
Category Inclusive Incremental
Benefits: Reduction in Arrears $1,000 $500 Avoided Costs $8,154 $4,077
Costs: Program Outlays $44,000 $44,000 Administrative Costs $22,000 $22,000
Expression of Resutts. The primary measure for this perspective is net present value. The benefit-cost ratio is a secondary measures. Results for the hypothetical program are shown in Table 4.9.
Table 4.9 Sample Resutts
Utility Perspective
Category Inclusive Incremental
Net Present Value $42,732 ($9,766) Benefit-Cost Ratio 1.69 0.84
4.9
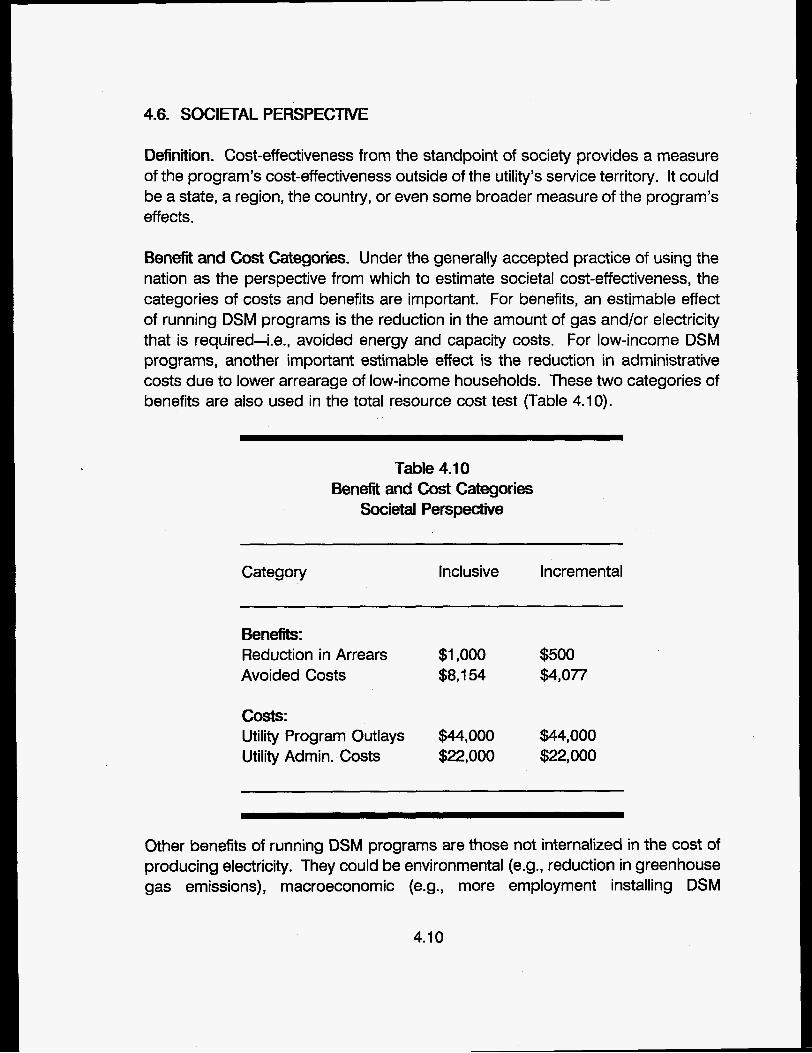
4.6. SOCIETAL PERSPECTNE
Definition. Cost-effectiveness from the standpoint of society provides a measure of the program’s cost-effectiveness outside of the utility’s service territory. It could be a state, a region, the country, or even some broader measure of the program’s effects.
Benefit and Cost Categories. Under the generally accepted practice of using the nation as the perspective from which to estimate societal cost-effectiveness, the categories of costs and benefits are important. For benefits, an estimable effect of running DSM programs is the reduction in the amount of gas and/or electricity that is required-i.e., avoided energy and capacity costs. For low-income DSM programs, another important estimable effect is the reduction in administrative costs due to lower arrearage of low-income households. These two categories of benefits are also used in the total resource cost test (Table 4.10).
Table 4.10 Benefit and Cost Categories
Societal Perspective
Category Inclusive Incremental
Benefits: Reduction in Arrears $1,000 $500 Avoided Costs $8,154 $4,077
costs: Utility Program Outlays $44,000 $44,000 Utility Admin. Costs $22,000 $22,000
Other benefits of running DSM programs are those not internalized in the cost of producing electricity. They could be environmental (e.g., reduction in greenhouse gas emissions), macroeconomic (e.g., more employment installing DSM
4.10

measures), national security (e.g., reduced dependence on foreign energy) , and, in the case of low-income DSM programs, increased levels of comfort, safety, and productivity. The inclusion of any category of these externalities is jurisdictional. If they are included for other DSM programs, they should be included for coordinated ones.
Determining society’s costs of improving the energy efficiency of low-income households is a little more troublesome. Clearly, there are external costs (e.g., reduction in employment in energy-producing industries), and, similar to benefits, their inclusion in the cost-effectiveness calculus is jurisdictional. Clearly, from a national perspective, any government expenditures on the program are transfers: the costs to taxpayers are offset by the benefits received. The actual cost of a DSM program from the standpoint of the nation is the incremental amount of national resources needed to increase energy efficiency beyond the level that existed before the program was implemented. In practice, the utility’s program outlays and administrative costs are usually used as a proxy for this incremental amount. To the extent that these costs capture this incremental amount, the more reliable the estimate of cost-effectiveness from society’s perspective.
Discount Rate. A social rate of discount should be used for this perspective. One source is the rate prescribed by the Federal Office of Management and Budget. A rate of 3.0 percent is used here.
Caveats. The societal test is the most difficult of the five tests to interpret, and also the most difficult of the five tests to estimate in practice. First, there is the question of interpretation. From what perspective is the societal test to be measured? The state in which the utility operates? Its region? The nation as a whole? Globally? Answers to these questions are important in estimating the cost-effectiveness of DSM programs because the categories of costs and benefits to be included in the calculus will changdepending on the perspective.
Expression of Resutts. The net present value of the DSM program is the recommended primary measure of cost-effectiveness for the societal test. The benefit-cost ratio is a secondary measure. Results for the hypothetical program are shown in Table 4.1 1.
4.1 1
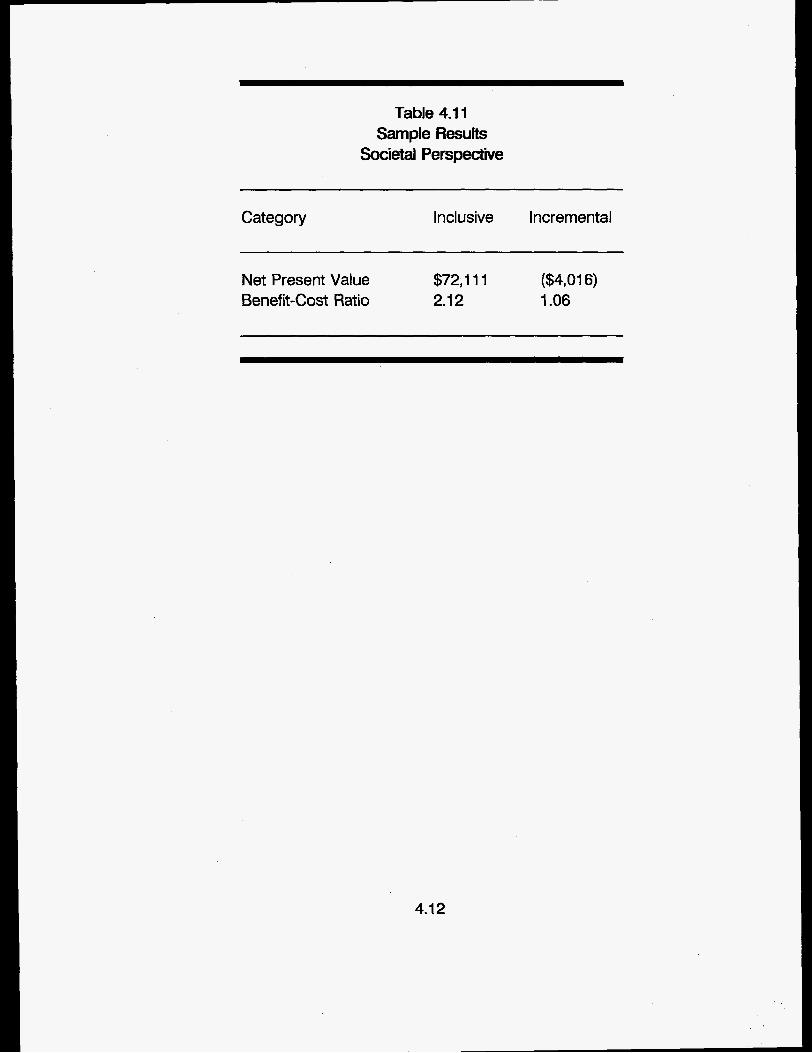
Table 4.1 1 Sample Results
Societal Perspective
~~~
Category Inclusive Incremental
Net Present Value Benefit-Cost Ratio
$72,111 2.12
($401 6) 1.06
4.1 2
5. SYNTHESIS
In this manual, we have addressed differences between coordinated government- utility DSM programs and typical utility-run programs. In estimating the cost- effectiveness of the two types of programs, an important consideration is the distinction between the social and private cost-effectiveness of expenditures on the program. A social accounting looks at the program’s net effect on society at large, while a private accounting looks at the program’s effects on the participating utility. Consequently, when estimating the cost-effectiveness of a coordinated program from the standpoint of the utility, government expenditures on the program should not be included as costs from the nonparticipant--and, therefore, total resource-- perspectives.
In many cases, however, this argument is academic because the important test of a coordinated program’s cost-effectiveness is the incremental effect of the utility’s expenditures on the program--not the inclusive or total effect. The government’s expenditures on the program--and the energy and capacity savings that they cause--are not considered in the incremental test.
In the incremental test, the most difficult part of estimating the cost-effectiveness of a coordinated program is allocating the benefits of the program--i,e, the avoided energy and capacity costs--to the utility’s share of investment in the program. That is, does the utility’s investment result in proportional--or more or less than proportional--energy and capacity savings in the program? An incorrect answer to this question can cause an otherwise cost-effective coordinated program to be eliminated from further consideration in the assessment process. The reverse is true for otherwise cost-ineffective programs.
Accurate allocations may be more difficult to obtain for existinq programs currently funded by a government agency than for ones jointly contemplated by an electric or gas utility and a government agency. Special care must be taken when allocating benefits for existing programs, looking at both the nature and amount of the government agency’s and utility’s investment. In many cases, the utility’s investment in an existing program may lead to more-than-proportional savings because of start-up costs incurred by the government agency when first initiating a program.
The allocation for new programs is not as complicated. A good starting point is to allocate savings proportional to the investment of the utility and government
5.1
agency. However, a major complicating factor in allocating program benefits of a new program may be the condition for existence of the program itself: i.e., utility participation. In other words, in programs in which a government agency will provide funding only on the condition that an electric or gas utility cofunds a portion of the program, all of the benefits of the program should be allocated to the utility in estimating the incremental cost-effectiveness of the program for the I utility.
5.2
APPENDIX A: FRAMRNORK FOR ANALYSIS
A.1. WHAT IS COST-EFFECTIVENESS?
In determining cost-effectiveness, the incremental costs of coordinated programs are compared with their incremental benefits. The question becomes: What costs and what benefits? Answers to those questions have changed as electric utility planning has evolved.
Prior to the 1980s, utilities engaged in least-cost planning, minimizing supply costs given forecasts of their customers’ demand growth. Load curves were exogenous in utility planning. By minimizing the cost of providing electricity, the objective of utilities was essentially to minimize the price of electricity to customers.
As utilities began to intervene on the customer’s side of the meter by running demand-side management programs, this least-cost/least-price planning paradigm evolved into one of minimizing the cost of providing energy services. In response to this evolution, the California Public Utilities Commission and California Energy Commission developed a set of perspectives from which to measure the cost- effectiveness of utility-run DSM programs: (1) the utility exclusively and (2) participants, nonparticipants, and their total (which may or may not include societal effects).’ The resulting planning approach--integrated resource planning (IRP)--is the combination of traditional least-cost supply planning and demand-side planning. By focusing on the total resource cost test in this paradigm, the industry’s planning emphasis switched from least-cost of supply to least-cost of energy services.
In developing the perspectives from which to measure the cost-effectiveness of DSM programs and recommending various cost and benefit categories to include in their tests, the authors of the California standard practice acknowledged the limitations of their tests. A key limitation is the static nature of the tests: there is no accounting for the effects that DSM programs have on electricity prices, and the consequent effects on electricity demand both by those participating or not participating in the program.
Recognizing this deficiency, several authors (Hobbs, 1991 ; Borlick, 1994; Braithwait
California Public Utilities Commission and California Energy Commission, Standard Practice 1
Manual: Economic Analysis of Demand-Side Management Programs, December 1 987.
A. 1
and Caves, 1994)' have suggested that evaluation of DSM programs should incorporate these price effects to accurately reflect the effects of the programs on both participants and non-participants. By including price effects and using the concept of consumer's surplus, the authors direct DSM-program evaluation from cost to value, from costs to net benefits, from a financial analysis to an economic one.
The major obstacle in using economic measures of cost-effectiveness is information on markets. In most real-world settings, the analyst does not have the information to measure changes in value from running DSM programs. However, because the least-cost approach is one part of the net benefits or most-value approach to estimating cost-effectiveness, the least-cost approach can be extended to an economic one for those so inclined. We show how the two approaches are related below.
A.2. AN ECONOMIC APPROACH
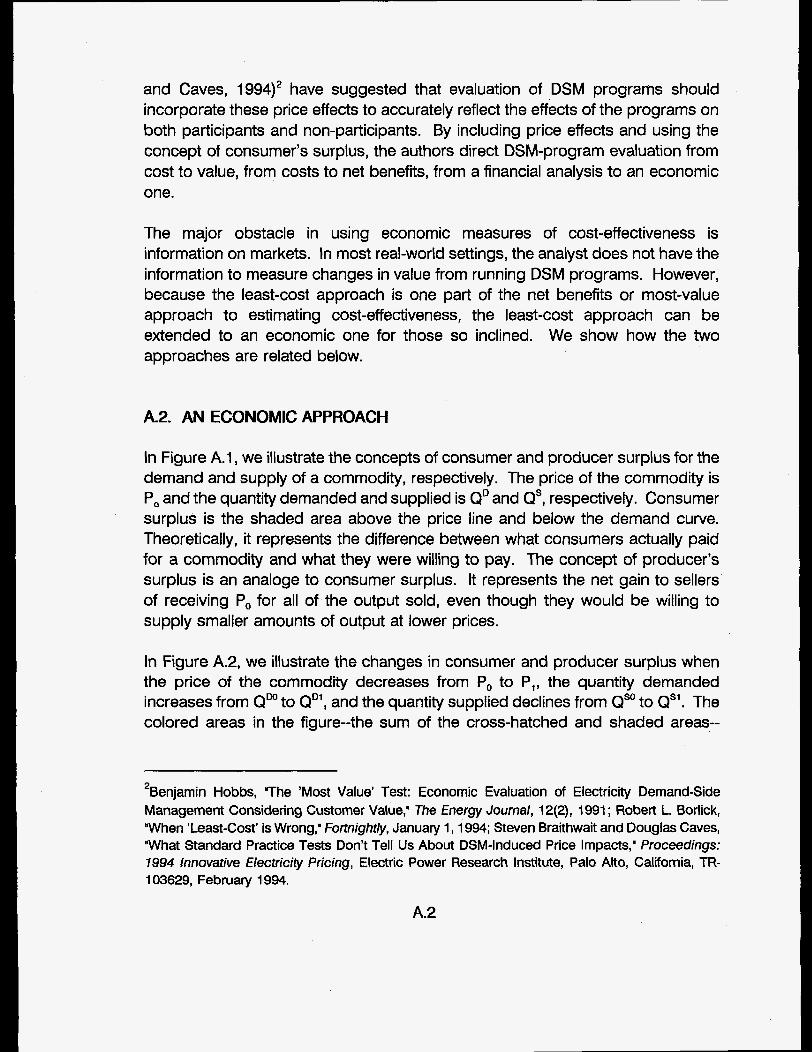
In Figure A.l , we illustrate the concepts of consumer and producer surplus for the demand and supply of a commodity, respectively. The price of the commodity is Po and the quantity demanded and supplied is QD and QS, respectively. Consumer surplus is the shaded area above the price line and below the demand curve. Theoretically, it represents the difference between what consumers actually paid for a commodity and what they were willing to pay. The concept of producer's surplus is an analoge to consumer surplus. It represents the net gain to sellers of receiving Po for all of the output sold, even though they would be willing to supply smaller amounts of output at lower prices.
In Figure A.2, we illustrate the changes in consumer and producer surplus when the price of the commodity decreases from Po to P,, the quantity demanded increases from QW to QD1, and the quantity supplied declines from Qso to Q". The colored areas in the figure--the sum of the cross-hatched and shaded areas--
Benjamin Hobbs, The 'Most Value' Test: Economic Evaluation of Electricity Demand-Side Management Considering Customer Value," The Energy Journal, 12(2), 1991 ; Robert L. Borlick, "When 'Least-Cost' is Wrong,' fortnightly, January 1, 1994; Steven Braithwait and Douglas Caves, "What Standard Practice Tests Don't Tell Us About DSM-Induced Price Impacts," Proceedings: 7994 innovative Electricity Pricing, Electric Power Research Institute, Palo Alto, California, TR- 103629, February 1994.
2
A.2

represent changes in consumer and producer surpluses as a result of the price change.
Figure A1 Consumer and Producer Surplus
i CONSUMER SURPLUS
I
W 0 E
PO - - - -
PRODUCER SURPLUS +
I
QUANTITY Q: QUANTITY
In most cost-effectiveness estimates, the only areas addressed are the cross- hatched ones. That is, the analysis is based on changes in financial flows to the customer and the utility.
To illustrate, consider an increase in energy efficiency from a utility-run DSM program. That increase in efficiency is the same as a reduction in the price of energy. From Figure A.2, the price falls from Po to P,. The demand for energy then increases from Q, to Q,. As a result of the price decrease, utility bills for participants in the program decline by the difference between P,QDo and P,QDo--i.e., the cross-hatched area under the demand curve. In estimating cost-effectiveness based on least-cost financial principles, that is the only benefit that the customer is estimated to receive. However, from Figure A.l, there is another benefit that most estimates ignore--i.e., the shaded area, also representing an increase in
A.3
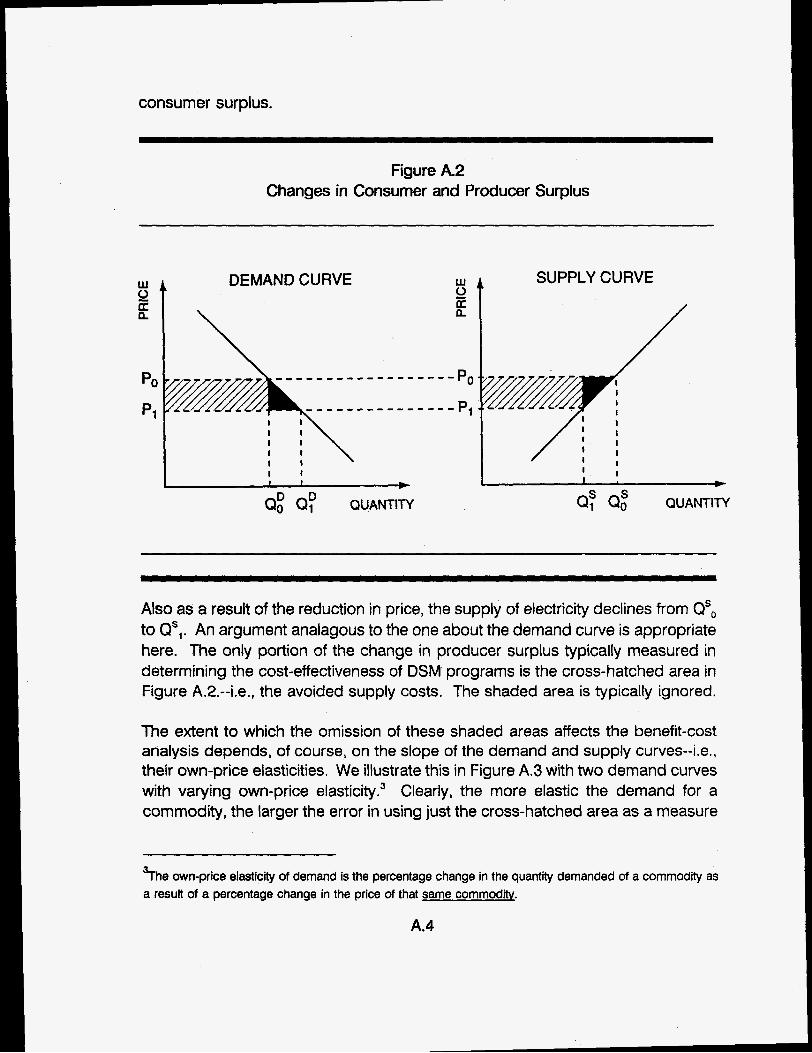
consumer surplus.
Figure A.2 Changes in Consumer and Producer Surplus
Also as a result of the reduction in price, the supply of electricity declines from QS, to QS,. An argument analagous to the one about the demand curve is appropriate here. The only portion of the change in producer surplus typically measured in determining the cost-effectiveness of DSM programs is the cross-hatched area in Figure A.IZ.--i.e., the avoided supply costs. The shaded area is typically ignored.
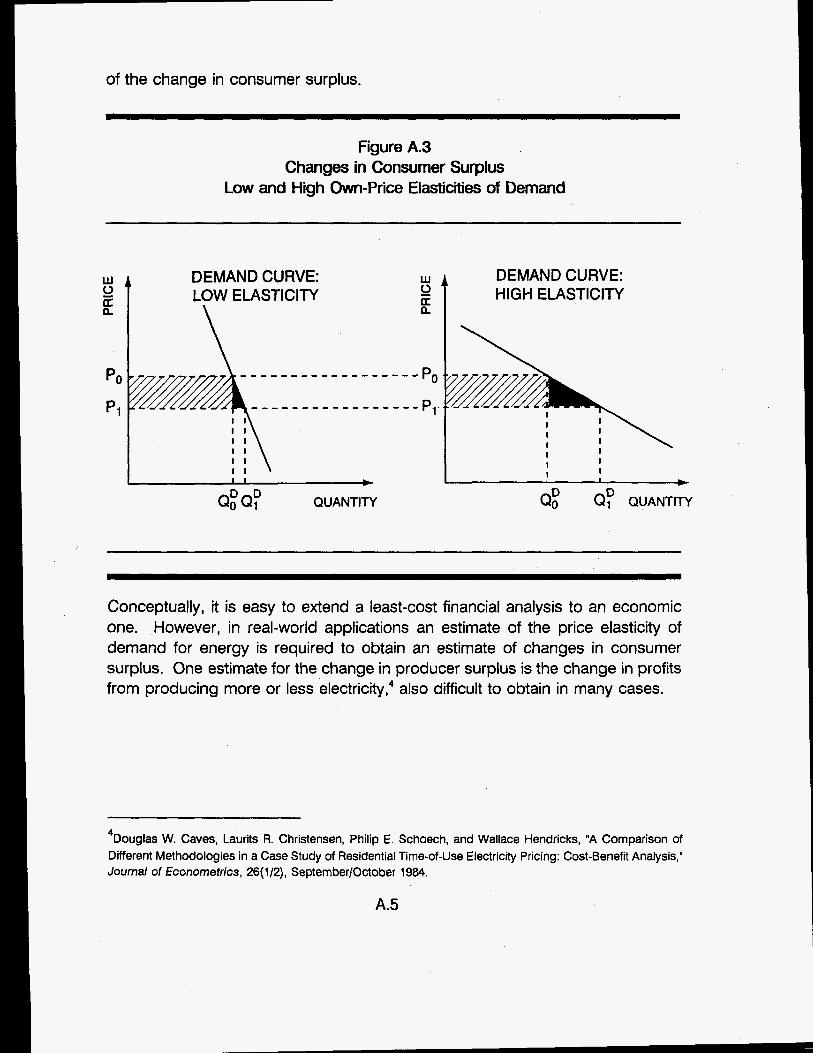
The extent to which the omission of these shaded areas affects the benefit-cost analysis depends, of course, on the slope of the demand and supply curves--Le., their own-price elasticities. We illustrate this in Figure A.3 with two demand curves with varying own-price ela~ticity.~ Clearly, the more elastic the demand for a commodity, the larger the error in using just the cross-hatched area as a measure
b e own-price elasticity of demand is the percentage change in the quantity demanded of a commodity as a result of a percentage change in the price of that same commodity.
A.4
Douglas W. Caves, Laurits R. Christensen, Philip E. Schoech, and Wallace Hendricks, "A Comparison of Different Methodologies in a Case Study of Residential Time-of-Use Electricity Pricing: Cost-Benefit Analysis," Journal of Econometrics, 26(1/2), SeptembedOctober 1984.
4
A.5
A.3. A FINANCIAL PARADIGM
In this manual, we followed the financial paradigm, recognizing that we do not capture the total effects of running coordinated DSM programs. However, as illustrated in Figure 3.2, the financial paradigm is consistent with an economic one.
A.3.1. Inclusive Test
Because coordinated programs involve multiple sponsors-the utility and one or more government agencies-it is important to distinguish between the cost- effectiveness of the program as a whole and the cost-effectiveness of the utility’s contribution. Estimatina the cost-effectiveness of the total wonram involves the measurement of total or inclusive costs and benefits, and does not consider the marginal impact of any single sponsor’s contribution on the program. This aggregate approach provides a useful overview of the total investment in the program.
A.3.2. Incremental Test
Estimating the cost-effectiveness of the utility’s investment involves the measurement of incremental costs and benefits. The results of these incremental tests are important because they can be used to compare the utility’s investment in the low-income DSM program with other investments the utility is considering, including other DSM programs. The incremental tests reflect only the costs and benefits that result from the utility’s cosponsorship of the coordinated program.
A.6
APPENDIX B:
CALCULATION OF SAMPLE RESULTS
B.l
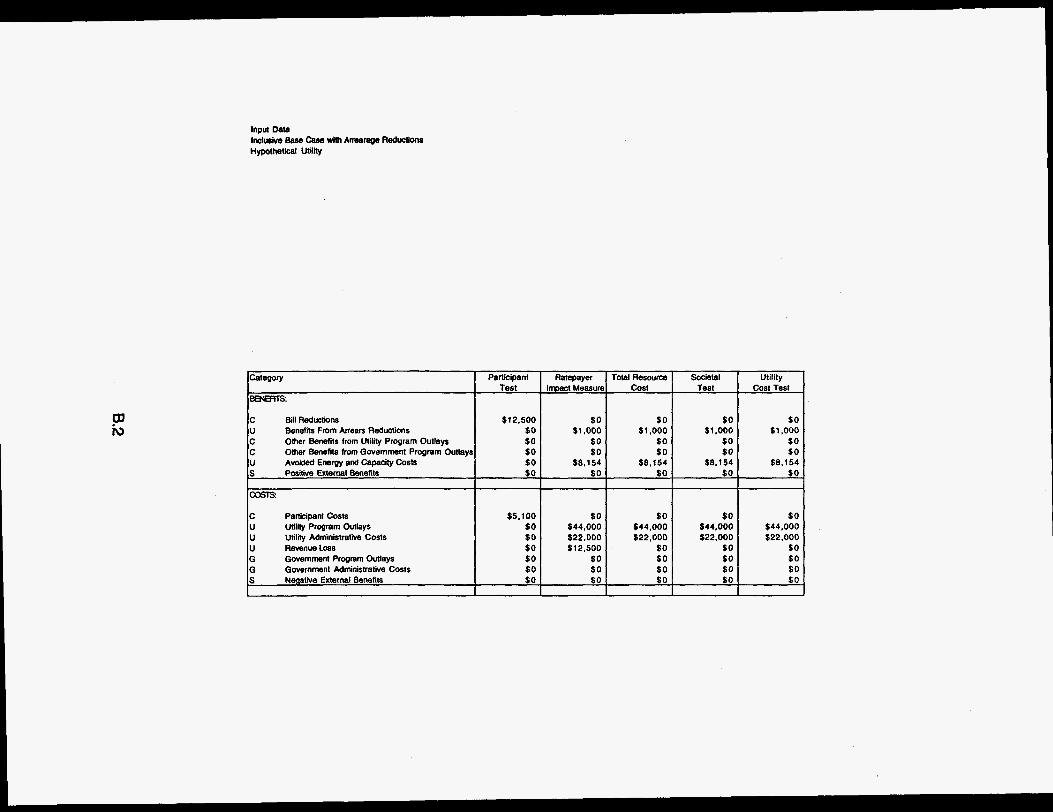
Category Partkipant Ratepayer Total Resource Societal Utility
BBJBTTS: Test lmct Measure Cost Test Cost Test
$12.500
Other Benefits from Utility Program Outlays Other Benefits from Government Program Outlays Avoided EWQy and Capacity Costs Positive External Benefits SO
$8.154 $0 $8.154 $0 $8.154 $0
I I
COSTS:
C PartkipantCosts $5.100 I I
U Uti l i i Program Outlays $0 U Utility Administralive Costs $0 U RevenueLoss $0 G Government Program Outlays $0 G Government Administratiwe Costs $0 S Negative External Benefits $0
$0 $0 $ 0

~
Year 1 Year 2 Year 3 Yeer 4 Year 5 Year 8 Year 7 Year 8 Year 9 Year 10 Year 11 year 12 Year 13 Year 14 Year 15 Year 16 Year 17 Year 18 Year 19
C &WRedunbnr U B e n a f i l s F n n n M n ~ C O ( h e r h m 6 t s t r o m U W P m q v n ~ c OtherBensRDCom(w- U A w l d s d E ~ n d W C o * s PorkivrEI*m3i(iO
COSTS
lmntr Cca# 12.500 5.100 12,500 0 12.500 0 12.500 0 12.500 0 12.500 0 12.500 0 12.500 0 12.500 0 12.500 0 12.500 0 12.500 0 12.500 0 12.500 0 12.500 0 12.500 0 12.500 0 12.500 0 12,500 0 12.500 0 03.388 4.554
88.814.5 20.504
$11.890 12.00%
SS3.368 SO SO SO so so $9.818 $13,008 $14.877 $1 1 A70 so so so so so S O so so so so SO $80.057 $106.067 $121,311 $93.528 $0 SO so so so
$03.388 $89.875 $119.075 $138,188 $104,998
~~ ~
lenRtr costs 9.154 78.500 9.154 12.500 9.154 12.500 9.154 12.500 9.154 12.500 9.154 12.500
9.154 12.500 9.154 12.500 9.154 12.500 9.154 12.500 9.154 12.500 9.154 12.500 9.154 12.500 9.154 12.500 9.154 12.500 9,154 12.500 9.154 12.500 9.154 12.500 9.154 12,500
89.875 183.838 (03.962.8l
0.489 (S9.5701
8.00%
9.154 12.500
C Partlclpam co*r u Ullllly PmQaln ouumy8 U Utility AdmkJlb.tk. Carr, U RevsnaLorr G G o v e r m m - G GwemmmtAbnwlhk.cor(r S N C a a t h m
TOT&
unna cab 9.154 bd.000 9.154 0 9.154 0 9.154 0 9.154 0 9.154 0 9.154 0 9.154 0 0.154 0 9.154 0 9.154 0 0.154 0 9.154 0 9.154 0 9.154 0 9.154 0 0.154 0 9.154 0 0.154 0 0.154 0
119.075 83.158 55.016.8
1 .ea! S4.2D9
4.6091
$4.554 so so so so $0 $40.741 $42.105 $42.718 $41.500 so (20.370 $21.053 $21.359 $20.755 SO 1122.727 so so so so so SO SO so SO so so so $0 $0 t o so SO $0
$4.554 $183.838 $63.158 $64.078 $62.284 I
*nema lew*rrr co*, 9.154 W.Oo0 I 0.154 m.000 9,154 0 0.154 0 0.154 0 9.154 0 0.154 0 9.154 0 0.154 0 0.154 0 9.154 0 8.154 0 9.154 0 9,154 0 0.154 0 0.154 0 0.154 0 9.154 0 9.154 0 9.154 0 9.154 0 0.154 0 9.154 0 0,154 0 9.154 0 0.154 0 9.154 0 9.154 0 0.154 0 9.154 0 9.154 0 0.154 0 9.154 0 9.154 0 0.154 0 0.154 0 0.154 0.154 0.154 0" I
0.154 6.f
138.188 84.078 104.998 62.264 72.1 10.7 42.131 .5
2.125 1.68f $4.147 $9.728
9.00%

Category Participant Ratepayer Total Resource Societal Utility
BENEFITS: Test InpactMeasure Cost Test Cost Test
C Bill Reductions $6,250 $0 $ 0 $0 $0 U Benefits From Arrears Reductions $0 $500 $500 $500 $500 C Olher Benefis from UtiliIy Program Outlays $0 $0 $0 $0 $0 C Other Benefits from Government Program Outlays $0 $0 $0 SO SO
S Positive External Benefits $0 $0 $0 $0 $0 U Avoided Energy and Capacity Costs $0 $4.077 $4.077 $4,077 $4.077
COSTS:
$2.550 Utility Program Outlays Utility Admlnlstrative Costs Revenue Loss $0 Government Prwrarn Outlays $0
$0 $0 $0
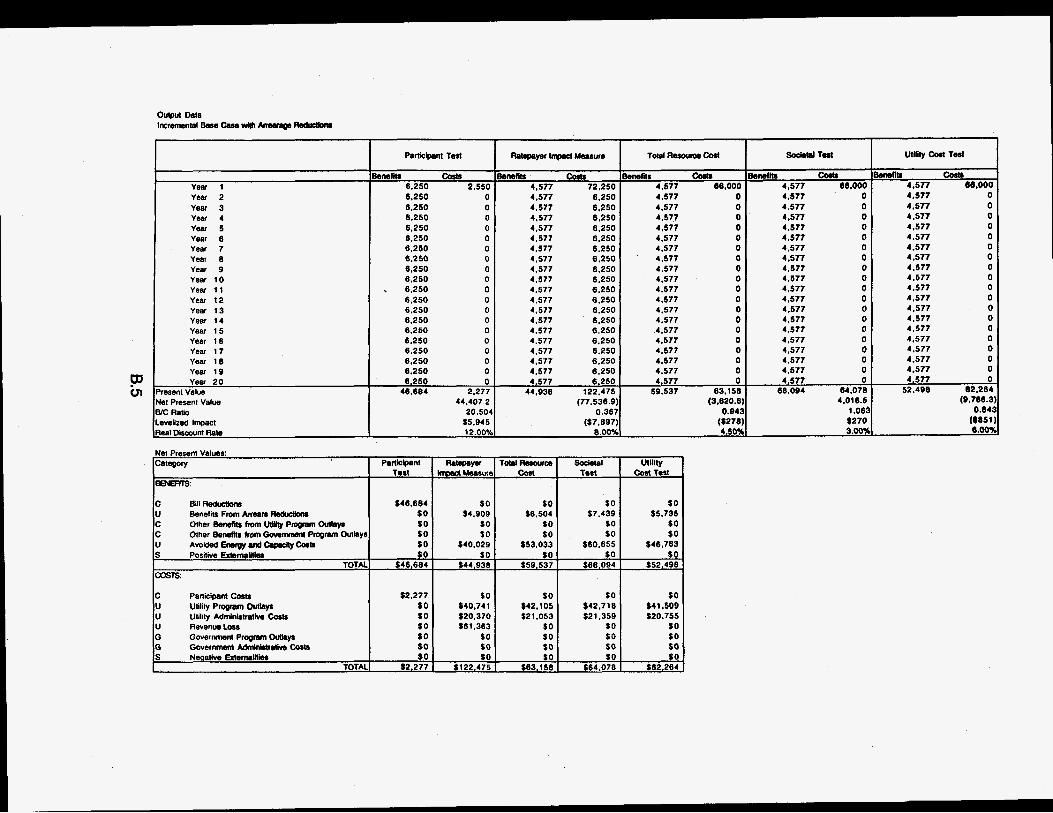
Year 1 Year 2 Year 3 Year 4 Year 5 Year 6 Year 7 Year 6 Year 9 Year 10 Year 11 Year 12 Year 13 Year 14 Year 15 Year 16 Year 17 Year 16 Year 19
bmfils costs 4.577 66.000 4.577 0 4.577 0 4.577 0 4.577 0 4.577 0 4.577 0 4.577 0 4.577 0 4.577 0 4.577 0 4.577 0 4.577 0 4,577 0 4.577 0 4.577 0 4.577 0 4.577 0 4.577 0 4,577 0
59.537 63.158 (9.620.6)
0.943 ($276) 4.50%
Yes 20
Benefits CQa 4.577 66.000 4.577 0 4.577 0 4.577 0 4.577 0 4.577 0 4.577 0 4.577 0 4.577 0 4.577 0 4.577 0 4.577 0 4.577 0 4.577 0 4.577 0 4.577 0 4.577 0 4.577 0 4.577 0 4.577 0
66.094 64.076 4.016.5
1.062 $270 3.00%
Net Present Value B/C RaM Levelized Impact
- ~ ~~~
Particlp.nl T d
bnefits cosls 6.250 2.550 6.250 0 6.250 0 6.250 0 6,250 0 6.250 0 6.250 0 6.250 0 6.250 0 6,250 0 . 6.250 0 6.250 0 6.250 0 6.250 0 6.250 0 6.250 0 6.250 0 6.250 0 6.250 0
bnelb Coa8 4.577 72.250 4.577 6.250 4.577 6.250 4,577 6,250 4.577 6.250 4.577 6,250 4.577 6,250 4.577 6.250 4.577 6.250 4.577 6,250 4.577 6,250 4.577 6.250 4.577 6.250 4.577 6,250 4.577 6.250 4.577 6.250 4.577 6.250 4.577 6.250 4.577 6.250
6.250 0 4.577 6.250 46.664 2.277 44.936 122.475
44,407.2 (77.536.9 20.504 0.36;
$5.945 ($7,697 12.00% 8.OW
C BillReduc(lana $48.664 U Benelits From &roan Aeductlanr SO C Other Bedita horn UWy Prc9mm ovtlr/r S O C Other BeneR(r tram GavsmMnt Program Outlays SO U AvoidedEnsrwudC.pacityCosb SO
SO $4,909
so SO
$40.029 s Positive Extsmslltkr SO SO
TOTAL 546.664 $44,936 COSTS:
Par!icipanl Core Utility P q m m OuUny8 Utility Mminhtrath CoOu Revenue Loss Government Progmm Outlay8 GwemmMlt Mmwlt rM cootr
SO TOTAL
$2.277 S O SO SO SO SO
SO 540.74 1 520,370 $61,363
SO SO
Utility co8t Tost
$42.105 521,053
so $42.7 18 $21.359
S O SO SO
SO $41,509 $20.755
S O S O so
utlllly coat Teat
emfib tort, 4.577 66.000 4.577 n - 4.577 0 4.577 0 4.577 0 4.577 0 4.577 0 4.577 0 4.577 0 4.577 0 4.577 0 4.577 0 4.577 0 4.577 0 4.577 0 4.577 0 4.577 0 4.577 0 4.577 0 4.577 0
52.498 62.264 (9.766.3
0.84: ($851 6.003

O W C O N - 3 9 0
INTERNAL DISTRIBUTION
1. R. A. Balzer, 4500N, MS 6206 2. L. G. Berry, 4500N, MS 6206 3. M. A. Brown, 4500N, MS 6206 4. J. W. Cooke, 4500N, MS 6269 5. T. R. Curlee, 4500N, MS 6205 6. M. B. Gettings, 3147, MS 6070 7. L. G. Hill, 4500N, MS 6205 8. J. 0. Kolb, 3147, MS 6070 9. W. P. Levins, 3 147, MS 6070 10. J. M. MacDonald, 3147, MS 6070 11. W. R. Mixon, 3147, MS 6070 12. T. R. Sharp, 3147, MS 6070
13. A. C. Schaffhauser, 4500N, MS 6188
D. L. White, 4500N, MS 6206 14-100.4500N, H-l1D 101. 102. Central Research Library 103. Document Reference Section 104-5. Laboratory Records 106. Laboratory Records-RC 107. OFWL Patent Office
EXTERNAL DISTRIBUTION
108.
109.
110.
111.
112.
113.
114-1 16. 117.
118.
119.
120.
D. A. Beschen, U.S. Department of Energy, 5G-023, EE-70, lo00 Independence Ave., SW, Washington, DC 20585. D. R. Bohi, Director, Energy and Natural Resources Division, Resources for the Future, 1616 P Street, N.W., Washington, DC 20036. T. E. Drabek, Professor, Department of Sociology, University of Denver, Denver, Colorado 80208-0209 M. A. Fowler, U.S. Department of Energy, 56-023, EE-532, lo00 Independence Avenue, S.W., Washington, DC 20585. C. D. MacCracken, President, Calmac Manufacturing Corporation, 101 West Sheffield Avenue, P.O. Box 7 10, Englewood, NJ 0763 1 Office of the Assistant Manager, Energy Research and Development, Department of Energy, P.O. Box 2008, DOE Field Office, Oak Ridge, TN 37831-6269. OSTI, U.S. Department of Energy, P.O. Box 62, Oak Ridge, TN 3783 1. J. B. Shrago, Director, Office of Technology Transfer, 405 Kirkland Hall, Vanderbilt University, Nashville, TN 37240 G. F. Sowers, P.E., Senior Vice President, Law Companies Group, Inc., 114 Townpark Drive, Suite 250, Kennesaw, GA 30144-5599 J. Van Vlandren, U.S. Department of Energy, EE-532, lo00 Independence Ave., SW, Washington, DC 20585 C. M. Walton, Paul D. and Betty Robertson Meek Centennial Professor and Chairman, Department of Civil Engineering, College of Engineering, The University of Texas at Austin, Cockrell Hall, Suite 4.2, Austin, TX 78712