standard title slide - sk telecom · marketing exp./sales ... total operating revenue 3,304 3,223...
TRANSCRIPT

November 2014
Investor Presentation

This material contains forward-looking statements with respect to the financial condition, results of operations and business of
SK Telecom and its subsidiaries (the “Company”) and plans and objectives of the management of the Company. Statements
that are not historical facts, including statements about the Company’s beliefs and expectations, are forward-looking
statements. Such forward-looking statements involve known and unknown risks, uncertainties and other factors which may
cause the actual results or performance of the Company to be materially different from any future results or performance
expressed or implied by such forward-looking statements.
The Company does not make any representation or warranty, expressed or implied, as to the accuracy or completeness of the
information contained in this management presentation, and nothing contained herein is, or shall be relied upon as, a promise
or representation, whether as to the past or the future. Such forward-looking statements were based on current plans,
estimates and projections of the Company and the political and economic environment in which the Company will operate in
the future, and therefore you should not place undue reliance on them.
Forward-looking statements speak only as of the date they are made, and the Company undertakes no obligation to update
publicly any of them in light of new information or future events. Additional information concerning these and other risk
factors are contained in the Company’s latest annual report on Form 20-F and in the Company’s other filings with the U.S.
Securities and Exchange Commission (SEC).
1
Disclaimer

Table of Contents
2
3
8
11
14
15
Ⅰ. Key Takeaways
Ⅱ. Financial Results
Ⅲ. Operating Results
Ⅳ. Shareholder Return
Ⅴ. Appendix

3
ARPU Ⅰ. Key Takeaways
[ Number of LTE subscribers ] [ Billing ARPU ]
0.6
7.5
13.5
14.8 15.4
16.2
'11 '12 '13 '14.1Q 2Q 3Q
23.0% 27.8%
49.3%
53.2% 55.2% 57.0%
% of total subscribers
Subscribers (mn)
33.7 34.0
34.9
35.7 35.3
36.0
36.4
4.4%
3.3%
5.4% 5.6%
4.9%
5.9%
4.3%
'13.1Q 2Q 3Q 4Q '14.1Q 2Q 3Q
ARPU (KRW ‘000)
YoY growth
Expanding LTE subscribers continues to drive ARPU

3.1
2.8 2.9
2.7
2.9
2.4
2.8
29.1% 26.6% 25.7% 25.4%
33.7%
25.3% 25.2%
'13.1Q 2Q 3Q 4Q '14.1Q 2Q 3Q
4
Marketing Expenses Ⅰ. Key Takeaways
[ Marketing stats]
Gross adds, incl. upgrading subs. (in mn)
Marketing exp./sales
In ‘14.3Q, marketing exp. to sales ratio remained flat
while the 18% QoQ increase in gross adds, including
upgrading subs, placed upward pressure
Lower subscriber acquisition costs contained overall
marketing expenses
Marketing expenses remained flat QoQ despite increases in new and upgrading subscribers

5
Data Usage Trend Ⅰ. Key Takeaways
Comfortably managing the rising LTE data traffic with existing frequency assets and leveraging highly
efficient network management tools
1.1
1.7 1.8
2.1 2.1 2.2 2.2 2.2
2.6
2.9
'11.12 '12.6 '12.12 '13.6 '13.12 '14.6
[ Monthly LTE data usage per sub ]
(GB)
Ample 40MHz of LTE spectrum to accommodate rising LTE data traffic
- Acquired 20MHz at the 1.8GHz band in 2013
- Repurposed from 3G to LTE service, 10MHz at the 2.1GHz band
Launched unlimited T&T
voice plans (‘13.3.22)
Launched unlimited
LTE data plans (‘14.4.3)
‘14.9

SKT at the forefront of IoT growth
6
IoT/B2B Solution Ⅰ. Key Takeaways
[ High speed mobile data network ]
[ Devices for IoT ]
[ Solutions and platforms ]
[ Data / Content ]
Internet of Things
- Global IoT market to grow 23% YoY, and devices by 22% YoY
Wide and deep LTE-A coverage: 201K base stations
World’s first to develop 3 band 300Mbps LTE-A technology
- Demonstrated 450Mbps technology at the Mobile World Congress 2014
Developing 5Gbps technology for 5G
Development of devices for B2B, M2M services, including remote metering, surveillance camera and vehicle control
Launched various B2C devices; smart beam, smart speaker, health-on Shine
Gaining core competencies in design and production through acquisitions such as Iriver and Inoio
Well prepared to make the next leap for growth
B2B solutions showing strong growth
- KRW 430 bn in sales in 2013
- 1.2 mn IoT/M2M connections (connected car, safety, etc.)
Acquired of NSOK enhances the offering of security solution
Compiling significant store of big data
Utilizing data processing, analytics to expand big data application
- Developing big data analytic engine
- Cooperating with credit card and insurance companies and Seoul city to develop new applications
- T phone utilizes big data to filter spam calls
“Completion of IoT
Value Chain ”

7
SK Planet Ⅰ. Key Takeaways
[ Market place ]
Solidify domestic market position
- Mobile 11st and curation services (“Shocking Deal”) are driving growth of the 11st platform
- Mobile 11st GMV to double in 2014; cumulative GMV thru Sep. reached KRW 1 tn (No. 1 mobile marketplace in Korea)
1.21
1.44
'13.3Q 14.2Q '14.3Q
+19% growth (KRW tn)
[ Global commerce ]
Acquired Shopkick to expand global O2O services
- No. 1 in the rapidly growing US O2O market
[ Smart offering ]
Expanding the online to offline (“O2O”) service with the launch of syrup
- User base of 12 mn and growing
- Expanding O2O service areas to high traffic merchant districts
Renewed OK Cashbag membership service (‘14.6) which combines coupons and points to provide enriched shopping experience
- Daily active users up 2X from Jun.
Strengthen market presence through Gifticon
- Sales of Gifticon at 11st showing monthly growth of 40%
“Global Leader in Next Commerce”
“2016 Enterprise Value: KRW 5 trillion”
Expanding 11st’s reach in Asia
- n11.com (Turkey): Led market GMV in Sep. (6 mn monthly visitors)
- Elevenia ( Indonesia): Cumulative seven month GMV of KRW 10 bn and monthly UV of 2.7 mn
- To be launched in Malaysia with Celcom Axiata
SK Planet strives to be a global leader in Next Commerce with 5 trillion won in Enterprise Value
11st GMV
Launched Gificon in Japan

8
Summary of Income Statement (Consolidated)
SK Telecom (“SKT” or the “Company”) operating revenue
increased 5.9% YoY and 1.4% QoQ led by the growth of
the LTE service and new businesses, the acquisition of
SK Networks’ retail business by PS&Marketing, and the
earnings growth of subsidiary companies
Operating income decreased 2.7% YoY and 1.7% QoQ
as the rise in PS&Marketing’s cost of goods sold and
the rise in SKT’s new subscribers increased expenses
Consolidated net income increased 5.7% YoY and 6.7%
QoQ due to the equity gains from SK Hynix (3Q14 KRW
269.9 bn)
(KRW bn) 3Q14 3Q13 3Q14 2Q14
Operating revenue 4,367 4,125 243 5.9% 4,367 4,305 62 1.4%
Operating expenses 3,831 3,573 258 7.2% 3,831 3,759 72 1.9%
Operating income 537 551 (15) -2.7% 537 546 (10) -1.7%
Operating margin 12.3% 13.4% -1.1%p 12.3% 12.7% -0.4%p
Net profit or loss
from non-operating items1) 129 (122) 251 206.1% 129 62 67 108.7%
Income from continuing
operations
before income tax
666 430 236 54.9% 666 608 58 9.5%
Consolidated net income 531 502 29 5.7% 531 498 33 6.7%
Net margin 12.2% 12.2% 0.0%p 12.2% 11.6% 0.6%p
EBITDA2) 1,258 1,258 (0) 0.0% 1,258 1,264 (6) -0.5%
EBITDA margin 28.8% 30.5% -1.7%p 28.8% 29.3% -0.6%p
1) The equity gains from SK Hynix 3Q14 amounted to KRW 269.9 bn
2) EBITDA = Operating income + Depreciation (including R&D related depreciation)
YoY QoQ
Ⅱ. Financial Results

9
Operating Expenses (Consolidated)
Labor cost increased 13.2% YoY and 2.5% QoQ due to
the rise in the number of employees
Commissions paid decreased 1.7% YoY and 2.8% QoQ
due to the acquisition of SK Networks’ retail business by
PS&Marketing
Depreciation increased 2.1% YoY and 0.5% QoQ due to
the increase in LTE network capex and amortization of
spectrum assets
Cost of goods sold increased 54.8% YoY and 20.3% QoQ
in line with the growth of SKT’s and PS&Marketing’s
(including the impact from the acquisition of SK
Networks’ retail business) product sales
(KRW bn) 3Q14 3Q13 3Q14 2Q14
Labor cost 411 363 48 13.2% 411 401 10 2.5%
Commissions paid 1,327 1,350 (23) -1.7% 1,327 1,364 (38) -2.8%
Advertising 105 92 13 14.4% 105 100 5 5.0%
Depreciation1) 721 706 15 2.1% 721 717 4 0.5%
Network interconnection 286 265 21 8.1% 286 281 6 2.0%
Leased line 53 62 (9) -14.2% 53 54 (1) -1.9%
Frequency usage fees 49 52 (3) -6.0% 49 47 2 3.4%
Cost of goods sold 474 306 168 54.8% 474 394 80 20.3%
Others 405 377 28 7.3% 405 401 4 1.1%
Operating expenses 3,831 3,573 258 7.2% 3,831 3,759 72 1.9%
1) Includes R&D related depreciation
YoY QoQ
Ⅱ. Financial Results

2,621 2,666 2,689 2,782 2,727 2,787 2,768 2,828
2,767 2,794 2,814
254 264 252
166 210 217 231
240 270 241 241 132
138 157 211 175 205 224
248 227 229 249
2,000
2,500
3,000
'12.1Q '12.2Q '12.3Q '12.4Q '13.1Q '13.2Q '13.3Q '13.4Q '14.1Q '14.2Q '14.3Q
New Business & Others Interconnection Mobile Service Revenue
(KRW bn)
10
[ SK Telecom Operating Revenues ]
Operating Revenues (Non-consolidated)
Total operating revenue increased 2.5% YoY and 1.2%
QoQ led by the growth of the LTE service and increased
new business-related sales
- Interconnection revenue fell 0.3% QoQ due to the
seasonal effect
- Strong sales of B2B businesses and product
continued to account for an increasing portion of
total revenue
[ New Business & Others, % of Total Revenue ]
Year/Quarter % of Rev
’11 5.1%
’12 5.2%
’13 6.6%
’14.1Q 6.9%
’14.2Q 7.0%
’14.3Q 7.5%
(KRW bn) 3Q14 3Q13 3Q14 2Q14
Total operating revenue 3,304 3,223 81 2.5% 3,304 3,265 39 1.2%
Mobile service revenue 2,814 2,768 46 1.7% 2,814 2,794 20 0.7%
Interconnection revenue 241 231 10 4.2% 241 241 (1) -0.3%
New business & others1) 249 224 25 11.1% 249 229 20 8.5%
1) Includes sales from leased line, fixed-line resale, solution and other businesses
YoY QoQ
3,007 3,069 3,097
3,159 3,112
3,209 3,223 3,265 3,316 3,264 3,304
Ⅱ. Financial Results
(KRW ‘000)
11
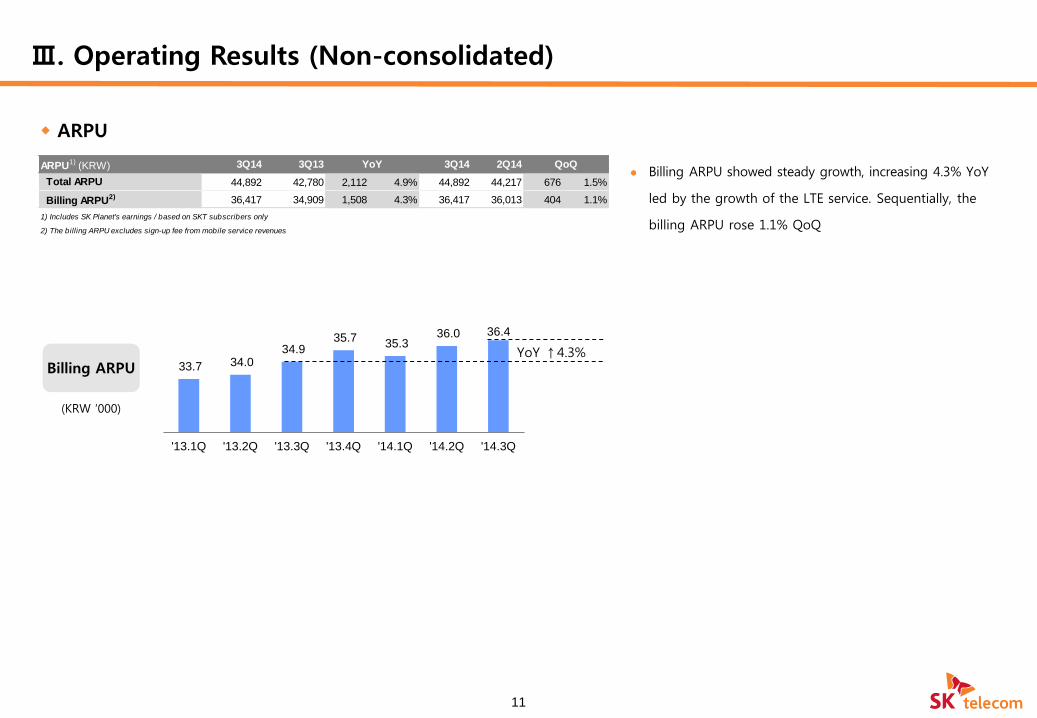
ARPU
Ⅲ. Operating Results (Non-consolidated)
Billing ARPU showed steady growth, increasing 4.3% YoY
led by the growth of the LTE service. Sequentially, the
billing ARPU rose 1.1% QoQ
Billing ARPU 33.7 34.0 34.9
35.7 35.3
36.0 36.4
'13.1Q '13.2Q '13.3Q '13.4Q '14.1Q '14.2Q '14.3Q
YoY ↑4.3%
ARPU1) (KRW) 3Q14 3Q13 3Q14 2Q14
Total ARPU 44,892 42,780 2,112 4.9% 44,892 44,217 676 1.5%
Billing ARPU2) 36,417 34,909 1,508 4.3% 36,417 36,013 404 1.1%
1) Includes SK Planet's earnings / based on SKT subscribers only
2) The billing ARPU excludes sign-up fee from mobile service revenues
YoY QoQ

Subscriber Numbers
The number of LTE subscribers reached 16.2 mn in 3Q14.
Over 57% of SKT’s subscribers are currently on the LTE
service
The churn rate recorded 2.0%, continuing its general
downtrend
12
[ Monthly Churn Rate Trend ]
9.8 6.9 5.0 4.0 3.8 3.8 3.6
15.9 19.0
14.5 9.9 9.2 8.8 8.6
0.6 7.5
13.5 14.8 15.4 16.2
-
10.0
20.0
'10 '11 '12 '13 '14.1Q '14.2Q '14.3Q
LTE
WCDMA
CDMA
25.7 26.6 27.0 27.4
3.9
11.1
16.0 18.3 18.8 18.9 19.3
15.2% 41.7%
59.3% 66.9% 67.7% 67.9% 68.0%
0.0%
50.0%
100.0%
150.0%
200.0%
0.03.06.09.0
12.015.018.0
'10 '11 '12 '13 '14.1Q '14.2Q '14.3Q
Subscribers
% of Total
Subscriber-
base
27.8
Year/
Quarter
Churn
Rate
Year/
Quarter
Churn
Rate
’07 2.6% ’12 2.6%
’08 2.7% ’13 2.3%
’09 2.7% ’14.1Q 2.3%
’10 2.7% ’14.2Q 1.9%
’11 2.7% ’14.3Q 2.0%
(mn)
Smartphone
Subscribers
(mn)
Subscriber
by Network
27.9 28.4
3Q14 3Q13 3Q14 2Q14
Subscribers ('000) 28,403 27,211 1,193 4.4% 28,403 27,889 514 1.8%
Net adds 514 71 443 624.6% 514 76 438 578.9%
Activations 2,218 1,903 315 16.6% 2,218 1,641 577 35.2%
Deactivations 1,705 1,832 (127) -7.0% 1,705 1,566 139 8.9%
Monthly churn rate (%) 2.0% 2.2% -0.2%p 2.0% 1.9% 0.1%p
Average subscribers ('000) 28,146 27,164 982 3.6% 28,146 27,769 377 1.4%
Smartphone Subscribers ('000) 19,325 17,917 1,408 7.9% 19,325 18,926 399 2.1%
LTE Subscribers ('000) 16,212 12,273 3,938 32.1% 16,212 15,381 831 5.4%
YoY QoQ
Ⅲ. Operating Results (Non-consolidated)

Marketing Expenses & Capex
Marketing expenses increased 0.6% YoY and 0.9% QoQ
due to the rise in new subscribers
Capex deployment is being executed within the 2014
guidance
Marketing
Expenses
Capex
(KRW bn)
(KRW bn)
13
907 853 827 842
1,100
825 832
29.1% 26.6% 25.7% 25.4% 33.7% 25.3% 25.2%
0.0%
50.0%
100.0%
150.0%
200.0%
- 100 200 300 400 500 600 700 800 900
1,000 1,100
'13.1Q '13.2Q '13.3Q '13.4Q '14.1Q '14.2Q '14.3Q
Marketing Expenses
% of Operating Revenue
322 223 305
1,053
223 424 505
29 71
114
201
42
93 83
'13.1Q '13.2Q '13.3Q '13.4Q '14.1Q '14.2Q '14.3Q
Non-Network
Network
(KRW bn) 3Q14 3Q13 3Q14 2Q14
Marketing expenses1) 832 827 5 0.6% 832 825 7 0.9%
% of operating revenue 25.2% 25.7% -0.5%p 25.2% 25.3% -0.1%p
Capital expenditure 588 419 170 40.5% 588 517 71 13.7%
% of operating revenue 17.8% 13.0% 4.8%p 17.8% 15.8% 2.0%p
1) Marketing expenses = marketing related commission + advertising expense
YoY QoQ
351 293
419
1,254
265
517 588
Ⅲ. Operating Results (Non-consolidated)

14
Ⅳ. Shareholder Return
Maintain strong shareholder return policy
(in KRW bn)
Cash Dividends
Shareholder
Return
‘07 ‘08 ‘09 ‘10 ‘11 ‘12 ’13
Dividend Policy DPS
Dividend Per Share
KRW 9,400 / Share
Payout Ratio 42% 53% 53% 34% 39% 53% 73%
Paid annual cash dividend of KRW 9,400/share since
2007 including interim dividend of KRW 1,000/share
* Record date for 2014 interim dividend: June 30th
Commenced share buyback in 4 out of past 7 years
0
0
0
0
0
1
1
1
1
1
1
'07 '08 '09 '10 '11 '12 '13
현금배당 자사주*
680
880 864
210 208
774
92
801
119 655 666
Cash Share Buyback

15
Consolidated Income Statement
Appendix
(KRW bn) 1Q13 2Q13 3Q13 4Q13 FY13 1Q14 2Q14 3Q14
Operating revenue 4,065.7 4,117.0 4,124.6 4,294.8 16,602.1 4,201.9 4,305.4 4,367.5
Operating expenses 3,661.1 3,571.5 3,573.2 3,785.1 14,590.9 3,949.5 3,759.3 3,830.9
Labor cost 444.0 359.2 363.2 395.0 1,561.4 429.1 401.1 411.2
Commissions paid 1,422.9 1,360.2 1,349.6 1,366.1 5,498.7 1,627.6 1,364.3 1,326.7
Advertising 63.4 108.8 91.6 130.3 394.1 85.3 99.9 104.8
Depreciation1) 679.0 706.3 706.4 728.1 2,819.8 703.2 717.4 721.0
Network interconnection 252.5 252.3 264.9 274.0 1,043.7 275.8 280.7 286.3
Leased line 63.4 61.6 62.0 55.4 242.3 56.0 54.2 53.2
Frequency usage fees 50.2 55.0 51.7 49.6 206.5 50.2 47.0 48.6
Cost of goods sold 318.8 305.3 306.3 369.9 1,300.4 335.7 394.0 474.1
Others 366.9 362.9 377.4 416.9 1,524.1 386.5 400.6 405.0
Operating income 404.5 545.4 551.4 509.7 2,011.1 252.4 546.1 536.6
EBITDA 1,083.5 1,251.7 1,257.9 1,237.8 4,830.9 955.6 1,263.5 1,257.6
EBITDA margin 26.7% 30.4% 30.5% 28.8% 29.1% 22.7% 29.3% 28.8%
Net profit or loss from non-operating items 15.4 47.5 (121.7) (125.2) (184.0) 80.2 61.9 129.2
Interest income 17.0 15.9 14.9 17.9 65.6 15.5 14.3 15.5
Interest expenses 89.2 83.0 78.7 81.0 331.8 78.6 82.6 82.2
Profit or loss in other non-operating items 87.6 114.6 (57.9) (62.1) 82.3 143.3 130.2 195.8
Income from continuing operations before tax 420.0 592.9 429.7 384.5 1,827.1 332.6 608.0 665.8
Income(Loss) from discontinued operations2) 6.0 5.9 171.9 (0.5) 183.2 - - -
Consolidated net income 345.9 467.7 502.2 293.7 1,609.5 267.3 497.6 531.0
Majority interests 354.2 466.6 504.0 314.1 1,639.0 269.8 498.5 531.5
Minority interests (8.2) 1.1 (1.8) (20.5) (29.4) (2.5) (0.9) (0.5)
Basic earnings per share(KRW) 5,081 6,663 7,086 4,388 23,211 3,804 6,909 7,493
1) Includes R&D related depreciation
2) Income(loss) from discontinued operations: Income or loss on discontinuation of Loen Entertainment

16
Appendix
SK Telecom Non-consolidated Income Statement
(KRW bn) 1Q13 2Q13 3Q13 4Q13 FY13 1Q14 2Q14 3Q14
Operating revenue 3,112.1 3,209.1 3,222.9 3,316.3 12,860.4 3,263.7 3,264.6 3,303.6
Operating expenses 2,692.0 2,676.8 2,685.7 2,836.2 10,890.7 3,012.4 2,736.9 2,797.9
Labor cost 205.3 135.7 134.3 149.1 624.3 171.2 153.0 138.8
Commissions paid 1,364.1 1,296.9 1,295.5 1,351.9 5,308.4 1,584.0 1,299.4 1,336.5
Marketing commissions 871.8 777.4 768.7 773.0 3,190.9 1,061.0 767.6 772.5
Other commissions 492.3 519.5 526.8 578.9 2,117.5 522.9 531.8 564.0
Advertising 34.7 75.4 58.2 69.0 237.3 39.4 57.1 59.4
Depreciation1) 503.6 531.9 528.1 551.9 2,115.5 536.5 547.1 549.3
Network interconnection 176.4 184.6 197.7 211.4 770.1 214.9 219.9 226.6
Leased line 53.8 51.6 51.0 49.3 205.7 46.7 45.5 45.6
Frequency usage fees 50.2 55.0 51.7 49.6 206.5 50.2 47.0 48.6
Others 303.9 345.7 369.1 404.0 1,422.8 369.6 368.0 393.3
Operating income 420.1 532.2 537.2 480.1 1,969.7 251.3 527.7 505.7
EBITDA 923.7 1,064.1 1,065.3 1,032.1 4,085.2 787.8 1,074.7 1,055.0
EBITDA margin 29.7% 33.2% 33.1% 31.1% 31.8% 24.1% 32.9% 31.9%
Net profit or loss from non-operating items (39.9) (135.3) (321.0) (252.7) (748.9) (55.3) (83.2) (131.3)
Interest income 8.4 8.0 7.6 8.2 32.3 6.8 6.0 6.3
Interest expenses 72.8 69.5 65.6 65.5 273.5 63.9 68.5 67.2
Net profit or loss from other non-operating items 24.5 (73.8) (262.9) (195.4) (507.7) 1.7 (20.8) (70.4)
Income from continuing operations before tax 380.2 396.9 216.2 227.5 1,220.8 195.9 444.4 374.4
Net income 302.2 313.4 126.1 168.4 910.2 153.5 363.4 293.3
1) Includes R&D related depreciation

17
Appendix
Consolidated Balance Sheet
(KRW bn) 1Q13 2Q13 3Q13 4Q13 1Q14 2Q14 3Q14
Total assets 25,408.8 25,436.4 25,933.5 26,576.5 26,067.2 27,027.6 27,685.0
Current assets 5,081.7 5,230.7 5,381.6 5,123.4 4,781.8 5,592.6 5,740.2
Cash and marketable securities1) 1,493.0 1,693.5 1,937.0 1,765.1 1,384.1 1,652.0 1,665.3
Accounts receivable 2,920.7 2,936.1 2,911.3 2,900.9 2,886.8 3,230.6 3,515.3
Short-term loans 93.3 77.9 76.1 79.4 86.8 83.0 79.1
Inventories 205.1 179.6 176.2 177.1 189.4 399.9 236.8
Other current assets 369.6 343.6 281.1 200.9 234.7 227.2 243.7
Non-current assets 20,327.2 20,205.7 20,551.8 21,453.1 21,285.4 21,435.0 21,944.8
Property & equipment 9,604.1 9,402.7 9,404.3 10,212.4 9,982.9 10,073.2 10,232.7
Intangible assets 4,389.9 4,303.5 4,440.8 4,484.0 4,387.1 4,317.7 4,238.3
Investment assets 5,808.6 6,025.4 6,244.5 6,302.0 6,439.5 6,534.9 6,941.7
Other non-current assets 524.5 474.2 462.3 454.7 475.9 509.3 532.2
Total liabilities 13,041.1 12,060.0 12,150.5 12,410.0 12,242.3 12,824.5 12,940.9
Current liabilities 6,287.1 5,688.5 5,653.3 6,069.2 6,283.3 6,162.7 6,063.2
Short-term borrowings 160.0 60.5 80.5 260.0 766.0 869.5 787.4
Accounts payable 1,966.5 1,703.5 1,416.1 2,190.8 1,288.9 1,595.0 1,619.6
Current portion of long-term debt 910.3 1,553.1 1,691.1 1,269.0 1,152.4 1,143.7 1,162.5
Other current liabilities 3,250.4 2,371.4 2,465.6 2,349.4 3,076.0 2,554.4 2,493.7
Non-current liabilities 6,754.0 6,371.5 6,497.2 6,340.7 5,958.9 6,661.8 6,877.7
Bonds payable & long-term borrowings 5,750.3 5,431.6 5,180.1 5,010.4 4,748.1 5,251.9 5,355.8
Long-term payables - other 565.6 558.1 835.4 838.6 657.2 660.8 681.1
Post-employment benefit obligation 102.3 119.8 137.5 74.2 99.0 125.8 154.9
Other non-current liabilities 335.8 262.0 344.1 417.6 454.5 623.3 686.0
Total shareholders' equity 12,367.7 13,376.5 13,783.0 14,166.6 13,825.0 14,203.2 14,744.1
Capital stock 44.6 44.6 44.6 44.6 44.6 44.6 44.6
Capital surplus 2,924.8 3,323.4 3,323.4 3,323.4 3,323.4 3,323.4 3,323.4
Retained earnings 11,890.3 12,353.4 12,785.1 13,102.5 12,772.6 13,254.6 13,716.4
Capital adjustments (3,276.8) (3,101.5) (3,087.0) (3,005.8) (3,006.0) (3,034.6) (3,034.6)
Other comprehensive income/loss2) 2.2 (27.5) (18.2) (12.3) (21.1) (94.1) (25.0)
Minoriry interests 782.6 784.1 735.1 714.2 711.5 709.3 719.3
1) Cash & marketable securities includes cash & cash equivalent, marketable securities & short-term financial
2) Other comprehensive income/loss include gains or losses on valuation of investment securities and derivatives

18
SK Telecom Non-consolidated Balance Sheet
Appendix
(KRW bn) 1Q13 2Q13 3Q13 4Q13 1Q14 2Q14 3Q14
Total assets 22,391.5 22,147.4 22,416.2 22,827.4 22,256.0 22,494.0 22,829.6
Current assets 2,765.8 2,809.9 2,956.8 2,817.8 2,563.8 2,755.0 2,941.3
Cash and marketable securities1) 631.3 659.3 754.5 669.5 489.7 568.2 592.8
Accounts receivable 1,871.3 1,909.1 1,964.2 1,901.6 1,802.5 1,936.1 2,099.3
Short-term loans 84.7 68.4 68.5 72.2 80.1 75.7 72.3
Inventories 10.5 10.4 12.2 24.6 30.3 22.2 16.5
Other current assets 168.0 162.7 157.5 149.9 161.2 152.8 160.5
Non-current assets 19,625.7 19,337.5 19,459.4 20,009.6 19,692.2 19,739.1 19,888.3
Property & equipment 7,043.8 6,866.0 6,818.4 7,460.0 7,282.2 7,318.7 7,442.8
Intangible assets 3,419.4 3,351.2 3,506.7 3,545.4 3,459.3 3,374.1 3,288.2
Investment assets 8,810.6 8,786.2 8,831.7 8,747.4 8,688.4 8,794.1 8,896.3
Other non-current assets 351.9 334.1 302.6 256.9 262.3 252.1 260.9
Total liabilities 10,326.9 9,284.3 9,386.5 9,512.0 9,424.0 9,343.7 9,428.9
Current liabilities 4,591.6 3,656.0 3,600.7 4,288.1 4,511.9 4,110.6 4,135.9
Short-term borrowings 40.0 - - 260.0 400.0 700.0 600.0
Accounts payable 1,430.3 1,106.9 923.2 1,656.6 977.5 847.1 1,017.0
Current portion of long-term debt 710.4 1,062.9 1,101.6 829.5 917.3 902.7 915.2
Other current liabilities 2,410.9 1,486.2 1,575.9 1,541.9 2,217.1 1,660.9 1,603.7
Non-current liabilities 5,735.3 5,628.4 5,785.7 5,223.9 4,912.0 5,233.1 5,293.0
Bonds payable & long-term borrowings 4,764.4 4,729.5 4,579.8 4,099.9 3,945.3 4,138.5 4,174.6
Long-term payables 555.4 547.4 824.5 828.7 646.6 650.0 653.5
Post-employment benefit obligation 42.0 49.5 56.0 22.9 29.3 42.2 48.8
Other non-current liabilities 373.5 302.0 325.4 272.4 290.8 402.4 416.1
Total shareholders' equity 12,064.7 12,863.1 13,029.7 13,315.4 12,832.0 13,150.3 13,400.7
Capital stock 44.6 44.6 44.6 44.6 44.6 44.6 44.6
Capital surplus 2,920.9 3,319.4 3,319.4 3,319.4 3,319.4 3,319.4 3,319.4
Retained earnings 12,128.4 12,437.8 12,491.3 12,665.7 12,220.2 12,568.7 12,793.1
Capital adjustments (3,157.1) (2,981.0) (2,966.5) (2,885.5) (2,885.5) (2,885.5) (2,885.5)
Other comprehensive income/loss2) 127.8 42.3 140.9 171.2 133.3 103.1 129.0
1) Cash & marketable securities includes cash & cash equivalent, marketable securities and short-term financial instruments
2) Other comprehensive income/loss includes gains or losses on valuation of investment securities and derivatives

19
IR Contacts
Dong Seop Kim (82-2-6100-1464, [email protected])
Hye Seung Han (82-2-6100-3681, [email protected])
Hun Lee (82-2-6100-1334, [email protected])
Woo Sun Cho (82-2-6100-1638, [email protected])
Jung Hyun Kim (82-2-6100-1582, [email protected])