stars and zombies - pwc · 54% to the zombie groups • only star companies show growth while...
TRANSCRIPT

PwC
Stars and Zombies Greek corporates coming out of the crisis
www.pwc.gr
Executive summary
June 2014
PwC
Growth for Greece
Introduction
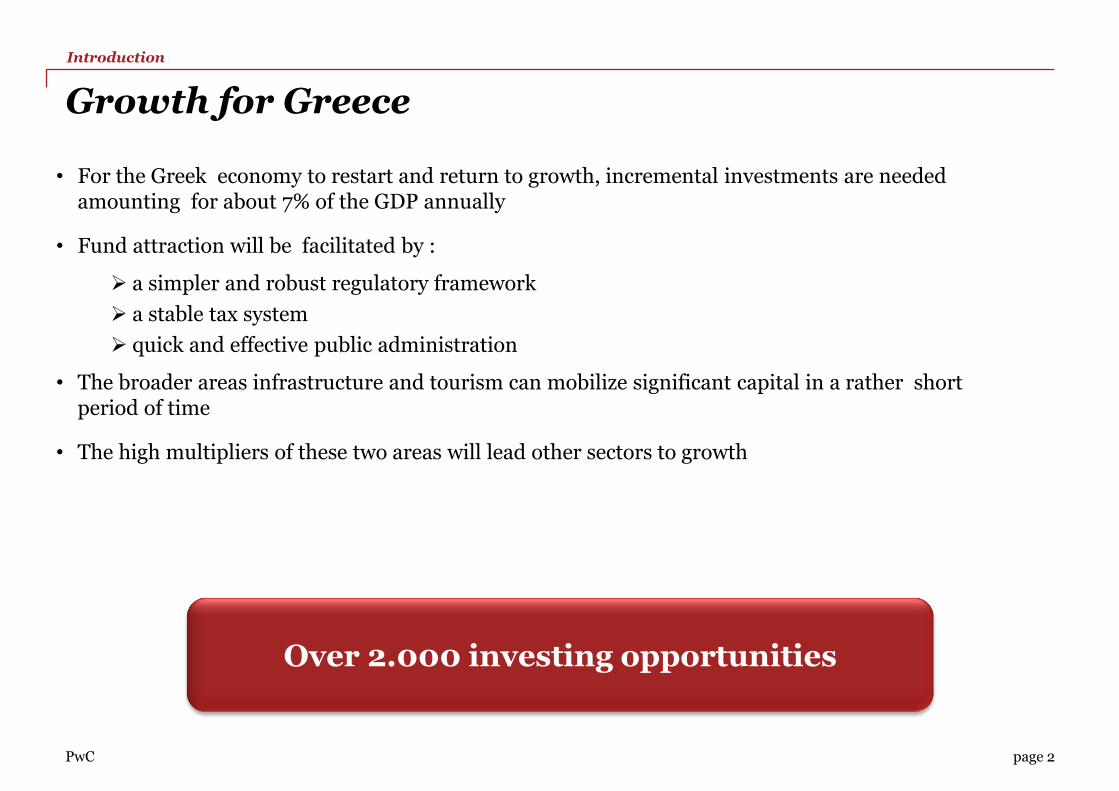
• For the Greek economy to restart and return to growth, incremental investments are needed amounting for about 7% of the GDP annually
• Fund attraction will be facilitated by :
a simpler and robust regulatory framework
a stable tax system
quick and effective public administration
• The broader areas infrastructure and tourism can mobilize significant capital in a rather short period of time
• The high multipliers of these two areas will lead other sectors to growth
Over 2.000 investing opportunities
page 2

PwC
The value pyramid of the Greek corporate economy
page 3
Stars
Almost Stars
Other
% Revenue 2012 % EBITDA 2012
% Total Debt 2012 % Number of personnel 2012
Zombies
Policy Dimensions
Companies
3.000 companies with revenues
>€10m.
~ 25% of GDP
~ 500.000 employees
650
628
1.269
179 5% 6%
0,4% 4%
32%
10%
52%
24%
56%
69%
67%
57%
7%
21%
-25%
14%

PwC page 4
Methodology (1/3)
Methodology
• The Greek active limited liability companies are in total 23,376. A sample of 3,153 (13.5%) companies that had annual revenues of more than €10 mn in any given year during the period 2008-2012 was selected
• The data used for the period 2008-2012 were extracted from the published financial statements of the companies. For 197 companies whose financial statements were not available for 2012 we estimated their financial data based on that of previous years
• For 12 Groups of companies, which were centrally financed, consolidated figures were used instead of individual company figures
• The companies whose debt is guaranteed by the Greek state have been excluded from the sample
• 203 companies were excluded from the sample for a number of reasons, ending up with 2,950 companies
• These 2,950 companies represent 85% of revenues and 67% of Fixed Assets of the total corporate economy

PwC
Methodology (2/3)
• The companies were classified in terms of Growth, Profitability and Debt Sustainability
• The criteria chosen for the classification of the companies were the Compound Annual Growth Rate of Revenue
(2008-2012), Return on Capital Employed (ROCE) and the Net Debt / EBITDA
Criteria Star Grey Zombie
CAGR Revenue (2008-2012)
Greater than 5% Between -5% and 5% Less than -5%
ROCE Greater than 15% Between 0% and 15% Less than 0% or Capital Employed
<0
Net debt/ EBITDA Less than 1.5 or Net Debt <0 Between 1.5 and 5 Greater than 5 or
EBITDA <0
page 5
Methodology

PwC
Methodology (3/3)
• By combining the three financial variables 27 different classes of companies were created
• According to the ranking against each of the criteria, the classes formed are combinations such as for example SGZ (Star,
Grey, Zombie)
• Classes with similar characteristics were merged into 10 Groups in order to facilitate statistical analysis
• 76 companies which have applied for restructuring under Article 99 of law 3588/07 have been classified as Zombies
(-5*)
• The groups were further consolidated into three groupings (Stars: 5*/4*/3*/2*, Grey: 1*/-1*, Zombies: -2*/-3*/-4*/-
5*) in order to facilitate the understanding of the dynamics
No Groups Classes Designation Groupings
1 Group 5* SSS Stars Stars
2 Group 4* SSG+SGS+GSS Almost Stars
Almost Stars 3 Group 3* SGG+GSG+GGS Aspiring Stars
4 Group 2* SSZ+SZS+ZSS Stars with Zombie aspects
5 Group 1* GGG Good Grey
6 Group -1* GSZ+SGZ+ZGS+GZS+SZG+ZSG Mixed Bags
7 Group -2* ZGG+GZG+GGZ Departing Good
Almost Zombies 8 Group -3* ZZS+ZSZ+SZZ Zombies with Star aspects
9 Group -4* ZZG+ZGZ+GZZ Almost Zombies
10 Group -5* ZZZ Zombies Zombies
page 6
Methodology

PwC page 7
Significant decline of economic activity, yet no extensive damage of the production fabric of the economy (1/2)
Outlook of the economy
• The sample had in 2012 revenues of almost €141bn, €120bn capital employed, €61bn debt and approximately 470k employees during the period 2008-2012
• Almost 1/3 of the sample’s revenue derives from 12 Groups of companies
• Aggregate sample revenue decreased 13.6% between 2008-2012, with total assets going down by 5.1 % and fixed assets remaining almost constant
• Profitability, in terms of EBITDA, decreased by 40.6% while Earnings Before Taxes collapsed from €6bn in 2008 to - €1bn in 2012. In addition, during the same period capital employed was under remunerated
• Capital employed dropped by only 6.8%, debt by 5.9% and shareholders' equity by 7.9% over the period 2008-2012 , suggesting that the production fabric of the economy remained active
• Financing shrank by 8% leading to a 24.3% contraction of working capital through increases in short term liabilities
• Debt sustainability of the sample deteriorated substantially between 2008 and 2012, with loans representing in 2012 about 52% of capital employed
• In summary, despite the fact that the capital structure of the sample did not change significantly, the decrease in revenue and the shrinkage of profitability had a major impact on debt servicing for a significant number of companies

PwC
Significant decline of economic activity, yet no extensive damage of the production fabric of the economy (2/2)
Outlook of the economy
page 8 Groups Other Companies
50 43 46 49 50
113 107 101 97 91
dRevenue (%)
-13,6%
-2%
0%
2%
4%
6%
8%
10%
0
20
40
60
80
100
120
140
160
180
2008 2009 2010 2011 2012
Total Revenue (€ bn.)
37 40 41 43 41
66 70 70 65 61
ROCE
-0,1%
0%
1%
2%
3%
4%
5%
6%
7%
8%
0
20
40
60
80
100
120
2008 2009 2010 2011 2012
Fixed Assets(€ bn.)
16 16 17 19 17
35 36 37 35 32
Net Debt/ EBITDA (x)
-3,6%
0
1
2
3
4
5
6
7
0
10
20
30
40
50
60
2008 2009 2010 2011 2012
Net Debt (€ bn.)
6,0 7,6 7,0
5,8 5,6
9,3 7,8
2,0 2,8 3,5
EBITDA margin (%)
-40,6%
0%
2%
4%
6%
8%
10%
12%
0
2
4
6
8
10
12
14
16
18
2008 2009 2010 2011 2012
EBITDA (€bn.)

PwC
Debt servicing difficulties increase exponentially from Group 5 to Group -5
page 9
* in € millions
No Group #
Companies % Companies Personnel Revenue*
CAGR Revenue ’08 -’12
EBITDA* EBITDA Margin
ROCE Fixed
Assets* Net Debt*
Capital Employed*
Net Debt / EBITDA
1 5* 179 7% 20,672 6,570 24% 513 8% 34% 729 -187 1,430 N/A
2 4* 230 8% 40,585 13,437 8% 1,406 10% 14% 6,564 286 7,979 0.2
3 3* 253 9% 54,194 22,031 10% 1,583 7% 9% 8,201 3,411 10,642 2.2
4 2* 145 5% 19,272 9,260 -9% 1,767 19% 53% 2,357 -500 3,155 N/A
5 1* 107 4% 75,904 17,680 0% 2,210 13% 5% 21,223 8,194 19,766 3.7
6 -1* 342 13% 42,941 12,176 -3% 806 7% 4% 7,665 2,564 10,095 3.2
7 -2* 275 10% 71,063 32,392 -3% 3,363 10% 6% 24,062 12,294 27,831 3.7
8 -3* 210 8% 26,630 6,926 -1% -19 0% -11% 6,885 2,661 6,449 N/A
9 -4* 335 12% 47,196 10,270 -9% -228 -2% -5% 10,271 8,518 13,235 N/A
10 -5* 650 24% 67,471 10,476 -21% -2,295 -22% -16% 14,798 11,701 17,091 N/A
Total 2,726 465,928 141,217 -3% 9,105 6% 2% 102,756 48,942 117,673 5.4
Sta
rs
Gre
y
Zo
mb
ies
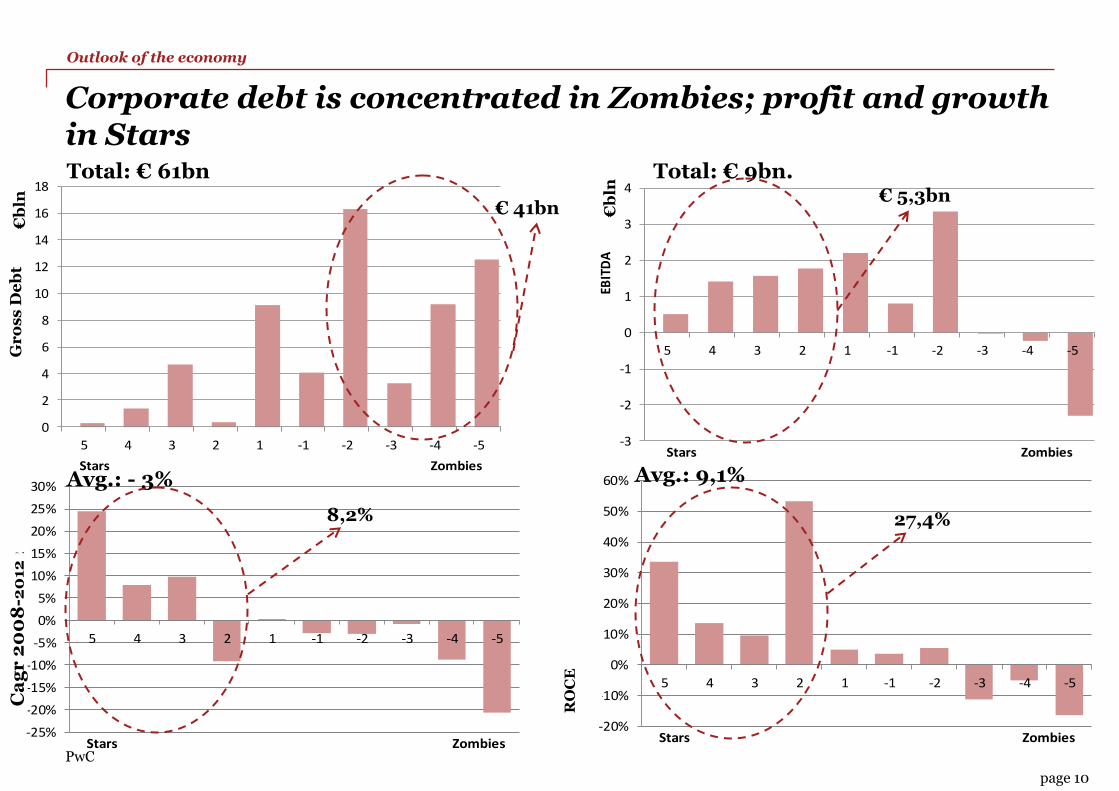
• 7% of the companies are Stars (Group 5*) versus 24% which are Zombies (Group -5*). Almost 30% belong to the Star groups and 54% to the Zombie groups
• Only Star companies show growth while Zombies’ profitability is negative
• The Zombie groups accounts for 43% of total revenue, 55% of capital employed and 72% of net debt
• Zombie groups has almost 213 thousand employees, approximately 46% of the total
• 36% of revenue originates from the Star groups and 42% from the Zombie groups
0
10.000
20.000
30.000
40.000
50.000
60.000
70.000
80.000
0
5.000
10.000
15.000
20.000
25.000
30.000
35.000
5 4 3 2 1 -1 -2 -3 -4 -5
Pe
rs
on
ne
l Re
ve
nu
e (
€ b
n)
Zombies
Star
Outlook of the economy
PwC
0
2
4
6
8
10
12
14
16
18
5 4 3 2 1 -1 -2 -3 -4 -5
Συνο
λικό
ς Δ
ανε
ισμ
ός€
δις
Stars Zombies
-3
-2
-1
0
1
2
3
4
5 4 3 2 1 -1 -2 -3 -4 -5
EBIT
DA
€δ
ις
Stars Zombies
Corporate debt is concentrated in Zombies; profit and growth in Stars
Outlook of the economy
-25%
-20%
-15%
-10%
-5%
0%
5%
10%
15%
20%
25%
30%
5 4 3 2 1 -1 -2 -3 -4 -5
CAG
R ε
σόδω
ν 20
08-2
012
Stars Zombies-20%
-10%
0%
10%
20%
30%
40%
50%
60%
5 4 3 2 1 -1 -2 -3 -4 -5
RO
CE
Stars Zombies
€ 41bn
Total: € 61bn
Total: € 9bn.
Avg.: 9,1% Avg.: - 3%
8,2% 27,4%
€ 5,3bn
RO
CE
page 10
Gr
os
s D
eb
t C
ag
r 2
00
8-2
012
€
bln
€b
ln

PwC
The Greek corporate economy retained some of its dynamism through the crisis
page 11
Outlook of the economy
1,435 companies
(51% of total companies) moved
downward
747 companies (26% of total companies) remained in the
same Group
644 companies (23% of
total companies) moved upward
2009 5* 4* 3* 2* 1* -1* -2* -3* -4* -5* 2012
5* 64 27 6 22 1 16 4 8 6 5 159
4* 51 65 27 30 7 20 3 10 2 5 220
3* 23 40 58 9 13 59 20 7 17 4 250
2* 27 20 4 51 0 7 4 5 2 6 126
1* 4 11 12 2 15 14 27 3 13 5 106
-1* 39 40 26 64 4 73 28 18 25 15 332
-2* 7 13 21 15 18 51 70 5 66 6 272
-3* 12 18 15 27 2 42 10 42 13 18 199
-4* 6 17 17 8 20 47 60 10 112 36 333
-5* 39 40 44 45 17 103 114 36 194 197 829
2009 272 291 230 273 97 432 340 144 450 297 2.826
% Change -42% -24% 9% -54% 9% -23% -20% 38% -26% 179%
1.391 companies (49%) did
not get worse or they did better
Sta
rs
G
re
y
Zo
mb
ies
Stars
Zombies
• Out of the total sample, 1,435 companies moved downward (51% of total), while 1.391 companies did not worsen or
they did better (49% of total)
• Since 2009, 632 companies turned into Zombies (-5*) in 2012, while 95 companies became Stars (5*)
• 66% of Zombies (-5*) failed to move upward, while only 24% of Stars (5*) of 2009 remained there * 220 companies were classified directly as Zombies in 2012 (144 due to ceasing publishing financial statements from 2009 onwards)

PwC
Capital employed decreased by €11bn between 2009-2012, almost exclusively due to Zombies
• Between 2009 and 2012 in the overall sample capital outflow of €11bn was took place. Equity decreased by €6.7bn while total debt by €4.3 bn. This reduction is almost exclusively due to the Zombie groups. The majority of companies in other groups raised both equity and cash levels within the period of crisis
• A significant reduction of equity due to losses is observed in the Zombie group. There is an inflow of equity in the majority of the remaining groups
• Total debt decreased in the Zombie groups, with the greatest reduction taking place in the last Zombie group (-5*)
Equity Total Debt Cash Capital Employed
2009 2012 Δ 2009 2012 Δ 2009 2012 Δ 2009 2012 Δ
5* 0.6 1.2 0.5 0.3 0.3 0.0 0.2 0.5 0.3 0.9 1.4 0.5
4* 4.9 6.6 1.7 1.5 1.4 0.0 1.1 1.1 0.0 6.3 8.0 1.7
3* 5.1 6.0 0.9 3.9 4.7 0.8 0.9 1.2 0.3 9.0 10.6 1.6
2* 1.9 2.8 0.9 0.3 0.3 0.1 1.6 0.8 -0.7 2.1 3.2 1.0
1* 10.8 10.7 -0.1 9.0 9.1 0.1 1.1 0.9 -0.2 19.8 19.8 0.0
-1* 5.8 6.0 0.2 4.4 4.1 -0.3 1.7 1.5 -0.2 10.2 10.1 -0.1
-2* 11.1 11.5 0.4 16.4 16.3 -0.1 3.3 4.0 0.7 27.5 27.8 0.3
-3* 3.4 3.2 -0.3 3.8 3.3 -0.5 0.7 0.6 -0.1 7.2 6.4 -0.8
-4* 5.7 4.1 -1.7 9.1 9.2 0.1 0.9 0.7 -0.2 14.8 13.2 -1.6
-5* 13.8 4.5 -9.3 16.9 12.6 -4.3 2.1 0.9 -1.3 30.7 17.1 -13.6
Total 63.18 56.48 -6.70 65.53 61.20 -4.33 13.64 12.26 -1.38 128.70 117.67 -11.03
page 12
Structural Relations

PwC
Δ Net Debt =a1EBITDA +a2CapEx + α3Interest + a4ΔShare Capital + a5ΔCA + a6ΔCL
EBITDA Capital Exp. Interest Share Capital Δ Current Assets Δ Current Liabilities
α1 α2 α3 α4 α5 α6 R2
Total -0.12 0.56 -0.56 -0.32 0.34 -0.39 0.70
Group 5* -0.30 0.88 -0.75 -1.13 0.41 -0.52 0.97
Group 4* -0.13 0.48 -0.27 -0.31 0.04 -0.38 0.70
Group 3* -0.15 0.13 -1.61 -0.16 0.24 -0.30 0.71
Group 2* 0.27 -0.27 -0.39 -0.46 -0.11 0.46 0.79
Group 1* -0.02 0.80 0.14 -0.56 0.89 -0.54 0.93
Group -1* -0.58 0.89 -1.15 -0.57 0.71 -1.19 0.87
Group -2* -0.23 0.84 0.60 -0.43 0.65 -0.41 0.89
Group -3* -0.05 0.74 -0.85 -0.30 0.51 -0.70 0.97
Group -4* -0.45 0.51 -1.20 -0.38 0.81 -0.84 0.91
Group -5* -0.43 0.32 -0.88 -0.24 0.68 -0.45 0.63
• About 50% of EBITDA has been used for Debt repayment from Zombies
• Investment is being funded to more than 50% by debt, apart from the zombies
• Interest payments in the Zombie categories are funded 90% through new debt
• Share capital increases are 50% used by Zombies for Debt repayment
• Additional working capital requirements are not financed through debt, but from trading partners
page 13
Structural Relations
Capital use differs significantly between Groups (1/2)
~ =

PwC
page 14
Structural Relations
Capital use differs significantly between Groups (2/2)

PwC
Zombies’ return on capital employed decreased by 17 percentage points during the period 2009-2012 Capital Employed ROCE
€ bn 2009 2012 Δ % 2009 2012 Δ (pps)
5* 0.90 1.43 58% 20% 34% 14.0
4* 6.33 7.98 26% 12% 14% 1.5
3* 9.01 10.64 18% 9% 9% 0.5
2* 2.14 3.16 47% 67% 53% -13.8
1* 19.79 19.77 0% 11% 5% -6.3
-1* 10.22 10.09 -1% 7% 4% -3.6
-2* 27.54 27.83 1% 9% 6% -3.2
-3* 7.25 6.45 -11% -4% -11% -7.9
-4* 14.83 13.24 -11% 2% -5% -6.7
-5* 30.69 17.09 -44% 0% -16% -16.8
Total 128.70 117.67 -9% 7% 2% -4.77
• In total, during the period 2009-2012 capital employed decreased by 9%; however, this decrease did not compensate for the shrinking EBITDA
• Capital employed due the Star groups increased almost by €5bn while in the Zombie groups it decreased by €15.7bn, with €13.6bn to Zombies (-5*)
• Star companies have positive and high returns on capital employed
• Return on capital employed increased in the Star groups (5*,4*), decreased significantly in the groups 2*,1* and collapsed in the Zombie groups with the last three groups consuming a great part of capital employed
page 15
Structural Relations

PwC
Zombies have a negative effect on the cash flows of all other companies
• During the period 2009-2012 the Zombie companies showed a constantly increasing number of Days Payable Outstanding compared to the total of companies, causing cash flow problems to the counterparties
• Zombie companies delay their payments 53 days more than they did in 2009
• In 2012, the average Zombie company delayed its payments to its suppliers 75 days more than the average company of the sample. The average Star company paid its suppliers 18 days earlier than the average company of the sample
• The growing delays in payments of Zombie companies increases the financing needs in the rest of the groups
page 16
Structural Relations
Group 5*
Group -5*
Total
0
20
40
60
80
100
120
140
160
2009 2010 2011 2012
Days Payable Outstanding

PwC
High levels of debt reduce ROCE whilst fresh debt beyond a point does not lead to EBITDA increase
α1 α2 R2
Total 0.81 0.02 0.99
Group 5* 0.82 0.04 0.98
Group 4* 0.83 0.02 0.99
Group 3* 0.81 0.04 0.99
Group 2* 0.84 0.03 0.98
Group 1* -0.10 1.02 0.99
Group -1* 0.81 0.03 0.98
Group -2* 0.11 0.76 0.99
Group -3* 0.77 0.03 0.96
Group -4* 0.12 0.72 0.99
Group -5* 0.75 0.02 0.98
ln(EBITDA) = a1lnR + a2lnD
α1 α2 α3 R2
Total -0.14 -0.08 0.02 0.78
Group 5* -0.08 -0.07 0.02 0.52
Group 4* -0.12 -0.04 -0.02 0.73
Group 3* -0.15 0.02 0.00 0.93
Group 2* 2.34 0.00 -2.10 0.55
Group 1* -0.11 -0.65 0.01 0.94
Group -1* -0.18 -0.04 0.00 0.88
Group -2* -0.09 -0.75 0.01 0.95
Group -3* - - - -
Group -4* - - - -
Group -5* - - - -
ln(ROCE) = a1lnR + a2ln(D/EBITDA) + a3ln(ΔR/R2008-2012)
page 17
Structural Relations
Incompatibility of cash flows and debt
Diminishing return on new debt
Growth Size
Size

PwC
General Categories
• The companies were classified into sectors by the type of their economic activity. The ICAP classification of sectors was used as a basis, which where then grouped into six hyper-sectors
• The Manufacturing hyper-sector includes most of the Greek companies engaged in light and heavy manufacturing industry
• The hyper-sector of Commerce accounts for a good part of the tertiary sector in the Greek economy
• The hyper-sector of Services also represents a share of tertiary production
• The Tourism hyper-sector includes hotels and companies which offer tourism related services
• The hyper-sector of Investment Companies includes all whose operating model is based on capital investment outside the financial sector
• The Infrastructure hyper-sector includes companies which build and operate the country’s infrastructure such as public utilities, telecommunications and main roads
Sector Analysis
page 18

PwC
Page 19
*€ millions
Manufacturing, commerce and services represent…
No Sectors Companies Income* EBITDA* Earnings before
Taxes* Capital Employed* Total Debt* Personnel
1 Manufacturing 979 52.522 2.160 -1.074 42.825 22.787 136.692
2 Commerce 1.197 52.287 1.646 -408 23.818 12.735 180.909
3 Services 380 14.790 1.593 457 13.276 6.550 93.067
4 Infrastructure 40 19.453 4.105 816 29.569 14.904 47.387
5 Tourism 99 1.588 113 -168 4.527 2.152 6.567
6 Investment Companies
31 578 -512 -691 3.657 2.070 1.306
Total 2.726 141.217 9.105 -1.068 117.673 61.198 465.928
Sector Analysis
80% 74% 57% 58% 68%
Manufacturing Commerce Services Infrastructure Tourism Investment Companies

PwC
Sectors with a relative majority in Stars or Zombies
page 20
Sector Analysis
• The food & beverage, energy and pharmaceuticals display signs of competitiveness in contrast with heavy industry, entertainment and construction
• Food & beverage (commerce), fuel retail and pharmaceutical commerce stand out in terms of Star characteristics while health commerce has a strong Zombie contingent
• The Infrastructure sector, except for telecoms and construction, has a large population of Stars
• In the Services sector, professional services stand out for their number of Stars and entertainment for their number of Zombies
Zombies Stars Grey
% of companies above the average of the corresponding hyper-sector
27 sectors ICAP classification

PwC
Sectors approaches lack the clarity to become a base for policy making. The market “chooses” companies
Stars
EBITDA (mn. €)
Zombies
Size: Revenue 2012
27 sectors ICAP classification
Sector Analysis
page 21

PwC
Main drivers of the corporate economy
The main assumptions regarding the companies’ economic behaviour :
• the size of the company affects adversely returns on capital
• indebtedness affects negatively the return on capital employed
• growth is positively correlated with returns on capital employed
• profit in terms of EBITDA is positively affected by size and debt
The above mentioned assumptions were tested with the use of regression models applied both on the total sample and the individual groups, and led to the following conclusions:
• The greatest shrinkage on their capital base was suffered by Zombies
• Debt is recycled to a great extend, preserving mostly Zombie companies
• Zombies disseminate economic pressure on the rest of the groups (viral)
• Indebtedness inhibits profits and growth
• Size increases profit, but leads to diminishing returns on capital
page 22
Refinancing the Corporate Sector

PwC
0
2
4
6
8
10
12
14
16
18
5 4 3 2 1 -1 -2 -3 -4 -5
€b
n
The sample’s total debt (€61bn) is concentrated mostly in the Zombie groups
• The analysis highlights that a part of the sample’s total debt (approximately €41bn) cannot be repaid normally
• The question is how much is the amount of debt that needs to be restructured or refinanced in order for debt to be sustainable in the sampled companies
• The exercise was carried at the company level according to the approach below :
Refinancing the Corporate Sector
1. Net Debt/ EBITDA was set equal to 5, as the maximum acceptable limit for the debt sustainability
2. The average EBITDA over years 2010, 2011 and 2012 was used in the calculation
3. For every company with negative EBITDA, it was assumed that the debt committed will not be repaid (“Trapped Debt”)
4. For every company with positive EBITDA, the debt level that requires refinancing (“Refinanceable Debt”) was calculated using the debt sustainability ratio of Net Debt/ EBITDA=5
5. “Trapped Debt” as well as “Refinanceable Debt” were aggregated by group and by sector
Total debt for the groups -5* to -2* amounts to € 41bn, part of which is reflected at the corporate NPLs of the Greek banks
page 23

PwC
For the refinancing of the corporate economy, over a reasonable time horizon, banks may:
… refinance about €10 bn. (15% of loans) to restore the balance with the operational profitability
…restructure about €15 bn. (25% of loans) to release assets, mostly by Zombies
€3,7 bn. refinancing of companies with
profitability and growth in the past
Refinancing the Corporate Sector
page 24

PwC
Trapped Debt -5* -4* -3* -2* -1* 1* 2* 3* 4* 5* Total
Commerce 2.47 0.52 0.20 0.00 0.00 0.00 0.00 0.00 0.00 0.00 3.19
Manufacturing 3.95 1.45 0.78 0.05 0.15 0.00 0.00 0.01 0.00 0.00 6.39
Infrastructure 0.00 0.06 0.72 0.00 0.00 0.00 0.00 0.11 0.00 0.00 0.89 Investment Companies
0.69 0.65 0.00 0.00 0.00 0.00 0.00 0.00 0.00 0.00 1.34
Services 1.86 0.26 0.53 0.00 0.02 0.00 0.00 0.01 0.00 0.00 2.69
Tourism 0.22 0.00 0.22 0.00 0.07 0.00 0.00 0.00 0.00 0.00 0.50
Total 9.20 2.94 2.44 0.06 0.24 0.00 0.00 0.13 0.00 0.00 15.00
Refinanceable Debt -5* -4* -3* -2* -1* 1* 2* 3* 4* 5* Total
Commerce 0.61 1.01 0.01 0.34 0.55 0.01 0.00 0.24 0.08 0.00 2.83
Manufacturing 0.88 1.06 0.13 1.10 0.44 0.03 0.00 0.02 0.01 0.00 3.66
Infrastructure 0.00 0.26 0.01 0.27 0.08 0.00 0.00 0.01 0.00 0.00 0.64 Investment Companies
0.05 0.14 0.00 0.00 0.05 0.00 0.00 0.00 0.00 0.00 0.24
Services 0.23 0.32 0.29 0.07 0.32 0.00 0.00 0.10 0.00 0.00 1.35
Tourism 0.32 0.32 0.09 0.17 0.08 0.00 0.00 0.00 0.00 0.00 0.98
Total 2.08 3.11 0.54 1.95 1.52 0.04 0.00 0.37 0.09 0.00 9.71
Grand Total 11.29 6.04 2.98 2.01 1.76 0.04 0.00 0.50 0.09 0,00 24.71
Total Debt 12.56 9.18 3.28 16.28 4.09 9.11 0.34 4.65 1.41 0,27 61.20
% over Total Debt 90% 66% 91% 12% 43% 0.4% 1% 11% 6% 0% 40% € bn
page 25
Refinancing the Corporate Sector
In total, up to about €9.7bn (15% of loans) should be refinanced and up to €15bn (25% of loans) should be restructured in the Zombie groups

PwC
97% of companies with trapped debt belong to the Zombie groups
• This class consists of 427 companies which account for 8% of revenue, 15% of the sample’s capital and 25% of debt
• Most of the companies (331) belong to Zombies (-5*), while 84 companies belong to Almost Zombies
• 78% of the companies are in Commerce and Manufacturing (41% and 37% respectively)
2012 Analysis per Group and Sector € bn Class data Total Sample %
Revenue 11.1 141 8%
CAGR -12% -5% -7.2
EBITDA -2.7 9.1 Ν/Α
Net Debt 14.2 48.9 29%
Total Debt 15.0 61.2 25%
Capital Employed 18.1 117.7 15%
page 26
Refinancing the Corporate Sector
Almost Stars1.2%
Good1.6%
Almost Zombies19.7%
Zombies77.5%

PwC
Changes in the Debt Sustainability level (Net Debt/ EBITDA) utilized have a relatively small impact (±≈4 bn) on restructured and refinanceable debt
ΝD/E =5
ΝD/E =8
ΝD/E =4
€ bn Refinanceable Debt Trapped Debt
Initial Debt Level Post Restructuring
% of Restructurin
g
Total figures
Number of companies
Debt Level Number of companies
Debt Level
Commerce 295 2.83 176 3.19 12.73 6.71 47%
Manufacturing 291 3.66 159 6.39 22.79 12.74 44%
Infrastructure 7 0.64 7 0.89 14.90 13.37 10%
Investment Companies 6 0.24 7 1.34 2.07 0.49 76%
Services 66 1.35 63 2.69 6.55 2.52 62%
Tourism 38 0.98 15 0.50 2.15 0.66 69%
Total 703 9.71 427 15.00 61.20 36.5 40%
Total Restructuring 24.70 δις / 1130 Companies
€ bn Refinanceable Debt Trapped Debt
Initial Debt Level Post Restructuring
% of Restructurin
g
Total figures
Number of companies
Debt Level Number of companies
Debt Level
Commerce 182 1.83 176 3.19 12.73 7.71 39%
Manufacturing 188 2.04 159 6.39 22.79 14.36 37%
Infrastructure 3 0.05 7 0.89 14.90 13.96 6%
Investment Companies 4 0.18 7 1.34 2.07 0.55 73%
Services 39 1.03 63 2.69 6.55 2.83 57%
Tourism 29 0.73 15 0.50 2.15 0.91 58%
Total 445 5.86 427 15.00 61.20 40.3 34%
Total Restructuring 20.86 δις / 872 Companies 20.86 872 € bn
Refinanceable Debt Trapped Debt Initial Debt Level Post Restructuring
% of Restructurin
g
Total figures
Number of companies
Debt Level Number of companies
Debt Level
Commerce 337 3.31 176 3.19 12.73 6.23 51%
Manufacturing 340 4.71 159 6.39 22.79 11.69 49%
Infrastructure 10 1.51 7 0.89 14.90 12.50 16%
Investment Companies 6 0.26 7 1.34 2.07 0.47 78%
Services 76 1.49 63 2.69 6.55 2.37 64%
Tourism 41 1.08 15 0.50 2.15 0.57 73%
Total 810 12.36 427 15.00 61.20 33.8 45%
Total Restructuring 27.36 δις / 1237 Companies 27.37 1,237
page 27
Refinancing the Corporate Sector

PwC
For the refinancing of over-indebted companies, which are profitable and have been growing in the past, about €3.7bn are required
€ bn Trapped Debt Refinanceable Debt
Group Number of companies Debt Level Number of companies Debt Level
GGZ 2 0.05 137 1.94
SGZ 4 0.21 66 1.51
Σύνολο 6 0.26 203 3.45
€ bn Over-indebted
companies Total Sample %
Revenue 27.9 141.2 20%
EBITDA 1.3 9.1 15%
Net Debt 10.4 48.9 21%
Capital Employed 19.6 117.7 17%
ROCE 3.35% 2.03%
Net Debt/ EBITDA 7.9 5.3
2012 Sectorial Analysis
page 28
Refinancing the Corporate Sector
Manufacturing48.9%
Commerce33.6%
Services9.8%
Infrastructure0.9%
Tourism6.4%
Investment Companies
0.4%

PwC
Creating the necessary conditions for the appearance of more Stars should be the main policy premise for the facilitation of resource allocation in the economy
2012 Typical Companies
Stars Almost Stars Other Zombies
Revenue* 36,7 71,2 62,6 16,1
Fixed Assets* 4,1 27,3 55,2 22,8
Total Assets* 17,8 57,1 89,1 39,1
Number of employees 115 182 208 104
EBITDA 2,9 7,6 4,8 -3,5
EBITDA margin 7,8% 10,6% 7,7% -21,9%
EBT 2,3 5,1 -0,7 -5,8
EBT margin 7,8% 10,6% 7,7% -21,9%
ROCE 33,6% 17,2% 1,9% N/A
ROE 40,3% 22,1% -2,5% N/A
Capital Employed* 8,0 34,7 61,0 26,3
Total Debt* 1,5 10,2 33,1 19,3
Net Debt* N/A 5,1 27,0 18,0
Shareholder Equity* 6,5 24,5 27,9 7,0
Net Debt/EBITDA N/A 0,67 5,58 -5,10
Net Debt/ Revenue N/A 0,07 0,43 1,12
Net Debt/ Capital emp. N/A 0,15 0,44 0,68
EBITDA/Financial Res. 18,13 10,80 2,58 -3,40
2012 Total
Stars Almost Stars Other Zombies
Revenue* 6.570 44.727 79.444 10.476
Fixed Assets* 729 17.122 70.107 14.798
Total Assets* 3.185 35.870 113.105 25.442
Number of employees 20.672 114.051 263.734 67.471
EBITDA 513 4.755 6.131 -2.295
EBITDA margin 7,8% 10,6% 7,7% -21,90%
EBT 410 3.174 -904 -3.748
EBT margin 6,23% 7,10% -1,14% -35,78%
ROCE 33,6% 17,2% 1,9% -16,4%
ROE 40,3% 22,1% -2,5% -63,1%
Capital Employed* 1430 21.776 77.376 17.091
Total Debt* 273 6.409 41.959 12.557
Net Debt* -187 3.196 34.231 11.701
Shareholder Equity* 1.156 15.368 35.417 4.534
Net Debt/EBITDA N/A 0,67 5,58 -5,10
Net Debt/ Revenue N/A 0,07 0,43 1,12
Net Debt/ Capital emp. N/A 0,15 0,44 0,68
EBITDA/Financial Res. 18,13 10,80 2,58 -3,40
More and bigger Stars are necessary for sustained growth
Refinancing the Corporate Sector
page 29

PwC
The overall picture
• The sampled companies have loans of €61.2bn, versus almost €116bn total corporate loans in the economy
• Out of the 2,726 companies, 427 (15% of total companies) are completely unable to repay loans up to €15bn (25% of sample loans)
• Moreover, 703 companies (24% of total companies) could possibly repay loans of €9.7bn (16% of total loans) in the future if they were refinanced using the right type of financing
• About 97% of trapped debt is in the Zombie categories
• Changing the debt sustainability criterion, leads to a 15% shift in the debt to be restructured / refinanced
• Companies with good past performance (growth /profitability) need to restructure about € 3.7 bn
• Except for Infrastructure, every other hyper - sector needs to restructure more than 20% of their loans. Tourism, Services and Commerce need refinancing of more than 20% of their loans
• The sector of Infrastructure has minimal needs while Investment Companies have “lost” 76% of their debt capital
page 30
Refinancing the Corporate Sector

PwC
The dynamics of forthcoming growth
430
630
1.490
180 Stars
Almost Stars
Other
Zombies
•Investment to boost capacity
• Acquisitions / Mergers
•Restructuring of debt and fresh equity
•Liquidation to release assets
Policy Dimensions
page 31

PwC
About 800 companies drive the Greek economy and another 1,500 could make a vital contribution
• The Greek corporate economy seems to be led by 180 Star companies (group 5*) which represent 6% of EBITDA, 5% of revenues, 1% of fixed assets and 4% of the employees in the sample
• These companies have an annual growth rate of 24%, ROCE of 34% and loans of only €273mn in 2012
• At a second level, Almost Stars (groups 4*, 3*, 2*) comprise 630 companies with quite good characteristics ,which are the backbone of corporate economic activity in the country and represent 52% of EBITDA, 32% of revenue, 18% of fixed assets and 24% of the employees in the sample
• These companies show a lower annual growth rate (4%) with ROCE however reaching 17% in 2012 and total debt of only €6.4bn
• 1,490 companies (groups 1*, -1*,-2*,-3*,-4*) represent the largest part of economic activity (56% revenues, 65% fixed assets, 55% employees) and produce 71% of total EBITDA. These corporates show significant diversity in performance and suffer from excessive debt
• 430 companies with trapped debt represent 8% of total revenue, 18% of fixed assets, 16% of employees and contribute negatively to the produced EBITDA (-29%). In addition, they exhibit a significant shrinkage and negative ROCE
• The strategy for the recovery of the corporate economy should have three dimensions: funding and promoting the two leading groups, restructuring of debt and refinancing the third group and the fast liquidation of the last group
Policy Dimensions
page 32

PwC
Growth Financing and Corporate Debt Management Policies
No Policy # Total Debt Effect on the companies
Effect on the Banks Third Party Investment
1 Financing of companies with systematically good performance in the past
~800 €6,7 bn
1α Companies with average performance in the past with no need for refinancing
~800 €20 bn.
2 Debt restructuring for companies with good performance in the past
~200 €8,5 bn. Revenue Increase EBITDA and EBT
improvement
Up to €4 bn restructuring/ refinancing
Improvement of profitability on NPLs and reversal of provisions
€ 2bn share capital increases
3 Debt restructuring for companies with “non-negative” outlook
~500 €11 bn. Revenue Increase EBITDA and EBT
improvement
Up to €6 bn restructuring/ refinancing
Improvement of profitability on NPLs and reversal of provisions
€ 2bn share capital increases
4 Rapid liquidation of companies with systemically negative cash flows
~430 €15 bn. Liquidation /
Administration Up to €15bn of losses
€ 2bn for purchase of assets
Total Outcome Improvement of
profitability and growth
€ 15bn restructuring € 9.7bn refinancing € 5bn new financing
€ 7bn third party investments
New Capital Employed Revenue increase EBITDA and ΕΒΙΤ
increase
€5bn new financing € 3bn share capital increases
Policy Dimensions
page 33

PwC
Addressing corporate indebtedness
• Regarding companies with trapped debt, the bankruptcy law should be amended extensively to allow for the rapid liquidation of effectively insolvent companies and the swift re-utilisation of their fixed assets within the economy (potential targets for Star companies or new investors)
• Companies facing debt servicing issues, but with otherwise a non-negative economic outlook should be the target of a major debt restructuring exercise.
• Given that in the majority of cases the debt of any given company is held by many banks, a systemic inter-banking approach should be adopted to facilitate debt restructuring.
− Prioritisation : Eligible companies for a systemic approach should be identified and prioritised through a mechanism jointly agreed among all participating banks, combining total exposure and economic outlook
− Bundling: Eligible companies for restructuring, outside the systemic, should be bundled either in sectoral or linked groups to be looked at simultaneously or in an unconnected groupings, and the groups will be prioritised
− Evaluation: Each company in a selected group should be evaluated and the participating banks should produce a bespoke financial solution to refinance its debt and attract new funds
− Agreement: Proposed financial solutions should be agreed among the banks and each company with all required covenants as necessary, and implemented within 4 months from the start of the evaluation exercise
Incentives and disincentives for the fast and effective handling of restructurings should be instituted, as for example:
should the banks fail to agree on a restructuring solution within the prescribed time, then the full outstanding debt will need to be written off in a regulatory capital term
upon agreement, a tax credit equal to part or the whole of the restructured debt could be issued proportionately to the banks.
page 34
Policy Dimensions

PwC
Economic growth requires investments and there are many investment opportunities in Greece
• The Greek corporate economy needs to be significantly relieved from debt, in order to start growing again attracting new funds in the way
• Assets trapped in the banks’ and the corporate balance sheets must be released back into the economy to increase production capacity
• There is no strong case for sectoral policies. The market “decides” at the level of the corporates
• The objective is to create more stars. Policy and resource allocation should focus on the competitiveness of individual companies:
systematic growth
high profitability
reasonable debt consistent with the company’s cash flows
• By restructuring €15bn of debt and refinancing another €10bn through higher risk instruments, further €7bn could be mobilized in the form of equity or quasi-equity and about €2bn of assets to re-enter
• The restructuring and refinancing of the corporate economy will create opportunities for Mergers and Acquisitions
• The consistent implementation by all involved parties (banks, corporates, BoG, the state) of such an approach to facilitate growth will boost the Greek economy by adding 0,7%-1% to GDP annually up to 2020
page 35
Policy Dimensions

PwC Greece helps organisations and individuals create the value they’re looking for. We’re a member of the PwC network of firms in 157 countries with more than 184,000 people who are committed to delivering quality in assurance, tax
and advisory services. We have premises in Athens and Thessaloniki and over 850 employees. Tell us what matters to you and find out more by visiting us at www.pwc.com/gr.
This publication has been prepared for general guidance on matters of interest only, and does not constitute professional advice. You should not act upon the information contained in this publication without obtaining specific professional
advice. No representation or warranty (express or implied) is given as to the accuracy or completeness of the information contained in this publication, and, to the extent permitted by law, PwC does not accept or assume any liability,
responsibility or duty of care for any consequences of you or anyone else acting, or refraining to act, in reliance on the information contained in this publication or for any decision based on it.
Copyright © 2014 PricewaterhouseCoopers Business Solutions S.A. All rights reserved.
PwC refers to the Greece member firm, and may sometimes refer to the PwC network. Each member firm is a separate legal entity. Please see www.pwc.com/structure for further details.
www.pwc.gr