state of mississippi office of the governor mississippi
TRANSCRIPT

STATE OF MISSISSIPPI
OFFICE OF THE GOVERNOR
MISSISSIPPI DIVISION OF MEDICAID
External Quality Review (EQR) Protocol 4
Summary of Findings
UnitedHealthcare Community Plan

United Healthcare Community Plan
www.mslc.com page 2
Mississippi Medicaid Managed Care
EQR Protocol 4 Summary of Findings
Table of Contents
57TTable of Contents 57T ................................................................................................................................... 2
Overview ............................................................................................................................................ 4
57TGlossary57T ............................................................................................................................................ 7
57TActivity 1: Review State Requirements 57T................................................................................................. 11
o 57TMethodology57T ............................................................................................................................ 11
- 57TState Requirements 57T .......................................................................................................... 12
- 57TFindings 57T ............................................................................................................................. 13
- 57TRecommendations 57T ............................................................................................................ 14
57TActivity 2: Review CCO’s Capability57T ..................................................................................................... 17
o 57TMethodology57T ............................................................................................................................ 17
- 57TFindings 57T ............................................................................................................................. 18
- 57TRecommendations 57T ............................................................................................................ 18
57TActivity 3: Analyze Electronic Encounter Data 57T ..................................................................................... 19
o 57TStep 1: Test Plan 57T ..................................................................................................................... 19
o 57TStep 2: Verifying the Integrity of the CCO Encounter Data Files 57T ............................................ 20
- 57TVerification of Completeness 57T ............................................................................................ 20
- 57TVerification of Accuracy57T .................................................................................................... 21
- 57TValid Value Testing 57T ........................................................................................................... 22
57TFindings 57T ........................................................................................................................ 22
57TRecommendations 57T ....................................................................................................... 26
- 57TKey Data Elements Matching 57T ............................................................................................ 26
57TFindings 57T ........................................................................................................................ 33
57TRecommendations 57T ....................................................................................................... 36
o 57TSteps 3 and 4: Generating and Reviewing Analytical Reports and Comparing Findings to
State-Identified Standards 57T ....................................................................................................... 38
- 57TVolume, Utilization, and Per Member Costs 57T ..................................................................... 38
- 57TUtilization Indicators 57T .......................................................................................................... 40
57TFindings 57T ........................................................................................................................ 44
57TRecommendations 57T ....................................................................................................... 45
57TActivity 4: Review of Medical Records 57T................................................................................................. 46
o 57TMethodology57T ............................................................................................................................ 46
- 57TFindings 57T ............................................................................................................................. 47

United Healthcare Community Plan
www.mslc.com page 3
Mississippi Medicaid Managed Care
EQR Protocol 4 Summary of Findings
- 57TRecommendations 57T ............................................................................................................ 52
57TActivity 5: Summary of Findings 57T .......................................................................................................... 56
57TAppendix A: Volume, Member Utilization, Demographic Statistics and Per Member Costs 57T
57TAppendix B: Myers and Stauffer Encounter Reconciliation Report Dated March 20, 2017 57T

United Healthcare Community Plan
www.mslc.com page 4
Mississippi Medicaid Managed Care
EQR Protocol 4 Summary of Findings
Overview
CMS EQR Validation - Guidance and Requirements
The Centers for Medicare & Medicaid Services (CMS) strongly encourages states to contract with
qualified entities to implement EQR Protocol 4 Validation of Encounter Data Reported by the
MCO (EQR Protocol 4) due to the need for valid and reliable encounter data as part of any state
quality improvement efforts. The CMS EQR Protocol 4 guidelines state: “as federal programs
transition toward payment reform for demonstrated quality of care, the validation of encounter
data in the use of performance data will become increasingly significant. Validation of encounter
data can help states reach the goals of transparency and payment reform to support their efforts
in quality measurement and improvement.”
The Role and Importance of Encounter Data
Encounter data are a replica of claims that have been adjudicated by the Coordinated Care Organization
(CCO) or their subcontracted vendors (e.g., vision, pharmacy, and dental) to health care providers that
have provided health care services to members enrolled with the CCO. These encounter claims are sub-
mitted to DOM via the Fiscal Agent Contractor (FAC). Validated encounter data has many uses such as
rate setting, federal reporting program management and oversight, and for tracking, accounting and other
ad-hoc analyses. In addition, the new federal regulatory requirements clearly state that incomplete or in-
accurate encounter data will no longer be accepted. All states are at risk for loss of federal financial par-
ticipation reimbursement dollars for having inaccurate or incomplete encounter data.
EQR Protocol 4, while not federally mandated, has been identified by CMS as an excellent management
tool that offers much of what DOM was searching for to assist in its monitoring of the encounter data sub-
missions and also assists with meeting new federal mandates regarding encounter data validation. The
basis of the encounter data validation is to assess the level of completeness and accuracy of the Missis-
sippiCAN encounter data submissions. It provides the ability to assess whether the encounter data can
be used to determine program effectiveness, accurately evaluate utilization, identify service gaps, and
make sound management decisions. In addition, the protocol evaluates both departmental policies, as
well as the policies, procedures, and systems of the CCO to identify strengths and opportunities to en-
hance oversight.
Background of MississippiCAN
Mississippi’s Coordinated Access Network (MississippiCAN) was implemented in January 2011 with the
goals of improving access to needed medical services, improving the quality of care for Medicaid benefi-
ciaries and to achieve cost efficiencies in the delivery of that care. Since its inception, enrollment has
grown to nearly half a million members. In December 2012, the MississippiCAN program was expanded
to include additional categories of eligibility, mental (behavioral) health services, and mandatory enroll-
ment for certain categories. A large number of children were transitioned into the program during the pe-
riod May through July 2015. Inpatient hospital services were added in December 2015.

United Healthcare Community Plan
www.mslc.com page 5
Mississippi Medicaid Managed Care
EQR Protocol 4 Summary of Findings
Purpose, Scope, Methodology, and Value of the Myers and Stauffer LC Review
The Mississippi DOM was in search of a robust and comprehensive approach to help assist with their cur-
rent managed care oversight responsibilities and capabilities. Therefore, in August, 2015, the Mississippi
DOM engaged Myers and Stauffer LC to undertake this project to validate encounter data submitted to
the FAC by the Medicaid contracted CCOs and to perform an EQR using the CMS EQR Protocol 4.
An EQR Protocol 4 review is a resource intensive and time consuming project requiring extensive coordi-
nation with CCO personnel in order to obtain the appropriate data necessary to analyze. It entails both
the procurement of large datasets and medical records through multiple requests to acquire all required
data elements in a certain specified format, as well as the capacity and time necessary to process and
analyze this information in order to provide usable and comparable results. As part of the protocol, each
participating CCO was required to provide a sample of claims data adjudicated in January 2015 and Oc-
tober 2015 to be used to match against the encounter data to test the quality of the encounter data re-
ceived by the FAC. In addition, summary analytics were performed on all encounter data submitted by the
CCO to the FAC for calendar year (CY) 2015 dates of service to evaluate completeness and identify other
data quality issues. The analytics performed by Myers and Stauffer LC represents a robust review into the
encounter data including tracing encounter data elements back to the source medical records documen-
tation for a sample of members. This medical records acquisition process for the sampled members also
required extensive time and coordination efforts with the CCOs. The results of such a detailed encounter
data analysis were previously not available to the state and now provides a complete audit trail of the
medical service information obtained from the medical records to the sample claims adjudicated by the
CCOs to the submitted encounter claims data currently residing in the FAC data warehouse. These ana-
lytics along with findings and recommendations related to the EQR Protocol 4 activities are included
within this report.
DOM intends to utilize the results, findings, and recommendations from this review to generate enforcea-
ble corrective action plans specifying the steps to mitigate the concerns identified, timetables for resolu-
tion, and identify the person(s) responsible from the CCOs and FAC for ensuring all issues are satisfacto-
rily resolved. We strongly agree with this corrective action plan methodology.
In addition to completing the EQR Protocol 4 Review, Myers and Stauffer has been working closely with
DOM and the CCOs to perform on-going bi-monthly encounter reconciliations since March 2016 to iden-
tify deficiencies and propose solutions that will result in high quality and reliable encounter data being
submitted. Many of the previously identified issues have already been addressed, while the more chal-
lenging deficiencies continue to be addressed through an on-going collaboration effort between the
CCOs, DOM, and the FAC, with the ultimate goal to provide complete, accurate, and useable encounter
data. Encounter data serves as a leading tool for stakeholders to make informed decisions about medical
management, care coordination, program integrity Issues, quality improvement, financial and actuarial
calculations, and performance evaluations.
CMS has established formal encounter validation requirements because many states did not maintain a
complete and accurate encounter data set to be utilized for these purposes. Since the bi-monthly encoun-
ter reconciliations were initiated a year ago, Mississippi health plans have increased their required com-
pletion percentages from significantly below contract required levels to at or near contract required levels.

United Healthcare Community Plan
www.mslc.com page 6
Mississippi Medicaid Managed Care
EQR Protocol 4 Summary of Findings
With this proactive approach and monitoring, DOM can both identify issues for correction and if neces-
sary, assess liquidated damages as appropriate. Encounter data is an area in which many state Medicaid
programs continue to struggle. DOM has demonstrated great awareness of the new federal requirements
as evidenced by their initiation of encounter data validation well in advance of the federal requirement.
The results of the encounter reviews will yield future cost savings and fiscal accountability, stronger over-
sight and program integrity opportunities, and much more accurate data critical for important activities
such as actuarial sound rate setting. A limited number of states have undertaken the initiative to validate
encounter data with an EQR Protocol 4 review and bi-monthly encounter reconciliations to cash disburse-
ment journals. This places Mississippi as a leader among its peers in this area and serves as a best
practices model for other states to follow.
Included below for reference are the current federal requirements:
Federal Requirements Related to Validation of Encounter Data
Federal External Quality Review (EQR) Requirements under the Centers for Medicare and
Medicaid Services (CMS) Final Rule on Medicaid Managed Care (42 CFR 438)
The final Medicaid Managed Care Rule P0F
1P strengthens the requirements for state monitoring of
managed care programs. Under the rule, each state Medicaid agency must have a monitoring
system that addresses all aspects of the state’s managed care program, including but not limited
to, the performance of managed care operations and management in the areas of claims man-
agement and information systems. Additionally, Mississippi is required through the new federal
regulations to provide accurate financial and encounter data to its actuary as well as to CMS as
part of the Transformed Medicaid Statistical Information System (T-MSIS) project. This data must
be audited no less than once every three years.
1 Electronic Code of Federal Regulations. https://www.ecfr.gov/cgi-bin/text-idx?SID=888e7bb305afac68ec3793a21b77a4ba&mc=true&node=pt42.4.438&rgn=div5

United Healthcare Community Plan
www.mslc.com page 7
Mississippi Medicaid Managed Care
EQR Protocol 4 Summary of Findings
Glossary
834 file – A benefit enrollment and maintenance document.
835 file – Healthcare claim payment/advice.
837 file – The standard format used by institutional providers and health care professionals and
suppliers to transmit health care claims electronically.
277 CA – A healthcare claim acknowledgement.
999 – The 999 Implementation Acknowledgement, is a required standard transaction to
acknowledge initial receipt of an electronic claim file and whether it was accepted or rejected.
NCPDP – The NCPDP Provider Identification number provides pharmacies with a unique, na-
tional identifier to assist pharmacies in their interactions with pharmacy payers and claims proces-
sors. The NCPDP Provider ID is a seven-digit numbering system that is assigned to every li-
censed pharmacy and qualified Non-Pharmacy Dispensing Sites (NPDS) in the United States.
5010 – Refers to the revised set of HIPAA electronic transaction standards adopted to replace the
Version 4010/4010A standards. All HIPAA covered entities should have transitioned to Version
5010 as of January 1, 2012. Any electronic transaction for which a standard has been adopted
must be submitted using Version 5010; otherwise, the transaction is not compliant with HIPAA
and will be rejected.
Acceptable Error Rate – The Division of Medicaid (DOM) established maximum tolerance,
stated as a percentage, of missing, surplus, or erroneous encounter records the state accepts.
Adjudication – The process of determining if a claim should pay or deny.
American Dental Association (ADA) – The recognized leading source of oral health related in-
formation for dentists and their patients.
Ancillary Services – Diagnostic or therapeutic services requested by a health care provider as a
supplement to basic medical services.
Benchmark – A standard or reference by which to measure or judge.
Calculated Void Encounter (CV) – An encounter that Myers and Stauffer LC has identified as
being a replacement encounter that does not appear to have a corresponding void of the original
encounter in the FAC data warehouse.
Cash Disbursement Journal (CDJ) – A journal used to record and track cash payments by an
entity.
Cash Disbursement Journal (CDJ) Monthly Reported Total – The sum of all payments from a
CCO or delegated vendor to service providers for a given month as reported by the CCO to the
DOM.
CDJ Cumulative Reported Total – The sum of all payments from a CCO or delegated vendor to
service providers for the reconciliation period as reported by the CCO to the DOM. This amount is
inclusive of all amounts reported in prior months.

United Healthcare Community Plan
www.mslc.com page 8
Mississippi Medicaid Managed Care
EQR Protocol 4 Summary of Findings
Centers for Medicare & Medicaid Services (CMS) – The agency within the United States De-
partment of Health & Human Services that provides administration and funding for Medicare un-
der Title XVIII, Medicaid under Title XIX, and the Children’s Health Insurance Program (CHIP)
under Title XXI of the Social Security Act.
Centers for Medicare & Medicaid Services (CMS) Medicaid Managed Care Final Rule – This
final rule modernizes the Medicaid managed care regulations to reflect changes in the usage of
managed care delivery systems. The final rule aligns many of the rules governing Medicaid man-
aged care with those of other major sources of coverage; implements statutory provisions;
strengthens actuarial soundness payment provisions to promote the accountability of Medicaid
managed care program rates; and promotes the quality of care and strengthens efforts to reform
delivery systems that serve Medicaid and CHIP beneficiaries. It also ensures appropriate benefi-
ciary protections and enhances policies related to program integrity.
CFR – Code of Federal Regulations.
Children’s Health Insurance Program (CHIP) – This program provides insurance coverage for
uninsured children up to age 19 whose family does not qualify for Medicaid and whose income
does not exceed 200 percent of the federal poverty level.
Claims Adjustment Reason Code (CAS) – Codes used to explain why a claim or service line
was paid differently than it was billed.
Clean Encounter – An encounter submitted without any complications that might cause delays in
processing.
Conduent (formerly known as Xerox) – The fiscal agent contractor for the state of Mississippi.
Coordinated Care Organization (CCO) – A private organization that has entered into a risk-
based contractual arrangement with the Mississippi DOM to obtain and finance care for enrolled
Medicaid members. CCOs receive a capitation or per member per month (PMPM) payment from
the DOM for each enrolled member. Magnolia Health Plan (Magnolia Health) and UnitedH-
ealthcare Community Plan (UHC) are the two CCOs operating under contract in Mississippi.
Cumulative Encounter Total – The sum of all encounter submissions stored in the fiscal agent
contractor’s (FAC) encounter data warehouse. This amount is inclusive of all amounts submitted
in prior months.
Cumulative Variance – The difference between the cumulative encounter total and the CDJ cu-
mulative reported total.
Data Warehouse (DW) – A central repository for storing, retrieving, and managing large amounts
of current and historical data. Data stored in the warehouse is uploaded from the operational sys-
tems and may pass through additional processing functions before it is stored in the warehouse.
Also known as an enterprise data warehouse (EDW).
Division of Medicaid (DOM) – The Division under the Office of the Governor within the state of
Mississippi that oversees and administers Medicaid and the state’s Children’s Health Insurance
Program.

United Healthcare Community Plan
www.mslc.com page 9
Mississippi Medicaid Managed Care
EQR Protocol 4 Summary of Findings
Encounter – A medical service provided to a member, by a unique provider, on a single date of
service, whether paid or denied by a coordinated care organization. One patient encounter may
result in multiple encounter records.
Encounter Data – Claims that have been adjudicated by the CCOs or subcontracted vendors
(e.g., vision, pharmacy, dental) to health care providers that have provided health care services to
members enrolled with the CCO. These claims are submitted to DOM via the Fiscal Agent Con-
tractor (FAC) for the DOM’s use in rate setting, federal reporting, program oversight and manage-
ment, tracking, accounting, and other ad-hoc analyses.
External Quality Review Organization (EQRO) – An organization that meets the competence
and independence requirements set forth in 42 CFR §438.354, and performs external quality re-
view or other EQR-related activities as set forth in 42 CFR §438.358, or both.
External Quality Review (EQR) – The analysis and evaluation by an EQRO, of aggregated infor-
mation on quality, timeliness, and access to the health care services that CCOs, or their contrac-
tors, furnish to Medicaid recipients.
Erroneous – As defined within the Centers for Medicare & Medicaid Services (CMS) EQR Proto-
col 4 Validation of Encounter Data Reported by the MCO (Protocol 4) document: Encounter data
represented by an encounter record that contains incorrect data elements.
Fiscal Agent Contractor (FAC) – A contractor selected to design, develop, and maintain the
claims processing Medicaid Management Information System (MMIS); Conduent is the current
FAC. Also known as a fiscal intermediary (FI).
Healthcare Effectiveness Data and Information Set (HEDIS) – A set of performance measures
used in the managed care industry.
The Health Insurance Portability and Accountability Act (HIPAA) – A set of federal regula-
tions designed to protect the privacy and maintain security of protected health information (PHI).
Medicaid Management Information System (MMIS) – The claims processing system used by
the FAC to adjudicate Mississippi Medicaid claims. CCO submitted encounters are loaded into
this system and assigned a unique claim identifier.
Missing Encounters – As defined within the CMS EQR Protocol 4 Validation of Encounter Data
Reported by the MCO (Protocol 4) document: Encounters that occurred but are not represented
by an encounter record within the MMIS data warehouse data.
Mississippi Coordinated Access Network (MississippiCAN) – The state of Mississippi’s Medi-
caid managed care program. Effective July 1, 2014, the Mississippi DOM started a new contract
with two CCOs, who are responsible for coordinating services for Mississippi Medicaid beneficiar-
ies.
Monthly Encounter Record Total – The sum of all encounter submissions for a given month
stored in the FAC’s encounter data warehouse.
Monthly Variance – The difference between the monthly encounter total and the CDJ monthly
reported total.

United Healthcare Community Plan
www.mslc.com page 10
Mississippi Medicaid Managed Care
EQR Protocol 4 Summary of Findings
National Committee for Quality Assurance (NCQA) – A non-profit organization dedicated to
improving health care quality, which accredits health care organizations, and develops and main-
tains HEDIS measures.
Non-Emergency Transportation (NET) – A ride, or reimbursement for a ride, provided so that a
member with no other transportation resources can receive services from a medical provider.
NET does not include emergency or ambulance transportation.
Per Member Per Month (PMPM) – The amount paid to a CCO each month for each person for
whom the CCO is responsible for providing health care services under a capitation agreement.
Potential Duplicate Encounter (PDUP) – An encounter that Myers and Stauffer LC has identi-
fied as being a potential duplicate of another encounter in the FAC’s data warehouse.
Protocol 4 – A Centers for Medicare & Medicaid Services (CMS)-developed, voluntary EQR pro-
tocol that is used to validate encounter data submitted to state Medicaid agencies by MCOs (or
CCOs).
Sub-Capitated Provider – A health care provider that is paid on a capitated or per member per
month (PMPM) basis that has contracted with a CCO paid under a capitated system and shares a
portion of the CCO’s capitated premium.
Subcontractor – A vendor to whom the CCO has contractually delegated responsibility for the
provision and oversight of approval, payment, and administration of medical services to the Medi-
caid CCOs plan members. Also known as a delegated vendor.
Surplus – As defined within the Centers for Medicare & Medicaid Services (CMS) EQR Protocol
4 Validation of Encounter Data Reported by the MCO (Protocol 4) document: Encounter records
which did not occur or which duplicated other records.
TCN (or ICN) – Transaction (or Internal) Control Number or Transaction (or Internal) Claim Num-
ber, a numerical mechanism used to track health care claims and encounters.
Truven Health Analytics (Truven) – Subcontractor to the state’s fiscal agent contractor respon-
sible for the encounter data warehouse.
UnitedHealthcare Community Plan (United or UHC) – A CCO participating in the Mississippi
Medicaid managed care program.
Validation – The review of information, data, and procedures to determine the extent to which
encounter data is accurate, reliable, free from bias, and in accord with standards for data collec-
tion and analysis.

United Healthcare Community Plan
www.mslc.com page 11
Mississippi Medicaid Managed Care
EQR Protocol 4 Summary of Findings
Activity 1: Review State Requirements
DOM provides a set of requirements to each CCO that specifies the expected structure of the encounter
data, submission times, error correction, and other related submission information. Activity 1 of the proto-
col allows for the state requirements to be reviewed in order to determine if additional or updated require-
ments are needed to ensure encounter data is complete and accurate.
The protocol suggests the following items are reviewed as part of Activity 1:
1) The state’s requirements for collection and submission of encounter data by CCOs (these
typically are specifications in the contracts between the state and the CCO).
2) The data submission format specified by the state for CCO use.
3) Requirements for the types of encounters that must be validated.
4) The state’s data dictionary.
5) A description of the information flow from the CCO to the state, including the role of any
contractors or data intermediaries.
6) State standards for encounter data completeness and accuracy.
7) A list and description of edit checks built into the state’s MMIS that identifies how the sys-
tem treats data that fails an edit check.
8) The timeframes for data submission.
9) Prior years’ EQR report on validating encounter data (if available).
10) Any other information relevant to encounter data validation. P1F
2
Methodology
Detail was gathered from both the DOM website and DOM representatives to determine what information
was necessary to complete this activity. Documents including contracts and companion guides were also
obtained from DOM.
In addition to the on-site visits to United’s Minnesota corporate offices and encounter data center, Myers
and Stauffer also met with Conduent to discuss the encounter data submission process and their system
capabilities.
Based on the information and documentation received, as well as the on-site visit to Conduent, DOM’s
data standards were reviewed for: completeness and accuracy; file transfer protocols; certification poli-
cies; collection and submission requirements; and processes, claims, and encounter submission require-
ments. We also reviewed the DOM-CCO contract in effect for the period under review, as well as the
2 From EQR Protocol 4 Validation of Encounter Data Reported by the MCO, Activity 1

United Healthcare Community Plan
www.mslc.com page 12
Mississippi Medicaid Managed Care
EQR Protocol 4 Summary of Findings
DOM-CCO proposed contract amendment dated March 20, 2017 for compliance with the encounter data
requirements in the federal Medicaid Managed Care rule. P2F
3
State Requirements
1) Claims and Encounters Standards:
The claim processing timeliness standard requires that 90 percent of clean claims be paid within
30 calendar days from receipt, and 99 percent of clean claims be paid within 90 calendar days
from receipt.
2) Error Types, Acceptable Error Rates, and Data Element Validity Requirements:
According to the contract between DOM and the CCOs, the acceptable encounter error rate is
two percent, as measured by a comparison of encounters to cash disbursements. The CCOs are
expected to submit 98 percent of all encounter data.
3) Data Collection and Submission:
According to the contract Section 10, sub-section R, item 3: “Encounter Records sent to DOM’s
Agent by the Contractor are considered acceptable when they pass all the Division’s Agent’s ed-
its. Encounter Records that deny or suspend due to Division’s Agent’s edits are returned to the
Contractor and the Contractor must make the requested corrections. The Contractor shall resub-
mit denied Encounter Records as a “new” Encounter Record if appropriate and within the defined
timeframe referenced above. The Contractor shall correct and resubmit suspended Encounter
Records as an adjustment within the time frame referenced above. Corrections and resubmis-
sions must pass all edits before they are accepted by the Division’s Agent.”
Submissions by the CCOs are required under CFR 438.606 to be certified by the CCO's CEO,
CFO, or an individual who has delegated authority to sign for, and who reports to either. Accord-
ing to the contract: “The certification must attest, based on best knowledge, information, and be-
lief, to the accuracy, completeness and truthfulness of the data and to the accuracy completeness
and truthfulness of the documents. The Contractor must submit the certification in writing with the
signature of the appropriate certifier, at the time the certified data, documents, reports, records,
encounter data, or other information is submitted to the Division.” Data transfers must occur using
a secure and HIPAA-compliant FTP over a VPN connection.
4) Conduent and Truven Health Analytics
Conduent was the FAC for the Mississippi Medicaid program during the review period. Truven
was the FAC subcontractor responsible for the encounter data warehouse. The Truven data
warehouse was the source used by Myers and Stauffer for the encounter data. As the FAC, Con-
duent held responsibility for maintenance of the MMIS, adjudication of Medicaid fee-for-service
(FFS) claims, and intake and storage (data warehouse) of the Mississippi Medicaid managed
care encounter data. In accordance with EQR Protocol 4, Myers and Stauffer conducted a site
visit on April 26, 2016 with staff members from Conduent and Truven to discuss the encounter
3 U.S. Government Publishing Office, Electronic Code of Federal Regulations as of July 14, 2017, available at https://www.ecfr.gov/cgi-bin/text-idx?SID=5b6858ff72af7923d2556e76de6559f6&mc=true&node=pt42.4.438&rgn=div5#sp42.4.438.f

United Healthcare Community Plan
www.mslc.com page 13
Mississippi Medicaid Managed Care
EQR Protocol 4 Summary of Findings
process and to gain an understanding of their systems and processes currently in place for the
Mississippi Medicaid managed care program.
Findings
1) DOM encounter submission standards appear to be generally stated and could potentially be
subject to interpretation. Developing standards specific to encounter data submissions may im-
prove the quality of the encounter data and generate the accuracy and completeness required for
DOM oversight and other analyses performed using the encounter data.
For example, the contract contains language related to the frequency of encounter submissions.
According to the contract Section 10, sub-section R: “The Contractor must submit complete, ac-
curate, and timely Encounter Data to the Division that meets Federal requirements and allows the
Division to monitor the program at least monthly following the month in which they were pro-
cessed (paid or denied).” Under contract section 10, sub-section R, item 3: “All encounter records
must be submitted and determined acceptable by the FAC on or before the last calendar day of
the third month after the payment/adjudication calendar month in which the CCO paid/adjudicated
the claim.”
2) The contract between DOM and the CCOs sets forth a single 98 percent completeness standard
and a single two percent error rate for all service types. EQR Protocol 4 guidelines recommend
the states set specific standards for each service type to be reported.
3) The state’s data dictionaries are similar to what Myers and Stauffer has observed in other states,
however, there is an opportunity to enhance user friendliness, detail, and completeness. For ex-
ample, Myers and Stauffer identified challenges with tracing some fields from the 837s and
NCPDPs to their final location in the data warehouse. There was no document or crosswalk to
show that mapping. To trace the data points, we had to specifically ask the state/Conduent about
some fields. Oftentimes, the data dictionaries are machine generated from the database. The
best examples seen in other states appear to be generated by a database administrator or an in-
formation technology (IT) professional.
4) The CCOs are not providing a formal attestation or certification to DOM related to encounter data
submissions as required by their contracts. Federal regulation 42 CFR 438.606 requires that the
entity attest to the accuracy, completeness, and truthfulness of each encounter data submission.
5) In April 2016, CMS issued a major update to the federal Medicaid Managed Care rules in 42 CFR
438. A key component of the rule is increased state and federal oversight in the form of monitor-
ing and reporting. The rule requirements impact encounter data and are phased in over three
years with many of the provisions becoming effective on or after July 1, 2017. The DOM pro-
posed CCO contract amendment dated March 20, 2017 appears to include the necessary lan-
guage to address the rule’s encounter data requirements including direct reference to the specific
regulatory section. The only issue identified is in Section 11 on Program Integrity on page 150 in
Item 2:
Data on the basis of which the State certifies the actuarial soundness of capitation rates to the
Contractor under §438.3, including base data described in §438.5 (c) is generated by the Con-
tractor.

United Healthcare Community Plan
www.mslc.com page 14
Mississippi Medicaid Managed Care
EQR Protocol 4 Summary of Findings
The reference to actuarial soundness of the capitation rates is incorrectly cited as §438.3 of the
rule. The correct reference is to §438.4.
We noted the following potential risk areas during the on-site visit to Conduent:
6) Encounters cannot be identified for all of the CCOs’ delegated vendors. This poses challenges
with reconciling encounters with CDJs.
7) Conduent has a file limitation of 1,000 claims per file. Conduent can process up to 48,000 claims
per day, per CCO. This creates obstacles and potentially limits the ability of the CCOs to meet
submission compliance standards, particularly when the CCOs have to submit or re-submit large
batches of claims.
8) At the time of the Conduent on-site review, the diagnosis-related groups (DRGs) submitted by the
health plans were not being saved or stored. DOM and Conduent worked to resolve this issue
and a fix was implemented July 11, 2016.
9) Initial encounter reconciliation reviews identified an issue with claim adjustment reason (CAS)
code differences and coordination of CAS codes with the CCOs. We found instances where the
CCOs submitted a paid encounter with a CAS code that was processed by the FAC as CCO-de-
nied. This suggested that the FAC’s denial adjustment reason code (ARC) table may not contain
the same CAS codes that the CCO is intending to use to identify denied encounters. DOM has
been working with the CCOs and the FAC to review and update CAS codes to ensure CCO-de-
nied encounters are processing correctly.
10) Under the current system, DOM and the FAC may not be capturing accurate encounter infor-
mation on adjustments. There are claim adjustment instances in the encounters where the claim
adjustment back out is successful, but the corresponding replacement transaction is denied by
the FAC. This is creating a series of problems with the encounter data. First, these instances ef-
fectively remove paid encounters from the FAC’s data warehouse that the CCO may have in-
tended to replace. Additionally, when a CCO submits subsequent replacement transactions (to
replace the encounter record), these are denied due to the original claim already having been re-
moved. As a result, the CCO must send the transaction as a new, unrelated original encounter in
order to have it accepted. This process can produce encounters that may not reflect the CCO’s
actual claim adjustment activity. DOM has been working with the FAC and the CCOs to resolve
issues caused by incorrect CAS codes.
11) DOM has created a supplemental file on the claims/encounter side because the 835 does not
give sufficient detail to allow the CCOs to identify the reason for denial. DOM essentially provides
a type of crosswalk with details on the edits, so the CCOs can reconcile and better work the files.
The MississippiCAN edits are sent weekly.
12) According to Conduent representatives, there is no oversight or quality assurance check per-
formed on the Truven data warehouse standard reports that are submitted to the state (e.g.,
checking/verifying code, etc.).
Recommendations
1) DOM should update the standards and requirements specific to encounter data submission to in-
clude more details. This may include a specific day or date for submitting initial encounters. For

United Healthcare Community Plan
www.mslc.com page 15
Mississippi Medicaid Managed Care
EQR Protocol 4 Summary of Findings
example, DOM may want to change the contract for submission standards to read that the CCO
is required to submit encounter data within 60 days of claims payment (paid date). According to
DOM representatives, this provision will be part of the next contract amendment.
2) With respect to service types, error types, and acceptable error rates, the EQR Protocol 4 encour-
ages states to specify acceptable error rates for each encounter and error type as illustrated be-
low.
Table 1: EQR Protocol 4 Potential Encounter and Error Types for Which Acceptable Error Rates May
be Defined
Example Service Types Error Type* Acceptable Error Rate
(To Be Defined by State)
Institutional Inpatient Institutional Outpatient
Missing, Surplus, Erroneous < %
Behavioral Health Missing, Surplus, Erroneous < %
Professional Missing, Surplus, Erroneous < %
Vision Missing, Surplus, Erroneous < %
Dental Missing, Surplus, Erroneous < %
Prescription Missing, Surplus, Erroneous < %
Other Types of Encounters as Speci-fied by the State (e.g., laboratory, physical therapy, office visit, etc.)
Missing, Surplus, Erroneous < %
* See Glossary for definitions.
3) DOM may wish to consider whether a database administrator or an IT professional could help de-
velop more detailed data dictionaries that facilitate completeness and the ability to trace data from
the 837s and NCPDPs to their final location in the data warehouse.
4) DOM should require a standard written attestation from the CCOs for all encounter data submis-
sions. Even though this requirement is specified in the contract, interviews with CCO representa-
tives indicated this does not occur as a regular practice. DOM should monitor encounter data
submissions to ensure the attestation is included and completed by the appropriate CCO repre-
sentatives.
5) DOM should fix the following reference in the proposed March 20, 2017 CCO contract language
located in Section 11 on Program Integrity on page 150 in Item 2:
Data on the basis of which the State certifies the actuarial soundness of capitation rates to
the Contractor under §438.3, including base data described in §438.5 (c) is generated by
the Contractor.
The reference to actuarial soundness of the capitation rates is incorrectly cited as §438.3 of the
rule. The correct reference is to §438.4.
6) DOM is currently working with the CCOs to determine whether the CCOs’ claim numbers may be
modified to include a prefix to denote the delegated vendors in the encounter data.
7) DOM and Conduent should explore whether expansion of Conduent’s file and volume capacity is
feasible or whether such a change would be cost prohibitive.

United Healthcare Community Plan
www.mslc.com page 16
Mississippi Medicaid Managed Care
EQR Protocol 4 Summary of Findings
8) The FAC should capture and retain all encounter data as submitted by the CCOs.
9) DOM and the FAC should continue working with the plans to resolve all issues related to CAS
codes.
10) DOM should evaluate whether the 835s could be modified to include sufficient information on de-
nials to enable the CCO to reconcile and better work the files.
11) Conduent should implement a quality control system or method of checking the code and verify-
ing the accuracy of the standard Truven data warehouse reports submitted to the state.

United Healthcare Community Plan
www.mslc.com page 17
Mississippi Medicaid Managed Care
EQR Protocol 4 Summary of Findings
Activity 2: Review CCO’s Capability
This activity assesses the ability of the CCO’s information system and controls to collect and submit com-
plete and accurate encounter data.
Methodology
A survey was developed, documentation requested, and on-site activities were performed at each CCO to
assess their system capabilities.
The survey consisted of two parts. The first section requested information about the CCO, its parent com-
pany, and the local CCO environment, where applicable. Questions regarding encounter submissions, the
Information System Capabilities Assessment (ISCA), and subcontractor relationships were included, as
well as questions regarding any accreditation process. The CCO engaged a third party to perform an
ISCA or a HEDIS Roadmap Assessment, which evaluates the systems within a health plan as part of the
National Committee for Quality Assurance (NCQA) accreditation process. The second part of the survey
included questions found in Appendix 5, Attachment B of CMS EQR Protocol 4, regarding claim types,
code sets, enrollment systems, data systems, controls, and reporting mechanisms.
Requested documentation included work flows, policies, and procedures for handling encounter data,
subcontractor information, key contacts, organization charts, and other related documents. The documen-
tation was used to gain an understanding of the CCOs’ processes and to determine the appropriate staff
to interview and questions to ask during the on-site visit.
On-site activities were performed at the CCO encounter data center. DOM sent a notification letter to the
CCO describing the activities and proposed dates for the on-site visit in January 2016. Planning confer-
ence calls were held during February and March 2016 to discuss logistics, questions, and other pre-visit
activities.
On-site activities were conducted May 23 through 25, 2016 at UHC’s corporate offices in Minnetonka,
Minnesota. Individuals identified from the CCO’s organization chart were interviewed and asked about
encounter data operations. Additional individuals identified during the interview process were added to
the list of interviewees. UHC personnel were readily available and provided a comprehensive view of their
encounter data processes.
Based on UHC’s responses to the Myers and Stauffer survey, the details provided on the ISCA, a review
of the 2015 EQRO report, and on-site interviews, there were no significant issues or concerns noted by
Myers and Stauffer pertaining to the overall UabilityU of UHC’s systems to produce accurate and complete
encounter data. Our findings in this area were consistent with the 2015 EQRO review conducted by the
Carolinas Center for Medical Excellence.

United Healthcare Community Plan
www.mslc.com page 18
Mississippi Medicaid Managed Care
EQR Protocol 4 Summary of Findings
Findings
1) Control totals are not sent to the FAC by UHC to ensure the number of encounters submitted in
the files are correctly received and loaded by the FAC. Additionally, UHC receives acknowledg-
ment of the files from Conduent, but no control totals.
2) Dashboards containing operational metrics used to meet state reporting requirements are auto-
matically refreshed when the data warehouse is refreshed and new claims are accepted from the
claims processing system. During the on-site interviews, UHC personnel indicated many reports
are automated and a quality assurance check is not completed on report creation.
3) UHC representatives noted that UHC completes high-level audits of delegated vendors, however,
there is no auditing of delegated vendors on a claim detail level.
4) There is limited oversight and validation of subcontractor encounter data. Often, the data is
passed through UHC to Conduent via automated processes with minimal checks for completion
or subsequent validation by UHC.
Recommendations
1) The CCO should modify their processes, as necessary, to ensure all data files, especially sub-
contractor data files, are complete. This may include, but not be limited to, exchange of control
totals for both inbound and outbound subcontractor files. Additionally, control totals should also
be exchanged between the FAC and the CCO.
2) A quality assurance process should be developed to ensure all updated data from the dash-
boards gets reflected in the reports prepared for and submitted to DOM.
3) UHC should evaluate the benefits of conducting a more comprehensive audit of delegated ven-
dors by including audits at the claim level detail as part of the audit process.
4) The Medicaid Managed Care Final Rule imposes the same expectations for subcontractor en-
counter data as it does for the CCO. Accordingly, the CCO needs to hold the subcontracted ven-
dors accountable to the required encounter data submission standards.

United Healthcare Community Plan
www.mslc.com page 19
Mississippi Medicaid Managed Care
EQR Protocol 4 Summary of Findings
Activity 3: Analyze Electronic Encounter Data
This activity is the core process to determine the validity of the encounter data. It is designed to assist the
state in determining whether the data can be used for additional analysis, including Activity 4: Medical
Record Review.
The Activity is comprised of four steps:
1) Developing a quality test plan;
2) Verifying the integrity of the CCO encounter data files;
3) Generating and reviewing analytic reports; and
4) Comparing findings to State-identified standards.
Step 1: Test Plan
The testing plan for MississippiCAN encounter data encompassed testing all service types since Activity 3
had not been performed previously on the Mississippi Medicaid encounter data. CHIP data was excluded
from testing due to the encounter submissions provided to the FAC from the CCO being incomplete.
Calendar year 2015 encounter data and CDJs were utilized in performing the encounter data testing and
analysis. Additionally, two distinct measurement sample periods were selected by Myers and Stauffer and
approved by DOM for use in testing; January 1, 2015 through January 31, 2015 and October 1, 2015
through October 31, 2015. Cash disbursement journals were submitted by the CCO and its subcontrac-
tors, and encounter data was provided by the FAC. The CCO and subcontractors were instructed to in-
clude all claims payments, adjustments, or voids made during the 2015 calendar year related to Missis-
sippiCAN, excluding any sub-capitated amounts in the CDJ. The detailed 2015 CDJs were submitted on a
monthly basis to Myers and Stauffer. The 2015 encounter data provided by the FAC contains all encoun-
ters submitted by the CCO to the FAC regardless of whether the encounter was paid or denied. The CCO
submitted claims data extracts, based on paid (adjudication) date, from its claims processing systems and
from each subcontracted vendor’s claims processing systems for the sample months. Each extract in-
cluded the following service types covered under the Mississippi Medicaid program for the sample peri-
ods: outpatient institutional, professional, pharmacy, and dental claims. All encounter types processed
within the CCO or subcontractor’s claims processing system (e.g., paid, denied, adjusted, subcontracted
vendor, sub-capitated provider, etc.) were included in the extract. Inpatient institutional claims are not in-
cluded in the sample testing of this report, as inpatient services were carved during December 2015.
The cumulative 2015 totals from the CDJs and encounter data were used to test the completeness of the
encounter data. The samples were utilized to test the quality of the encounter data received from the FAC
at a claim (header) or a line level of detail for both completeness and accuracy. The sample testing was
based on receiving a full set of claims data for the testing period from the CCO to determine missing, sur-
plus, and erroneous encounters contained within the FAC encounter data by comparing the claims data
set to the FAC encounter data.

United Healthcare Community Plan
www.mslc.com page 20
Mississippi Medicaid Managed Care
EQR Protocol 4 Summary of Findings
Step 2: Verifying the Integrity of the CCO Encounter Data Files
Verifying the integrity of the CCO encounter data files requires verifying both the completeness of the en-
counter data and the accuracy of the encounter data.
Verification of Completeness
In determining the completeness of the encounter data, DOM’s contract with the CCO stipulates the CCO
is required to submit 98 percent of all encounter data, including those of subcontractors or delegated ven-
dors, and the percentage completion will be validated by utilizing the CDJs of the CCO and its subcon-
tractors. Myers and Stauffer performs a bi-monthly reconciliation of the CDJ to the FAC encounter data on
DOM’s behalf to measure the encounter data completeness. The contract between DOM and the CCO
does not stipulate the measurement period required to be utilized to measure compliance nor does it stip-
ulate if the percentage should be measured by service type, or if a separate measurement should be ap-
plied by subcontractor. The bi-monthly reconciliation report reflects 24 months of data with monthly, as
well as cumulative totals, and contains a separate report for each subcontractor, if identifiable.
Completeness of encounter data can also be measured based on the number of encounters to ensure
denials, resubmissions, and zero pay encounters related to sub-capitated providers are included in the
encounter data in addition to paid encounters. However, because this methodology does not focus on
CCO payments, which is necessary when utilizing the encounter data for the establishment of future capi-
tation rates, DOM uses the CDJ reconciliation methodology. Also, the risk of missing zero pay encounters
related to sub-capitated providers does not exist in this instance, as the CCO does not contract with sub-
capitated providers.
For the purposes of the EQR Protocol 4 report, CY 2015 CDJs and encounters are included in the com-
pleteness measurement from the Encounter Data Validation Report issued March, 2017. As demon-
strated in the completion percentages in the following tables, the encounter payments are in excess of the
total cash disbursements for the dental service type (113.18 percent), which may indicate the CDJs are
understated if the FAC encounters are valid.
Table 2: Cumulative Completeness Percentage by Service Type for Calendar Year 2015
Paid Amount based on Encounter Data Validation (EDV) March 2017 Report
Service Type Total CDJ Paid
Amount Total Encounter
Paid Amount
Cumulative Completeness
Percentage
Institutional/Professional $ 366,031,625 $ 360,565,484 98.50%
Dental $ 31,614,693 $ 35,781,840 113.18%
Pharmacy $ 179,411,342 $ 178,806,675 99.66%
Total $ 577,057,659 $ 575,153,999 99.67%
*May not sum due to rounding.
Completeness of the two months of sample data received from the CCO was also measured based on a
comparison of the sample data payments segregated by medical (institutional and professional), dental,
and pharmacy claims to the CDJ for the sample months. This comparison was originally performed to es-

United Healthcare Community Plan
www.mslc.com page 21
Mississippi Medicaid Managed Care
EQR Protocol 4 Summary of Findings
tablish whether the quality of the encounter data for the sample periods was sufficient to continue with Ac-
tivity 4, the medical records review. However, after conversation with DOM, it was determined necessary
to proceed with the medical record review regardless of the completeness or accuracy percentages con-
tained in Activity 3. This was done to assess the adequacy of the medical record documentation required
by the CCO and maintained by the providers. See Table 3 below for the January and October complete-
ness percentages.
Table 3: Completeness Percentage by Service Type for Sample Periods
Paid Amount based on Encounter Data Validation (EDV) March 2017 Report
Service Type
Total Sample Paid Amount
Matched by ICN to Encounter
Data
Total Paid Amount Change
based on EDV Logic
Total Paid Amount
Total CDJ Paid
Amount Per EDV Report
Completeness Percentage
Outpatient/ Professional*
$ 61,844,950 $ (7,848,300) $53,996,650 $ 59,542,115 91%
Dental $ 4,623,827 $ (1,976,181) $ 2,647,646 $ 5,615,640 47%
Pharmacy $ 29,891,675 $ (1,937,659) $27,954,017 $ 27,059,839 103%
*Inpatient services were not available during the sample periods.
It is important to note the encounter paid amounts used in comparison of the CCO and subcontractor
CDJs are adjusted in some instances to account for errors noted in analyzing the encounter data during
the bi-monthly encounter data verification performed by Myers and Stauffer. Payment adjustments are
made for items such as denied claims reflecting a paid amount in the encounter data (possibly due to
shadow pricing), adjustment credit encounters reflecting a debit payment rather than a credit adjustment,
and duplicate encounters noted within the encounter data. As reflected in the table above, the sample
paid claim amounts submitted by the CCOs for January and October were adjusted by $7,848,300 for
outpatient and professional claims, $1,976,181 for dental claims, and $1,937,659 for pharmacy claims.
Verification of Accuracy
For the purpose of verifying the integrity of the FAC encounter data, the claims data from the two sample
periods of January and October 2015 were compared with the encounter data for key data components
chosen for testing. The MMIS Internal Control Number (ICN) field and the Transaction Control Number
(TCN) field were utilized as the unique identifiers (IDs) in the comparison of the CCO claims data and
FAC encounter data for all service types. This unique ID is populated by the FAC and communicated to
the CCO in the X12 835 response file and serves as the link between the data sets. The EQR Protocol 4
guidelines require the EQRO to verify the accurate incorporation of the state’s IDs into the CCO infor-
mation system. The use of other identifiers such as a CCO claim number or account number can result in
multiple encounters matching one claim number, which eliminates the uniqueness of the ID. Additionally,
CCO claim numbers may not be unique between all CCOs in the state.
Key data elements were measured on either a claim (header) or a line level of detail, depending on the
characteristic of the element. This approach causes the number of data elements tested to vary by key
element. For key data elements such as diagnosis code or tooth number, there may be multiple items to

United Healthcare Community Plan
www.mslc.com page 22
Mississippi Medicaid Managed Care
EQR Protocol 4 Summary of Findings
test for one MMIS_ICN number. The individual key data element error and missing rates are calculated
based on the number of items in the sample excluding claims which have no value for the key data ele-
ment for data elements tested at the line level. For header key data elements, claims with missing header
elements are included in the error rate because all header elements are required. An exception, is the for-
mer MMIS claim ICN, which is tested at the header level, but not required on each claim since it would
only be applicable to replacement or adjustments. Therefore, the total sample is limited to the claims with
values. However, in calculating the surplus, all surplus claims were considered surplus, which causes an
unusually high surplus percentage for the data element.
Valid Value Testing
Analysis was performed to determine the validity for key data element values in the encounter data for the
paid months of January and October 2015.
Testing Assumptions:
1) All encounters contained in the FAC data warehouse for the paid months of January and October
2015, were included.
2) The claims were divided into the following service types:
a. Outpatient institutional, professional, dental, and pharmacy.
b. Inpatient institutional claims are not included in this report, as inpatient services were
carved in during December 2015.
3) Key data elements were reviewed based on frequency of invalid and null values.
a. Reference Table 4a: Key Data Element Valid Values Criteria by Service Type for testing
criteria defined for each key data element and service type.
4) Performed other consistency checks, such as verifying key data elements contain expected values
in the correct format and specificity, and values were consistent across elements.
Findings
The following table outlines all key data elements tested and the error rates reported based on validity
and null values by service type.

United Healthcare Community Plan
www.mslc.com page 23
Mississippi Medicaid Managed Care
EQR Protocol 4 Summary of Findings
Table 4a: Key Data Element Valid Values Criteria by Service Type
Valid Values Criteria
Key Data Ele-ment
Header/Line Level
Outpatient Professional Dental Pharmacy
Type of Bill Header Level Character value defined on
UB92/UB0404 claim form
Former MMIS Claim ICN
Header Level Character value of length 17 with lead-
ing zeros
Character value of length 17 with lead-
ing zeros
Character value of length 17 with
leading zeros
Header First DOS
Header Level Valid date value > 1/1/2000
Valid date value > 1/1/2000
Header Last DOS
Header Level Valid date value > 1/1/2000
Valid date value > 1/1/2000
Header Paid Amount
Header Level Numeric value with two decimal places
Numeric value with two decimal places
MMIS ICN Header Level Character value of length 17 with lead-
ing zeros
Character value of length 17 with lead-
ing zeros
Character value of length 17 with
leading zeros
Character value of length 17 with
leading zeros
MMIS Member Number
Header Level Character value of length 14 with lead-
ing zeros
Character value of length 14 with lead-
ing zeros
Character value of length 14 with
leading zeros
Character value of length 14 with
leading zeros
Billing Provider NPI
Header Level Character value of length 10
Character value of length 10
Character value of length 10
Character value of length 10
Service/ Ren-dering Provider NPI
Header Level Character value of length 10
Character value of length 10
Character value of length 10
Character value of length 10
Service Provider Taxonomy
Header Level Taxonomy code of length 10
Taxonomy code of length 10
Place of Service Header Level
Valid CMS POS value
Valid CMS POS code value
Provider Spe-cialty Code
Header Level
No data to test
Plan Paid Date Header Level Valid date value > 1/1/2000
Valid date value > 1/1/2000
Valid date value > 1/1/2000
Valid date value > 1/1/2000
Plan Received Date
Header Level Valid date value > 1/1/2000
Valid date value > 1/1/2000
Valid date value > 1/1/2000
Valid date value > 1/1/2000
Diagnosis Codes
Header Level Valid ICD-9-CM or ICD-10-PCS code
Valid ICD-9-CM or ICD-10-PCS code
Surgical Procedure Codes
Header Level Valid ICD-9-CM or ICD-10-PCS code
Valid ICD-9-CM or ICD-10-PCS code
Plan Paid Amount
Line Level Numeric value with two decimal places
Numeric value with two decimal places
Numeric value with two decimal
places
Numeric value with two decimal
places
Procedure Code Line Level Valid CPT-4 code Valid CPT-4 code Valid CPT-4 code
Procedure Modifiers
Line Level Valid Level I (AMA) or Level II (CMS)
code
Valid Level I (AMA) or Level II (CMS)
code

United Healthcare Community Plan
www.mslc.com page 24
Mississippi Medicaid Managed Care
EQR Protocol 4 Summary of Findings
Valid Values Criteria
Key Data Ele-ment
Header/Line Level
Outpatient Professional Dental Pharmacy
Revenue Code Line Level Character value defined on
UB92/UB04 claim form
Billed Charges Line Level Numeric value with two decimal places
Numeric value with two decimal places
Numeric value with two decimal
places
Line FDOS Line Level Valid date value >
1/1/2000 Valid date value >
1/1/2000 Valid date value
> 1/1/2000
Line LDOS Line Level Valid date value >
1/1/2000 Valid date value >
1/1/2000
Tooth Numbers Line Level Valid ADA Sys-
tem code
Tooth Surfaces Line Level Valid ADA Sys-
tem code
Date Filled Line Level Valid date value
> 1/1/2000
Days Supply Line Level
Numeric value with no decimal
places
Dispensed Units Line Level Numeric value
NDC Line Level Character value
of length 11
Refill Number Line Level
Numeric value with no decimal
places
Prescription Number Line Level
Numeric value with no decimal
places
Table 4b: Key Data Element Valid Values Error Rates by Service Type
Error Rate
Key Data Element Header/ Line
Level
Outpatient Professional Dental Pharmacy
Invalid Null Invalid Null Invalid Null Invalid Null
Type of Bill Header Level 0.0% 0.0%
Former MMIS Claim ICN Header Level 0.0% N/A 0.0% N/A 0.0% N/A
Header First DOS Header Level 0.0% 0.0% 0.0% 0.0%

United Healthcare Community Plan
www.mslc.com page 25
Mississippi Medicaid Managed Care
EQR Protocol 4 Summary of Findings
Error Rate
Key Data Element Header/ Line
Level
Outpatient Professional Dental Pharmacy
Invalid Null Invalid Null Invalid Null Invalid Null
Header Last DOS Header Level 0.0% 0.0% 0.0% 0.0%
Header Paid Amount Header Level 0.0% 0.0% 0.0% 0.0%
MMIS ICN Header Level 0.0% 0.0% 0.0% 0.0% 0.0% 0.0% 0.0% 0.0%
MMIS Member Number Header Level 0.0% 0.0% 0.0% 0.0% 0.0% 0.0% 0.0% 0.0%
Billing Provider NPI Header Level 0.0% 0.2% 0.0% 0.0% No data to test 100.0% 0.0%
Service/ Rendering Provider NPI Header Level 0.0% 0.2% 0.0% 0.0% 0.0% 0.0% 0.0% 0.0%
Service Provider Taxonomy Header Level 0.0% 0.0% 0.0% 0.0%
Place of Service Header Level 0.0% 0.0% 0.0% 0.0%
Provider Specialty Code Header Level
No data to test
Plan Paid Date Header Level 0.0% 0.0% 0.0% 0.0% 0.0% 0.0% 0.0% 0.0%
Plan Received Date Header Level 0.0% 0.0% 0.0% 0.0% 0.0% 0.0% 100.0% 0.0%
Diagnosis Codes Header Level 0.0% 0.0% 0.0% 100.0%
Surgical Procedure Codes Header Level No data to test No data to test
Plan Paid Amount Line Level 0.0% 0.0% 0.0% 0.0% 0.0% 0.0% 0.0% 0.0%
Procedure Code Line Level 0.0% N/A 0.0% 0.0% 0.0% 0.0%
Procedure Modifi-ers Line Level 0.0% N/A 0.0% N/A
Revenue Code Line Level 0.0% 0.0%
Billed Charges Line Level 0.0% 0.0% 0.0% 0.0% 0.0% 0.0%
Line FDOS Line Level 0.0% 0.0% 0.0% 0.0% 0.0% 0.0%
Line LDOS Line Level 0.0% 0.0% 0.0% 0.0%
Tooth Numbers Line Level 0.1% N/A
Tooth Surfaces Line Level 0.0% N/A
Date Filled Line Level 0.0% 0.0%
Days Supply Line Level 0.0% 0.0%

United Healthcare Community Plan
www.mslc.com page 26
Mississippi Medicaid Managed Care
EQR Protocol 4 Summary of Findings
Error Rate
Key Data Element Header/ Line
Level
Outpatient Professional Dental Pharmacy
Invalid Null Invalid Null Invalid Null Invalid Null
Dispensed Units Line Level 0.0% 0.0%
NDC Line Level 0.0% 0.0%
Refill Number Line Level 0.0% 0.0%
Prescription Num-ber Line Level 0.0% 0.0%
1) Outpatient and Professional Key Data Elements: The Principal Diagnosis Code for profes-
sional claims is null 100 percent of the time, however the Diagnosis Code 1 data element is popu-
lated with valid values.
2) 0TDental Key Data Elements: 0T The Tooth Numbers data element had a 0.1 percent invalid error rate
identified.
3) Pharmacy Key Data Elements: Billing Provider NPI reflected a 100 percent invalid error rate be-
cause the field does not contain an NPI number. All values are length of five and six instead of
the required ten character length. In addition the Plan Received date had a 100 percent invalid
error date due to the field being populated with a date of 01/01/0001.
Recommendations
1) Conduent should ensure that all values submitted are valid and at a minimum report these errors
to allow for corrections when necessary.
Key Data Elements Matching
Table 5: Data Elements and Matching Error Rate by Service Type displays each key data element and
error rate by service type. Additionally, Table 6: Number of Data Elements and Matching Error Rate by
Service Type displays the number of data elements tested as well and the number of errors by service type.
The error rates were segregated to reflect the following:
Missing: Claims included in the sample that are not present in FAC encounter data.
Surplus: Encounters present in the FAC, based on adjudication date, which were not included in
the claims data sample.
Erroneous: FAC encounters that are represented in the claims sample data that contain incorrect
data elements based on comparison with the sample claims data.
The error rates were calculated and shown in total for the sampled months of January and October 2015.

United Healthcare Community Plan
www.mslc.com page 27
Mississippi Medicaid Managed Care
EQR Protocol 4 Summary of Findings
Table 5: Data Elements and Matching Error Rate by Service Type
Error Rate
Key Data Element Header/
Line Level
Outpatient Professional Dental Pharmacy
Mis
sin
gP1
Su
rplu
s
Err
on
eo
us
Mis
sin
gP1
Su
rplu
s
Err
on
eo
us
Mis
sin
gP1
Su
rplu
s
Err
on
eo
us
Mis
sin
gP1
S
urp
lus
Err
on
eo
us
Type of Bill Header Level
0% 15% 6%
Former MMIS Claim ICN Header Level
0% 76% 0% 0% 52% 0% 0% 108% 0%
Header First DOS Header Level
0% 15% 1% 0% 21% 0% 0% 109% 1%
Header Last DOS Header Level
0% 15% 1% 0% 21% 1%
Header Paid Amount Header Level
0% 15% 78% 0% 21% 76%
MMIS ICN Header Level
0% 15% 0% 0% 21% 0% 0% 109% 0% 1% 26% 0%
MMIS Member Number Header Level
0% 15% 0% 0% 21% 0% 0% 109% 0% 1% 26% 0%
Billing Provider NPI Header Level
0% 15% 71% 0% 21% 81% 0% 109% 71% 1% 26% 99%
Service/Rendering Provider NPI
Header Level
0% 15% 100% 0% 21% 100% 0% 109% 63% 1% 26% 1%
Service Provider Type
Header Level
0% 15% 13% 0% 21% 26%
Place of Service Header Level
0% 21% 0% 0% 109% 3%
Provider Specialty Code
Header Level
No data to test
Plan Paid Date Header Level
0% 15% 4% 0% 21% 4% 0% 109% 0% 1% 26% 0%

United Healthcare Community Plan
www.mslc.com page 28
Mississippi Medicaid Managed Care
EQR Protocol 4 Summary of Findings
Error Rate
Key Data Element Header/
Line Level
Outpatient Professional Dental Pharmacy
Mis
sin
gP1
Su
rplu
s
Err
on
eo
us
Mis
sin
gP1
Su
rplu
s
Err
on
eo
us
Mis
sin
gP1
Su
rplu
s
Err
on
eo
us
Mis
sin
gP1
S
urp
lus
Err
on
eo
us
Plan Received Date Header Level
0% 15% 0% 0% 21% 0% 0% 109% 0% 1% 26% 99%
Diagnosis Codes Header Level
0% 15% 0% 0% 21% 0%
Surgical Procedure Codes Header Level
No data to test
Plan Paid Amount Line Level
0% 13% 97% 0% 14% 95% 0% 124% 99% 1% 26% 94%
Procedure Code Line Level
0% 15% 0% 0% 19% 1% 0% 124% 9%
Procedure Modifiers Line Level
0% 15% 18% 0% 19% 14%
Revenue Code Line Level
0% 15% 0%
Billed Charges Line Level
0% 15% 5% 0% 20% 5% 0% 124% 9%
Line FDOS Line Level
0% 15% 0% 0% 19% 1%
Line LDOS Line Level
0% 15% 1% 0% 19% 1%
Tooth Numbers
Line Level
0% 127% 10%
Tooth Surfaces
Line Level
0% 135% 61%
Date Filled Line Level
1% 26% 0%

United Healthcare Community Plan
www.mslc.com page 29
Mississippi Medicaid Managed Care
EQR Protocol 4 Summary of Findings
Error Rate
Key Data Element Header/
Line Level
Outpatient Professional Dental Pharmacy
Mis
sin
gP1
Su
rplu
s
Err
on
eo
us
Mis
sin
gP1
Su
rplu
s
Err
on
eo
us
Mis
sin
gP1
Su
rplu
s
Err
on
eo
us
Mis
sin
gP1
S
urp
lus
Err
on
eo
us
Days Supply
Line Level
1% 26% 3%
Dispensed Units Line Level
1% 26% 3%
NDC Line Level
1% 26% 0%
Refill Number
Line Level
1% 26% 29%
Prescription Number Line Level
1% 26% 0%
Overall Error Rate 0% 15% 12% 0% 20% 13% 0% 118% 26% 1% 26% 25%
P
1 P"Missing" encounters may include instances in which CHIP claims were presented by the CCO as CAN claims within the sample dataset and may result in inflated counts
and percentages.

United Healthcare Community Plan
www.mslc.com page 30
Mississippi Medicaid Managed Care
EQR Protocol 4 Summary of Findings
Table 6: Number of Data Elements and Matching Error Rate by Service Type
Number of Data Elements
Key Data Element
Header/ Line Level
Outpatient Professional Dental Pharmacy T
ota
l
Ele
me
nts
Sa
mp
led
Mis
sin
gP1
Su
rplu
s
Err
on
eo
us
To
tal
Ele
-
me
nts
Sa
m-
ple
d
Mis
sin
gP1
Su
rplu
s
Err
on
eo
us
To
tal
Ele
me
nts
Sa
mp
led
Mis
sin
gP1
Su
rplu
s
Err
on
eo
us
To
tal
Ele
me
nts
Sa
mp
led
Mis
sin
gP1
Su
rplu
s
Err
on
eo
us
Type of Bill
Header Level
76,476 18 11,230 4,463
Former MMIS Claim ICN
Header Level
7,530 18 5,704 - 48,705 69 25,224 1 22,727 6 24,589 -
Header First DOS
Header Level
77,257 18 11,230 781 432,893 69 91,457 841 41,597 6 45,192 388
Header Last DOS
Header Level
77,254 18 11,230 778 432,880 69 91,457 2,336
Header Paid Amount
Header Level
76,476 18 11,230 60,022 432,053 69 91,457 327,365
MMIS ICN Header Level
76,476 18 11,230 - 432,053 69 91,457 - 41,209 6 44,785 - 350,866 3,201 92,865 -
MMIS Member Number
Header Level
76,476 18 11,230 28 432,053 69 91,457 219 41,209 6 44,785 23 350,866 3,201 92,865 108
Billing Pro-vider NPI
Header Level
76,476 18 11,230 54,162 432,053 69 91,457 351,261 41,209 6 44,785 29,234 350,866 3,201 92,865 347,665
Service/ Rendering Provider NPI
Header Level
76,476 18 11,230 76,445 432,053 69 91,457 431,984 41,209 6 44,785 26,064 350,866 3,201 92,865 3,760
Service Provider Type
Header Level
76,476 18 11,230 10,144 432,053 69 91,457 114,006

United Healthcare Community Plan
www.mslc.com page 31
Mississippi Medicaid Managed Care
EQR Protocol 4 Summary of Findings
Number of Data Elements
Key Data Element
Header/ Line Level
Outpatient Professional Dental Pharmacy
To
tal
Ele
me
nts
Sa
mp
led
Mis
sin
gP1
Su
rplu
s
Err
on
eo
us
To
tal
Ele
-
me
nts
Sa
m-
ple
d
Mis
sin
gP1
Su
rplu
s
Err
on
eo
us
To
tal
Ele
me
nts
Sa
mp
led
Mis
sin
gP1
Su
rplu
s
Err
on
eo
us
To
tal
Ele
me
nts
Sa
mp
led
Mis
sin
gP1
Su
rplu
s
Err
on
eo
us
Place of Service
Header Level
432,844 69 91,457 791 41,209 6 44,785 1,325
Provider Specialty Code
Header Level
No data to test
Plan Paid Date
Header Level
76,729 18 11,230 2,728 432,853 69 91,457 15,702 41,209 6 44,785 - 350,866 3,201 92,865 1,638
Plan Re-ceived Date
Header Level
76,476 18 11,230 - 432,053 69 91,457 - 41,209 6 44,785 8 350,866 3,201 92,865 347,665
Diagnosis Codes
Header Level
76,476 18 11,230 - 432,053 69 91,457 2
Surgical Procedure Codes
Header Level
No data to test
Plan Paid Amount
Line Level 220,542 11 28,540 214,652 592,646 2 81,281 563,523 125,623 20 155,616 124,545 350,866 3,201 92,865 330,194
Procedure Code
Line Level 349,385 70 52,158 1,594 860,914 134 164,739 5,811 139,221 36 172,905 13,010
Procedure Modifiers
Line Level 345,293 70 52,158 63,457 860,651 134 164,739 123,111
Revenue Code
Line Level 409,643 85 61,119 1,973
Billed Charges
Line Level 408,991 84 61,086 20,606 813,867 133 161,813 41,112 138,993 36 172,890 13,068
Line FDOS
Line Level 409,805 85 61,119 1,973 851,052 134 164,739 5,811
Line LDOS
Line Level 409,618 85 61,119 4,111 850,929 134 164,739 8,786

United Healthcare Community Plan
www.mslc.com page 32
Mississippi Medicaid Managed Care
EQR Protocol 4 Summary of Findings
Number of Data Elements
Key Data Element
Header/ Line Level
Outpatient Professional Dental Pharmacy
To
tal
Ele
me
nts
Sa
mp
led
Mis
sin
gP1
Su
rplu
s
Err
on
eo
us
To
tal
Ele
-
me
nts
Sa
m-
ple
d
Mis
sin
gP1
Su
rplu
s
Err
on
eo
us
To
tal
Ele
me
nts
Sa
mp
led
Mis
sin
gP1
Su
rplu
s
Err
on
eo
us
To
tal
Ele
me
nts
Sa
mp
led
Mis
sin
gP1
Su
rplu
s
Err
on
eo
us
Tooth Numbers
Line Level 45,275 18 57,310 4,725
Tooth Sur-faces
Line Level 12,770 2 17,236 7,742
Date Filled Line Level 350,866 3,201 92,865 -
Days Sup-ply
Line Level 350,866 3,201 92,865 10,247
Dispensed Units
Line Level 350,880 3,201 92,878 10,931
NDC Line Level 350,866 3,201 92,898 97
Refill Number
Line Level 350,481 3,201 92,865 100,362
Prescrip-tion Num-ber
Line Level 350,866 3,201 92,865 1,175
Total 3,480,331 724 517,763 517,917 10,066,658 1,568 2,024,758 1,992,662 814,669 166 959,233 220,132 4,560,887 41,613 1,207,291 1,153,842
P
1 P"Missing" encounters may include instances in which CHIP claims were presented by the CCO as CAN claims within the sample dataset and may result in inflated counts
and percentages.

UnitedHealthcare Community Plan
www.MSLC.com page 33
Mississippi Medicaid Managed Care
EQR Protocol 4 Summary of Findings
Findings
1) Measuring Completeness: The contract between DOM and the CCO does not stipulate the
measurement period required to be utilized to measure compliance with the 98 percent encounter
submission minimum, nor does it stipulate if the percentage should be measured by service type,
or if a separate measurement should be applied by subcontractor.
2) Surplus Encounters (All Service Types): Surplus encounters across all service types are an
area of concern in the FAC encounter data based on the claim set submitted by the CCO for the
sample months of January and October 2015. Surplus encounters, based on number of encoun-
ters, range from 26 percent for pharmacy, 15 percent for outpatient, 20 percent for professional,
and 118 percent for dental. The surplus encounters, based on paid amounts and number of en-
counters, are summarized by encounter and service type below.
The paid amount for outpatient/professional and pharmacy is at the header level. Therefore, the
total surplus of 102,687 for outpatient/professional and 92,865 for pharmacy represents the num-
ber of surplus encounters for these two service types. For dental claims, the paid amount is re-
flected at the line level. The 155,616 surplus paid amount data elements represent 44,785 sur-
plus dental encounters. The total number of surplus encounters and surplus percentage by ser-
vice type are also reflected above in Table 5: Data Elements and Matching Error Rate by Service
Type and Table 6: Number of Data Elements and Matching Errors by Service Type.
Table 7: Encounter Surplus Reconciliation
Service Type
Description
Outpatient/Professional Dental Pharmacy
Number of Data
Elements Paid Amount
Number of Data
Elements Paid Amount
Number of Data
Elements Paid Amount
Total Encounter Paid Amount
611,129 $ 77,447,146 281,219 $ 13,396,801 440,530 $ 37,938,101
Encounter Paid Amount for Claims Matched to Sample by ICN
508,442 $ 61,844,950 125,603 $ 4,623,827 347,665 $ 29,891,675
Surplus at En-counter Paid Amounts
102,687 $ 15,602,196 155,616 $ 8,772,974 92,865 $ 8,046,426
Surplus by En-counter Type
Final 17,891 $ 2,140,985 1,933 $ 95,354 78,331 $ 6,689,956
Duplicate 61,963 $ 9,795,240 152,636 $ 8,632,919 2 $ 1,540
Void 18,898 $ 3,251,991 179 $ (12,724) 3,738 $ 345,159
Denied 2,711 $ 2,674 838 $ 54,843 325 $ 145,422
Replaced 777 $ 36,328 30 $ 2,582 10,467 $ 863,448
Unidentified 447 $ 374,977 - $ - 2 $ 901
Total Surplus 102,687 $ 15,602,196 155,616 $ 8,772,974 92,865 $ 8,046,426

UnitedHealthcare Community Plan
www.MSLC.com page 34
Mississippi Medicaid Managed Care
EQR Protocol 4 Summary of Findings
Service Type
Description
Outpatient/Professional Dental Pharmacy
Number of Data
Elements Paid Amount
Number of Data
Elements Paid Amount
Number of Data
Elements Paid Amount
EDV Adjustments $ (9,939,834) $ (5,062,327) $ (838,180)
Surplus at EDV Paid
102,687 $ 5,662,363 155,616 $ 3,710,646 92,865 $ 7,208,246
3) The dollar impact of the surplus encounters for outpatient/professional, dental, and pharmacy en-
counters is less significant after payment adjustments are made for errors related to duplicates,
voids, denials, and replacements as explained above in Table 3: Completeness Percentage by
Service Type for Sample Periods. Because the majority of the surplus encounters relate to these
non-final (void, replaced, denied) encounter types which require adjustment to the raw encounter
data paid amounts, the surplus encounters paid amounts would be adjusted by $9,939,834 for
outpatient/professional encounters, $5,062,327 for dental encounters, and $838,180 for phar-
macy encounters for the two sample months, if the encounter data validation logic is applied to
the surplus encounters. 0TThe adjusted surplus based on paid amounts is: 0T$5,662,363 for 0Toutpa-
tient/professional encounters;0T $3,710,646 for dental encounters; and $7,208,246 for pharmacy
encounters. 0TAlthough there were non-final encounter types included in the CCO’s two months of
sample claims data, the claims sample was primarily comprised of final claims. The surplus could
be overstated for any of the service types if the CCO didn’t provide a complete claim set for the
January and October 2015 sample months.
4) 0TAs identified in Table 3: 0TCompleteness Percentage by Service Type for Sample Periods on page
21, the 2015 annual completion percentage for dental claims is 113.18 percent which may signify
inaccurate CDJ information supplied by UHC.
5) Outpatient Key Data Elements: The overall missing, surplus, and error rates related to outpa-
tient encounters in the two sample months of January and October 2015 were 0 percent, 15 per-
cent, and 12 percent, respectively. Header Paid Amount, Billing Provider NPI, and Service/Ren-
dering Provider NPI experienced the highest error rates of 78 percent, 71 percent, and 100 per-
cent respectively, for the key data elements. Billing Provider and Service/Rendering Provider NPI
values are reflecting a high error rate due to the sample not containing values to test. There were
47,729 of the Billing Provider fields and 48,984 of the Service/Rendering Provider NPI fields out
of the total sample of 76,476 claims that were blank. These blank fields are included as errors
due to the field being a required value. The encounter data reflected values for these fields for all
but 17 encounters. The Header Paid Amount’s 78 percent error rate is primarily attributable to the
CCO submitting payment amounts as whole dollars (no cents) in the sample. 58,083 of the
60,022 payment errors noted had variances less than $1, which are most likely due to the
rounded sample value payments provided by the CCO. The remaining 1,939 of the 60,022 errors
were due to either negative rounded dollar payment amounts in the sample with corresponding
positive payments with dollars and cents in the encounter data or had a variance larger than $1,
and could not be explained. Plan Paid Amount, tested at the line level, reflected an error rate of
97 percent. This error rate is partially attributable to the sample payment amounts being submit-
ted in whole dollars values. However, there are additional issues noted when comparing the line

UnitedHealthcare Community Plan
www.MSLC.com page 35
Mississippi Medicaid Managed Care
EQR Protocol 4 Summary of Findings
level detail paid amounts with the header paid amount which are not explained by rounding.
Based on conversations with DOM and the FAC, the line level payments are not reliable, as the
97 percent error rate reflects.
The Service Provider Type is not a required field on the claim form, but is utilized by some CCOs
or Medicaid agencies to apply edits for servicing/rendering physicians billing for codes outside of
the physician’s designated specialty based on the specialty codes the physician registers when
applying for a National Provider Identification (NPI) number. The codes are updated twice a year
by the National Uniform Claim Committee. The service provider specialty taxonomy contains
more than one taxonomy per Medicare specialty code. For the purposes of the key data element
testing the Service Provider Type was tested at the taxonomy code level of specificity.
6) Professional Key Data Elements: The overall missing, surplus, and error rates related to pro-
fessional encounters in the two sample months of January and October 2015 were 0 percent, 20
percent, and 13 percent, respectively. Header Paid Amount, Billing Provider NPI, and Ser-
vice/Rendering Provider NPI experienced the highest error rates of 76 percent, 81 percent, and
100 percent respectively, for the key data elements. Billing Provider and Service/Rendering Pro-
vider NPI values are reflecting a high error rate due to the sample not containing values to test.
There were 299,376 of the Billing Provider fields and 431,984 of the Service/Rendering Provider
NPI fields out of the total sample of 432,053 claims that were blank. These blank fields are re-
ported as errors due to the field being a required value. The encounter data reflected values for
these fields all claims. The Header Paid Amount’s 76 percent error rate is primarily attributable to
the CCO submitting rounded whole dollar payment values as whole dollars (no cents) in the sam-
ple rather than the actual payment. There were 317,722 errors with a variance of less than $1
each. Key data elements amounting to 9,643 of the 327,365 errors contained either negative
rounded dollar payment amounts in the sample with corresponding positive payments with dollars
and cents in the encounter data or had a variance larger than $1. Plan Paid Amount, tested at the
line level, reflected an error rate of 95 percent. This error rate is partially attributable to the sam-
ple payment amounts being submitted in whole dollar values. However, there are additional is-
sues noted when comparing the line level Detail Paid Amounts with the Header Paid Amount
which not explained by rounding. Based on conversations with DOM and the FAC, the line level
payments are not reliable, as the 95 percent error rate reflects.
The Service Provider Type was tested for professional claims using the same methodology as the
outpatient claims.
7) Dental Key Data Elements: The overall missing, surplus, and error rates related to dental en-
counters in the two sample months of January and October 2015 were 0 percent, 118 percent,
and 26 percent, respectively. Billing Provider and Service/Rendering Provider NPI values are re-
flecting error rates of 71 percent and 63 percent due the value of ‘88888888888’ being reported in
the sample data or the value is null. There were 16,202 errors related to the inclusion of
‘88888888888’ in the sample data and an additional 11,310 errors are due to no value being re-
flected in the sample out of the 29,234 total errors noted in the Billing Provider field. 23,097 of the
26,064 errors for the Service/Rendering Provider NPI data element are due to the ‘88888888888’
value being present in the sample data. The Plan Paid Amount’s error rate of 99 percent is par-
tially attributable to the CCO submitting values as whole dollars (no cents) for amounts reported
in the sample. However, the variance of $2,404,679 between total Plan Paid Amount, matching
on MMIS_ICN/TCN_NUM, in the sample of $6,843,410 and the encounter data total of

UnitedHealthcare Community Plan
www.MSLC.com page 36
Mississippi Medicaid Managed Care
EQR Protocol 4 Summary of Findings
$4,438,731 cannot be explained merely by rounding differences. Tooth Surfaces experienced an
error rate of 61 percent due to the encounter data storing up to five fields for tooth surfaces, com-
pared to the sample reporting only one tooth surface.
8) Pharmacy Key Data Elements: The overall missing, surplus, and error rates related to phar-
macy encounters in the two sample months of January and October 2015 were one percent, 26
percent, and 25 percent, respectively. The Billing Provider NPI reflects an error rate of 99 per-
cent, this is due to the provider numbers in the encounter data reported as five digits and reported
as 10 digits in the sample data. The Plan Received Date has dates reported in the encounter data
as 0001-01-01 thus causing an error rate of 99 percent. Plan Paid Amount, tested at the line
level, reflected an error rate of 94 percent. 329,879 of the 330,194 errors resulted in less than $1
difference between the sample and the encounter payment due to sample payments being re-
ported in whole dollars rather than actual dollars and cents. Lastly, the refill numbers were erro-
neous in 29 percent of the sample date. All but 67 of the errors could be eliminated if the FAC en-
counter data refill number was divided by 10. The encounter data included an unnecessary 0 af-
ter the refill number causing the error rate.
Recommendations
1) We recommend DOM stipulate the measurement period (e.g., monthly, annually) required to be
utilized to measure compliance with the 98 percent encounter submission requirement. DOM
should also stipulate if the percentage should be measured by service type and whether a sepa-
rate measurement should be applied by subcontractor.
2) We recommend DOM require the CCO and its subcontractors, in conjunction with the FAC, to in-
vestigate the causes of surplus and missing encounters that appear to be present or missing in
the FAC raw data based on the sample claims data provided for January and October 2015. Any
issues noted during the investigation requiring encounter data revisions should be incorporated
into the FAC encounter data for use in future reporting or rate development.
3) We recommend payment adjustments related to FAC encounter data for each rate setting period
be quantified and communicated to DOM’s actuary to ensure duplicates, voids, and denied claims
are accurately accounted for in the rate setting process. Additionally, encounter data analysis per-
formed by DOM or other outside entities must incorporate a factor to account for any confirmed
surplus encounters. The bi-monthly electronic data validation process will assist in providing this
information.
4) We recommend DOM require the CCO to utilize cash disbursements from its accounting records
as the source of its CDJ data, and provide documentation regarding how the data is extracted
from the system as well as what mechanism it utilizes to ensure all transactions are properly in-
cluded in the CDJ. This should assist in explaining the encounter payment amounts which exceed
cash disbursements for the 2015 calendar year. Additionally, seeking to obtain an encounter-level
identifier from the CCO which bridges the cash disbursement records with the encounter data
would improve the level of detailed analysis that could be performed between the CDJ and en-
counter data and provide DOM, with greater assurance regarding the validity of the FAC encoun-
ter data.
5) The line level Plan Paid Amounts for outpatient and professional service types have been noted
as errors in the sample testing and the EDV bi-monthly reporting. According to the CCO, it cor-

UnitedHealthcare Community Plan
www.MSLC.com page 37
Mississippi Medicaid Managed Care
EQR Protocol 4 Summary of Findings
rected the line level issue in June 2016 on a prospective basis. Additional testing should be per-
formed to ensure the solution is adequate. Ideally we recommend the solution be applied retroac-
tively to ensure payments are properly captured at both the line level and the header level for re-
porting and analysis purposes.
6) To improve the accuracy of the key data elements with high testing errors noted in the above nar-
ratives, a review and possible update of the data dictionary with the CCO and subcontractors is
recommended to address errors related to the claims sample data containing values differing
from the encounter data. Based on the high error rates, emphasis should be placed on verifying
Plan Paid Amounts. It is necessary to establish a crosswalk between the UB04 and 1500 claim
forms to the encounter data. Doing so will help determine where the discrepancies exist in the
data and ensure the key data components in the encounter data can be relied on for reporting
and various analysis including rate setting, utilization analysis, and population health trends.
7) Based on higher error rates noted for the pharmacy and dental service types and the significant
amount of surplus dental claims in the FAC encounter data, the CCO should be required by DOM
to increase the oversight of the subcontracted vendors and provide DOM with an action plan for
improvement in their data. This may include monthly reporting and reconciliations of claims and
financial information. Based on the January and October 2015 claims sample, the FAC encounter
data contains over double the number of dental encounters the claims sample supported. Also,
pharmacy encounters had three required data components (Plan Paid Amount, Plan Received
Date, Billing Provider NPI) exceeding 90 percent error rates.
8) We recommend DOM ensure the CCO has enforceable language to require third party vendors to
provide all necessary documentation to support Mississippi Medicaid claims, and include penal-
ties for non-compliance even after the contract has terminated. The Medicaid managed care final
rule provides CMS the right to audit or inspect any documents or records in any format of the sub-
contractor for 10 years from the final date of the contract period or from the date of completion of
any audit, whichever is later. Contract language should be included to meet this requirement.

UnitedHealthcare Community Plan
www.MSLC.com page 38
Mississippi Medicaid Managed Care
EQR Protocol 4 Summary of Findings
Steps 3 and 4: Generating and Reviewing Analytical Reports and Comparing Findings to
State-Identified Standards
Data Assumptions
As reported in the Step 1, the same CY 2015 encounters and CDJ data obtained for our encounter to
CDJ reconciliations was utilized in the utilization analysis and statistics presented below. The totals pre-
sented in the separately issued reconciliation reports represent an estimate of the total incurred claim
payments based on submitted final claims, net of adjustments, made to providers for a given payment pe-
riod. The encounter reconciliation process is tied to cash flow over time. It is not focused on identifying
payments for specific beneficiary visits to provide an assessment on the completeness of the encounter
data for the period. Whereas, the data presented for the utilization statistics is based upon specific benefi-
ciary visits with CY 2015 dates of services. We have compared the totals from these reports to the data
utilized for this analysis and believe that they are comparable and represent a similar percentage of the
plan’s claims. However, it should be noted that there are many assumptions made during the reconcilia-
tion process regarding the individual encounter data submissions that could potentially result in discrep-
ancies when compared to the CCO’s encounter claim warehouse. These include assumptions such as
the identification and status flagging of duplicate encounter submissions and non-submitted voided en-
counters, which were removed from our analysis. As a result, the figures presented below represent My-
ers and Stauffer’s best interpretation of encounter data submissions based on current known data limita-
tions and is not meant to represent precise information, as there may be yet to be discovered data limita-
tions and issues.
Volume, Utilization, and Per Member Costs
UVolume As shown in Table 8: Encounter Expenditures and Volume by Service Type, UHC’s encounters com-
prised $614.3 million or 48.3 percent of total encounter dollars and 47.8 percent of total MississippiCAN
encounters for CY 2015. MississippiCAN spent approximately $1.27 billion on services and had over 10.7
million encounters for CY 2015. An encounter is defined as a service provided to a member, by a unique
provider, for a particular date of service. For example, a dentist providing a cleaning and two fillings to the
same member on a date of service would count as one encounter service.
Table 8: Encounter Expenditures and Volume by Service Type
MississippiCAN UHC CAN
Service Type CY 2015 Services CY 2015 Services
Expenditures % Volume % Expenditures % Volume %
Institutional $304,553,842 23.9% 858,596 8.0% $148,576,654 24.2% 429,585 8.4%
Professional $514,390,508 40.4% 5,034,801 46.8% $248,379,009 40.4% 2,450,099 47.7%
Dental $69,324,725 5.4% 399,740 3.7% $38,560,233 6.3% 210,345 4.1%
Pharmacy $384,640,464 30.2% 4,454,931 41.4% $178,806,622 29.1% 2,047,557 39.9%
Total $1,272,909,539 100.0% 10,748,068 100.0% $614,322,518 100.0% 5,137,586 100.0%
Percentage of MississippiCAN Total
48.3% 47.8%

UnitedHealthcare Community Plan
www.MSLC.com page 39
Mississippi Medicaid Managed Care
EQR Protocol 4 Summary of Findings
UUtilization
To evaluate per member utilization, Myers and Stauffer calculated the total member months for CY 2015
(i.e., the sum of all months each member was covered by the CCO). Total member months were then di-
vided by twelve (12) to determine the average number of members for the year. As detailed in Table 9:
Member Utilization, overall, members had an average total utilization of 28.5 encounters during this time
period. UHC’s total utilization was slightly lower at 27.5 encounters per member. The table below pre-
sents additional data by major service type. More detailed statistics on volume, member utilization, gen-
der, and age are available in Appendix A: Volume, Member Utilization, Demographic Statistics and Per
Member Costs.
Table 9: Member Utilization
Mississippi CAN
UHC CAN
Utilization by Service Type for CY 2015
Count Percent of Mississippi
CAN
Overview
Total Member Months 4,524,227 2,239,925 49.5%
Average Number of Members P
1 377,019 186,660
Total Number of (all) Encounters 10,748,068 5,137,586 47.8%
Encounters (all) Per Member P
2 28.5 27.5
Institutional Use
Total Number of Institutional Encounters 858,596 429,585 50.0%
Institutional Encounters Per Member P
2 2.3 2.3
Professional Use
Total Number of Professional Encounters 5,034,801 2,450,099 48.7%
Professional Encounters Per Member P
2 13.4 13.1
Pharmacy Use
Total Number of Pharmacy Encounters 4,454,931 2,047,557 46.0%
Pharmacy Encounters Per Member P
2 11.8 11.0
Dental Use
Total Number of Dental Encounters 399,740 210,345 52.6%
Dental Encounters Per Member P
2 1.1 1.1
P
1PThe average number of members was calculated by dividing the total number of member months by 12.
P
2P Encounters per member were calculated by dividing the number of encounters by the average number of members.

UnitedHealthcare Community Plan
www.MSLC.com page 40
Mississippi Medicaid Managed Care
EQR Protocol 4 Summary of Findings
UPer Member Costs Table 10: Per Member Per Year Cost by Service Type summarizes the CY 2015 UHC per member per
year (PMPY) cost by service type compared to the MississippiCAN Program. In total, the CY 2015 aver-
age UHC CAN PMPY cost was $3,291.12 and about 2.52 percent lower than the MississippiCAN PMPY
of $3,376.25. In both MississippiCAN and UHC CAN, by service type, Professional Services had the high-
est PMPY and Dental Services had the lowest PMPY. Additional details on PMPY costs by age and gen-
der are presented in Appendix A: Volume, Member Utilization, Demographic Statistics and Per Member
Costs.
Table 10: Per Member Per Year Cost by Service Type MississippiCAN UHC CAN Variance
Service Type CY 2015 PMPYP
1 CY 2015 PMPYP
1 Dollars Percent
Institutional $807.79 $795.97 -$11.82 -1.46%
Professional $1,364.36 $1,330.65 -$33.72 -2.47%
Dental $183.88 $206.58 $22.70 12.35%
Pharmacy $1,020.22 $957.92 -$62.29 -6.11%
Total $3,376.25 $3,291.12 -$85.12 -2.52%
P
1P These are actual costs for the CCO and are not risk adjusted for the costs associated with categories of eligibility
(COEs) that receive capitated risk based adjustment premiums.
Utilization Indicators
Myers and Stauffer analyzed encounter data for other volume/consistency dimensions including prompt
payment, timeliness of encounter submissions, provider type, type of service, and other dimensions such
as dental categories of service and pharmacy services. The most notable findings related to adjudication
timeliness.
UTimeliness
Complete data takes into account time to pay a claim and timely turnaround and submission of encoun-
ters. Inconsistent processing may indicate problems within the CCO’s information systems. To evaluate
how timely the CCO paid claims and turned around and submitted encounters to the FAC, Myers and
Stauffer looked at two scenarios. The first scenario analyzed how quickly the CCO is adjudicating claims.
As shown in the next table, for MississippiCAN, the majority of institutional (97.2 percent) and profes-
sional claims (97.2 percent) were processed within the first 30 days. The majority of dental claims under
MississippiCAN were paid within 30 days (99.3 percent) and pharmacy claims were most commonly pro-
cessed within the first 15 days (99.7 percent).
For UHC, 98.1 percent of institutional claims and 97.2 percent of professional claims were processed
within the first 30 days. Processing time took 30 days or less for 99.9% of UHC dental claims. Almost all
of UHC’s pharmacy claims were processed within the first 15 days (99.5 percent).

UnitedHealthcare Community Plan
www.MSLC.com page 41
Mississippi Medicaid Managed Care
EQR Protocol 4 Summary of Findings
Table 11: MississippiCAN and UHC CAN - Timeliness of Payment MississippiCAN UHC CAN
Days Institutional Professional Dental Pharmacy Institutional Professional Dental Pharmacy
<= 15 91.7% 92.8% 54.5% 99.7% 95.5% 92.6% 48.6% 99.5%
16 - 30 5.5% 4.4% 44.8% 0.2% 2.6% 4.6% 51.3% 0.4%
31 - 60 1.1% 1.1% 0.6% 0.1% 0.5% 1.0% 0.1% 0.1%
61 - 90 0.4% 0.4% 0.1% 0.0% 0.3% 0.4% 0.0% 0.0%
Over 90 1.2% 1.3% 0.1% 0.0% 1.1% 1.4% 0.0% 0.0%
*Percentages may be slightly off due to rounding. **There were 132,956 dental encounters excluded from this analysis due to missing paid date information.
The second scenario looked at how long it takes the CCO to get the initial encounter submissions into the
MMIS system. As shown in the next table, for MississippiCAN, the majority of institutional (88.4 percent)
and professional claims (88.5 percent) were submitted into the MMIS system within the first 30 days. Den-
tal and pharmacy encounters took the longest with 46.0 percent and 8.7 percent, respectively, taking over
90 days to submit the encounters.
For UHC, 77.1 percent of initial institutional claims and 78.4 percent of professional claims were submit-
ted within the first 30 days. Submission time took 90 days or longer for 39.4 percent of UHC dental
claims. All of UHC’s pharmacy claim encounters were submitted within the first 60 days (100.0 percent).
Table 12: MississippiCAN and UHC CAN - Timeliness of Submitting Encounters
UPlace of Service
Myers and Stauffer performed a comparison of utilization by place of service/facility type for institutional,
professional, and dental services for MississippiCAN and UHC CAN. Thirty-four percent of services and
$237.8 million of the MississippiCAN encounters were rendered in an office setting and 17.9 percent of
services and $344.3 million in payments were rendered in a hospital setting. UHC’s encounters were con-
sistent with 34.2 percent of services and over $122.2 million in payments rendered in an office setting and
17.7 percent of services and over $165.4 million in payments in a hospital setting.
MississippiCAN UHC CAN
Days Institutional Professional Dental Pharmacy
Institu-tional
Profes-sional Dental Pharmacy
<= 15 87.6% 86.6% 35.3% 39.1% 75.6% 74.8% 39.8% 9.6%
16 – 30 0.8% 1.9% 1.9% 48.7% 1.5% 3.6% 1.3% 87.3%
31 – 60 2.3% 3.3% 6.2% 1.3% 4.7% 6.8% 7.1% 3.1%
61 – 90 2.6% 1.8% 10.7% 2.3% 5.2% 3.6% 12.3% 0.0%
91– 120 1.7% 0.7% 6.7% 7.1% 3.5% 1.5% 7.7% 0.0%
Over 120 5.0% 5.7% 39.3% 1.6% 9.5% 9.7% 31.7% 0.0%
*Percentages may be slightly off due to rounding.

UnitedHealthcare Community Plan
www.MSLC.com page 42
Mississippi Medicaid Managed Care
EQR Protocol 4 Summary of Findings
Table 13: Place of Service by Expenditures and Utilization
MississippiCAN UHC CAN
Place of Service/ Facility Type
ExpendituresP
3 % VolumeP
3 % ExpendituresP
3 % VolumeP
3 %
Office $237,850,404 26.8% 2,285,289 34.0% $122,266,544 28.1% 1,137,166 34.2%
Hospital $344,340,079 38.8% 1,207,200 17.9% $165,411,417 38.0% 586,640 17.7%
Independent La-boratory $15,033,675 1.7%
331,125 4.9% $6,967,673 1.6%
155,841 4.7%
Rural Health Clinic P
1 $36,530,072 4.1% 394,138 5.9% $16,841,067 3.9% 188,347 5.7%
Community Mental Health Center
$49,339,921 5.6% 403,598 6.0% $24,275,685 5.6% 209,312 6.3%
Emergency Room HospitalP
2 $33,003,703 3.7% 571,766 8.5%
$16,664,147 3.8% 275,544 8.3%
All Other $172,163,859 19.4% 1,535,780 22.8% $83,082,000 19.1% 770,453 23.2%
Total $888,261,712 6,728,896 $435,508,533 3,323,303
Percentage of MississippiCAN Total 49.0% 49.4%
*Numbers may be slightly off due to rounding
P
1P Rural Health Clinic totals do not include Federally Qualified Health Centers.
P
2P Note: There are claims on the institutional form related to Emergency Room.
P
3P Note: Place of Service Expenditures and Volume were analyzed at the claim level versus an encounter level and excludes Pharmacy, therefore there will be
discrepancies in the total counts reported in Table 8 of page 38 of the Report.
UProvider Type
Hospital providers represent 12.2 percent of all Mississippi CCOs’ encounters by provider type and
$230.7 million (26.4 percent) in expenditures. In comparison, 11.7 percent of UHC encounters and $105.2
million (24.4 percent) in expenditures were for hospital providers. CCOs were not required to submit insti-
tutional inpatient encounters until December 2015.
Physicians (35.0 percent) and dentists (5.9 percent) comprise 40.9 percent of all MississippiCAN’s institu-
tional, professional, and dental encounters, representing over $287.6 million in expenditures. Physicians
(33.5 percent) and dentists (6.6 percent) comprise 40.1 percent of all UHC institutional, professional, and
dental encounters, representing approximately $140.2 million in expenditures.
Table 14: Provider Type by Utilization – Dollars, Volume, and Percentages
MississippiCAN UHC CAN
Provider Type Expenditures % Volume % Expenditures % Volume %
Hospital, General $230,658,210 26.4% 810,736 12.2% $105,242,507 24.4% 385,630 11.7%
Physician, MD $220,654,504 25.2% 2,334,307 35.0% $103,071,831 23.9% 1,106,713 33.5%
Dentist, Unclassified $66,960,907P
1P 7.7% 390,755 5.9% $37,180,223 8.6% 218,666 6.6%
Nurse Practitioner $47,294,729 5.4% 641,913 9.6% $21,071,584 4.9% 289,175 8.8%
Ind X-ray And Lab $12,215,560 1.4% 282,437 4.2% $5,486,030 1.3% 132,615 4.0%
All Other $296,314,798 33.9% 2,210,615 33.1% $159,540,135 37.0% 1,168,307 35.4%
Total $874,098,707 6,670,763 $431,592,310 3,301,106

UnitedHealthcare Community Plan
www.MSLC.com page 43
Mississippi Medicaid Managed Care
EQR Protocol 4 Summary of Findings
MississippiCAN UHC CAN
Provider Type Expenditures % Volume % Expenditures % Volume %
Percentage of MississippiCAN Total 49.4% 49.5%
P
1 PNote that this total is significantly more than the $55,929,876 identified in Table 15: Dental Expenditures and Visits by Category of
Service. This is due to the utilization of the header paid amount in Table 14: Provider Type by Utilization – Dollars, Volume, and Percentages versus procedure codes at the line level in Table 15 where there was not always an accurate amount present. This illustrates a significant data limitation in the encounter data.
UDental Services
Over 1.5 million dental services were provided under the MississippiCAN program in CY 2015 at a cost of
$55.9 million. UHC members were recipients of 52.3 percent of the services. In terms of dollars, UHC
dental services comprised over $25.3 million (45.3 percent). The volume, percentage, and dollar break-
downs for dental categories of services are shown in the next table.
Table 15: Dental Expenditures and Visits by Category of Service MississippiCAN UHC CAN
Category of Service
Expenditures % Volume % Expendi-
tures % Volume %
Diagnostic $15,137,322 27.1% 632,158 40.9% $7,340,450 28.9% 321,139 39.7%
Preventive $9,472,122 16.9% 513,640 33.2% $4,452,113 17.6% 281,709 34.8%
Restorative $15,368,985 27.5% 195,315 12.6% $7,336,016 28.9% 102,086 12.6%
Oral and Maxillofacial Surgery
$7,715,624 13.8% 100,444 6.5% $3,765,659 14.9% 51,026 6.3%
Orthodontics $4,926,315 8.8% 49,507 3.2% $982,475 3.9% 25,389 3.1%
Adjunctive General Ser-vices
$1,353,093 2.4% 33,824 2.2% $606,989 2.4% 16,563 2.0%
Endodontics $1,904,614 3.4% 18,572 1.2% $857,464 3.4% 9,860 1.2%
All Other $51,800 0.1% 2,219 0.1% $21,982 0.1% 1,181 0.1%
Total $55,929,876P
1P 1,545,679 $25,363,149 808,953
Percentage of MississippiCAN Total
45.3% 52.3%
*Numbers may be slightly off due to rounding.
P
1 PNote that this total is significantly less than the $66,960,907 identified in Table 14. This is due to the utilization of the procedure codes
at the line level in Table 15 where there was not always an amount present versus the header paid amount in Table 14. This illustrates
a significant data limitation in the encounter data.
UPharmacy Services
To evaluate prescriptions, Myers and Stauffer utilized claim-level pharmacy data to identify new/original
prescriptions. Any prescriptions filled after the date of the new/original prescription was considered a refill.
Approximately 69.8 percent of the drugs dispensed for MississippiCAN were for new/original prescriptions
and refills were 30.2 percent of prescriptions. For UHC, 70.1 percent of the drugs dispensed were for
new/original prescriptions with refills averaging 29.9 percent.

UnitedHealthcare Community Plan
www.MSLC.com page 44
Mississippi Medicaid Managed Care
EQR Protocol 4 Summary of Findings
Table 16: Pharmacy Prescriptions by Drug Group
Prescriptions
Pharmacy Services Total New / Original Refills
MississippiCAN
Antibiotics 13.3% 12.9% 0.4%
Psychotherapeutic Drugs 11.7% 7.5% 4.2%
Analgesics 8.8% 8.4% 0.4%
Cardiovascular 8.6% 3.6% 5.1%
Antihistamines 6.4% 4.7% 1.7%
Antiasthmatics 5.9% 3.5% 2.4%
Gastrointestinal 5.6% 3.7% 1.9%
CNS Drugs 4.9% 2.4% 2.5%
All Other 34.8% 23.3% 11.6%
MississippiCAN Totals* 100.0% 69.8% 30.2%
UHC CAN
Antibiotics 15.4% 15.0% 0.4%
Psychotherapeutic Drugs 11.8% 7.5% 4.3%
Analgesics 8.9% 8.6% 0.3%
Cardiovascular 7.4% 2.9% 4.6%
Antihistamines 6.9% 5.0% 1.9%
Antiasthmatics 6.2% 3.6% 2.7%
Cardiovascular 4.9% 3.1% 1.9%
CNS Drugs 4.7% 2.2% 2.5%
All Other 33.7% 22.3% 11.3%
UHC CAN Totals* 100.0% 70.1% 29.9%
*Total percentages may be slightly off due to rounding.
Findings
1) As identified in Table 11 MississippiCAN and UHC CAN - Timeliness of Payment on page 41, all
of UHC’s dental and pharmacy claims were paid within the first 60 days. A very small percentage
of UHC’s institutional (1.1 percent) and professional (1.4 percent) claims took over 90 days to
process and therefore fell outside the contractual requirement which states, “The contractor will
be responsible for processing claims within ninety calendar days of receipt…”
2) As identified in Table 12 MississippiCAN and UHC CAN - Timeliness of Submitting Encounters on
page 41, encounter records reflect submission dates more than 120 days after the claim payment
for institutional, professional, and dental service types. According to the contract, encounter rec-
ords are required to be submitted by the last day of the 3rd month after the payment/adjudication

UnitedHealthcare Community Plan
www.MSLC.com page 45
Mississippi Medicaid Managed Care
EQR Protocol 4 Summary of Findings
calendar month in which the contractor paid/adjudicated the claim. There were 9.5 percent of in-
stitutional encounters, 9.7 percent of professional encounters, and 31.7 percent of dental encoun-
ters that were submitted to the FAC beyond 120 days.
Recommendations
1) UHC should continue to monitor and ensure subcontractors are processing and paying claims
within contractual requirements. DOM should continue to hold UHC responsible for contract com-
pliance.
2) UHC should monitor and ensure subcontractor encounters are submitted to the FAC within con-
tractual requirements. DOM should continue to hold UHC responsible for contract compliance.

UnitedHealthcare Community Plan
www.mslc.com page 46
Mississippi Medicaid Managed Care
EQR Protocol 4 Summary of Findings
Activity 4: Review of Medical Records
Methodology
The purpose of this activity is to confirm findings from the analysis of encounter data by reviewing medical
records for data components where the medical record is the primary source of information. In adherence
with the protocol guidelines, the quality of the encounter data was adequate, based on the sample com-
pleteness percentage (Table 3: Completeness Percentage by Service Type for Sample Periods) to be
used for analysis for pharmacy encounters. To accomplish the medical record review, the sample claims
data submitted by the CCO was used to identify encounters that met the list of assumptions below. These
assumptions were used to impact how the sample was designed and drawn.
Sample Assumptions:
1) Claim detail records were combined into appropriate claim (header) level. The sample was deter-
mined based on claim level counts.
2) Claims submitted by the CCO for January 2015 and October 2015, and traced through to the
FAC data warehouse encounter data, are included. Claims submitted by the CCO not found in
the encounter data were excluded from medical records sampling since the purpose of the medi-
cal record review is to confirm the Activity 3 encounter data findings.
3) If a particular claim type did not meet the completeness threshold of 98 percent complete for en-
counter claims submission for the months identified, it was excluded from the medical record re-
view, per the EQR Protocol 4 guidelines (pages 6-7), which states “If the EQRO is unsure of the
quality of the encounter data at the completion of Activity 3, it should not proceed to the medical
record review activity (Activity 4).”
a. This limitation was discussed with DOM, however DOM determined it necessary to pro-
ceed with the medical record review regardless of the completeness or accuracy percent-
ages contained in Activity 3 to assess the adequacy of the medical record documentation
required by the CCO and maintained by the providers.
4) The claims were divided into the following service types:
a. Outpatient institutional, professional, dental, and pharmacy.
b. Inpatient institutional claims are not included in this report, as inpatient services were
carved in during December 2015.
5) Key data elements were reviewed based on a tiered designation of either “critical” or “non-criti-
cal”. The approach, approved by DOM, for determining the severity of an error was based on the
Medicaid reimbursement impact of each data component and claim type, refer to Table 19: Data
Elements and Associated Tier Level and Error Rate by Service Type below.
6) Key data elements were measured on either a claim (header) or a line level of detail, dependent
on the characteristic of the element. This approach causes the number of data elements tested to
vary by key element. This distinction is displayed in Table 19 below.
As shown in the following table (Table 17: Statistically Valid Sample Size), a five percent Error Rate and a
95 percent Confidence Level was utilized to determine the minimum sample size required for a statisti-
cally valid sample. To ensure an adequate number of records were received to meet the minimum sample

UnitedHealthcare Community Plan
www.mslc.com page 47
Mississippi Medicaid Managed Care
EQR Protocol 4 Summary of Findings
size, a total of 110 medical records were requested for each service type. As indicated below, the mini-
mum statistically valid sample size is 73. The calculation of the minimum sample size was performed in
consultation with a qualified statistician.
Table 17: Statistically Valid Sample Size
Margin of Error
Error Rate
0.05 0.1 0.2 0.3 0.4 0.5
0.01 1,825 3,457 6,147 8,067 9,220 9,604
0.02 456 867 1,537 2,017 2,305 2,401
0.03 203 384 683 896 1,024 1,067
0.05 73 138 246 323 369 384
0.1 18 35 61 81 92 96
0.2 5 9 15 20 23 24
For each CCO service type, random sampling was used to select the claims for medical record review.
The sample list with recipient and provider information was forwarded to the CCO for medical record re-
trieval. The request stated to submit each medial record for the sample date of service in its entirety.
Upon receipt of the sample, the CCO worked with its providers to obtain the medical record supporting
the claim identified in the sample.
Upon Myers and Stauffer’s receipt, the medical records were assessed for usability and verified as being
part of the requested claim sample. Clinical and professional staff compared the medical record and the
claims data to validate all key data elements were supported by the medical record documentation, as
shown in Table 19: Data Elements and Associated Tier Level and Error Rate by Service Type. There
were several instances where the documentation received was deemed incomplete. As a result, an addi-
tional information request was sent to the CCO which outlined specific pieces of the record needed to
support the key elements. The same processes were followed, as referenced above, to request and sub-
mit additional data. All additional information submitted to Myers and Stauffer by March 31, 2017 was in-
corporated into the report.
Findings
Evaluation of encounter data on the basis of medical record review is dependent on the ability of the pro-
vider to locate and submit complete and accurate medical records. The EQR Protocol 4 guidelines state it
is inappropriate to substitute a record that cannot be located, unless it is out of the office for legal review
(for example). If the CCO provided an acceptable reason for not submitting the requested medical record,
that particular claim was removed from the sample exceptions and total amounts. UHC attested that no
medical records were out of the office for legal review. Therefore, all missing records are included in the
error rate calculation.
Table 19 displays each key data element, corresponding tier level and error rate by service type. The er-
ror rates were segregated in the table to reflect the following:

UnitedHealthcare Community Plan
www.mslc.com page 48
Mississippi Medicaid Managed Care
EQR Protocol 4 Summary of Findings
Unsupported Element: Claims for which a medical record was received, but lacked documenta-
tion to support the key data element.
Unsupported Element including Missing/Unusable Records: Claims for which a medical record
was or was not received, which resulted in the lack of documentation to support the key data ele-
ment.
Both error rates were reported to highlight whether the errors stemmed from non-supported key data ele-
ments in the medical records or from the inability of the CCO/provider to submit medical record documen-
tation. The rates were calculated and shown in total for the sampled months of January and October
2015. UHC submitted one medical record that was deemed unusable. A total of 27 medical records were
missing for both sampled months. Half of the missing records were within the professional service type.
The following table (Table 18: Summary of Medical Records) summarizes the number of medical records
requested, received, missing, or deemed unusable.
Table 18: Summary of Medical Records
Medical Records
Outpatient Professional Dental Pharmacy Total
Number of Records Required for a Statisti-cally Valid Sample
73 73 73 73 292
Number of Records Requested
January 2015 55 55 55 55 220
October 2015 55 55 55 55 220
Total Records Requested 110 110 110 110 440
Number of Records Received
January 2015 52 46 52 51 201
October 2015 53 51 55 53 212
Total Records Received 105 97 107 104 413
Missing Records
January 2015 3 9 3 4 19
October 2015 2 4 0 2 8
Total Records Missing 5 13 3 6 27
Unusable Records
January 2015 0 0 0 1 1
October 2015 0 0 0 0 0
Total Records Unusable 0 0 0 1 1
Net Usable Records Received
January 2015 52 46 52 50 200
October 2015 53 51 55 53 212
Total Usable Records 105 97 107 103 412
UError Rate Calculations:
Unsupported Element = Key Data Element Fields Deemed Unsupported Compared to Medical Records/Total Key Data Element
Fields excluding Missing and Unusable Records.
Unsupported Element including Missing/Unusable Records = Key Data Element Fields Deemed Unsupported Compared to
Medical Records + Key Data Element Fields with Missing and Unusable Records/Total Key Data Element Fields.
Black Cell = Key Data Element Field not applicable for Service type.

UnitedHealthcare Community Plan
www.mslc.com page 49
Mississippi Medicaid Managed Care
EQR Protocol 4 Summary of Findings
Table 19: Data Elements and Associated Tier Level and Error Rate by Service Type
Error Rate
Key Data Element
Header/ Line Level
Tier Level
Outpatient Professional Dental Pharmacy
Unsupported Element
Unsupported Element
including Missing/ Unusable Records
Unsupported Element
Unsupported Element including Missing/
Unusable Rec-ords
Unsupported Element
Unsupported Element including Missing/
Unusable Rec-ords
Unsupported Element
Unsupported Element
including Missing/ Unusable Records
Member Name Header Level Critical 0% 5% 3% 15% 1% 4% 1% 7%
Member DOB Header Level Critical 1% 5% 12% 23% 43% 45% 18% 24%
Type of Bill Header Level Critical 0% 5% #DIV/0! #DIV/0! #DIV/0! #DIV/0! #DIV/0! #DIV/0!
Header First DOS Header Level Critical 0% 5% 10% 21% 3% 5% 16% 21%
Header Last DOS Header Level Critical 1% 5% #DIV/0! #DIV/0! #DIV/0! #DIV/0! #DIV/0! #DIV/0!
Place of Service Header Level Critical #DIV/0! #DIV/0! 7% 18% 18% 20% #DIV/0! #DIV/0!
Procedure Code Line Level Critical 21% 25% 43% 48% 25% 27% #DIV/0! #DIV/0!
Procedure Modi-fier 1
Line Level Critical 39% 39% 78% 80% #DIV/0! #DIV/0! #DIV/0! #DIV/0!
Revenue Code Line Level
Non-Critical 21% 25% #DIV/0! #DIV/0! #DIV/0! #DIV/0! #DIV/0! #DIV/0!
Principal Diagno-sis Code
Header Level
Non-Critical 13% 17% #DIV/0! #DIV/0! #DIV/0! #DIV/0! #DIV/0! #DIV/0!
Diagnosis Code 1 Header Level
Non-Critical 18% 23% 20% 29% #DIV/0! #DIV/0! #DIV/0! #DIV/0!
Diagnosis Code 2 Header Level
Non-Critical 31% 35% 17% 24% #DIV/0! #DIV/0! #DIV/0! #DIV/0!
Diagnosis Code 3 Header Level
Non-Critical 32% 37% 19% 24% #DIV/0! #DIV/0! #DIV/0! #DIV/0!
Diagnosis Code 4 Header Level
Non-Critical 38% 44% 17% 29% #DIV/0! #DIV/0! #DIV/0! #DIV/0!

UnitedHealthcare Community Plan
www.mslc.com page 50
Mississippi Medicaid Managed Care
EQR Protocol 4 Summary of Findings
Error Rate
Key Data Element
Header/ Line Level
Tier Level
Outpatient Professional Dental Pharmacy
Unsupported Element
Unsupported Element
including Missing/ Unusable Records
Unsupported Element
Unsupported Element including Missing/
Unusable Rec-ords
Unsupported Element
Unsupported Element including Missing/
Unusable Rec-ords
Unsupported Element
Unsupported Element
including Missing/ Unusable Records
Surgical Proce-dure Code 1
Line Level Critical
No data to test No data to test #DIV/0! #DIV/0! #DIV/0! #DIV/0! #DIV/0! #DIV/0!
Tooth Number 1 Line Level Critical #DIV/0! #DIV/0! #DIV/0! #DIV/0! 10% 11% #DIV/0! #DIV/0!
Tooth Number 2 Line Level Critical #DIV/0! #DIV/0! #DIV/0! #DIV/0! 21% 21% #DIV/0! #DIV/0!
Tooth Number 3 Line Level Critical #DIV/0! #DIV/0! #DIV/0! #DIV/0! 33% 33% #DIV/0! #DIV/0!
Tooth Number 4 Line Level Critical #DIV/0! #DIV/0! #DIV/0! #DIV/0! 38% 38% #DIV/0! #DIV/0!
Tooth Number 5 Line Level Critical #DIV/0! #DIV/0! #DIV/0! #DIV/0! 43% 43% #DIV/0! #DIV/0!
Tooth Surface 1 Line Level Critical #DIV/0! #DIV/0! #DIV/0! #DIV/0! 0% 0% #DIV/0! #DIV/0!
Tooth Surface 2 Line Level Critical #DIV/0! #DIV/0! #DIV/0! #DIV/0! 0% 0% #DIV/0! #DIV/0!
Tooth Surface 3 Line Level Critical #DIV/0! #DIV/0! #DIV/0! #DIV/0! 0% 0% #DIV/0! #DIV/0!
Tooth Surface 4 Line Level Critical #DIV/0! #DIV/0! #DIV/0! #DIV/0! 0% 0% #DIV/0! #DIV/0!
Prescription Num-ber
Header Level Critical #DIV/0! #DIV/0! #DIV/0! #DIV/0! #DIV/0! #DIV/0! 9% 15%
Refill Number Line Level Critical #DIV/0! #DIV/0! #DIV/0! #DIV/0! #DIV/0! #DIV/0! 37% 41%
Quantity Line Level Critical #DIV/0! #DIV/0! #DIV/0! #DIV/0! #DIV/0! #DIV/0! 11% 16%
Days Supply Line Level
Non-Critical #DIV/0! #DIV/0! #DIV/0! #DIV/0! #DIV/0! #DIV/0! 24% 29%
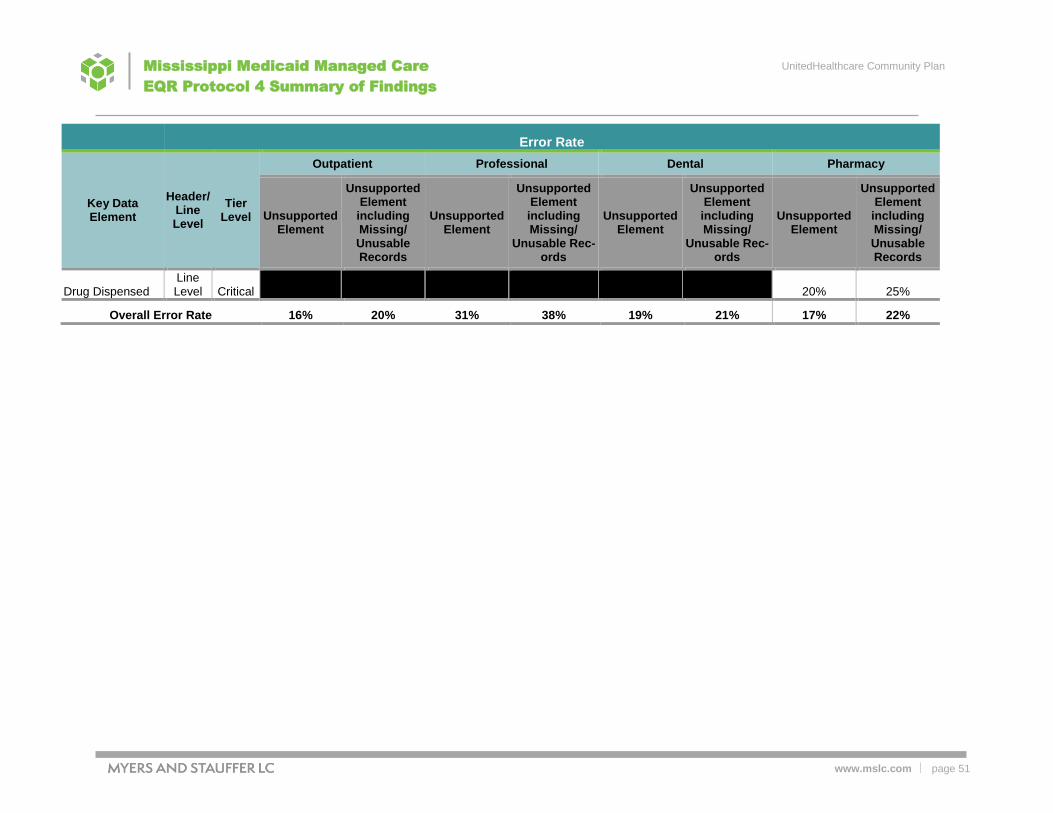
UnitedHealthcare Community Plan
www.mslc.com page 51
Mississippi Medicaid Managed Care
EQR Protocol 4 Summary of Findings
Error Rate
Key Data Element
Header/ Line Level
Tier Level
Outpatient Professional Dental Pharmacy
Unsupported Element
Unsupported Element
including Missing/ Unusable Records
Unsupported Element
Unsupported Element including Missing/
Unusable Rec-ords
Unsupported Element
Unsupported Element including Missing/
Unusable Rec-ords
Unsupported Element
Unsupported Element
including Missing/ Unusable Records
Drug Dispensed Line Level Critical #DIV/0! #DIV/0! #DIV/0! #DIV/0! #DIV/0! #DIV/0! 20% 25%
Overall Error Rate 16% 20% 31% 38% 19% 21% 17% 22%

UnitedHealthcare Community Plan
www.mslc.com page 52
Mississippi Medicaid Managed Care
EQR Protocol 4 Summary of Findings
1) As shown in Table 18: Summary of Medical Records, medical records chose as part of the
sample were not supplied by UHC from providers for testing of proper medical documenta-
tion to support the encounter data in the FAC.
2) The overall error rates by service type calculated for unsupported elements, ranged from 16
percent to 31 percent. Including the missing records in the error rate, the overall error rates
increased to 20 percent to 38 percent across the four service types. The professional claims
had the highest error rate by service type and on individual key data components for proce-
dure codes (43 percent; 48 percent) and Procedure Code Modifiers (78 percent; 80 per-
cent). Outpatient institutional claims lacked documentation to support Procedure Code Modi-
fiers (39 percent) and some secondary Diagnosis Codes (18-44 percent). None of the sam-
ple claims contained Surgical Procedure Codes, therefore, this key data element was not
tested. For dental encounters, the most common error was related to Date of Birth (43 per-
cent; 45 percent). The highest error rates in the pharmacy claims related to the lack of sup-
porting documentation for the Refill Number (37 percent; 41 percent). Overall the outpatient
institutional claims contained the most complete medical record documentation. In most
cases, the medical record documentation received from the CCO was limited to the date of
service in the sample selection. If the entire medical record had been submitted, it may have
contained additional supporting documentation.
Recommendations
1) We recommend DOM ensure the CCO recoup funds from the providers not submitting medi-
cal record documentation to support the sampled claims. Policy NQM-025, Ambulatory Med-
ical Record Review Process, the policy of UHC Mississippi is to require member medical
records be maintained in a manner that is current, detailed, and organized, and permits ef-
fective and confidential patient care and quality review. Standards will be in accordance with
state and federal regulations as well as any applicable accreditation standards. DOM may
consider additional medical record testing to ensure compliance with medical records docu-
mentation standards and implement corrective action plans or penalties for non-compliance.
2) Additionally, given the high error rates in some categories, we recommend that DOM pro-
vide proper oversight of the CCO through program integrity efforts and provider training.
DOM may want to consider requesting support from UHC and monitor how results from this
review are incorporated. Special emphasis may be appropriate for professional encounters
due to the higher overall error rates compared to the other service types.
3) UHC should examine contracts and processes to ensure medical records are supplied upon
request from its providers. If need be, language may need to be strengthened to increase
the requirement and penalties for not being able to supply medical records. UHC may need
to perform additional medical record audits to confirm the accessibility and availability of
medical records for UHC CAN members.
The table on the following pages includes the detail of key data element totals by service types.

UnitedHealthcare Community Plan
www.mslc.com page 53
Mississippi Medicaid Managed Care
EQR Protocol 4 Summary of Findings
Table 20: Number of Data Elements and Associated Tier Level and Errors by Service Type
Number of Data Elements
Key Data Element
Header/ Line Level
Tier Level
Outpatient Professional Dental Pharmacy
Total Elements Sampled
Unsup-ported
Element
Element with
Missing / Unusable Records
Total Elements Sampled
Unsup-ported
Element
Element with
Missing / Unusable Records
Total Elements Sampled
Unsup-ported
Element
Element with
Missing / Unusable Records
Total Elements Sampled
Unsup-ported
Element
Element with
Missing / Unusable Records
Member Name
Header Level
Critical 110 - 5 110 3 13 110 1 3 110 1 7
Member DOB
Header Level
Critical 110 1 5 110 12 13 110 46 3 110 19 7
Type of Bill Header Level
Critical 110 - 5 0
Header First DOS
Header Level
Critical 110 - 5 110 10 13 110 3 3 110 16 7
Header Last DOS
Header Level
Critical 110 1 5 0
Place of Service
Header Level
Critical 110 7 13 110 19 3
Procedure Code
Line Level
Critical 480 96 26 328 125 34 324 78 8
Procedure Modifier 1
Line Level
Critical 85 33 0 166 122 10
Revenue Code
Line Level
Non-Critical 577 112 32
Principal Di-agnosis Code
Header Level
Non-Critical 110 14 5
Diagnosis Code 1
Header Level
Non-Critical 66 11 4 110 19 13
Diagnosis Code 2
Header Level
Non-Critical 37 11 2 38 6 3

UnitedHealthcare Community Plan
www.mslc.com page 54
Mississippi Medicaid Managed Care
EQR Protocol 4 Summary of Findings
Number of Data Elements
Key Data Element
Header/ Line Level
Tier Level
Outpatient Professional Dental Pharmacy
Total Elements Sampled
Unsup-ported
Element
Element with
Missing / Unusable Records
Total Elements Sampled
Unsup-ported
Element
Element with
Missing / Unusable Records
Total Elements Sampled
Unsup-ported
Element
Element with
Missing / Unusable Records
Total Elements Sampled
Unsup-ported
Element
Element with
Missing / Unusable Records
Diagnosis Code 3
Header Level
Non-Critical 27 8 2 17 3 1
Diagnosis Code 4
Header Level
Non-Critical 18 6 2 7 1 1
Surgical Procedure Code 1
Line Level
Critical 0 - 0
Tooth Num-ber 1
Line Level
Critical 70 7 1
Tooth Num-ber 2
Line Level
Critical 24 5 0
Tooth Num-ber 3
Line Level
Critical 12 4 0
Tooth Num-ber 4
Line Level
Critical 8 3 0
Tooth Num-ber 5
Line Level
Critical 7 3 0
Tooth Sur-face 1
Line Level
Critical 10 0 0
Tooth Sur-face 2
Line Level
Critical 6 0 0
Tooth Sur-face 3
Line Level
Critical 3 0 0
Tooth Sur-face 4
Line Level
Critical 0 0 0
Prescription Number
Header Level
Critical 110 9 7

UnitedHealthcare Community Plan
www.mslc.com page 55
Mississippi Medicaid Managed Care
EQR Protocol 4 Summary of Findings
Number of Data Elements
Key Data Element
Header/ Line Level
Tier Level
Outpatient Professional Dental Pharmacy
Total Elements Sampled
Unsup-ported
Element
Element with
Missing / Unusable Records
Total Elements Sampled
Unsup-ported
Element
Element with
Missing / Unusable Records
Total Elements Sampled
Unsup-ported
Element
Element with
Missing / Unusable Records
Total Elements Sampled
Unsup-ported
Element
Element with
Missing / Unusable Records
Refill Num-ber
Line Level
Critical 110 38 7
Quantity Line Level
Critical 110 11 7
Days Supply Line Level
Non-Critical 110 25 7
Drug Dis-pensed
Line Level
Critical 110 21 7
Total 1,950 293 98 1,106 308 114 904 169 21 880 140 56

UnitedHealthcare Community Plan
www.mslc.com page 56
Mississippi Medicaid Managed Care
EQR Protocol 4 Summary of Findings
Activity 5: Summary of Findings
The table below summarizes the findings and recommendations related to Activities 1-4.
Table 21: Summary of Findings
Entity/Finding # Activity #/
Page Reference Finding Recommendation
DOM Finding 1.1
Activity 1: Review State Requirements Page 13
DOM encounter submissions standards appear to be generally stated and could potentially be subject to interpretation. Developing standards specific to encounter data submissions may improve the quality of the encounter data and generate the accuracy and com-pleteness required for DOM oversight and other analyses per-formed using the encounter data.
DOM should update the detailed standards and re-quirements specific to the encounter data submis-sion. This may include a specific day or date for sub-mitting initial encounters. For example, DOM may want to amend the contract to read that the CCO is required to submit encounter data within 60 days of claims payment (paid date). According to DOM representatives, this provision will be part of the next contract amendment.
DOM Finding 1.2
Activity 1: Review State Requirements Page 13
The contract sets forth a single 98 percent completeness standard and two percent error rate for all service types. EQR Protocol 4 guidelines recommend states set specific standards for each ser-vice type.
DOM should develop specific standards by service type. See Table 1 on page 15 for EQR Protocol 4 examples of service types for which the state should develop acceptable error rates. DOM should continue ensuring quality encounter data submissions via periodic reconciliation of paid encounter files to cash disbursement journals. DOM should require CCOs to submit all encounter it-erations: originals, adjustments, and voids.
DOM Finding 1.3
Activity 1: Review State Requirements Page 13
There is an opportunity to enhance the state’s data dictionaries to enhance detail, completeness, and user friendliness.
DOM may wish to consider whether a database ad-ministrator or an information technology professional could help develop more detailed data dictionaries that facilitate completeness and the ability to trace data from the 837s and NCPDPs to their final loca-tion in the data warehouse.
DOM/CCOs Finding 1.4
Activity 1: Review State Requirements Page 13
The CCOs are not providing a formal attestation or certification to DOM related to encounter data submissions as required by 42 CFR 438.606. This federal provision requires that the managed care entity attest to the accuracy, completeness, and truthfulness of the data.
DOM should require, monitor, and enforce submis-sion of a standard written attestation from the CCOs for all encounter data submissions.

UnitedHealthcare Community Plan
www.mslc.com page 57
Mississippi Medicaid Managed Care
EQR Protocol 4 Summary of Findings
Entity/Finding # Activity #/
Page Reference Finding Recommendation
DOM Finding 1.5
Activity 1: Review State Requirements Page 13
The reference to actuarial soundness of the capitation rates is in-correctly cited as §438.3 of the rule in the proposed March 20, 2017 CCO contract language located in Section 11 on Program In-tegrity on page 150, Item 2.
DOM should update the reference within the contract language to §438.4.
Conduent (FAC) Finding 1.6
Activity 1: Review State Requirements Page 14
Encounters cannot be identified for all of the CCOs’ delegated ven-dors. This poses challenges with reconciling encounters with CDJ’s.
Conduent should continue working with DOM and the CCOs to determine whether the CCOs’ TCNs may be modified to include a prefix to denote the delegated vendors in the encounter data.
Conduent (FAC) Finding 1.7
Activity 1: Review State Requirements Page 14
Conduent has a file limitation of 1,000 claims per file. Conduent can process up to 48,000 claims per day per CCO. The file and volume limitations create obstacles for the CCOs to be compliant with submission requirements, particularly when the CCOs have to submit or re-submit large batches of claims.
Conduent and DOM should explore whether expan-sion of Conduent’s capacity is feasible or whether such a change would be cost prohibitive.
Conduent (FAC) Finding 1.8
Activity 1: Review State Requirements Page 14
At the time of the Conduent on-site review, the DRGs submitted by the health plans were not being saved or stored. DOM and Con-duent worked to resolve this issue and a fix was implemented July 11, 2016.
The FAC should capture and retain all encounter data as submitted by the CCOs.
Conduent (FAC) Finding 1.9
Activity 1: Review State Requirements Page 14
Initial encounter reconciliation reviews identified an issue with CAS code differences and coordination of CAS codes with the CCOs. There were instances where the CCOs submitted a paid encounter with a CAS code that was processed by the FAC as CCO-denied. This suggested that the FAC’s denial adjustment reason code (ARC) table may not contain the same CAS codes that the CCO is intending to use to identify denied encounters. DOM has been working with the CCOs and the FAC to review and update CAS codes to ensure CCO-denied encounters are processing correctly.
The FAC should continue working with DOM and the CCOs to resolve all issues related to CAS codes.

UnitedHealthcare Community Plan
www.mslc.com page 58
Mississippi Medicaid Managed Care
EQR Protocol 4 Summary of Findings
Entity/Finding # Activity #/
Page Reference Finding Recommendation
Conduent (FAC) Finding 1.10
Activity 1: Review State Requirements Page 14
There are instances where the claim adjustment back out to an en-counter is successful, but the corresponding replacement transac-tion is denied by the FAC. This results in multiple encounter data issues:
Effectively removes paid encounters from the FAC’s data warehouse that the CCO may have intended to replace.
Subsequent CCO replacement transactions (to replace the en-counter record, are denied due to the original claim already having been removed. As a result, the CCO must send the transaction as a new unrelated original encounter in order to have it accepted. This process can produce encounters that may not reflect the CCO’s actual claim adjustment activity.
DOM, the FAC, and the CCOs have been working to resolve these issues. During the most recent encounter reconciliation cycles, fewer occurrences of these adjustment transactions were ob-served.
The FAC should continue working with the CCO to resolve all issues related to replacement transac-tions.
Conduent (FAC) Finding 1.11
Activity 1: Review State Requirements Page 14
DOM has created a supplemental file on the claims/encounter side because the 835 does not give sufficient detail to allow the CCOs to identify the reason for denial.
Conduent should work with DOM to evaluate whether the 835s could be modified to include suffi-cient information on denials to enable the CCO to reconcile and better work the files.
Conduent (FAC) Finding 1.12
Activity 1: Review State Requirements Page 14
According to the FAC representatives, there is no oversight or quality assurance check performed on the Truven data warehouse standard reports that are submitted to the state (e.g., checking/veri-fying code, etc.).
The FAC should implement a quality control system or method of checking the code and verifying the ac-curacy of the standard Truven data warehouse re-ports submitted to the state.
UHC Finding 2.1
Activity 2: Review CCO’s Capability Page 18
Control totals are not sent to the FAC by UHC to ensure the num-ber of encounters submitted in the files are correctly received and loaded by the FAC. Additionally, UHC receives acknowledgment of the files from Conduent, but no control totals.
The CCO should modify their processes as neces-sary to ensure all data files, especially subcontractor data files, are complete. This may include, but not be limited to, exchange of control totals for both in-bound and outbound subcontractor files. Addition-ally, control totals should be exchanged between the FAC and the CCO.

UnitedHealthcare Community Plan
www.mslc.com page 59
Mississippi Medicaid Managed Care
EQR Protocol 4 Summary of Findings
Entity/Finding # Activity #/
Page Reference Finding Recommendation
UHC Finding 2.2
Activity 2: Review CCO’s Capability Page 18
Dashboards containing operational metrics used to meet state re-porting requirements are automatically refreshed when the data warehouse is refreshed and new claims are accepted from the claims system. During the on-site interviews, UHC personnel indi-cated many reports are automated and a quality assurance check is not completed on report creation.
A quality assurance process should be developed to ensure all updated data from the dashboards gets reflected in the reports prepared for and submitted to DOM.
UHC Finding 2.3
Activity 2: Review CCO’s Capability Page 18
UHC representatives noted during the on-site review that UHC completes high level audits of delegated vendors; however, there is no auditing of delegated vendors on a claim detail level.
UHC should evaluate the benefits of conducting a more comprehensive audit of delegated vendors by including audits at the claim level detail as part of the audit process.
UHC Finding 2.4
Activity 2: Review of CCO’s Capability Page 18
There is limited oversight and validation of subcontractor encounter data. Often, the data is passed through UHC to Conduent via auto-mated processes with minimal checks for completion or subse-quent validation by UHC.
The CCO should modify their processes, as neces-sary, to ensure all data files, especially subcontrac-tor data files, are complete. This may include ex-change of control totals for both inbound and out-bound subcontractor files. The CCO should explore implementing a more thor-ough quality assurance and audit process to verify the completeness and accuracy of encounter data from their subcontractors.
DOM and Con-duent (FAC) Finding 3.1
Activity 3: Analyze Encounter Data Page 26
UOutpatient and Professional Key Data Elements: U The Principal Di-agnosis Code for professional claims is null 100 percent of the time, however the Diagnosis Code 1 data element is populated with valid values. 0TUDental Key Data Elements:U 0T The Tooth Numbers data element had a 0.1 percent invalid error rate identified. UPharmacy Key Data Elements:U Billing Provider NPI reflected a 100 percent invalid error rate because the field does not contain an NPI number. All values are length of five and six instead of the required ten character length. In addition the Plan Received date had a 100 percent invalid error date due to the field being populated with a date of 01/01/0001.
Conduent should ensure that all values submitted are valid and at a minimum report these errors to al-low for corrections when necessary.

UnitedHealthcare Community Plan
www.mslc.com page 60
Mississippi Medicaid Managed Care
EQR Protocol 4 Summary of Findings
Entity/Finding # Activity #/
Page Reference Finding Recommendation
DOM Finding 3.2
Activity 3: Analyze Encounter Data Page 33
No measurement period for the 98 percent encounter submission requirement is noted in the current contract between DOM and UHC.
DOM should stipulate the measurement period re-quired to be utilized to measure compliance with the 98 percent encounter submission requirement and stipulate if the percentage should be measured by service type and whether a separate measurement should be applied by subcontractor.
UHC and Con-duent (FAC) Finding 3.3
Activity 3: Analyze Encounter Data Pages 33-34
Surplus encounters were noted in all service types based on the claims sample received from UHC for the sample test months of January and October 2015. Surplus encounters as a percentage of the total sample were 15 percent for outpatient, 20 percent for pro-fessional, 118 percent for dental, and 26 percent for pharmacy. Also, a minimal amount of encounters were missing from the FAC encounter data based on the January and October 2015 claims sample.
UHC and Conduent should investigate the causes of surplus and missing encounters that appear to be present or missing in the FAC encounter data based on the sample claims data provided by UHC for Jan-uary and October 2015. Encounter data should be updated in the FAC data warehouse for any discrep-ancies noted during the investigation.
DOM Finding 3.4
Activity 3: Analyze Encounter Data Page 34
Adjustments to encounter payments in the FAC are necessary in reconciling payments to the cash disbursements journal to account for adjusted, void, denied, and replacement encounters.
Payment adjustments related to FAC encounter data for each rate setting period should be quantified and communicated to DOM’s actuary to ensure dupli-cates, voids, and denied claims are accurately ac-counted for in the rate setting process.
UHC Finding 3.5
Activity 3: Analyze Encounter Data Page 34
The 2015 annual completion percentage for dental claims is 113.18 percent which may signify inaccurate CDJ information supplied by UHC.
We recommend DOM require UHC to utilize cash disbursements from its accounting records as the source of its CDJ data, and provide documentation regarding how the data is extracted from the system as well as what mechanism it utilizes to ensure all transactions are properly included in the CDJ.
UHC and Con-duent (FAC) Finding 3.6
Activity 3: Analyze Encounter Data Pages 34-35
The line level Plan Paid Amounts for outpatient and professional service types have been noted as errors in the sample testing as well as in the EDV bi-monthly reporting. The total of line level pay-ments do not equal the header paid amount.
According to UHC, it corrected the line level issue in June 2016 on a prospective basis. Additional testing should be performed to ensure the solution is ade-quate. Ideally, we recommend the solution be applied retroactively to ensure payments are properly cap-tured at both the line level and the header level for reporting and analysis purposes.
UHC, DOM and Conduent (FAC) Finding 3.7
Activity 3: Analyze Encounter Data Pages 34-36
Errors were noted in key data component testing between sample claims and the FAC encounter data.
DOM, UHC, and Conduent should review and possi-bly update of the data dictionary to address errors related to the claims sample data containing values differing from the encounter data. A crosswalk be-tween the UB04 and 1500 claim forms to the en-counter data should be summarized to ensure proper fields are utilized in reporting.
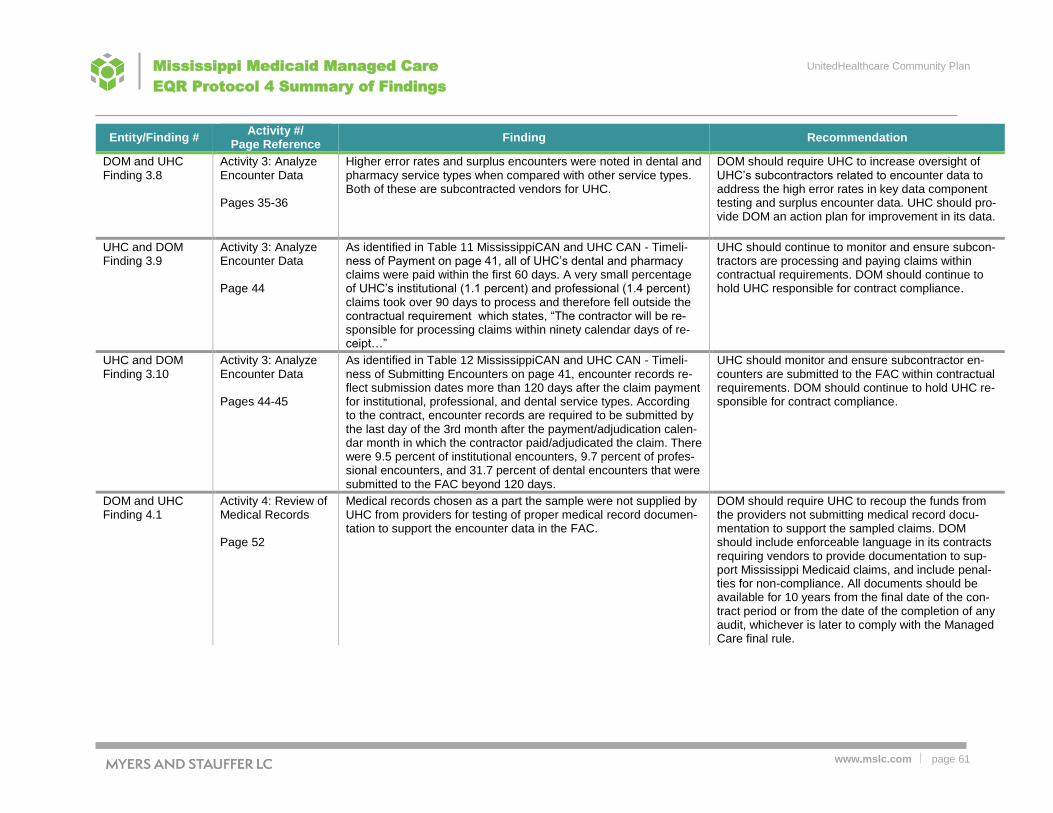
UnitedHealthcare Community Plan
www.mslc.com page 61
Mississippi Medicaid Managed Care
EQR Protocol 4 Summary of Findings
Entity/Finding # Activity #/
Page Reference Finding Recommendation
DOM and UHC Finding 3.8
Activity 3: Analyze Encounter Data Pages 35-36
Higher error rates and surplus encounters were noted in dental and pharmacy service types when compared with other service types. Both of these are subcontracted vendors for UHC.
DOM should require UHC to increase oversight of UHC’s subcontractors related to encounter data to address the high error rates in key data component testing and surplus encounter data. UHC should pro-vide DOM an action plan for improvement in its data.
UHC and DOM Finding 3.9
Activity 3: Analyze Encounter Data Page 44
As identified in Table 11 MississippiCAN and UHC CAN - Timeli-ness of Payment on page 41, all of UHC’s dental and pharmacy claims were paid within the first 60 days. A very small percentage of UHC’s institutional (1.1 percent) and professional (1.4 percent) claims took over 90 days to process and therefore fell outside the contractual requirement which states, “The contractor will be re-sponsible for processing claims within ninety calendar days of re-ceipt…”
UHC should continue to monitor and ensure subcon-tractors are processing and paying claims within contractual requirements. DOM should continue to hold UHC responsible for contract compliance.
UHC and DOM Finding 3.10
Activity 3: Analyze Encounter Data Pages 44-45
As identified in Table 12 MississippiCAN and UHC CAN - Timeli-ness of Submitting Encounters on page 41, encounter records re-flect submission dates more than 120 days after the claim payment for institutional, professional, and dental service types. According to the contract, encounter records are required to be submitted by the last day of the 3rd month after the payment/adjudication calen-dar month in which the contractor paid/adjudicated the claim. There were 9.5 percent of institutional encounters, 9.7 percent of profes-sional encounters, and 31.7 percent of dental encounters that were submitted to the FAC beyond 120 days.
UHC should monitor and ensure subcontractor en-counters are submitted to the FAC within contractual requirements. DOM should continue to hold UHC re-sponsible for contract compliance.
DOM and UHC Finding 4.1
Activity 4: Review of Medical Records Page 52
Medical records chosen as a part the sample were not supplied by UHC from providers for testing of proper medical record documen-tation to support the encounter data in the FAC.
DOM should require UHC to recoup the funds from the providers not submitting medical record docu-mentation to support the sampled claims. DOM should include enforceable language in its contracts requiring vendors to provide documentation to sup-port Mississippi Medicaid claims, and include penal-ties for non-compliance. All documents should be available for 10 years from the final date of the con-tract period or from the date of the completion of any audit, whichever is later to comply with the Managed Care final rule.

UnitedHealthcare Community Plan
www.mslc.com page 62
Mississippi Medicaid Managed Care
EQR Protocol 4 Summary of Findings
Entity/Finding # Activity #/
Page Reference Finding Recommendation
DOM and UHC Finding 4.2
Activity 4: Review of Medical Records Page 52
Overall error rates in the medical record reviews range from 20 percent to 38 percent including errors related to missing records. Professional claims experienced a 38 percent error rate and phar-macy claims had 22 percent error rate.
DOM should ensure there is proper oversight of UHC specific to UHC's program integrity efforts and provider training. UHC should conduct medical rec-ord reviews including targeting specific service types with high error rates and implement corrective action plans or penalties for non-compliance with documen-tation standards. Medical record review results should be shared with DOM. UHC should evaluate and strengthen where appropriate their provider's contractual provisions that define the maximum toler-able error rates and the potential monetary and/or le-gal consequences for failure to properly document services rendered to its members. Further, UHC should have a provision to verify whether the ser-vices that were represented as delivered were actu-ally received by Mississippi Medicaid enrollees. In accordance with the Medicaid final rule, the applica-tion of this verification should occur on a regular ba-sis. DOM's and UHC's program integrity sections should coordinate efforts to ensure that DOM has the ability to direct specific reviews and/or inde-pendently review the results from these medical rec-ord reviews to maintain proper oversight and moni-toring in accordance with the Medicaid Managed Care Final Rule requirements.

UnitedHealthcare Community Plan
www.mslc.com
Mississippi Medicaid Managed Care
EQR Protocol 4 Summary of Findings
Appendix A: Volume, Member Utilization, Demographic Statistics and
Per Member Costs
The table on page 38 showed summary encounters by type with an encounter defined by a combination
of a plan, a member, a provider, a date, and a claim type (institutional, professional, dental). In the ser-
vices/utilization tables, the same criteria was used, but gender and age were also added. Cases were
identified where both gender and age caused the identification of 562 additional encounters and a slight
variation in the total dollars. Denied encounters were not excluded for either analysis. Documentation in-
dicates the denied encounters are the primary cause of the variance. They have been intentionally left in
the analysis because we are showing what services were rendered, even if they were not paid for.
Table 22: Utilization Compared by Age and Gender
MS CAN UHC CAN
Age Total Male Female Total Male Female
Members
Member Months
Ages 0 - 9 1,829,945 929,563 900,382 926,862 472,449 454,413
Ages 10 - 17 1,172,729 592,620 580,109 610,249 309,266 300,983
Ages 18 - 34 843,727 176,469 667,258 407,810 85,455 322,355
Ages 35 - 49 379,373 91,404 287,969 171,869 41,914 129,955
Ages 50 - 64 297,680 122,637 175,043 122,765 51,203 71,562
Ages 65 - 74 773 241 532 370 116 254
Total 4,524,227 1,912,934 2,611,293 2,239,925 960,403 1,279,522
Average Number of Members P
1
Ages 0 - 9 152,495 77,464 75,032 77,239 39,371 37,868
Ages 10 - 17 97,727 49,385 48,342 50,854 25,772 25,082
Ages 18 - 34 70,311 14,706 55,605 33,984 7,121 26,863
Ages 35 - 49 31,614 7,617 23,997 14,322 3,493 10,830
Ages 50 - 64 24,807 10,220 14,587 10,230 4,267 5,964
Ages 65 - 74 64 20 44 31 10 21
Total 377,019 159,411 217,608 186,660 80,034 106,627
Total Utilization
Total Number of (all) Services
Ages 0 - 9 2,869,043 1,550,885 1,318,158 1,458,018 790,736 667,282
Ages 10 - 17 1,732,524 845,715 886,809 914,770 447,295 467,475
Ages 18 - 34 2,424,047 381,556 2,042,491 1,168,978 184,039 984,939
Ages 35 - 49 1,745,227 389,036 1,356,191 783,326 183,181 600,145
Ages 50 - 64 1,971,100 711,158 1,259,942 809,315 297,326 511,989

UnitedHealthcare Community Plan
www.mslc.com
Mississippi Medicaid Managed Care
EQR Protocol 4 Summary of Findings
MS CAN UHC CAN
Age Total Male Female Total Male Female
Ages 65 - 74 6,127 1,536 4,591 3,179 781 2,398
Total 10,748,068 3,879,886 6,868,182 5,137,586 1,903,358 3,234,228
Services (all) Per MemberP
2
Ages 0 - 9 18.8 20.0 17.6 18.9 20.1 17.6
Ages 10 - 17 17.7 17.1 18.3 18.0 17.4 18.6
Ages 18 - 34 34.5 25.9 36.7 34.4 25.8 36.7
Ages 35 - 49 55.2 51.1 56.5 54.7 52.4 55.4
Ages 50 - 64 79.5 69.6 86.4 79.1 69.7 85.9
Ages 65 - 74 95.1 76.5 103.6 103.1 80.8 113.3
Total 28.5 24.3 31.6 27.5 23.8 30.3
Institutional Utilization
Total Number of (all) Services
Ages 0 - 9 239,640 128,666 110,974 125,230 67,479 57,751
Ages 10 - 17 108,610 50,124 58,486 59,492 27,560 31,932
Ages 18 - 34 235,577 28,727 206,850 117,022 14,762 102,260
Ages 35 - 49 138,746 29,926 108,820 66,316 16,315 50,001
Ages 50 - 64 135,505 47,743 87,762 61,307 22,023 39,284
Ages 65 - 74 518 96 422 218 69 149
Total 858,596 285,282 573,314 429,585 148,208 281,377
Services (all) Per MemberP
2
Ages 0 - 9 1.6 1.7 1.5 1.6 1.7 1.5
Ages 10 - 17 1.1 1.0 1.2 1.2 1.1 1.3
Ages 18 - 34 3.4 2.0 3.7 3.4 2.1 3.8
Ages 35 - 49 4.4 3.9 4.5 4.6 4.7 4.6
Ages 50 - 64 5.5 4.7 6.0 6.0 5.2 6.6
Ages 65 - 74 8.0 4.8 9.5 7.1 7.1 7.0
Total 2.3 1.8 2.6 2.3 1.9 2.6
Professional Utilization
Total Number of (all) Services
Ages 0 - 9 1,440,090 785,855 654,235 733,338 401,414 331,924
Ages 10 - 17 840,465 422,620 417,845 439,322 221,768 217,554
Ages 18 - 34 1,204,642 194,416 1,010,226 589,109 94,145 494,964
Ages 35 - 49 735,280 173,763 561,517 339,391 84,540 254,851
Ages 50 - 64 811,434 301,948 509,486 347,332 131,261 216,071
Ages 65 - 74 2,890 669 2,221 1,607 391 1,216

UnitedHealthcare Community Plan
www.mslc.com
Mississippi Medicaid Managed Care
EQR Protocol 4 Summary of Findings
MS CAN UHC CAN
Age Total Male Female Total Male Female
Total 5,034,801 1,879,271 3,155,530 2,450,099 933,519 1,516,580
Services (all) Per MemberP
2
Ages 0 - 9 9.4 10.1 8.7 9.5 10.2 8.8
Ages 10 - 17 8.6 8.6 8.6 8.6 8.6 8.7
Ages 18 - 34 17.1 13.2 18.2 17.3 13.2 18.4
Ages 35 - 49 23.3 22.8 23.4 23.7 24.2 23.5
Ages 50 - 64 32.7 29.5 34.9 34.0 30.8 36.2
Ages 65 - 74 44.9 33.3 50.1 52.1 40.4 57.4
Total 13.4 11.8 14.5 13.1 11.7 14.2
Dental Utilization
Total Number of (all) Services
Ages 0 - 9 162,206 80,936 81,270 84,757 42,637 42,120
Ages 10 - 17 169,046 75,426 93,620 90,763 40,707 50,056
Ages 18 - 34 45,904 9,326 36,578 23,945 4,999 18,946
Ages 35 - 49 14,718 2,799 11,919 7,397 1,452 5,945
Ages 50 - 64 7,853 3,185 4,668 3,475 1,468 2,007
Ages 65 - 74 13 4 9 8 3 5
Total 399,740 171,676 228,064 210,345 91,266 119,079
Services (all) Per MemberP
2
Ages 0 - 9 1.1 1.0 1.1 1.1 1.1 1.1
Ages 10 - 17 1.7 1.5 1.9 1.8 1.6 2.0
Ages 18 - 34 0.7 0.6 0.7 0.7 0.7 0.7
Ages 35 - 49 0.5 0.4 0.5 0.5 0.4 0.5
Ages 50 - 64 0.3 0.3 0.3 0.3 0.3 0.3
Ages 65 - 74 0.2 0.2 0.2 0.3 0.3 0.2
Total 1.1 1.1 1.0 1.1 1.1 1.1
Pharmacy Utilization
Total Number of (all) Services
Ages 0 - 9 1,027,107 555,428 471,679 514,693 279,206 235,487
Ages 10 - 17 614,403 297,545 316,858 325,193 157,260 167,933
Ages 18 - 34 937,924 149,087 788,837 438,902 70,133 368,769
Ages 35 - 49 856,483 182,548 673,935 370,222 80,874 289,348
Ages 50 - 64 1,016,308 358,282 658,026 397,201 142,574 254,627
Ages 65 - 74 2,706 767 1,939 1,346 318 1,028
Total 4,454,931 1,543,657 2,911,274 2,047,557 730,365 1,317,192

UnitedHealthcare Community Plan
www.mslc.com
Mississippi Medicaid Managed Care
EQR Protocol 4 Summary of Findings
MS CAN UHC CAN
Age Total Male Female Total Male Female
Services (all) Per MemberP
2
Ages 0 - 9 6.7 7.2 6.3 6.7 7.1 6.2
Ages 10 - 17 6.3 6.0 6.6 6.4 6.1 6.7
Ages 18 - 34 13.3 10.1 14.2 12.9 9.8 13.7
Ages 35 - 49 27.1 24.0 28.1 25.8 23.2 26.7
Ages 50 - 64 41.0 35.1 45.1 38.8 33.4 42.7
Ages 65 - 74 42.0 38.2 43.7 43.7 32.9 48.6
Total 11.8 9.7 13.4 11.0 9.1 12.4
P
1P The average number of members was calculated by dividing the total number of member months by
12. P
2P Services per member were calculated by dividing the number of encounters by the average number of
members.

UnitedHealthcare Community Plan
www.mslc.com
Mississippi Medicaid Managed Care
EQR Protocol 4 Summary of Findings
Table 23: Utilization Costs in Dollars – By Age Group for Total Utilization, Institutional, Professional, Dental and Phar-macy
MS CAN UHC CAN
Age Total Male Female Total Male Female
Total Utilization ($/Year)
Total Dollars of (all) Services
Ages 0 - 9 $ 307,860,482.26 $ 169,368,002.59 $ 138,492,479.67 $ 157,702,051.63 $ 87,295,750.96 $ 70,406,300.67
Ages 10 - 17 $ 202,823,183.21 $ 103,163,415.44 $ 99,659,767.77 $ 108,448,957.59 $ 55,132,983.67 $ 53,315,973.92
Ages 18 - 34 $ 293,909,996.89 $ 51,614,521.67 $ 242,295,475.22 $ 142,800,708.53 $ 24,692,771.33 $ 118,107,937.20
Ages 35 - 49 $ 211,756,697.97 $ 52,505,248.63 $ 159,251,449.34 $ 97,572,586.48 $ 25,179,926.48 $ 72,392,660.00
Ages 50 - 64 $ 255,867,716.27 $ 99,892,956.64 $ 155,974,759.63 $ 107,518,034.88 $ 42,563,023.70 $ 64,955,011.18
Ages 65 - 74 $ 691,462.44 $ 191,348.92 $ 500,113.52 $ 280,179.18 $ 32,215.61 $ 247,963.57
Total
$1,272,909,539.04 $476,735,493.89 $ 796,174,045.15 $ 614,322,518.29 $234,896,671.75 $ 379,425,846.54
Average Cost Per Member Per YearP
2
Ages 0 - 9 $ 2,018.82 $ 2,186.42 $ 1,845.78 $ 2,041.75 $ 2,217.27 $ 1,859.27
Ages 10 - 17 $ 2,075.40 $ 2,088.96 $ 2,061.54 $ 2,132.55 $ 2,139.25 $ 2,125.67
Ages 18 - 34 $ 4,180.17 $ 3,509.82 $ 4,357.45 $ 4,201.98 $ 3,467.48 $ 4,396.69
Ages 35 - 49 $ 6,698.11 $ 6,893.17 $ 6,636.19 $ 6,812.58 $ 7,209.03 $ 6,684.71
Ages 50 - 64 $ 10,314.47 $ 9,774.50 $ 10,692.78 $ 10,509.64 $ 9,975.12 $ 10,892.10
Ages 65 - 74 $ 10,734.22 $ 9,527.75 $ 11,280.76 $ 9,086.89 $ 3,332.65 $ 11,714.81
Total $ 3,376.25 $ 2,990.60 $ 3,658.76 $ 3,291.12 $ 2,934.98 $ 3,558.45
Institutional Utilization ($/Year)
Total Dollars for (all) Services
Ages 0 - 9 $ 69,608,198.16 $ 39,190,236.37 $ 30,417,961.79 $ 36,472,483.64 $ 20,696,994.88 $ 15,775,488.76
Ages 10 - 17 $ 30,493,022.59 $ 14,692,806.27 $ 15,800,216.32 $ 16,398,558.30 $ 7,854,821.50 $ 8,543,736.80
Ages 18 - 34 $ 80,344,406.06 $ 10,700,797.21 $ 69,643,608.85 $ 39,181,886.93 $ 5,360,032.66 $ 33,821,854.27

UnitedHealthcare Community Plan
www.mslc.com
Mississippi Medicaid Managed Care
EQR Protocol 4 Summary of Findings
Table 23: Utilization Costs in Dollars – By Age Group for Total Utilization, Institutional, Professional, Dental and Phar-macy
MS CAN UHC CAN
Age Total Male Female Total Male Female
Ages 35 - 49 $ 56,223,687.90 $ 12,884,549.55 $ 43,339,138.35 $ 26,632,291.62 $ 6,652,260.56 $ 19,980,031.06
Ages 50 - 64 $ 67,708,049.83 $ 26,696,411.55 $ 41,011,638.28 $ 29,818,047.99 $ 11,791,566.96 $ 18,026,481.03
Ages 65 - 74 $ 176,477.47 $ 8,128.86 $ 168,348.61 $ 73,385.39 $ 5,427.68 $ 67,957.71
Total $ 304,553,842.01 $104,172,929.81 $ 200,380,912.20 $ 148,576,653.87 $ 52,361,104.24 $ 96,215,549.63
Average Cost Per Member Per YearP
2
Ages 0 - 9 $ 456.46 $ 505.92 $ 405.40 $ 472.21 $ 525.69 $ 416.59
Ages 10 - 17 $ 312.02 $ 297.52 $ 326.84 $ 322.46 $ 304.78 $ 340.63
Ages 18 - 34 $ 1,142.71 $ 727.66 $ 1,252.47 $ 1,152.95 $ 752.68 $ 1,259.05
Ages 35 - 49 $ 1,778.42 $ 1,691.55 $ 1,805.99 $ 1,859.48 $ 1,904.55 $ 1,844.95
Ages 50 - 64 $ 2,729.43 $ 2,612.24 $ 2,811.54 $ 2,914.65 $ 2,763.49 $ 3,022.80
Ages 65 - 74 $ 2,739.62 $ 404.76 $ 3,797.34 $ 2,380.07 $ 561.48 $ 3,210.60
Total $ 807.79 $ 653.49 $ 920.84 $ 795.97 $ 654.24 $ 902.36
Professional Utilization ($/Year)
Total Number of (all) Services
Ages 0 - 9 $ 138,553,147.97 $ 75,017,380.63 $ 63,535,767.34 $ 69,083,821.35 $ 37,583,264.23 $ 31,500,557.12
Ages 10 - 17 $ 79,957,369.12 $ 39,225,215.84 $ 40,732,153.28 $ 41,940,861.77 $ 20,645,278.55 $ 21,295,583.22
Ages 18 - 34 $ 138,695,084.91 $ 20,291,442.41 $ 118,403,642.50 $ 68,182,929.04 $ 9,661,187.37 $ 58,521,741.67
Ages 35 - 49 $ 73,856,387.71 $ 17,703,250.84 $ 56,153,136.87 $ 33,966,615.40 $ 8,603,705.80 $ 25,362,909.60
Ages 50 - 64 $ 83,146,367.72 $ 31,850,824.57 $ 51,295,543.15 $ 35,115,185.51 $ 13,399,183.00 $ 21,716,002.51
Ages 65 - 74 $ 182,150.77 $ 32,213.84 $ 149,936.93 $ 89,596.32 $ 11,661.96 $ 77,934.36
Total $ 514,390,508.20 $184,120,328.13 $ 330,270,180.07 $ 248,379,009.39 $ 89,904,280.91 $ 158,474,728.48
Average Cost Per Member Per YearP
2
Ages 0 - 9 $ 908.57 $ 968.42 $ 846.78 $ 894.42 $ 954.60 $ 831.86
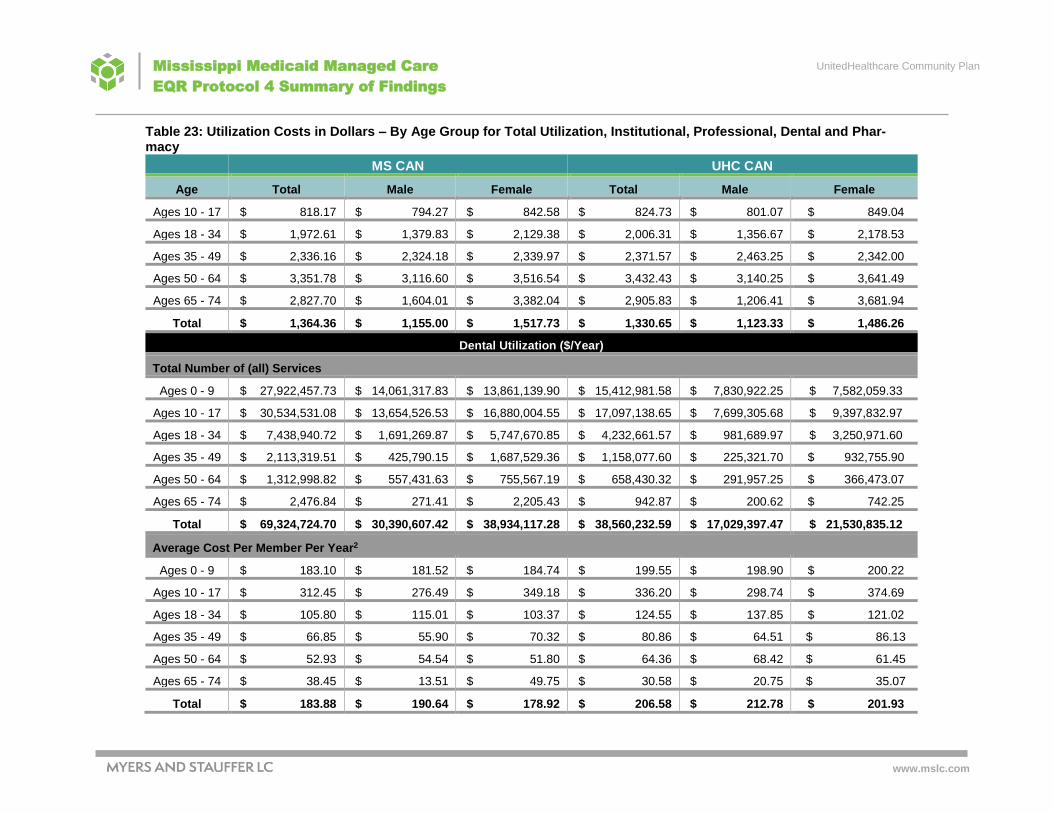
UnitedHealthcare Community Plan
www.mslc.com
Mississippi Medicaid Managed Care
EQR Protocol 4 Summary of Findings
Table 23: Utilization Costs in Dollars – By Age Group for Total Utilization, Institutional, Professional, Dental and Phar-macy
MS CAN UHC CAN
Age Total Male Female Total Male Female
Ages 10 - 17 $ 818.17 $ 794.27 $ 842.58 $ 824.73 $ 801.07 $ 849.04
Ages 18 - 34 $ 1,972.61 $ 1,379.83 $ 2,129.38 $ 2,006.31 $ 1,356.67 $ 2,178.53
Ages 35 - 49 $ 2,336.16 $ 2,324.18 $ 2,339.97 $ 2,371.57 $ 2,463.25 $ 2,342.00
Ages 50 - 64 $ 3,351.78 $ 3,116.60 $ 3,516.54 $ 3,432.43 $ 3,140.25 $ 3,641.49
Ages 65 - 74 $ 2,827.70 $ 1,604.01 $ 3,382.04 $ 2,905.83 $ 1,206.41 $ 3,681.94
Total $ 1,364.36 $ 1,155.00 $ 1,517.73 $ 1,330.65 $ 1,123.33 $ 1,486.26
Dental Utilization ($/Year)
Total Number of (all) Services
Ages 0 - 9 $ 27,922,457.73 $ 14,061,317.83 $ 13,861,139.90 $ 15,412,981.58 $ 7,830,922.25 $ 7,582,059.33
Ages 10 - 17 $ 30,534,531.08 $ 13,654,526.53 $ 16,880,004.55 $ 17,097,138.65 $ 7,699,305.68 $ 9,397,832.97
Ages 18 - 34 $ 7,438,940.72 $ 1,691,269.87 $ 5,747,670.85 $ 4,232,661.57 $ 981,689.97 $ 3,250,971.60
Ages 35 - 49 $ 2,113,319.51 $ 425,790.15 $ 1,687,529.36 $ 1,158,077.60 $ 225,321.70 $ 932,755.90
Ages 50 - 64 $ 1,312,998.82 $ 557,431.63 $ 755,567.19 $ 658,430.32 $ 291,957.25 $ 366,473.07
Ages 65 - 74 $ 2,476.84 $ 271.41 $ 2,205.43 $ 942.87 $ 200.62 $ 742.25
Total $ 69,324,724.70 $ 30,390,607.42 $ 38,934,117.28 $ 38,560,232.59 $ 17,029,397.47 $ 21,530,835.12
Average Cost Per Member Per YearP
2
Ages 0 - 9 $ 183.10 $ 181.52 $ 184.74 $ 199.55 $ 198.90 $ 200.22
Ages 10 - 17 $ 312.45 $ 276.49 $ 349.18 $ 336.20 $ 298.74 $ 374.69
Ages 18 - 34 $ 105.80 $ 115.01 $ 103.37 $ 124.55 $ 137.85 $ 121.02
Ages 35 - 49 $ 66.85 $ 55.90 $ 70.32 $ 80.86 $ 64.51 $ 86.13
Ages 50 - 64 $ 52.93 $ 54.54 $ 51.80 $ 64.36 $ 68.42 $ 61.45
Ages 65 - 74 $ 38.45 $ 13.51 $ 49.75 $ 30.58 $ 20.75 $ 35.07
Total $ 183.88 $ 190.64 $ 178.92 $ 206.58 $ 212.78 $ 201.93

UnitedHealthcare Community Plan
www.mslc.com
Mississippi Medicaid Managed Care
EQR Protocol 4 Summary of Findings
Table 23: Utilization Costs in Dollars – By Age Group for Total Utilization, Institutional, Professional, Dental and Phar-macy
MS CAN UHC CAN
Age Total Male Female Total Male Female
Pharmacy Utilization ($/Year)
Total Number of (all) Services
Ages 0 - 9 $ 71,776,678.40 $ 41,099,067.76 $ 30,677,610.64 $ 36,732,765.06 $ 21,184,569.60 $ 15,548,195.46
Ages 10 - 17 $ 61,838,260.42 $ 35,590,866.80 $ 26,247,393.62 $ 33,012,398.87 $ 18,933,577.94 $ 14,078,820.93
Ages 18 - 34 $ 67,431,565.20 $ 18,931,012.18 $ 48,500,553.02 $ 31,203,230.99 $ 8,689,861.33 $ 22,513,369.66
Ages 35 - 49 $ 79,563,302.85 $ 21,491,658.09 $ 58,071,644.76 $ 35,815,601.86 $ 9,698,638.42 $ 26,116,963.44
Ages 50 - 64 $ 103,700,299.90 $ 40,788,288.89 $ 62,912,011.01 $ 41,926,371.06 $ 17,080,316.49 $ 24,846,054.57
Ages 65 - 74 $ 330,357.36 $ 150,734.81 $ 179,622.55 $ 116,254.60 $ 14,925.35 $ 101,329.25
Total $ 384,640,464.13 $158,051,628.53 $ 226,588,835.60 $ 178,806,622.44 $ 75,601,889.13 $ 103,204,733.31
Average Cost Per Member Per YearP
2
Ages 0 - 9 $ 470.68 $ 530.56 $ 408.86 $ 475.58 $ 538.08 $ 410.59
Ages 10 - 17 $ 632.76 $ 720.68 $ 542.95 $ 649.16 $ 734.65 $ 561.31
Ages 18 - 34 $ 959.05 $ 1,287.32 $ 872.24 $ 918.17 $ 1,220.27 $ 838.08
Ages 35 - 49 $ 2,516.68 $ 2,821.54 $ 2,419.91 $ 2,500.67 $ 2,776.73 $ 2,411.63
Ages 50 - 64 $ 4,180.34 $ 3,991.12 $ 4,312.91 $ 4,098.21 $ 4,002.96 $ 4,166.35
Ages 65 - 74 $ 5,128.45 $ 7,505.47 $ 4,051.64 $ 3,770.42 $ 1,544.00 $ 4,787.21
Total $ 1,020.22 $ 991.47 $ 1,041.27 $ 957.92 $ 944.63 $ 967.91

UnitedHealthcare Community Plan
www.mslc.com
Mississippi Medicaid Managed Care
EQR Protocol 4 Summary of Findings
Appendix B:
Myers and Stauffer Encounter Reconciliation Report
Dated March 20, 2017

JANUARY 1, 2015 THROUGH DECEMBER 31, 2016
COMPARISON OF MISSISSIPPI
COORDINATED CARE ORGANIZATION ENCOUNTER CLAIMS TO CASH DISBURSEMENTS FOR UNITEDHEALTHCARE COMMUNITY PLAN
MARCH 20, 2017

2
EXECUTIVE SUMMARY ........................................................................................................ 3
DEFINITIONS AND ACRONYMS ............................................................................................. 5
STUDY PURPOSE ............................................................................................................... 7
DATA SOURCES ................................................................................................................ 8
ANALYSIS ......................................................................................................................... 9
POTENTIAL DATA ISSUES AND ANALYSIS ASSUMPTIONS .................................................... 10
UNITEDHEALTHCARE COMMUNITY PLAN – ENTIRE PLAN .................................................... 13
UNITEDHEALTHCARE COMMUNITY PLAN CALCULATED VOID AND DUPLICATE SUMMARY ...... 14
UNITEDHEALTHCARE COMMUNITY PLAN SUMMARY REPORTING CHARTS ............................ 15
UNITEDHEALTHCARE COMMUNITY PLAN – UHC DENTAL (DENTAL SERVICES) .................... 16
UNITEDHEALTHCARE COMMUNITY PLAN – OPTUMRX (PHARMACY BENEFITS) ..................... 17
UNITEDHEALTHCARE COMMUNITY PLAN – FEE-FOR-SERVICE AND OTHER VENDORS ........... 18
TABLE OF
CONTENTS

MS CCO Encounter and CDJ Comparison
3
Overview and Use of Encounter Data The Mississippi Division of Medicaid (DOM) requires that each of the CCOs submit encounter claims data to the DOM’s fiscal agent contractor (FAC). To ensure complete and accurate encounter data is being received, Myers and Stauffer provides bi-monthly encounter reconciliations (to test completeness). As part of this process, Myers and Stauffer analyzes Medicaid encounter data that has been submitted by the CCOs to Conduent and completes a comparison of the encounters to cash disbursement journals provided by each CCO. For purposes of this analysis, “encounter data” are claims that have been paid by CCOs or delegated vendors (e.g., vision and pharmacy) to health care providers that have provided health care services to members enrolled with the CCO. Myers and Stauffer is working closely with DOM and the CCOs to identify deficiencies and propose solutions that will result in high quality and reliable encounter data being submitted and available to the state agency to use to measure and monitor its Medicaid managed care program. Validated encounter data has many uses such as utilization by actuaries as part of their rate setting analyses as well as fulfilling the federal reporting requirements related to the Medicaid Managed Care Final Rule, to provide program management and oversight, and for tracking, accounting and other ad hoc analyses. Section 10.R.6 of the contract between DOM and the CCO states, “The Contractor shall submit ninety-eight percent (98%) of all Encounter Data, including those of subcontractors or delegated vendors as provided for in the contract Section, both for the original and any adjustment or void… The Contractor’s failure to comply may be subject to liquidated damages as outlined in Section 15.E, Liquidated Damages, of the Contract… Ninety-eight percent (98%) of the records in the Contractor’s encounter batch submission must pass X12 EDI compliance edits and the Mississippi Medicaid MMIS threshold and repairable compliance edits.” The bi-monthly encounter reconciliations also help fulfill part of the work requirements set forth in step number 3 of the Center for Medicare and Medicaid’s (CMS) External Quality Review (EQR) Protocol 4, which require a determination of the completeness, accuracy and quality of the encounter data being submitted by each CCO. CMS’ External Quality Review, Protocol 4, is an excellent way to assess whether the encounter data can be used to determine program effectiveness, accurately evaluate utilization, identify service gaps and make strong management decisions. In addition, the Protocol evaluates both departmental policies, as well as the policies, procedures and systems of the health plans to identify strengths and opportunities to enhance oversight. The full results of our Protocol 4 work will be issued as a separate report. March 2017 Encounter Reconciliation Report The March 2017 Mississippi Encounter Reconciliation report is an analysis of UnitedHealthcare Community Plan’s (UHC) fee-for-service and delegated vendors’ claims identified in the encounter data compared to the payments to service providers in the cash disbursement journals. Below is a summary of the cumulative completion percentages for all delegated vendors and non-vendor (fee-for-service) encounter paid claims submitted to Conduent (FAC) for the reporting period of January 1, 2015 through December 31, 2016. Included in this report, starting on page 10, are the potential data issues and assumptions utilized during the completion of this report, as well as our recommendations to the CCO, FAC, and DOM to help identify and correct the root causes of the issues identified. The current methodology utilized to actively engage and promote communication between the aforementioned parties is the usage of a separately provided crosswalk document of the issues, which allows for the capture of the responses and actions being pursued by each party. These responses are incorporated into subsequently issued reports to monitor the status of each issue. We further recommend that the Division of Medicaid utilize these reports as a management oversight tool to track the progress made by the CCO over time and to monitor the CCO’s contract compliance with providing complete and accurate encounter information. This report currently consists of only MississippiCAN encounters and cash disbursement journals (CDJs).
EXECUTIVE
SUMMARY

MS CCO Encounter and CDJ Comparison
4
The CHIP encounters in the FAC’s data warehouse seem to be near the same level as our last report with almost no paid encounters beyond January 2016. UHC’s CHIP cumulative encounter total appears to be approximately 24 percent of the CDJ cumulative total for the paid period, January 1, 2015 through December 31, 2016. It was confirmed by the DOM that UHC has been in the process of submitting historical CHIP encounters and working forward into the reporting period. As these encounters become more complete, we intend to include an analysis of the CHIP encounters in subsequent comparison reports.
UnitedHealthcare Community Plan ― Cumulative Completion Percentages
CCO/Delegated Vendor % of Cumulative Total Adjusted % of Cumulative Total
Entire Plan 96.52% 96.04%
UHC Dental (Dental Services) 108.91% 100.00%
OptumRx (Pharmacy Benefits) 97.26% 97.26%
UHC Fee-for-Service and Other Vendors 95.24% 95.24%
Potential issues that may impact the completion percentages are listed below (A full list and description of all potential issues starts on page 10):
1. The UHC Dental completion percentages exceeding 100 percent (page 16) appear to be due to possible issues with the CDJ transactions and/or encounters. In the third column in the above table, we have limited UHC Dental to a 100 percent completion rate in order to obtain an adjusted Entire Plan completion rate.

MS CCO Encounter and CDJ Comparison
5
The following terms are used throughout this document:
Calculated Void Encounter (CV) – An encounter that Myers and Stauffer LC has identified
as being a replacement encounter that does not appear to have a corresponding void of the original encounter in the FAC’s data warehouse.
Cash Disbursement Journal (CDJ) Monthly Reported Total – The sum of all payments
from a CCO or delegated vendor to service providers for a given month as reported by the CCO to the DOM.
CDJ Cumulative Reported Total – The sum of all payments from a CCO or delegated vendor
to service providers for the reconciliation period as reported by the CCO to the DOM. This amount is inclusive of all amounts reported in prior months.
Children’s Health Insurance Program (CHIP) – This program provides insurance
coverage for uninsured children up to age 19 whose family does not qualify for Medicaid and whose income does not exceed 200% of the federal poverty level. CHIP became a coordinated care program on January 1, 2015, with the two CCOs, UHC and Magnolia Health, being responsible for coordinating services.
Coordinated Care Organization (CCO) – A private organization that has entered into a risk-
based contractual arrangement with the Mississippi Division of Medicaid (DOM) to obtain and finance care for enrolled Medicaid members. CCOs receive a capitation or per member per month (PMPM) payment from the DOM for each enrolled member. There are two CCOs operating in Mississippi under a contract that was effective July 1, 2014, Magnolia Health Plan (Magnolia Health) and UnitedHealthcare Community Plan (UHC).
Conduent - State fiscal agent contractor, formerly known as Xerox Health Solutions.
Cumulative Encounter Total – The sum of all encounter submissions stored in the fiscal
agent contractor’s (FAC) encounter data warehouse. This amount is inclusive of all amounts submitted in prior months.
Cumulative Variance – The difference between the cumulative encounter total and the CDJ
cumulative reported total.
Fiscal Agent Contractor (FAC) – A contractor selected to design, develop and maintain the
claims processing system (Medicaid Management Information System); Conduent (formerly known as Xerox Health Solutions) is the current FAC.
Medicaid Management Information System (MMIS) – The claims processing system
used by the FAC to adjudicate Mississippi Medicaid claims. CCO submitted encounters are loaded into this system and assigned a unique claim identifier.
Mississippi Coordinated Access Network (MississippiCAN) – The state of
Mississippi’s Medicaid managed care program. Effective July 1, 2014, the Mississippi Division of Medicaid (DOM) started a new contract with two coordinated care organizations, who are responsible for coordinating services for Mississippi Medicaid beneficiaries.
Mississippi Division of Medicaid (DOM) – The division in the Office of the Governor that is
responsible for administering Medicaid in Mississippi.
Monthly Encounter Total – The sum of all encounter submissions for a given month stored in
the FAC’s encounter data warehouse.
DEFINITIONS AND
ACRONYMS

MS CCO Encounter and CDJ Comparison
6
Monthly Variance – The difference between the monthly encounter total and the CDJ monthly
reported total.
Potential Duplicate Encounter (PDUP) – An encounter that Myers and Stauffer LC has
identified as being a potential duplicate of another encounter in the FAC’s data warehouse.
Truven Health Analytics (Truven) –- Subcontractor to the state’s fiscal agent contractor
responsible for the encounter data warehouse.

MS CCO Encounter and CDJ Comparison
7
The Mississippi Division of Medicaid (DOM) engaged Myers and Stauffer LC to analyze Medicaid encounter data that has been submitted by the coordinated care organizations (CCOs) to Conduent (FAC) and complete a comparison of the encounters to cash disbursement journals provided by each CCO. For purposes of this analysis, “encounter data” are claims that have been paid by CCOs or delegated vendors (e.g., dental and pharmacy) to health care providers that have provided health care services to members enrolled with the CCO. Such claims are submitted to DOM via the FAC for DOM’s use in rate setting, federal reporting, program management and oversight, tracking, accounting and other ad hoc analyses. Section 10.R.6 of the contract between DOM and the CCO states, “The Contractor shall submit ninety-eight percent (98%) of all Encounter Data, including those of subcontractors or delegated vendors as provided for in the contract Section, both for the original and any adjustment or void… The Contractor’s failure to comply may be subject to liquidated damages as outlined in Section 15.E, Liquidated Damages, of the Contract… Ninety-eight percent (98%) of the records in the Contractor’s encounter batch submission must pass X12 EDI compliance edits and the Mississippi Medicaid MMIS threshold and repairable compliance edits.” The Medicaid encounter data encompasses both MississippiCAN and CHIP. However, the CHIP encounters existing in the FAC’s data warehouse are still relatively low as of the cutoff date for this report. Therefore, this report includes only MississippiCAN encounter to cash disbursement comparisons. Subsequent reports will include CHIP encounter to cash disbursement comparisons. DOM requested that, for this study, we estimate the percentage of each CCO delegated vendor paid encounter claims that appear to be included in the FAC’s data warehouse. This analysis includes these percentages for all CCO paid claims as well as separate dental and pharmacy delegated vendor encounters paid during the period January 1, 2015 through December 31, 2016. We have also included the percentages for the combined total of remaining vendor and non-vendor CCO paid encounter claims. The remaining vendor encounters that cannot be identified consist of non-emergency transportation, vision and behavioral health.
STUDY
PURPOSE

MS CCO Encounter and CDJ Comparison
8
Myers and Stauffer LC receives encounter data on a monthly basis from the FAC’s subcontracted data warehouse vendor, Truven Health Analytics. The data are in a standardized extract containing CCO institutional, medical, and pharmacy encounter claims. These encounter data extracts include claims from the two CCOs, Magnolia Health and UHC, having plan paid dates starting with October 1, 2013. The data used for this report includes encounter claims received and accepted by the FAC and transmitted to Myers and Stauffer LC through January 30, 2017. Myers and Stauffer LC also requested cash disbursement journals from each CCO ranging in dates from January 1, 2015 through December 31, 2016 in a standardized monthly format.
DATA
SOURCES

MS CCO Encounter and CDJ Comparison
9
Encounter claims from institutional, medical and pharmacy claim types were combined on like data fields. We analyzed the line reported information of each encounter to capture the amount paid on the entire claim. Encounter totals were calculated by summarizing the data by the CCO paid date, CCO identification number and specific delegated vendor criteria. Cash disbursements submitted by the CCO were summarized by paid date and delegated vendor to create a matching table. These matching tables were combined using common fields between the tables and were used to produce the results. Based on criteria provided by the CCO, we identified UHC encounters as follows:
UHC Dental – Dental Services Claim Type Code value of ‘D’.
OptumRx - Pharmacy Benefit
These encounters are contained in separate data warehouse tables as a result of pharmacy claim submissions processing.
UHC - Fee-for-Service and Other Vendors
All other plan submitted encounter claims that do not meet the listed criteria. This includes UHC non-vendor (fee-for-service) and the following delegated vendors that at the present time cannot be separately identified:
MTM (non-emergency transportation) VSP (vision services) Optum Behavioral (behavioral health services)
ANALYSIS

MS CCO Encounter and CDJ Comparison
10
1. We assume that all data provided to Myers and Stauffer LC is complete and accurate.
2. This analysis only included encounter information that was submitted by the CCOs to the FAC and loaded into the FAC’s data warehouse. Encounters submitted by any CCO that were rejected by the FAC for errors in submission or other reasons are excluded from this analysis.
3. The CHIP encounters appearing in the FAC’s data warehouse remain near the completion levels in the last report. There appear to be no CHIP pharmacy encounters submitted for the paid period, January 1, 2015 through December 31, 2016. As CHIP encounters continue to be submitted by the CCO, we intend to include an analysis of them in subsequent reports.
4. Voided encounter claims contained within the encounter submissions were coded to match the associated adjustment claim’s paid date to allow for the proper matching of cash disbursements that occurred due to this void transaction. However, we were unable to assign a paid date to the void transactions in which there was not an associated adjustment claim.
5. We identified potential duplicate encounter claims. We analyzed the encounter and CDJ submissions to conclude that some of these potential duplicates appear to be partial payments, some are actual duplicate submissions, and some are replacement claims without a matching void. We have attempted to adjust our totals to reflect the actual payment made and have removed duplicate payments from our analysis.
6. We have continued the utilization of the dispense date as the plan paid date for the pharmacy encounters within this reconciliation report. However, we recently identified an additional field within the encounter data that could possibly be the actual delegated vendor's paid date. The field, PYR_ID_DT, in the Truven warehouse encounter table, PHA_HDR_PYR, is defined as the day the CCO paid the claim. This field is located within the MSCAN NCPDP payer sheet at field # 443-E8 OTHER PAYER DATE. UHC has confirmed that this date field is populated with the check date from the claim file provided by OptumRx. They have also confirmed that the transaction date on the CDJ is populated with the check date. We have completed further analysis and have provided UHC with examples where these two dates are not in agreement. UHC is currently reviewing these samples.
7. There are claim adjustment instances in the encounters where the claim adjustment backout is successful, but the corresponding replacement transaction is denied by the FAC. This is creating a series of problems with the encounter data. First, these instances effectively remove paid encounters from the FAC’s data warehouse that the CCO may have intended to replace. Additionally, when a CCO submits subsequent replacement transactions (to replace the replacement claim), these are denied due to the original claim already having been removed. As a result, the plan must send the transaction as a new unrelated original encounter in order to have it accepted. This process can produce encounters that may not reflect the CCO’s actual claim adjustment activity. According to DOM iTech, this issue was being caused by incorrect CAS codes on the list used to set denial status. UHC provided an updated list of CAS codes on 10/18/16. This list is currently under review by iTech. Once this is completed, either a file maintenance CSR will be submitted to make necessary changes to the list or UHC will be contacted with additional questions. Since our last report, we continue to observe fewer new occurrences of these adjustment transactions.
8. There appear to be instances where the CCO submitted a paid encounter with a claim adjustment reason (CAS) code that was processed by the FAC as CCO-denied. This suggests that the FAC’s denial adjustment reason code (ARC) table may not contain the same CAS codes that the CCO is intending to use to identify denied encounters. DOM and UHC have reviewed the list of CAS codes and have informed us that CCO-denied encounters should now be processing correctly. DOM iTech is submitting a CSR that will be submitted to change the process to not set the line and header statuses to deny if the MC encounter paid amount is present. Since our last report, we have observed fewer instances of encounters that were paid by the CCO but processed as CCO-denied.
POTENTIAL DATA ISSUES AND
ANALYSIS ASSUMPTIONS

MS CCO Encounter and CDJ Comparison
11
9. We excluded encounters that were truly denied by the CCO. Encounters denied by the FAC were included and subjected to our potential duplicate encounter logic process which attempts to identify and remove these claims appropriately. However, this methodology artificially inflates the percentages of claim counts and amounts removed as identified in Table 2 - UHC Calculated Void and Duplicate Summary on page 14, since some of these were likely already marked correctly as denied for this very duplicate issue. This is currently the only fair and representative way to ensure that the actual CCO paid encounters remain in our analysis.
10. We instructed the CCOs to exclude referral fees, management fees and other non-encounter related fees from the CDJ data submitted to Myers and Stauffer LC.
11. Interest amounts do not appear to be included in the CCO paid amounts. We have therefore excluded the separately itemized interest expense from the CDJ totals.
12. There are instances where the monthly completion percentages in the entire plan, delegated vendor and/or fee-for-service completion tables on the following pages exceeded 100 percent during some months of the reporting period. These overstated monthly completion rates may be due to a variety of reasons such as encounters included without a corresponding matching CDJ transaction or certain claim voids and replacements that were absent from the encounter data, but were accounted for in the CDJ. Additionally, duplicate claims may have existed in the encounter data that we were unable to identify and remove. Also, CDJ payment dates may not have matched the payment dates that were reported in the encounter data resulting in potential timing differences.
13. As mentioned in the analysis section on page 9, we are not able to identify all of the delegated vendors in the encounters. This may be facilitated by additional identification in the CCO’s transaction control number (TCN) that is submitted on the encounter. However, no identification of this type currently exists in the UHC encounters. We are currently working with the DOM to add vendor identification to the encounters.
14. There are significant instances in UHC’s encounters where the sum of the claim line paid amounts does not equal the header paid amount. The FAC and UHC have confirmed that we should use the header paid amount in these instances. According to UHC, this issue has been corrected with a fix deployed in June 2016. This fix is on a go-forward basis only.
15. Monthly completion percentages exceeding 100 percent were noted for the UHC Dental vendor encounter claims. To prevent artificial inflation of the overall encounter completion percentages, we have included a separate adjusting line titled “Adjustments” in Table 1 – UHC Total and Table 3 – UHC Dental. This line adjusts the cash disbursement totals to limit the UHC Dental completion percentages to 100 percent. UHC indicated that they have identified several errors during their review and intend to supply us with a corrected CDJ file. This file has not been resubmitted as of this report date.
16. There are numerous instances in the UHC Dental CDJ where an original transaction and its corresponding adjustment void transaction are not found in the FAC’s encounter data warehouse. This creates concerns as to whether the FAC is receiving all encounter transactions even if the net paid amount for these transactions is $0. This may also affect the individual monthly completion percentages due to the timing of the transactions. UHC Dental appears to have made a change to the claim number in the CDJ transactions beginning with the October 2016 file. This new claim number is now 18 characters in length. Since the last report, we have also observed a significant increase in the number of UHC Dental encounters having plan claim numbers consisting of 18 characters. UHC indicated that they have identified several errors during their review and intend to supply us with a corrected CDJ file. This file has not been submitted as of this report date.
17. We identified instances in the Medical/Optum Behavioral CDJ files where a behavioral health transaction and a medical transaction appear to have the same plan claim number. The corresponding encounters in the FAC’s data warehouse also suggest that these transactions are included as part of the same encounter. We provided examples to UHC and discussed with them how these can occur. The UHC claim adjudication system “tags” claims and claim lines as belonging to Optum Behavioral (UBH) based on a mixed-service protocol between UBH and UHC. The result is that UBH and UHC can potentially have claim lines within the same claim. We have completed an analysis on the

MS CCO Encounter and CDJ Comparison
12
prevalence of this issue using the CDJ transactions and have found that it occurs infrequently and has not occurred since the paid month of December 2015.
18. Every transaction date in the VSP vision CDJ files is four to six days prior to the corresponding encounter plan paid date contained within the FAC’s data warehouse. We would expect that the CDJ transaction date would not be prior to the plan’s paid date. This implies that the provider is being paid before the claim is adjudicated. UHC has reported that VSP has two paid date definitions. The first definition is the date the claim was processed and submitted for payment. The second definition is the actual date the payment was sent to the provider. Per VSP, the CDJ file was using the first date definition and intends to start utilizing the second date definition. The encounter data is currently using the second date definition, however the encounter data should be using the first date definition. UHC has reported that they are changing to March Vision effective 1/1/2017. They will make the proposed change to the VSP CDJ to use the date the payment was sent to the provider. They will not be able to make the proposed change to the encounter data before the end of the contract. UHC will work with March Vision to ensure the proposed date changes are made for both the CDJ and encounter submissions.
19. Analysis of the encounter data and cash disbursement journals, as well as interactions with the CCOs, DOM and the FAC have resulted in the identification of opportunities for improving the encounter reconciliation process. While we have attempted to account for these situations, other potential issues within the data may exist that have not yet been identified which may require us to restate a report or modify reconciliation processes in the future.

MS CCO Encounter and CDJ Comparison
13
UnitedHealthcare Community Plan appears to have submitted approximately 96 percent of their encounter data for this period, with a cumulative monthly range between 95 percent and 100 percent. Monthly percentages exceeded 100 percent during some months of the reporting period. Please reference potential data issue number 12 on page 11 for an explanation of the possible causes.
Table 1 ― UHC Entire Plan
Paid Month CDJ Monthly
Reported Total Monthly
Encounter Total Monthly Variance
CDJ Cumulative Reported Total
Cumulative Encounter Total
Cumulative Variance
% of Monthly Claims
% of Cumulative Total
January 2015 $32,379,707 $31,983,353 ($396,354) $32,379,707 $31,983,353 ($396,354) 98.77% 98.77%
February 2015 $30,519,525 $29,687,401 ($832,124) $62,899,232 $61,670,754 ($1,228,478) 97.27% 98.04%
March 2015 $33,896,114 $31,196,112 ($2,700,002) $96,795,346 $92,866,866 ($3,928,480) 92.03% 95.94%
April 2015 $38,554,999 $38,397,705 ($157,294) $135,350,345 $131,264,571 ($4,085,775) 99.59% 96.98%
May 2015 $40,759,669 $38,836,982 ($1,922,687) $176,110,014 $170,101,553 ($6,008,461) 95.28% 96.58%
June 2015 $41,369,718 $42,000,418 $630,699 $217,479,732 $212,101,970 ($5,377,762) 101.52% 97.52%
July 2015 $58,192,217 $57,991,999 ($200,217) $275,671,949 $270,093,969 ($5,577,979) 99.65% 97.97%
August 2015 $57,427,499 $57,390,283 ($37,216) $333,099,447 $327,484,252 ($5,615,195) 99.93% 98.31%
September 2015 $60,594,088 $61,196,412 $602,324 $393,693,535 $388,680,664 ($5,012,871) 100.99% 98.72%
October 2015 $59,837,887 $62,152,686 $2,314,799 $453,531,422 $450,833,350 ($2,698,072) 103.86% 99.40%
November 2015 $61,480,049 $58,867,671 ($2,612,378) $515,011,471 $509,701,021 ($5,310,450) 95.75% 98.96%
December 2015 $62,046,188 $65,452,978 $3,406,790 $577,057,659 $575,153,999 ($1,903,660) 105.49% 99.67%
January 2016 $66,083,493 $68,076,980 $1,993,487 $643,141,153 $643,230,979 $89,826 103.01% 100.01%
February 2016 $79,025,899 $76,815,168 ($2,210,732) $722,167,052 $720,046,147 ($2,120,905) 97.20% 99.70%
March 2016 $87,969,136 $87,259,773 ($709,363) $810,136,188 $807,305,920 ($2,830,269) 99.19% 99.65%
April 2016 $79,379,431 $75,315,044 ($4,064,387) $889,515,619 $882,620,963 ($6,894,656) 94.87% 99.22%
May 2016 $77,419,579 $72,225,808 ($5,193,771) $966,935,198 $954,846,771 ($12,088,427) 93.29% 98.74%
June 2016 $79,298,500 $75,438,017 ($3,860,484) $1,046,233,699 $1,030,284,788 ($15,948,911) 95.13% 98.47%
July 2016 $78,038,352 $72,579,936 ($5,458,416) $1,124,272,050 $1,102,864,724 ($21,407,327) 93.00% 98.09%
August 2016 $78,471,717 $75,533,646 ($2,938,071) $1,202,743,767 $1,178,398,370 ($24,345,398) 96.25% 97.97%
September 2016 $84,505,725 $78,120,360 ($6,385,365) $1,287,249,492 $1,256,518,730 ($30,730,762) 92.44% 97.61%
October 2016 $78,944,996 $71,243,647 ($7,701,349) $1,366,194,488 $1,327,762,377 ($38,432,111) 90.24% 97.18%
November 2016 $78,254,575 $73,438,611 ($4,815,965) $1,444,449,063 $1,401,200,988 ($43,248,076) 93.84% 97.00%
December 2016 $90,981,344 $80,869,920 ($10,111,424) $1,535,430,407 $1,482,070,908 ($53,359,499) 88.88% 96.52%
Adjustments1 $7,749,850 $1,543,180,257 $1,482,070,908 ($61,109,349) 96.04%
1 The Adjustments line represents an increase in cash disbursements for UHC Dental to attain a cumulative completion rate of 100 percent. Their encounters exceed 100 percent of CDJ monthly totals on a consistent basis. See issue number 15.
UNITEDHEALTHCARE COMMUNITY PLAN – ENTIRE PLAN
UNITEDHEALTHCARE COMMUNITY PLAN
JANUARY 2015 – DECEMBER 2016

MS CCO Encounter and CDJ Comparison
14
The calculated void (CV) and potential duplicate (PDUP) claims that have been identified through the encounter reconciliation analysis are indicated below. These claims have been removed from the encounter reconciliation totals. We will send the potential duplicates and calculated voids to UHC to review. Responses received will be incorporated into the next report. Claims having additional questions for UHC will remain on the list for two consecutive report cycles. After that time, any claims without responses will be marked confirmed as a calculated void or duplicate.
Table 2 ― UHC Calculated Void and Duplicate Summary
Paid Month
Count of Encounter
Claims
Total Sum (CCO Submitted
Paid Amount)
Count of CV PDUP
Claims
CV PDUP Amount
Removed
% of CV PDUP
Claim Count
% of CV PDUP Amount
Removed
January 2015 344,895 $39,072,036 62,852 $7,088,683 18.22% 18.14%
February 2015 319,361 $34,202,255 43,941 $4,514,854 13.76% 13.20%
March 2015 344,132 $40,181,711 102,742 $8,985,599 29.86% 22.36%
April 2015 464,790 $54,491,653 185,680 $16,093,949 39.95% 29.53%
May 2015 435,014 $49,200,925 101,196 $10,363,944 23.26% 21.06%
June 2015 448,850 $52,997,693 101,747 $10,997,275 22.67% 20.75%
July 2015 597,633 $76,150,474 161,346 $18,158,475 27.00% 23.85%
August 2015 647,724 $77,039,113 193,947 $19,648,830 29.94% 25.51%
September 2015 608,007 $70,882,300 115,131 $9,685,889 18.94% 13.66%
October 2015 640,016 $74,411,240 134,146 $12,258,553 20.96% 16.47%
November 2015 661,383 $76,902,104 257,553 $18,034,433 38.94% 23.45%
December 2015 694,769 $85,591,149 241,283 $20,138,171 34.73% 23.53%
January 2016 561,112 $84,088,595 91,990 $16,011,615 16.39% 19.04%
February 2016 605,438 $97,010,839 96,855 $20,195,672 16.00% 20.82%
March 2016 651,395 $101,880,609 65,541 $14,620,836 10.06% 14.35%
April 2016 640,336 $84,811,555 94,171 $9,496,511 14.71% 11.20%
May 2016 593,907 $76,861,767 37,689 $4,635,960 6.35% 6.03%
June 2016 584,453 $79,638,731 34,317 $4,200,714 5.87% 5.27%
July 2016 551,776 $78,204,712 49,471 $5,624,776 8.97% 7.19%
August 2016 644,974 $79,738,238 44,060 $4,204,593 6.83% 5.27%
September 2016 654,269 $84,357,290 73,181 $6,236,930 11.19% 7.39%
October 2016 650,666 $76,402,178 40,303 $5,158,531 6.19% 6.75%
November 2016 611,290 $76,800,736 26,472 $3,362,125 4.33% 4.38%
December 2016 590,216 $85,247,813 36,353 $4,377,893 6.16% 5.14%
TOTALS 13,546,406 1,736,165,716 2,391,967 254,094,811 17.66% 14.64%1
Count of Encounter Claims – The number of claims processed by the FAC (including claims marked as denied by
the FAC). Total Sum (CCO Submitted Paid Amount) – The total paid amount of claims in a month per the encounter data
provided by the FAC. Count of CV PDUP Claims – The number of claims identified by Myers and Stauffer LC as potential calculated voids
and duplicates as well as calculated voids and duplicates confirmed by the CCO. CV PDUP Amount Removed – The paid amount removed from the Monthly Encounter Total based on Myers and
Stauffer LC’s analysis of calculated void and duplicate claims. % of CV PDUP Claim Count – The percentage of CV PDUP claims out of the total number of encounter claims. % of CV PDUP Amount Removed – The percentage of paid amount removed from the total CCO submitted paid
amount. 1 These percentages are somewhat higher than usually expected due to our current methodology which includes system-denied encounters. Please reference potential issue number 9 on page 11.
UNITEDHEALTHCARE COMMUNITY PLAN
CALCULATED VOID AND DUPLICATE SUMMARY

MS CCO Encounter and CDJ Comparison
15
UHC’s CDJ totals and encounter totals as reported monthly.
UHC’s cumulative encounter submissions expressed as a percentage of payments submitted to the FAC to reported MCO CDJ payments.
$0
$10,000,000
$20,000,000
$30,000,000
$40,000,000
$50,000,000
$60,000,000
$70,000,000
$80,000,000
$90,000,000
$100,000,000
UHC - 1
CDJ Monthly Reported Total
Monthly Encounter Total
94%
95%
96%
97%
98%
99%
100%
101%
UHC - 2
% of Cumulative Total
UNITEDHEALTHCARE COMMUNITY PLAN
SUMMARY REPORTING CHARTS

MS CCO Encounter and CDJ Comparison
16
Reported UHC vendors include UHC Dental (Dental) and OptumRx (Pharmacy).
UnitedHealthcare Community Plan appears to have submitted approximately 100 percent of the UHC Dental encounter data for this period, with a cumulative monthly range between 86 percent and 100 percent. Monthly percentages exceeded 100 percent during some months of the reporting period. Please reference potential data issue number 12 on page 11 for an explanation of the possible causes.
Table 3 ― UHC Dental (Dental)
Paid Month CDJ Monthly
Reported Total Monthly
Encounter Total Monthly Variance
CDJ Cumulative Reported Total
Cumulative Encounter Total
Cumulative Variance
% of Monthly Claims
% of Cumulative Total
January 2015 $1,049,019 $907,641 ($141,378) $1,049,019 $907,641 ($141,378) 86.52% 86.52%
February 2015 $702,529 $774,965 $72,436 $1,751,548 $1,682,606 ($68,942) 110.31% 96.06%
March 2015 $719,569 $770,002 $50,433 $2,471,117 $2,452,609 ($18,508) 107.00% 99.25%
April 2015 $883,060 $994,616 $111,556 $3,354,177 $3,447,225 $93,047 112.63% 102.77%
May 2015 $1,379,885 $1,548,365 $168,480 $4,734,062 $4,995,589 $261,527 112.20% 105.52%
June 2015 $2,134,512 $2,426,900 $292,388 $6,868,574 $7,422,490 $553,916 113.69% 108.06%
July 2015 $4,124,694 $4,740,359 $615,665 $10,993,268 $12,162,848 $1,169,580 114.92% 110.63%
August 2015 $4,409,738 $5,173,978 $764,241 $15,403,006 $17,336,827 $1,933,821 117.33% 112.55%
September 2015 $2,961,220 $3,370,239 $409,019 $18,364,226 $20,707,066 $2,342,840 113.81% 112.75%
October 2015 $4,566,621 $5,189,308 $622,687 $22,930,847 $25,896,373 $2,965,526 113.63% 112.93%
November 2015 $4,162,796 $4,747,494 $584,697 $27,093,644 $30,643,867 $3,550,224 114.04% 113.10%
December 2015 $4,521,049 $5,137,972 $616,923 $31,614,693 $35,781,840 $4,167,147 113.64% 113.18%
January 2016 $4,005,477 $4,703,288 $697,811 $35,620,170 $40,485,128 $4,864,958 117.42% 113.65%
February 2016 $4,158,749 $4,843,096 $684,347 $39,778,919 $45,328,224 $5,549,305 116.45% 113.95%
March 2016 $4,151,320 $3,470,588 ($680,733) $43,930,239 $48,798,812 $4,868,572 83.60% 111.08%
April 2016 $5,232,266 $5,686,175 $453,909 $49,162,505 $54,484,987 $5,322,482 108.67% 110.82%
May 2016 $4,372,379 $3,715,726 ($656,652) $53,534,883 $58,200,713 $4,665,830 84.98% 108.71%
June 2016 $3,491,672 $3,755,737 $264,065 $57,026,556 $61,956,450 $4,929,894 107.56% 108.64%
July 2016 $4,922,562 $5,280,902 $358,340 $61,949,117 $67,237,352 $5,288,235 107.27% 108.53%
August 2016 $6,425,995 $7,044,020 $618,025 $68,375,112 $74,281,372 $5,906,260 109.61% 108.63%
September 2016 $5,365,460 $5,811,700 $446,240 $73,740,572 $80,093,072 $6,352,500 108.31% 108.61%
October 2016 $4,259,713 $4,554,496 $294,783 $78,000,285 $84,647,568 $6,647,283 106.92% 108.52%
November 2016 $4,381,610 $4,858,523 $476,914 $82,381,895 $89,506,091 $7,124,196 110.88% 108.64%
December 2016 $4,562,698 $5,188,352 $625,654 $86,944,593 $94,694,443 $7,749,850 113.71% 108.91%
Adjustments1 $7,749,850 $94,694,443 $94,694,443 $0 100.00%
1 The Adjustments line represents an increase in cash disbursements for UHC Dental to attain a cumulative completion rate of 100 percent. Their encounters exceed 100 percent of CDJ monthly totals on a consistent basis. See issue number 15. .
UNITEDHEALTHCARE COMMUNITY PLAN – UHC DENTAL (DENTAL SERVICES)

MS CCO Encounter and CDJ Comparison
17
UnitedHealthcare Community Plan appears to have submitted approximately 97 percent of the OptumRx pharmacy benefit encounter data for this period, with a cumulative monthly range between 96 percent and 100 percent. Monthly percentages exceeded 100 percent during some months of the reporting period. Please reference potential data issue number 12 on page 11 for an explanation of the possible causes.
Table 4 ― UHC OptumRx (Pharmacy Benefits)
Paid Month CDJ Monthly
Reported Total Monthly
Encounter Total Monthly Variance
CDJ Cumulative Reported Total
Cumulative Encounter Total
Cumulative Variance
% of Monthly Claims
% of Cumulative Total
January 2015 $10,335,156 $10,281,666 ($53,490) $10,335,156 $10,281,666 ($53,490) 99.48% 99.48%
February 2015 $8,627,420 $10,348,895 $1,721,476 $18,962,576 $20,630,561 $1,667,985 119.95% 108.79%
March 2015 $13,545,917 $11,277,801 ($2,268,116) $32,508,492 $31,908,362 ($600,131) 83.25% 98.15%
April 2015 $11,414,290 $11,120,848 ($293,441) $43,922,782 $43,029,210 ($893,572) 97.42% 97.96%
May 2015 $13,638,858 $12,570,298 ($1,068,560) $57,561,640 $55,599,508 ($1,962,132) 92.16% 96.59%
June 2015 $14,263,134 $14,744,148 $481,015 $71,824,774 $70,343,656 ($1,481,118) 103.37% 97.93%
July 2015 $16,673,163 $16,698,722 $25,559 $88,497,937 $87,042,378 ($1,455,559) 100.15% 98.35%
August 2015 $18,395,316 $17,983,633 ($411,683) $106,893,252 $105,026,011 ($1,867,241) 97.76% 98.25%
September 2015 $17,879,070 $18,329,497 $450,427 $124,772,322 $123,355,509 ($1,416,814) 102.51% 98.86%
October 2015 $16,724,683 $18,508,455 $1,783,772 $141,497,006 $141,863,964 $366,958 110.66% 100.25%
November 2015 $21,740,306 $18,189,057 ($3,551,249) $163,237,312 $160,053,021 ($3,184,291) 83.66% 98.04%
December 2015 $16,174,030 $18,753,654 $2,579,624 $179,411,342 $178,806,675 ($604,666) 115.94% 99.66%
January 2016 $16,925,583 $19,098,913 $2,173,330 $196,336,924 $197,905,588 $1,568,664 112.84% 100.79%
February 2016 $20,174,405 $19,652,987 ($521,418) $216,511,330 $217,558,575 $1,047,246 97.41% 100.48%
March 2016 $17,835,657 $20,687,578 $2,851,921 $234,346,987 $238,246,153 $3,899,166 115.98% 101.66%
April 2016 $16,772,892 $15,230,572 ($1,542,320) $251,119,879 $253,476,725 $2,356,846 90.80% 100.93%
May 2016 $15,458,208 $14,979,222 ($478,986) $266,578,087 $268,455,947 $1,877,860 96.90% 100.70%
June 2016 $14,919,079 $14,401,921 ($517,158) $281,497,166 $282,857,868 $1,360,703 96.53% 100.48%
July 2016 $16,186,156 $14,150,987 ($2,035,170) $297,683,322 $297,008,855 ($674,467) 87.42% 99.77%
August 2016 $15,852,546 $16,053,139 $200,593 $313,535,868 $313,061,994 ($473,874) 101.26% 99.84%
September 2016 $18,310,092 $15,305,803 ($3,004,289) $331,845,960 $328,367,797 ($3,478,163) 83.59% 98.95%
October 2016 $18,811,974 $14,734,709 ($4,077,265) $350,657,934 $343,102,505 ($7,555,428) 78.32% 97.84%
November 2016 $15,638,427 $16,002,443 $364,016 $366,296,361 $359,104,948 ($7,191,413) 102.32% 98.03%
December 2016 $18,862,006 $15,534,800 ($3,327,207) $385,158,368 $374,639,748 ($10,518,620) 82.36% 97.26%
UNITEDHEALTHCARE COMMUNITY PLAN – OPTUMRX (PHARMACY BENEFITS)

MS CCO Encounter and CDJ Comparison
18
Other UHC vendors that cannot be identified in the encounters include MTM (Non-Emergency Transportation), VSP (Vision) and Optum Behavioral (Behavioral Health).
UnitedHealthcare Community Plan appears to have submitted approximately 95 percent of the UHC fee-for-service encounter data for this period, with a cumulative monthly range between 93 percent and 99 percent. Monthly percentages exceeded 100 percent during a few months of the reporting period. Please reference potential data issue number 12 on page 11 for an explanation of the possible causes.
Table 5 ― UHC Fee-for-Service and Other Vendors
Paid Month CDJ Monthly
Reported Total Monthly
Encounter Total Monthly Variance
CDJ Cumulative Reported Total
Cumulative Encounter Total
Cumulative Variance
% of Monthly Claims
% of Cumulative Total
January 2015 $20,995,531 $20,794,046 ($201,486) $20,995,531 $20,794,046 ($201,486) 99.04% 99.04%
February 2015 $21,189,577 $18,563,541 ($2,626,036) $42,185,108 $39,357,587 ($2,827,521) 87.60% 93.29%
March 2015 $19,630,628 $19,148,309 ($482,319) $61,815,737 $58,505,896 ($3,309,841) 97.54% 94.64%
April 2015 $26,257,649 $26,282,240 $24,591 $88,073,386 $84,788,136 ($3,285,250) 100.09% 96.26%
May 2015 $25,740,926 $24,718,319 ($1,022,606) $113,814,312 $109,506,455 ($4,307,856) 96.02% 96.21%
June 2015 $24,972,072 $24,829,369 ($142,704) $138,786,384 $134,335,824 ($4,450,560) 99.42% 96.79%
July 2015 $37,394,360 $36,552,919 ($841,441) $176,180,744 $170,888,743 ($5,292,001) 97.74% 96.99%
August 2015 $34,622,445 $34,232,672 ($389,774) $210,803,189 $205,121,414 ($5,681,775) 98.87% 97.30%
September 2015 $39,753,798 $39,496,676 ($257,123) $250,556,987 $244,618,090 ($5,938,897) 99.35% 97.62%
October 2015 $38,546,582 $38,454,923 ($91,659) $289,103,569 $283,073,013 ($6,030,557) 99.76% 97.91%
November 2015 $35,576,946 $35,931,120 $354,174 $324,680,516 $319,004,133 ($5,676,383) 100.99% 98.25%
December 2015 $41,351,109 $41,561,351 $210,242 $366,031,625 $360,565,484 ($5,466,141) 100.50% 98.50%
January 2016 $45,152,434 $44,274,779 ($877,655) $411,184,058 $404,840,263 ($6,343,795) 98.05% 98.45%
February 2016 $54,692,745 $52,319,085 ($2,373,660) $465,876,804 $457,159,348 ($8,717,456) 95.66% 98.12%
March 2016 $65,982,159 $63,101,607 ($2,880,551) $531,858,962 $520,260,955 ($11,598,007) 95.63% 97.81%
April 2016 $57,374,273 $54,398,296 ($2,975,976) $589,233,235 $574,659,252 ($14,573,984) 94.81% 97.52%
May 2016 $57,588,993 $53,530,859 ($4,058,134) $646,822,228 $628,190,111 ($18,632,117) 92.95% 97.11%
June 2016 $60,887,749 $57,280,359 ($3,607,391) $707,709,977 $685,470,469 ($22,239,508) 94.07% 96.85%
July 2016 $56,929,634 $53,148,048 ($3,781,586) $764,639,611 $738,618,517 ($26,021,094) 93.35% 96.59%
August 2016 $56,193,176 $52,436,486 ($3,756,689) $820,832,787 $791,055,003 ($29,777,784) 93.31% 96.37%
September 2016 $60,830,173 $57,002,857 ($3,827,315) $881,662,960 $848,057,861 ($33,605,099) 93.70% 96.18%
October 2016 $55,873,309 $51,954,443 ($3,918,866) $937,536,269 $900,012,303 ($37,523,966) 92.98% 95.99%
November 2016 $58,234,538 $52,577,645 ($5,656,894) $995,770,807 $952,589,948 ($43,180,859) 90.28% 95.66%
December 2016 $67,556,640 $60,146,769 ($7,409,871) $1,063,327,447 $1,012,736,717 ($50,590,730) 89.03% 95.24%
UNITEDHEALTHCARE COMMUNITY PLAN – FEE-FOR-SERVICE AND OTHER VENDORS