state of retail real estate in india
DESCRIPTION
State of Retail Real Estate in IndiaTRANSCRIPT

State of the Retail Real Estate in India Market Trends and Outlook
May 2012 Himadri Mayank AVP-Research and REIS
201 204
238
278
321
368
425
0
50
100
150
200
250
300
350
400
450
1998 2000 2002 2004 2006 2008 2010
Market Size (in USD Billion)
Source: Real Estate Intelligence Service (JLL), 1Q12
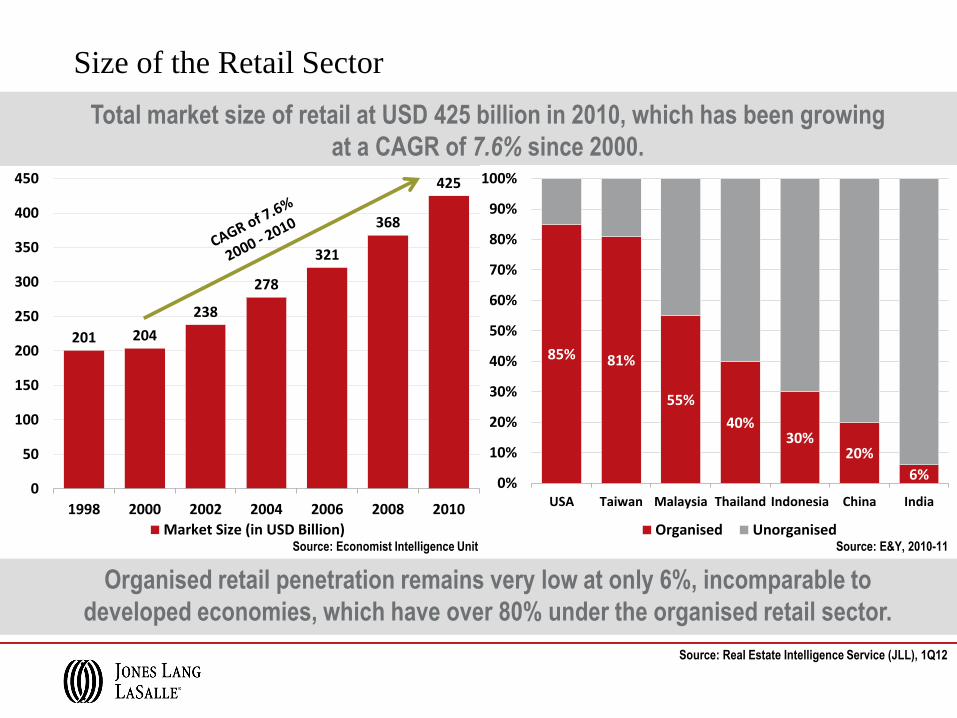
Size of the Retail Sector
Total market size of retail at USD 425 billion in 2010, which has been growing
at a CAGR of 7.6% since 2000.
85% 81%
55%
40%30%
20%
6%0%
10%
20%
30%
40%
50%
60%
70%
80%
90%
100%
USA Taiwan Malaysia Thailand Indonesia China India
Organised Unorganised
Organised retail penetration remains very low at only 6%, incomparable to
developed economies, which have over 80% under the organised retail sector.
Source: Economist Intelligence Unit Source: E&Y, 2010-11

India - Growth of Organised Retail
Easy Access to
Credit
Rapid
Urbanisation
Expected
Economic
Growth
7-8%
Young
Demographics
with Rising
Income
Rise in Brand
Consciousness
Pressing need
to improve
supply-chain
efficiencies
Hypermarkets
to dominate
organised
retail sector
Relaxation in
Policy to
Support
Investments
Share of organised retail slated to grow from 6% in 2010 to 9% by 2015 and to
20% by 2020
Source: Real Estate Intelligence Service (JLL), 1Q12

The Growth of Retail Malls

The Growth of Retail Malls
As of December 2008, there were 173 malls expected to become operational
during 2009-2011 in the top seven cities @ 1 mall per week!
Source: Real Estate Intelligence Service (JLL), 1Q12
Note: Figures represent the top seven cities of India – Mumbai, NCR-Delhi, Bangalore, Chennai, Pune, Hyderabad and Kolkata.

Rationalisation of Mall Supply (2008)
As of December 2008, there were 173 malls expected to become operational
during 2009-2011 in the top seven cities @ 1 mall per week!
FORECAST
Source: Real Estate Intelligence Service (JLL), 1Q12
Note: Figures represent the top seven cities of India – Mumbai, NCR-Delhi, Bangalore, Chennai, Pune, Hyderabad and Kolkata.

3.4 3.8 3.7
9.48.5
6.3
17.3
13.9
20.0
0
5
10
15
20
25
30
2004 2005 2006 2007 2008 2009 2010 2011 2012 2013 2014
(mill
ion
sq
ft)
Supply as of End-2009
Rationalisation of Mall Supply (2009)
Only 25% of the projected supply in 2009 became operational. Several malls
were delayed, while some in initial stages were shelved or converted.
FORECAST
Source: Real Estate Intelligence Service (JLL), 1Q12
Note: Figures represent the top seven cities of India – Mumbai, NCR-Delhi, Bangalore, Chennai, Pune, Hyderabad and Kolkata.

3.4 3.8 3.7
9.48.5
6.3 6.9
19.3
13.812.3
0
5
10
15
20
25
30
2004 2005 2006 2007 2008 2009 2010 2011 2012 2013 2014
(mill
ion
sq
ft)
Supply as of End-2010
Rationalisation of Mall Supply (2010)
As retail became the last to recover among the real estate sectors, 60% of the
projected supply of 2010 was also delayed to 2011.
FORECAST
Source: Real Estate Intelligence Service (JLL), 1Q12
Note: Figures represent the top seven cities of India – Mumbai, NCR-Delhi, Bangalore, Chennai, Pune, Hyderabad and Kolkata.
3.4 3.8 3.7
9.48.5
6.3 6.9
13.812.0
9.5
17.2
0
5
10
15
20
25
30
2004 2005 2006 2007 2008 2009 2010 2011 2012 2013 2014
(mill
ion
sq
ft)
Supply as of End-2011
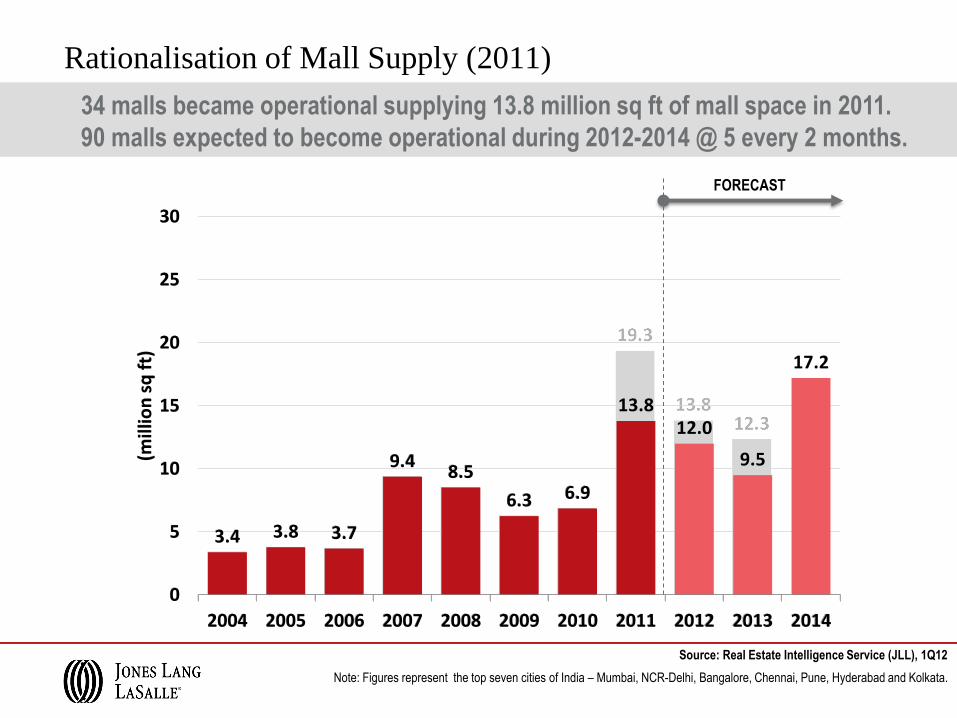
Rationalisation of Mall Supply (2011)
34 malls became operational supplying 13.8 million sq ft of mall space in 2011.
90 malls expected to become operational during 2012-2014 @ 5 every 2 months.
FORECAST
Source: Real Estate Intelligence Service (JLL), 1Q12
Note: Figures represent the top seven cities of India – Mumbai, NCR-Delhi, Bangalore, Chennai, Pune, Hyderabad and Kolkata.

Source: Real Estate Intelligence Service (JLL), 1Q12
Absorption of retail space more than doubled to reach 10.7 million sq ft. Supply in 2012 is near
completion, while half of the supply of 2013 and most in 2014 have high construction risks.
Note: Figures represent the top seven cities of India – Mumbai, NCR-Delhi, Bangalore, Chennai, Pune, Hyderabad and Kolkata.
Supply and Demand of Retail Mall Space 3
.8 4.1
9.4
8.5
6.3 6
.9
13
.8
12
.0
8.4
14
.2
2.8
3.7
9.6
6.6
4.0 4.0
10
.7
8.1
7.1
10
.1
0%
4%
8%
12%
16%
20%
24%
28%
32%
0
2
4
6
8
10
12
14
16
2005 2006 2007 2008 2009 2010 2011 2012F 2013F 2014F
New Completions Net Absorption Vacancy
FORECAST
Completed
Ready for Fit-Outs
50%-100% Structure
Ready
Less than 50%
Structure Ready
Excavation / Upto
Plinth
Proposed

Source: Real Estate Intelligence Service (JLL), 1Q12
Hyderabad and NCR-Delhi have several malls under construction, but a significant
portion is under initial stages. Mumbai, Pune, Chennai and Bangalore have few malls in
the supply pipeline. Thus, there is a severe crunch of suitable mall space for retailers.
Status of Construction of Upcoming Retail Malls

NCR-Delhi
Mumbai
Bangalore
Chennai
PuneHyderabad Kolkata
0
5
10
15
20
25
30
0% 5% 10% 15% 20% 25% 30% 35% 40%
Sto
ck (
mill
ion
sq
ft)
Vacancy (%)
NCR-Delhi and Mumbai lead
others by a huge margin in
terms of operational retail
stock; have high vacancies in
secondary districts. Kolkata, Hyderabad, Chennai
and Bangalore have relatively
low stock and low vacancy.
These cities have considerable
activity on high streets.
NCR-Delhi and Mumbai constitute two-thirds of pan India retail mall space.
Considerable retail activity remains on the traditional high streets of India.
1Q12 4Q13F
Source: Real Estate Intelligence Service (JLL), 1Q12
Retail Trends: Stock vs Vacancy 1Q12
PA
N-I
ND
IA
VA
CA
NC
Y

NCR-Delhi
Mumbai
Bangalore
Chennai
Pune
Hyderabad
Kolkata
0
5
10
15
20
25
30
0% 5% 10% 15% 20% 25% 30% 35% 40%
Sto
ck (
mill
ion
sq
ft)
Vacancy (%)
Note: 4Q13F values for stock and vacancy rate are REIS forecasted values
Source: Real Estate Intelligence Service (JLL), 1Q12
NCR-Delhi expected to remain dominant with over 25 million sq ft of operational mall
space by end-2013. Vacancies are expected to increase in the short term due to supply-
absorption mismatch.
1Q12 4Q13F
Malls expected to
become operational
in 2012 and 2013
will increase stock in
Mumbai and NCR
3.3 million sq ft of
expected supply till
2013 in Chennai
Retail Trends: Stock vs Vacancy 4Q13F
PA
N-I
ND
IA
VA
CA
NC
Y

Source: Real Estate Intelligence Service (JLL), 1Q12
Good quality malls enjoy high occupancy levels while poor quality malls continue to
struggle with high vacancy as they fail to garner retailer interest.
Retail Trends: Polarisation of Demand
• Success chases success. Retailers are
interested in taking spaces in only through
those malls that attract higher footfalls and
have a healthy footfall-to-sales conversion
ratio.
• Superior Grade Malls offer
good location
lease-only model
experienced developer profile
professional mall management
active tenant mix management
Superior
Grade
Average
Grade
Poor
GradeAll
NCR-Delhi 6% 28% 40% 25%
Mumbai 10% 34% 47% 23%
Bangalore 2% 17% 33% 9%
Chennai 0% 29% NA 14%
Pune 17% 18% 21% 18%
Hyderabad 4% 6% 12% 6%
Kolkata 6% 28% 45% 21%
India 7% 26% 39% 20%
Vacancy in Operational Malls

Source: Real Estate Intelligence Service (JLL), 1Q12
After declining sharply in 2009, rents remained stable for most parts of 2010. They have since
recovered gradually in several markets, but remain near cyclical lows.
Movement of Rental Values (1Q08 – 1Q12)
Simple Average of % Q-o-Q Change in Rental Values of Constituent Micro-Markets
Rental
Movement
1Q08 2Q08 3Q08 4Q08 1Q09 2Q09 3Q09 4Q09 1Q10 2Q10 3Q10 4Q10 1Q11 2Q11 3Q11 4Q11 1Q12 2012 2013 2014 1Q08-4Q14F
NCR-Delhi 0.0% -3.0% -9.8% -21.1% -12.1% -8.4% -8.7% -5.8% -3.9% 0.0% 0.0% 0.7% 1.6% 1.3% 0.9% 0.0% 1.7% 5.0% 6.4% 6.3%
Mumbai 1.1% 0.0% -14.5% -15.3% -12.2% -5.4% -3.0% 0.0% 0.0% 0.0% 0.0% 0.0% 2.4% 1.8% 2.9% 0.4% 1.4% 4.3% 6.0% 7.1%
Bangalore 0.0% 0.0% -2.6% -8.0% -7.6% -5.8% -2.7% -1.5% 0.0% 0.0% 0.0% 0.0% 3.5% 1.3% 0.0% 0.0% 1.4% 4.4% 6.4% 6.7%
Pune 0.0% 0.0% -16.6% -7.9% -5.6% 0.0% 0.0% 0.0% 0.0% 0.0% 2.4% 0.9% 1.3% 1.6% 1.1% 0.0% 1.9% 5.4% 6.6% 7.2%
Hyderabad 0.0% 0.0% -11.3% -13.9% 0.0% -6.5% 0.0% 0.0% 0.0% 0.0% 0.0% 0.8% 0.0% 0.0% 0.0% 0.0% 1.0% 2.9% 3.9% 4.8%
Kolkata 2.6% 1.9% -8.2% -12.7% -10.9% -2.6% -1.9% 0.0% 0.0% 0.8% 0.0% 0.9% 0.7% 0.6% 2.4% 3.5% 1.2% 4.0% 5.8% 4.0%
ANNUAL FORECASTGROWTH
SLOWING
RENTS
DECLINING
RENTS
RISING
DECLINE
SLOWING
The Recipe for Success

Source: Real Estate Intelligence Service (JLL), 1Q12
Average size of a shopping mall in India has been increasing due to developers focusing on
larger shopping malls. Success of a mall does depend on its size, as superior grade malls are
nearly double the size of average grade malls.
Average Size of Shopping Mall
Note: Figures represent the top seven cities of India – Mumbai, NCR-Delhi, Bangalore, Chennai, Pune, Hyderabad and Kolkata.
-
2,00,000
4,00,000
6,00,000
8,00,000
10,00,000
12,00,000
20
01
20
02
20
03
20
04
20
05
20
06
20
07
20
08
20
09
20
10
20
11
20
12
20
13
20
14
20
15
20
16
20
17
(Ave
rage
Siz
e in
sq
ft)
-
1,00,000
2,00,000
3,00,000
4,00,000
5,00,000
6,00,000
20
01
20
02
20
03
20
04
20
05
20
06
20
07
20
08
20
09
20
10
20
11
20
12
20
13
20
14
20
15
20
16
20
17
(Ave
rage
Siz
e in
sq
ft)
For Malls
Becoming
Operational
in a
Particular
Year
For All
Operational
Malls
Crosses 200,000 sq ft
in 2007
Expected to cross
300,000 sq ft by 2014
200,000
2001 - 2006
300,000
2007 - 2010
400,000
2011 - 2013
700,000?
2014 - 2017
Superior Grade
440,000 sq ft
Average Grade
190,000 sq ft
Poor Grade
150,000 sq ft
Average Size of

What makes a mall successful in India?
Leasable
Area
Vacancy
Prime locations, but
not necessarily at the
centre of the city
Location
50% of the malls have at least
one anchor store with area
greater than 60,000 sq ft
Anchor Store
Professional Mall
Management Services Adequate Parking
Multiplex essential to
ensure sufficient foot-
falls
Entertainment
Ample Mall Amenities
From the analysis of 20 successful malls across major Indian cities
| Ambi Mall, Vasant Kunj, Delhi | Ambience Mall, Gurgaon | City Centre, Kolkata | DLF Emporio, Delhi | Express Avenue, Chennai |
Forum Mall, Bangalore | GVK One, Hyderabad | High Street Phoenix, Mumbai | Inorbit, Hyderabad | Inorbit, Malad, Mumbai | Inorbit,
Vashi, Mumbai | Korum Mall, Thane | Mantri Square, Bangalore | MGF Metropolitan, Gurgaon | Oberoi Mall, Mumbai | Pacific Mall,
Delhi | R-City Mall, Mumbai | Select City Walk, Delhi | South City Mall, Kolkata | The Great India Place, Noida |
600,000 –
800,000 sq ft
Less than 5%

Future Formats of Retail Real Estate in India

Retail Formats – Ushering an Era of Collaboration
Destination Retailing
Rural Retailing
Mixed Use Formats
Tourism Retailing
Luxury Retailing
Integrated residential
townships
Hotel-and-luxury retail
Office-and-convenience
retail
Lack of luxury malls
Luxury brands
limited to Tier I on
high-streets or Five-
Star Hotels
Recreational
shopping
precincts
Organised retail for
70% of India’s
population
Retail development at
tourist hubs
Partnership with
government
Industry will experiment with several organised retail formats by collaborating with multiple
stakeholders
Source: Real Estate Intelligence Service (JLL)
Source: Real Estate Intelligence Service (JLL)
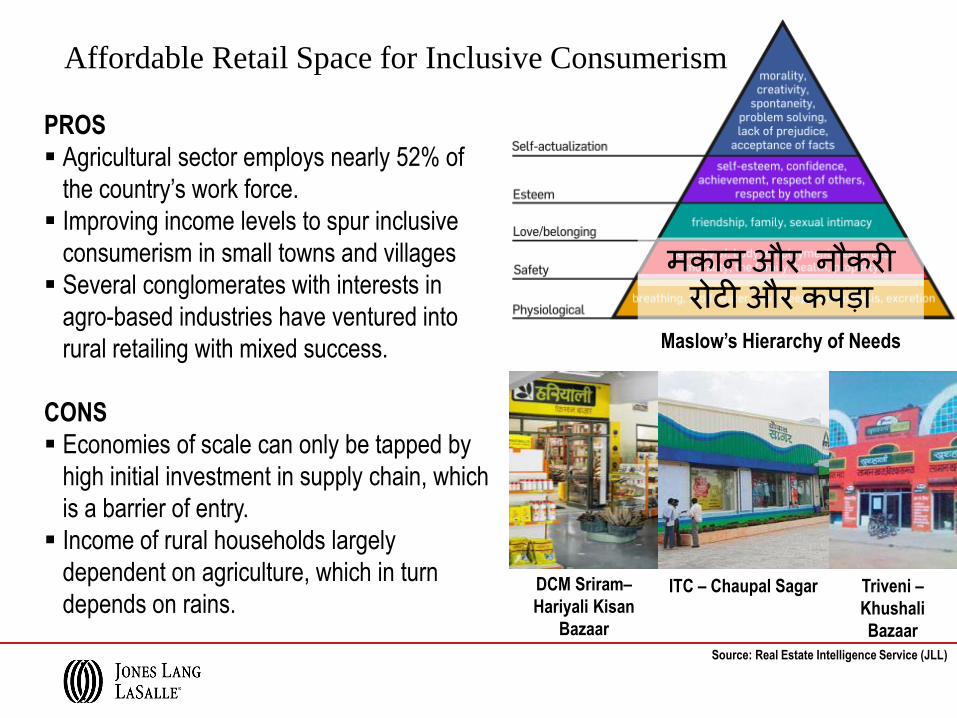
Affordable Retail Space for Inclusive Consumerism
DCM Sriram–
Hariyali Kisan
Bazaar
ITC – Chaupal Sagar Triveni –
Khushali
Bazaar
PROS
Agricultural sector employs nearly 52% of
the country’s work force.
Improving income levels to spur inclusive
consumerism in small towns and villages
Several conglomerates with interests in
agro-based industries have ventured into
rural retailing with mixed success.
CONS
Economies of scale can only be tapped by
high initial investment in supply chain, which
is a barrier of entry.
Income of rural households largely
dependent on agriculture, which in turn
depends on rains.
मकान और नौकरी
Maslow’s Hierarchy of Needs
रोटी और कपडा
Copyright © Jones Lang LaSalle, 2011
Jones Lang LaSalle Research Real Estate Intelligence Service Research Advisory
Leads the industry in India. Drawing on a
wide spectrum of expertise, we provide clients
with best-in-class market insights that allow
you to optimize your real estate strategies and
mitigate risks.
The REIS is a subscription-based service
providing comprehensive market monitoring,
analysis and forecasts across major
institutional-grade real estate markets
throughout the Asia Pacific region.
The Research team offers tailored advisory
services for investors, developers and
occupiers at the local, regional and global
levels.
For more details, contact:
Ashutosh Limaye
Head of Research and Real Estate Intelligence Service
Himadri Mayank
Assistant Vice President, Research and Real Estate Intelligence Service