state of the industry report -...
TRANSCRIPT

Implications for Foodservice
Equipment & Supplies Manufacturers
September 2014
State of the Industry Report


1
Perspective
The 2014 State of the Industry Report, powered by research and information gleaned from
industry-leading research organization, Technomic, delves into issues impacting foodservice
operations, and, the implications of such on equipment and supplies purchases.
What consumer behaviors and attitudes impact menu and culinary trends? What are the
implications for equipment and supplies manufacturers? Read on for ideas, information and
opportunities.

2
Today’s Consumer
The success of the foodservice industry is ultimately driven by the consumer. Consumer
financial well-being is critical to understanding the broader trends and issues impacting the
industry as a whole, and the equipment and supplies manufacturer in particular.
According to the Conference Board, consumer confidence stood at 90.9 in July, up four points
from June. Sentiment is holding more or less steady, and is well above the doldrums during
and after the great recession. However, while consumers appear to be getting more
confidence in the overall situation and that of the broader economy, today’s numbers are not
those typical of an expansionary period. This indicates consumers do not fully believe that the
economy has recovered and are constraining their spending as a result.
Base: 1985 = 100
Source: Conference Board
Jul '07111.9
Jul '1490.9
0
20
40
60
80
100
120
Jan '06 Jan '07 Jan '08 Jan '09 Jan '10 Jan '11 Jan '12 Jan '13 Jan '14
Consumer Confidence – U.S. Index

3
Today’s Consumer
Over time, Technomic has found that the growth in disposable personal income provides the strongest correlation to overall foodservice industry growth. Disposable personal income, inflation, and an increase in food prices all impact consumer confidence. Disposable personal income was up 1.9 percent in May 2014 over May 2013. The average disposable income growth has been less than 1 percent over the past several years, which strongly correlates to sluggish industry growth.
Technomic keeps a close eye on both the unemployment and the under-employment rate since the level of employment is key to understanding broader consumer financial health and the ability to spend money on dining out. While the unemployment rate dropped to 6.1 percent in June, its lowest since July 2008, under-employment remained a concern. In June, the under-employment rate, with under-employment defined as individuals working in positions insufficient in the level of skill required, hours worked or level of compensation, stood at 12.1 percent. Under-employment compresses disposable personal income.
-4%
-2%
0%
2%
4%
6%
8%
May
'06
May
'07
May
'08
May
'09
May
'10
May
'11
May
'12
May
'13
May
'14
Disposable Income % Real Change vs. Prior Year

4
Today’s Consumer
Since spring, jobs have been growing and production has been on the upswing. Although core
inflation remains low, “non-core” inflation – for energy and food – has been rising. Consumers
are slow to regain confidence. Nearly 45 percent of all consumers surveyed report eating away-
from-home more than once a week, with another 22 percent reporting they have eaten out at
least once a week. Only 14 percent eat away-from-home once a month or less, and consumers
remain very cautious.
While foodservice has become ingrained in many consumers’ daily activities, many have not
increased spending and even more are spending less. Additionally, the recovery has not been
uniform. Higher-income consumers have recovered much more quickly than low-income
consumers, which has had an impact on the growth of various foodservice channels.
Most Consumers Use Foodservice at Least Once a Week
5
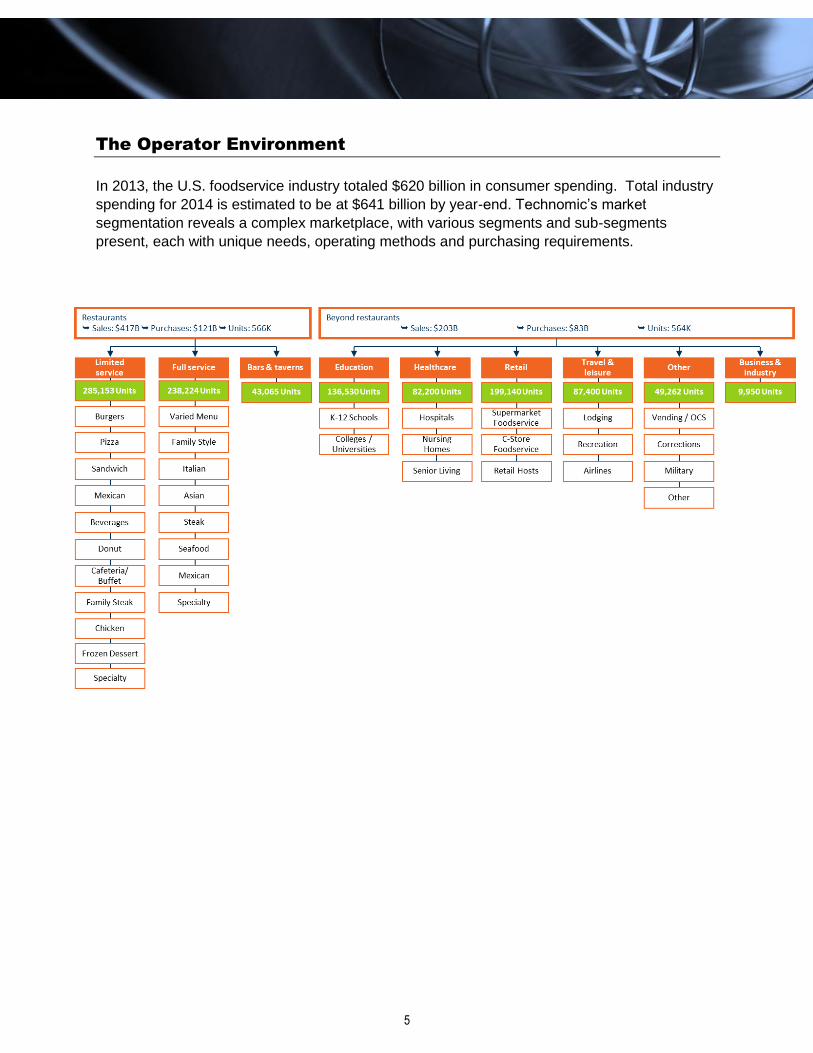
The Operator Environment
In 2013, the U.S. foodservice industry totaled $620 billion in consumer spending. Total industry
spending for 2014 is estimated to be at $641 billion by year-end. Technomic’s market
segmentation reveals a complex marketplace, with various segments and sub-segments
present, each with unique needs, operating methods and purchasing requirements.

6
The Operator Environment
Chains continue to dominate the industry in the restaurant sector. In 2013, the current year for
which Technomic has full-year data, the top 100 limited- and full-service chains controlled 49
percent of the $448 billion restaurant business. Further, the top 500 chains experienced a less
severe decline than independents, weathering the recession better than other foodservice
outlets. And while chains have been growing faster than the broader restaurant industry,
franchising has been the preferred source of growth, since it’s less risky for the corporate
parent.
The top 500 chains by U.S. sales account for almost $6.00 out of every $10.00 taken in
nationally, although they represent only four out of 10 restaurant locations. The limited-service
sector, dominated by large chains, comprises 83 percent of limited-service sales and 65 percent
of unit locations. Full service is still led by independent restaurants and regional companies,
with big chains accounting for only 33 percent of sales and 17 percent of locations.
.
Total 2013 Restaurant
Industry: $448 billion Sales Growth vs. Previous Year
Share of Restaurant Sales Share of Restaurant Units

7
The Operator Environment
Growth for the top 10 largest chains, for both full- and limited-service restaurants – especially
full service – has been hampered by strong economic headwinds and a consumer desire for a
differentiated experience. As a result, much of the growth has occurred in small chains and
independents.
For years, same-store sales growth in limited-service restaurants has almost always beat that in
full service, indicating a general consumer demand for low-cost menu options and some
“trade down” effect. It’s also true that full-service restaurants, specifically casual dining, suffered
from a poor value equation, with consumers finding a lack of differentiation among many of the
larger chains.
Same-Store Sales

8
The Operator Environment
Within the top 500 limited-service restaurants, key trends emerged. Fast-casual Asian/noodle
and bakery café sectors were the fastest growing, along with coffee cafes.
Limited-service sales growth, beating that of the full-service restaurant sector, is a bit more
complex. In full service, with demand driven by affluent consumers and business travelers,
expensive steakhouses exceeded all other menu clusters in growth. Varied-menu chains also
beat the segment average.
With that in mind, fast casual ― with concepts such as Qdoba, Panera, Five Guys and Chipotle
― and contemporary casual concepts ― such as Yard House, Maggianos, The Cheesecake
Factory and Seasons 52 ― are best positioned for growth.

9
The Operator Environment
Within the context of this report, it is important to keep in mind that the U.S. foodservice industry
has been in a prolonged period of flat to declining growth. In general, the industry is mature.
Expectations for growth through 2016 suggest that real growth, i.e. case or volume growth, will
be just over 1 percent for the next three years. As with any statistic, certain segments will
outperform this variable.
Given the uncertainties facing operations and consumers, most nominal industry sales growth
comes from inflation, with a return to 1 percent plus real growth in 2015. Sectors beyond
restaurants will do better than the commercial restaurant industry based on changes to the
menu and traffic mix. Limited-service restaurants are likely to see real sales flat in 2014 and up
1 percent in 2015, while full-service restaurant real sales are more likely to contract this year
and bounce back next year.
Total U.S. Foodservice Industry Growth 2001-2014 (P)
Nominal and real percentage

10
Foodservice E&S
As reported in NAFEM’s 2014 Size & Shape of the Industry Study, the overall foodservice
equipment and supplies market for 2013 totaled approximately $9.9 billion, up from $9 billion in
2011 and $8.1 billion in 2009.
From a growth perspective, and compared to 2011 figures, food preparation equipment was the
fastest growing category, up nearly 10 percent over the two-year period. Refrigeration and ice
machines grew 9 percent, while primary cooking equipment was up nearly 6 percent.
Equipment & Supplies Category
2013 sales
($000,000)
Refrigeration & Ice Machines $2,422.6
Primary Cooking Equipment $2,030.0
Serving Equipment $1,162.5
Tabletop & Servingware $1,081.6
Warewashing, Janitorial & Safety
Equipment
$808.1
Storage & Handling Equipment $699.9
Furnishings, Décor & Custom Fabrication $643.0
Smallwares, Cookware & Kitchen Tools $620.2
Food Preparation Equipment $474.5
Total E&S sales ($B)

11
Foodservice E&S
Equipment & Supplies Category
Compound Annual
Growth (2011-2013)
Food Preparation Equipment 9.7%
Refrigeration & Ice Machines 9.0%
Primary Cooking Equipment 5.9%
Furnishings, Décor & Custom
Fabrication
5.4%
Tabletop & Servingware 4.7%
Storage & Handling Equipment 4.6%
Smallwares, Cookware & Kitchen Tools 3.7%
Warewashing, Janitorial & Safety Equip. 1.4%
Serving Equipment 0.9%
While the NAFEM 2014 Size & Shape of the Industry Study provides detailed information by
product category, it is important to place the size of these categories into context.
Technomic continually monitors the broader foodservice industry and has identified eight key
drivers impacting both consumer spending and front- or back-of-the-house foodservice
operations. These macro-level trends also impact how equipment and supplies manufacturers
could respond to customer needs.
Overall, it is important to realize that regardless of the segment, all foodservice operators have
common concerns such as costs, sales and margins. Human-asset issues also are on the rise.
Interestingly, as consumers call for “fresh” and “hand-crafted,” labor issues and costs dictate a
greater need for automated equipment.
Similar issues impact the equipment and supplies world. Rising costs, the need for profitability
enhancement, labor challenges, freshness as a quality driver, customization, an increasing
focus on ethnic foods, continued interest and focus around “health,” and sustainability and
social responsibility, all factor into discussions on equipping foodservice kitchens worldwide.
Existing restaurant and foodservice outlets generally are not seeing “organic” sales growth. In
fact, many casual-dining chains actually are watching same-store sales declines. Stagnant
growth conditions mean many foodservice operators are seeing little to no top-line sales growth.
Focusing on maintaining profitability has been critical, which by definition, has meant an
extreme focus on cost containment or reduction.
With a lack of “real” growth and higher traffic counts, operators are discounting to a much
greater degree. While this may or may not provide a traffic lift, it does bring in a much less
profitable guest, leading further to profitability issues.

12
Foodservice E&S
There’s no question that rising costs are the number one concern. Customers are still slow to
spend, and operators are unwilling to raise prices. Maintaining profitability is critical as top-line
sales growth is challenged.
Issue E&S Implications
Rising cost
and need for
profitable
growth
Investment is occurring to keep up with
trends. Being able to show return on
investment including labor savings,
energy efficiency, and more, is critical.
Operators also may delay purchases
on specific types of equipment if it is
not perceived as absolutely necessary.
Labor challenges continue among all foodservice segments, most notably finding and retaining
qualified labor. Of operators surveyed, 64 percent list retention as the most critical issue, with
60 percent citing recruiting a critical concern. Beyond finding and retaining good employees,
many operators are facing a potential cost increase due to legislation such as the Affordable
Care Act and pending action on minimum wage. In Technomic’s 2014 operator survey, half of
restaurateurs and 61 percent of all foodservice operators, including those in on-site sectors,
said a minimum wage increase to $10 an hour would have a negative effect on business.
Issue E&S Industry Implications
Labor
challenges
Provide solutions to reduce labor costs
with a focus on ease of use and simple
maintenance.
Automation can reduce overall labor
costs.

13
Foodservice E&S
More than half the surveyed consumers say customization – allowing the consumer to tailor their meal to their personal taste preferences – is a growing trend. The demand for customization also related to the larger trend of consumers demanding what and how they want it, when they want it. To wit, there’s an increase in all-day snacking, all-day breakfasts, staggered portions, and build-your-own concepts (sandwiches, burritos, pizzas, etc.). Consumers expect to be able to customize their order at the point-of-purchase. Much of the fast-casual marketplace has incorporated customization into their operations. This trend is expected to continue.
Issue E&S Industry Implications
Need for
customization
Equipment that enhances
customization – hot/cold
merchandisers, prep tables, under-
counter refrigeration, etc., – to take
advantage of the trend.
Accelerated cooking equipment is
a natural fit to assist in point-of-
purchase customization.
Food on the go, referred to as grab-n-go, represents a small but critical element of successful
foodservice programs, and growth is expected to outpace that of overall foodservice outlets over
the next three years. Technomic typically defines grab-n-go as pre-packaged, ready-to-eat
prepared food requiring no customer assembly or preparation. These are self-service offerings
sold in heated or chilled merchandisers.
The total grab-n-go market grew 3.6 percent annually between 2010 and 2013, with the concept
in colleges/universities, supermarkets, hotels and mass merchandisers/club stores, outpacing
the overall growth rate.
Issue E&S Implications
Convenience/
grab-n-go
Display and holding equipment, as
well as take-out packaging and
monitoring devices, are all growth
areas for this segment.

14
Foodservice E&S
Flavor also has gained ground. Two thirds of consumers say savory flavors appeal to them,
down slightly from 72 percent of consumers in 2009. All other flavors indicate a slight-to-
moderate increase in consumer interest from 2009, especially salty and smoky flavors. Spicy,
though not seeing as much growth, is the second most appealing flavor, with 52 percent of
consumers now saying they like spicy foods. Operators are incorporating many of these flavors
through cooking and preparation methods such as smoking, marinating, grilling, roasting and
pickling.
Issue E&S Implications
Incorporating
new flavors
Global cuisines create the need for
authentic equipment such as a
vertical spits, smokers, well-
seasoned woks or tortilla presses.
Consumers are trending toward health-halo and looking for healthy food. Nearly 65 percent say
restaurants can offer healthy food that tastes good. A growing number of consumers want
healthy menus, and operators have responded with baked, steamed and other healthful
preparations. However, consumers still see dining out as an indulgence, so operators need
broilers, fryers and panini presses.
Millennials gravitate toward low-calorie, unprocessed, natural items, while Gen Xers want
organic, authentic, homemade creations. Boomers focus on all the lows – fat, salt, cholesterol,
carbohydrates – and premium, homemade dishes.
Issue E&S Implications
Continued
interest in
and focus
around
healthy
Prep cooks with colorful
ingredients at hand need
convenient storage and attractive
servingware.
Fryers, waffle irons, panini
presses, grills and sauté pans still
fit the bill, since dining out is a
consumer indulgence.

15
Foodservice E&S
While freshness is closely linked with the perception of healthy, it also is a critical component
when consumers gauge the overall quality and value of a foodservice establishment. Fresh is
the leading health-halo term, but interest in attributes such as natural and organic has been
increasing.
Issue E&S Implications
Freshness as
a primary
driver for
quality
Operators also need solutions for
storing seasonal ingredients and
displaying freshness.
Perceived freshness is often as
important as true freshness, and
display equipment plays a crucial
role.
With fresh, local and sustainable menu options growing in importance among consumers,
operations are balancing easy-holding frozen items with use-now fresh ingredients. At the
same time, their eco-friendly tactics include sustainable construction materials, energy-saving
equipment and waste-reduction strategies.
Issue E&S Industry Implications
Sustainability
and social
responsibility
Energy-saving and holding
equipment, use of post-consumer
waste, and anything that can be
reduced, reused or recycled, are
growth areas.

16
Conclusions
The foodservice industry remains in a period of challenged growth. The overall industry is
expected to grow by 3.3 percent in 2014 and 3.1 percent in 2015. And, there are a number of
bright spots, including the supermarket, lodging, and college/university segments, that are
expected to outperform the broader industry.
Overall, Technomic sees the following as impacting each NAFEM Size & Shape of the
Industry product category:
Categories Comments/Impact
Refrigeration & Ice Machines
One of the fastest growing E&S categories for the past two years.
Energy efficiency critical to maintain cost control.
With “fresh” positioning causing a shift toward “never frozen,” refrigeration
continues to benefit.
Ice machines can benefit from positive investment and experimentation in new
beverage programs.
Primary Cooking Equipment
On-trend preparation styles include grilling, sautéing, braising; equipment sales
reflecting these trends.
Frying remains a popular preparation technique as consumers still look to indulge.
Serving Equipment
Manufacturers need to demonstrate how serving equipment can positively impact
sales and generate ROI.
Many specific pieces of serving equipment benefit from high growth menu items –
specifically coffee and specialty coffee, next-generation beverages such as teas,
and juices, and the demand to customize at order.
Tabletop & Servingware New unit openings have slowed; operator sales will be generated from
replacement business or as units are “re-concepted.”
Operators may be reluctant to invest here unless there is a proven ROI.
Warewashing, Janitorial & Safety Equipment
Profitability drivers may mean operators try to prolong the life of warewashing
equipment; maintenance is key.
Cleanliness and food safety can often impact consumer attitudes and perceptions
of specific foodservice operations; equipment plays a role.
Storage & Handling Equipment Operator purchases will be driven by replacement, remodels.
Storage solutions that assist in front-of-house prep work can benefit from key
trends.
Furnishings, Décor & Custom Fabrication Much of the growth will be driven by remodels and unit openings.
Smallwares, Cookware & Kitchen Tools Pans, utensils and other items are not likely to outperform the industry.
Sauté pans win on the health trend.
Food Preparation Equipment
Fastest growing category over the past two years; grills, toasters and panini
presses all benefit from trends.
Fryers remain a critical component of a typical kitchen, although long-term trend
indicates frying will fall out of favor.


300 S. Riverside Plaza Suite 1200 Chicago, IL 60606 312-506-3827 [email protected] www.technomic.com
161 N. Clark St. Suite 2020 Chicago, IL 60601 312-821-0201 [email protected] www.nafem.org