state of the market 2020 - climate-kic
TRANSCRIPT

CORPORATE RENEWABLE POWER PURCHASE AGREEMENTS IN AUSTRALIA:
STATE OF THE MARKET 2020

About the Business Renewable Centre AustraliaThe Business Renewables Centre Australia (BRC-A) is a not-for-profit initiative that seeks to help accelerate the uptake of Renewable Energy Corporate Power Purchase Agreements (PPA) in Australia through facilitating industry networking and mitigating a range of knowledge gaps. The BRC-A is a joint collaboration between WWF-Australia, Climate-KIC Australia and the Institute for Sustainable Futures, University of Technology.
AcknowledgementsThis Project received funding from ARENA as part of ARENA’s Advancing Renewables Program. The views expressed herein are not necessarily the views of the Australian Government, and the Australian Government does not accept responsibility for any information or advice contained herein.
The BRC-A would like to acknowledge and thank its Funding Partners: • the Australian Renewable Energy Agency (ARENA);• Sustainability Victoria and the Victorian Department of Environment, Land, Water and Planning
(DELWP);• the New South Wales Department of Planning Industry and Environment• Trade and Investment Queensland
The BRC-A operates with the support and under licence from the United States Business Renewables Center developed by the Rocky Mountain Institute.
The BRC-A would like to extend gratitude to its Technical Advisory Panel (TAP), a group of industry experts and experienced corporate buyers of offsite renewable energy, for their continuing input into the development of the BRC-A Resource Library.
CitationPlease cite as Business Renewables Centre-Australia (2019) Corporate Renewable Power Purchase Agreements: State of the Market 2019.
Authors: Finnian Murphy (Climate-KIC Australia), Chris Briggs (Institute for Sustainable Futures, University of Technology), Jonathan Prendergast (University of Technology).
Cover Photo Credit: iamacoconut, GettyImagesPhoto p.4: American Public Power Association 2020, unsplash.comPhoto p.6: Milada Vigerova 2020, unsplash.com
Design & Layout: Jessica Hyne, Climate-KIC Australia

CORPORATE RENEWABLE POWER PURCHASE AGREEMENTS IN AUSTRALIA:
STATE OF THE MARKET 2020

TABLE OF CONTENTS
TABLE OF CONTENTS iv
LIST OF FIGURES vi
EXECUTIVE SUMMARY 1
INTRODUCTION 3
About the report 3
About the BRC-A 4
LARGE-SCALE RENEWABLE ENERGY IN AUSTRALIA 5
There is a large pipeline of renewable energy projects 5
WHAT IS A CORPORATE PPA? 6
THE GROWTH OF CORPORATE PPAs IN AUSTRALIA 7
The role of Corporate PPAs 9
Corporate PPAs with operational projects are growing - but they still mostly support new projects
10
How big are the deals? 10
NSW was the leading state for PPAs in 2019-20 11
Buyer sectoral composition remained diverse 11
Solar or wind? 11
KEY CORPORATE PPA TRENDS 12
The resilience of the Corporate PPA market 12
State and local governments are leading on Corporate PPAs as retailer investment falls
15
Corporate Renewable Power Purchase Agreements In Australia: State of the Market 2020
iv
Consolidation of a two-stream market: wholesale (large buyers) and retail (mid-sized buyers)
16
Other market trends to look out for 17
UNDERSTANDING BUYERS: PREFERENCES AND BARRIERS TO CORPORATE PPAs
19
Barriers to Corporate PPAs 19
Buyer preferences: What matters when buyers are evaluating PPAs? 22
BRC-A ACTIVITIES IN 2019-20 25
BRC-A impact to date 25
BRC-A Industry survey participants profile 26
BRC-A Events 29
BRC-A Marketplace Platform 30
BRC-A Resources 31
APPENDIX A: COMMUNITY BENEFITS 34
APPENDIX B: INDUSTRY SURVEY QUESTIONS 35
Energy Buyers 35
Developers 42
Service Providers 48
Corporate Renewable Power Purchase Agreements In Australia: State of the Market 2020
v

LIST OF FIGURESFigure 1: Annual Growth of Large-Scale Renewables (MW) ......................................................................... 5
Figure 2: Large-Scale Renewable Energy - Project Pipeline (MW) ............................................................ 5
Figure 3: Corporate PPAs, Volume of Contracts (MW) .................................................................................. 7
Figure 4: PPA Market Segments, 2018-20 ........................................................................................................ 9
Figure 5: Utility vs Non-Utility PPAs (MW) ......................................................................................................... 9
Figure 6: How many Corporate PPAs support new projects? ................................................................... 10
Figure 7: How much capacity is contracted by Corporate PPAs with new projects? .......................... 10
Figure 8: Corporate PPAs segments by size ................................................................................................. 10
Figure 9: Corporate PPAs by state (MW) .......................................................................................................... 11
Figure 10: Number of Corporate PPAs by sector (%) .................................................................................... 11
Figure 11: Corporate PPAs, Solar and Wind Farms, 2019-20 (MW, %) ....................................................... 11
Figure 12: COVID-19 Impact on Corporate PPA buyer demand - Developers ...................................... 12
Figure 13: COVID-19 Impact on Corporate PPA buyer demand - Service Providers ........................... 13
Figure 14: COVID-19 Impact on Corporate PPA buyer demand - Buyers ............................................... 13
Figure 15: Respondents by PPA stage ............................................................................................................. 14
Figure 16: PPA Deal Pipeline, Survey Respondents ..................................................................................... 14
Figure 17: PPA Deal Types, 2019-20 (#, %) ..................................................................................................... 16
Figure 18: PPA Deal Types, 2019-20 (MW, %) ................................................................................................. 17
Figure 19: PPA Deal Types, 2019-20 (Volume in MW) ................................................................................. 17
Figure 20: How hard are Corporate PPAs? .................................................................................................... 19
Figure 21: How high are the transaction costs for Corporate PPAs? ...................................................... 20
Figure 22: Corporate PPAs, Process Duration ............................................................................................. 20
Figure 23: What is the major barrier to a PPA (current buyers)? ............................................................. 20
Figure 24: Major barriers in PPA procurement process for experienced PPA Buyers ....................... 21
Corporate Renewable Power Purchase Agreements In Australia: State of the Market 2020
vi

Figure 25: Major barriers in PPA procurement process for Developers and Service Providers ..... 21
Figure 26: Key Factors for PPA Buyers, Average Rating ........................................................................... 22
Figure 27: How Important is Developer reputation? ................................................................................... 22
Figure 28: Importance of price to PPA buyers ............................................................................................. 23
Figure 29: Importance of financial risks to PPA buyers ............................................................................. 23
Figure 30: Importance of local community support for PPA buyers ....................................................... 24
Figure 31: Importance of community benefits for PPA buyers ................................................................. 24
Figure 32: Importance of impacts on local environment and biodiversity for PPA Buyers .............. 24
Figure 33: Buyer respondent annual electricity loads (%) ......................................................................... 26
Figure 34: BRC-A membership proportion by region ................................................................................. 26
Figure 35: Economic sector distribution of Buyer members .................................................................... 27
Figure 36: Buyer respondent employee count (%) ...................................................................................... 28
Figure 37: Buyer respondents’ current level of renewable energy (#) .................................................. 28
Figure 38: Developer respondent employee number (%) ......................................................................... 29
Figure 39: Developer respondent pipeline ................................................................................................... 29
Figure 40: BRC-A Buyer’s Roadmap ................................................................................................................ 31
Figure 41: Average rating out of 5 on Importance of jobs and other benefits for disadvantaged groups ..................................................................................................................................................................... 34
Figure 42: Importance of jobs and other benefits for disadvantaged groups, rating out of 5 ........ 34
Figure 43: Average rating out of 5 on importance of local employment and industry ...................... 34
Figure 44: Importance of local employment and industry, rating out of 5 ............................................ 34
Corporate Renewable Power Purchase Agreements In Australia: State of the Market 2020
vii

EXECUTIVE SUMMARYThe emergence and growth of Corporate Renewable Power Purchase Agreements (Corporate PPAs1) has been one of the major changes to the market for large-scale renewable energy. Since 2017, we estimate there have been 79 Corporate PPAs negotiated, contracting 3 GW of renewable energy generation.2 Over half of Corporate PPAs have been made with new solar and wind farms.
The growth in Corporate PPAs has diversified the market for large-scale renewable energy. Not long ago, Utility PPAs with electricity retailers were effectively the only buyer option for off-take agreements – but Corporate PPAs are now playing an important role in energy transition. As retailer PPAs slow now their legislated purchase obligations under the Renewable Energy Target have been met, Corporate PPAs are playing a leading role in supporting new investment in renewable energy. Corporate PPAs have consistently accounted for 30-50 per cent of PPA investment quarter-on-quarter during 2019-20.
In our State of the Market report, we highlight three key trends or features of the market during 2019-20:
• The resilience of the Corporate PPA market: amidst the turbulence of Covid-19 – described by the International Energy Agency as ‘causing more disruption to the energy sector than any other event in recent history’3 – 2020 has already proved a record year for Corporate PPAs, with more than 1,000 MW of renewable power purchased as at mid-November 2020. Corporate PPAs have accounted for more than a third4 of energy contracted during the year, constituting $2.4B5 in total value of large-scale renewable capacity sold in PPAs. Whilst Covid-19 and associated impacts such as lower wholesale electricity prices have reduced buyer demand, BRC-A’s annual survey of the PPA market finds only modest impacts and that there remains a significant pipeline of deals under development. The resilience of the Corporate PPA sector through a recession says they are here to stay.
• State and Local Governments are playing a leading role in the Corporate PPA market: as retailer investment in renewable PPAs has fallen, Corporate PPAs and governments have stepped up. The return of Government is not a return to centralised planning, but instead the development of new strategies to facilitate Corporate PPAs. Whether as retailing intermediaries on-selling PPAs, anchor buyers facilitating deals for other buyers to join or aggregators of buyer groups, governments are playing a leading role in the growth of Corporate PPAs.
1. This report refers to Corporate PPAs and PPAs interchangably throughout.2. These figures are drawn from BRC-A’s PPA database based on publicly available information. Industry participants inform us that there are some PPAs that are not public.3. International Energy Agency (2020) World Energy Outlook, p.17.4. This figure is likely closer to 35% due to lack of data availability on several PPAs announced in late 2020.5. PPA data drawn from BRC-A PPA database; capacity costs from Graham, P., Hayward, J., Foster, J. and Havas, L. 2019, GenCost 2019-20: preliminary results for stakeholder review CSIRO, Australia, p. 35.
Corporate Renewable Power Purchase Agreements In Australia: State of the Market 2020
1
• Consolidation of a dual market for large and mid-sized buyers: the divergent preference of large buyers for Wholesale PPAs directly with solar and wind farms and mid-sized buyers for Retail PPAs intermediated by a retailer has consolidated into dual market segments.
Our annual survey collects information on the key barriers to Corporate PPAs and processes. The major findings were:
• PPAs remain a challenging undertaking with most buyers and developers rating the difficulty high or very high - though transaction costs are generally rated moderate to high.
• The major barriers to PPA execution are internal to buyer organisations: buyer understanding and building organisational support for PPAs are more challenging than the external market environment.
• PPAs take time: one-third of buyers said their process was less than a year – but for almost half of buyers it was longer than 18 months.
For this year’s survey, we also collected data on buyer preferences and criteria when evaluating PPA deals from buyers, developers and service providers.
Buyers, developers and service providers told us that:
• Price and risk are the most important factors for buyers followed by developer reputation. This much might be expected but developers over-estimate the importance of price and under-estimate the importance of risk to buyers.
• Community support and benefits from PPAs and environment and biodiversity are more important to buyers than developers recognise. Whilst less important than price, community and environmental factors are much more important for buyers than developers think.
• Community support and benefits from PPAs are becoming more important to buyers: what’s more, whereas developers think they are becoming less important, the rating from current PPA buyers relative to past buyers is significantly higher.
• Across most categories, service providers were notably more accurate in their assessments of buyer preferences than developers.
It’s been a tough year but through the tumult Corporate PPAs have continued to grow. Amongst our members who answered the survey, the level of demand amongst buyers pursuing PPAs is 400 – 600 MW and buyers interested in PPAs is 100 – 150 MW.
Corporate Renewable Power Purchase Agreements In Australia: State of the Market 2020
2
INTRODUCTIONUnder a Corporate Renewable PPA, electricity buyers agree to buy power and/or Large-scale Generation Certificates (LGC) from a renewable energy project (currently solar or wind farms) at a fixed price over medium and long terms.
The key drivers for Corporate PPA buyers are:
• Sustainability targets – off-site renewable PPAs are the quickest and often the only way to achieve ambitious targets.
• Improving budget certainty in volatile markets.
• The potential for cost savings.
• Improving their brand or social licence by supporting new renewable energy.
Corporate Renewable PPAs have now been signed in a wide range of sectors – led by manufacturing, local councils, universities, utilities and state governments for their own operations or infrastructure projects. Whereas large buyers led the way in the early deals, there has also been a series of deals with smaller or mid-sized buyers – like schools, vineyards and local councils.
ABOUT THE REPORT
The State of the Market 2020 report provides an overview of the Corporate Renewable Power Purchase Agreements sector and its key trends. The report is prepared by the Business Renewables Centre Australia (BRC-A) with input from the Technical Advisory Panel.
The purpose of the report is to provide an overview of PPA market trends. The original data in the report is drawn from two sources:
1. The BRC-A maintains a database of Corporate PPAs based on publicly available information and supplemented through industry contacts
2. An annual survey of corporate Buyers, project Developers and professional Service Providers in the industry and BRC-A membership.
As of late September 2020, BRC-A had 196 members:
BRC-A membership statistics, industry surveys and further information are provided in ‘BRC-A Activities in 2019-20’.
Buyers 105
Developers 44
Service providers 25
Partners 22
Total 193
Corporate Renewable Power Purchase Agreements In Australia: State of the Market 2020
3

ABOUT THE BRC-A
The Australian Corporate PPA sector is developing at a rapid rate. For renewable energy developers, the search and transaction costs for finding and negotiating with buyers can be high. For many buyers, energy procurement is often not a core function and understanding and negotiating Corporate PPAs can be complex and time-consuming.
Consequently, the BRC-A was launched in September 2018, to support and facilitate the growth of Corporate PPAs with funding from the Australian Renewable Energy Agency (ARENA) and the NSW and Victorian Governments, and later the Queensland Government.
The BRC-A is a member-based organisation which helps prepare prospective PPA buyers for market-readiness through in-person and online procurement training (bootcamps and webinars) and a suite of educational resources, and facilitates connections between buyers, developers and professional service providers through an online marketplace and profiles platform.
The BRC-A is a collaboration between WWF-Australia (building on the Renewable Energy Buyers Forum), Climate-KIC Australia and the Institute for Sustainable Futures, University of Technology. For more information go to www.businessrenewables.org.au.
...energy procurement is often not a core function and understanding and negotiating Corporate
PPAs can be complex and time-consuming
Corporate Renewable Power Purchase Agreements In Australia: State of the Market 2020
4

LARGE-SCALE RENEWABLE ENERGY IN AUSTRALIA
Large-scale renewable energy has been growing rapidly. In 2019, 34 new solar or wind farms were built adding 2,253 MW (837 MW of wind farms, 1,416 MW solar farms). Another yearly record high of total electricity generation from renewable sources was set in 2019 of 24 per cent.
However, investment in new projects in 2019 fell by more than 50 per cent from the 2018 peak to $4.5 billion. Consequently, the level of renewable energy construction is likely to fall in 2020.
THERE IS A LARGE PIPELINE OF RENEWABLE ENERGY PROJECTS
The Australian Energy Market Operator’s (AEMO) project pipeline illustrates there is an enormous volume of renewable energy projects under development.
Based on AEMO’s generator information, there is almost 48 GW of solar, wind and battery storage projects categorised as publicly announced, emerging, maturing or advanced in the development process. Only a small proportion of projects in the pipeline have secured finance: there is a large number of projects seeking a power purchase agreement and finance to proceed.
Figure 1: Annual Growth of Large-Scale Renewables (MW)
Source: Clean Energy Australia 2020, Clean Energy Council
0
5000
10000
15000
20000
25000
30000
35000
solar wind battery storage
existing committed proposed
Figure 2: Large-Scale Renewable Energy – Project Pipeline (MW)
Source: Generation Information 2020, AEMO
0
500
1000
1500
2000
2500
2010 2011 2012 2013 2014 2015 2016 2017 2018
wind solar
2019
Corporate Renewable Power Purchase Agreements In Australia: State of the Market 2020
5
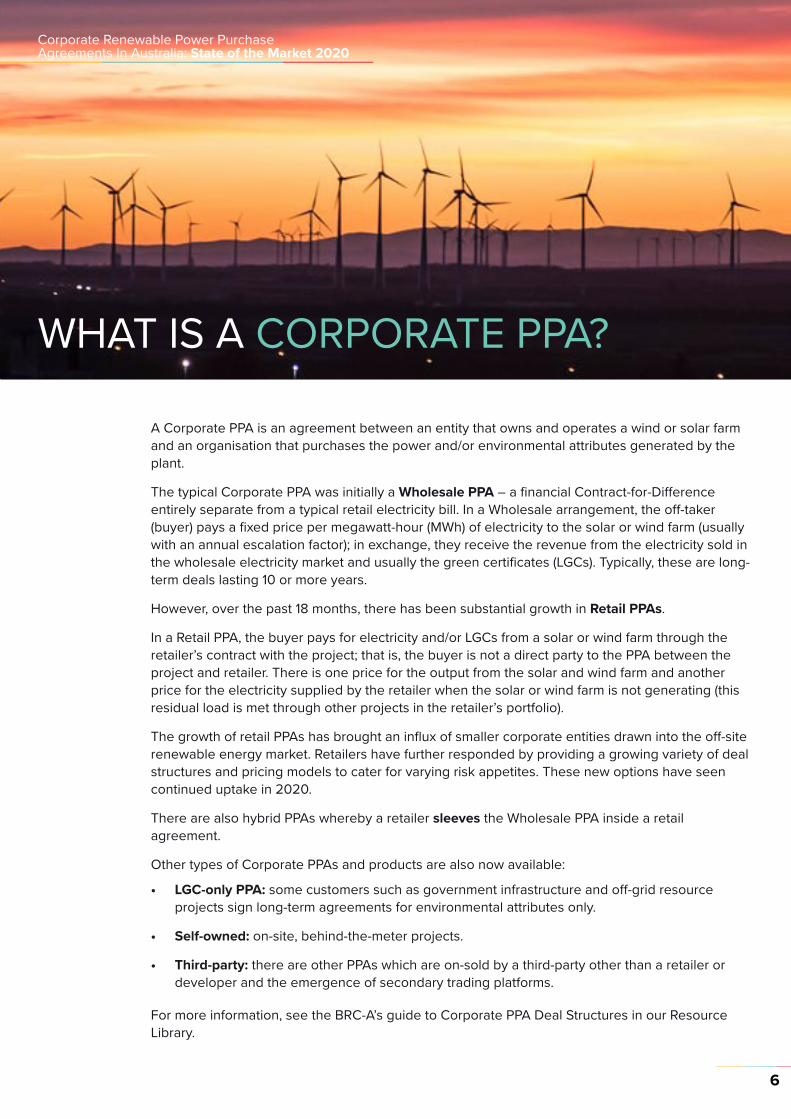
WHAT IS A CORPORATE PPA?
A Corporate PPA is an agreement between an entity that owns and operates a wind or solar farm and an organisation that purchases the power and/or environmental attributes generated by the plant.
The typical Corporate PPA was initially a Wholesale PPA – a financial Contract-for-Difference entirely separate from a typical retail electricity bill. In a Wholesale arrangement, the off-taker (buyer) pays a fixed price per megawatt-hour (MWh) of electricity to the solar or wind farm (usually with an annual escalation factor); in exchange, they receive the revenue from the electricity sold in the wholesale electricity market and usually the green certificates (LGCs). Typically, these are long-term deals lasting 10 or more years.
However, over the past 18 months, there has been substantial growth in Retail PPAs.
In a Retail PPA, the buyer pays for electricity and/or LGCs from a solar or wind farm through the retailer’s contract with the project; that is, the buyer is not a direct party to the PPA between the project and retailer. There is one price for the output from the solar and wind farm and another price for the electricity supplied by the retailer when the solar or wind farm is not generating (this residual load is met through other projects in the retailer’s portfolio).
The growth of retail PPAs has brought an influx of smaller corporate entities drawn into the off-site renewable energy market. Retailers have further responded by providing a growing variety of deal structures and pricing models to cater for varying risk appetites. These new options have seen continued uptake in 2020.
There are also hybrid PPAs whereby a retailer sleeves the Wholesale PPA inside a retail agreement.
Other types of Corporate PPAs and products are also now available:
• LGC-only PPA: some customers such as government infrastructure and off-grid resource projects sign long-term agreements for environmental attributes only.
• Self-owned: on-site, behind-the-meter projects.
• Third-party: there are other PPAs which are on-sold by a third-party other than a retailer or developer and the emergence of secondary trading platforms.
For more information, see the BRC-A’s guide to Corporate PPA Deal Structures in our Resource Library.
Corporate Renewable Power Purchase Agreements In Australia: State of the Market 2020
6
THE GROWTH OF CORPORATE PPAs IN AUSTRALIA
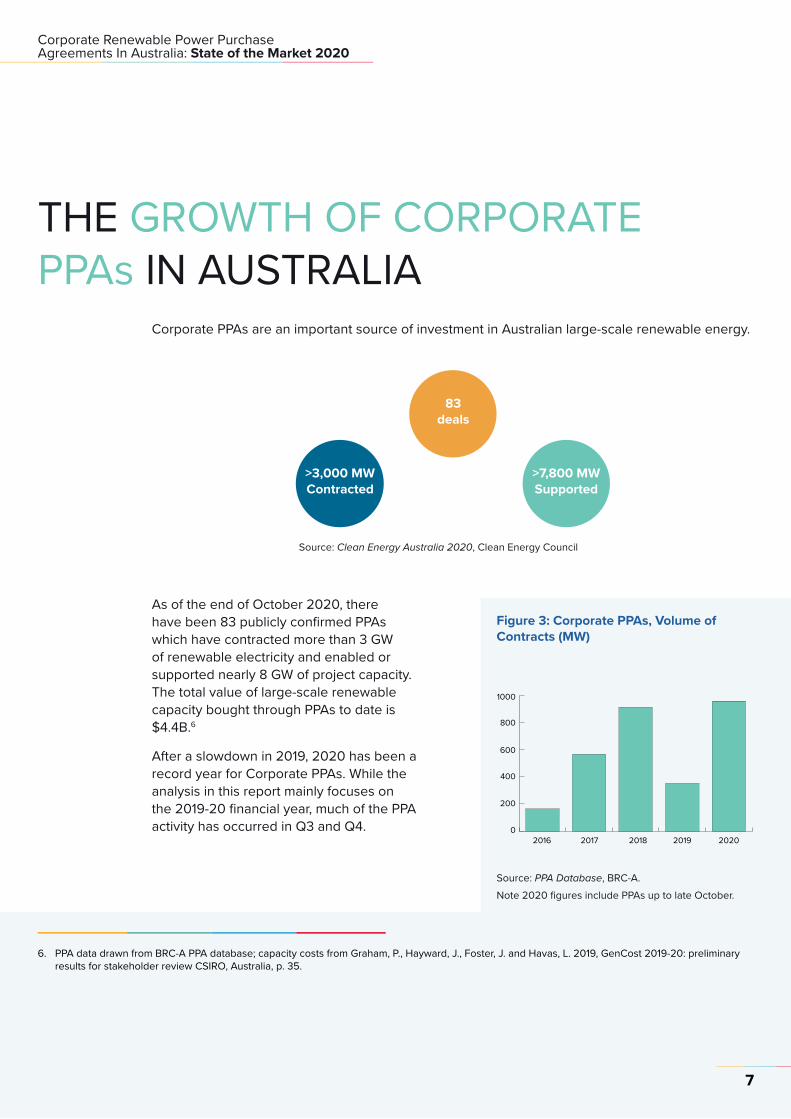
As of the end of October 2020, there have been 83 publicly confirmed PPAs which have contracted more than 3 GW of renewable electricity and enabled or supported nearly 8 GW of project capacity. The total value of large-scale renewable capacity bought through PPAs to date is $4.4B.6
After a slowdown in 2019, 2020 has been a record year for Corporate PPAs. While the analysis in this report mainly focuses on the 2019-20 financial year, much of the PPA activity has occurred in Q3 and Q4.
Corporate PPAs are an important source of investment in Australian large-scale renewable energy.
>3,000 MW Contracted
83 deals
>7,800 MW Supported
Figure 3: Corporate PPAs, Volume of Contracts (MW)
Source: Clean Energy Australia 2020, Clean Energy Council
0
200
400
600
800
1000
2016 2017 2018 2019 2020
Source: PPA Database, BRC-A. Note 2020 figures include PPAs up to late October.
6. PPA data drawn from BRC-A PPA database; capacity costs from Graham, P., Hayward, J., Foster, J. and Havas, L. 2019, GenCost 2019-20: preliminary results for stakeholder review CSIRO, Australia, p. 35.
Corporate Renewable Power Purchase Agreements In Australia: State of the Market 2020
7

Buyer Project Size (MW)
Advanced Circular Polymers (Victoria) Moorabool Wind Farm 321
Molycop (NSW) Bomen Solar FarmSapphire Wind Farm
120270
Coles (NSW)Wagga Wagga Solar FarmCorowa Solar FarmJunee Solar Farm
303030
Lion Brewery and Australian Hotels Association (NSW) Silverleaf Solar Farm 120
City of Sydney (NSW)Sapphire Wind FarmBomen Solar FarmNowra Community Solar Farm
2701203
City of Newcastle (NSW) Sapphire Wind Farm 270
L’Oreal Australia (South Australia) Willogoleche Wind Farm 119
Royal Automobile Club of Victoria N/A N/A
Gold Fields (Western Australia) Agnew Wind FarmAgnew Solar Farm
184
City of Adelaide (South Australia)Clements Gap Wind FarmStreaky Bay Solar FarmCoonalpyn Solar Farm
5735
Amazon 1 (NSW) Gunnedah Solar Farm 146
Transurban 1 (Queensland) N/A N/A
Shell (Queensland) Wandoan Solar Farm 120
Aldi 1 (NSW) Collector Wind Farm 227
Transurban 2 (NSW) Bango Wind FarmSapphire Wind Farm
244270
Aldi 2 (Victoria) Dundonnell Wind Farm 336
Macquarie University (NSW) Snow Hydro Portfolio N/A
Hawkesbury City Council (NSW) Griffith Solar FarmParkes Solar Farm
3666
Swinburne University (Victoria) Cherry Tree Wind Farm 58
Amazon 2 (NSW) Suntop Solar Farm 150
City of Casey (Victoria) Bald Hills Wind Farm 107
Table 1: PPAs in 2019-20 Financial Year
Source: PPA Database 2019-20, BRC-A
Corporate Renewable Power Purchase Agreements In Australia: State of the Market 2020
8

THE ROLE OF CORPORATE PPAs
There are four market segments in Australia’s large-scale renewable energy sector:
• Utility PPAs: deals between electricity retailers and renewable energy projects
• Merchant projects: solar and wind farms that sell into the wholesale market without a PPA
• Government PPAs: auctions by government for renewable energy using general revenue (i.e. not for their own operations)
• Corporate PPAs: deals with renewable energy projects by public and private sector buyers for their own operations.
In the past year, publicly-owned retailers in Queensland and Snowy Hydro have signed major PPAs so they are separately represented below to differentiate from utility PPAs signed by private sector retailers.
Quarter on quarter, Corporate PPAs have accounted for 30 - 50 per cent of PPA market with most of the remaining investment supplied by public retailers. Utility PPAs, once the dominate finance mechanism, have been rare in the past two years once retailers had contracted sufficient volumes to meet liabilities under the national renewable energy target.
Another way of observing this trend is to compare electricity market PPAs with non-electricity market PPAs.
Using a 12-month rolling average, the electricity market PPAs peaked in 2017 as retailers signed up capacity to meet their obligations under the RET. The recent upturn in utility PPAs reflects PPAs signed by public retailers (Clean Co, Snowy Hydro). PPAs signed outside the electricity market by corporates and government auction processes grew as utility PPAs declined but are now in closer alignment.
Figure 4: PPA Market Segments, 2018-20
0
20
40
60
80
100
2018Q3
corporate government utility
merchant state-owned utility
2018Q4
2019Q1
2019Q2
2019Q3
2019Q4
2020Q1
2020Q2
Source: PPA Database 2019-20, BRC-A.
Figure 5: Utility vs Non-Utility PPAs (MW)
0
1000
2000
3000
4000
5000
2016Q2
non-electricity market (corporate PPAs and government auctions)
electricity market (utility PPAs and merchant projects)
2018Q1
2019Q1
2017Q1
2020Q1
2020Q3
Source: PPA Database 2019-20, BRC-A.
Corporate Renewable Power Purchase Agreements In Australia: State of the Market 2020
9
0
2019-20
2018-19
<20 MW 20-50 MW 50-100 MW 100+ MW
20 40 60 80 100
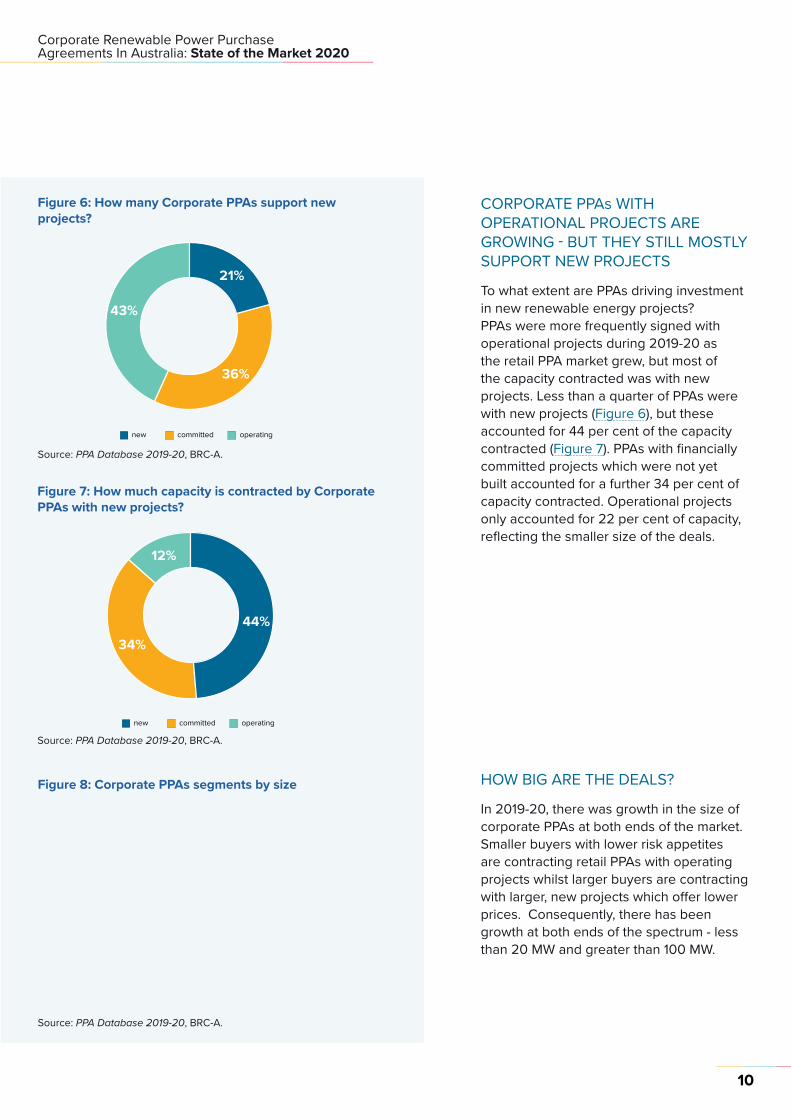
CORPORATE PPAs WITH OPERATIONAL PROJECTS ARE GROWING - BUT THEY STILL MOSTLY SUPPORT NEW PROJECTS
To what extent are PPAs driving investment in new renewable energy projects? PPAs were more frequently signed with operational projects during 2019-20 as the retail PPA market grew, but most of the capacity contracted was with new projects. Less than a quarter of PPAs were with new projects (Figure 6), but these accounted for 44 per cent of the capacity contracted (Figure 7). PPAs with financially committed projects which were not yet built accounted for a further 34 per cent of capacity contracted. Operational projects only accounted for 22 per cent of capacity, reflecting the smaller size of the deals.
HOW BIG ARE THE DEALS?
In 2019-20, there was growth in the size of corporate PPAs at both ends of the market. Smaller buyers with lower risk appetites are contracting retail PPAs with operating projects whilst larger buyers are contracting with larger, new projects which offer lower prices. Consequently, there has been growth at both ends of the spectrum - less than 20 MW and greater than 100 MW.
Figure 7: How much capacity is contracted by Corporate PPAs with new projects?
Figure 8: Corporate PPAs segments by size
new committed operating
21%
36%
43%
Figure 6: How many Corporate PPAs support new projects?
new committed operating
44%34%
12%
Source: PPA Database 2019-20, BRC-A.
Source: PPA Database 2019-20, BRC-A.
Source: PPA Database 2019-20, BRC-A.
Corporate Renewable Power Purchase Agreements In Australia: State of the Market 2020
10

Solar PV
Wind4852
Figure 10: Number of Corporate PPAs by sector (%)
Figure 11: Corporate PPAs, Solar and Wind Farms, 2019-20 (MW, %)
2019-20 Total (as at end Q2 2020)
NSW QLD SA VIC WA
1200
1000
800
600
400
200
0
Figure 9: Corporate PPAs by state (MW)
EducationHospitality
24
1910
10
10
1010
5
5
Information TechnologyInfrastructureLocal GovernmentManufacturingMiningResourcesRetailWater Utility
Source: PPA Database 2019-20, BRC-A.
Source: PPA Database 2019-20, BRC-A.
Source: PPA Database 2019-20, BRC-A.
NSW WAS THE LEADING STATE FOR PPAs IN 2019-20
During 2019-20, Corporate PPA uptake accelerated in NSW, narrowing the gap on Victoria as the leading state for Corporate PPAs. Queensland was second (and has surged in Q3 2020). Activity remains low in other states.
In each of the three leading states, governments are implementing initiatives to grow large-scale renewable energy which are likely to also lead to Corporate PPAs.
BUYER SECTORAL COMPOSITION REMAINED DIVERSE
One of the key features of the PPA market continues to be the diversity of sectors.
Whilst there are some leaders - local governments, retailers, education, infrastructure and hospitality – the spread of PPA across sectors is striking.
SOLAR OR WIND?
In the previous year, there had been a preference for solar but the volumes contracted were even in 2019-20.
Corporate Renewable Power Purchase Agreements In Australia: State of the Market 2020
11
The Australian economy and energy market have been through a tumultuous year. The International Energy Agency (2020) has declared that ‘the Covid-19 pandemic has caused more disruption to the energy sector than any other event in recent history.’7 In Australia, there has been a modest reduction in electricity demand but global impacts such as lower gas prices have led to major reductions in wholesale electricity prices (AEMO 2020).
There are three key PPA market trends to highlight:
• The resilience of the Corporate PPA market: BRC-A’s annual survey of buyers finds only modest impacts on interest and demand in PPAs amidst a record year for Corporate PPAs.
• The leadership of State and Local Governments: whether as retailing intermediaries, anchor buyers or aggregators, governments are playing a leading role in the growth of Corporate PPAs as retailer investment has receded following the achievement of the national Renewable energy Target.
• Consolidation of a dual market for large and mid-sized buyers: the divergent preference of large buyers for Wholesale PPAs and mid-sized buyers for Retail PPAs has consolidated with the development of the retail PPA sector.
There are also some emerging market trends (e.g. growth of firming and storage) and gaps (e.g. group PPA facilitation) highlighted in the final section.
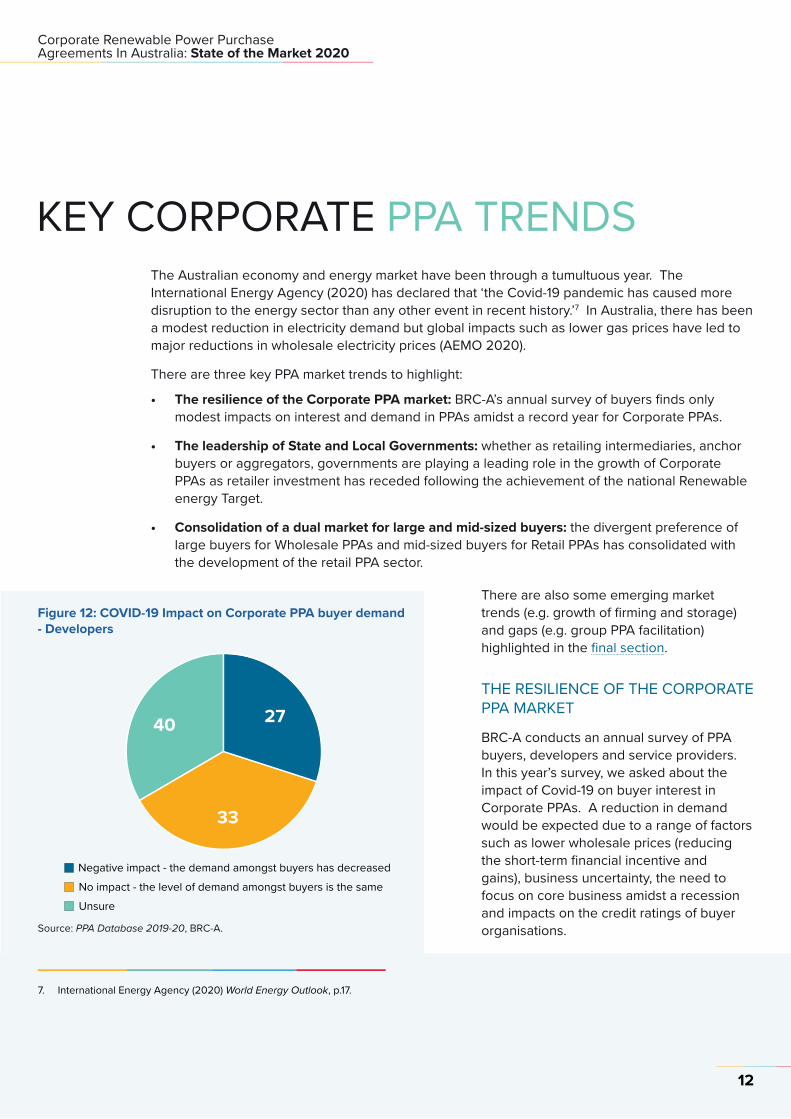
THE RESILIENCE OF THE CORPORATE PPA MARKET
BRC-A conducts an annual survey of PPA buyers, developers and service providers. In this year’s survey, we asked about the impact of Covid-19 on buyer interest in Corporate PPAs. A reduction in demand would be expected due to a range of factors such as lower wholesale prices (reducing the short-term financial incentive and gains), business uncertainty, the need to focus on core business amidst a recession and impacts on the credit ratings of buyer organisations.
KEY CORPORATE PPA TRENDS
7. International Energy Agency (2020) World Energy Outlook, p.17.
Figure 12: COVID-19 Impact on Corporate PPA buyer demand - Developers
Source: PPA Database 2019-20, BRC-A.
No impact - the level of demand amongst buyers is the sameNegative impact - the demand amongst buyers has decreased
Unsure
27
33
40
Corporate Renewable Power Purchase Agreements In Australia: State of the Market 2020
12
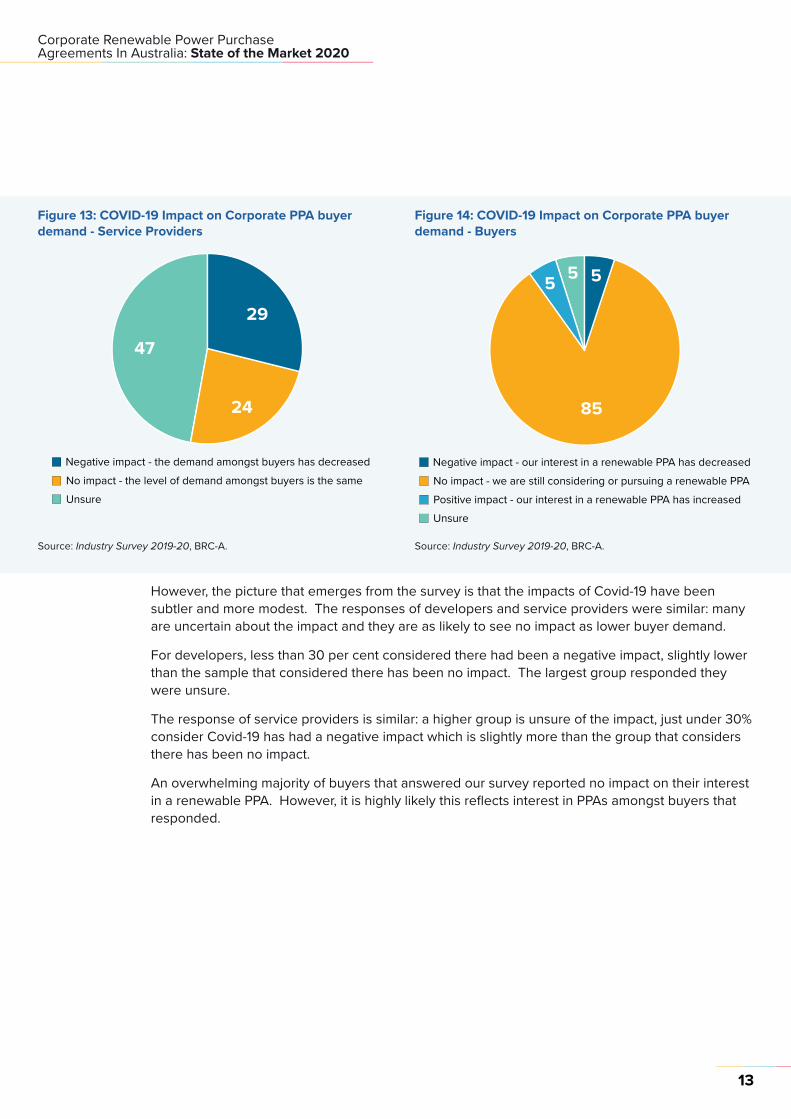
Figure 13: COVID-19 Impact on Corporate PPA buyer demand - Service Providers
No impact - the level of demand amongst buyers is the sameNegative impact - the demand amongst buyers has decreased
Unsure
29
24
47
Source: Industry Survey 2019-20, BRC-A.
Figure 14: COVID-19 Impact on Corporate PPA buyer demand - Buyers
Source: Industry Survey 2019-20, BRC-A.
However, the picture that emerges from the survey is that the impacts of Covid-19 have been subtler and more modest. The responses of developers and service providers were similar: many are uncertain about the impact and they are as likely to see no impact as lower buyer demand.
For developers, less than 30 per cent considered there had been a negative impact, slightly lower than the sample that considered there has been no impact. The largest group responded they were unsure.
The response of service providers is similar: a higher group is unsure of the impact, just under 30% consider Covid-19 has had a negative impact which is slightly more than the group that considers there has been no impact.
An overwhelming majority of buyers that answered our survey reported no impact on their interest in a renewable PPA. However, it is highly likely this reflects interest in PPAs amongst buyers that responded.
No impact - we are still considering or pursuing a renewable PPANegative impact - our interest in a renewable PPA has decreased
Positive impact - our interest in a renewable PPA has increasedUnsure
85
555
Corporate Renewable Power Purchase Agreements In Australia: State of the Market 2020
13

Nonetheless, the interest amongst these buyers alone represents significant on-going demand for Corporate PPAs. When asked about their level of involvement, 40 per cent of buyers said they were currently pursuing a Corporate PPA and a further 15 per cent of buyers said they were interested in a Corporate PPA. Only 10 per cent were not interested in a Corporate PPA.
The aggregate load of buyers who are pursuing or interested in a Corporate PPA is significant.
Figure 15: Respondents by PPA stage
0
10%
20%
30%
40%
50%
60%
Completion of or
involvement in a PPA
corporate
government
utility
Pursuingor
investigatingPPA
Interested in learning
more
Investigatedbut
decidedagainst PPA
Notinterested
in PPA
Source: Industry Survey 2019-20, BRC-A.
Figure 16: PPA Deal Pipeline, Survey Respondents
Source: Industry Survey 2019-20, BRC-A.
Note: the volume for each category is calculated using the mid-point of ranges used in the survey (e.g. for buyers who answered their load is 50-200 GWh, the number of respondents is multiplied by 125 GWh). For respondents with 200+ GWh, the volume is assumed to be 200 GWh and for the 0-15 GWh category the volume is assumed to be 15 GWh.
The level of demand amongst buyers surveyed who are pursuing PPAs is around 400 – 600 MW and buyers interested in PPAs is around 100 – 150 MW.
0-15 GWh
15-30 GWh
30-50 GWh
50-200 GWh
200+ GWh
0
interested pursuing/investigating
200 400 600 800 1000
High Low
Pursuing PPA (GWh) 1940 1360
Pursuing PPA (MWh) 582 408
Interested in a PPA (GWh) 505 340
Interested in a PPA (MW) 151.5 102
Note: the capacity estimate assumes a 50:50 split between solar and wind with capacity factors of 25% and 35% respectively.
Table 2: Buyer Demand and Interest for Corporate PPAs, Survey Respondents
Corporate Renewable Power Purchase Agreements In Australia: State of the Market 2020
14

The BRC-A survey does not of course cover the market. There will be other organisations pursuing or interested in PPAs that have not answered the survey.
The key feature to emerge is the resilience of the Corporate PPA market. As PPAs generally take 9 – 12 months, the record volume this year reflects deal processes that were commenced last year – but the successful conclusion of deals amidst the uncertainty is nonetheless impressive. From our discussions with the industry, there is a view that there are less buyers motivated by the impacts of high wholesale electricity prices and a higher proportion of buyers with sustainability mandates. It is possible that there will be a hangover from this year in deal volumes next year – and it is always hard to reproduce record years - but the results of our survey suggest the impacts are lower than might be expected. Corporate PPAs are likely to remain a significant source of investment for large-scale renewable energy.
STATE AND LOCAL GOVERNMENTS ARE LEADING ON CORPORATE PPAs AS RETAILER INVESTMENT FALLS
One of the major trends over the past year has been the leadership roles being undertaken by state and local governments. In each of the three major states for PPAs, state governments are acting in different ways to grow investment in renewable energy and Corporate PPAs - as either intermediaries, anchor buyers or aggregators. At a local government level, there is also significant activity, whether it is using PPAs to cover their own operations or facilitating uptake by businesses within their Local Government Areas.
The big move of 2020 was a series of large PPAs signed by publicly-owned retailers in Queensland:
• CleanCo will build and operate a 100MW project and signed a 400 MW PPA as part of the 1026 MW MacIntyre Wind Farm (the largest in Australia)
• CleanCo signed a 320 MW PPA as part of the 400 MW Western Downs Solar Farm
• Stanwell Corporate signed a PPA for 348 MW from Stage 1 of the 450 MW Clarkes Creek Wind Farm
• CS Energy signed a PPA with the 64 MW Warwick Solar Farm and a 160 MW PPA with Columboola Solar Farm.
Clean Co and CS Energy have on-sold parcels of the off-take as retail PPAs to Coles and a group of university buyers (Griffith University, Queensland University of Technology, Central Queensland University). Queensland’s publicly owned retailers are underwriting new investment directly and intermediating between projects and commercial buyers through retail PPAs.
The Victorian Government is currently consulting on the Victorian Renewable Energy Target 2 (VRET 2). Under VRET 2, the Victorian Government will contract for at least 600 MW to achieve a 100 per cent renewable energy target for its own operations. In addition, the Victorian Government is investigating options to enable commercial and industrial businesses to participate in VRET. Under this arrangement, the Victorian Government would effectively act as an anchor buyer and support Corporate PPAs through the auction process.
Corporate Renewable Power Purchase Agreements In Australia: State of the Market 2020
15

The City of Melbourne aggregated a second buyer group under the Melbourne Renewable Energy Project 2. The buyers group included seven organisations across construction, property, food and university sectors that contracted for a total of 110 GWh per annum. City of Melbourne facilitated the transaction by acting as the coordinator or aggregator.
The NSW Government is focussing on the establishment of the first Renewable Energy Zones (REZs) in Australia. Within the AEMO Integrated System Plan, a series of REZs were identified to coordinate investment in transmission network capacity to unlock low-cost renewable energy in regional areas with the best solar and wind resources. In the Expression of Interest for the first REZ in the Central-West Orana, developers put forward projects totalling 27,000 MW of projects. The NSW Electricity Infrastructure Roadmap for operationalising the REZs includes auctions for options on a minimum price contract and observes Corporate PPAs will be one source of finance for the projects.
Consequently, governments have become key players in the Corporate PPA market as retailer investment in renewable energy has fallen. Whether as intermediators, buyers or aggregators, governments have returned to the energy market and are playing leadership roles in supporting and facilitating Corporate PPAs.
CONSOLIDATION OF A TWO-STREAM MARKET: WHOLESALE (LARGE BUYERS) AND RETAIL (MID-SIZED BUYERS)
The two-stream market which was emerging last year between wholesale and retail PPAs was consolidated in 2020. There is a clear bifurcation between large-buyers which prefer wholesale PPAs and mid-sized buyers which prefer retail PPAs.
The retail PPA market has continued to develop with a range of offerings for buyers with different goals and risk appetites - from LGC-only deals that sit alongside standard retail contracts to fixed-price PPAs through to PPAs with wholesale spot exposure.8 For mid-sized buyers without the scale of large buyers, these are often considered lower risk and easier than wholesale PPAs. Retail PPAs are now the most common deal type (Figure 17).
8. See BRC-A’s Renewable Retail PPA Guide for an explanation of the different types of Retail PPAs and how they work.
Figure 17: PPA Deal Types, 2019-20 (#, %)
Source: PPA Database 2019-20, BRC-A.
Note: ‘other’ includes PPAs for behind-the-meter projects on the site of the buyer, self-owned projects and PPAs signed through third-party platforms.
wholesale retail other
42
47
11
Corporate Renewable Power Purchase Agreements In Australia: State of the Market 2020
16

Figure 18: PPA Deal Types, 2019-20 (MW, %)
wholesale retail other
5621
23
Source: PPA Database 2019-20, BRC-A
Figure 19: PPA Deal Types, 2019-20 (Volume in MW)
Source: PPA Database 2019-20, BRC-A
Note: the ‘other’ category primarily constitutes a self-owned PPA by Shell
2018-19 2019-20
350
300
250
200
150
100
50
0wholesale retail other
310340
50
130100
140
However, wholesale PPAs dominate the share of volume that is contracted through Corporate PPAs, reflecting the size of the buyers and deals. Larger buyers with more resources, in-house energy management expertise and scale are able to negotiate lower prices through wholesale PPAs.
OTHER MARKET TRENDS TO LOOK OUT FOR
There are some other notable market trends and gaps to consider.
The growth of firming products and strategies
There is a growing market understanding of the role and importance of ‘firming’ to support PPAs. Firming refers to a range of strategies for addressing mis-matches between the output of the project(s) and buyer consumption (and more broadly electricity demand). Improving the match between output and consumption reduces the risks and costs associated with retail PPAs as it lowers the requirement for supply to fill in the gaps. There is a trend towards stipulating minimum load match requirements in buyer tenders.
The growth of firming solutions can be seen at different points:
• the project (e.g. a solar farm with a battery)
• the retailer (e.g. through green sources such as pumped hydro or its brown assets)
• the growth of financial products for purchase by a buyer or retailer (e.g. a proxy revenue swap or ‘wind firming’/’solar firming’ products that guarantee production)
• on-site: battery storage, thermal storage (e.g. cold-water systems) demand management and back-up generators can all be low-cost ways of firming a PPA.
Corporate Renewable Power Purchase Agreements In Australia: State of the Market 2020
17
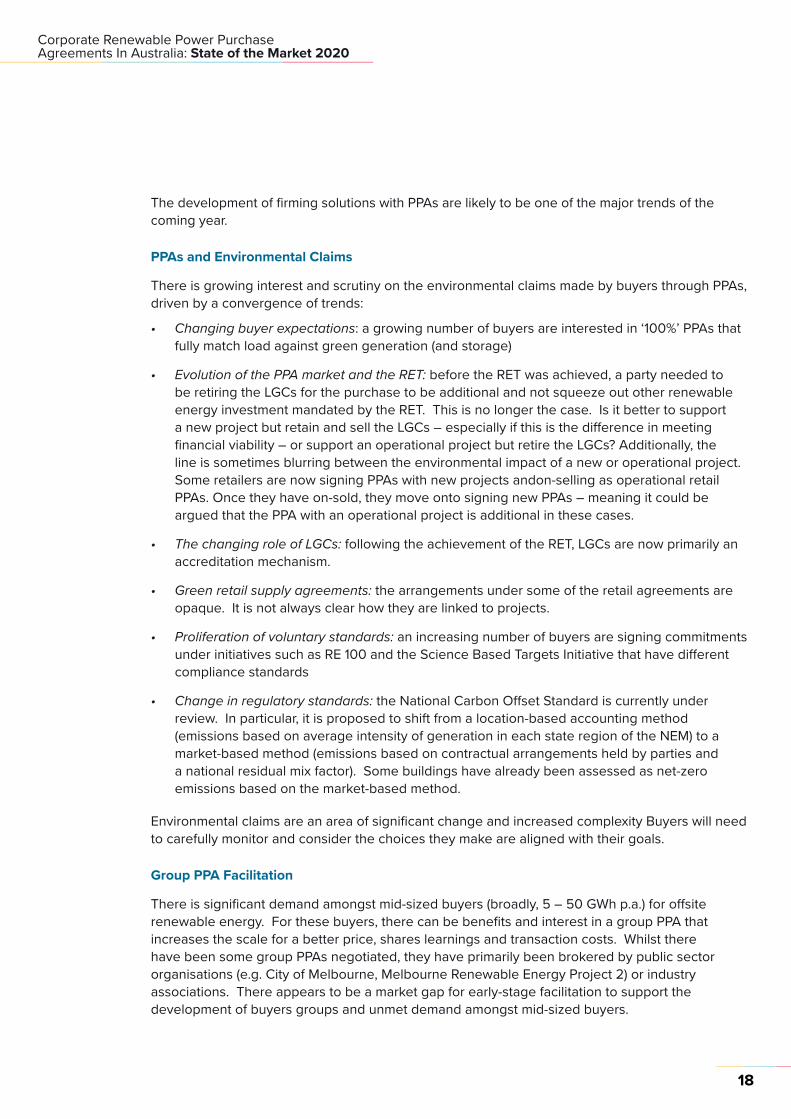
The development of firming solutions with PPAs are likely to be one of the major trends of the coming year.
PPAs and Environmental Claims
There is growing interest and scrutiny on the environmental claims made by buyers through PPAs, driven by a convergence of trends:
• Changing buyer expectations: a growing number of buyers are interested in ‘100%’ PPAs that fully match load against green generation (and storage)
• Evolution of the PPA market and the RET: before the RET was achieved, a party needed to be retiring the LGCs for the purchase to be additional and not squeeze out other renewable energy investment mandated by the RET. This is no longer the case. Is it better to support a new project but retain and sell the LGCs – especially if this is the difference in meeting financial viability – or support an operational project but retire the LGCs? Additionally, the line is sometimes blurring between the environmental impact of a new or operational project. Some retailers are now signing PPAs with new projects andon-selling as operational retail PPAs. Once they have on-sold, they move onto signing new PPAs – meaning it could be argued that the PPA with an operational project is additional in these cases.
• The changing role of LGCs: following the achievement of the RET, LGCs are now primarily an accreditation mechanism.
• Green retail supply agreements: the arrangements under some of the retail agreements are opaque. It is not always clear how they are linked to projects.
• Proliferation of voluntary standards: an increasing number of buyers are signing commitments under initiatives such as RE 100 and the Science Based Targets Initiative that have different compliance standards
• Change in regulatory standards: the National Carbon Offset Standard is currently under review. In particular, it is proposed to shift from a location-based accounting method (emissions based on average intensity of generation in each state region of the NEM) to a market-based method (emissions based on contractual arrangements held by parties and a national residual mix factor). Some buildings have already been assessed as net-zero emissions based on the market-based method.
Environmental claims are an area of significant change and increased complexity Buyers will need to carefully monitor and consider the choices they make are aligned with their goals.
Group PPA Facilitation
There is significant demand amongst mid-sized buyers (broadly, 5 – 50 GWh p.a.) for offsite renewable energy. For these buyers, there can be benefits and interest in a group PPA that increases the scale for a better price, shares learnings and transaction costs. Whilst there have been some group PPAs negotiated, they have primarily been brokered by public sector organisations (e.g. City of Melbourne, Melbourne Renewable Energy Project 2) or industry associations. There appears to be a market gap for early-stage facilitation to support the development of buyers groups and unmet demand amongst mid-sized buyers.
Corporate Renewable Power Purchase Agreements In Australia: State of the Market 2020
18

The Business Renewables Centre Australia is a ‘buyer-facing’ organisation that undertakes capacity-building to support buyers make informed decisions about Corporate PPAs. In the 2019 survey, we asked buyers, developers and service providers about the barriers to and transaction costs of PPAs. This year we also asked about preferences and criteria of buyers when making PPAs.
The key findings from the 2020 survey are:
• PPAs remain a challenging undertaking with most buyers and developers rating the difficulty high or very high but transaction costs are rated moderate to high.
• The major barriers to PPA execution are internal to buyer organisations: understanding PPAs and internal processes including business case and building organisational support.
• PPAs take time: one-third of buyers said their process was less than a year – but for almost half of buyers it was longer than 18 months.
• Price and risk are the most important factors for PPA buyers, but community support and benefits are more important than developers think they are and becoming more important to buyers.
BARRIERS TO CORPORATE PPAs
When asked to rate the difficulty of negotiating Corporate PPAs, both buyers and developers answer they are hard.
Over 80 per cent of buyers rate the difficulty at a 4 or 5. Developer ratings are similar though slightly more rate the difficulty as moderate (3) and slightly fewer rate the difficulty as very hard (5). No buyers or developers consider PPAs easy (1 or 2).
UNDERSTANDING BUYERS: PREFERENCES AND BARRIERS TO CORPORATE PPAs
Figure 20: How hard are Corporate PPAs?
Source: Industry Surveys 2019-20, BRC-A
Buyer Developer
60%
50%
40%
30%
20%
10%
0%1 2 3 4 5
Corporate Renewable Power Purchase Agreements In Australia: State of the Market 2020
19

Finding the right specialists
Market or policy uncertainty
The complexity of PPAs and understanding the options
Understanding of electricity markets and pricing
0% 5% 10% 15% 20%
Finding the right project or developer
Business case and internal stakeholder support
35%25% 30%
When asked about transaction costs there is greater diversity of answers and the parties rate them lower than the negotiation difficulty.
A similar portion of buyers rate transaction costs as high (4) but no buyers rate the transaction costs as very high (5) and 40 per cent of buyers rated them low (2) or moderate (3). Developers generally rated the transaction costs as lower than buyers; over half of developers rate the transaction costs as low or moderate.
Consequently, whilst PPAs are considered difficult, this does not necessarily translate into high transaction costs.
How long do PPAs take? For buyers, it is rarely less than 6 months and there is quite an even split across the other duration periods. Around one-third take 6-12 months, one-fifth 12-18 months, but almost half of buyers responded that the PPA took longer than 18 months.
When asked about the single greatest barrier, buyers currently pursuing a PPA reported the complexity of PPA options, business case and building internal organisational support. Finding the right service provider was the third most common barrier. Market or policy uncertainty or finding the right project were nominated as the major barrier by a minority of buyers.
There is a strong correlation with the answers of buyers who have completed a PPA (‘experienced PPA buyers). Experienced buyers also listed business case and internal organisational support, complexity of PPA options, securing internal agreement and assessing responses as the key barriers (Figure 23).
Figure 22: Corporate PPAs, Process Duration
Figure 23: What is the major barrier to a PPA (current buyers)?
Buyer Developer
60%
50%
40%
30%
20%
10%
0%1 2 3 4 5
Service Provider
Figure 21: How high are the transaction costs for Corporate PPAs?
Source: Industry Surveys 2019-20, BRC-A
Source: Industry Surveys 2019-20, BRC-A
Source: Industry Surveys 2019-20, BRC-A
Buyer Developer
60%50%40%30%20%10%0%
<6 months 6-12 months 12-18 months 18-24 months 2+ years
Service Provider
70%80%
Corporate Renewable Power Purchase Agreements In Australia: State of the Market 2020
20

Figure 24: Major barriers in PPA procurement process for experienced PPA Buyers
Finding the rightproject or developer
Finding the right specialists
Investigating/assessing options
Market or policy uncertainty
0% 10% 20% 30%
Buyer legal oraccounting issues
Business case and internalstakeholder support
40% 50%
Negotiating a deal that met the needs of both organisations
Securing internal agreement
The complexity of PPAs andunderstanding the options
Transaction costs
Source: Industry Surveys 2019-20, BRC-A
Figure 25: Major barriers in PPA procurement process for Developers and Service Providers
Source: Industry Surveys 2019-20, BRC-A
The responses of developers and service providers likewise rate buyer understanding and internal agreement as the key barriers.
It is notable how low both service providers and developers rate Covid impacts or external market conditions as a key barrier even amidst the economic turbulence.
Negotiating a deal that met theneeds of both organisations
Market or policy uncertainty
Finding the right buyer
Developer understanding of buyer needs or processes
0% 10% 20% 30%
The complexity of PPAs andunderstanding the options
Transaction costs
40% 50%
COVID-19 Impacts
Buyers securing internal agreement
Buyer understanding of PPAs
Buyer price expectations
Buyer legal or accounting issues
DeveloperService Provider
Corporate Renewable Power Purchase Agreements In Australia: State of the Market 2020
21

BUYER PREFERENCES: WHAT MATTERS WHEN BUYERS ARE EVALUATING PPAs?
What are the key factors for buyers when procuring PPAs and evaluating different projects? In this year’s survey, we asked buyers, developers and service providers about the preferences of buyers to gain insight into their priorities and differences between the parties. We also asked ‘experienced’ parties who have completed a PPA to observe any differences with ‘current’ parties negotiating a PPA to observe any differences.
The average ratings of the parties highlight:
• Price (4.5) and risk (4.6) are the most important factors for buyers followed by developer reputation (4.1).
• Community support (3.8), community benefits (3.5) and environment and biodiversity (3.7) are less important than price - but each are rated as more important for buyers than developers consider.
• The assessment of buyer preference by service providers is generally more accurate than developers.
Beneath these headline ratings, there are other important findings that will be unpacked beneath:
• Whereas developers over-estimate the importance of price to buyers, they under-estimate the importance of risk.
• whereas developers consider the importance of community benefits, support and environmental impacts is falling, there is a marked increase in rating amongst current Buyers
Developer Reputation
For around three-quarters of buyers, developer reputation is either very important or important.
There is a higher number of buyers who rate this as very important than developers expect.
Figure 27: How Important is Developer reputation?
Source: Industry Surveys 2019-20, BRC-A
Figure 26: Key Factors for PPA Buyers, Average Rating
Source: Industry Surveys 2019-20, BRC-A
Note: respondents were asked to rate on a scale of 1-5. Developers and service providers were asked to rate the importance of each factor for buyers – not themselves.
Dev
elop
erRe
puta
tion
Pric
e
Risk
Com
mun
itysu
ppor
t
Com
mun
itybe
nefit
s
Envi
ronm
ent
& bi
odiv
ersi
ty
DeveloperBuyer
4.13.9 3.9
4.5 4.54.7 4.6
4.1
4.7
3.83.4
3.83.5
3.1 3.1
3.7
3.23.0
Service Provider
1
DeveloperBuyer Service Provider
0%
10%
20%
30%
40%
50%
2 3 4 5
Corporate Renewable Power Purchase Agreements In Australia: State of the Market 2020
22
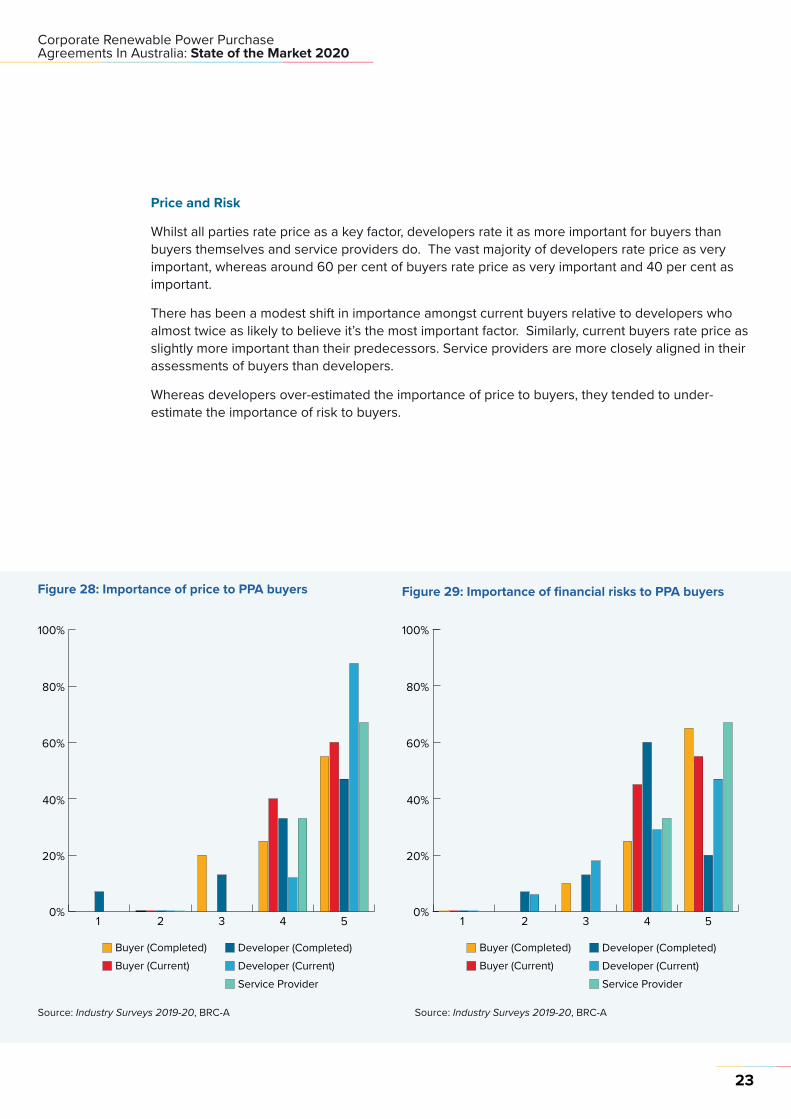
Figure 28: Importance of price to PPA buyers
Developer (Completed)Buyer (Completed)
Service Provider
0%
20%
40%
60%
80%
100%
54321
Buyer (Current) Developer (Current)
Source: Industry Surveys 2019-20, BRC-A
Figure 29: Importance of financial risks to PPA buyers
Source: Industry Surveys 2019-20, BRC-A
Price and Risk
Whilst all parties rate price as a key factor, developers rate it as more important for buyers than buyers themselves and service providers do. The vast majority of developers rate price as very important, whereas around 60 per cent of buyers rate price as very important and 40 per cent as important.
There has been a modest shift in importance amongst current buyers relative to developers who almost twice as likely to believe it’s the most important factor. Similarly, current buyers rate price as slightly more important than their predecessors. Service providers are more closely aligned in their assessments of buyers than developers.
Whereas developers over-estimated the importance of price to buyers, they tended to under-estimate the importance of risk to buyers.
Developer (Completed)Buyer (Completed)
Service Provider
0%
20%
40%
60%
80%
100%
54321
Buyer (Current) Developer (Current)
Corporate Renewable Power Purchase Agreements In Australia: State of the Market 2020
23

Again, service providers were closer to buyer ratings.
Community, Economic and Environmental Benefits
If price, risk and reputation are the most important factors, community benefits, support and environment and bio-diversity are all rated more importantly by buyers than developers expect.
Around one-third of buyers gave the highest rating for community support whereas only 1-in-6 developers assessed it as that important for buyers (although the developers currently negotiating PPAs are closer). Interestingly, this was one area where service providers over-estimated its importance for buyers.
When asked about the importance of community benefits, the buyers rating them as a very important or important factor was even higher.
Notably, whereas developers currently negotiating PPAs were less likely to think community benefits are important to buyers, buyers currently negotiating PPAs were much more likely to rate them as important.
When asked about different types of community benefits, the most highly-rated benefit was local jobs followed by benefits for disadvantaged groups (see Appendix A for graphs).
Greater importance is also being placed on impacts on local environment and biodiversity by current PPA buyers. The gap in the proportion of service providers and developers who consider it as very important to buyers is also large.
Buyer (Current)Buyer (Completed)
0%
10%
20%
30%
40%
54321
Service ProviderDeveloper
50%
Figure 31: Importance of community benefits for PPA buyers
Figure 32: Importance of impacts on local environment and biodiversity for PPA Buyers
Developer Buyer Service Provider
0%
10%
20%
30%
40%
50%
54321
Figure 30: Importance of local community support for PPA buyers
Source: Industry Surveys 2019-20, BRC-A
Source: Industry Surveys 2019-20, BRC-A
Note: Community benefits refer to benefits such as infrastructure funds which are included as part of solar and wind farm developments
Source: Industry Surveys 2019-20, BRC-A
Developer (Completed) Buyer (Completed)
0%
10%
20%
30%
40%
54321
Developer (Current) Buyer (Current)
Corporate Renewable Power Purchase Agreements In Australia: State of the Market 2020
24

BRC-A ACTIVITIES IN 2019-20The BRC-A was established to support the development of the Corporate PPA market. Established through a licence agreement with the Rocky Mountain Institute’s Business Renewables Centre in the United States, the BRC-A is a member-based organisation that provides buyer education and training, develops informational resources (guides, primers, tools, templates), and connects buyers and developers through an online marketplace platform and networking events. The core function of the BRC-A is to help bring build the capacity of PPA buyers, grow the pipeline of buyers who are better informed and able to negotiate PPAs and reduce the transaction costs of Corporate PPAs.
BRC-A IMPACT TO DATE
As Corporate PPAs generally take longer than a year and upwards to negotiate, it takes some time for the impact of an initiative focussed on early-stage buyers to demonstrate impact. However, there are now BRC-A members and buyers coming through ‘buyer bootcamps’ to negotiate PPAs.
Since launching in October 2018, some of the impacts of the BRC-A include:
• 9 Buyer Members have signed 11 PPAs constituting >350 MW of power contracted and supporting >2,700 MW of projects. 6 of these Members participated in Buyers Bootcamps.
• Four Buyers Bootcamps have been run, training more than 80 organisations in PPA procurement
• More than 1,600 listeners attended BRC-A webinars in 2020
• The BRC-A online Resource Library has been utilised by ~500 Member users 2,500 times;
• the Project Marketplace has been viewed by Member users 3,800 times.
The BRC-A surveyed its members and the broader industry in 2020 to understand their experiences with Corporate PPAs. There were 103 responses of which more than 65 per cent were BRC-A members.
Buyers Developers Service Providers
53 34 16
In this section we profile BRC-A members and other industry constituents and report on activities of the BRC-A in 2019-20.
Corporate Renewable Power Purchase Agreements In Australia: State of the Market 2020
25

BRC-A INDUSTRY SURVEY PARTICIPANTS PROFILE
BRC-A membership is comprised of energy Buyers, large-scale renewable energy Project Developers, professional Service Providers that advise on PPA transactions and partners including State Government departments and industry associations.
The survey captured a range of annual electricity loads, with 47% being large or very large consumers, and a growing, now majority, segment of small and mid-sized buyers (<50 GWh p.a.) constituting the remainder. There is significant load among Buyers that are currently pursuing or investigating a PPA, with this survey capturing 5 Buyers using 200 or more GWh of electricity per annum, along with many smaller and mid-sized energy Buyers.
BRC-A Members are drawn primarily from New South Wales and Victoria, with a growing base in Queensland.
Figure 33: Buyer respondent annual electricity loads (%)
Source: Industry Surveys 2019-20, BRC-A
Figure 34: BRC-A membership proportion by region
Source: BRC-A Membership 2019-20, BRC-A
200+ GWh
50-200 GWh
30-50 GWh
15-30 GWh
0-15 GWh
23
23
8
30
17
ACT (2%)
NSW (45%)
QLD (13%)
SA (3%)
TAS (1%)
VIC (30%)
WA (3%)
Other (3%)
Corporate Renewable Power Purchase Agreements In Australia: State of the Market 2020
26

Figure 35: Economic sector distribution of Buyer members
Source: BRC-A Membership 2019-20, BRC-A
Agriculture, 2%Construction, 1%
Conventions & Exhibitions, 1%Financial Services, 1%
Food & Beverage, 7%
Gambling & Casinos, 1%
GovernmentAdministration,27%
Information Technology Services, 5%Hotels, 1%
Hospital & Health Care, 2%Higher Education, 8%
Infrastructure Management, 1%Insurance, 4%
Logistics & Supply Chain, 2%Manufacturing, 3%
Mining & Metals, 10%
NGO, 2%
Utilities, 2%Transportation, 5%
Telecommunications, 1%
Retail, 7%
Renewables &Environment, 4%
Real Estate, 4%
Corporate Renewable Power Purchase Agreements In Australia: State of the Market 2020
27

Buyers
BRC-A Buyer members are drawn from a diverse range of economic sectors, with strong representation among public sector organisations (local and state governments, higher education) and private enterprises spanning mining, metals and resources, food & beverage manufacturing, consumer goods retailers, transport, property and real estate, financial services and more.
The distribution among economic sectors of Buyers that answered the industry survey was largely representative of BRC-A Buyer membership.
Two-thirds of Buyer respondents are from businesses employing over 500 people, with small and medium enterprises constituting the remaining third.
Organisations responding to the survey tended to be at one end of the spectrum or the other in relation to their current purchase of renewable energy. Almost one-fifth of members currently do not purchase renewable energy. Just over 60 per cent source less than 20 per cent of their electricity from renewable sources. Just under 15 per cent are entirely powered by renewable energy. There are very few organisations that are in-between. Consequently, most are either at an early stage when it comes to renewable energy or they have negotiated a PPA which covers all of their electricity consumption.
Figure 37: Buyer respondents’ current level of renewable energy (#)
Source: Industry Surveys 2019-20, BRC-A
Figure 36: Buyer respondent employee count (%)
Source: Industry Surveys 2019-20, BRC-A
20-291-19 100-499 500+
66
6
24
4
0%
0%
5%
10%
15%
20%
25%
1-10%
10-2
0%
20-3
0%
30-4
0%
40-5
0%
50-6
0%
60-7
0%
70-8
0%
80-9
0%
90-10
0%
100%
Don
’t kn
ow
Corporate Renewable Power Purchase Agreements In Australia: State of the Market 2020
28
Developers
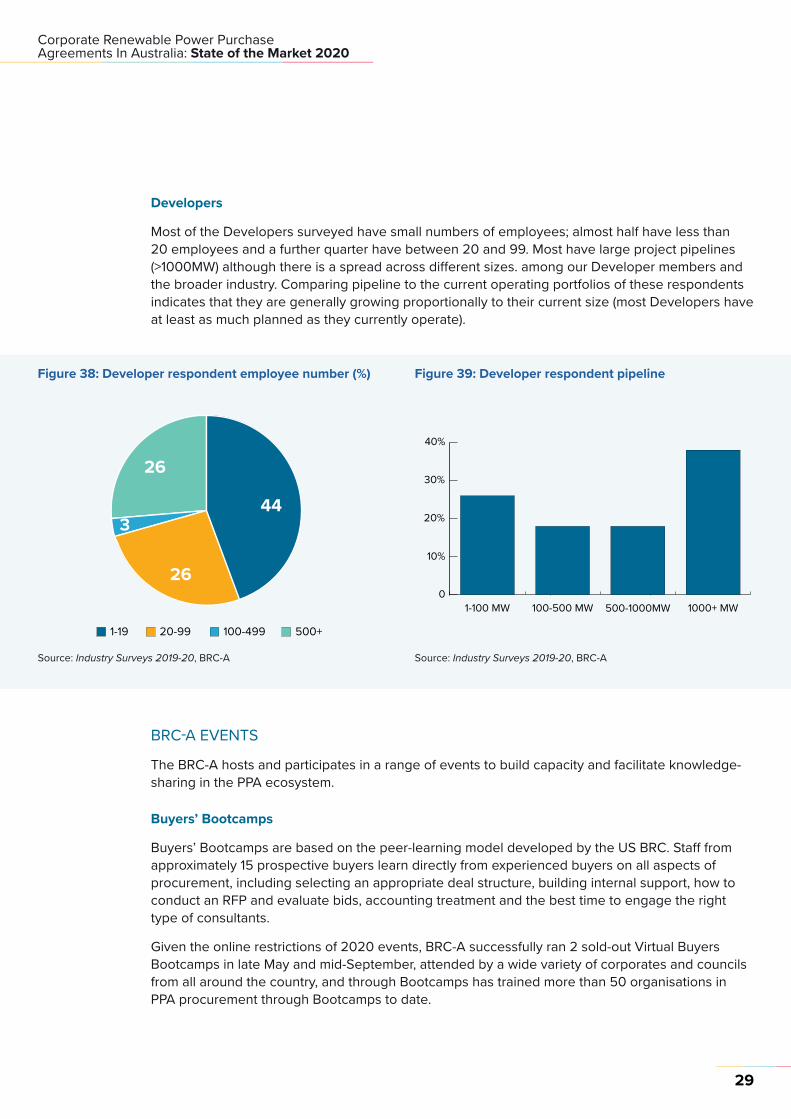
Most of the Developers surveyed have small numbers of employees; almost half have less than 20 employees and a further quarter have between 20 and 99. Most have large project pipelines (>1000MW) although there is a spread across different sizes. among our Developer members and the broader industry. Comparing pipeline to the current operating portfolios of these respondents indicates that they are generally growing proportionally to their current size (most Developers have at least as much planned as they currently operate).
BRC-A EVENTS
The BRC-A hosts and participates in a range of events to build capacity and facilitate knowledge-sharing in the PPA ecosystem.
Buyers’ Bootcamps
Buyers’ Bootcamps are based on the peer-learning model developed by the US BRC. Staff from approximately 15 prospective buyers learn directly from experienced buyers on all aspects of procurement, including selecting an appropriate deal structure, building internal support, how to conduct an RFP and evaluate bids, accounting treatment and the best time to engage the right type of consultants.
Given the online restrictions of 2020 events, BRC-A successfully ran 2 sold-out Virtual Buyers Bootcamps in late May and mid-September, attended by a wide variety of corporates and councils from all around the country, and through Bootcamps has trained more than 50 organisations in PPA procurement through Bootcamps to date.
Figure 38: Developer respondent employee number (%)
1-19 20-99 100-499
44
26
26
3
500+
Source: Industry Surveys 2019-20, BRC-A
Figure 39: Developer respondent pipeline
Source: Industry Surveys 2019-20, BRC-A
40%
30%
20%
10%
01-100 MW 500-1000MW 1000+ MW100-500 MW
Corporate Renewable Power Purchase Agreements In Australia: State of the Market 2020
29

Developer Bootcamps
The BRC-A also delivers annual Developer Bootcamps, and this year ran a virtual instalment in late August which involved the US Renewable Energy Buyers Alliance and experienced Australian PPA buyers conveying insight to renewable energy Developers operating in Australia on maximising RFP chances of success, understanding the buyer’s journey and tips on how best to differentiate their offering.
Industry Events
The BRC-A also participates in industry events to build awareness and understanding of Corporate PPAs through presentations on market trends, deal structures, case studies and by participants themselves. Since the launch in November-December 2018, BRC-A has participated regularly in All Energy, the Australian Clean Energy Summit and a range of other industry events (including Energy Users Association and Smart Energy Council events, various industry summits, Renewable Cities etc.).
Webinars
Educational webinars for BRC-A members are hosted as a quick, easily accessible way for members to get information on PPAs. A developer webinar for buyers to hear their perspectives was held as was a webinar on the Cities Power Partnership for councils.
In addition to contributing to the CEC’s Large-scale Solar Forum 2020 Webinar Series and others hosted by the Smart Energy Council and Australian Industry Group, in 2020 the BRC-A began an annual webinar series, Buying Power, which saw the following topics covered (which amassed nearly 1000 attendees in total): • Buying Power 1: Appetite for Renewable PPAs
• Buying Power 2: Understanding Retail PPAs
• Buying Power 3: Environmental Claims and 100% Renewable Energy
• Buying Power 4: Minimising Social Risks and Maximising Social Benefits
• Buying Power 5: City of Melbourne MREP II and the Power of Coming Together
BRC-A MARKETPLACE PLATFORM
The BRC-A website hosts an online marketplace platform where developers can list projects seeking an off-taker. Project listings include a range of information on the project status (e.g. seeking planning approval), terms (e.g. minimum term and purchase volume), technology and state. The marketplace is designed to assist buyers understand the market and help connect buyers and sellers.
As at mid-November 2020, the Marketplace Platform contained:• 102 renewable energy projects
• 14.2 GW of total capacity
The Marketplace also now allows Developer and Service Provider members to upload exemplary cases of their prior work and better differentiate themselves form other companies by selecting which categories their customisable profile appears in, the benefit of which is better visibility from the perspective of interested PPA Buyer members.
Corporate Renewable Power Purchase Agreements In Australia: State of the Market 2020
30

1 2 3 4 5 6 7 8 9
BUILDA team (internal and/or external)
DETERMINECompany goals & electricity load
UNDERSTANDThe di�erent
options
BUILDInternal support for a transaction
IDENTIFYYour risk
tolerances
RUNRFP
NEGOTIATEA contract
OBTAINFinal approval
FINALISEPre-COD
details
MANAGEPost-CODoperations
DEVELOPMarket approach
RUNProvisional approv-
als process
DEFINESpecific transaction
preferences
Figure 40: BRC-A Buyer’s Roadmap
BRC-A RESOURCES
The BRC-A is developing and adapting a range of primers, guides, tools and templates from the US for the Australian market. The centrepiece for BRC-A resources is the Buyer’s Roadmap, which includes a step-by-step guide to Corporate PPA procurement with supporting resources for each step of the process.
Source: BRC-A Member Portal 2019-20, BRC-A
Corporate Renewable Power Purchase Agreements In Australia: State of the Market 2020
31

Resource Library
The BRC has a licence from the Rocky Mountain Institute to adapt its primers, guides and tools to the Australian market. The BRC-A has to date adapted the following resources to the Australian market for its members:
• Accounting Primer
• Chief Financial Officer (CFO) Pitch Deck
• Deal Structure Primer
• Deal Team Guide
• Energy Management Principles Primer
• Renewable Retail PPAs Guide
• Request for Proposals (RFP) Template
• Social Licence Primer
• Term Sheet Template
The following BRC US resources are currently available to BRC-A members without adaptation:
• Aggregation Primer
• Finance Primer
• Risk Allocation Guide
Other guides that will be developed in coming months include:
• Combining Demand Management and PPAs
• Economic Analysis Primer
• Engaging Consultants Primer
• Environmental Claims Factsheet
• Internal Support Guide
• Project Due Diligence Primer
• RFP Template for Retail PPAs
• Term Sheet for Retail PPAs
Corporate Renewable Power Purchase Agreements In Australia: State of the Market 2020
32
Technical Advisory Panel
The BRC-A’s Technical Advisory Panel (TAP) is a group of professionals from leading industry organisations (including government, finance, consulting, academia) that collaborate with the BRC-A on industry-relevant matters, including but not limited to the development of BRC-A resources.
The membership of the TAP is:
• Adam Zaborszczyk, Independent Consultant
• Andrew Wilson, University of Queensland
• Anita Stadler, Energetics
• Aylin Cunsolo, Baker McKenzie
• Ben Waters, Presync
• Brian Morris, Macquarie Capital
• Ceri Binding, Westpac
• Daniel Teng, Origin Energy
• John Griffiths, City of Melbourne
• Monique Miller, Clean Energy Finance Corporation
• Simon Corbell, Energy Estate (Chair)
• Tricia Lorenzo, Flow Power
The BRC-A would like to express its gratitude for the ongoing contributions made by members of its TAP.
Corporate Renewable Power Purchase Agreements In Australia: State of the Market 2020
33

APPENDIX A: COMMUNITY BENEFITSFigure 41: Average rating out of 5 on Importance of jobs and other benefits for disadvantaged groups
0.0 0.5 1.0 1.5 2.0 2.5 3.0 3.5
Service Provider
Developer
Buyer
Source: Industry Surveys 2019-20, BRC-A
Figure 43: Average rating out of 5 on importance of local employment and industry
Figure 42: Importance of jobs and other benefits for disadvantaged groups, rating out of 5
0%
10%
20%
30%
40%
50%
60%
1 2 3 4 5
Developer (Completed)Buyer (Completed)
Service ProviderBuyer (Current) Developer (Current)
Source: Industry Surveys 2019-20, BRC-A
Figure 44: Importance of local employment and industry, rating out of 5
Source: Industry Surveys 2019-20, BRC-A
0.0 0.5 1.0 1.5 2.0 2.5 3.0 3.5
Service Provider
Developer
Buyer
Source: Industry Surveys 2019-20, BRC-A
0%
10%
20%
30%
40%
50%
60%
1 2 3 4 5
Developer (Completed)Buyer (Completed)
Service ProviderBuyer (Current) Developer (Current)
Corporate Renewable Power Purchase Agreements In Australia: State of the Market 2020
34
APPENDIX B: INDUSTRY SURVEY QUESTIONS
ENERGY BUYERS
Which of the following sectors best describes the primary activities of your organisation?• Education and Training• Public Administration and Safety• Construction• Manufacturing• Retail, Hiring, Property Operators and Real Estate Services• Accommodation and Food Services• Electricity, Gas, Water and Waste Services• Financial and Insurance Services• Retail Trade• Mining• Arts and Recreation Services• Health Care and Social Assistance• Professional, Scientific and Technical Services• Transport, Postal and Warehousing• Administrative and Support Services• Agriculture, Fishing, Forestry• Information Media and Telecommunications• Wholesale Trade• Other
How many persons does your organisation employ?• 500+• 100-499• 1-19• 20-99 What is the size of your annual electricity load?• 50-200 GWh• 0-15 Gigawatt-hours (GWh)• 15-30 GWh• 200+ GWh• 30-50 GWh
Corporate Renewable Power Purchase Agreements In Australia: State of the Market 2020
35

What proportion of your electricity load is currently sourced from renewable energy?• 1-10%• 0%• 10-20%• 100%• 20-30%• Don’t know• 40-50%• 80-90%• 30-40%• 50-60%• 60-70%• 70-80%• 90-99%*Experience with Corporate Renewable Power Purchase Agreements (PPA)*Which of the following best describes the level of experience of your organisation with a re-newable energy PPA:• Our organisation has completed a PPA• Our organisation is currently pursuing or investigating whether to pursue a PPA• Our organisation is interested in learning more about PPAs but has not taken any major steps• We looked at PPAs but have decided they are not a good option for our organisation• We don’t know much about PPAs and are not interested Why is your organisation disinterested in PPAs?• Insufficient cost savings• Long terms unsuitable for our organisation• Too risky• Too complex• OtherIf your organisation has completed a PPAHow long did the process take from start to finish?• 6-12 months• 18-24 months• 12-18 months• 2+ years• < 6 months On a scale of 1-5, how challenging was it to develop a PPA?• 1• 2• 3• 4• 5
Corporate Renewable Power Purchase Agreements In Australia: State of the Market 2020
36
At what stage of the process would independent assistance have been most helpful?• Business case and internal stakeholder support• Investigating/assessing options• Procurement process• Negotiation What were the major barriers you experienced?• The complexity of PPAs and understanding the options• Market uncertainty• Securing internal agreement• Negotiating a deal that met the needs of your organisation and the developer• Finding the right specialists• Accounting issues• Finding the right project or developer• Transaction costs• Policy uncertainty• COVID-19 impacts• Licensing issues• No major barrier• Other
On a scale of 1-5, how would you rate the scale of transaction costs of a PPA?• 1• 2• 3• 4• 5 What type of PPA did you choose?• Wholesale (direct agreement with RE project separate from retail contract)• Retail (PPA integrated into retail contract)• Sleeved (PPA negotiated with project and then integrated into retail contract)• Other Why did you choose this type of PPA?• Most familiar• Less complexity• Risk management• Financial/price• Transaction costs• Legal or accounting issues• Impact/sustainability/PR• Other
Corporate Renewable Power Purchase Agreements In Australia: State of the Market 2020
37

When evaluating Corporate PPAs, how important was *PPA price*?(5 = extremely important, 1 = not important at all)?• 1• 2• 3• 4• 5 How important were *community benefits (benefit fund, infrastructure etc.)*?• 1• 2• 3• 4• 5
*The* *developer’s reputation*?• 1• 2• 3• 4• 5
*Local community support (i.e. social licence)*?• 1• 2• 3• 4• 5
*Financial risks*?• 1• 2• 3• 4• 5
*Jobs and other benefits for disadvantaged groups*?• 1• 2• 3• 4• 5
*Impacts on local environment and biodiversity*?• 1• 2• 3• 4• 5
Corporate Renewable Power Purchase Agreements In Australia: State of the Market 2020
38
*Local employment and industry*?• 1• 2• 3• 4• 5
Were there any other important criteria when evaluating Corporate PPAs? Please list.
In retrospect, what is the one change you would recommend to make it easier to do PPAs?
If your organisation is currently pursuing or investigating whether to pursue a PPAWhat is the main driver for your organisation?• Electricity price certainty• Lower electricity prices• Greenhouse emissions or renewable energy targets• Brand leadership• Corporate Social Responsibility goals• Other
What has been the impact of Covid-19 on your organisation’s interest in a PPA?• No impact – we are still considering or pursuing a renewable PPA• No impact – we were not considering or pursuing a renewable PPA• Positive impact – our interest in a renewable PPA has increased• Negative impact – our interest in a renewable PPA has decreased• Unsure
Why has your interest in a PPA increased?• Greater price certainty/less exposure to electricity price changes• Climate or renewable energy targetss• Cost savings• Corporate sustainability goals• Brand and social reputation• Other
Why has your interest in a PPA decreased?• Less scope for cost savings• Focussing on core business/less time and resources• Other
How advanced are you in the process of pursuing a PPA?• We are in negotiations with project developers• We have issued or are about to issue a Request for Proposal• We are currently assessing the business case for an PPA• We are investigating the feasibility of an PPA
Corporate Renewable Power Purchase Agreements In Australia: State of the Market 2020
39
What are the primary areas on which you’re seeking information and/or support for PPAs?• Understanding the electricity market• Options assessment• Economic or financial aspects• Legal and/or accounting issues• Electricity markets pricing• Strategies for securing internal support• Template documents (e.g. RFPs, term sheets)• Strategies for aggregated deals
What are the major barriers you have encountered to date?• Choosing the right model that meets your organisation’s needs• Internal agreement or commitment• Understanding of electricity markets and pricing• Transaction costs• Legal or accounting standards• Finding the right project or developer• Finding the right specialists to support you• Market uncertainty• Policy uncertainty• COVID-19 impacts• None• Other
When evaluating Corporate PPAs, how important do you expect *PPA Price* will be?(5 = extremely important, 1 = not important at all)?• 1• 2• 3• 4• 5
How important do you expect *community benefits (benefit fund, infrastructure etc.)* will be?• 1• 2• 3• 4• 5
*The developer’s reputation*?• 1• 2• 3• 4• 5
Corporate Renewable Power Purchase Agreements In Australia: State of the Market 2020
40

*Local community support (i.e. social licence)*?• 1• 2• 3• 4• 5
*Financial risks*?• 1• 2• 3• 4• 5
*Jobs and other benefits for disadvantaged groups*?• 1• 2• 3• 4• 5
*Impacts on local environment and biodiversity*?• 1• 2• 3• 4• 5
*Local employment and industry*?• 1• 2• 3• 4• 5
Are there any other criteria you expect will be important when evaluating Corporate PPAs? Please list.
If your organisation is interested in learning more about an PPAWhat is the main driver(s) for your organisation?• Electricity price certainty• Lower electricity prices• Greenhouse emissions or renewable energy targets• Brand leadership• Corporate Social Responsibility goals• Other
Corporate Renewable Power Purchase Agreements In Australia: State of the Market 2020
41

What are the primary areas on which you seeking information and/or support for PPAs?• Costs and benefits of PPAs• Options and deal structures• Economic or financial aspect• Legal and accounting issues• Electricity markets• Strategies for securing internal support• Template documents (e.g. RFPs, term sheets)• Strategies for aggregated deals• Other
Is your organisation a BRC-A Member?• Yes• No• I don’t know
What was your primary reason for joining?• Education and training• Networking and industry connections• Access to the marketplace platform• Making connections with buyers• Making connections with developers• Events
DEVELOPERS
How many persons does your organisation employ?• 1-19• 20-99• 100-499• 500+
What is the size of your current (operating) portfolio in Australia?• 0-100 MW• 100-500 MW• 500-1000 MW• 1000-2000 MW• 2000+
What is the size of your future project pipeline in Australia?• 0-100 MW• 100-500 MW• 500-1000 MW• 1000+ MW
Corporate Renewable Power Purchase Agreements In Australia: State of the Market 2020
42
In which states do you have operating projects?• NSW• VIC• QLD• SA• TAS
Experience with corporate PPAsWhich of the following best describes the level of experience of your organisation with a corpo-rate renewable energy PPA:• Our organisation has completed a Corporate Renewable PPA in the past 2 years• Our organisation is considering or pursuing a Corporate Renewable PPA• Our organisation is not interested in pursuing a Corporate Renewable PPA
If your organisation has completed a Corporate Renewable PPAHow long did the process take from start to finish?• < 6 months• 6-12 months• 12-18 months• 18-24 months• 2+ years
On a scale of 1-5, how challenging was it to develop a PPA?• 1• 2• 3• 4• 5
At what stage of the PPA process could independent assistance be most helpful?• Helping buyers assess options• EOIs• RFPs• Negotiation• Other
What were the major barriers you experienced?• Transaction costs• The complexity of the process• Buyer understanding of PPAs• Buyer legal or accounting issues• Buyer price expectations• Finding the right buyer• Negotiating a deal that met the needs of your organisation and the buyer• Market or policy uncertainty• COVID-19 impacts• No major barrier• Other
Corporate Renewable Power Purchase Agreements In Australia: State of the Market 2020
43

On a scale of 1-5, how would you rate the scale of transaction costs of a corporate PPA?• 1• 2• 3• 4• 5
In your experience, when Buyers are evaluating Corporate PPAs, how important is *PPA price*?• 1• 2• 3• 4• 5
In your experience, how important are *community benefits (benefit fund, infrastructure etc.)*?• 1• 2• 3• 4• 5
*Developer reputation*?• 1• 2• 3• 4• 5
*Local community support (i.e. social licence)*?• 1• 2• 3• 4• 5
*Financial risks*?• 1• 2• 3• 4• 5
*Jobs and other benefits for disadvantaged groups*?• 1• 2• 3• 4• 5
Corporate Renewable Power Purchase Agreements In Australia: State of the Market 2020
44

*Impacts on local environment and biodiversity*?• 1• 2• 3• 4• 5
*Local employment and industry*?• 1• 2• 3• 4• 5
Were there any other important criteria for Buyers when evaluating Corporate PPAs? Please list.
In retrospect, what is the one change you would recommend to make it easier to do PPAs?
If your organisation is currently pursuing or investigating whether to pursue a corpo-rate PPAHow advanced are you in the process of pursuing a PPA?• We are in negotiations with project buyers• We have responded or are about to respond to a Request for Proposal• We are currently searching for PPA off-takers• We are investigating the feasibility of a PPA
What are the major barriers you have encountered to date?• Buyer understanding (e.g. electricity markets and pricing)• Finding a buyer• Buyer price expectations• Other buyer expectations or requirements (e.g. RFP)• Negotiating a deal that meets the needs of your organisation and the buyer• Market and policy uncertainty• Transaction costs• COVID-19 impacts• None• Other
What kind of independent assistance would be most helpful in supporting your PPA processes or the market at large?• Educating buyers• Connections with buyers• Template documents (e.g. RFPs, term sheets)• Strategies for aggregated deals• Lower transaction costs• Other
Corporate Renewable Power Purchase Agreements In Australia: State of the Market 2020
45

In your experience, when Buyers are evaluating Corporate PPAs, how important is *PPA price*?• 1• 2• 3• 4• 5
In your experience, how important are *community benefits (benefit fund, infrastructure etc.)*?• 1• 2• 3• 4• 5
*Developer reputation*?• 1• 2• 3• 4• 5
*Local community support (i.e. social licence)*?• 1• 2• 3• 4• 5
*Financial risks*?• 1• 2• 3• 4• 5
*Jobs and other benefits for disadvantaged groups*?• 1• 2• 3• 4• 5
*Impacts on local environment and biodiversity*?• 1• 2• 3• 4• 5
Corporate Renewable Power Purchase Agreements In Australia: State of the Market 2020
46

*Local employment and industry*?• 1• 2• 3• 4• 5
Are there any other important criteria for Buyers when evaluating Corporate PPAs? Please list.
What is the minimum contract *length (years)* you’re seeking in a PPA?
What is the minimum *off-take agreement scale (GWh)* you’re seeking in a PPA?
Why are you not interested in Corporate Renewable PPAs?• The transaction costs are too high• There are insufficient buyers at the right scale for our project• There is not interest from buyers at the moment• Other
What has been the impact of Covid-19 on level of buyer interest in a Corporate Renewable PPA?• No impact – the level of demand amongst buyers is the same• Positive impact – the level of demand amongst buyers has increased• Negative impact – the level of demand amongst buyers has decreased• Unsure
Why in your assessment has the interest in PPAs amongst buyers increased?• Buyers are seeking greater price certainty• There are more buyers with climate or renewable energy targets• There are more buyers with Corporate sustainability goals• Other
Why in your assessment has the interest in PPAs amongst buyers decreased?• Less scope for cost savings• Focussing on core business/less time and resources• Other
Is your organisation a BRC-A Member?• Yes• No• I don’t know
What was your primary reason for joining?• Education and training• Networking and industry connections• Access to the marketplace platform• Making connections with buyers• Events
Corporate Renewable Power Purchase Agreements In Australia: State of the Market 2020
47
SERVICE PROVIDERS
How many persons does your organisation employ?• 1-19• 20-99• 100-499• 500+
What type of services do you provide?• Accounting• Financial• Legal• Corporate Strategy/marketing• Energy advice• Sustainability advice• Other
Which of the following best describes the level of experience of your organisation with a corpo-rate renewable energy PPA:• Our organisation has provided services for a PPA• Our organisation has not yet provided services for a PPA
If your organisation has been involved in a PPAHow long did the process take from start to finish?• < 6 months• 6-12 months• 12-18 months• 18-24 months• 2+ years
On a scale of 1-5, how challenging was it to develop a PPA?• 1• 2• 3• 4• 5
What are the major barriers experienced in PPA transactions?• Transaction costs• The complexity of the process• Buyer understanding of PPAs• Buyer legal or accounting issues• Buyers securing internal agreement• Developer understanding of buyer needs or processes• Negotiating a deal that met the needs of both organisation• Market uncertainty• Policy uncertainty• COVID-19 impacts• No major barrier• Other
Corporate Renewable Power Purchase Agreements In Australia: State of the Market 2020
48

On a scale of 1-5, how would you rate the scale of transaction costs of an PPA?• 1• 2• 3• 4• 5
In your experience, when Buyers are evaluating Corporate PPAs, how important is *PPA price*?(5 = extremely important, 1 = not important at all)• 1• 2• 3• 4• 5
When Buyers are evaluating Corporate PPAs, how important are *community benefits (benefit fund, infrastructure etc.)*?• 1• 2• 3• 4• 5
*The developer’s reputation*?• 1• 2• 3• 4• 5
*Local community support (i.e. social licence)*?• 1• 2• 3• 4• 5
*Financial risks*?• 1• 2• 3• 4• 5
*Jobs and other benefits for disadvantaged groups*?• 1• 2• 3• 4• 5
Corporate Renewable Power Purchase Agreements In Australia: State of the Market 2020
49

*Impacts on local environment and biodiversity*?• 1• 2• 3• 4• 5
*Local employment and industry*?• 1• 2• 3• 4• 5
Were there any other important criteria when evaluating Corporate PPAs? Please list.
In retrospect, what is the one change you would recommend to make it easier to do PPAs?
What has been the impact of Covid-19 on level of buyer interest in a PPAs?• No impact – the level of demand amongst buyers is the same• Positive impact – the level of demand amongst buyers has increased• Negative impact – the level of demand amongst buyers has decreased• Unsure
Why in your assessment has the interest in PPAs amongst buyers increased?• Buyers are seeking greater price certainty• There are more buyers with climate or renewable energy targets• There are more buyers with Corporate sustainability goals
Why in your assessment has the interest in PPAs amongst buyers decreased?• Less scope for cost savings• Focussing on core business/less time and resources• Other
What are the primary areas on which BRC-A should provide information? • Options assessment• Economic or financial aspects• Legal and/or accounting issues• Deal structuring• Electricity markets and pricing• Template documents (e.g. RFPs, term sheets)• Strategies for aggregated deals• Other
Is your organisation a BRC-A Member?• Yes• No• I don’t know
Corporate Renewable Power Purchase Agreements In Australia: State of the Market 2020
50

What was your primary reason for joining?• Education and training• Networking and industry connections• Access to the marketplace platform• Making connections with buyers• Making connections with developers• Events• Other
At what stage of the PPA process could independent assistance be most helpful?• When buyers are seeking to understand the electricity market and how PPAs work• When buyers are assessing options• When developers are seeking connections/advice• EOIs• RFPs• Negotiation• Other
Corporate Renewable Power Purchase Agreements In Australia: State of the Market 2020
51


BRC-A is supported by funding from:
WHO IS BRC-A?A not-for-profit initiative of Climate-KIC Australia, WWF-Australia’s and the Institute for Sustainable Futures (UTS).