state of the market report for pjm - … · 2011 state of the market report for pjm monitoring...
TRANSCRIPT

2011
State of the Market Report for PJM
Monitoring Analytics, LLCIndependent Market Monitor for PJM
3.15.2012
Volume 2:DetailedAnalysis

2011 State of the Market Report for PJM i
Preface
© 2012 Monitoring Analytics, LLC
PrefaceThe PJM Market Monitoring Plan provides:
The Market Monitoring Unit shall prepare and submit contemporaneously to the Commission, the State Commissions, the PJM Board, PJM Management and to the PJM Members Committee, annual state-of-the-market reports on the state of competition within, and the efficiency of, the PJM Markets, and quarterly reports that update selected portions of the annual report and which may focus on certain topics of particular interest to the Market Monitoring Unit. The quarterly reports shall not be as extensive as the annual reports. In its annual, quarterly and other reports, the Market Monitoring Unit may make recommendations regarding any matter within its purview. The annual reports shall, and the quarterly reports may, address, among other things, the extent to which prices in the PJM Markets reflect competitive outcomes, the structural competitiveness of the PJM Markets, the effectiveness of bid mitigation rules, and the effectiveness of the PJM Markets in signaling infrastructure investment. These annual reports shall, and the quarterly reports may include recommendations as to whether changes to the Market Monitoring Unit or the Plan are required.1
Accordingly, Monitoring Analytics, LLC, which serves as the Market Monitoring Unit (MMU) for PJM Interconnection, L.L.C. (PJM),2 and is also known as the Independent Market Monitor for PJM (IMM), submits this 2011 State of the Market Report for PJM.
1 PJM Open Access Transmission Tariff (OATT) Attachment M (PJM Market Monitoring Plan) § VI.A. Capitalized terms used herein and not otherwise defined have the meaning provided in the OATT, PJM Operating Agreement, PJM Reliability Assurance Agreement or other tariff that PJM has on file with the Federal Energy Regulatory Commission (FERC or Commission).
2 OATT Attachment M § II(f).

ii Preface
2011 State of the Market Report for PJM
© 2012 Monitoring Analytics, LLC
2011 State of the Market Report for PJM 1
Section 1 Introduction
© 2012 Monitoring Analytics, LLC
Introduction2011 In ReviewThe state of the PJM markets in 2011 was good. The results of the energy market and the results of the capacity market were competitive.
The goal of a competitive power market is to provide power at the lowest possible price, consistent with cost. PJM markets met that goal in 2011. The test of a competitive power market is how it reacts to change. PJM markets have passed that test so far, but that test continues. There were significant changes in the economic environment of PJM markets in 2011, and of all wholesale power markets, and change will continue in future years. Continued success requires markets that are flexible and adaptive. However, wholesale power markets are defined by complex rules. Markets do not automatically provide competitive and efficient outcomes. There are still areas of market design that need further improvement in order to ensure that the PJM markets continue to adapt successfully to changing conditions. The details of market design matter.
Gas prices fell and coal prices rose in 2011. Gas prices decreased on average by 10 percent and coal prices increased on average by 19 percent in 2011. PJM LMPs were lower. The load-weighted average LMP was five percent lower in 2011. PJM capacity prices were lower. PJM average capacity prices were 18 percent lower in 2011. Significant new environmental regulations requiring new emission control technology will take effect in 2015, including MATS and HEDD, affecting current decisions about participation in the capacity market auction to be held in May for the 2015/2016 delivery year.
The results of the market dynamics in 2011 were generally positive for gas fired units, especially new combined cycle units. Total new entrant combined cycle revenues were generally higher in 2011 and exceeded the threshold to incent new entry for most zones.
Five large plants, each over 500 MW, began generating in PJM in 2011. This is the first time since 2006 that a plant rated at more than 500 MW has come online in PJM. Overall, 5,008 MW of nameplate capacity were added in PJM in 2011. Average offered supply increased by 14,478, or 9.3 percent, from 156,003 MW in the
summer of 2010 to 170,481 MW in the summer of 2011, including the integration of the ATSI zone in the second quarter.
The results of the market dynamics in 2011 were generally negative for coal fired units, especially older, smaller coal fired units without the required technologies to meet the new environmental regulations. The profitability of coal units declined as a result of declining revenues and increased costs. Market revenues, including capacity market revenues, were not enough to cover even the going forward costs of some of these coal units. The situation was worse for units requiring additional investments to meet environmental regulations.
A total of 1,322.3 MW of generation capacity retired in 2011, and it is expected that a total of 18,886 MW will retire from 2011 through 2019, with most of this capacity retiring by the end of 2015. Units planning to retire in 2012 make up 7,189 MW, or 41 percent of all planned retirements. In addition, between 5,764 and 6,936 MW of coal generation is at risk in the PJM market areas that participate in PJM capacity markets.
The PJM capacity market makes the PJM markets more flexible and more able to adapt to the significant changes that are affecting PJM market participants. The use of a forward looking capacity market rather than reliance on real time scarcity pricing to address these issues will permit the adjustment process to occur while reducing risk and dislocations.
The changes in the economic environment make it even more critical to complete the task of getting the design of the capacity market right. In order to ensure that the appropriate market incentives exist to replace retiring units, the capacity market prices must reflect underlying supply and demand fundamentals and especially local supply and demand fundamentals. Significant factors that result in capacity market prices failing to reflect fundamentals should be addressed. This includes both the 2.5 percent reduction in demand that suppresses market prices and the continued inclusion of inferior demand side products that also suppress market prices. Demand side resources are critical to the success of PJM markets, but they no longer need special treatment. The importance of demand side resources in the capacity market make it more critical that such resources be

2 Section 1 Introduction
2011 State of the Market Report for PJM
© 2012 Monitoring Analytics, LLC
full capacity resources, required to interrupt whenever called.
Markets need information in order to function effectively. It is no longer acceptable that generation owners provide only 90 days notice of retirements. That is clearly not enough time for the capacity market to react. Some generation owners have voluntarily provided substantially longer notice. If the higher prices which result from retirements are to provide incentives for required new entry, notice should be at least a year. PJM should consider doing full reliability analyses of all capacity resources at risk, as soon as they are identified, to ensure that locational capacity markets are appropriately defined and that transmission upgrades are completed prior to retirements if appropriate. Continued progress is needed on the transmission interconnection process to ensure that economic generation can be built in a timely manner. State commissions have raised significant questions about whether the capacity market design will maintain local reliability. The market design must be modified to ensure that these questions are answered.
The PJM markets and PJM market participants from all sectors face significant challenges as a result of the changing economic environment. PJM and its market participants worked constructively to address these challenges in 2011 and will need to continue to do so to ensure the continued effectiveness of PJM markets.
PJM Market BackgroundThe PJM Interconnection, L.L.C. operates a centrally dispatched, competitive wholesale electric power market that, as of December 31, 2011, had installed generating capacity of 178,847 megawatts (MW) and more than 750 market buyers, sellers and traders of electricity1 in a region including more than 58 million people2 in
1 See “Company Overview.” PJM.com. PJM Interconnection L.L.C. n.d. 1 January. 2012. <http://pjm.com/about-pjm/who-we-are/company-overview.aspx>.
2 See “Company Overview.” PJM.com. PJM Interconnection L.L.C. n.d. 1 January. 2012 <http://pjm.com/about-pjm/who-we-are/company-overview.aspx>.
all or parts of Delaware, Illinois, Indiana, Kentucky, Maryland, Michigan, New Jersey, North Carolina, Ohio, Pennsylvania, Tennessee, Virginia, West Virginia and the District of Columbia (Figure 1-1).3 In 2011, PJM had total billings of $35.9 billion. As part of that market operator function, PJM coordinates and directs the operation of the transmission grid and plans transmission expansion improvements to maintain grid reliability in this region.
Figure 1-1 PJM’s footprint and its 18 control zones4,5
PJM operates the Day-Ahead Energy Market, the Real-Time Energy Market, the Reliability Pricing Model (RPM) Capacity Market, the Regulation Market, the Synchronized Reserve Markets, the Day Ahead Scheduling Reserve (DASR) Market and the Long Term, Annual and Monthly Balance of Planning Period Auction Markets in Financial Transmission Rights (FTRs).
PJM introduced energy pricing with cost-based offers and market-clearing nodal prices on April 1, 1998, and
3 See the 2011 State of the Market Report for PJM, Volume II, Appendix A, “PJM Geography” for maps showing the PJM footprint and its evolution prior to 2011.
4 On June 1, 2011, the American Transmission Systems, Inc. (ATSI) Control Zone joined the PJM footprint.
5 On January 1, 2012, the Duke Energy Ohio/Kentucky (DEOK) region joined the PJM footprint. This report covers calendar year 2011, so Figure 1-1 and the data in this report do not include results from the DEOK area.
2011 State of the Market Report for PJM 3
Section 1 Introduction
© 2012 Monitoring Analytics, LLC
market-clearing nodal prices with market-based offers on April 1, 1999. PJM introduced the Daily Capacity Market on January 1, 1999, and the Monthly and Multimonthly Capacity Markets for the January through May 1999 period. PJM implemented an auction-based FTR Market on May 1, 1999. PJM implemented the Day-Ahead Energy Market and the Regulation Market on June 1, 2000. PJM modified the regulation market design and added a market in spinning reserve on December 1, 2002. PJM introduced an Auction Revenue Rights (ARR) allocation process and an associated Annual FTR Auction effective June 1, 2003. PJM introduced the RPM Capacity Market effective June 1, 2007. PJM implemented the DASR Market on June 1, 2008.6,7
On June 1, 2011, PJM integrated the American Transmission Systems, Inc. (ATSI) Control Zone. The metrics reported in this 2011 State of the Market Report for PJM include the integration of the ATSI zone for the period from June through December.
ConclusionsThis report assesses the competitiveness of the markets managed by PJM in 2011, including market structure, participant behavior and market performance. This report was prepared by and represents the analysis of the independent Market Monitoring Unit (MMU) for PJM.
For each PJM market, market structure is evaluated as competitive or not competitive, and participant behavior is evaluated as competitive or not competitive. Most important, the outcome of each market, market performance, is evaluated as competitive or not competitive.
The MMU also evaluates the market design for each market. The market design serves as the vehicle for translating participant behavior within the market structure into market performance. This report evaluates the effectiveness of the market design of each PJM
6 See also the 2011 State of the Market Report for PJM, Volume II, Appendix B, “PJM Market Milestones.”
7 Analysis of 2011 market results requires comparison to prior years. During calendar years 2004 and 2005, PJM conducted the phased integration of five control zones: ComEd, American Electric Power (AEP), The Dayton Power & Light Company (DAY), Duquesne Light Company (DLCO) and Dominion. In June 2011, the American Transmission Systems, Inc. (ATSI) Control Zone joined PJM. By convention, control zones bear the name of a large utility service provider working within their boundaries. The nomenclature applies to the geographic area, not to any single company. For additional information on the integrations, their timing and their impact on the footprint of the PJM service territory prior to 2011, see the 2011 State of the Market Report for PJM, Volume II, Appendix A, “PJM Geography.”
market in providing market performance consistent with competitive results.
Market structure refers to the ownership structure of the market. The three pivotal supplier test is the most relevant measure of market structure because it accounts for both the ownership of assets and the relationship between ownership among multiple entities and the market demand and it does so using actual market conditions reflecting both temporal and geographic granularity. Market shares and the related Herfindahl-Hirschman Index (HHI) are also measures of market structure.
Participant behavior refers to the actions of individual market participants, also sometimes referenced as participant conduct.
Market performance refers to the outcome of the market. Market performance reflects the behavior of market participants within a market structure, mediated by market design.
Market design means the rules under which the entire relevant market operates, including the software that implements the market rules. Market rules include the definition of the product, the definition of marginal cost, rules governing offer behavior, market power mitigation rules, and the definition of demand. Market design is characterized as effective, mixed or flawed. An effective market design provides incentives for competitive behavior and permits competitive outcomes. A mixed market design has significant issues that constrain the potential for competitive behavior to result in competitive market performance, and does not have adequate rules to mitigate market power or incent competitive behavior. A flawed market design produces inefficient outcomes which cannot be corrected by competitive behavior.
4 Section 1 Introduction
2011 State of the Market Report for PJM
© 2012 Monitoring Analytics, LLC
occurs only in the case of local market power. When a transmission constraint creates the potential for local market power, PJM applies a structural test to determine if the local market is competitive, applies a behavioral test to determine if generator offers exceed competitive levels and applies a market performance test to determine if such generator offers would affect the market price.9
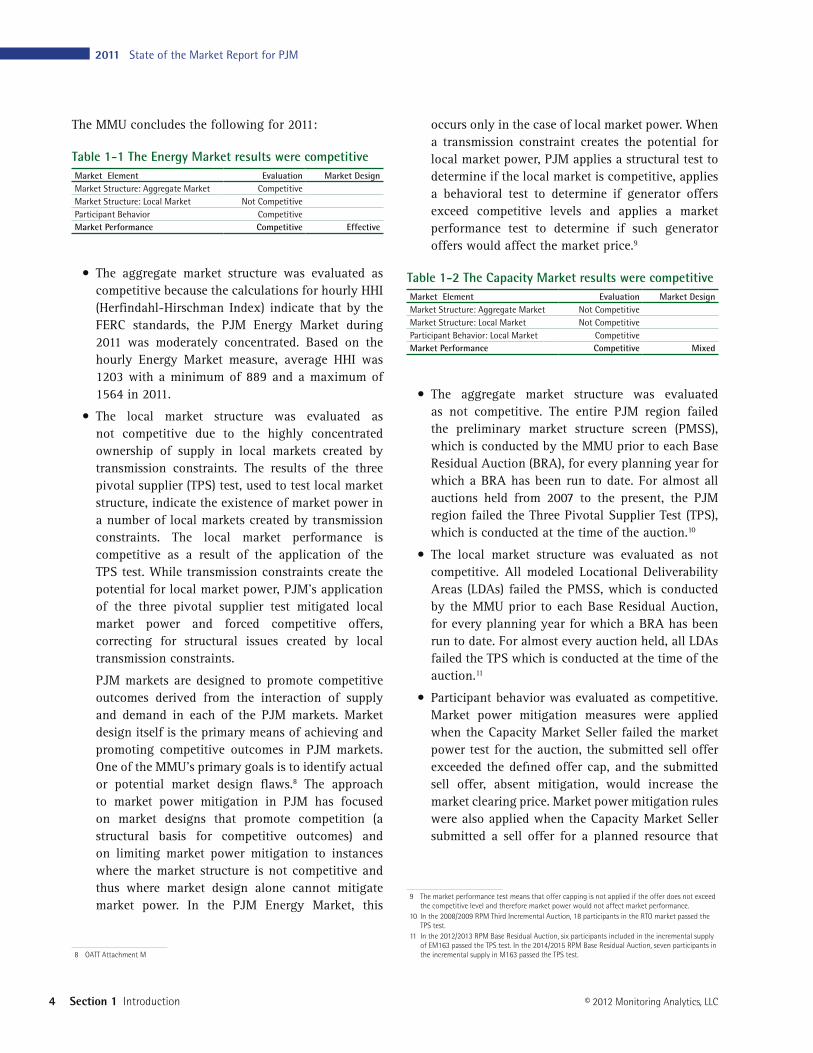
Table 1-2 The Capacity Market results were competitiveMarket Element Evaluation Market DesignMarket Structure: Aggregate Market Not CompetitiveMarket Structure: Local Market Not CompetitiveParticipant Behavior: Local Market CompetitiveMarket Performance Competitive Mixed
•The aggregate market structure was evaluated as not competitive. The entire PJM region failed the preliminary market structure screen (PMSS), which is conducted by the MMU prior to each Base Residual Auction (BRA), for every planning year for which a BRA has been run to date. For almost all auctions held from 2007 to the present, the PJM region failed the Three Pivotal Supplier Test (TPS), which is conducted at the time of the auction.10
•The local market structure was evaluated as not competitive. All modeled Locational Deliverability Areas (LDAs) failed the PMSS, which is conducted by the MMU prior to each Base Residual Auction, for every planning year for which a BRA has been run to date. For almost every auction held, all LDAs failed the TPS which is conducted at the time of the auction.11
•Participant behavior was evaluated as competitive. Market power mitigation measures were applied when the Capacity Market Seller failed the market power test for the auction, the submitted sell offer exceeded the defined offer cap, and the submitted sell offer, absent mitigation, would increase the market clearing price. Market power mitigation rules were also applied when the Capacity Market Seller submitted a sell offer for a planned resource that
9 The market performance test means that offer capping is not applied if the offer does not exceed the competitive level and therefore market power would not affect market performance.
10 In the 2008/2009 RPM Third Incremental Auction, 18 participants in the RTO market passed the TPS test.
11 In the 2012/2013 RPM Base Residual Auction, six participants included in the incremental supply of EM163 passed the TPS test. In the 2014/2015 RPM Base Residual Auction, seven participants in the incremental supply in M163 passed the TPS test.
The MMU concludes the following for 2011:
Table 1-1 The Energy Market results were competitiveMarket Element Evaluation Market DesignMarket Structure: Aggregate Market CompetitiveMarket Structure: Local Market Not CompetitiveParticipant Behavior CompetitiveMarket Performance Competitive Effective
•The aggregate market structure was evaluated as competitive because the calculations for hourly HHI (Herfindahl-Hirschman Index) indicate that by the FERC standards, the PJM Energy Market during 2011 was moderately concentrated. Based on the hourly Energy Market measure, average HHI was 1203 with a minimum of 889 and a maximum of 1564 in 2011.
•The local market structure was evaluated as not competitive due to the highly concentrated ownership of supply in local markets created by transmission constraints. The results of the three pivotal supplier (TPS) test, used to test local market structure, indicate the existence of market power in a number of local markets created by transmission constraints. The local market performance is competitive as a result of the application of the TPS test. While transmission constraints create the potential for local market power, PJM’s application of the three pivotal supplier test mitigated local market power and forced competitive offers, correcting for structural issues created by local transmission constraints.
PJM markets are designed to promote competitive outcomes derived from the interaction of supply and demand in each of the PJM markets. Market design itself is the primary means of achieving and promoting competitive outcomes in PJM markets. One of the MMU’s primary goals is to identify actual or potential market design flaws.8 The approach to market power mitigation in PJM has focused on market designs that promote competition (a structural basis for competitive outcomes) and on limiting market power mitigation to instances where the market structure is not competitive and thus where market design alone cannot mitigate market power. In the PJM Energy Market, this
8 OATT Attachment M
2011 State of the Market Report for PJM 5
Section 1 Introduction
© 2012 Monitoring Analytics, LLC
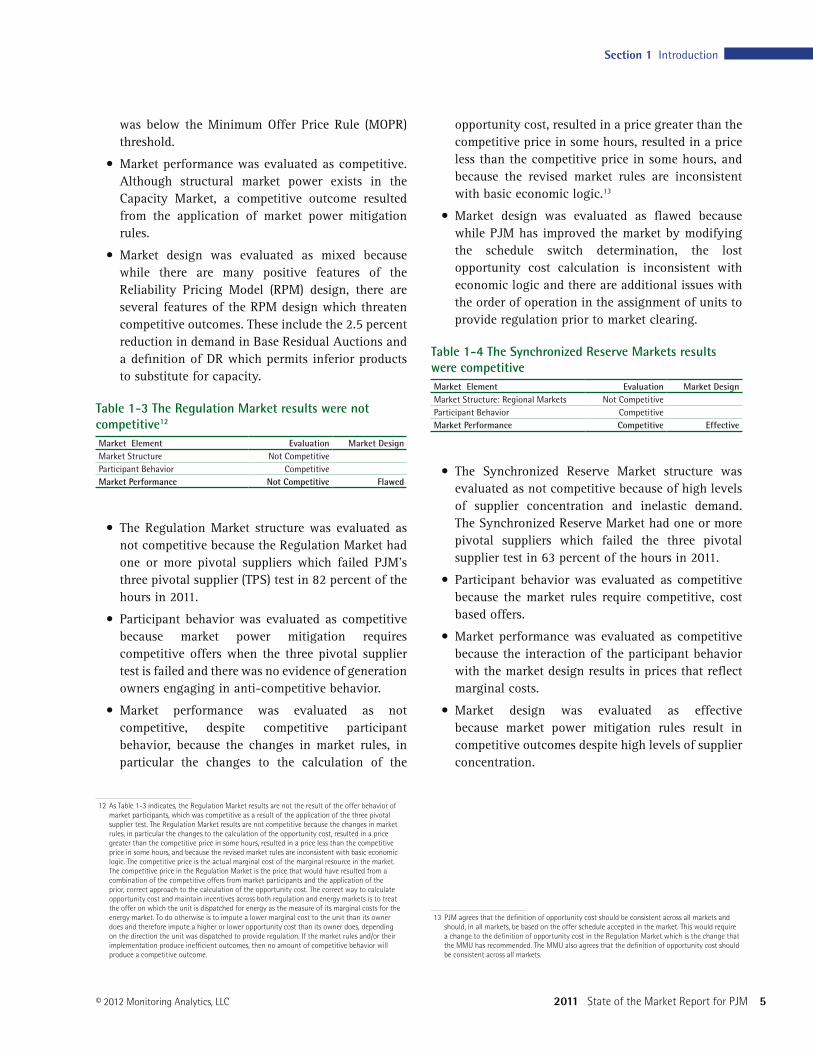
opportunity cost, resulted in a price greater than the competitive price in some hours, resulted in a price less than the competitive price in some hours, and because the revised market rules are inconsistent with basic economic logic.13
•Market design was evaluated as flawed because while PJM has improved the market by modifying the schedule switch determination, the lost opportunity cost calculation is inconsistent with economic logic and there are additional issues with the order of operation in the assignment of units to provide regulation prior to market clearing.
Table 1-4 The Synchronized Reserve Markets results were competitiveMarket Element Evaluation Market DesignMarket Structure: Regional Markets Not CompetitiveParticipant Behavior CompetitiveMarket Performance Competitive Effective
•The Synchronized Reserve Market structure was evaluated as not competitive because of high levels of supplier concentration and inelastic demand. The Synchronized Reserve Market had one or more pivotal suppliers which failed the three pivotal supplier test in 63 percent of the hours in 2011.
•Participant behavior was evaluated as competitive because the market rules require competitive, cost based offers.
•Market performance was evaluated as competitive because the interaction of the participant behavior with the market design results in prices that reflect marginal costs.
•Market design was evaluated as effective because market power mitigation rules result in competitive outcomes despite high levels of supplier concentration.
13 PJM agrees that the definition of opportunity cost should be consistent across all markets and should, in all markets, be based on the offer schedule accepted in the market. This would require a change to the definition of opportunity cost in the Regulation Market which is the change that the MMU has recommended. The MMU also agrees that the definition of opportunity cost should be consistent across all markets.
was below the Minimum Offer Price Rule (MOPR) threshold.
•Market performance was evaluated as competitive. Although structural market power exists in the Capacity Market, a competitive outcome resulted from the application of market power mitigation rules.
•Market design was evaluated as mixed because while there are many positive features of the Reliability Pricing Model (RPM) design, there are several features of the RPM design which threaten competitive outcomes. These include the 2.5 percent reduction in demand in Base Residual Auctions and a definition of DR which permits inferior products to substitute for capacity.
Table 1-3 The Regulation Market results were not competitive12
Market Element Evaluation Market DesignMarket Structure Not CompetitiveParticipant Behavior CompetitiveMarket Performance Not Competitive Flawed
•The Regulation Market structure was evaluated as not competitive because the Regulation Market had one or more pivotal suppliers which failed PJM’s three pivotal supplier (TPS) test in 82 percent of the hours in 2011.
•Participant behavior was evaluated as competitive because market power mitigation requires competitive offers when the three pivotal supplier test is failed and there was no evidence of generation owners engaging in anti-competitive behavior.
•Market performance was evaluated as not competitive, despite competitive participant behavior, because the changes in market rules, in particular the changes to the calculation of the
12 As Table 1-3 indicates, the Regulation Market results are not the result of the offer behavior of market participants, which was competitive as a result of the application of the three pivotal supplier test. The Regulation Market results are not competitive because the changes in market rules, in particular the changes to the calculation of the opportunity cost, resulted in a price greater than the competitive price in some hours, resulted in a price less than the competitive price in some hours, and because the revised market rules are inconsistent with basic economic logic. The competitive price is the actual marginal cost of the marginal resource in the market. The competitive price in the Regulation Market is the price that would have resulted from a combination of the competitive offers from market participants and the application of the prior, correct approach to the calculation of the opportunity cost. The correct way to calculate opportunity cost and maintain incentives across both regulation and energy markets is to treat the offer on which the unit is dispatched for energy as the measure of its marginal costs for the energy market. To do otherwise is to impute a lower marginal cost to the unit than its owner does and therefore impute a higher or lower opportunity cost than its owner does, depending on the direction the unit was dispatched to provide regulation. If the market rules and/or their implementation produce inefficient outcomes, then no amount of competitive behavior will produce a competitive outcome.
6 Section 1 Introduction
2011 State of the Market Report for PJM
© 2012 Monitoring Analytics, LLC
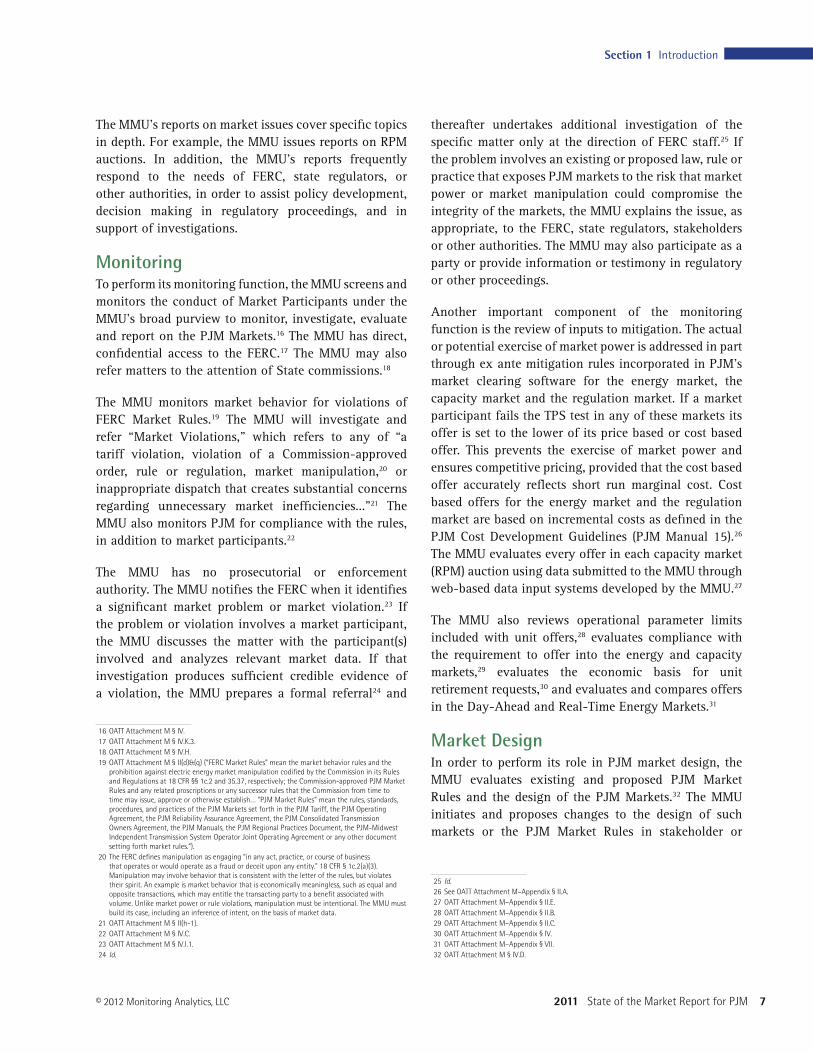
for market participants to acquire FTRs and a competitive auction mechanism.
Role of MMUThe FERC assigns three core functions to MMUs: reporting, monitoring and market design.14 These functions are interrelated and overlap. The PJM Market Monitoring Plan establishes these functions, providing that the MMU is responsible for monitoring: compliance with the PJM Market Rules; actual or potential design flaws in the PJM Market Rules; structural problems in the PJM Markets that may inhibit a robust and competitive market; the actual or potential exercise of market power or violation of the market rules by a Market Participant; PJM’s implementation of the PJM Market Rules or operation of the PJM Markets; and such matters as are necessary to prepare reports.15
ReportingThe MMU performs its reporting function by issuing and filing annual and quarterly state of the market reports, and reports on market issues. The state of the market reports provide a comprehensive analysis of the structure, behavior and performance of PJM markets. The reports evaluate whether the market structure of each PJM Market is competitive or not competitive; whether participant behavior is competitive or not competitive; and, most importantly, whether the outcome of each market, the market performance, is competitive or not competitive. The MMU also evaluates the market design for each market. Market design translates participant behavior within the market structure into market performance. The MMU evaluates whether the market design of each PJM market provides the framework and incentives for competitive results. State of the market reports and other reports are intended to inform PJM, the PJM Board, FERC, other regulators, other authorities, market participants, stakeholders and the general public about how well PJM markets achieve the competitive outcomes necessary to realize the goals of regulation through competition, and how the markets can be improved.
14 18 CFR § 35.28(g)(3)(ii); see also Wholesale Competition in Regions with Organized Electric Markets, Order No. 719, FERC Stats. & Regs. ¶31,281 (2008) (“Order No. 719”), order on reh’g, Order No. 719-A, FERC Stats. & Regs. ¶31,292 (2009), reh’g denied, Order No. 719-B, 129 FERC ¶ 61,252 (2009).
15 OATT Attachment M § IV; 18 CFR § 1c.2.
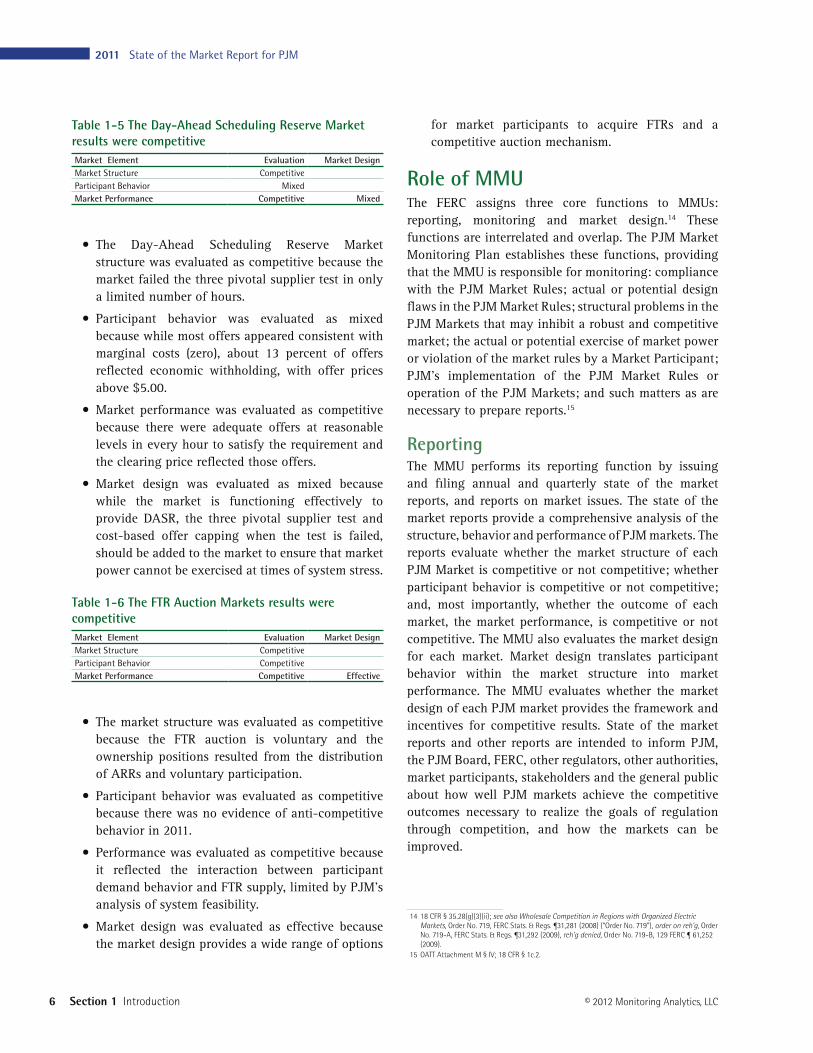
Table 1-5 The Day-Ahead Scheduling Reserve Market results were competitiveMarket Element Evaluation Market DesignMarket Structure CompetitiveParticipant Behavior MixedMarket Performance Competitive Mixed
•The Day-Ahead Scheduling Reserve Market structure was evaluated as competitive because the market failed the three pivotal supplier test in only a limited number of hours.
•Participant behavior was evaluated as mixed because while most offers appeared consistent with marginal costs (zero), about 13 percent of offers reflected economic withholding, with offer prices above $5.00.
•Market performance was evaluated as competitive because there were adequate offers at reasonable levels in every hour to satisfy the requirement and the clearing price reflected those offers.
•Market design was evaluated as mixed because while the market is functioning effectively to provide DASR, the three pivotal supplier test and cost-based offer capping when the test is failed, should be added to the market to ensure that market power cannot be exercised at times of system stress.
Table 1-6 The FTR Auction Markets results were competitiveMarket Element Evaluation Market DesignMarket Structure CompetitiveParticipant Behavior CompetitiveMarket Performance Competitive Effective
•The market structure was evaluated as competitive because the FTR auction is voluntary and the ownership positions resulted from the distribution of ARRs and voluntary participation.
•Participant behavior was evaluated as competitive because there was no evidence of anti-competitive behavior in 2011.
•Performance was evaluated as competitive because it reflected the interaction between participant demand behavior and FTR supply, limited by PJM’s analysis of system feasibility.
•Market design was evaluated as effective because the market design provides a wide range of options
2011 State of the Market Report for PJM 7
Section 1 Introduction
© 2012 Monitoring Analytics, LLC
thereafter undertakes additional investigation of the specific matter only at the direction of FERC staff.25 If the problem involves an existing or proposed law, rule or practice that exposes PJM markets to the risk that market power or market manipulation could compromise the integrity of the markets, the MMU explains the issue, as appropriate, to the FERC, state regulators, stakeholders or other authorities. The MMU may also participate as a party or provide information or testimony in regulatory or other proceedings.
Another important component of the monitoring function is the review of inputs to mitigation. The actual or potential exercise of market power is addressed in part through ex ante mitigation rules incorporated in PJM’s market clearing software for the energy market, the capacity market and the regulation market. If a market participant fails the TPS test in any of these markets its offer is set to the lower of its price based or cost based offer. This prevents the exercise of market power and ensures competitive pricing, provided that the cost based offer accurately reflects short run marginal cost. Cost based offers for the energy market and the regulation market are based on incremental costs as defined in the PJM Cost Development Guidelines (PJM Manual 15).26 The MMU evaluates every offer in each capacity market (RPM) auction using data submitted to the MMU through web-based data input systems developed by the MMU.27
The MMU also reviews operational parameter limits included with unit offers,28 evaluates compliance with the requirement to offer into the energy and capacity markets,29 evaluates the economic basis for unit retirement requests,30 and evaluates and compares offers in the Day-Ahead and Real-Time Energy Markets.31
Market DesignIn order to perform its role in PJM market design, the MMU evaluates existing and proposed PJM Market Rules and the design of the PJM Markets.32 The MMU initiates and proposes changes to the design of such markets or the PJM Market Rules in stakeholder or
25 Id.26 See OATT Attachment M–Appendix § II.A.27 OATT Attachment M–Appendix § II.E.28 OATT Attachment M–Appendix § II.B.29 OATT Attachment M–Appendix § II.C.30 OATT Attachment M–Appendix § IV.31 OATT Attachment M–Appendix § VII.32 OATT Attachment M § IV.D.
The MMU’s reports on market issues cover specific topics in depth. For example, the MMU issues reports on RPM auctions. In addition, the MMU’s reports frequently respond to the needs of FERC, state regulators, or other authorities, in order to assist policy development, decision making in regulatory proceedings, and in support of investigations.
MonitoringTo perform its monitoring function, the MMU screens and monitors the conduct of Market Participants under the MMU’s broad purview to monitor, investigate, evaluate and report on the PJM Markets.16 The MMU has direct, confidential access to the FERC.17 The MMU may also refer matters to the attention of State commissions.18
The MMU monitors market behavior for violations of FERC Market Rules.19 The MMU will investigate and refer “Market Violations,” which refers to any of “a tariff violation, violation of a Commission-approved order, rule or regulation, market manipulation,20 or inappropriate dispatch that creates substantial concerns regarding unnecessary market inefficiencies...”21 The MMU also monitors PJM for compliance with the rules, in addition to market participants.22
The MMU has no prosecutorial or enforcement authority. The MMU notifies the FERC when it identifies a significant market problem or market violation.23 If the problem or violation involves a market participant, the MMU discusses the matter with the participant(s) involved and analyzes relevant market data. If that investigation produces sufficient credible evidence of a violation, the MMU prepares a formal referral24 and
16 OATT Attachment M § IV.17 OATT Attachment M § IV.K.3.18 OATT Attachment M § IV.H.19 OATT Attachment M § II(d)&(q) (“FERC Market Rules” mean the market behavior rules and the
prohibition against electric energy market manipulation codified by the Commission in its Rules and Regulations at 18 CFR §§ 1c.2 and 35.37, respectively; the Commission-approved PJM Market Rules and any related proscriptions or any successor rules that the Commission from time to time may issue, approve or otherwise establish… “PJM Market Rules” mean the rules, standards, procedures, and practices of the PJM Markets set forth in the PJM Tariff, the PJM Operating Agreement, the PJM Reliability Assurance Agreement, the PJM Consolidated Transmission Owners Agreement, the PJM Manuals, the PJM Regional Practices Document, the PJM-Midwest Independent Transmission System Operator Joint Operating Agreement or any other document setting forth market rules.“).
20 The FERC defines manipulation as engaging “in any act, practice, or course of business that operates or would operate as a fraud or deceit upon any entity.” 18 CFR § 1c.2(a)(3). Manipulation may involve behavior that is consistent with the letter of the rules, but violates their spirit. An example is market behavior that is economically meaningless, such as equal and opposite transactions, which may entitle the transacting party to a benefit associated with volume. Unlike market power or rule violations, manipulation must be intentional. The MMU must build its case, including an inference of intent, on the basis of market data.
21 OATT Attachment M § II(h-1).22 OATT Attachment M § IV.C.23 OATT Attachment M § IV.I.1.24 Id.
8 Section 1 Introduction
2011 State of the Market Report for PJM
© 2012 Monitoring Analytics, LLC
ensure that market prices reflect the forward locational marginal value of capacity.
•The MMU recommends that the obligations of capacity resources be more clearly defined in the market rules.
•The MMU recommends that the performance incentives in the RPM Capacity Market design be strengthened.
•The MMU recommends that the terms of Reliability Must Run (RMR) service be reviewed, refined and standardized.
Section 5, Demand Response•The MMU recommends elimination of the Limited
and Extended Summer Demand Response products from the capacity market. All products competing in the capacity market should be required to be available to perform when called for every hour of the year.
•The MMU recommends that PJM continue to implement subzonal dispatch for Demand Response products and develop a plan to implement nodal dispatch for all demand resources.
•The MMU recommends that changes be made to simplify and improve the Emergency Demand Response (DR) program. The MMU recommends that the option to specify a minimum dispatch price under the Emergency Program Full option be eliminated and that participating resources receive the hourly real-time LMP less any generation component of their retail rate. The MMU also recommends that the Emergency Program Energy Only option be eliminated because the opportunity to receive the appropriate energy market incentive is already provided in the Economic Program.
•The MMU recommends that there be improvement in measurement and verification methods implemented in order to ensure the credibility of PJM demand-side programs. These could take the form of improvements in the CBL calculation and/or improvements in the verification and customer documentation of load reducing activities. PJM has implemented or plans to implement changes to the CBL calculation that should improve measurement and verification for many customers.
regulatory proceedings.33 In support of this function, the MMU engages in discussions with stakeholders, State Commissions, PJM Management, and the PJM Board; participates in PJM stakeholder meetings or working groups regarding market design matters; publishes proposals, reports or studies on such market design issues; and makes filings with the Commission on market design issues.34 The MMU also recommends changes to the PJM Market Rules to the staff of the Commission’s Office of Energy Market Regulation, State Commissions, and the PJM Board.35 The MMU may provide in its annual, quarterly and other reports “recommendations regarding any matter within its purview.”36
RecommendationsConsistent with its core function to “[e]valuate existing and proposed market rules, tariff provisions and market design elements and recommend proposed rule and tariff changes,”37 the MMU recommends specific enhancements to existing market rules and implementation of new rules that are required for competitive results in PJM markets and for continued improvements in the functioning of PJM markets.
Section 2, Energy Market•There are no recommendations in Section 2.
Section 3, Operating Reserve•The MMU recommends improving the process of
identifying and classifying the reasons for paying operating reserve credits to both generation and demand side resources in order to ensure that market transactions pay only appropriate operating reserve charges.
•The MMU recommends that up-to congestion transactions pay balancing operating reserve charges.
Section 4, Capacity•The MMU recommends that the RPM market
structure, definitions and rules be modified to improve the efficiency of market prices and to
33 Id.34 Id.35 Id.36 OATT Attachment M § VI.A. 37 18 CFR § 35.28(g)(3)(ii)(A); see also OATT Attachment M § IV.D.
2011 State of the Market Report for PJM 9
Section 1 Introduction
© 2012 Monitoring Analytics, LLC
expected that implementation of these changes will occur by the end of the second quarter 2012.
— The MMU recommends eliminating internal source and sink bus designations for external energy transactions in the Day-Ahead and Real-Time Energy Markets.
•On April 12, 2011, the PJM Market Implementation Committee (MIC) endorsed the elimination of internal source and sink designations in both the Day-Ahead and Real-Time Energy Markets.39 These modifications are currently being evaluated by PJM. It is expected that implementation of these changes will occur by the end of the second quarter 2012.
— The MMU recommends eliminating or modifying the dispatchable transaction product to reduce the amount of balancing operating reserve credits associated with the uneconomic scheduling of the product.
•On May 10, 2011, the PJM Market Implementation Committee (MIC) endorsed the recommendation to incorporate the dispatchable transaction product into PJM’s dispatch tool.40 PJM stated that the inclusion of this product would require minimal effort, and could be implemented by the end of 2011 or early in the first quarter of 2012.
— The MMU recommends eliminating or modifying the up-to congestion transaction product to ensure that it pays appropriate operating reserve charges and has appropriate credit requirements.
•At the PJM Market Implementation Committee, held on February 17, 2012, the PJM stakeholders agreed to form a task force to address up-to congestion issues.
— The MMU recommends that the Enhanced energy Scheduler (EES) application be modified to require that transactions be scheduled for a constant MW level over the entire 45 minutes as
39 See “Meeting Minutes“ Minutes from PJM’s MIC meeting , <http://112.pjm.com/~/media/committees-groups/committees/mic/20110412/20110412-mic-minutes.ashx>. (May 16, 2011)
40 See “Meeting Minutes“ Minutes from PJM’s MIC meeting , <http://112.pjm.com/~/media/committees-groups/committees/mic/20110510/20110510-mic-minutes.ashx>. (July 13, 2011)
Section 6, Net Revenue•There are no recommendations in Section 6.
Section 7, Environmental and Renewables•The MMU recommends that renewable energy
credit markets based on state renewable portfolio standards be brought into PJM markets as they are an increasingly important component of the wholesale energy market.
Section 8, Interchange Transactions•The MMU recommends that PJM modify a number
of its transaction related rules to improve market efficiency, reduce operating reserves charges, reduce gaming opportunities and to make the markets more transparent.
— The MMU recommends performing a regular assessment of the mappings of external balancing authorities associated with the interface pricing points, and modify as necessary to ensure that prices reflect the actual flows on the transmission system.
— The MMU recommends that PJM monitor, and adjust as necessary, the weights applied to the components of the interfaces to ensure that the interface prices reflect ongoing changes in system conditions and that loop flows are accounted for on a dynamic basis.
— The MMU recommends that PJM modify the not willing to pay congestion product to address the issues of uncollected congestion charges. The MMU recommends charging market participants for any congestion incurred while such transactions are loaded, regardless of their election of transmission service, and restricting the use of not willing to pay congestion transactions to transactions at interfaces (wheeling transactions).
•On April 12, 2011, the PJM Market Implementation Committee (MIC) endorsed the elimination of internal source and sink designations in both the Day-Ahead and Real-Time Energy Markets.38 These modifications are currently being evaluated by PJM. It is
38 See “Meeting Minutes“ Minutes from PJM’s MIC meeting , <http://112.pjm.com/~/media/committees-groups/committees/mic/20110412/20110412-mic-minutes.ashx> . (May 16, 2011)
10 Section 1 Introduction
2011 State of the Market Report for PJM
© 2012 Monitoring Analytics, LLC
market design changes to improve the performance of the Regulation Market, including use of a single clearing price based on actual LMP, modifications to the LOC calculation methodology, a software change to save some data elements necessary for verifying market outcomes, and further documentation of the implementation of the market design through SPREGO. The MMU is hopeful that the opportunity cost issue can be resolved in 2012.
— PJM will propose a redesign of the Regulation Market in 2011 to address fast response resources and other design issues.
•The MMU recommends that the single clearing price for synchronized reserves be determined based on the actual LMP. This is consistent with PJM’s recommendation on this topic in the scarcity pricing matter. The MMU also recommends that documentation of the Tier 1 synchronize reserve deselection process be published.
•The MMU recommends that the DASR Market rules be modified to incorporate the application of the three pivotal supplier test and cost-based offer caps in order to address potential market power issues.
•The MMU recommends that PJM, FERC, reliability authorities and state regulators reevaluate the way in which black start service is procured in order to ensure that procurement is done in a least cost manner for the entire PJM market. PJM should have responsibility to prepare the black start restoration plan for the region, with Members playing an advisory role. PJM should have the responsibility to procure required black start service on a least cost basis through a transparent process.
•The MMU recommends that the Synchronized Reserve Market design be modified to address the issue of units which offer and clear synchronized reserve but fail to provide synchronized reserve when an actual spinning event occurs.
•The MMU recommends that PJM document the reasons each time it changes the Tier 1 synchronized reserve transfer capability into the Mid-Atlantic subzone market because of the potential impacts on the market.
soon as possible. This business rule is currently in the PJM Manuals, but is not being enforced.41
•The MMU requests that, in order to permit a complete analysis of loop flow, FERC and NERC ensure that the identified data are made available to market monitors as well as other industry entities determined appropriate by FERC.
— On April 21, 2011, FERC issued a Notice of Proposed Rulemaking addressing the issues associated with access to loop flow data by the Commission staff and market monitors.42 On June 27, 2011, the North American market monitors provided comments to the Notice of Proposed Rulemaking, supporting the consideration to making the complete electronic tagging data used to schedule the transmission of electric power in wholesale markets available to entities involved in market monitoring functions.43 As of December 31, 2011, the Commission had not made a final decision.
•The MMU recommends that PJM ensure that all the arrangements between PJM and other balancing authorities be reviewed, and modified as necessary to ensure consistency with basic market principles and that PJM not enter into any additional arrangements that are not consistent with basic market principles.
— In 2011, PJM and MISO hired an independent auditor to review and identify any areas of the market to market coordination process that were not conforming to the JOA, and to identify differing interpretations of the JOA between PJM and MISO that may lead to inconsistencies in the operation and settlements of the market to market process. The final report is expected to be completed and distributed early in the first quarter of 2012.
Section 9, Ancillary Services•The Regulation Market design and implementation
continue to be flawed and require a detailed review to ensure that the market will produce competitive outcomes. The MMU recommends a number of
41 See “PJM Manual 41: Managing Interchange,” Revision 03 (November 24, 2008), External Transaction Minimum Duration Requirement.
42 See 135 FERC ¶ 61,052 (2011).43 See “Joint Comments of the North American Market Monitors.” Docket No. RM11-12-000 (June
27, 2011)
2011 State of the Market Report for PJM 11
Section 1 Introduction
© 2012 Monitoring Analytics, LLC
FTRs, derived from the ARR allocation to that load, follow the load in the same manner as ARRs.
HighlightsThe following presents highlights of each of the sections of the 2011 State of the Market Report for PJM:
Section 2, Energy Market•Average offered supply increased by 14,478, or 9.3
percent, from 156,003 MW in the summer of 2010 to 170,481 MW in the summer of 2011. The large increase in offered supply was the result of the integration of the ATSI zone in the second quarter, plus the addition of 5,008 MW of nameplate capacity to PJM in 2011. The increases in supply were partially offset by the deactivation of twelve units (738 MW) since January 1, 2011. (See page 23)
•In 2011, coal units provided 46.9 percent, nuclear units 34.2 percent and gas units 14.4 percent of total generation. Compared to calendar year 2010, generation from coal units decreased 0.8 percent, generation from nuclear units increased 3.3 percent, while generation from natural gas units increased 18.1 percent, and generation from oil units decreased 35.5 percent. (See page 23)
•Five large plants (over 500 MW) began generating in PJM in 2011. This is the first time since 2006 that a plant rated at more than 500 MW has come online in PJM. Overall, 5,008 MW of nameplate capacity was added in PJM in 2011 (excluding the ATSI integration), the most since 2002. (See page 286)
•The PJM system peak load for the summer of 2011 was 158,016 MW, which was 21,556 MW, or 15.8 percent, higher than the PJM peak load for the summer of 2010.44 The ATSI transmission zone accounted for 13,953 MW in the peak hour of summer 2011. The peak load excluding the ATSI transmission zone was 144,063 MW, an increase of 7,603 MW from the 2010 peak load. (See page 24)
•PJM average real-time load in 2011 increased by 3.7 percent from 2010, from 79,611 MW to 82,541 MW. The PJM average real-time load in 2011 would have decreased by 2.0 percent from 2010, from 79,611
44 All hours are presented and all hourly data are analyzed using Eastern Prevailing Time (EPT). See the 2011 State of the Market Report for PJM, Appendix I, “Glossary,” for a definition of EPT and its relationship to Eastern Standard Time (EST) and Eastern Daylight Time (EDT).
Section 10, Congestion and Marginal Losses•The MMU recommends that PJM conduct a detailed
review of the Day-Ahead Market software in order to address the issue of occasional anomalous loss factors and their effect on the day-ahead market results.
Section 11, Planning•The MMU recommends that PJM continue its
efforts to find ways to modify the generation and transmission interconnection process to minimize the uncertainty and improve the efficiency of the process so as to eliminate any inappropriate barriers to the entry of new generation.
•The MMU recommends that PJM continue to incorporate the principle that the goal of transmission planning should be the incorporation of transmission investment decisions into market driven processes as much as possible.
•The MMU recommends that PJM propose modifications to the transmission planning process that would limit significant changes in the status of major transmission projects after they have been approved, and thus limit the uncertainty imposed on markets by the use of evaluation criteria that are very sensitive to changes in forecasts of economic variables.
Section 12, Financial Transmission Rights and Auction Revenue Rights. •The MMU recommends that a detailed review of
the ARR/FTR allocation and market clearing be conducted in order to better understand and address the reasons for FTR underfunding. This review should include the assumptions made in the modeling of auctions and their basis in market developments. The MMU also recommends an explicit statement in the rules explaining the purpose and objectives of ARRs, FTRs and the appropriate level of funding of FTRs. The MMU recommends that no action to substantially modify the market design, e.g. removal of balancing congestion from the calculation of FTR revenues, be taken until the review is complete.
•The MMU recommends that when load switches among LSEs during the planning period, a proportional share of the underlying self scheduled
12 Section 1 Introduction
2011 State of the Market Report for PJM
© 2012 Monitoring Analytics, LLC
$49.4 million or 13.5 percent while lost opportunity cost charges increased by $58.5 million or 51.5 percent in 2011. (See page 67)
•Generators and real-time transactions balancing operating reserve charges were $288.8 million, 58.9 percent of all balancing operating reserve charges. Total balancing operating reserve charges were allocated 31.4 percent as reliability charges and 68.6 percent as deviation charges. Lost opportunity cost charges were $172.2 million or 35.2 percent of all balancing charges. The remaining 5.9 percent of balancing operating reserve charges were comprised of 1.8 percent canceled resources charges and 4.1 percent charges paid to resources controlling local transmission constraints. (See page 68)
•The concentration of operating reserve credits among a small number of units remains high. The top 10 units receiving total operating reserve credits, which make up less than one percent of all units in PJM’s footprint, received 28.1 percent of total operating reserve credits in 2011, compared to 33.2 percent in 2010. In 2011, the top generation owner received 21.0 percent of the total operating reserve credits paid. (See page 75)
•The regional concentration of balancing operating reserves remained high in 2011, although slightly lower than 2010. In 2011, 59.3 percent of all operating reserve credits were paid to resources in the top three zones, a decrease of 4.2 percent from the 2010 share. (See page 81)
Section 4, Capacity•In calendar year 2011, PJM installed capacity
increased 14,826.8 MW or 8.9 percent from 166,410.0 MW on January 1 to 178,846.5 MW on December 31, primarily due to the integration of the American Transmission Systems, Inc. (ATSI) Control Zone into PJM. Installed capacity includes net capacity imports and exports and can vary on a daily basis. (See page 91)
•The 2011/2012 RPM Third Incremental Auction, 2014/2015 RPM Base Residual Auction, 2012/2013 RPM Second Incremental Auction, and the 2013/2014 First Incremental Auction were run in calendar year 2011. In the 2011/2012 RPM Third Incremental Auction, the RTO clearing price was $5.00 per MW-day. In the 2014/2015 RPM Base
MW to 78,000 MW, if the ATSI transmission zone were excluded. (See page 38)
•PJM average day-ahead load, including DECs and up-to congestion transactions, increased in 2011 by 9.6 percent from 2010, from 103,935 MW to 113,866 MW. PJM average day-ahead load would have been 0.2 percent higher in 2011 than in 2010, from 103,935 MW to 103,746 MW if the ATSI transmission zone were excluded. (See page 40)
•PJM average real-time generation increased by 3.9 percent in 2011 from 2010, from 82,582 MW to 85,775 MW. PJM average real-time generation would have decreased 1.4 percent in 2011 from 2010, from 82,582 MW to 81,645 MW if the ATSI transmission zone were excluded. (See page 42)
•PJM Real-Time Energy Market prices decreased in 2011 compared to 2010. The load-weighted average LMP was 5.0 percent lower in 2011 than in 2010, $45.94 per MWh versus $48.35 per MWh. (See page 45)
•PJM Day-Ahead Energy Market prices decreased in 2011 compared to 2010. The load-weighted average LMP was 5.2 percent lower in 2011 than in 2010, $45.19 per MWh versus $47.65 per MWh. (See page 48)
•Levels of offer capping for local market power remained low. In 2011, 0.9 percent of unit hours and 0.4 percent of MW were offer capped in the Real-Time Energy Market and 0.0 percent of unit hours and 0.0 percent of MW were offer capped in the Day-Ahead Energy Market. (See page 27)
•Of the 188 units that were eligible to include a Frequently Mitigated Unit (FMU) or Associated Unit (AU) adder in their cost-based offer during 2011, 54 (28.7 percent) qualified in all months, and 11 (5.9 percent) qualified in only one month of 2011. (See page 35)
•There were no scarcity pricing events in 2011 under PJM’s current Emergency Action based scarcity pricing rules. (See page 56)
Section 3, Operating Reserve•Operating reserve charges increased $5.8 million, or
1.0 percent, from $572.3 million in 2010, to $578.1 million in 2011. Balancing operating reserve charges (without lost opportunity cost charges) decreased by
2011 State of the Market Report for PJM 13
Section 1 Introduction
© 2012 Monitoring Analytics, LLC
•In calendar year 2011, total capacity payments to demand response resources under the PJM Load Management (LM) Program, which integrated Emergency Load Response Resources into the Reliability Pricing Model, decreased by $25.2 million, or 4.9 percent, compared to the same period in 2010, from $512 million in 2010 to $487 million in 2011. (See page 133)
Section 6, Net Revenue•Net revenues are significantly affected by fuel prices,
energy prices and capacity prices. The combination of lower energy prices, lower gas prices and higher coal prices resulted in higher energy revenues for the new entrant CT and CC unit in most zones and lower energy net revenues for the new entrant coal unit in all zones in 2011. However, revenue from the capacity market was lower in 2011, which affected total net revenues for all units. Total new entrant CT net revenue decreased in 2011 in all but five zones. Total new entrant CC net revenue increased in all but five zones. Total new entrant coal unit net revenue was lower in all zones except AEP. (See page 147)
•The MMU estimates that there are 5,764 MW of RPM coal capacity at risk of retirement. Capacity at risk of retirement includes units that did not cover their avoidable costs in 2011 or would not be able to cover the cost of installing MATS compliant environmental controls, excludes units that have started the deactivation process or are expected to request deactivation, and excludes FRR capacity. (See page 157)
Section 7, Environmental and Renewables•The EPA issued the Mercury Air Toxics Rule
December 16, 2011, which will require significant investments in control technology for Mercury and other pollutants, effective April 16, 2015. (See page 163)
•Generation from wind units increased from 9,688.2 GWh in 2010 to 11,561.1 GWh in 2011, an increase of 19.3 percent. Generation from solar units increased from 5.7 GWh in 2010 to 55.7 GWh in 2011, an increase of 872.5 percent. (See page 173)
Residual Auction, the RTO clearing price for Limited Resources was $125.47 per MW-day, and the RTO clearing price for Extended Summer and Annual Resources was $125.99 per MW-day. In the 2012/2013 RPM Second Incremental Auction, the RTO resource clearing price was $13.01 per MW-day, and the EM163 resource clearing price was $48.91 per MW-day. In the 2013/2014 RPM First Incremental Auction, the RTO resource clearing price was $20.00 per MW-day, the EM163 resource clearing price was $178.85 per MW-day, and the SWM163 resource clearing price was $54.82 per MW-day. (See page 109)
•All LDAs and the entire PJM Region failed the preliminary market structure screen (PMSS) for the 2014/2015 Delivery Year. (See page 95)
•Capacity in the RPM load management programs was 9,688.3 MW for June 1, 2011. (See page 100)
•Annual weighted average capacity prices increased from a Capacity Credit Market (CCM) weighted average price of $5.73 per MW-day in 2006 to an RPM weighted-average price of $164.71 per MW-day in 2010 and then declined to $127.05 per MW-day in 2014. (See page 109)
•Average PJM equivalent demand forced outage rate (EFORd) increased from 7.2 percent in 2010 to 7.9 percent in 2011. (See page 112)
•The PJM aggregate equivalent availability factor (EAF) decreased from 84.9 percent in 2010 to 83.7 percent in 2011. The equivalent maintenance outage factor (EMOF) increased from 2.8 percent in 2010 to 3.1 percent in 2011, the equivalent planned outage factor (EPOF) increased from 7.4 percent in 2010 to 7.9 percent in 2011, and the equivalent forced outage factor (EFOF) increased from 4.9 percent in 2010 to 5.3 percent in 2011. (See page 112)
Section 5, Demand Response•In 2011, the total MWh of load reduction under
the Economic Load Response Program decreased by 57,288 MWh compared to the same period in 2010, from 74,070 MWh in 2010 to 16,782 MWh in 2011, a 77 percent decrease. Total payments under the Economic Program decreased by $1,080,438, from $3,088,049 in 2010 to $2,007,612 in 2011, a 35 percent decrease. (See page 131)
14 Section 1 Introduction
2011 State of the Market Report for PJM
© 2012 Monitoring Analytics, LLC
•PJM initiated 62 TLRs in 2011, a reduction from the 110 TLRs for the calendar year 2010. (See page 211)
•The average daily volume of up-to congestion bids increased from 4,293 bids per day, for the period between March 1, 2009 through May 14, 2010, to 6,881 bids per day for the period between May 15, 2010 through September 16, 2010, to 26,303 bids per day for the period between September 17, 2010 and December 31, 2011. A significant increase in bid volume occurred following the September 17, 2010, modification to the up-to congestion product that eliminated the requirement to procure transmission when submitting up-to congestion bids.45 (See page 212)
•Total uncollected congestion charges in 2011 were -$20,955, compared to $3.3 million for the calendar year 2010. Uncollected congestion charges are accrued when not willing to pay congestion transactions are not curtailed when congestion between the specified source and sink is present. Uncollected congestion charges also apply when there is negative congestion (when the LMP at the source is greater than the LMP at the sink) which was the case for the net uncollected congestion charges in 2011. (See page 218)
•Balancing operating reserve credits are paid to importing dispatchable transactions (also known as real-time with price) as a guarantee of the transaction price. Dispatchable transactions are made whole when the hourly integrated LMP does not meet the specified minimum price offer in the hours when the transaction was active. In 2011, these balancing operating reserve credits were $1.3 million, a decrease from $23.0 million for the calendar year 2010. The reasons for the reduction in these balancing operating reserve credits were active monitoring by the MMU and the absence of any such dispatchable transactions after April, 2011. (See page 221)
Section 9, Ancillary Services•The weighted average Regulation Market clearing
price, including opportunity cost, for 2011 was
45 In prior state of the market reports for PJM, the number of up-to congestion bids reported represented unique up-to congestion transaction IDs. The new totals represent the total hours of up-to congestion bids per day. For example, if a unique up-to congestion transaction ID was submitted for all 24 hours of the day, it was counted as one bid in previous reports, and now is counted as 24 bids. This is consistent with the reporting of increment offers and decrement bids.
•At the end of 2011, the Cross-State Air Pollution Rule was subject to a stay pending further action on appeal, resulting in the reinstatement of the Clean Air Interstate Rule for 2012. (See page 161)
•Emission prices declined in calendar year 2011 compared to calendar year 2010. NOx prices declined 64.3 percent in 2011 compared to 2010, and SO2
prices declined 87.3 percent in 2011 compared to 2010. RGGI CO2 prices declined by 4.6 percent in 2011 compared to 2010. (See page 169)
•The price of RGGI CO2 allowances remained at or near the floor price of $1.89 during 2011, and as of January 1, 2012, the state of New Jersey will no longer be participating in the RGGI program. (See page 168)
Section 8, Interchange Transactions•On June 1, 2011 at 0100, the American Transmission
Systems, Inc. (ATSI) Control Zone was integrated into PJM. As a result, the First Energy (FE) Interface and the MICHFE Interface Pricing Point were eliminated. (See page 196)
•Real-time net exports increased to -9,761.8 GWh in 2011 from -9,661.0 GWh for the calendar year 2010. Day-ahead net imports in 2011 were 6,576.2 GWh compared to net exports of -6,470.0 GWh for the calendar year 2010. The primary reason that PJM became a net importer of energy in the Day-Ahead Market in 2011 was the significant increase in up-to congestion transactions and the fact that up-to congestion transactions were net imports for most of that period. (See page 187)
•The direction of power flows was not consistent with real-time energy market price differences in 55 percent of hours at the border between PJM and MISO and in 48 percent of hours at the border between PJM and NYISO in 2011. (See page 198)
•In 2011, net scheduled interchange was -7,072 GWh and net actual interchange was -7,576 GWh, a difference of 504 GWh or 7.1 percent, an increase from 5.2 percent for the calendar year 2010. While actual interchange exceeded scheduled interchange in 2011, the opposite was true in 2010. This difference is system inadvertent. The total inadvertent over the two year period including 2010 and 2011 was 1.1 percent. (See page 208)
2011 State of the Market Report for PJM 15
Section 1 Introduction
© 2012 Monitoring Analytics, LLC
•Monthly marginal loss costs in 2011 were lower than monthly marginal loss costs in 2010, with the exception of March and April (Table 10-12).48 (See page 272)
•The marginal loss credits (loss surplus) decreased in 2011 to $586.7 million compared to $836.7 million in 2010. (Table 10-13). (See page 273)
•Congestion costs in 2011 decreased by 29.9 percent over congestion costs in 2010 (Table 10-17). (See page 275)
•Net day–ahead congestion costs were $1,244.9 million in 2011 and $1,713.1 in 2010. Net balancing congestion costs were -$246.7 million in 2011 (Table 10-18) and -$289.5 million in 2010. (See page 276)
•Monthly congestion costs in 2011 were lower than monthly congestion costs in 2010, with the exception of January and March (Table 10-19 and Table 10-20). (See page 277)
Section 11, Planning•At December 31, 2011, 90,725 MW of capacity
were in generation request queues for construction through 2018, compared to an average installed capacity of 180,000 MW in 2011 including the June 1, 2011, ATSI integration. Wind projects account for approximately 37,792 MW, 41.7 percent of the capacity in the queues, and combined-cycle projects account for 34,138 MW, 37.6 percent of the capacity in the queues. (See page 286)
•Five large plants (over 500 MW) began generating in PJM in 2011. These include York Energy Center in the PECO zone, Bear Garden Generating Station in the Dominion zone, Longview Power in the APS zone, Dresden Energy Facility in the AEP zone, and Fremont Energy Center in the ATSI zone.49 This is the first time since 2006 that a plant rated at more than 500 MW has come online in PJM. Overall, 5,008 MW of nameplate capacity were added in PJM in 2011 (excluding the integration of the ATSI zone), the most since 2002. (See page 286)
•A total of 1,322.3 MW of generation capacity retired in 2011, and it is expected that a total of 18,886 MW will have retired from 2011 through 2019, with most
48 See the 2010 State of the Market Report for PJM, Volume II, “Energy Market, Part 1,” Table 2-58. 49 Fremont Energy Center entered PJM after the June 1, 2011 integration of ATSI, and is included in
the 5,008 MW of nameplate capacity reported above.
$16.21 per MW.46 This was a decrease of $1.87, or 10 percent, from the average price for regulation in 2010. The total cost of regulation decreased by $2.79 from $32.07 per MW in 2010, to $29.28, or 8.7 percent. In 2011 the weighted Regulation Market clearing price was only 55 percent of the total regulation cost per MW, compared to 56 percent of the total costs of regulation per MW in 2010. (See page 236)
•The weighted average clearing price for Tier 2 Synchronized Reserve Market in the Mid-Atlantic Subzone was $11.81 per MW in 2011, a $1.26 per MW increase from 2010.47 The total cost of synchronized reserves per MWh in 2011 was $15.48, a 7.4 percent increase from the total cost of synchronized reserves ($14.41) during 2010. The weighted average Synchronized Reserve Market clearing price was 76 percent of the weighted average total cost per MW of synchronized reserve in 2011, up from 73 percent in 2010. (See page 251)
•The weighted DASR market clearing price in 2011 was $0.55 per MW. In 2010, the weighted price of DASR was $0.16 per MW. The year over year increase in the weighted average price per MW of DASR was attributable to several days of high DASR prices in June, July and August. (See page 256)
•Black start zonal charges 2011 ranged from $0.04 per MW in the DLCO zone to $0.90 per MW in the BGE zone (See page 257)
Section 10, Congestion and Marginal Losses•Total marginal loss costs in 2011 decreased by 15.6
percent from 2010 (Table 10-10). (See page 271)
•Net day-ahead marginal loss costs were $1,430.5 million in 2011 and net balancing marginal loss costs were -$51.0 million in 2011 (Table 10-12). (See page 272)
•American Electric Power (AEP) was the control zone with the most marginal loss costs in 2011. AEP accounted for $318.6 million or 23.1 percent of the $1,379.5 million total marginal loss costs. (See page 413)
46 The term “weighted” when applied to clearing prices in the Regulation Market means clearing prices weighted by the MW of cleared regulation.
47 The term “weighted” when applied to clearing prices in the Synchronized Reserve Market means clearing prices weighted by the MW of cleared synchronized reserve.
16 Section 1 Introduction
2011 State of the Market Report for PJM
© 2012 Monitoring Analytics, LLC
Total Price of Wholesale PowerThe total price of wholesale power is the total price per MWh of purchasing wholesale electricity from PJM markets. The total price is an average price and actual prices vary by location. The total price includes the price of energy, capacity, ancillary services, and transmission service, administrative fees, regulatory support fees and uplift charges billed through PJM systems. Table 1-7 provides the average price and total revenues paid, by component for 2010 and 2011.
Table 1-7 shows that Energy, Capacity and Transmission Service Charges are the three largest components of the total price per MWh of wholesale power, comprising 96.0 percent of the total price per MWh in 2011. The cost of energy was 73.4 percent, the cost of capacity was 15.5 percent and the cost of transmission service was 7.1 percent of the total price per MWh in 2011.
The total price per MWh of wholesale power in 2011, $62.56, was 6.2 percent lower than total per MWh price of wholesale power in 2010, $66.72. This decrease in the total price per MWh was largely attributable to the 5.0 percent decrease in the average energy price per MWh and the 20.0 percent decrease in the average price of capacity per MWh between 2010 and 2011.
Each of the components is defined in PJM’s Open Access Transmission Tariff (OATT) and PJM Operating Agreement and each is collected through PJM’s billing system.
Components of Total Price•The Energy component is the real time load weighted
average PJM locational marginal price (LMP).
•The Capacity component is the average price per MWh of Reliability Pricing Model (RPM) payments.
•The Transmission Service Charges component is the average price per MWh of network integration charges, and firm and non firm point to point transmission service.50
•The Operating Reserve (uplift) component is the average price per MWh of day ahead and real time operating reserve charges.51
50 OATT §§ 13.7, 14.5, 27A & 34.51 OA Schedules 1 §§ 3.2.3 & 3.3.3.
of this capacity retiring by the end of 2015. Units planning to retire in 2012 make up 7,189 MW, or 41 percent of all planned retirements. (See page 291)
Section 12, Financial Transmission Rights and Auction Revenue Rights•On June 1, 2011, the American Transmission
Systems, Inc. (ATSI) Control Zone joined the PJM footprint. Network Service Users and Firm Transmission Customers in the ATSI Control Zone participated in the Annual ARR Allocation and the Annual FTR Auction for the 2011 to 2012 planning period. (See page 305)
•The total cleared FTR buy bids from the Monthly Balance of Planning Period FTR Auctions for the first seven months of the 2011 to 2012 planning period increased by 47 percent from 1,092,956 MW to 1,589,989 MW compared to the first seven months of the 2010 to 2011 planning period. (See page 312)
•FTRs were paid at 85.0 percent of the target allocation level for the full 2010 to 2011 planning period and 84.9 percent for the first seven months of the 2011 to 2012 planning period. (See page 329)
•FTR profitability is the difference between the revenue received for an FTR and the cost of the FTR. FTRs were profitable overall and were profitable for both physical and financial entities in the 2011 calendar year. Total FTR profits were $340.3 million for physical entities and $125.7 million for financial entities. Self scheduled FTRs were the source of $560.5 million of the FTR profits for physical entities. Not every FTR was profitable. FTRs purchased by physical entities, but not self scheduled, were not profitable in 2011. (See page 333)
•As one of the measures to address underfunding, effective August 5, 2011, PJM no longer allows FTR buy bids to clear with a price of zero unless there is at least one constraint in the auction which affects the FTR path. (See page 320)

2011 State of the Market Report for PJM 17
Section 1 Introduction
© 2012 Monitoring Analytics, LLC
•The Synchronized Reserve component is the average cost per MWh of synchronized reserve procured through the Synchronized Reserve Market.57
•The Black Start component is the average cost per MWh of black start service.58
•The RTO Startup and Expansion component is the average cost per MWh of charges to recover AEP, ComEd and DAY’s integration expenses.59
•The NERC/RFC component is the average cost per MWh of NERC and RFC charges, plus any reconciliation charges.60
•The Load Response component is the average cost per MWh of day ahead and real time load response program charges to LSEs.61
•The Transmission Facility Charges component is the average cost per MWh of Ramapo Phase Angle Regulators charges allocated to PJM Mid-Atlantic transmission owners.62
Table 1-8 provides the average price by component for calendar years 2000 through 2011.
Table 1-8 shows that from 2007 through 2011 Energy, Capacity and Transmission Service Charges are the three largest components of the total price per MWh
57 OA Schedule 1 § 3.2.3A.01; PJM OATT Schedule 6.58 OATT Schedule 6A. The Black Start charges do not include Operating Reserve charges required for
units to provide Black Start Service under the ALR option.59 OATT Attachments H-13, H-14 and H-15 and Schedule 13.60 OATT Schedule 10-NERC and OATT Schedule 10-RFC.61 OA Schedule 1 § 3.6.62 OA Schedule 1 § 5.3b.
•The Reactive component is the average cost per MWh of reactive supply and voltage control from generation and other sources.52
•The Regulation component is the average cost per MWh of regulation procured through the Regulation Market.53
•The PJM Administrative Fees component is the average cost per MWh of PJM’s monthly expenses for a number of administrative services, including Advanced Control Center (AC2) and OATT Schedule 9 funding of FERC, OPSI and the MMU.
•The Transmission Enhancement Cost Recovery component is the average cost per MWh of PJM billed (and not otherwise collected through utility rates) costs for transmission upgrades and projects, including annual recovery for the TrAIL and PATH projects.54
•The Day-Ahead Scheduling Reserve component is the average cost per MWh of Day-Ahead scheduling reserves procured through the Day-Ahead Scheduling Reserve Market.55
•The Transmission Owner (Schedule 1A) component is the average cost per MWh of transmission owner scheduling, system control and dispatch services charged to transmission customers.56
52 OATT Schedule 2 and OA Schedule 1 § 3.2.3B.53 OA Schedules 1 §§ 3.2.2, 3.2.2A, 3.3.2, & 3.3.2A; OATT Schedule 3.54 OATT Schedule 12.55 OA Schedules 1 §§ 3.2.3A.01 & OATT Schedule 6.56 OATT Schedule 1A.
Table 1-7 Total price per MWh by category and total revenues by category: 2010 and 2011
Category2010
$/MWh2011
$/MWhPercent Change
Totals2010 Percent of
Total2011 Percent of
TotalEnergy $48.35 $45.94 (5.0%) 72.5% 73.4%Capacity $12.15 $9.72 (20.0%) 18.2% 15.5%Transmission Service Charges $4.00 $4.42 10.5% 6.0% 7.1%Operating Reserves (Uplift) $0.79 $0.79 1.1% 1.2% 1.3%Reactive $0.44 $0.42 (6.6%) 0.7% 0.7%PJM Administrative Fees $0.36 $0.37 3.4% 0.5% 0.6%Regulation $0.35 $0.32 (6.6%) 0.5% 0.5%Transmission Enhancement Cost Recovery $0.21 $0.29 39.0% 0.3% 0.5%Synchronized Reserves $0.06 $0.09 47.4% 0.1% 0.1%Transmssion Owner (Schedule 1A) $0.09 $0.09 1.5% 0.1% 0.1%Day Ahead Scheduling Reserve (DASR) $0.01 $0.05 391.9% 0.0% 0.1%Black Start $0.02 $0.02 22.4% 0.0% 0.0%NERC/RFC $0.02 $0.02 (7.6%) 0.0% 0.0%RTO Startup and Expansion $0.01 $0.01 (1.9%) 0.0% 0.0%Load Response $0.00 $0.01 28.6% 0.0% 0.0%Transmission Facility Charges $0.00 $0.00 19.1% 0.0% 0.0%Total $66.72 $62.56 (6.2%) 100.0% 100.0%
18 Section 1 Introduction
2011 State of the Market Report for PJM
© 2012 Monitoring Analytics, LLC
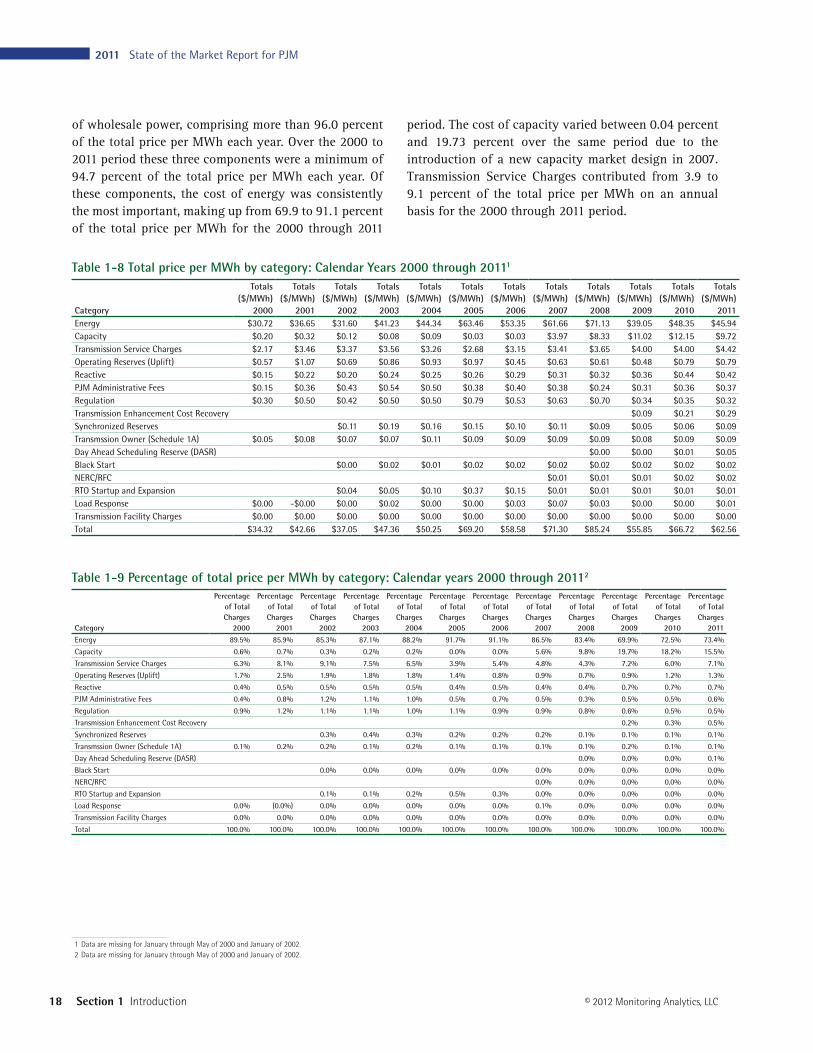
of wholesale power, comprising more than 96.0 percent of the total price per MWh each year. Over the 2000 to 2011 period these three components were a minimum of 94.7 percent of the total price per MWh each year. Of these components, the cost of energy was consistently the most important, making up from 69.9 to 91.1 percent of the total price per MWh for the 2000 through 2011
Table 1-8 Total price per MWh by category: Calendar Years 2000 through 20111
Category
Totals ($/MWh)
2000
Totals ($/MWh)
2001
Totals ($/MWh)
2002
Totals ($/MWh)
2003
Totals ($/MWh)
2004
Totals ($/MWh)
2005
Totals ($/MWh)
2006
Totals ($/MWh)
2007
Totals ($/MWh)
2008
Totals ($/MWh)
2009
Totals ($/MWh)
2010
Totals ($/MWh)
2011Energy $30.72 $36.65 $31.60 $41.23 $44.34 $63.46 $53.35 $61.66 $71.13 $39.05 $48.35 $45.94Capacity $0.20 $0.32 $0.12 $0.08 $0.09 $0.03 $0.03 $3.97 $8.33 $11.02 $12.15 $9.72Transmission Service Charges $2.17 $3.46 $3.37 $3.56 $3.26 $2.68 $3.15 $3.41 $3.65 $4.00 $4.00 $4.42Operating Reserves (Uplift) $0.57 $1.07 $0.69 $0.86 $0.93 $0.97 $0.45 $0.63 $0.61 $0.48 $0.79 $0.79Reactive $0.15 $0.22 $0.20 $0.24 $0.25 $0.26 $0.29 $0.31 $0.32 $0.36 $0.44 $0.42PJM Administrative Fees $0.15 $0.36 $0.43 $0.54 $0.50 $0.38 $0.40 $0.38 $0.24 $0.31 $0.36 $0.37Regulation $0.30 $0.50 $0.42 $0.50 $0.50 $0.79 $0.53 $0.63 $0.70 $0.34 $0.35 $0.32Transmission Enhancement Cost Recovery $0.09 $0.21 $0.29Synchronized Reserves $0.11 $0.19 $0.16 $0.15 $0.10 $0.11 $0.09 $0.05 $0.06 $0.09Transmssion Owner (Schedule 1A) $0.05 $0.08 $0.07 $0.07 $0.11 $0.09 $0.09 $0.09 $0.09 $0.08 $0.09 $0.09Day Ahead Scheduling Reserve (DASR) $0.00 $0.00 $0.01 $0.05Black Start $0.00 $0.02 $0.01 $0.02 $0.02 $0.02 $0.02 $0.02 $0.02 $0.02NERC/RFC $0.01 $0.01 $0.01 $0.02 $0.02RTO Startup and Expansion $0.04 $0.05 $0.10 $0.37 $0.15 $0.01 $0.01 $0.01 $0.01 $0.01Load Response $0.00 -$0.00 $0.00 $0.02 $0.00 $0.00 $0.03 $0.07 $0.03 $0.00 $0.00 $0.01Transmission Facility Charges $0.00 $0.00 $0.00 $0.00 $0.00 $0.00 $0.00 $0.00 $0.00 $0.00 $0.00 $0.00Total $34.32 $42.66 $37.05 $47.36 $50.25 $69.20 $58.58 $71.30 $85.24 $55.85 $66.72 $62.56
Table 1-9 Percentage of total price per MWh by category: Calendar years 2000 through 20112
Category
Percentage of Total Charges
2000
Percentage of Total Charges
2001
Percentage of Total Charges
2002
Percentage of Total Charges
2003
Percentage of Total Charges
2004
Percentage of Total Charges
2005
Percentage of Total Charges
2006
Percentage of Total Charges
2007
Percentage of Total Charges
2008
Percentage of Total Charges
2009
Percentage of Total Charges
2010
Percentage of Total Charges
2011Energy 89.5% 85.9% 85.3% 87.1% 88.2% 91.7% 91.1% 86.5% 83.4% 69.9% 72.5% 73.4%
Capacity 0.6% 0.7% 0.3% 0.2% 0.2% 0.0% 0.0% 5.6% 9.8% 19.7% 18.2% 15.5%
Transmission Service Charges 6.3% 8.1% 9.1% 7.5% 6.5% 3.9% 5.4% 4.8% 4.3% 7.2% 6.0% 7.1%
Operating Reserves (Uplift) 1.7% 2.5% 1.9% 1.8% 1.8% 1.4% 0.8% 0.9% 0.7% 0.9% 1.2% 1.3%
Reactive 0.4% 0.5% 0.5% 0.5% 0.5% 0.4% 0.5% 0.4% 0.4% 0.7% 0.7% 0.7%
PJM Administrative Fees 0.4% 0.8% 1.2% 1.1% 1.0% 0.5% 0.7% 0.5% 0.3% 0.5% 0.5% 0.6%
Regulation 0.9% 1.2% 1.1% 1.1% 1.0% 1.1% 0.9% 0.9% 0.8% 0.6% 0.5% 0.5%
Transmission Enhancement Cost Recovery 0.2% 0.3% 0.5%
Synchronized Reserves 0.3% 0.4% 0.3% 0.2% 0.2% 0.2% 0.1% 0.1% 0.1% 0.1%
Transmssion Owner (Schedule 1A) 0.1% 0.2% 0.2% 0.1% 0.2% 0.1% 0.1% 0.1% 0.1% 0.2% 0.1% 0.1%
Day Ahead Scheduling Reserve (DASR) 0.0% 0.0% 0.0% 0.1%
Black Start 0.0% 0.0% 0.0% 0.0% 0.0% 0.0% 0.0% 0.0% 0.0% 0.0%
NERC/RFC 0.0% 0.0% 0.0% 0.0% 0.0%
RTO Startup and Expansion 0.1% 0.1% 0.2% 0.5% 0.3% 0.0% 0.0% 0.0% 0.0% 0.0%
Load Response 0.0% (0.0%) 0.0% 0.0% 0.0% 0.0% 0.0% 0.1% 0.0% 0.0% 0.0% 0.0%
Transmission Facility Charges 0.0% 0.0% 0.0% 0.0% 0.0% 0.0% 0.0% 0.0% 0.0% 0.0% 0.0% 0.0%
Total 100.0% 100.0% 100.0% 100.0% 100.0% 100.0% 100.0% 100.0% 100.0% 100.0% 100.0% 100.0%
1 Data are missing for January through May of 2000 and January of 2002. 2 Data are missing for January through May of 2000 and January of 2002.
period. The cost of capacity varied between 0.04 percent and 19.73 percent over the same period due to the introduction of a new capacity market design in 2007. Transmission Service Charges contributed from 3.9 to 9.1 percent of the total price per MWh on an annual basis for the 2000 through 2011 period.