state revenue forecasts: building a shared reality · state revenue forecasts: building a shared...
TRANSCRIPT
State Revenue Forecasts: Building a
Shared Reality
Daniel J. Mallinson, PhDAssistant Professor of Political Science
David L. Carr, PhD Professor of Political Science
Director of Research and Policy Analysis Stockton University
101 Vera King Farris Drive Galloway, NJ 08205
February 2017

1
STATE REVENUE FORECASTS: BUILDING A SHARED REALITY
INTRODUCTION
“Annual income twenty pounds, annual expenditure nineteen [pounds]
nineteen [shillings] and six [pence], result happiness. Annual income twenty pounds, annual expenditure twenty pounds ought [shillings] and six [pence],
result misery."
Charles Dickens, David Copperfield1
In spring 2014, very near the end of the fiscal year, New Jersey Governor Chris
Christie revealed that the state was facing an estimated $800 million shortfall
in revenues.2 Addressing the shortfall, which later exceeded $1 billion,
required draconian measures and raised questions about how such a large
fiscal surprise could occur so late in the fiscal year.3 A report from the Volcker
Alliance provides its assessment:
“To produce a balanced budget, New Jersey has counted on shifting
resources intended for other programs to the general fund and has increased its reliance on borrowing. It does not issue multiyear budget
forecasts, and repeated optimistic revenue estimates have resulted in midyear adjustments that are not subject to the usual legislative budgeting process.”4
1 (Dickens 1850 [1966], 231) 2 (Seidman 2014) 3 (Reitmeyer 2016) 4 (The Volcker Alliance 2015, 35)

2
Happiness, as Dickens suggests, depends on an excess of revenues over
expenditures. American Governors often boast that, unlike the Federal
government, they are required to balance their budget. Indeed, many states
have either a constitutional or statutory (or both) requirement that they have a
balanced budget.5 Typically, these requirements apply to the general fund into
which tax revenues flow and from which general appropriations are made.
While difficult, and often prone to error, state revenue forecasts are not only
vital to the economic future of the state, the approach each state takes to this
daunting task reveals much about its approach to addressing other problems.
In this paper we will summarize the challenges in the revenue forecasting
process and explore the success of this process in New Jersey between 2002
and 2015. To place New Jersey’s experience in context we compare it to
revenue forecasting in neighboring Delaware, Pennsylvania, and New York over
the same time period.
Against the background of literature on revenue forecasting we explore several
key elements in revenue forecasting, its relationship to the budgeting process,
and approaches to managing the inevitable error found in all revenue forecasts.
These elements include:
Factors that influence the volatility of state revenues and the accuracy of revenue forecasts
Actors charged with making revenue forecasts
The methodologies used to create forecasts
5 (National Council of State Legislatures 2010)
3
The frequency and timing of revenue forecasts
Monitoring progress in revenue collection
Budget stabilization measures in place to smooth variability in actual
revenue collections
Transparency regarding revenue forecasting processes and the
performance of annual forecasts
We stand in awe of the difficulties faced by those charged with making
revenue forecasts in each of the states we have studied. The complexity and
time horizon of the forecasting task makes a successful forecast an elusive
goal. Our key findings will focus on revenue forecasting in New Jersey and
on opportunities that we see to improve current processes.
KEY FINDINGS
Although New Jersey’s record on revenue forecasting has not been good since the recession, we find the biggest shortcoming to be in the
State’s failure to establish and maintain a Surplus Revenue Fund sufficient to manage forecasting errors.
Deposits into the Surplus Revenue Fund, for the purpose of protecting against revenue volatility, are dependent on a year-end surplus
between forecasted and actual revenues. This less than proactive approach is uncomfortably similar to explanations of why most
Americans have not saved enough for retirement.
The revenue stream feeding the Surplus Revenue Fund is heavily
reliant on sales tax revenue which, according to the Treasurer’s Tax Expenditures Report, is reduced significantly by exemptions and
exclusions.
Since 2009 the Surplus Revenue Fund has been virtually empty.
4
In 2015, New Jersey only had enough reserve funds (Surplus Revenue
Fund plus end of year balances) to operate government for 9.2 days.6
New Jersey is the only state among the four studied whose revenues
have failed to recover to pre-recession peaks.
Since 2010 New Jersey has regularly overestimated revenues resulting in several “April Surprises” which, coming so close to the end of the
fiscal year have required short term fixes which have contributed to the State’s declining bond ratings.7
Although differences between forecasted and actual revenues in New
Jersey are small in percentage terms, in absolute dollars they run in the millions and occasionally, billions of dollars. Thus, they have significant programmatic and political consequences.
Even as New Jersey has suffered a succession of “April Surprises.” to
our knowledge, it has not undertaken any systematic initiative to improve its approach to revenue forecasting. Both legislative and
executive branch agencies appear to lack the staff and resources to do so. While all revenue forecasts have error, even a small decrease in forecasting error might be significant in absolute dollars.
New Jersey maintains a competing, rather than a consensus
forecasting model with the executive branch and the legislative branch offering competing forecasts.
The literature on revenue forecasting suggests that consensus forecasting does not produce more accurate forecasts. Its principal
advantage is political. It creates a shared reality as the budget process unfolds following the Governor’s budget address and often
introduces greater transparency into revenue forecasting processes.
The volatility of New Jersey revenues, although slightly higher than
the national average, is lower than in Delaware and New York.
Compared to both New York and Delaware, information on New Jersey’s revenue forecasting methodologies and results is much less
available and transparent.
6 (Rosewicz and Newman 2016) 7 (Reitmeyer 2016)
5
OPPORTUNITIES TO IMPROVE REVENUE FORECASTING IN NEW JERSEY
Given the impact of the budgetary challenges facing New Jersey it is perhaps
time to give renewed attention to revenue forecasting and its associated
processes. Based on the analysis that follows, we offer a few areas where
productive changes might possibly be made.
Establish a Proactive Approach to Building and Maintaining the State’s Budget Reserves
New Jersey is not alone in its year-end approach to adding to its “rainy day” fund. But its sustained zero balance means that the State is in no
position to manage revenue volatility. New Jersey needs to build its reserve funds up front by making deposits into the fund as a regular
practice. This might be done by setting aside a percentage of the surplus general revenue funds or by limiting the amount of forecasted revenues that can be appropriated and spent, depositing the remaining funds up
front. Judging by recent history, if New Jersey waits for a budget surplus to
add to its rainy day fund, it will rarely have one. Also, it is notable that New Jersey has no repayment provision when it uses its reserve funds, a
practice that is common in other states. Granted, this means that the total revenue available for appropriations
would decrease, but this is much like an individual setting aside a portion of their income for savings. One could argue that this dislocation
of funds is less impactful to existing programs than the large disruptions that can occur due to revenue shortfalls in the absence of a revenue stabilization fund. Finally, in not preparing for these shortfalls, the
legislature potentially concedes substantial spending authority to the Governor when there is an emergency revenue shortfall towards the end of the fiscal year (i.e., the “April Surprise”).

6
Establish Surplus Revenue Fund Targets to Reflect Historical and
Projected Patterns in Forecasting Accuracy New Jersey has no targeted size for its Surplus Revenue Fund. As our
analysis and the literature on revenue forecasting suggests, revenue volatility is real, but it is also variable. Just as individuals adjust their
financial decisions based on experience, so should the State. The long string of optimistic revenue forecasts suggests not only the importance of being proactive in building reserve funds, but also adjusting their size to
meet experienced and anticipated circumstances. Thus, hypothetically, if your April Surprise is a $200 million shortfall in
revenues and the Surplus Revenue Fund has only $50,000, it will not be of much help.
Consensus Forecasting
In rejecting recent legislation calling for consensus forecasting in New Jersey, Governor Christie indicated that there was no evidence that
consensus forecasts were more accurate. While this may be true, it is also true that there is no evidence that consensus forecasting is less
accurate. More importantly, consensus forecasting brings a critical advantage to the table: a shared reality and a shared vision of the economic parameters of the State’s fiscal future.
Include Longer Term Forecasts in the Revenue Forecasting Process
In contrast with the other states studied in this report, New Jersey
stands out in its short-term perspective for revenue forecasting. Certainly, longer-term forecasts may be prone to error, just as states that use biennial budgeting have found. But without long-term forecasts
there is no benchmark for determining the long-term impacts of current legislative initiatives. Nor is there a basis for longer term financial
planning. This merely induces a tendency to the short-term “fixes” that New Jersey has used so frequently.
Regularly Analyze and Monitor Sources of Revenue Volatility and Forecasting Error
Revenue forecasting needs to be, as far as possible, self-correcting.
While we recognize there will always be error, minimizing the size of the error and its volatility requires conscious attention. The State should be conducting or sponsoring research on the sources of revenue volatility,
as well as evaluating the effectiveness of its forecasting methodologies.
7
Update Forecasts Throughout the Year to Reflect Evolving
Conditions and to Monitor “Drift” Away From Critical Financial Assumptions.
New Jersey’s last revenue forecast takes place more than a year in advance of the end of the fiscal year being planned. In contrast,
Delaware and New York update forecasts six times a year. New Jersey’s approach may have been fine for an economy of the 1960s, but it hardly seems adequate for a more volatile 21st century, globalized economy.
While it is true that both the Office of Legislative Services and the Department of Treasury issue monthly revenue updates, these are
compared to the revenues certified by the governor at the time the Appropriations Act is passed, which may be woefully out of date with
regards to the state’s economic conditions. At a minimum, New Jersey should identify the conditions that might
require a mid-year update to the State’s revenue forecast to help guide timely adjustments to significant economic or other emergencies (e.g.,
Sandy). This would be consistent with the current provisions for tapping the Surplus Revenue Fund for similar situations.
Make the Forecasting Process More Transparent and Widely Accessible
The Department of the Treasury and the Office of Legislative Services issue updated revenue forecasts, but most citizens would have to actively
look for them. It would also help (see consensus forecasting above) if these forecast updates used the same methodology, and ideally, if they
came up with a single number. Regular updates are important to giving all actors an opportunity to
make appropriate adjustments. Adjustments made early may be manageable; those made later in the fiscal year may, as in the past,
result in far less attractive alternatives.

8
BACKGROUND
State governments must not only develop operating budgets, but also forecast
the revenues that will make the budget a working reality. If these forecasts are
overly optimistic, decision-makers will face difficult choices that may have long-
term consequences for the economic health of the state. In this first section we
frame understanding of New Jersey’s processes for making revenue forecasts
by covering key points in the literature on revenue forecasting in the American
states.
Operating in a turbulent and uncertain environment, those charged with
forecasting state revenues confront two, related challenges: tax revenue
volatility and accuracy of total revenue forecasts.8 Addressing these challenges
involves managing the effects of a complex web of forces that influence one or
both of these challenges, often within a highly charged partisan environment.
Tax Revenue Volatility
Tax revenue volatility refers to the year-to-year variation in each state’s various
tax revenue streams, as well as the variation in the aggregate revenue
generated by the state’s tax structure. This volatility is like a set of economic
tectonic plates whose shifting movements create uncertainty in the forecasting
environment. Indeed, tax revenue volatility is almost by definition the largest
source of error in revenue forecasts.
8 (Emery and Trist 1965). For a broader view of managing uncertainty see (Berstein 1998).
9
Volatility is shaped by a variety of factors, some of which are beyond the
control of the state or its forecasters and a recent study suggests that revenue
volatility is increasing.9 These include:
A state’s tax structure, including which taxes it uses, the basis for
deriving revenue, the proportion of the total tax revenue stream attributable to each type of tax, and the particular mix of tax advantages
embedded in state tax law. For example, the greater the role of capital gains in determining adjusted gross income, the greater the volatility of revenues.
Actions by the Federal government that may impact state law, or more
broadly, the Federal government’s economic policy and the overall health of the state’s economy. For example, changes in the way in which the
IRS treats capital gains may influence citizens in a state to take those capital gains in one year as opposed to another.
The size of the state and the diversity of its economic base. States that are reliant on a narrow range of business sectors may experience greater
volatility (e.g., resource-rich states like Alaska).10
Shifts in other social, economic, and demographic factors such as unemployment, foreclosure rates, sectoral declines in key state
industries, or relocation decisions by businesses both large and small. In some states, even weather can produce tax revenue volatility (e.g., Sandy).
Major macro-economic events, such as recessions, contribute to revenue
volatility.
Accuracy of Revenue Forecasts
One conclusion emerges as a constant from the literature on revenue
forecasting: there will always be error. State revenue forecasters are adrift in a
shifting sea of uncertainty. Boyd and Dadayan give a daunting summary of
factors contributing to the accuracy of revenue forecasts:
9 (The Nelson A. Rockefeller Institute of Government and The PEW Charitable Trusts 2015) 10 This is corroborated by Tax Revenue Volatility Scores published by the Pew Charitable
Trusts (2015). States like Alaska, Wyoming, and North Dakota top the list.
10
“. . . forecast methodology (such as utilization of expert opinion, nominal groups, Delphi methods, ARIMA, exponential smoothing, moving average,
simple regression, multiple regression, multiple equation regression, and simulation methods), political factors (such as party composition of the
government), economic factors (such as the economic condition of the state, unemployment rate, or per capita income) and institutional factors (such as tax and expenditure limits, budget cycles, parties involved in revenue forecasting
process, frequency of the forecast, whether the budget is bound by the forecast, the use of university faculty in the forecast preparation, the presence of an economic advisory council).11
The Nelson A. Rockefeller Institute of Government has produced the most
comprehensive description of state revenue forecasting errors in recent times.
This report covers the entire nation over the period of 1987-2013.12 They distill
their descriptive findings:
Forecasting errors vary by tax instrument. Median absolute percentage
errors were highest for corporate income tax (11.8%). Personal income tax (4.4%) and sales tax (2.3%) were more accurate.
“Smaller states and states dependent on a few sectors of the economy
(particularly states reliant on oil or natural gas, or gambling) . . .tend to have larger errors. Those states’ errors also tend to be more variable.”
Tax revenue forecasts show a conservative bias, particularly in situations
of uncertainty. That is, forecasters tend to underestimate revenues rather than face significant shortfalls.
Forecasting errors are larger in periods around recessions.
Errors associated with the 2001 and 2007 recessions were particularly
large, but errors have now returned to “normal.”13
The closer the forecast is to the onset of the fiscal year, the more accurate the forecast.
11 (Boyd and Dardan 2014, 34) 12 (Boyd and Dardan 2014) 13 (Boyd and Dardan 2014, vii). This conclusion is a generalization across all states, but we do
not see it as necessarily true for New Jersey.

11
Other investigators suggest that political factors are important in forecast
accuracy.14 Since most states have a balanced budget requirement, political
contexts of estimating revenues (e.g., actors making the forecast, divided vs.
single party control of the legislature) can create incentives to make more
generous or more conservative forecasts, thus altering the risk of political
consequences. Both incentives and consequences vary for different actors in
the revenue estimating process.15 Krause, et al., conclude that executive
branch estimates tend to be more conservative than legislative branch
forecasts, although we note that methods used by state legislative institutions
do vary widely. They also note that when there is a divided legislature, revenue
estimates tend to be more conservative and when there are gubernatorial terms
limits, executive revenue estimates may be less conservative.16
The underlying rationale is that those who will bear the greatest responsibility
for dealing with revenue shortfalls tend to be more conservative. In most
cases, the governor—a single, highly visible actor—will bear the greatest
consequences. Except perhaps, when they are the outgoing governor and their
successor will have the responsibility for dealing with subsequent shortfalls.
Other actors will have different perspectives on revenue forecasting issues,
illustrating the maxim where you stand depends on where you sit. Legislative
responsibility tends to be collective, which disperses responsibility for
14 (Mikesell and Ross 2014) 15 (Krause, Lewis and Douglas 2013, 271-277) 16 (Krause, Lewis and Douglas 2013, 271)
12
addressing shortfalls. There is a greater incentive, instead, to ensure that
money is appropriated for delivering more services to local constituents.17
When you have a quasi-independent agency, even one attached to the
legislature such as New Jersey’s Office of Legislative Services, creating
estimates they may tend to be more conservative, as they are not playing with
their own political capital.18
When states create competing forecasts embedded in the executive and
legislative branches of state government, each forecast takes on a partisan
character that may lead to political conflict, particularly in the case of divided
government.
Political factors influence spending as well as forecast accuracy. Although
spending patterns are not the focus of this study, research by Krause and
Melusky suggest that unilateral control by governors of revenue forecasting
and budget formulation can lead to increased spending.19 They note,
“. . . the best means for restricting excess fiscal-spending growth is for fiscal policymaking authority to be shared between the governor and legislature, and possibly other independent policy actors such as elected executives, civil
servants, or independent commissions.”20
Given balanced budget requirements, those interested in spending more, may
be tempted into more generous revenue forecasts. Krause and Melusky’s
17 (Barrilleaux and Berkman 2003) 18 Governor Christie is famous for labeling David Rosen, formerly in charge of revenue
forecasting for OLS, as the Dr. Kervorkian of numbers in May 2012 when he produced a
revenue forecast that was much more conservative than Christie’s. 19 (Krause and Melusky, Concentrated Powers: Unilateral Executive Authority and Fiscal
Policymaking in the American States 2012), p.98. 20 (Krause and Melusky, Concentrated Powers: Unilateral Executive Authority and Fiscal
Policymaking in the American States 2012), p. 110.
13
perspective is consistent with advocates of consensus revenue forecasting
processes who suggest that involving more actors will increase the accuracy of
forecasts.21
Approaches to Managing Revenue Volatility
As noted at the outset, there will always be error in revenue forecasts, much of
it attributable to volatility in the revenue streams that must be projected.
States have many different approaches to managing volatility in their revenue
streams. Like the methods for creating the forecasts themselves, methods for
managing underestimation or overestimation of revenues are heavily influenced
by statutory, constitutional, and political variables.
Among the techniques employed by states to protect themselves from the
particularly unpleasant alternative of overestimating revenues are:
1. Limits on the Percentage of Forecast Revenues that Can Be Appropriated
By creating limits on the amount of the forecast revenues that can be actually spent, some states, like Delaware, build a small cushion or hedge against the possibility of having to cut programs, shift revenues, or
even increase taxes in situations in which there are significant revenue deficits during the fiscal year. The percentage of the forecasted revenues that are held back varies.
2. Use of “Rainy Day” or Budget Stabilization Funds
All but four states have a “rainy day” or budget stabilization fund to
stabilize the budget in the face of volatility. Too often, however, volatility overwhelms the amount of money deposited in these accounts. Although
the combined deposits of all US states was almost $60 billion in 2008,
21 See, for example, (E. C. McNichol 2014).

14
this was only about half of the $117 billion shortfall faced in the following fiscal year.22 While the 2008-2009 recession might be an
extreme case, it reveals some interesting lessons.
The structure of budget stabilization funds may have four components:23
Rules that govern the timing and amount of deposits
Rules that govern withdrawals from the fund
Rules that may require repayment
Rules that govern the size of the fund
Deposit practices vary widely from fixed percentages of the budget, to portions of surpluses at the end of the year, to amounts above forecasted
revenues, to simply arbitrary decisions made by one or more branches of government.
According to a post-recession analysis by The PEW Charitable Trusts,
these practices are not only inadequate, but have key flaws, some of which could be remedied by changing current behavior:24
Deposits based on surpluses are year-end solutions that give low
priority to rainy day reserves, often even limiting the deposit to
only a portion of the surplus.
Deposits based on revenue above forecasted levels assume that the forecast levels, rather than actual figures should be the standard.
Therefore, if forecast error is high, there may be missed opportunities to build reserves. In addition, there may be rules that impact the calculation or dedicate only a portion of the
“excess” revenue. For example, in New Jersey, excess receipts in personal income taxes are excluded from the calculation as they are mandated to support property tax relief.25
Both the year-end surplus and excess revenue approaches give
saving a very low priority. Saving for the future comes only at the end of the budget cycle.
At hoc, static, or fixed percentage deposit approaches fail to
account for known uncertainties in revenue forecasting or past volatility in actual revenues.
22 (The Pew Charitable Trusts 2014) 23 (Haggerty and Griffin n.d.) 24 (The Pew Charitable Trusts 2014, 4-9) 25 (The Pew Charitable Trusts 2014, 8)

15
3. Changing the Tax Structure to Give Greater Emphasis on More Stable Sources of Revenue
The varied sources of revenues utilized by states differ, often widely, in
their volatility. The greater the reliance on more volatile sources, the
greater will be the overall revenue volatility. For example, the greater the role that capital gains and other non-wage forms of income tax play in determining tax liability, the more volatile will be revenue from personal
income tax. This might result from details in tax law, or perhaps from having a steeply progressive income tax structure that places greater emphasis on high-income individuals or families.
Approaches to Improving Revenue Forecast Accuracy
States use a dizzying array of approaches to make revenue forecasts that reflect
local conditions, state economic profiles, national economic forces, and political
conditions.26 Given the complexity of the forecasting challenge, there appears
to be very little consensus that particular structural approaches, process
variables, or other factors are the “magic bullet” for reducing error in revenue
forecasts.27 As one study put it
“No state can entirely eliminate forecasting errors. Unexpected economic
turns, new legislation, the rise and fall in housing values, and changes in federal policy, such as the 2013 budget deficit reduction plan known as the ‘fiscal cliff,’ guarantee that estimating revenue will always be imprecise. … the
resulting shortfalls and surpluses may complicate lawmakers’ efforts to craft and execute balanced budgets over several years.”28
Despite the lack of consensus regarding strategies to reduce forecasting error,
the literature cites a variety of approaches that have been tried, often by more
than one state. These include:
26 See, for example, (The Nelson A. Rockefeller Institute of Government and The PEW
Charitable Trusts 2015) 27 See, for example, (The Nelson A. Rockefeller Institute of Government and The PEW Charitable Trusts 2015) and (Mikesell and Ross 2014) 28 (The Nelson A. Rockefeller Institute of Government and The PEW Charitable Trusts 2015, 1)

16
1. Changing the tax structure
Diversification of the tax structure can reduce some volatility in revenue streams, a major source of forecasting error.29 However, this is not
unqualified. As noted above, the volatility of different types of taxes varies substantially. For example, the greater the role of capital gains in income taxes, the more difficult it is to predict. Furthermore, Boyd
and Dardayan point out that “Only by virtually eliminating the corporate income tax and significantly increasing reliance on the sales tax relative to the personal income tax could the typical state reduce revenue
forecast errors, and even then most tax combinations would not reduce forecast errors very much.30
2. Timing and Frequency of Forecasts
States vary widely in the lag between revenue forecasts and the onset of
the fiscal year. Using a regression model, Boyd and Dardayan suggest that forecasts made closer to the beginning of the fiscal year are said to
be more accurate. They conclude that each week lag introduces an error of 0.05%.31 It doesn’t appear, however, that frequency of forecasts makes a significant difference in revenue forecasting error.32 The
authors note that frequent forecasting does permit earlier identification of drift in actual revenue relative to forecasted revenue, thereby making earlier intervention possible. More frequent forecasts may also be
advantageous in fine-tuning forecast models.
One final note about timing. Most states have fiscal years beginning July
first. Given that most state income tax return due dates are synchronized with the Federal date in mid-April, this means (1) states are forecasting conditions close to a year away even in those states where
forecasts are updated closer to the onset of the fiscal year. In the case of corporate income taxes, extensions may also extend the period of uncertainty.
3. Monitoring Reviews and Updates
Many states attempt to monitor the sometimes-uneven flow of revenue. However, given the emphasis on revenue forecasts at the time of budget approval and passage of appropriations legislation, revenue forecasts
become unnecessarily static. They can lapse into meeting statutory or constitutional mandates without laying the foundation for managing the
implementation of the budget and its associated revenue forecast.
29 (Boyd and Dardan 2014, 18), citing the work of Crain. 30 (Boyd and Dardan 2014, 24) 31 (Boyd and Dardan 2014, 31) 32 (Boyd and Dardan 2014, 33)
17
Monitoring revenue will not produce a more accurate forecast at the time of budget passage, but it might allow the state to undertake needed
adjustments to changing conditions, thereby producing a better alignment of expenditures and revenues as the end of the budget cycle
approaches.33
4. Consensus Forecasting
States vary in those groups, institutions, or individuals who are charged with making revenue forecasts. Examples include actors from the
executive and legislative branch, outside experts, even citizen panels. A consensus forecast is one in which all actors in the process produce a
collective estimate. The logic of consensus forecasting is that various actors will create an estimate that cancels out individual biases. However, the specific sets of actors involved, their number and diversity
of skills, the presence of partisan actors, the methods for achieving consensus, and many other contextual variables can influence the
quality of the consensus forecast.34 In contrast, many states, including New Jersey, may have actors issuing
separate forecasts that appear to be in competition with each other, commonly a separate forecast by the executive branch and a research arm of the legislature.
5. Outsourcing Economic Forecasts
Almost all forecasting relies upon economic forecasts of future
conditions. Some states do the forecasts in house, while others use the services of an external firm. The latter approach may be followed when a
state does not have the resident expertise and/or it feels an external assessment will be less likely to be viewed as biased.
REVENUE FORECASTING IN NEW JERSEY
The Budget Process
The budget process in New Jersey extends for approximately one year before a
new fiscal year begins. Budget planning begins in earnest in August and
33 Of course, the capacity to do this will depend upon the proportion of the budget that is discretionary. 34 See, for example, (Krause and Douglas 2013) and (Voorhees 2004).
18
September of the prior fiscal year. Meaning, planning for Fiscal Year (FY) 2017
(which commenced on July 1, 2016) began in August and September of 2015.
New Jersey does not produce a multi-year budget. The New Jersey Office of
Management and Budget (NJOMB) provides agencies with preliminary budget
levels and agencies, in turn, prepare planning documents for submission
between September and January. NJOMB then works with the Governor,
Treasurer, and the Governor’s staff to prepare a budget proposal in advance of
the Governor’s February budget address. Once the Governor introduces their
proposed budget, the Assembly holds hearings and debates throughout the
spring in an effort to craft the final Appropriations Act (AA). The AA must be
passed by the end of the current fiscal year, June 30. After the onset of the
new fiscal year, the legislature has the authority to pass additional
supplemental appropriations, as necessary. 35 Figure 1 displays a Gantt chart
of the New Jersey budget and revenue forecasting processes.
35 (New Jersey Department of the Treasury 1996-2007)

19
Figure 1. New Jersey’s Executive Branch Revenue Forecasting and Budgeting Cycle
In New Jersey, much like the federal government, “all bills for raising revenue
shall originate in the General Assembly.”36 The Governor and Assembly then
have joint responsibility over the passage of an annual general appropriations
law. The New Jersey Constitution also stipulates that:
“No general appropriation law or other law appropriating money for any State
purpose shall be enacted if the appropriation contained therein, together with all prior appropriations made for the same fiscal period, shall exceed the total
amount of revenue on hand and anticipated which will be available to meet such appropriations during such fiscal period, as certified by the Governor.”37
36 Article 4, Section 6, Paragraph 1 of the New Jersey State Constitution (1947). 37 Article 8, Section 2, Paragraph 2 of the New Jersey State Constitution (1947).
20
The Governor possesses two key budgeting powers:
1. The Governor must certify the revenue estimates, thus limiting funds
available for allocation.
2. The Governor has the authority to line item veto appropriations in order to meet the constitutional mandate for a balanced budget. This is also a powerful
negotiating tool, even in the face of a divided government.
Revenue Forecasting
The Office of the Chief Economist/Office of Revenue and Economic Analysis
(OCE) produces the official revenue estimates in New Jersey. OCE uses
historical revenue data, macroeconomic forecasts contracted from outside
experts (IHS, Moodys, and Rutgers), and breaking national and state news to
generate revenue projections twice per year. The first projection is released in
February in support of the Governor’s budget address and a second in May for
the Treasurer’s budget testimony. In addition to these forecasts, OCE tracks
revenue for the Department of the Treasury (Treasury) throughout the year.
Treasury issues monthly press releases that include top-level revenue
amounts.38 Tracking revenues monthly gives the Treasurer a sense of whether
the state is ahead of or behind the certified revenue estimates in the AA. It also
allows the executive branch to make adjustments to spending as the year
progresses, as allowed by the AA. Although, as a source in Treasury
confirmed, there is always the possibility of an “April surprise,” as there are few
38 See, for example: http://www.nj.gov/treasury/news/2016/p11_16_2016a.pdf. Given that
these totals are presented in press releases, it is not always easy, at first glance, to identify the
appropriate report amongst the population of press releases. This is due to the use of press-friendly headlines. OLS, on the other hand, places all monthly snapshots on a single webpage
and explains their methodology (http://www.njleg.state.nj.us/legislativepub/snapshot.asp).

21
obvious clues from the monthly revenue stream regarding final income tax
payments and refunds.
Treasury is not the only producer of revenue estimates. The Office of
Legislative Services (OLS), i.e., the research arm of the Assembly, provides
legislators with revenue estimates in April and May. They only project
revenues for the major taxes (approximately 80-85 percent of total income).
OLS also produces a monthly revenue snapshot.39 Each snapshot compares
actual cash received with historical patterns and year-end target growth rates
for major revenue streams to determine whether monthly revenues are
exceeding or trailing expectations. OLS also makes an educated adjustment
based on anticipated tax changes by the state and federal government (e.g.,
changes to capital gains taxes). Only a small portion of OLS staff is responsible
for preparing revenue projections and that is not their sole responsibility.
Given the Governor’s constitutional mandate to balance the budget, OLS
considers itself a “second look” at the annual revenue forecast.40 In December,
OLS produces a final report for the previous fiscal year, however the official
year-end numbers are reported in the Governor’s Comprehensive Annual
Financial Report (CAFR) the following spring. 41
While there is often debate in Trenton about whose number is going to be
correct, we find that revenue and expenditure estimates produced by OLS and
the Governor are not drastically different. Figure 2 displays the percentage
39 http://www.njleg.state.nj.us/legislativepub/snapshot.asp. 40 This is according to an official at OLS. 41 (New Jersey Department of the Treasury 1996-2007)

22
difference between the revenue estimates of the Governor and OLS at the time
the annual budget is proposed (February) and the final revenues published in
that fiscal year’s CAFR. In this case, both offices are estimating final
collections over one year ahead of time. What is immediately evident is the
degree to which economic shocks (e.g., the Great Recession) affect the accuracy
of their forecasts. Unanticipated economic shocks will necessarily introduce a
great deal of forecasting error. It is also apparent that OLS generally tracks
with the Governor, but appears to be slightly more conservative. This is
evidenced by the fact that OLS’s trend line, more often than not, falls below the
Governor’s. Meaning, when both overestimate revenues, OLS does so to a
smaller degree. Likewise, when they underestimate revenue, OLS does so by a
larger amount. It also appears that the gap between the two offices began
widening between 2012 and 2015.

23
Figure 2. Percentage Difference between the Governor’s and OLS’s February Proposed Budget Revenue Estimates and CAFR
Figure 3 displays the same comparison, but this time for the revised estimates
published by both offices in May of the current fiscal year. These estimates
take into account any April surprises and give the Governor and legislature an
idea of whether there are surpluses or deficits in the current fiscal year as they
are finalizing the budget for the next fiscal year. Again, OLS and the Governor
issue fairly similar estimates, in terms of the percentage difference from actual
revenues, and these differences are substantially smaller due to the close
proximity of the end of the fiscal year. Meaning, the estimates are produced
very close to the end of the collection period and are thus more accurate than
the estimate from fifteen months prior (i.e., Figure 2).
-10.00%
-5.00%
0.00%
5.00%
10.00%
15.00%
2002 2003 2004 2005 2006 2007 2008 2009 2010 2011 2012 2013 2014 2015
Sources: Office of Legislative Services Annual Tax and Revenue Outlook Reports and the Comprehensive Annual Financial Audit
Governor Office of Legislative Services

24
Figure 3. Percentage Difference between Governor’s and OLS’s May Revenue Revisions Revenue Estimates and CAFR
One final point that warrants mentioning is that while OLS and the Governor
appear to have similar accuracy in projecting revenues sixteen months (Figure
2) and two months (Figure 3) prior to the end of the fiscal year, small
differences are meaningful and create political tension because of their
potential to have real programmatic impacts. Table 1 puts this into
perspective. The table presents total revenue projection differences between
OLS and the Governor at the time of the budget proposal and the following
May’s revision. When comparing OLS and the Governor, a positive value
(bolded and italicized) represents the few times when OLS’s projection was
higher than the Governor’s. This reiterates the observation that OLS is slightly
more conservative in their estimates. The other comparisons are between the
-10.00%
-5.00%
0.00%
5.00%
10.00%
15.00%
2002 2003 2004 2005 2006 2007 2008 2009 2010 2011 2012 2013 2014 2015
Sources: Office of Legislative Services Annual Tax and Revenue Outlook Reports and the Comprehensive Annual Financial Audit
Governor Office of Legislative Services
25
Governor and OLS projections and the final CAFR audit. In this case, the
positive values (also bolded and italicized) represent instances where
projections exceeded actual revenues. What is evident is that even small
overages in percentage terms, for example 1-2 percent in the 2012 May
revisions, are large in terms of real dollars (up to $678 million). What is also
important to note here is that even when the percentage difference between the
Governor and OLS is small, in many cases at or below one percent, the real
dollar value is still in the hundreds of millions. Hence the political acrimony
over differences in estimates, particularly in the face of an “April Surprise.”42
42 (Reitmeyer 2016)

26
Table 1. Total and Percentage Differences between Governor, OLS, and CAFR Revenue Amounts
Budget Proposal May Revision
Fiscal
Year
OLS-
Governor
Governor-
CAFR
OLS-
CAFR
OLS-
Governor
Governor-
CAFR
OLS-
CAFR
2017 -$89M
2016 $39M
-$73M
2015 -$309M $1.423B
(4.31%)
$1.114B
(3.37%)
-$23M -$457M
(-1.38%)
-$480M
(-1.45%)
2014 -$335M $1.575B
(5.04%)
$1.240B
(3.97%)
-$217M $1.291B
(4.13%)
$1.075B
(3.44%)
2013 -$392M $332M
(1.05%)
$-$61M
(-0.19%)
-$302M -$199M
(-0.63%)
-$502M
(-1.59%)
2012 -$53M $361M
(1.24%)
$308M
(1.06%)
-$145M $678M
(2.34%)
$533M
(1.84%)
2011 -$168M -$311M
(-1.09%)
-$478M
(-1.67%)
-$72M -$316M
(-1.11%)
-$388M
(-1.36%)
2010 -$223M $1.844B
(6.63%)
$1.622B
(5.83%)
-$82M -$77M
(-0.28%)
-$159M
(-0.57%)
2009 -$289M $3.650B
(12.66%)
$3.361B
(11.66%)
-$383M $1.161B
(4.03%)
$778M
(2.70%)
2008 -$289M -$559M
(-1.72%)
-$885M
(-2.72%)
$155.3M -$539M
(-1.66%)
-$384M
(-1.18%)
2007 -$159M -$480M
(-1.54%)
-$639M
(-2.05%)
-$299M -$309M
(-0.99%)
-$608M
(-1.95%)
Sources: Office of Legislative Services (OLS) Annual Tax and Revenue Outlook Reports and
CAFR.
Notes: Bold and italicized numbers reflect an over-estimate. Negative values represent an
under-estimate. Amounts are in billions (B) or millions (M).

27
Figure 4 is reprinted with permission of NJ Spotlight and illustrates the extent
to which New Jersey has experienced an “April Surprise” since Governor
Christie took office.43 The Governor inherited a substantial deficit from the
outgoing Corzine administration, which reversed in 2011, but was then
followed by three years of substantial shortfalls.
Figure 4. New Jersey "April Surprises" as Reported by NJ Spotlight
Note: Reprinted with permission. Copyright NJ Spotlight
43 (Reitmeyer 2016)

28
Rainy Day Fund
As noted in our review of the literature on revenue forecasting, states generally
maintain reserves to protect against budgetary shocks on the revenue side.
These reserve funds have specific names in different states, but collectively
they are often referred to as “rainy day” funds. Their character is typically
defined by four characteristics:44
1. Rules that determine the timing and amount of deposits
2. Rules that govern the size of the fund, usually cap on their total size
3. Rules that govern withdrawals from the funds
4. Rules that may require repayment or replenishment of funds, once they
have been withdrawn.
New Jersey’s “rainy day” fund is called the Surplus Revenue Fund.45 Its
characteristics are as follows:
Timing and the Amount of Deposits
A surplus-driven fund in which deposits are made only on or before December 31 annually.46 Thus, the fund is fed only when revenues
exceed expectations established over a year prior. This year-end, “if there is money left,” approach is similar to the retirement savings strategies often criticized by financial columnists.47
According to the New Jersey Revised Statutes, the legislature can also
directly appropriate funds into the Surplus Revenue Fund.48
44 (Haggerty and Griffin n.d.) 45 NJSA C52:9H-14 to 52:9H-23. 46 The Treasurer must report the status of the Fund to the Governor and Assembly at least
once a year (on or around January 15th). NJSA c52:9H-14. 47 See, for example, (Light 2016) 48 NJSA C52:9H-14

29
The required surplus-based deposit is determined by the following
formula: “50% of the difference between the amount of revenue certified by the Governor in the annual Appropriations Act for the current fiscal year and the actual collections realized for that year.”49
We note that deposits to the Fund are heavily reliant on sales tax
revenues, which are reduced by significant exemptions and exclusions.50
Surpluses in personal income tax revenues are not deposited into the
fund because those revenues are designated for property tax relief.
Surpluses in the remaining revenues are first diverted to property tax relief if actual collected income tax revenues fall below those certified by
the Governor in the year prior.51
Cash remaining in state funds (e.g., the General Fund) is simply carried forward to the next year and does not contribute to the Surplus Revenue
Fund.
Due to the fiscal challenges during and after the Great Recession, New Jersey’s Surplus Revenue Fund has been virtually empty since FY 2009
(see Figure 8 later in the report). New Jersey is one of the few remaining states whose Rainy Day Fund has not recovered since the Great
Recession.52
Cap on the Size of the Fund
New Jersey has an effective cap on the fund of “5% of the amount
certified by the Governor as total anticipated revenues in the General
Fund and the Property Tax Relief Fund”.53
If this fund exceeds this cap, up to 2% of the total anticipated revenues
can be spent for the following purposes:
o “To provide a reserve fund for retirement, purchase or discharge of
outstanding general obligation bonds of the State of New Jersey;
o To provide appropriations for capital projects;
o To provide appropriations to reduce or offset real property taxes.”54
49 NJSA C52:94-16 50 (Mallinson and Carr 2017) 51 NJSA C52:94-16 52 (Kozlik 2016) 53 NJSA C52:9H-21 54 NJSA C52:9H-22 to NJSA C52:9H-23

30
Any funds in excess of that can be transferred to the General Fund.55
Withdrawals from the Fund
According to the statute, there are three possible criteria for withdrawing
cash from the Surplus Revenue Fund: o The Governor certifies that expenditures will exceed revenues. o The General Assembly determines that using the fund is preferable
to a tax increase. o The Governor declares an emergency and notifies the legislature.56
The legislature is responsible for apportioning withdrawals from the Fund. Nonetheless, the Governor can use cash from the Fund, upon
notification of and approval by the Joint Budget Oversight Committee, in the case of an emergency.57
It is important to realize, however, that due to the fact that these
conditions are not in the state constitution, withdrawals from the fund can be made with the joint assent of the legislature and governor.
Repayment Provisions
New Jersey does not have a mandatory repayment or replenishment
provision. As noted above, the fund has been empty since 2009.
Tax Structure
New Jersey utilizes three major sources of revenue: corporate income tax,
personal income tax, and sales and gross receipts tax. Combined, income
taxes represented 50 percent of total state revenues in 2015.58 Sales and
Gross Receipts taxes produced 41 percent of revenues in the same year. Figure
5 gives a sense of the relative volatility of these revenue sources. Income taxes
55 NJSA C52:9H-23 56 NJSA C52:9H-18 57 NJSA C52:9H-19 defines an emergency as follows: “condition or occurrence which requires
an immediate response in the protection of the life, safety or well-being of the citizens of this
State, or any of them, or in the protection or restoration of property, public or private,
endangered, damaged, or destroyed as a result, actual or potential, of such condition or occurrence.” 58 (U.S. Census Bureau 2015)
31
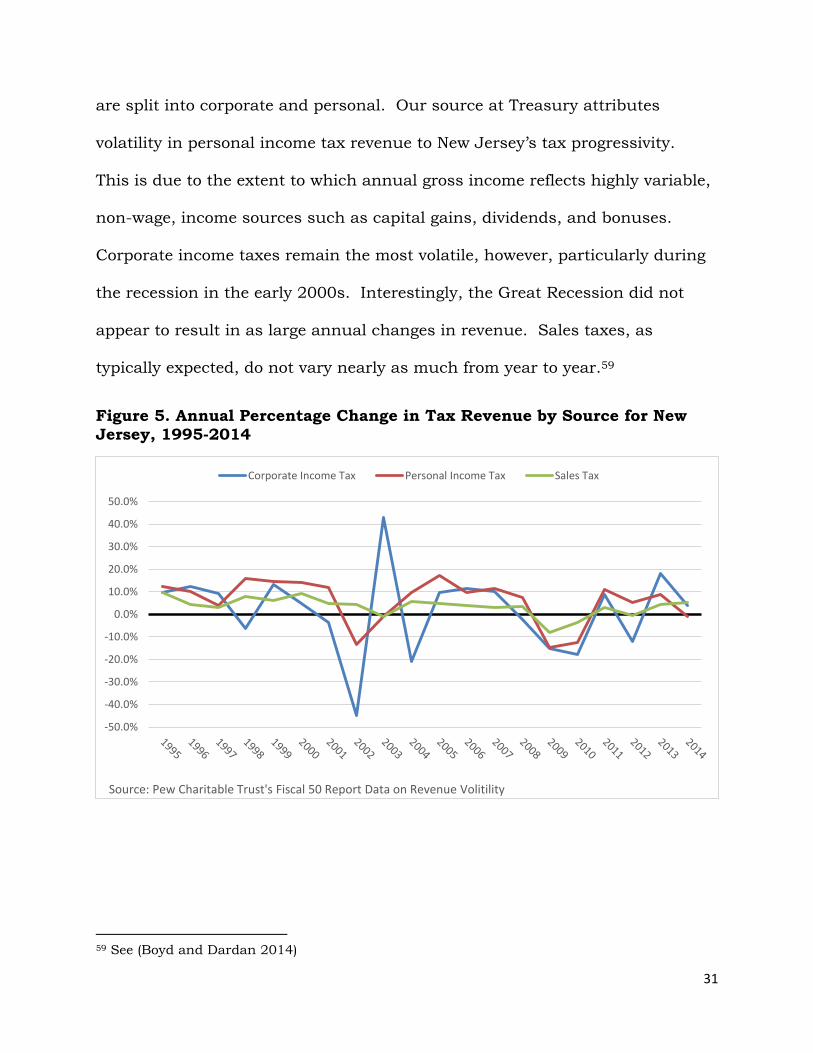
are split into corporate and personal. Our source at Treasury attributes
volatility in personal income tax revenue to New Jersey’s tax progressivity.
This is due to the extent to which annual gross income reflects highly variable,
non-wage, income sources such as capital gains, dividends, and bonuses.
Corporate income taxes remain the most volatile, however, particularly during
the recession in the early 2000s. Interestingly, the Great Recession did not
appear to result in as large annual changes in revenue. Sales taxes, as
typically expected, do not vary nearly as much from year to year.59
Figure 5. Annual Percentage Change in Tax Revenue by Source for New Jersey, 1995-2014
59 See (Boyd and Dardan 2014)
-50.0%
-40.0%
-30.0%
-20.0%
-10.0%
0.0%
10.0%
20.0%
30.0%
40.0%
50.0%
Source: Pew Charitable Trust's Fiscal 50 Report Data on Revenue Volitility
Corporate Income Tax Personal Income Tax Sales Tax

32
Reform Efforts
Reforms of New Jersey’s revenue forecasting system have been proposed in the
General Assembly, but have not gained traction. In 2015, Democrats proposed
creating a three person Revenue Advisory Board that would issue revenue
forecasts in January and May of each year.60 Speaking about this proposal,
Sheila Reynertson, senior policy analyst at New Jersey Policy Perspective, said
“a change in the forecasting process is long overdue. We hope it will take some
of the politics out of the process.”61 The January and May forecasts would
support the Governor’s budget proposal and the final Authorization Act. The
Governor, however, could still present alternative revenue estimates, as the law
would require the annual budget address to explain differences between the
estimates of the Governor and Advisory Board. Three members would include
the Treasurer, an OLS analyst, and a joint appointment by both parties. The
proposal would also require the Governor to project spending for two years
instead of just one, moving towards a longer-term planning approach (see
Pennsylvania). Finally, this reform proposal would require the Governor to
present options for balancing the budget in the event of a revenue shortfall.
The General Assembly passed this measure (A-4326/S-2942) in 2015, but
Governor Christie vetoed it on the grounds that the method would not produce
a more accurate forecast, be slower, and be potentially less transparent.62
60 (Assembly Democrats 2015) 61 (Reitmeyer 2015) 62 As of the printing of this report, a similar bill is under consideration in the Assembly (A3620)
and Senate (S2602).

33
REVENUE FORECASTING IN DELAWARE, NEW YORK, AND PENNSYLVANIA
In developing our opportunities for New Jersey to improve its processes, we not
only examined the broader literature on revenue forecasting and stabilization,
but also evaluated key differences between New Jersey and three neighboring
states: Delaware, New York, and Pennsylvania. Each state varies in its
budgeting processes, methods of revenue estimation, budget stabilization
methods, and tax structures. Appendix A provides an extended discussion of
each state, but this section provides an overview of the areas of key difference
and lessons for improving the process in New Jersey.
The Budget Process
While the exact timing of steps in each state’s budget cycle varies, New Jersey,
Delaware, and Pennsylvania operate on a July to June fiscal year, with fairly
similar processes in preparing their budgets. New York’s April to March fiscal
year is an interesting outlier amongst its neighbors. This is of special note
because it appears that the seemingly strange timeline may in fact help the
state manage the dreaded “April Surprise.” Since the budget has only recently
passed and the fiscal year is just beginning (i.e., the bulk of the appropriations
have not been spent), New York has eleven months to adjust spending in light
of unexpectedly high or low final collections and refunds. This is in contrast to
the one to two months that most states have before the end of their fiscal year,
when most of the funds are already spent. Of course, as an official at the New

34
York Division of the Budget pointed out to us, the April to March budget cycle
gives the legislature a shorter time frame for passing a budget on time.
Revenue Forecasting
There are several key differences across the four states in regards to revenue
forecasting:
Documentation
New Jersey provides little publically available documentation regarding
its methods.
New York, in contrast, makes publically available a 239-page manual for revenue and expenditure forecasting.63 Not only is this an advantage in
terms of transparency, but it allows the state to make clear the challenges in multi-year forecasts. Being forthright about the challenges encourages reasonable baseline expectations for the state’s ability to
predict the future.
Pennsylvania’s documentation falls somewhere in between New Jersey and New York, in that it is descriptive of the process, but does not
provide as much fine detail.64
Forecast Frequency
Pennsylvania has the least frequent forecasts.65 The Commonwealth
appears to only issue an official forecast in May of each year. This helps the executive certify revenues for the June 30 appropriations act.
New Jersey is only marginally better with two official forecasts – one in
the Governor’s proposed budget (February) and one for the appropriations act (May).
Both New York and Delaware issue official forecasts six times per year.
Combined with transparent forecasting practices, frequent forecasting allows those states to not only set reasonable baseline expectations, but
63 (New York State Division of the Budget n.d.) 64 (Pennsylvania Office of the Budget 2015) 65 (National Association of State Budget Officers 2015)

35
to update those prior beliefs throughout the fiscal year as revenue, spending, and macro-economic conditions evolve. Doing so gives the
states greater flexibility in managing revenue shortfalls throughout the year.
Body Responsible for the Forecast
Pennsylvania and New Jersey rely on the Governor’s office for official
forecasts, with the Assemblies also conducting their own competing forecasts.
New York and Delaware both take the consensus forecasting approach recommended by scholars. New York has an Economic
Advisory Board, composed of economists, that reviews methodology before the issuance of multi-year and quarterly forecasts. Delaware’s
Economic and Financial Advisory Council meets six times per year to issue projections. Its meeting minutes are published online.66 Thus, transparency in the consensus forecasting process is possible.
Accuracy
It is reasonable to ask whether variation in forecasting approach results in
better or worse projection outcomes. Consistent with past research in this
area, we find that the four states in our study do not vary substantially in their
ability to project revenues a year ahead of time. Figure 6 displays the
difference between each state’s revenue projection from the annual budget and
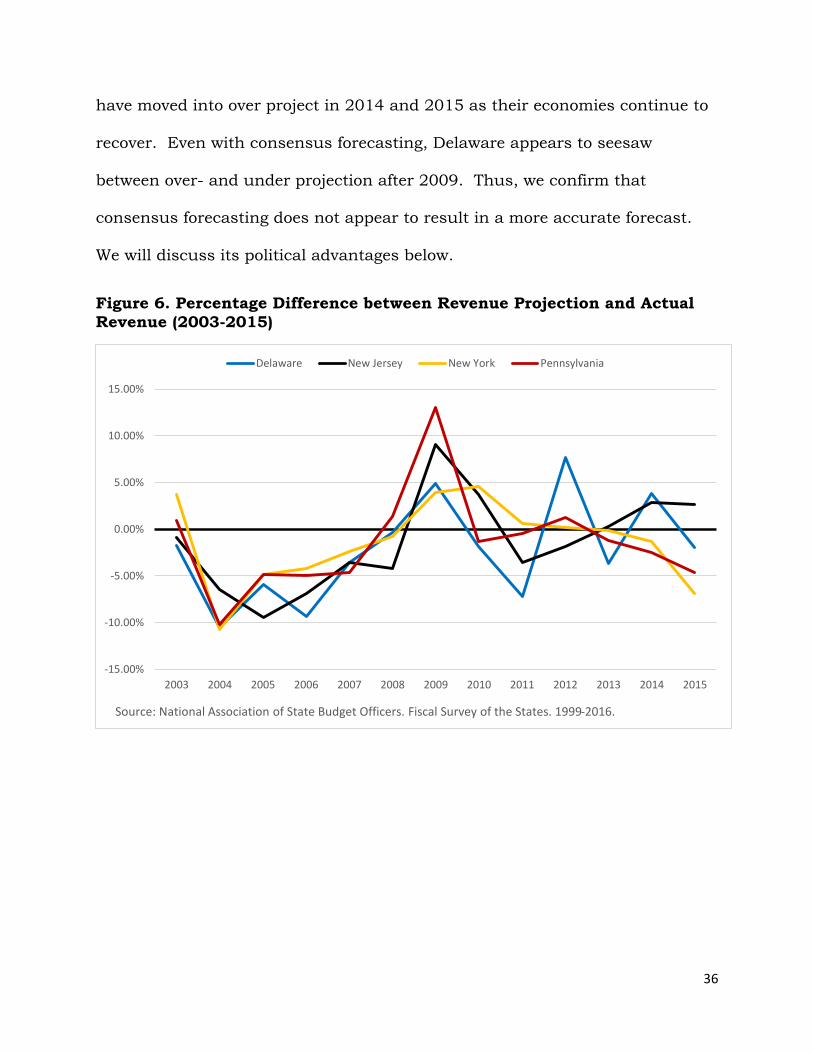
the actual revenues at the end of the fiscal year from 2003 to 2015.67 What is
immediately apparent is that all states are affected by exogenous shocks from
the business cycle. Furthermore, states tend to be conservative in their annual
revenue estimates.68 With the exception of the Great Recession, states tend to
under project revenues during the observed time frame. Granted, some states
66 http://finance.delaware.gov/publications/DEFAC.shtml. 67 NASBO’s Fiscal Survey of the States produces these data bi-annually. 68 (Krause and Melusky 2012)
36
have moved into over project in 2014 and 2015 as their economies continue to
recover. Even with consensus forecasting, Delaware appears to seesaw
between over- and under projection after 2009. Thus, we confirm that
consensus forecasting does not appear to result in a more accurate forecast.
We will discuss its political advantages below.
Figure 6. Percentage Difference between Revenue Projection and Actual
Revenue (2003-2015)
-15.00%
-10.00%
-5.00%
0.00%
5.00%
10.00%
15.00%
2003 2004 2005 2006 2007 2008 2009 2010 2011 2012 2013 2014 2015
Source: National Association of State Budget Officers. Fiscal Survey of the States. 1999-2016.
Delaware New Jersey New York Pennsylvania

37
Moving beyond projections, it is also important to recognize that the true
revenue situation varies across these states. While the Great Recession
negatively impacted each state, Figure 7 demonstrates that New Jersey is the
only one whose annual revenues have not recovered relative to their pre-2009
peak. This provides an important pivot point for discussing how states can
manage volatile revenues, forecast uncertainty, and changes in the business
cycle.
Figure 7. Percent Difference in Annual Revenues Compared to Peak Revenue before the Great Recession
-25.0
-20.0
-15.0
-10.0
-5.0
0.0
5.0
10.0
15.0
2009 2010 2011 2012 2013 2014 2015
Per
cen
t D
iffe
ren
ce f
rom
Pea
k Q
uar
terl
y Ta
x R
even
ue
Source: PEW. 2015. Fiscal 50.
Delaware New Jersey New York Pennsylvania
38
Rainy Day Funds
Table 2 presents several key differences amongst the four states in the extent
to which they have adopted the four rules outlined above for governing their
budget stabilization funds. Fuller descriptions of each state’s funds are
included in Appendix A.

39
Table 2. Comparison of Four Rules for State Budget Stabilization Funds
Deposits Withdrawals Repayment Maximum Size
New Jersey (Surplus Revenue Fund)
50% surplus actual over projected revenue, excluding personal
income tax
Legislature apportions:
a) Revenue Shortfall
b) Better than taxes
c) Emergency
No Rule 5% of expected General and Property Tax Relief Funds
New York (Tax Stabilization Fund)
Up to .2% of projected expenditures transferred at request of Comptroller
Two types: a) Short-term cash
loan b) Withdrawal to
cover end-of-year shortfall
Based on type: a) Within fiscal
year b) Three equal
installments in six years
2% of projected expenditures
New York (Rainy Day Reserve Fund)
Transferred at request of Comptroller
Two types: a) Short-term cash
loan b) Withdrawal to
cover end-of-year shortfall
Based on type: a) Within fiscal
year b) Repay within
three years
3% of projected expenditures
Pennsylvania (Budget Stabilization Reserve Fund)
25% of surplus revenues
Governor determination of emergency and 2/3 vote of General Assembly
No Rule 10% deposit if fund reaches 6% of annual collections
No Rule Delaware (Budget Reserve Account)
All unencumbered funds
3/5 vote of General Assembly
5% estimated revenues

40
New York and Delaware take substantively different approaches to revenue
stabilization than New Jersey and Pennsylvania. New York has two separate
funds: the Tax Stabilization Reserve Fund and the Rainy Day Reserve Fund.
Statutorily, the Tax Stabilization Fund is capped at two percent of expected
annual expenditures and the Rainy Day Reserve is capped at three percent.
Like Pennsylvania, the Rainy Day revenues can only be transferred in the event
of an economic downturn or catastrophic event, when proposed by the
Governor and appropriated by the Assembly. Furthermore, withdrawals must
be replaced within three fiscal years. The Tax Stabilization Reserve Fund can
be used if there is a revenue shortfall at the end of the year. New York must
repay the fund in three equal installments across the next six fiscal years.
Both funds can be accessed if the Budget Division faces a cash shortage during
the year, but these loans must be repaid within the same fiscal year. This
prevents New York from having to go to the market to borrow for the purpose of
filling short-term cash flow gaps.
Delaware’s Budget Reserve Account has the most stringent withdrawal
requirements among the four states. In fact, Delaware has never withdrawn
funds from this account since its enactment in the 1970s. The state is
required to hold five percent of general fund revenues in the Account and this
money can only be accessed through a three-fifths vote by the General
Assembly. The state has not faced a day rainy enough to use these funds.

41
In fact, an analyst with the Federal Reserve Bank of Philadelphia actually
criticized Delaware for not using the fund to stabilize revenues.69
One additional mechanism that helps prevent use of the Reserve Account is
Delaware’s requirement that the Governor and General Assembly can only
allocate 98 percent of expected revenues for the fiscal year. This gives a 2
percent cushion for addressing revenue shortfalls or unexpected expenses
during the year.
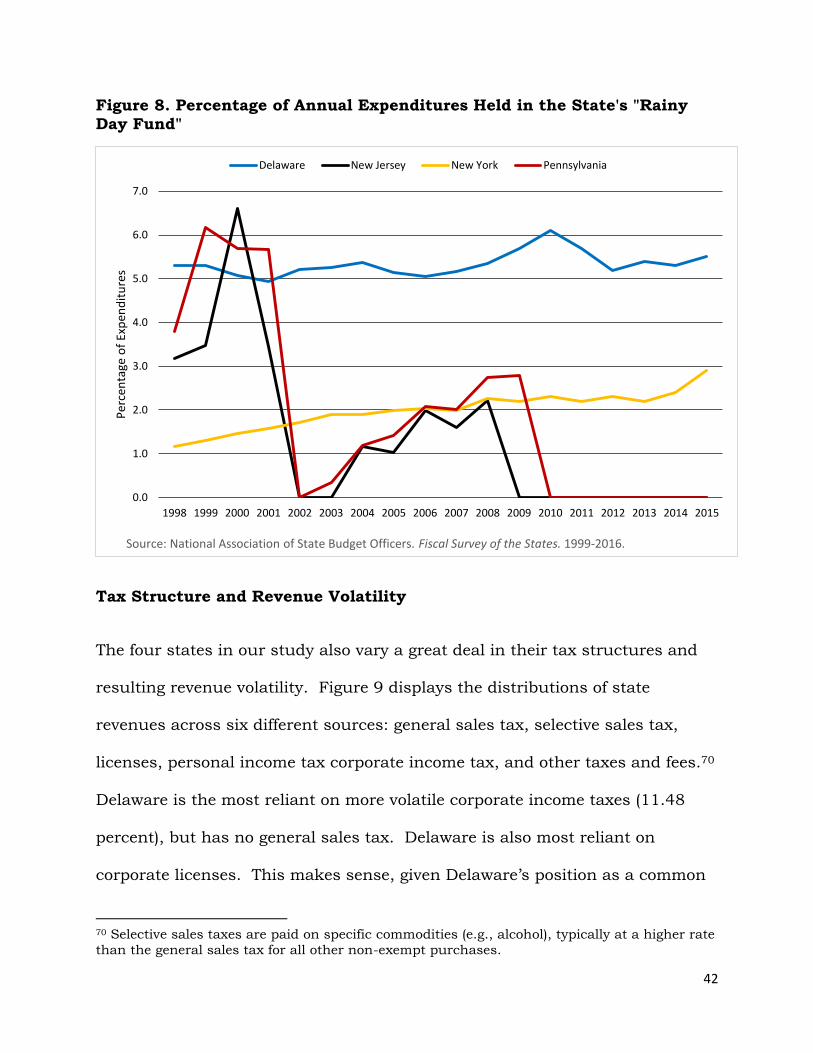
Variation in deposit, withdrawal, and repayment rules is apparent in the health
of each state’s Rainy Day Fund. Figure 8 displays the annual percentage of
expenditures held in each state’s main fund between 1998 and 2015. States
like Delaware and New York have maintained relatively steady accounts,
whereas Pennsylvania and New Jersey are deeply affected by changes in the
business cycle.
69 (Flora 2011)
42
Figure 8. Percentage of Annual Expenditures Held in the State's "Rainy Day Fund"
Tax Structure and Revenue Volatility
The four states in our study also vary a great deal in their tax structures and
resulting revenue volatility. Figure 9 displays the distributions of state
revenues across six different sources: general sales tax, selective sales tax,
licenses, personal income tax corporate income tax, and other taxes and fees.70
Delaware is the most reliant on more volatile corporate income taxes (11.48
percent), but has no general sales tax. Delaware is also most reliant on
corporate licenses. This makes sense, given Delaware’s position as a common
70 Selective sales taxes are paid on specific commodities (e.g., alcohol), typically at a higher rate
than the general sales tax for all other non-exempt purchases.
0.0
1.0
2.0
3.0
4.0
5.0
6.0
7.0
1998 1999 2000 2001 2002 2003 2004 2005 2006 2007 2008 2009 2010 2011 2012 2013 2014 2015
Per
cen
tage
of
Exp
end
itu
res
Source: National Association of State Budget Officers. Fiscal Survey of the States. 1999-2016.
Delaware New Jersey New York Pennsylvania

43
site of incorporation due to its favorable General Corporation Law.71 New
Jersey is the most reliant on more stable general sales taxes, though total sales
taxes make up a larger portion of Pennsylvania’s tax revenue.72 New York is by
far the most reliant on personal income taxes.
Figure 9. Tax Structures for Comparison States, 2015
Table 3 provides some insight into the extent to which these structural choices
result in greater or lesser revenue volatility. The volatility scores represent the
standard deviation of year-to-year changes in total tax revenue for a 20-year
period (1995-2014).73 Three of the four case states included in this analysis
71 (Black 2007) 72 Our study of tax expenditures reveals another potential influence on volatility. (Mallinson and Carr 2017) 73 (The Pew Charitable Trusts 2015)
29.0%
16.7%
27.3%
14.2%
12.1%
13.9%
23.6%
39.6%
4.9%
2.3%
6.2%
32.4%
42.0%
55.9%
31.8%
11.4%
8.2%
6.5%
7.0%
2.4%
3.9%
4.7%
4.1%
D e l a w a r e
N e w J e r s e y
N e w Y o r k
P e n n s y l v a n i a
Source: U.S. Census Bureau's 2015 Annual Survey of State Government Tax Collections (PEW 2016)
General sales Selective sales Licenses Personal Income Corporate Other
44
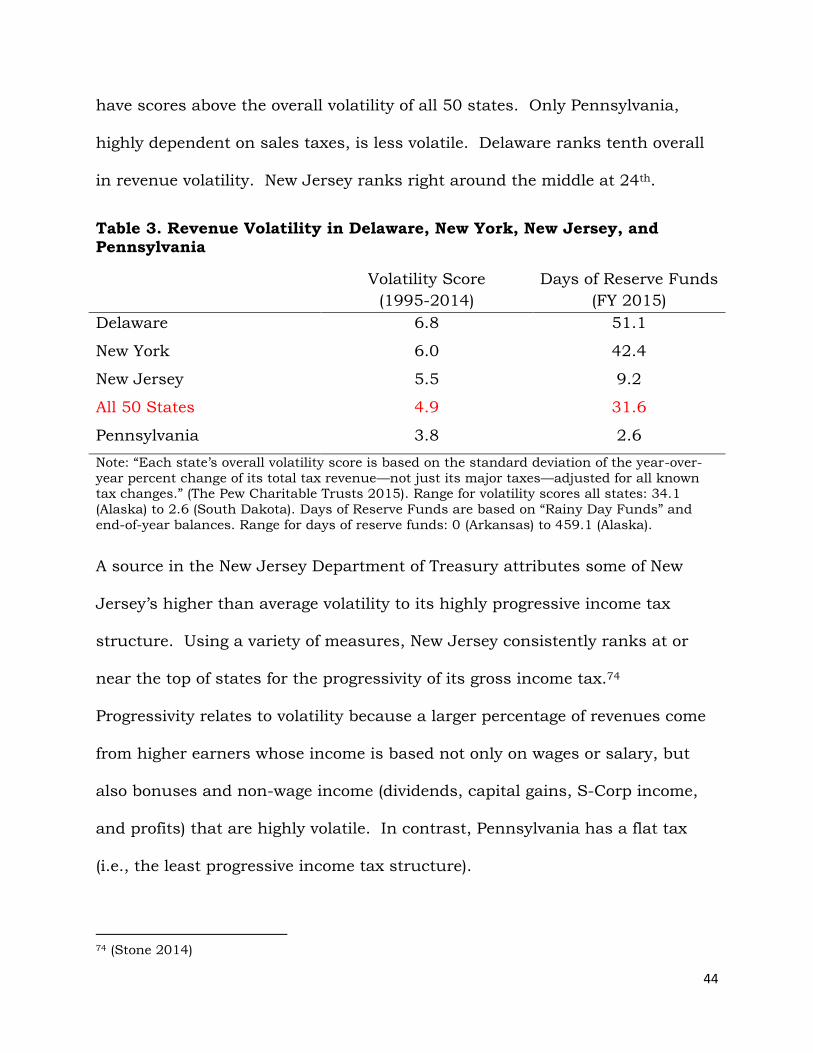
have scores above the overall volatility of all 50 states. Only Pennsylvania,
highly dependent on sales taxes, is less volatile. Delaware ranks tenth overall
in revenue volatility. New Jersey ranks right around the middle at 24th.
Table 3. Revenue Volatility in Delaware, New York, New Jersey, and Pennsylvania
Volatility Score
(1995-2014)
Days of Reserve Funds
(FY 2015)
Delaware 6.8 51.1
New York 6.0 42.4
New Jersey 5.5 9.2
All 50 States 4.9 31.6
Pennsylvania 3.8 2.6
Note: “Each state’s overall volatility score is based on the standard deviation of the year-over-
year percent change of its total tax revenue—not just its major taxes—adjusted for all known tax changes.” (The Pew Charitable Trusts 2015). Range for volatility scores all states: 34.1
(Alaska) to 2.6 (South Dakota). Days of Reserve Funds are based on “Rainy Day Funds” and
end-of-year balances. Range for days of reserve funds: 0 (Arkansas) to 459.1 (Alaska).
A source in the New Jersey Department of Treasury attributes some of New
Jersey’s higher than average volatility to its highly progressive income tax
structure. Using a variety of measures, New Jersey consistently ranks at or
near the top of states for the progressivity of its gross income tax.74
Progressivity relates to volatility because a larger percentage of revenues come
from higher earners whose income is based not only on wages or salary, but
also bonuses and non-wage income (dividends, capital gains, S-Corp income,
and profits) that are highly volatile. In contrast, Pennsylvania has a flat tax
(i.e., the least progressive income tax structure).
74 (Stone 2014)

45
We are not claiming that a progressive income tax or any particular tax structure
is inherently bad. What the above highlights are the trade-offs in policy choices
about a state’s tax structure that relate to revenue volatility. The point is that
if a state chooses to rely on more volatile sources of tax revenue, they will also
likely face greater errors in revenue forecasting and thus buffering
mechanisms, like Rainy Day Funds, become even more important. Alaska is a
useful example of this trade-off. Alaska has the greatest measured revenue
volatility of all 50 states (34.1, as measured by Pew), but the state also has the
largest stockpile of reserves (sum of Rainy Day Fund and end of year balance).
According to Pew, Alaska could operate for 459.1 days with its reserves. For
comparison, the median state could operate for 31.6 days and New Jersey
could operate for 9.2 days (see Table 3).75
75 (Rosewicz and Newman 2016)
46
APPENDIX A: EXTENDED DISCUSSION OF STATE BUDGETING PRACTICES
New York
The Budget Process
Starting nine months before the start of a new fiscal year (April 1), agencies
begin preparing their budget requests. The new fiscal “year” actually extends
for approximately 27 months, when the Comptroller’s authority to expend
funds for a fiscal year expires. The Budget Director issues a “call letter” in the
summer with an outline of the Governor’s priorities for the coming year.76 In
the fall, agencies submit their budgets to the Division of Budget (NYDOB),
which are compared to the outlines of the governor’s call letter. After requests
are received and reviewed, the Director holds hearings throughout the fall to
gather additional information. A Financial Plan is prepared for dissemination
to the Governor’s staff in December, in conjunction with an updated revenue
forecast. This plan “is prepared both on a cash basis and according to
Generally Accepted Accounting Principles (GAAP).”77 After internal
deliberations and consultation with NYDOB, the Governor submits a proposed
budget to the state legislature and gives a State of the State address in
January.
As the legislature takes on its budgeting role, it does so primarily through the
Senate Finance and Assembly Ways and Means committees. State law requires
76 (New York State Division of the Budget n.d.) 77 (New York State Division of the Budget n.d.)

47
the Assembly to establish priorities and agree on the budget via a bi-cameral
conference committee. During this process, the NYDOB provides an updated
revenue forecast in February when the Governor submits the Executive Budget
With 21-Day Amendments.
A joint legislative-executive economic and revenue forecasting conference is
held in March for the purpose of arriving at a shared view of the economic
forecast for the coming fiscal year. If the Governor and Legislature cannot
reach a consensus, the state Comptroller issues the official revenue forecast.78
This is done so that the legislature can meet its statutory requirement of
enacting a budget by April 1 (the start of the new fiscal year).
As the budget is implemented, NYDOB completes additional revenue forecasts
in June/July (first quarter update), September/October (mid-year), and again
in December/January. It is also tasked with keeping track of revenues and
expenditures, thus supplying the state with quarterly updates to the Financial
Plan. In addition to providing initial estimates for the following year, NYDOB’s
Economic Advisory Board meets to comment on the mid-year forecast. This
successive set of revenue projections and expenditure updates provides the
Governor and Assembly with time to adjust their revenue and spending
expectations throughout the year. Figure A.1 displays a Gantt chart of the
budget and revenue forecasting processes across a single fiscal year.
78 (National Association of State Budget Officers 2015)

48
Figure A.1. New York’s Executive Branch Revenue Forecasting and Budgeting Cycle
New York’s April to March budget cycle is unique among the states reviewed.
This is of special note because it appears that the seemingly strange timeline
may in fact help the state manage the dreaded “April Surprise.” New York has
eleven months to adjust spending in light of unexpectedly high or low final
collections and refunds. This is in contrast to the one to two months that most
states have before the end of their fiscal year.
49
Revenue Forecasting
Of the four states that we reviewed for this report, New York has the most
extensive publically available description of its revenue forecasting process.79
According to this manual, “DOB’s forecast methodology utilizes sophisticated
econometric models, augmented by the input of a panel of economic experts,
and a thorough review of economic, revenue and spending data to form multi-
year quarterly projections of economic, revenue, and spending changes.”80 Of
course, the manual also admits, “no matter how sophisticated the methods
used, all forecasts are subject to error.”81 Furthermore, the state describes five
major forecasting risks: data quality, model specification error, reporting fixed
points or ranges for estimates, economic shocks, and evaluation of the loss
function. We will not describe each in depth, but point out New York’s
transparency as a best practice. The state is clear not only about its
methodology, but also the limitation of projecting revenues for several years. In
fact, the manual states, “standard econometric theory tells us that the
probability of any point forecast being correct is virtually zero, but a budget
must be based on a single projection.”82 Thus, both the public and lawmakers
should have reasonable expectations regarding the state’s ability to accurately
project revenues into the future, regardless of the chosen timeframe.
79 (Labate n.d.) 80 (Labate n.d., 1) 81 (Labate n.d., 1) 82 (Labate n.d., 3)

50
In terms of process, New York begins its revenue forecast with a
macroeconomic model for the entire United States. The model provides insight
into macroeconomic trends outside of the state that will impact revenue
collections. Then, a macroeconomic forecast is produced specifically for New
York, which includes inputs from state and national data. The model weights
more heavily key sectors of the state’s economy (e.g., financial services). Tax
receipt data are also included for the purpose of forecasting economic
performance. The final tax revenue projections are thus based on past
receipts, future expected economic performance, and policy choices that shape
the state’s ability to generate revenue. The Economic Advisory Board,
composed of economists, reviews and approves the methodology of the forecast
and its results.
The manual further reinforces the fact that the state inevitably over- or under-
predicts revenues, even with more frequent forecasts. “Forecast models are
simplified versions of realty and as such are subject to error.”83 Even with
excellent macroeconomic models, it is difficult to predict shocks to the economy
(e.g., Sandy) and changes in the business cycle. Page 13 of the manual
provides the following specific elements that introduce revenue-forecasting
error:
National and State economic conditions, which are subject to shocks that
are by definition unanticipated;
One-time actions (that either spin up or delay collections and impact
cash flow);
83 (Labate n.d., 13)

51
Court decisions concerning the proper applicability of tax;
State or Federal tax policy actions that could alter taxpayer behavior;
Tax structures including tax rates and base subject to tax;
Efficiency of tax collection systems;
Enforcement efforts, audit activities and voluntary compliance;
Timing of payments (shifting collections from one fiscal year to another);
Tax Amnesty programs (1994, 1996, 2003, and 2010) covering personal income tax;
Corporate franchise tax, sales tax, estate and gift tax, and other minor taxes);
Timing of Budget enactment; and
Statutorily mandated accounting changes.
Rainy Day Fund
New York actually maintains two budget stabilization funds. The first is
referred to as the Tax Stabilization Reserve Fund.84 This Fund is capped at two
percent of the total expenditures for the year. Surplus revenues at the end of
the fiscal year are either deposited into this fund (if it has not already reached
the two percent threshold) or retained in the general fund. This is left to the
judgment of the Budget Director. Deposits are limited to 2/10ths of one
percent of total projected disbursements for the year. Any revenue shortfall at
the end of the fiscal year can be addressed through a withdrawal from this
fund and repaid in three equal installments across the next six fiscal years.
Additionally, money can be temporarily loaned throughout the fiscal year if
cash is needed. Short-term loans are repaid with cash during the fiscal year,
unless there is an overall revenue shortfall, which is addressed as stipulated
above. According to an official at NYDOB, however, the state’s refund reserve
account has been used in recent years to circumvent placing money in the Tax
84 New York State Finance Law § 92 (Consol.).

52
Stabilization Reserve Fund. The refund reserve moves cash from one fiscal
year to the next for the purpose of paying tax refunds from the previous fiscal
year.
New York also has a Rainy Day Reserve Fund that contains no more than three
percent of the “aggregate amount projected to be disbursed from the general
fund during the fiscal year immediately following the then-current fiscal
year.”85 Funds are deposited into the account “at the request of the director of
the budget,” generally at the end of the current fiscal year (March). There is no
statutory requirement to deposit surplus funds into the Rainy Day Fund.
Cash can be withdrawn from this fund in the event of either an economic
downturn or catastrophic event. The Budget Director must inform the majority
and minority party leadership in the Senate and Assembly before withdrawing
money from the fund. The state is then required to repay the fund within three
years. It is also possible for the state to borrow cash from this fund in the
event of a shortage during the fiscal year, but it must be repaid within the
current fiscal year. According to an official at the New York Division of the
Budget, the state has been hesitant to use these funds. In fact, the Rainy Day
Fund has not been used to balance the budget since its adoption in 2007. The
state has used the fund to borrow cash during the fiscal year so that it does
not have to go to the market and borrow to meet short-term cash needs.
85 New York State Finance Law § 92-CC (Consol.).

53
Tax Structure
Figure A.2 displays the annual percentage change in tax revenues for corporate
and personal income taxes and the sales tax in New York. The personal
income tax is New York’s largest revenue source and thus the most important
tax to forecast accurately, though the corporate income tax is the most volatile.
Withholding and quarterly tax payments give the state a sense of revenue
coming in on a regular basis, but NYDOB cannot know the actual tax liability
until returns are processed in the spring of each year. Extensions also delay
certainty. “Thus, a solid estimate of 2014 tax liability will not become available
until the end of 2015.” (77). Data are then reviewed and final numbers are not
available until summer 2016. This presents a lag of over one year until final
revenue figures are available.
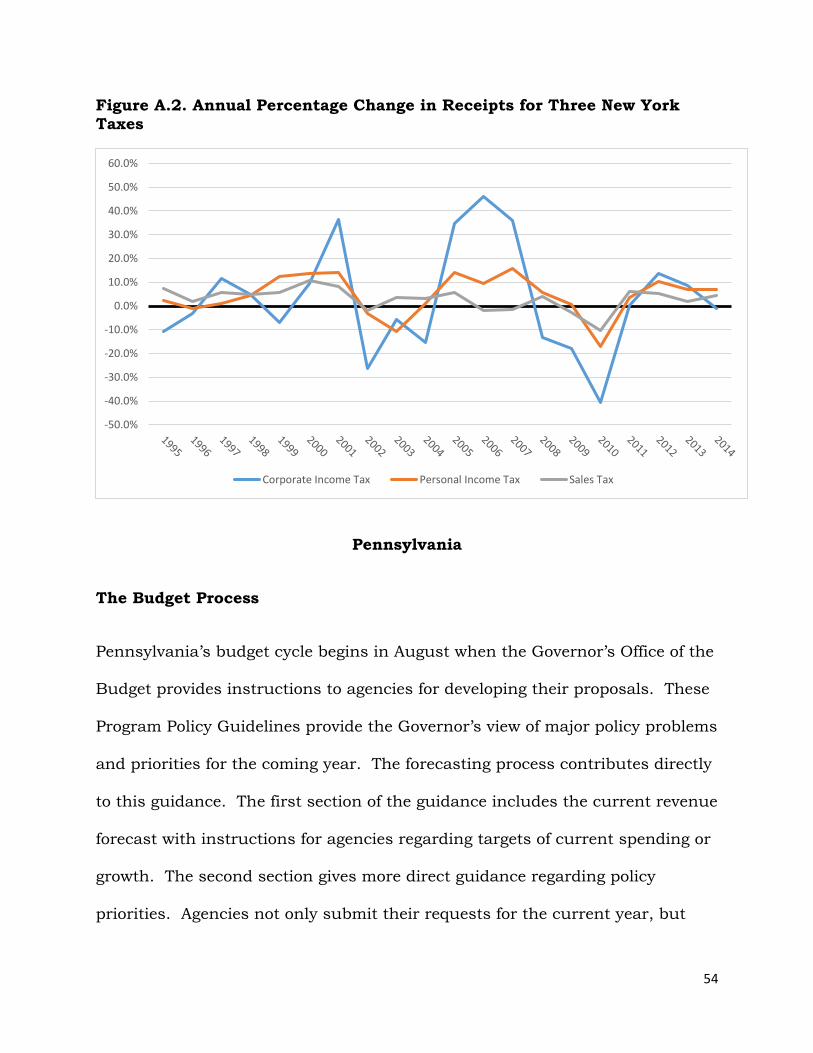
54
Figure A.2. Annual Percentage Change in Receipts for Three New York Taxes
Pennsylvania
The Budget Process
Pennsylvania’s budget cycle begins in August when the Governor’s Office of the
Budget provides instructions to agencies for developing their proposals. These
Program Policy Guidelines provide the Governor’s view of major policy problems
and priorities for the coming year. The forecasting process contributes directly
to this guidance. The first section of the guidance includes the current revenue
forecast with instructions for agencies regarding targets of current spending or
growth. The second section gives more direct guidance regarding policy
priorities. Agencies not only submit their requests for the current year, but
-50.0%
-40.0%
-30.0%
-20.0%
-10.0%
0.0%
10.0%
20.0%
30.0%
40.0%
50.0%
60.0%
Corporate Income Tax Personal Income Tax Sales Tax

55
also estimate the cost to maintain that request for four subsequent years.
These future projections are based on “current law, regulation, policy and
program decisions,” not projections of future policy changes.86 Agencies
submit their requests to the Office of the Budget in October.87 In December,
the Governor meets with leadership in the General Assembly to inform them of
anticipated revenue and spending. The Governor is then constitutionally
required to submit the Executive Budget and a drafted General Appropriations
Bill in February.
As the General Assembly becomes involved in the budget process, it relies on
the Appropriations Committees in both chambers to hold hearings on agency
requests. The Assembly’s General Appropriations Bill is enacted either by
simple majorities in both chambers, or by a conference committee whose report
is concurred upon by simple majorities of both chambers. The Governor has
the power to line item or completely veto appropriations bills in order to bring
the budget into balance. The new fiscal year begins on July 1, which means a
budget must be passed and signed by June 30. Much like the other states,
audit review begins after the close of the fiscal year and can take months as
final revenues come in. Figure A.3 displays a Gantt chart of Pennsylvania’s
budget and revenue forecasting processes.
86 (Pennsylvania Office of the Budget 2015) 87 Statutorily required to submit by November 1.
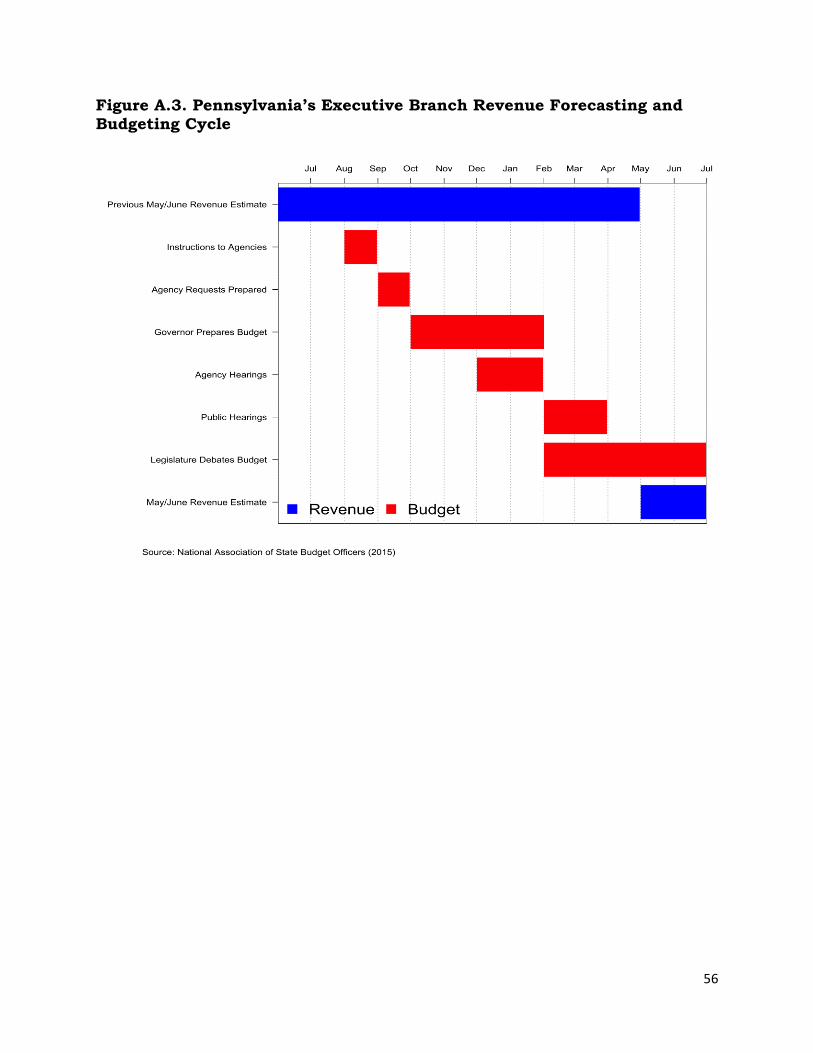
56
Figure A.3. Pennsylvania’s Executive Branch Revenue Forecasting and Budgeting Cycle

57
Revenue Forecasting
The Commonwealth utilizes a variety of statistical models to forecast revenue.
Unlike New York, which produces macroeconomic models in-house,
Pennsylvania purchases macroeconomic data and forecasts from commercial
firms. The Governor’s Executive Budget includes estimates for six years:
current fiscal, next fiscal, and four years after. The budget proposal revenue
estimate is actually for an 18-month period looking forward. The Governor “is
required to sign an official revenue estimate detailing the amount of revenues
expected to be received during the fiscal year for the General Fund and Motor
License Fund” when signing the annual appropriations act.88 This number can
only be changed if the General Assembly changes law concerning revenue
collection.
The Senate and House Appropriations Committees review monthly revenue
collection reports, in which actual and estimated collections are compared.
“Although actual monthly collections often vary from estimated collections, over
the year such monthly variations tend to cancel each other. Under any
circumstance, other than revision of the tax statutes, the official estimate
remains unchanged.”89 In fact, the budget proposal for the next fiscal year
contains a mid-year budget re-estimate, but this also does not change the
current fiscal year’s official estimate. It simply helps the governor plan for the
next budget, as deficits or surpluses are carried over to the next year.
88 (Pennsylvania Office of the Budget 2015, 17) 89 (Pennsylvania Office of the Budget 2015, 17)

58
Rainy Day Fund
Similar to New Jersey, Pennsylvania’s Budget Stabilization Reserve Fund is
only fed when there is an end-of-year surplus in revenues. Specifically, 25
percent of any year-end surplus is deposited into this fund.90 There is also a
provision stating that when the fund reaches six percent of a current year’s
revenue collections, the required end-of-year surplus deposit is only 10
percent. Also similar to New Jersey, Pennsylvania exhausted these funds
during the Great Recession and has not fully replenished them since. Like New
York, the funds are to be withdrawn the event of an emergency or an economic
downturn. After the Governor determines one of these two conditions is
present, the General Assembly must consent to using the funds with a two-
thirds vote. There is no automatic repayment provision for withdrawn funds.
Tax Structure
As noted in the main report, Pennsylvania ranks quite low on overall revenue
volatility, but this is likely due to its reliance on general and selective sales
taxes that are typically more stable sources of revenue. Figure A.4 displays the
volatility of individual revenue sources and it is evident that the
Commonwealth experiences substantial volatility in its corporate and personal
income taxes and motor fuels tax.
90 Pa. Stat. tit. 72, § 1701-A, et seq.

59
Figure A.4. Annual Percentage Change in Revenues for Pennsylvania Taxes
Delaware
The Budget Process
Delaware’s Office of Management and Budget (DEOMB) also starts the
budgeting process in the fall of the preceding fiscal year. Budget guidelines
and targets are provided to executive branch agencies in August/September.
Agencies submit their requests in October and DEOMB holds hearings in
-30.0%
-20.0%
-10.0%
0.0%
10.0%
20.0%
30.0%
Corporate Income Tax Personal Income TaxSales Tax Motor Fuels

60
November to gather additional information. DEOMB meets with the Governor
and the Delaware Economic and Financial Advisory Council (DEFAC), which is
responsible for revenue estimates, in December to discuss the proposed
budget. In January, the DEOMB Director consults with agency heads and can
make any revisions desired, except to the budget requests provided by the
legislature and judiciary. A revenue estimate is included in the proposed
budget. The Governor reviews the proposed budget, makes adjustments, and
formally submits it to the General Assembly on or before February 1.
As the Assembly takes over the process, the Joint Finance (JFC) and Bond Bill
Committees hold hearings to gather additional information. The JFC has
responsibility for marking up the Governor’s budget and proposing a final
budget for the Assembly’s consideration. The legislature then has until June
30 to pass the Appropriations Act, however the Governor can submit
amendments or supplements prior to the Act’s passage. Once the Act is passed
and signed, supplemental appropriations can be adopted if there is enough
additional revenue. Figure A.5 below provides a summary Gantt chart of both
the budgeting and revenue forecasting processes.

61
Figure A.5. Delaware’s Executive Branch Revenue Forecasting and Budgeting Cycle
Revenue Forecasting
As noted above, DEFAC, which is under the Department of Finance, is
responsible for producing official state revenue and expenditure forecasts.
According to Title 29, §6534 of the Delaware Code:
“The Governor shall submit to all members of the General Assembly and
the Controller General an estimate of anticipated General Fund revenues by major categories for the current and next immediate fiscal year. Such report shall be made no later than the 25th day of September, December,
March, April, and May, and the 20th day of June.”

62
Thus, the council meets six times per year in order to provide updates on
collections, state and national economic outlook, and revenue projections.
During those meetings, committee members discuss the assumptions of
forecasts provided by the revenue and expenditures subcommittees and
formally adopt estimates that are published in the meeting’s minutes.91
Members of the board are appointed by the Governor and include
representatives of the public and private sectors. According to the Delaware
Department of Finance, “because both the Governor and General Assembly
accept DEFAC’s revenue projections as "the estimate," others recognize the
DEFAC process as a model for eliminating politics from revenue and expenditure
estimates.”92
Rainy Day Fund
Delaware’s Rainy Day Fund is called the Budget Reserve Account.93 The
Account has a legal cap of five percent of estimated general fund revenues.
According to the Philadelphia Reserve Bank of Philadelphia, Delaware is unique
among its immediate neighbors (New Jersey and Pennsylvania), in that it has
not emptied its Reserve Account since its adoption.94 Meaning, the state has
maintained the required five percent of revenues in each year. There are
relatively stringent requirements for withdrawing funds from the Account.
Withdrawal of funds requires a three-fifths vote by the General Assembly. The
Federal Reserve Bank claims that “the broad requirement for withdrawal 91 (Delaware Economic & Financial Advisory Council 2016) 92 (Delaware Department of Finance 2015, 62), emphasis ours 93 Delaware Constitution Article VIII, § 6(d) 94 (Flora 2011)
63
provides flexibility, and the requirement of a super majority will tend to reduce
the likelihood of abuse.”95 There are trade-offs in this stringency, however.
Delaware has maintained a triple A bond rating partly due to the availability of
emergency funds, but the state has also never accessed this fund for budget
stabilization.96
Delaware has an additional interesting requirement that provides flexibility for
the Governor and legislature in dealing with revenue shortfalls. According to
Title 29 §6533(b-c) of the Delaware Code:
“No appropriation, supplemental appropriation or budget act shall cause the
aggregate General Fund appropriations enacted for any given fiscal year to exceed 98 percent (98%) of the estimated [General Fund] revenue for such fiscal year from all sources, including estimated unencumbered funds
remaining at the end of the previous fiscal year. Any portion of the amount between 98% and 100% of the estimated GF revenue for any fiscal year may be appropriated in any given fiscal year in the event of emergencies
involving the health, safety or welfare of the citizens of the State, those appropriations to be approved by three-fifths of the members elected to each
House of the General Assembly.”
Thus, Delaware is statutorily mandated to set aside two percent of its annual
budget as a stopgap for revenue shortfalls or other emergencies during the
fiscal year. These funds are first used to make necessary deposits into the
Budget Reserve Account to meet the five percent maximum.
95 (Flora 2011, 3) 96 (Flora 2011)

64
Tax Structure
Delaware is different than the other three states in our sample, in that it relies
heavily on highly volatile corporate income taxes and licensing fees. The state
has no general sales tax, but does have some selective sales tax. Delaware also
relies on its lottery and abandoned property taxes for revenue. Figure A.6
shows the annual percentage change in revenues across four major sources.
What is striking about this figure is actually the scale of the y-axis. Compared
to New Jersey, New York, and Pennsylvania, Delaware’s fluctuations in the
corporate income tax have been an order of magnitude or two larger,
particularly during the Great Recession.
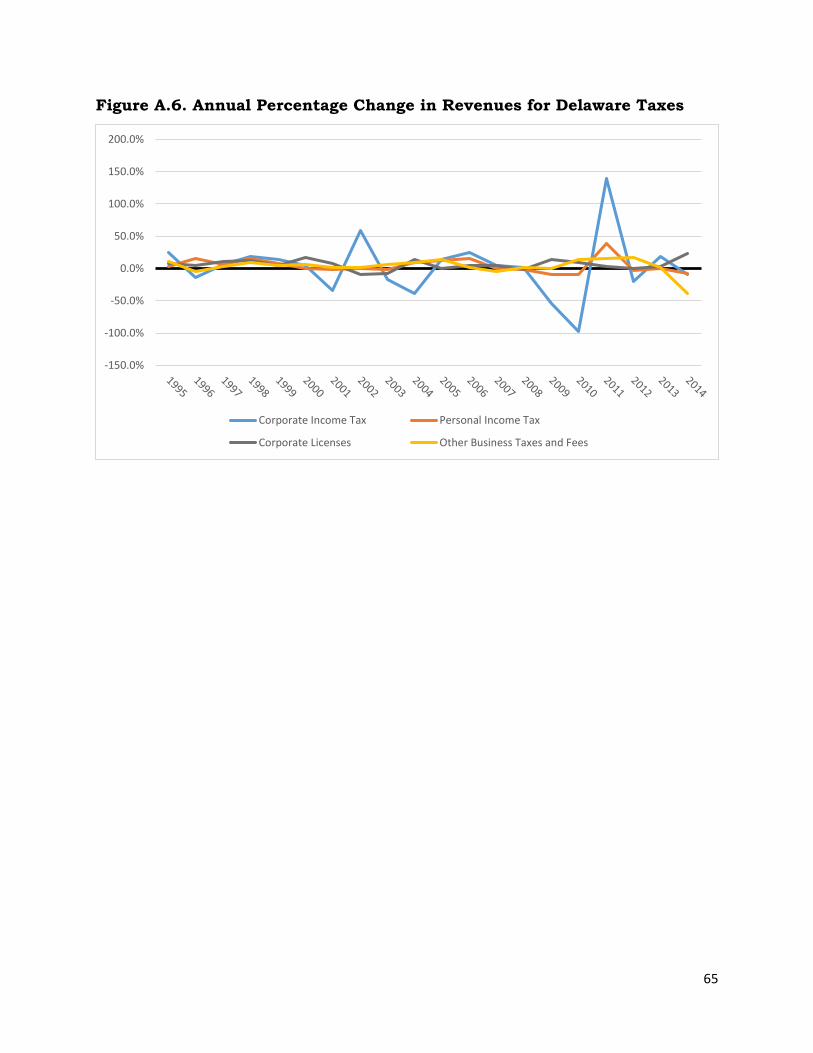
65
Figure A.6. Annual Percentage Change in Revenues for Delaware Taxes
-150.0%
-100.0%
-50.0%
0.0%
50.0%
100.0%
150.0%
200.0%
Corporate Income Tax Personal Income Tax
Corporate Licenses Other Business Taxes and Fees

66
REFERENCES
Assembly Democrats. 2015. "Legislation Would Promote Increased Transparency,
Collaboration in Fiscal Planning." Assembly Democrats. March 25.
http://www.assemblydems.com/Article.asp?ArticleID=9413.
Barrilleaux, Charles, and Michael Berkman. 2003. "Do Governors Matter? Budgeting
Rules and the Politics of State Policymaking." Political Research Quarterly 56 (4):
409-417.
Berstein, Peter L. 1998. Against the Gods: The Remarkable Story of Risk. New York,
New York: John Wiley and Sons, Inc.,.
Black, Lewis S. Jr. 2007. Why Corporations Choose Delaware. Dover, DE: Delaware
Department of State, Division of Corporations. Accessed November 22, 2016.
https://corp.delaware.gov/whycorporations_web.pdf.
Boyd, Donald J., and Lucy Dardan. 2014. "State Tax Revenue Forecasting Accuracy:
Technical Report." The Nelson A. Rockefeller Institute of Government. July 27.
Accessed September 12, 2016.
http://www.rockinst.org/pdf/government_finance/state_revenue_report/2014-
09-30-Revenue_Forecasting_Accuracy.pdf.
Delaware Department of Finance. 2015. "Delaware Fiscal Notebook." November 9.
Accessed November 10, 2016.
http://finance.delaware.gov/publications/fiscal_notebook_15/fiscal_notebook_
15.pdf.
Delaware Economic & Financial Advisory Council. 2016. Minutes. June 20. Accessed
November 10, 2016.
http://finance.delaware.gov/publications/defac/minutes/min_0616.pdf.
Dickens, Charles. 1850 [1966]. David Copperfield. Edited by Trevor Blount. Middlesex,
England: Penguin Books.
Emery, F.E., and E. L. Trist. 1965. "The Causal Texture of Organizational
Environments." Human Relations 18 (No. 1): 21-32.
Flora, Paul R. 2011. Use of Rainy Day Funds in Third District States. Special Report,
Philadelphia, PA: Federal Reserve Bank of Philadelphia.
Glasgall, William. 2016. "New Jersey: Pensions, Promises, and Fiscal Options."
Conference Presentation, Government Finance Officers Association of New
Jersey, Atlantic City.
Glyn, Noah and Malm, Liz. 2013. "New Jersey Revenue Projections: A Battle of Wills."
Tax Foundation. June 14. Accessed October 7, 2016.
http://taxfoundation.org/blog/new-jersey-revenue-projections-battle-wills.
Haggerty, Todd, and Jonathan Griffin. n.d. Rainy Day Funds. NCSL Fiscal Brief,
National Council of State Legislatures.

67
Kozlik, Tom. 2016. PNC Bank. February 2. https://www.pnc.com/content/dam/pnc-
com/pdf/corporateandinstitutional/MunicipalBond/US-State-Fiscal-Health-
Some-Not-Ready-for-Pressures%202-2-16%20PNC.pdf.
Krause, George A., and Benjamin F. Melusky. 2012. "Concentrated Powers: Unilateral
Executive Authority and Fiscal Policymaking in the American States." The
Journal of Politics 74 (No. 1): 98-112.
Krause, George A., and James W. Douglas. 2013. "Organizational Structure and the
Optimal Design of Policymaking Panels: Evidence from Consensus Group
Commissions' Revenue Forecasts in the American States." American Journal of
Political Science 27 (No. 1): 135-149.
Krause, George A., David E. Lewis, and James W. Douglas. 2013. "Politics Can Limit
Policy Opportunism in Fiscal Institutions: Evidence from Official General
Revenue Forecasts in American States." Journal of Policy Analysis and
Management 32 (No. 2): 271-295.
Labate, Mary Beth. n.d. "New York State Division of the Budget." Economic, Revenue,
and Spending Methodologies. Accessed November 10, 2016.
https://www.budget.ny.gov/pubs/supporting/MethodologyBook.pdf.
Light, Larry. 2016. "The Real Reason People Don't Save for Retirement." Forbes,
February 24. Accessed November 16, 2016.
www.forbes.com/sites/.../2016/02/.../the-real-reason-people-dont-save-for-
retirement/.
Mallinson, Daniel J., and David L. Carr. 2017. Tax Expenditures in New Jersey. Policy
Brief, Galloway, NJ: William J. Hughes Center for Public Policy.
McNichol, Elizabeth C. 2014. "Improving State Revenue Forecasting: Best Practices for
a More Trusted and Reliable Revenue Estimate." Center on Budget and Policy
Priorities. September 4. Accessed September 22, 2016.
http://www.cbpp.org/research/state-budget-and-tax/improving-state-revenue-
forecasting-best-practices-for-a-more-trusted.
McNichol, Elizabeth. 2014. "When and How States Should Strengthen their Rainy Day
Funds." www.cpbb.org. April 17. Accessed November 7, 2016.
http://www.cbpp.org/research/state-budget-and-tax/when-and-how-states-
should-strengthen-their-rainy-day-funds.
Mikesell, John L, and Justin M. Ross. 2014. "State Revenue Forecasts and Political
Acceptance: The Value of Consensus Forecasting in the Budget Process." Public
Administration Review 74 (2): 188-203.
National Association of State Budget Officers. 2015. Budget Processes in the States:
Spring 2015. Washington, DC: National Association of State Budget Officers.
National Council of State Legislatures. 2010. "NCSL Fiscal Brief: State Balanced
Budget Provisions." October. Accessed October 3, 2016.

68
http://www.ncsl.org/documents/fiscal/StateBalancedBudgetProvisions2010.p
df.
New Jersey Department of the Treasury. 1996-2007. State Financial Policies. Accessed
November 10, 2016.
http://www.state.nj.us/treasury/omb/ReadersGuide/statefinpol.shtml.
—. 1996-2007. The State Budget Process. Accessed November 10, 2016.
New York State Division of the Budget. n.d. Division of the Budget Review
(September/October - December. Accessed November 10, 2016.
https://www.budget.ny.gov/citizen/process/process_dobReview.html.
—. n.d. "Economic, Revenue, and Spending Methodologies." Accessed October 3, 2016.
https://www.budget.ny.gov/pubs/supporting/MethodologyBook.pdf.
—. n.d. The Budget Process. Accessed November 10, 2016.
https://www.budget.ny.gov/citizen/process/process.html.
NJ State Law Library. 1990. "Legislative History." Accessed December 14, 2016.
https://repo.njstatelib.org/bitstream/handle/10929.1/10190/L1990c44.pdf.
Pennsylvania Office of the Budget. 2015. "Pennsylvania Office of the Budget." The
Budget Process in Pennsylvania. September. Accessed November 10, 2016.
http://www.budget.pa.gov/PublicationsAndReports/Documents/OtherPublicat
ions/budget-process-in-pa.pdf.
Reitmeyer, John. 2016. "Christie Misses Tax-Revenue Estimate, Blows $600M Hole in
Current Budget." NJSPOTLIGHT. May 19. Accessed October 11, 2016.
http://www.njspotlight.com/stories/16/05/18/christie-misses-tax-revenue-
estimate-blows-600m-hole-in-current-budget/.
—. 2015. "Taking the Guesswork--and the Politics--Out of Forecasting NJ's Tax
Revenue." NJSPOTLIGHT. March 24. Accessed October 7, 2016.
http://www.njspotlight.com/stories/15/03/23/taking-the-guesswork-and-
politics-out-of-forecasting-nj-s-annual-tax-revenue/.
Rose, Shanna and Smith, Daniel L. 2011. "Budget Slack, Institutions, and
Transparency." Public Administration Review 72 (No. 2): 187-195.
Rosewicz, Barb, and Daniel Newman. 2016. "7 Years After Recession, States Are Still
Rebuilding Reserves." The Pew Charitable Trusts. September 27. Accessed
November 23, 2016. http://www.pewtrusts.org/en/research-and-
analysis/analysis/2016/09/27/7-years-after-recession-states-are-still-
rebuilding-reserves.
Seidman, Andrew. 2014. "N.J. budget bombshell: Revenue shortfall $800M."
philly.com. April 30. Accessed October 3, 2016.
http://articles.philly.com/2014-04-30/news/49497094_1_shortfall-tax-hikes-
treasurer-andrew-sidamon-eristoff.

69
Stone, Lyman. 2014. "Which States Have the Most Progressive Income Taxes?" The Tax
Foundation. September 24. Accessed November 23, 2016.
http://taxfoundation.org/blog/which-states-have-most-progressive-income-
taxes-0.
The Nelson A. Rockefeller Institute of Government and The PEW Center on the States.
2011. "States' Revenue Estimating: Cracks in the Crystal Ball." The Nelson A.
Rockefeller Institute of Government. March. Accessed November 12, 2015.
http://www.rockinst.org/pdf/government_finance/2011-03-01-
States_Revenue_Estimating_Report.pdf.
The Nelson A. Rockefeller Institute of Government and The PEW Charitable Trusts.
2015. "Managing Volatile Tax Collections in State Revenue Forecasts." The PEW
Charitable Trusts. March. Accessed August 8, 2016.
http://www.pewtrusts.org/en/research-and-
analysis/reports/2015/03/managing-volatile-tax-collections-in-state-revenue-
forecasts.
The Pew Charitable Trusts. 2014. "Building State Rainy Day Funds: Policies to
Harness Revenue Volatility, Stabilize Budgets, and Strengthen Reserves."
www.pewtrusts.org. July. Accessed November 4, 2016.
http://www.pewtrusts.org/~/media/assets/2014/07/sfh_rainy-day-fund-
deposit-rules-report_artready_v9.pdf.
—. 2015. "Fiscal 50: Tax Revenue Volitility." June 11. Accessed November 22, 2016.
http://www.pewtrusts.org/~/media/data-
visualizations/interactives/2016/fiscal-
50/docs/2013/RevenueVolatilityData.xlsx.
The Volcker Alliance. 2015. "Truth and Integrity in State Budgeting: Lessons from
Three States." New York. Accessed October 31, 2016.
https://www.volckeralliance.org/publications/truth-and-integrity-state-
budgeting.
U.S. Census Bureau. 2015. State Government Tax Collections. Accessed November 22,
2016. http://www.census.gov/govs/statetax/.
Voorhees, William R. 2004. "More is Better: Consensual Forecasting and State
Revenue Forecast Error." International Journal of Public Administration 27 (8-9):
651-671.