station capacity planning guidance - network rail · 2019-03-19 · november 2016 network rail...
TRANSCRIPT
STATION CAPACITY PLANNING GUIDANCE Network Rail November 2016
CONTENTS
1 THE OVERVIEW ............................................................................................................................................ 5
2 UNDERTAKING CAPACITY ASSESSMENTS ............................................................................................... 7
2.1 Identifying the need for an assessment .............................................................................................................................................................................. 7 2.2 Remits ................................................................................................................................................................................................................................. 7 2.3 Proposals ............................................................................................................................................................................................................................ 8 2.4 Demand forecasts ............................................................................................................................................................................................................... 8 2.5 Data requirement and collection ......................................................................................................................................................................................... 9
3 SPACE REQUIREMENTS FOR NORMAL OPERATION ............................................................................. 10
3.1 Passenger demand concepts ........................................................................................................................................................................................... 10 3.2 Revenue protection ........................................................................................................................................................................................................... 12 3.3 Platforms ........................................................................................................................................................................................................................... 16 3.4 Canopies ........................................................................................................................................................................................................................... 20 3.5 Concourses ....................................................................................................................................................................................................................... 22 3.6 Access and interchange .................................................................................................................................................................................................... 25
4 PLANNING FOR ABNORMAL CONDITIONS ............................................................................................... 34
4.1 Perturbation ....................................................................................................................................................................................................................... 34 4.2 Construction ...................................................................................................................................................................................................................... 36 4.3 Special events ................................................................................................................................................................................................................... 36 4.4 Emergency evacuation...................................................................................................................................................................................................... 36
5 STATION PERFORMANCE CATEGORISATION ......................................................................................... 39
5.1 Station performance categorisation .................................................................................................................................................................................. 39
November 2016 Network Rail Station Capacity Planning Guidance
3
Foreword
With significant investment planned for stations across the network, it is important that the industry adopts a consistent approach to the planning and design of our stations.
In the past decade, the number of rail
passengers has grown by 50 percent and
stations like London Waterloo and London
Victoria now handle more people per day
than the UK’s busiest airports. However, until
recent years, there has not been any new
major infrastructure and many of our stations
are busier than ever.
Since Victorian times, our railway hasn’t just
moved passengers and freight; it has
generated, and spread, prosperity. That is
why we are continuously investing in our
network with several high profile schemes
such as Thameslink, Crossrail, Edinburgh
Glasgow Improvement Programme and
Northern Hub. Station upgrades and new
facilities will play a key role in delivering
these schemes and helping to increase
capacity, safety and passenger comfort. The
importance of stations in delivering a better
railway is clearer than ever.
Modern stations are the shop windows of our
railway. In addition to providing access to
train services our stations are used as
meeting places and provide opportunities for
retail and leisure. Passengers expect, and
deserve, a positive experience at stations as
part of their overall journey on the railway.
Ease of access, readily available travel
information and ambient station space will
improve passenger satisfaction and the
attractiveness of rail as a mode.
With significant investment plans for stations
across the nation, it is important that the
industry adopts a consistent approach for
planning and design of station environments.
This document provides a series of best
practice guidelines for the design and
planning of railway stations to guarantee that
we continue to deliver value for money and
excellent passenger experience across the
network.
Isabelle Milford
Station Capacity Manager
November 2016 Network Rail Station Capacity Planning Guidance
4
Executive Summary
This document provides guidance for undertaking capacity assessments for stations across the network. It stipulates the thresholds for planning and design of passenger areas with a consideration for ‘value for money’.
The guidance shall be used by all parties
involved in the station design process
including, but not exclusive to, Network Rail
staff, architects, train operating companies
(TOC) and engineering and planning
consultants.
The application of this guidance ensures
station design supports the Industry and
Network Rail’s objectives, namely:
Develop and maintain consistently high
performing stations that support safe
movement of passengers and customer
satisfaction
Deliver station improvements and
designs that are fit for purpose, cost
effective and sustainable.
This guidance provides the information
required by architects and designers to
produce an outline station design focussing
on public areas. It includes all calculations
required to assess whether a station meets
Network Rail’s aspirations regarding
passenger comfort and safety in the station
environments, during normal operations and
emergency/perturbation situations.
It also provides a good practice guide for
undertaking capacity assessments. This
information is relevant for those responsible
for station capacity assessment studies and
contains the Network Rail requirements with
regards to analysis and deliverables.
This document supersedes the previous
version published in May 2011. The guidance
will be periodically updated to reflect ongoing
research, consultation and changes in
legislation and shall be read in conjunction
with;
Station Design Principles for Network Rail
Guide, March 2015
Spaces and Places for Everyone, Network
Rail Inclusive Design Strategy, 2015
Design Standards for Accessible Railway
Stations, Department for Transport and
Transport Scotland, March 2015
Other Rail Industry Standards and
Building codes referred to in Appendix F
Queries or comments regarding this
document are welcomed and should be sent
to: [email protected].
November 2016 Network Rail Station Capacity Planning Guidance
5
1 The Overview
Introduction to the basic principles of spatial planning for public areas and Network Rail’s planning criteria.
This guidance applies to the spatial aspects
of station planning for public areas during
normal operations and abnormal conditions.
Requirements for staff accommodation and
areas that are only used by tenants are not
covered in this guidance.
It is important to understand that the capacity
requirements included here shall be treated
as a minimum. Depending on the project
aspirations it may be desirable to deliberately
design public areas in excess of the spatial
requirements outlined here.
The following chapters provide methods for
sizing public areas that have sufficient space
to allow unimpeded circulation of
passengers, and also for reasonable comfort
in waiting areas.
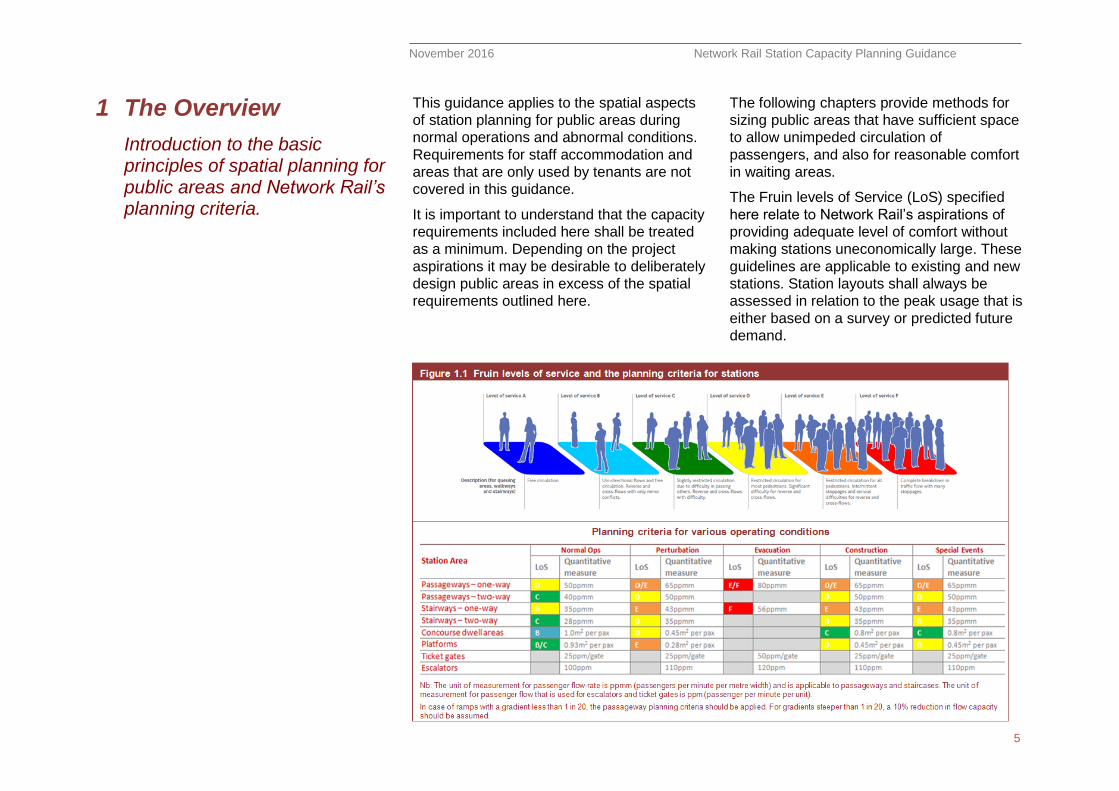
The Fruin levels of Service (LoS) specified
here relate to Network Rail’s aspirations of
providing adequate level of comfort without
making stations uneconomically large. These
guidelines are applicable to existing and new
stations. Station layouts shall always be
assessed in relation to the peak usage that is
either based on a survey or predicted future
demand.
November 2016 Network Rail Station Capacity Planning Guidance
6
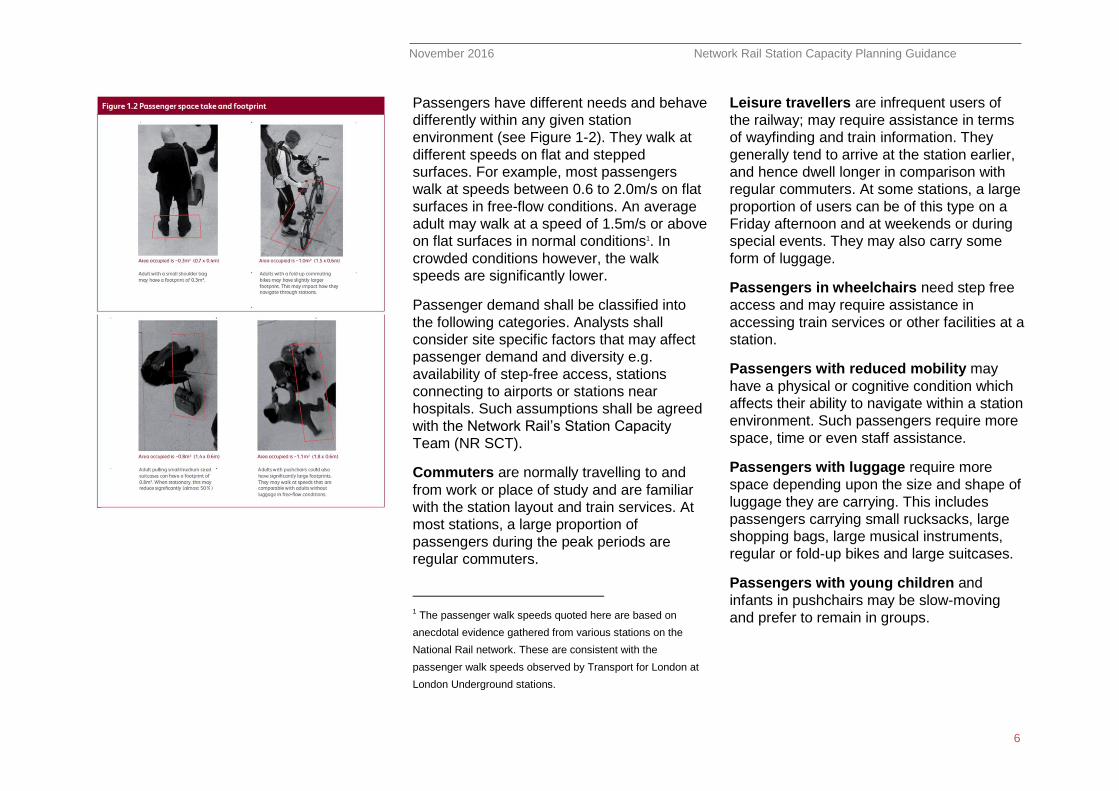
Passengers have different needs and behave
differently within any given station
environment (see Figure 1-2). They walk at
different speeds on flat and stepped
surfaces. For example, most passengers
walk at speeds between 0.6 to 2.0m/s on flat
surfaces in free-flow conditions. An average
adult may walk at a speed of 1.5m/s or above
on flat surfaces in normal conditions1. In
crowded conditions however, the walk
speeds are significantly lower.
Passenger demand shall be classified into
the following categories. Analysts shall
consider site specific factors that may affect
passenger demand and diversity e.g.
availability of step-free access, stations
connecting to airports or stations near
hospitals. Such assumptions shall be agreed
with the Network Rail’s Station Capacity
Team (NR SCT).
Commuters are normally travelling to and
from work or place of study and are familiar
with the station layout and train services. At
most stations, a large proportion of
passengers during the peak periods are
regular commuters.
1 The passenger walk speeds quoted here are based on
anecdotal evidence gathered from various stations on the
National Rail network. These are consistent with the
passenger walk speeds observed by Transport for London at
London Underground stations.
Leisure travellers are infrequent users of
the railway; may require assistance in terms
of wayfinding and train information. They
generally tend to arrive at the station earlier,
and hence dwell longer in comparison with
regular commuters. At some stations, a large
proportion of users can be of this type on a
Friday afternoon and at weekends or during
special events. They may also carry some
form of luggage.
Passengers in wheelchairs need step free
access and may require assistance in
accessing train services or other facilities at a
station.
Passengers with reduced mobility may
have a physical or cognitive condition which
affects their ability to navigate within a station
environment. Such passengers require more
space, time or even staff assistance.
Passengers with luggage require more
space depending upon the size and shape of
luggage they are carrying. This includes
passengers carrying small rucksacks, large
shopping bags, large musical instruments,
regular or fold-up bikes and large suitcases.
Passengers with young children and
infants in pushchairs may be slow-moving
and prefer to remain in groups.
November 2016 Network Rail Station Capacity Planning Guidance
7
2 Undertaking Capacity Assessments
Guidance for analysts and other parties involved in scoping and producing capacity assessments studies.
2.1 Identifying the need for an assessment
Station capacity assessments shall be
undertaken for the design and planning of all
new railway stations and for schemes that
affect the usage and flow of passengers in
station environments. For any scheme,
consideration shall be given to the station
layout, volume of passengers and complexity
of movement, GRIP (Governance for Railway
Investment Projects) stage and the level of
intervention. Particular consideration shall be
given to station category2, strategic
importance along the Route or within the
local area.
The objectives of an assessment may
typically include:
Benchmark existing station performance
Optimise station layouts
Option selection and design development
Evidence for a business case
Test crowd management, construction impact and evacuation plans
2 Better Rail Stations, November 2009.
Evaluate the impact on passengers due to changes in timetables, introduction of new services or rolling stock
NR SCT shall be consulted at the earliest
opportunity in order to identify the need of an
assessment and to help define a remit.
2.2 Remits
A remit shall clearly set out the following with
respect to the assessment that is required:
Context, the strategic fit and the problem
statement
Objectives of the study3, scope,
interdependencies
Indicates any gaps in availability of
passenger and train information
Operational and other assumptions
Programme milestones and deadlines.
Remits shall be developed by the Client,
Sponsor or Manager in conjunction with, or
reviewed by, the NR SCT. Following on from
this, a proposal will be provided by the NR
SCT or an external consultant.
3 Clearly set out what is expected from the assessment i.e.
what are the questions that need answering.
November 2016 Network Rail Station Capacity Planning Guidance
8
2.3 Proposals
The NR SCT or an external consultant shall
respond to the remit with a project proposal.
This proposal shall be sent to the Client,
Sponsor or Manager and reviewed by the NR
SCT.
It is important that respondents understand
the objectives and various stages of an
assessment to develop a comprehensive
proposal.
Each proposal shall demonstrate:
Good understanding of the remit, the
context, ability to identify key areas that
need to be analysed and any
constraints.
Strong capability in the discipline and
selection of an appropriate method for
analysis based on site complexity.
Detailed cost and resource breakdown
demonstrating value for money.
Project plan showing alignment with
wider NR delivery programme.
Allowance for review and feedback from
NR SCT throughout the project.
The Client, Sponsor or Manager will approve
and initiate an assessment project once the
NR SCT has completed a technical and
capability review of the proposals.
2.4 Demand forecasts
A vast majority of station users are rail
passengers, but some stations also offer a
variety of retail, attracting a significant
number of visitors who are not rail users.
Some stations may also provide access to
other transport modes, such as trams or
metro services. A station may also generate
footfall by offering a short-cut between two
external locations and hence it may be
necessary to include such non-rail
background demand; e.g. the new concourse
at Birmingham New Street station connect
two sides of the city centre.
Capacity assessments shall at least consider
an interim and future year scenario. Any
profiling of passenger demand across the
peak in relation to train loadings shall be
agreed with NR SCT.
Network Rail Economic Planners can provide
demand forecasts based on Route Studies
and other forecasting tools used in the
industry. Forecasts developed by a
consultant or another organisation will need
agreement with the Network Rail Economic
Planners at the start of any assessment
project.
November 2016 Network Rail Station Capacity Planning Guidance
9
2.5 Data requirement and collection
Wherever possible, surveys shall be
commissioned to establish a good
understanding of passenger numbers in and
around stations and any station specific
characteristics in relation to train services,
interchange and operational controls. Data
requirements may vary based on the scope
of the assessment and project objectives.
Network Rail Project Managers shall review
the checklist in Appendix A, to identify if the
required data is readily available and start
sourcing this information from Network Rail
studies, train operating companies, Local
Authorities, Transport for London, Merseyrail
or other third party developers.
Any gaps in the data shall be clearly defined
in the remit. In all cases, NR SCT shall be
consulted to determine the suitability of using
existing data. Appendix A includes a brief
description of the different datasets required
and suggested methods of data collection.
NR SCT can organise surveys if required.
Where surveys are being commissioned by
consultants the proposed methodology and
scope will require approval from the NR SCT
and the Station Manager. It is important that
careful consideration is given to the planning
and safe operations during any survey.
2.5.1 Passenger and train data
A survey shall cover two morning and
afternoon weekday peaks (e.g. 0700 – 1000
and 1600 to 1900hrs) and any other times
when passenger volumes are known to be
high. Validation counts and observations
shall be made to ensure consistency in the
data that is collected. At some stations it may
be necessary to include other times during
weekdays and weekends depending on the
project objectives and station usage.
For new stations, demand data may come
from forecasting models and the suitability of
such forecasts and underlying assumptions
shall be discussed with the NR SCT.
2.5.2 Station layout and operations
All assessments require an accurate
definition of the physical layout of the station
being assessed; typically this information
shall be in electronic CAD format.
The configuration of existing infrastructure
such as escalators, ticket barriers and station
entry gates shall be observed and included in
the analysis.
Passenger behaviour in relation to concourse
dwelling, train announcements, location and
format of CIS (customer information
screens), wayfinding and crowd management
measures such as ‘keep left / right’, one-way
routes shall be considered in assessments.
November 2016 Network Rail Station Capacity Planning Guidance
10
3 Space Requirements for Normal Operation
The space requirements specified in this section are based on specific planning criteria for each type of station element for normal operating conditions. The methods described here ensure that adequate level of comfort is achieved in public areas of stations without making them uneconomically large.
3.1 Passenger demand concepts
Station capacity assessments shall be based
on passenger demand from the busiest time
periods. At most stations the busiest times
are normally the morning and afternoon
peaks as passengers travel to and return
from work.
In some cases a separate assessment for
weekends and special events may be
required. Special events require
management controls and may involve
queuing passengers in a safe environment.
This can have a direct impact on space
requirements in and around stations.
Non-rail users shall be included where
applicable i.e. demand associated with
station retail and thoroughfare.
The passenger demand used in
assessments shall be based on survey data
and relevant forecasts. Network Rail
Economic Planners shall be consulted
regarding demand forecasts.
The following concepts of demand data are
used in this document:
Total number of exiting passengers shall
be derived using the alighting loads from the
maximum possible number of trains that
arrive during the busiest 5-minute period on a
typical day. The busiest train shall have its
alighting load increased by 25% to factor in
delays to the service.
Total number of entering passengers shall
be derived using the boarding loads for the
maximum possible number of trains
departing during the peak 5-minute period on
a typical day. The busiest train shall have its
departure load increased by 25% to factor in
delays to the service.
Non-rail demand shall be included for
stations where this may be appropriate. This
may be driven by retail footfall, access to
other transport modes and thorough fare.
Peak minute flow shall be derived from
count data collected at the station being
assessed. Where data of this resolution is
not available, a reasonable assumption shall
be made regarding the spread of passenger
demand based on the following:
For entry flows the peak minute flow shall be
estimated by applying a factor of 0.2 to the
observed peak 5-minute flow.
For exit flows; i.e. flows away from platforms
the peak minute flow shall be based on
observations made on site. In most cases the
concentration of alighting passengers will
depend on the length of trains, stock
formation and the station layout. A
reasonable percentage shall be applied to
the peak alighting load from the maximum
number of trains that arrive concurrently
within the busiest 15 minutes.
November 2016 Network Rail Station Capacity Planning Guidance
11
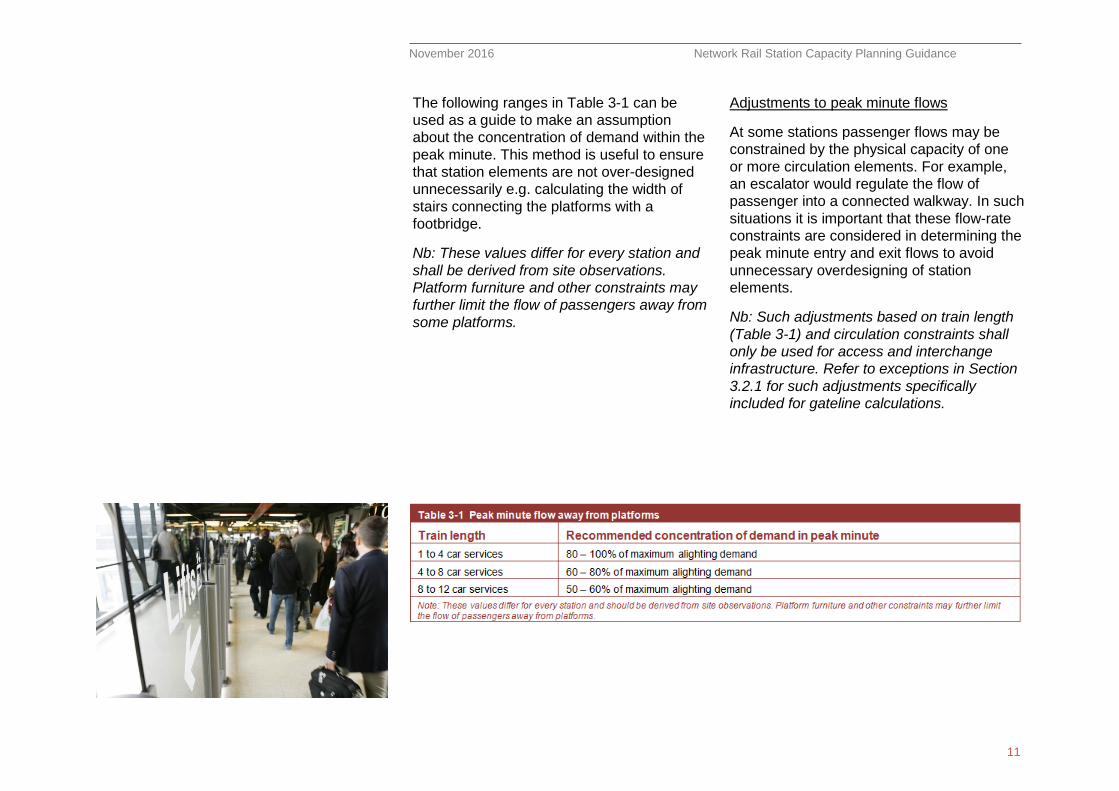
The following ranges in Table 3-1 can be
used as a guide to make an assumption
about the concentration of demand within the
peak minute. This method is useful to ensure
that station elements are not over-designed
unnecessarily e.g. calculating the width of
stairs connecting the platforms with a
footbridge.
Nb: These values differ for every station and
shall be derived from site observations.
Platform furniture and other constraints may
further limit the flow of passengers away from
some platforms.
Adjustments to peak minute flows
At some stations passenger flows may be
constrained by the physical capacity of one
or more circulation elements. For example,
an escalator would regulate the flow of
passenger into a connected walkway. In such
situations it is important that these flow-rate
constraints are considered in determining the
peak minute entry and exit flows to avoid
unnecessary overdesigning of station
elements.
Nb: Such adjustments based on train length
(Table 3-1) and circulation constraints shall
only be used for access and interchange
infrastructure. Refer to exceptions in Section
3.2.1 for such adjustments specifically
included for gateline calculations.
November 2016 Network Rail Station Capacity Planning Guidance
12
3.2 Revenue protection
Different types of ticket gates are used at
stations across the network, varying by
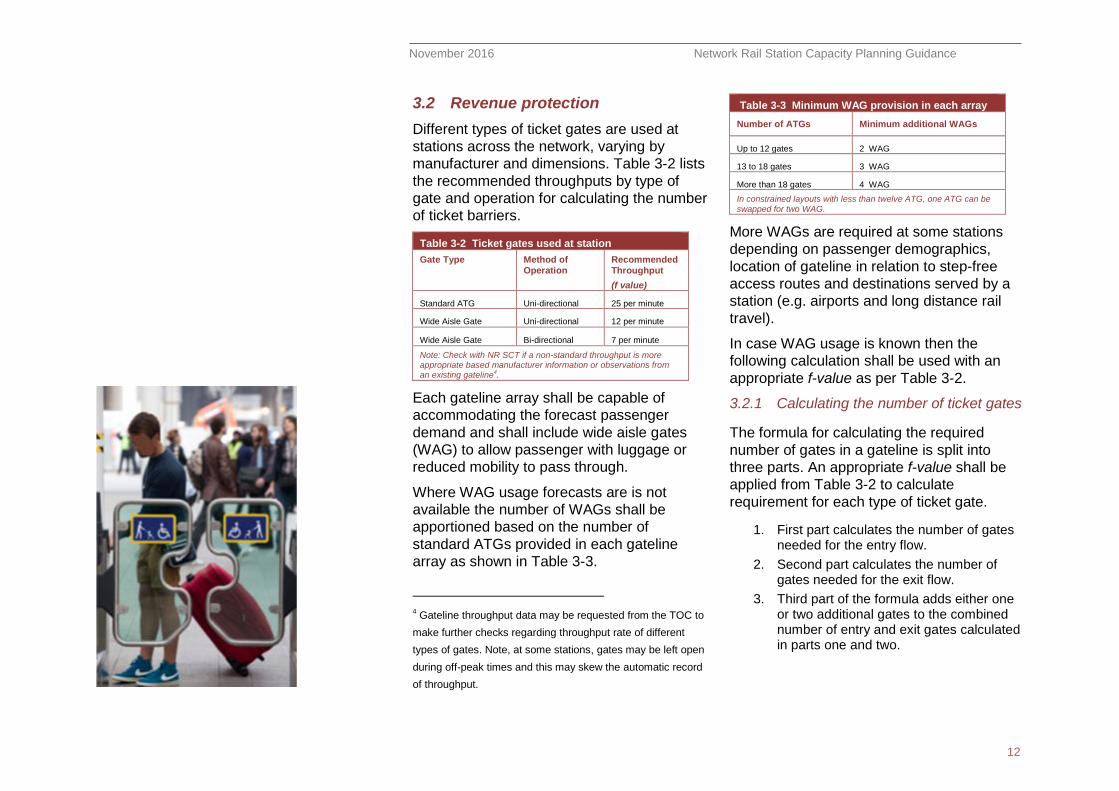
manufacturer and dimensions. Table 3-2 lists
the recommended throughputs by type of
gate and operation for calculating the number
of ticket barriers.
Table 3-2 Ticket gates used at station
Gate Type Method of Operation
Recommended Throughput
(f value)
Standard ATG Uni-directional 25 per minute
Wide Aisle Gate Uni-directional 12 per minute
Wide Aisle Gate Bi-directional 7 per minute
Note: Check with NR SCT if a non-standard throughput is more appropriate based manufacturer information or observations from an existing gateline4.
Each gateline array shall be capable of
accommodating the forecast passenger
demand and shall include wide aisle gates
(WAG) to allow passenger with luggage or
reduced mobility to pass through.
Where WAG usage forecasts are is not
available the number of WAGs shall be
apportioned based on the number of
standard ATGs provided in each gateline
array as shown in Table 3-3.
4 Gateline throughput data may be requested from the TOC to
make further checks regarding throughput rate of different
types of gates. Note, at some stations, gates may be left open
during off-peak times and this may skew the automatic record
of throughput.
Table 3-3 Minimum WAG provision in each array
Number of ATGs Minimum additional WAGs
Up to 12 gates 2 WAG
13 to 18 gates 3 WAG
More than 18 gates 4 WAG
In constrained layouts with less than twelve ATG, one ATG can be swapped for two WAG.
More WAGs are required at some stations
depending on passenger demographics,
location of gateline in relation to step-free
access routes and destinations served by a
station (e.g. airports and long distance rail
travel).
In case WAG usage is known then the
following calculation shall be used with an
appropriate f-value as per Table 3-2.
3.2.1 Calculating the number of ticket gates
The formula for calculating the required
number of gates in a gateline is split into
three parts. An appropriate f-value shall be
applied from Table 3-2 to calculate
requirement for each type of ticket gate.
1. First part calculates the number of gates needed for the entry flow.
2. Second part calculates the number of gates needed for the exit flow.
3. Third part of the formula adds either one or two additional gates to the combined number of entry and exit gates calculated in parts one and two.

November 2016 Network Rail Station Capacity Planning Guidance
13
Where:
Peak 5-minute entry flow is the maximum number of
passengers entering the station to board one or more
train services departing within the peak 5-minute
period. This shall be based on survey data and forecast
growth including a 25% mark-up applied to the busiest
train boarding load as per Section 3.1. At stations
where headways are typically less than or equal to 5
minutes, all passengers boarding trains departing in the
peak 5-minute period shall be assumed to pass
through the gates in the same 5 minutes.
It must be noted however, at stations where trains
dwell longer (e.g. at termini), a reasonable assumption
shall be made regarding the spread of passengers
passing through ticket gates at peak times to board one
or more trains. This is because some passengers may
choose to pass through the gates more than five
minutes before their train departs. This generally
depends on the anticipated transfer time from the
gateline to a specific location on platforms, time when
train doors close and specific passenger characteristics
(e.g. some long distance trains have long turnaround
times).
Total number of exiting passengers shall be derived
using the maximum number of passengers exiting a
station from one or more train arrivals. This shall be
based on individual train alighting survey data or
forecasts numbers, and the maximum possible number
of trains that can possibly arrive at a station
concurrently during peak periods. A mark-up of 25%
shall be applied to the busiest train alighting load as
per Section 3.1.
All calculations shall use the entry and exit flows from
the same 5-minute time period. If the forecast entry and
exit flows are not available, it is recommended that at
least 20% increase is applied to the current demand.
n-value for stations with through platforms shall not be
greater than 2 minutes and a value up to 4 minutes can
be used for gates located at the head of terminating
platforms5. This value is only used in static calculation
to spread the total number of exiting passengers over a
reasonable period of time to avoid over-specifying the
number of exit gates. The recommended thresholds for
the n-value are a function of the desirable platform
clearance time at stations. The n-value shall be agreed
with the NR SCT on a case by case basis.
X = 1 if the total (without X) is less than or equal to 10
gates, or X = 2 if the total (without X) is greater than 10
gates. This is to take account for redundancy of gates
due to fault or maintenance.
If the total number of ticket gates (including X)
calculated using this formula in a single gateline is less
than 3 ATGs, then at least 3 ATGs shall be provided
with additional WAGs as per Table 3-3.
5At termini the gap between arrivals on multiple platforms are
generally longer, whereas at some through stations the
headways can be as small as 2 minutes.
Calculating the required number of ticket gates in a gateline
November 2016 Network Rail Station Capacity Planning Guidance
14
The formula shall be used twice, once to
calculate the number of gates needed in the
AM peak and then again to calculate the
number of gates required in the PM peak. If a
station has a high number of leisure
travellers (i.e. tourists and shoppers) then the
busiest period of gateline activity may be
outside the AM and PM weekday peak times,
in which case a third calculation for the
number of gates shall be undertaken. The
highest figure from all calculations shall be
used as the required number of ticket gates.
Exceptions to the use of this formula
If a gateline is separated from the platforms
by any kind of intermediate constraint6; e.g.
an escalator, staircase, footbridge or
passageway, the flow of exiting passengers
will be limited by the capacity of this element
of infrastructure. In such cases the total
number of exiting passengers used in the
above formula shall be adjusted to represent
the maximum number of passengers that
could possibly arrive per minute at the exit
gates in a constrained flow scenario. For
calculations based on this method, the n-
value shall be set to 1 minute.
6 This is only applicable when using peak minute exit flows
recorded in dynamic simulations to replace ‘total exiting
passengers’ in the formula.
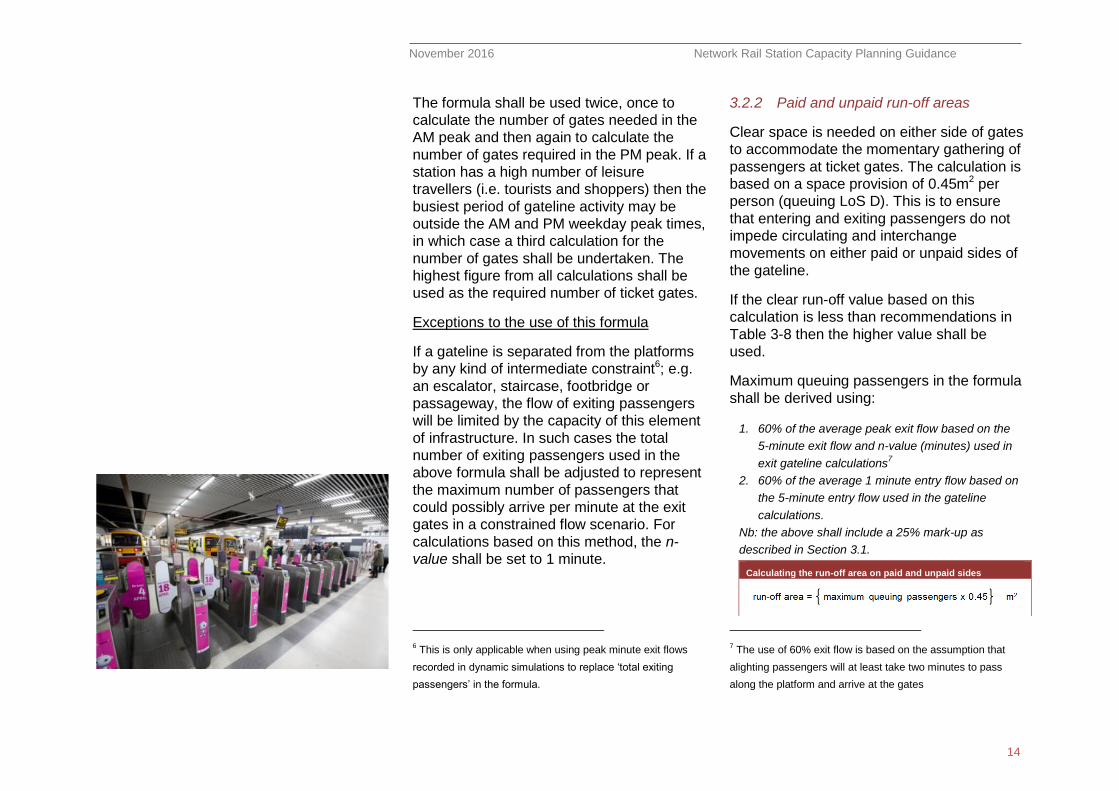
3.2.2 Paid and unpaid run-off areas
Clear space is needed on either side of gates
to accommodate the momentary gathering of
passengers at ticket gates. The calculation is
based on a space provision of 0.45m2 per
person (queuing LoS D). This is to ensure
that entering and exiting passengers do not
impede circulating and interchange
movements on either paid or unpaid sides of
the gateline.
If the clear run-off value based on this
calculation is less than recommendations in
Table 3-8 then the higher value shall be
used.
Maximum queuing passengers in the formula
shall be derived using:
1. 60% of the average peak exit flow based on the
5-minute exit flow and n-value (minutes) used in
exit gateline calculations7
2. 60% of the average 1 minute entry flow based on
the 5-minute entry flow used in the gateline
calculations.
Nb: the above shall include a 25% mark-up as
described in Section 3.1.
7 The use of 60% exit flow is based on the assumption that
alighting passengers will at least take two minutes to pass
along the platform and arrive at the gates
Calculating the run-off area on paid and unpaid sides
November 2016 Network Rail Station Capacity Planning Guidance
15
Nb: These percentage values may be
adjusted based on station layout, passenger
behaviour and type of train service.
Where ticket gates are separated from the
platforms by an intermediate constraint; e.g.
a staircase, maximum possible entry and exit
movements per minute based on the
capacity of circulation infrastructure and train
arrivals/departures shall be calculated.
3.2.3 Gateline orientation
Gatelines shall be sited such that all gates
are readily accessible, and entry or exit gates
shall be grouped in larger arrays, to minimise
cross flows. For large gatelines serving
multiple terminating platforms, it may be
more appropriate to alternate such clusters of
entry and exit gates along the length of the
gateline. In such cases it is beneficial to
clearly mark the clusters with dynamic
overhead signage that can change when the
directional setup gates is reversed.
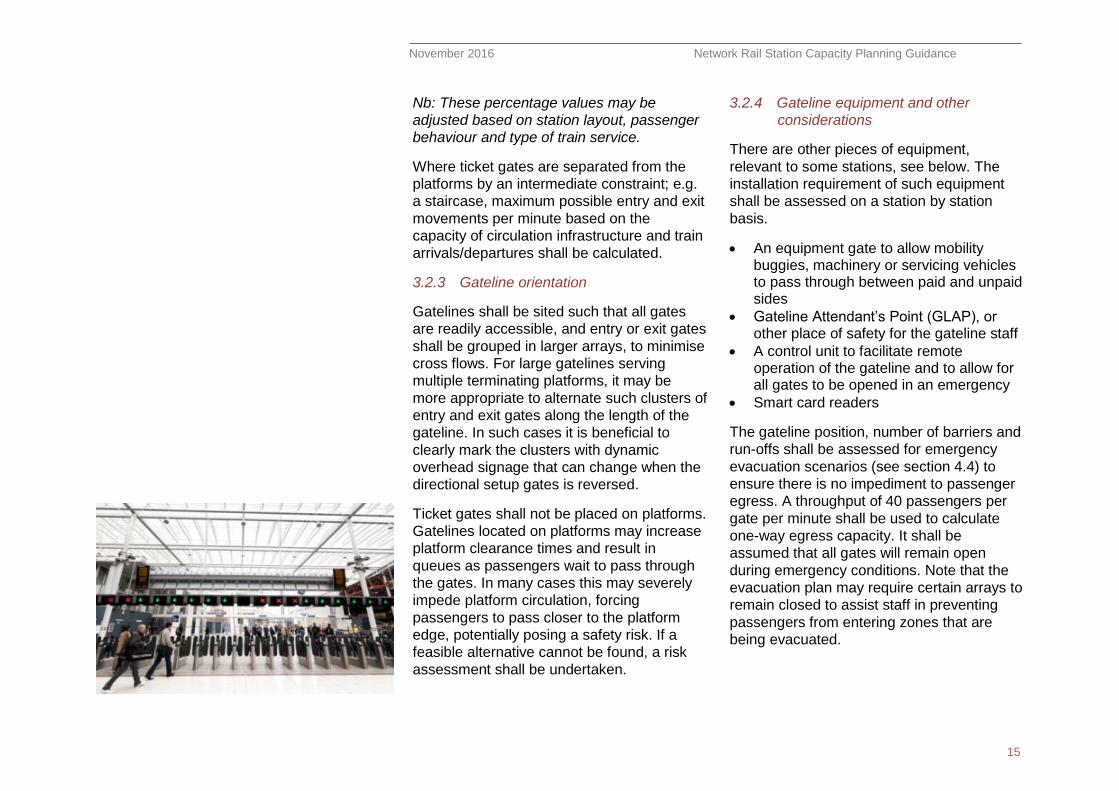
Ticket gates shall not be placed on platforms.
Gatelines located on platforms may increase
platform clearance times and result in
queues as passengers wait to pass through
the gates. In many cases this may severely
impede platform circulation, forcing
passengers to pass closer to the platform
edge, potentially posing a safety risk. If a
feasible alternative cannot be found, a risk
assessment shall be undertaken.
3.2.4 Gateline equipment and other
considerations
There are other pieces of equipment,
relevant to some stations, see below. The
installation requirement of such equipment
shall be assessed on a station by station
basis.
An equipment gate to allow mobility buggies, machinery or servicing vehicles to pass through between paid and unpaid sides
Gateline Attendant’s Point (GLAP), or other place of safety for the gateline staff
A control unit to facilitate remote operation of the gateline and to allow for all gates to be opened in an emergency
Smart card readers
The gateline position, number of barriers and
run-offs shall be assessed for emergency
evacuation scenarios (see section 4.4) to
ensure there is no impediment to passenger
egress. A throughput of 40 passengers per
gate per minute shall be used to calculate
one-way egress capacity. It shall be
assumed that all gates will remain open
during emergency conditions. Note that the
evacuation plan may require certain arrays to
remain closed to assist staff in preventing
passengers from entering zones that are
being evacuated.
November 2016 Network Rail Station Capacity Planning Guidance
16
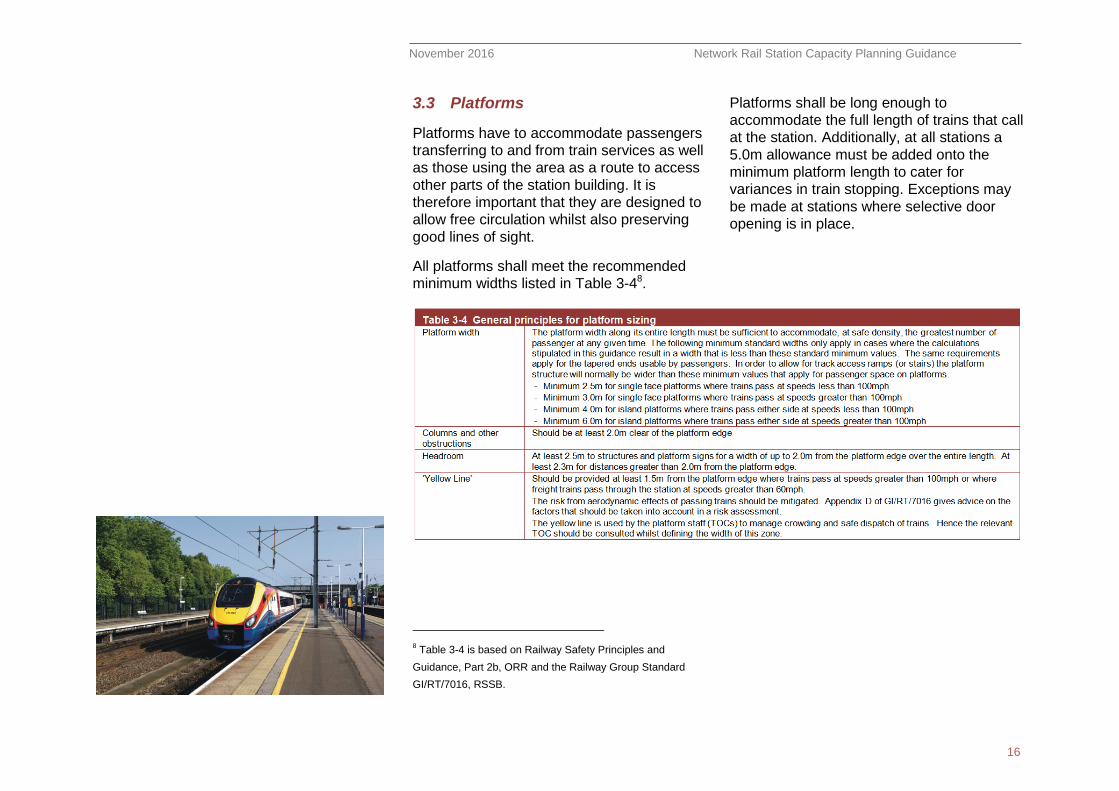
3.3 Platforms
Platforms have to accommodate passengers
transferring to and from train services as well
as those using the area as a route to access
other parts of the station building. It is
therefore important that they are designed to
allow free circulation whilst also preserving
good lines of sight.
All platforms shall meet the recommended
minimum widths listed in Table 3-48.
8 Table 3-4 is based on Railway Safety Principles and
Guidance, Part 2b, ORR and the Railway Group Standard
GI/RT/7016, RSSB.
Platforms shall be long enough to
accommodate the full length of trains that call
at the station. Additionally, at all stations a
5.0m allowance must be added onto the
minimum platform length to cater for
variances in train stopping. Exceptions may
be made at stations where selective door
opening is in place.
November 2016 Network Rail Station Capacity Planning Guidance
17
Calculating the required platform width
To ensure correct sizing of platforms one of
the two methods described below shall be
used to calculate the required width
depending on station operation and platform
usage. If it is not possible to deliver the
required width based on this guidance, a risk
assessment shall be undertaken.
In case of island platform the same
calculation needs to be repeated for both
operating sides of the platform.
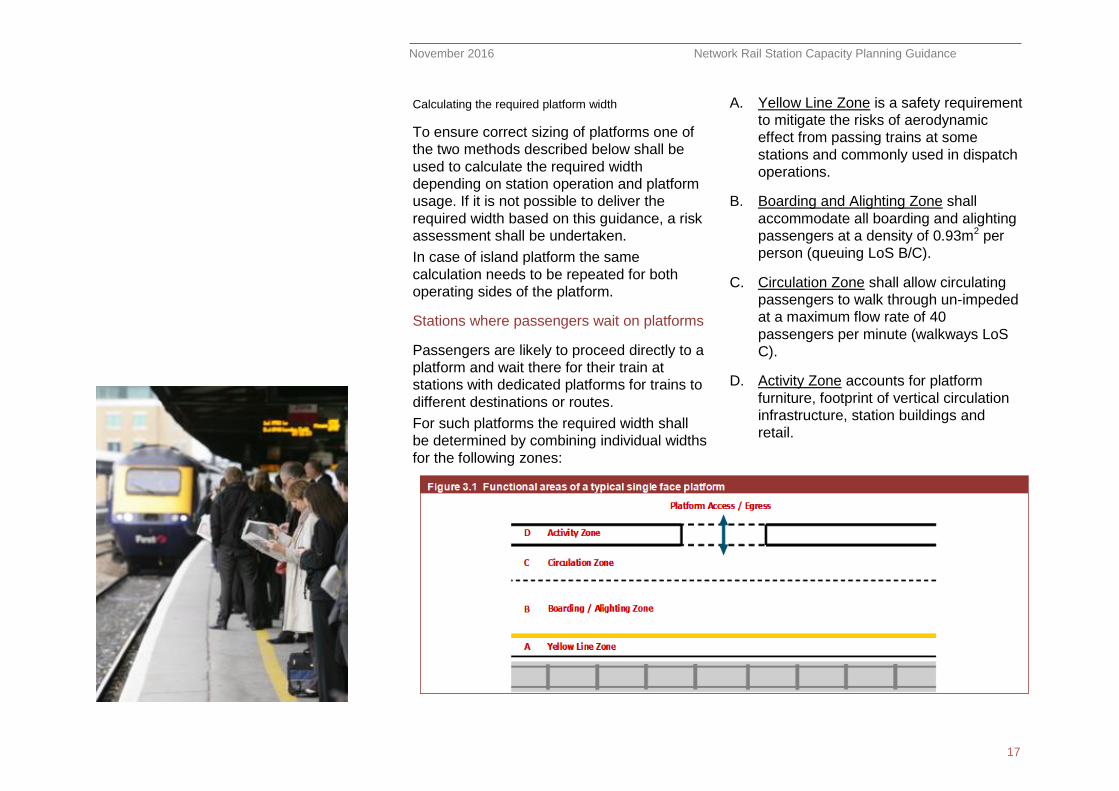
Stations where passengers wait on platforms
Passengers are likely to proceed directly to a
platform and wait there for their train at
stations with dedicated platforms for trains to
different destinations or routes.
For such platforms the required width shall
be determined by combining individual widths
for the following zones:
A. Yellow Line Zone is a safety requirement
to mitigate the risks of aerodynamic
effect from passing trains at some
stations and commonly used in dispatch
operations.
B. Boarding and Alighting Zone shall
accommodate all boarding and alighting
passengers at a density of 0.93m2 per
person (queuing LoS B/C).
C. Circulation Zone shall allow circulating
passengers to walk through un-impeded
at a maximum flow rate of 40
passengers per minute (walkways LoS
C).
D. Activity Zone accounts for platform
furniture, footprint of vertical circulation
infrastructure, station buildings and
retail.
November 2016 Network Rail Station Capacity Planning Guidance
18
The positioning of passengers on a platform
is not always uniform and is influenced by;
Location of platform entrances
Any shelters or canopies
Preferred carriage based on exit point at the destination station
Location of CIS (customer information screen) displays
Knowledge of busiest carriages
Seat reservations in some cases
To account for this uneven platform loading
the calculations for zones A – D shall be
carried out by dividing the platform length
into ‘carriage blocks’ which correspond to
individual train cars. The required width shall
then be calculated for each ‘carriage block’
separately using the formulas for zones A –
D; e.g. for an eight car train eight separate
platform widths would be defined.
Ideally platforms shall have a uniform width
and the maximum width calculated for the
busiest carriage block shall be used. Where
this is not the case a risk assessment shall
be undertaken, with supporting calculations,
to demonstrate that any risks are as low as
reasonably practicable.
The following calculations shall be carried out for the busiest periods and for all different train lengths that call at the platform; e.g. some rolling stock formations may result in higher concentration of passengers within a relatively small part of the platform.
Zone A: Yellow line zone
A ‘yellow line zone’ shall be provided based
on the minimum requirements listed in Table
3-4. For stations where a yellow line zone is
not provided, a minimum 0.5m shall be
added to the calculated width.
Zone B: Boarding / Alighting zone
The zone used by boarders and alighters can be calculated by the following formula separately for each carriage block:
Calculating size of boarding and alighting zone
Where: The block length is the length of each carriage based on the appropriate rolling stock. Block loading is the maximum number of passengers that board and alight the individual train car located within the ‘carriage block’. Distribution of boarding and alighting passengers along the length of a platform shall be based on a survey of the number of boarders and alighters for each train car.
In case platform spreading information is not available a reasonable assumption shall be agreed with the NR SCT.
November 2016 Network Rail Station Capacity Planning Guidance
19
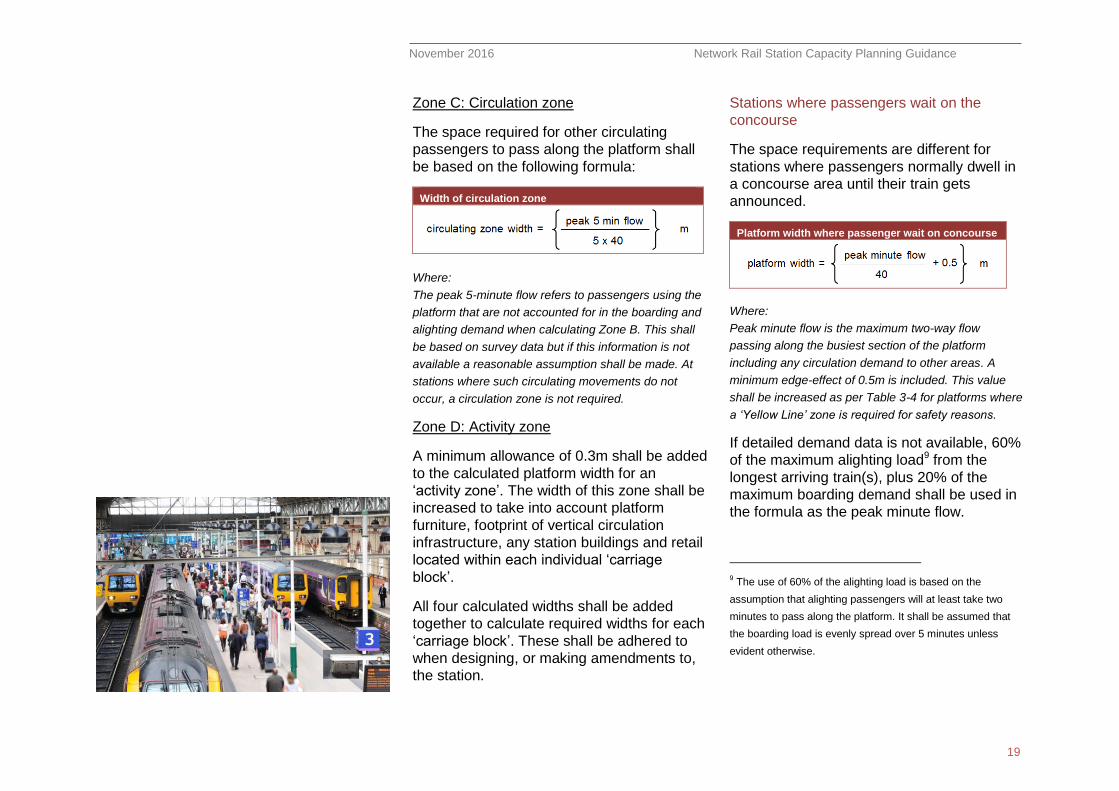
Zone C: Circulation zone
The space required for other circulating
passengers to pass along the platform shall
be based on the following formula:
Width of circulation zone
Where:
The peak 5-minute flow refers to passengers using the
platform that are not accounted for in the boarding and
alighting demand when calculating Zone B. This shall
be based on survey data but if this information is not
available a reasonable assumption shall be made. At
stations where such circulating movements do not
occur, a circulation zone is not required.
Zone D: Activity zone
A minimum allowance of 0.3m shall be added
to the calculated platform width for an
‘activity zone’. The width of this zone shall be
increased to take into account platform
furniture, footprint of vertical circulation
infrastructure, any station buildings and retail
located within each individual ‘carriage
block’.
All four calculated widths shall be added
together to calculate required widths for each
‘carriage block’. These shall be adhered to
when designing, or making amendments to,
the station.
Stations where passengers wait on the
concourse
The space requirements are different for
stations where passengers normally dwell in
a concourse area until their train gets
announced.
Platform width where passenger wait on concourse
Where:
Peak minute flow is the maximum two-way flow
passing along the busiest section of the platform
including any circulation demand to other areas. A
minimum edge-effect of 0.5m is included. This value
shall be increased as per Table 3-4 for platforms where
a ‘Yellow Line’ zone is required for safety reasons.
If detailed demand data is not available, 60%
of the maximum alighting load9 from the
longest arriving train(s), plus 20% of the
maximum boarding demand shall be used in
the formula as the peak minute flow.
9 The use of 60% of the alighting load is based on the
assumption that alighting passengers will at least take two
minutes to pass along the platform. It shall be assumed that
the boarding load is evenly spread over 5 minutes unless
evident otherwise.
November 2016 Network Rail Station Capacity Planning Guidance
20
3.4 Canopies
Canopies shall be provided over platforms
and other public areas within a station to
provide weather protected route to and from
train services. This is to ensure safety and
improve passenger comfort during inclement
weather conditions. Insufficient shelter
results in congestion as passengers
congregate in covered areas. This slows
boarding and alighting and has a negative
impact on train performance.
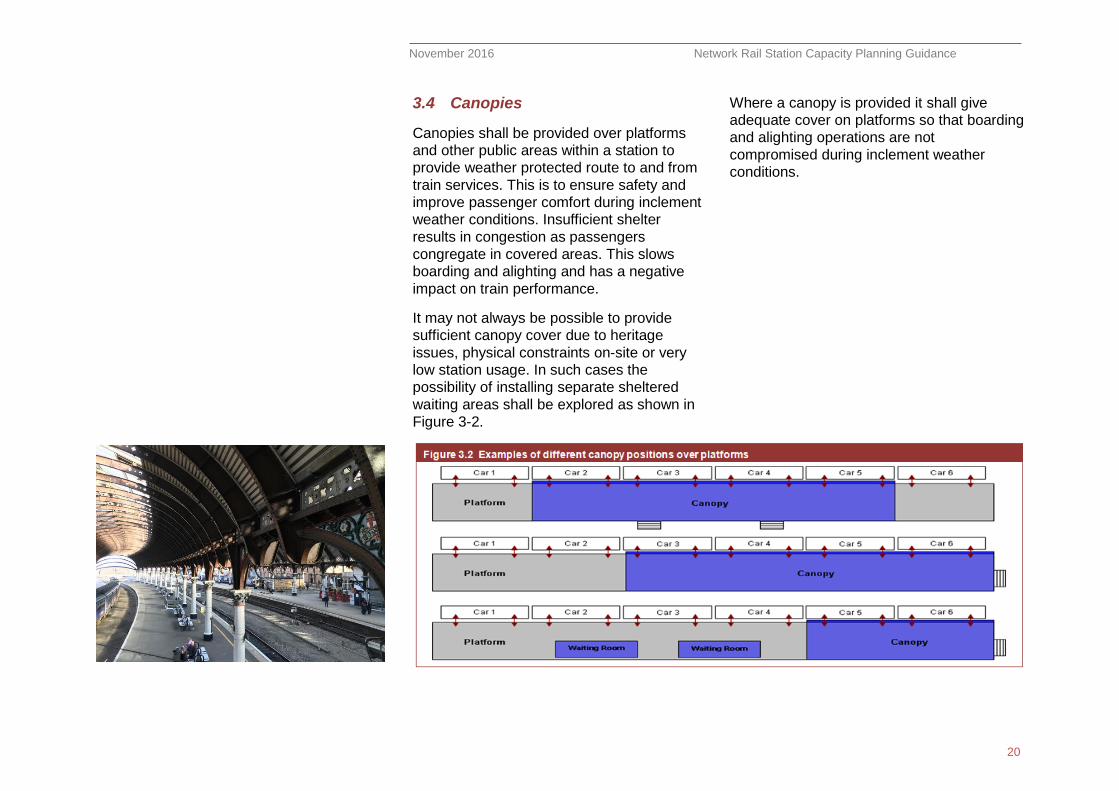
It may not always be possible to provide
sufficient canopy cover due to heritage
issues, physical constraints on-site or very
low station usage. In such cases the
possibility of installing separate sheltered
waiting areas shall be explored as shown in
Figure 3-2.
Where a canopy is provided it shall give
adequate cover on platforms so that boarding
and alighting operations are not
compromised during inclement weather
conditions.
November 2016 Network Rail Station Capacity Planning Guidance
21
3.4.1 Calculating canopy size
The recommended area covered by a
canopy shall be calculated by taking the
maximum value from one of the two
approaches below.
1. The first calculation is based on the
number of doors that are needed to be
under canopy cover to meet the train
dwell time requirement. One shall then
relate this to the rolling stock that is used
to calculate the length of canopy cover in
metres.
Number of carriage doors under cover
Where:
The maximum boarding load is for the single busiest
train service on each platform. The train dwell time
used here refers to the time when train doors remain
open in ‘normal’ running.
Note that doors and not always evenly spaced and
locations can vary by type of rolling stock. If door
widths vary on a single carriage then an average door
width shall be used for the length of the train.
A throughput of 40 passengers per minute per metre
width of train doors is assumed here in the formula and
this value can be reduced if deemed appropriate for a
given site.
2. The second calculation is for the space
(m2) that is required on a platform to
accommodate the maximum number
boarders at a reasonable density level.
One shall then derive the canopy length
(metres) by considering the usable width
along the platform.
Platform dwelling area under cover
Where:
The maximum boarding load use here is for the single
busiest train where headways are longer than
5minutes. In case of shorter headways all boarders for
the first train and those waiting for subsequent trains
shall be used in the calculation.
A passenger density of 0.65m2 per person (queuing
LoS C/D) is used in this calculation and a lower density
level can be used if deemed appropriate for a given
site.
Any station buildings or areas covered by
platform furniture that cannot be used by
passengers waiting for trains shall be
excluded from both calculations.
Other factors influencing the spreading of
passengers on platforms shall be considered
when designing canopies. These may
include the location of platform access
routes, passenger behaviour and train
loadings.
November 2016 Network Rail Station Capacity Planning Guidance
22
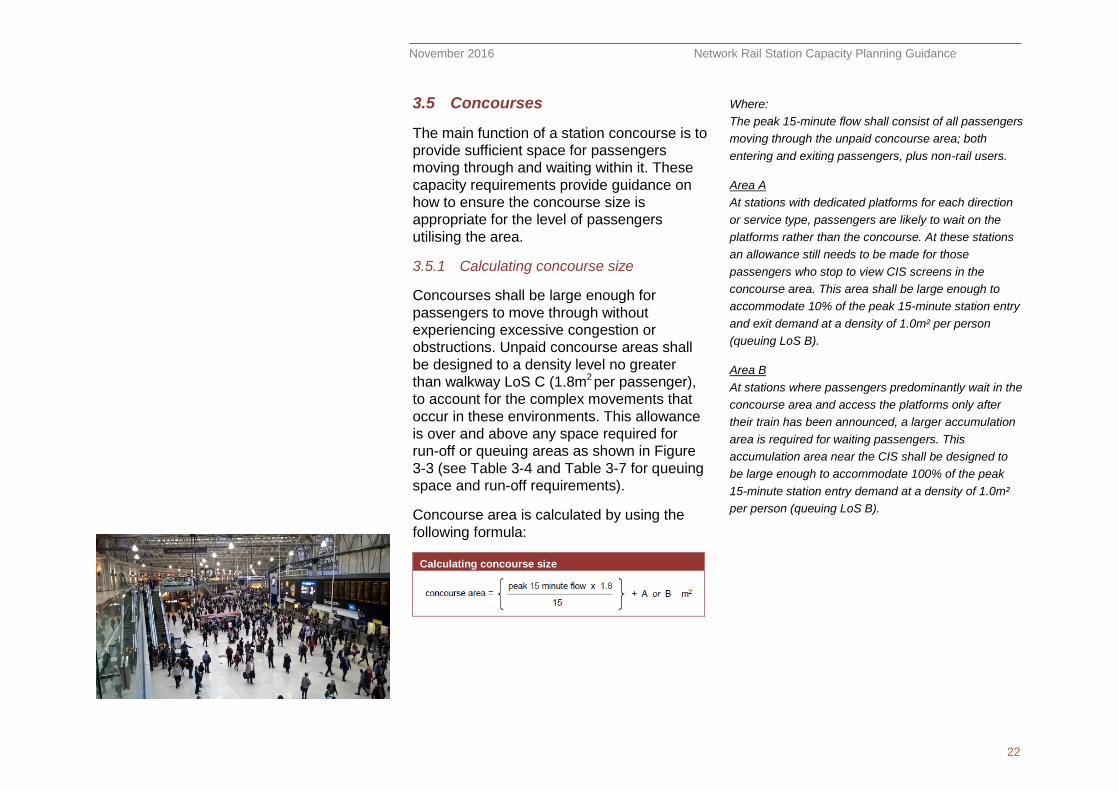
3.5 Concourses
The main function of a station concourse is to
provide sufficient space for passengers
moving through and waiting within it. These
capacity requirements provide guidance on
how to ensure the concourse size is
appropriate for the level of passengers
utilising the area.
3.5.1 Calculating concourse size
Concourses shall be large enough for
passengers to move through without
experiencing excessive congestion or
obstructions. Unpaid concourse areas shall
be designed to a density level no greater
than walkway LoS C (1.8m2 per passenger),
to account for the complex movements that
occur in these environments. This allowance
is over and above any space required for
run-off or queuing areas as shown in Figure
3-3 (see Table 3-4 and Table 3-7 for queuing
space and run-off requirements).
Concourse area is calculated by using the
following formula:
Calculating concourse size
Where:
The peak 15-minute flow shall consist of all passengers
moving through the unpaid concourse area; both
entering and exiting passengers, plus non-rail users.
Area A
At stations with dedicated platforms for each direction
or service type, passengers are likely to wait on the
platforms rather than the concourse. At these stations
an allowance still needs to be made for those
passengers who stop to view CIS screens in the
concourse area. This area shall be large enough to
accommodate 10% of the peak 15-minute station entry
and exit demand at a density of 1.0m² per person
(queuing LoS B).
Area B
At stations where passengers predominantly wait in the
concourse area and access the platforms only after
their train has been announced, a larger accumulation
area is required for waiting passengers. This
accumulation area near the CIS shall be designed to
be large enough to accommodate 100% of the peak
15-minute station entry demand at a density of 1.0m²
per person (queuing LoS B).
November 2016 Network Rail Station Capacity Planning Guidance
23
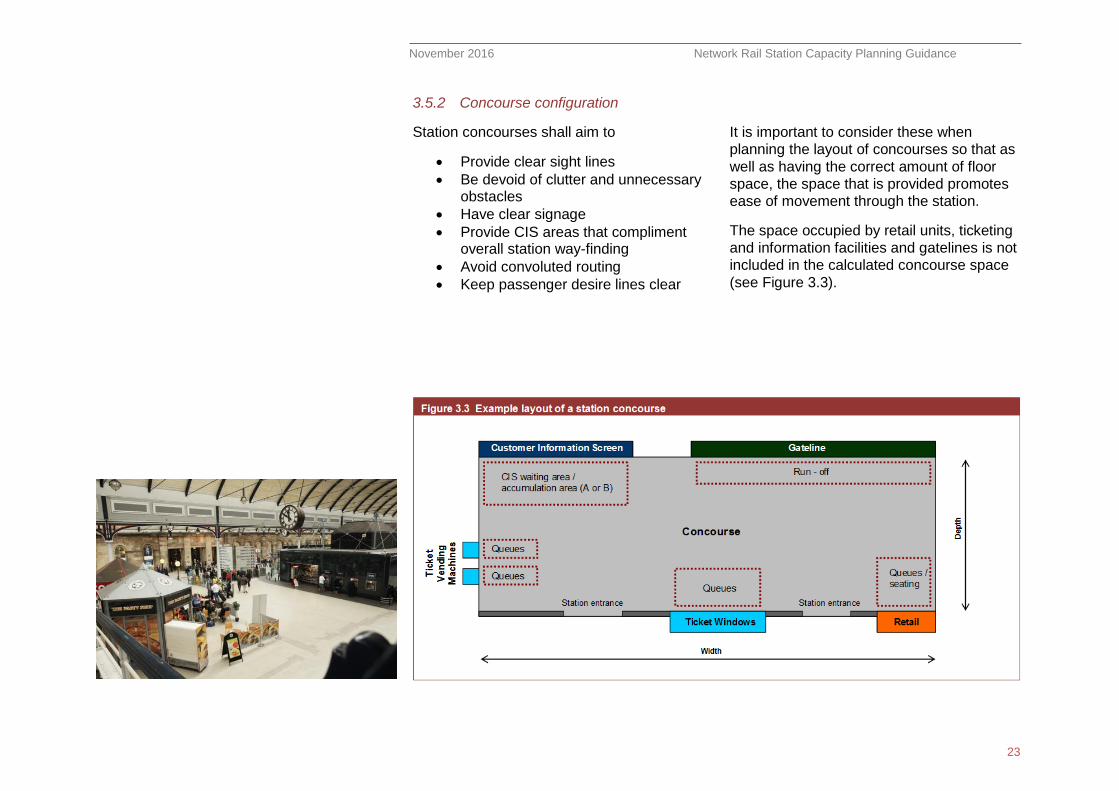
3.5.2 Concourse configuration
Station concourses shall aim to
Provide clear sight lines
Be devoid of clutter and unnecessary obstacles
Have clear signage
Provide CIS areas that compliment overall station way-finding
Avoid convoluted routing
Keep passenger desire lines clear
It is important to consider these when
planning the layout of concourses so that as
well as having the correct amount of floor
space, the space that is provided promotes
ease of movement through the station.
The space occupied by retail units, ticketing
and information facilities and gatelines is not
included in the calculated concourse space
(see Figure 3.3).
November 2016 Network Rail Station Capacity Planning Guidance
24
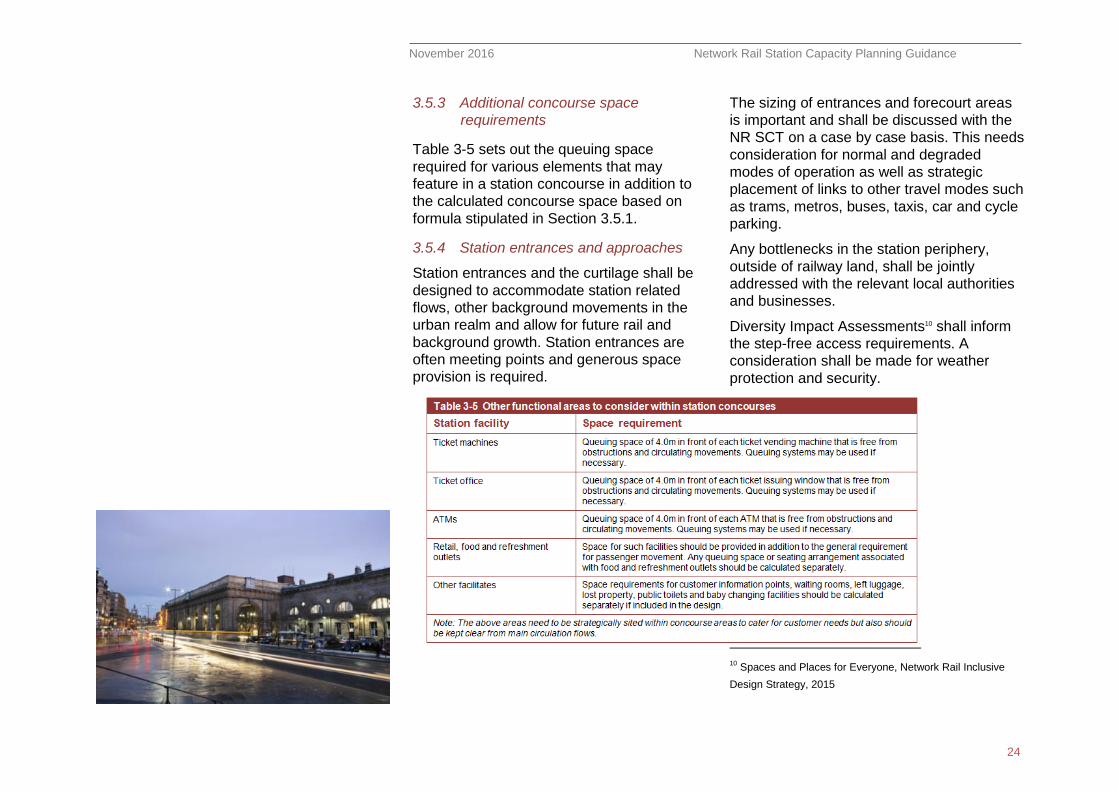
3.5.3 Additional concourse space
requirements
Table 3-5 sets out the queuing space
required for various elements that may
feature in a station concourse in addition to
the calculated concourse space based on
formula stipulated in Section 3.5.1.
3.5.4 Station entrances and approaches
Station entrances and the curtilage shall be
designed to accommodate station related
flows, other background movements in the
urban realm and allow for future rail and
background growth. Station entrances are
often meeting points and generous space
provision is required.
The sizing of entrances and forecourt areas
is important and shall be discussed with the
NR SCT on a case by case basis. This needs
consideration for normal and degraded
modes of operation as well as strategic
placement of links to other travel modes such
as trams, metros, buses, taxis, car and cycle
parking.
Any bottlenecks in the station periphery,
outside of railway land, shall be jointly
addressed with the relevant local authorities
and businesses.
Diversity Impact Assessments10 shall inform
the step-free access requirements. A
consideration shall be made for weather
protection and security.
10
Spaces and Places for Everyone, Network Rail Inclusive
Design Strategy, 2015
November 2016 Network Rail Station Capacity Planning Guidance
25
3.6 Access and interchange
Access and interchange routes provide the
means for passengers to move around the
station between the external, concourse and
platform zones. They consist of
passageways, escalators, passenger
conveyors, stairs, lifts and ramps. Access
and interchange routes shall be clear, safe,
direct and compliment the station way-finding
strategy.
This section provides the recommended
requirements for access and interchange
infrastructure. It is recognised that at existing
facilities or constrained sites it may not be
possible to meet these specifications. Where
this is the case, a site specific risk
assessment shall be undertaken.
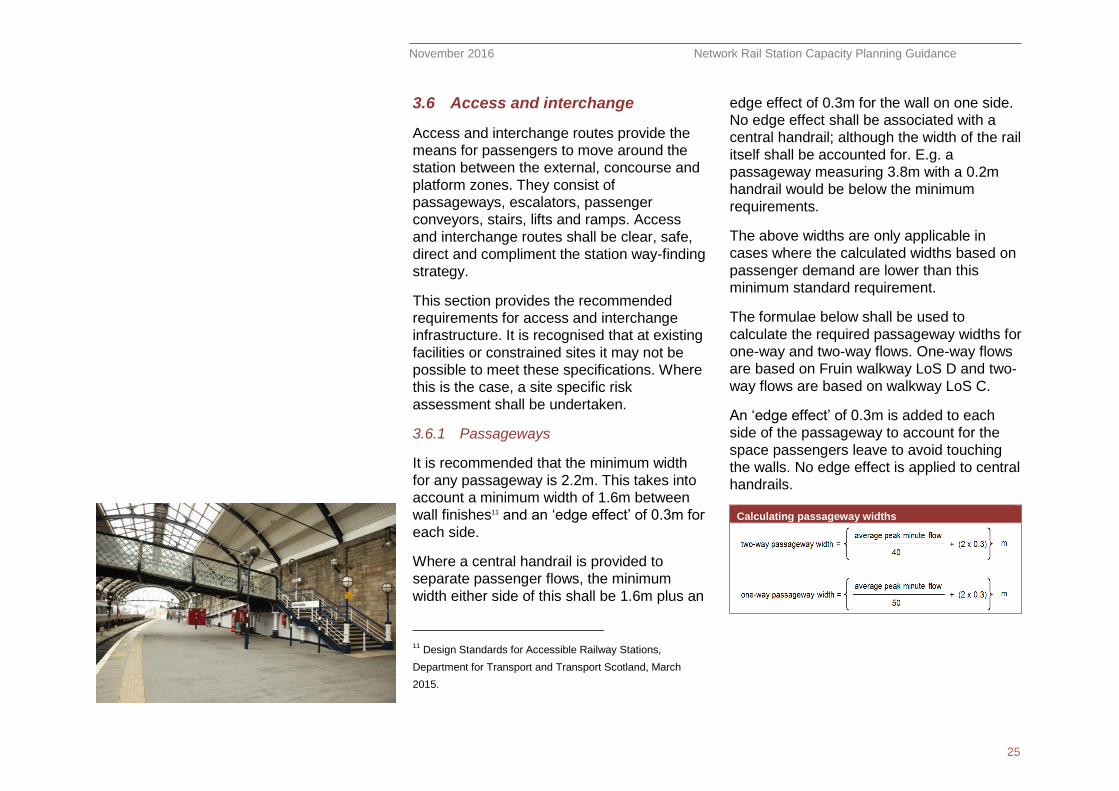
3.6.1 Passageways
It is recommended that the minimum width
for any passageway is 2.2m. This takes into
account a minimum width of 1.6m between
wall finishes11 and an ‘edge effect’ of 0.3m for
each side.
Where a central handrail is provided to
separate passenger flows, the minimum
width either side of this shall be 1.6m plus an
11
Design Standards for Accessible Railway Stations,
Department for Transport and Transport Scotland, March
2015.
edge effect of 0.3m for the wall on one side.
No edge effect shall be associated with a
central handrail; although the width of the rail
itself shall be accounted for. E.g. a
passageway measuring 3.8m with a 0.2m
handrail would be below the minimum
requirements.
The above widths are only applicable in
cases where the calculated widths based on
passenger demand are lower than this
minimum standard requirement.
The formulae below shall be used to
calculate the required passageway widths for
one-way and two-way flows. One-way flows
are based on Fruin walkway LoS D and two-
way flows are based on walkway LoS C.
An ‘edge effect’ of 0.3m is added to each
side of the passageway to account for the
space passengers leave to avoid touching
the walls. No edge effect is applied to central
handrails.
Calculating passageway widths
November 2016 Network Rail Station Capacity Planning Guidance
26
3.6.2 Passenger conveyors
If it is commercially viable and beneficial to
do so, passenger conveyors can be installed
in a number of locations including along
passageways. These can be considered
when station layouts have large walking
distances. It shall be assumed that
passenger conveyors or travelators have the
same run-off requirements as escalators.
The manufacturer’s specification shall be
used to determine a throughput rate for
capacity calculations.
3.6.3 Vertical circulation elements
Notwithstanding the need to provide ‘step-
free’ access throughout station
environments, all new station designs shall
include at least one step-free route from
street to concourse and from concourse to
platforms. Diversity Impact Assessments
must be undertaken to determine the
appropriate step-free access solution for
each station.
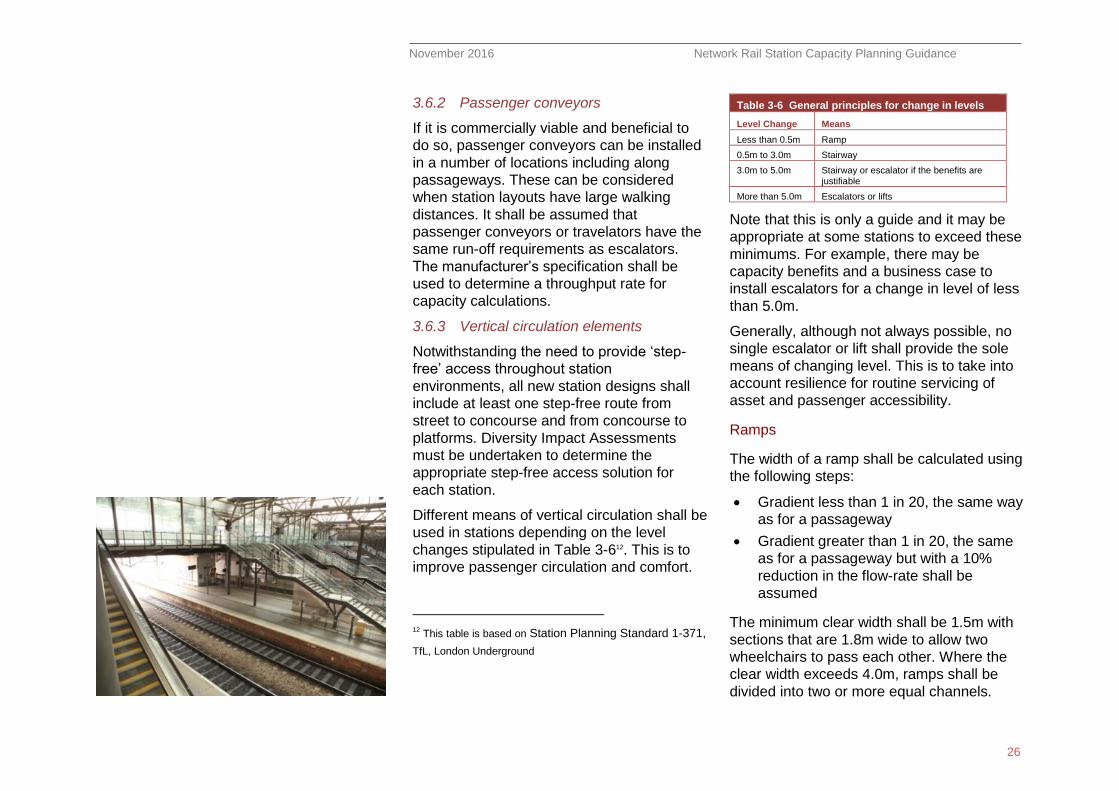
Different means of vertical circulation shall be
used in stations depending on the level
changes stipulated in Table 3-612. This is to
improve passenger circulation and comfort.
12
This table is based on Station Planning Standard 1-371,
TfL, London Underground
Table 3-6 General principles for change in levels
Level Change Means
Less than 0.5m Ramp
0.5m to 3.0m Stairway
3.0m to 5.0m Stairway or escalator if the benefits are justifiable
More than 5.0m Escalators or lifts
Note that this is only a guide and it may be
appropriate at some stations to exceed these
minimums. For example, there may be
capacity benefits and a business case to
install escalators for a change in level of less
than 5.0m.
Generally, although not always possible, no
single escalator or lift shall provide the sole
means of changing level. This is to take into
account resilience for routine servicing of
asset and passenger accessibility.
Ramps
The width of a ramp shall be calculated using
the following steps:
Gradient less than 1 in 20, the same way
as for a passageway
Gradient greater than 1 in 20, the same
as for a passageway but with a 10%
reduction in the flow-rate shall be
assumed
The minimum clear width shall be 1.5m with
sections that are 1.8m wide to allow two
wheelchairs to pass each other. Where the
clear width exceeds 4.0m, ramps shall be
divided into two or more equal channels.
November 2016 Network Rail Station Capacity Planning Guidance
27
Public ramps shall comply with the gradients
stipulated in Table 3-7.
Table 3-7 Maximum ramp gradients
Going of flight (max length) Maximum gradient
10.0m 1:20
5.0m 1:15
Ramps shall not be the only approach to
stations. Where a change in level that is no
greater than 0.3m a ramp is acceptable,
avoiding the need for a single step on station
approach.
No individual flight of a ramp shall have a
going of more than 10.0m or a rise of more
than 0.5m. Unless used as secondary means
of access, no series of ramps shall rise more
than 2.0m. Ramp flights shall have a
consistent gradient.
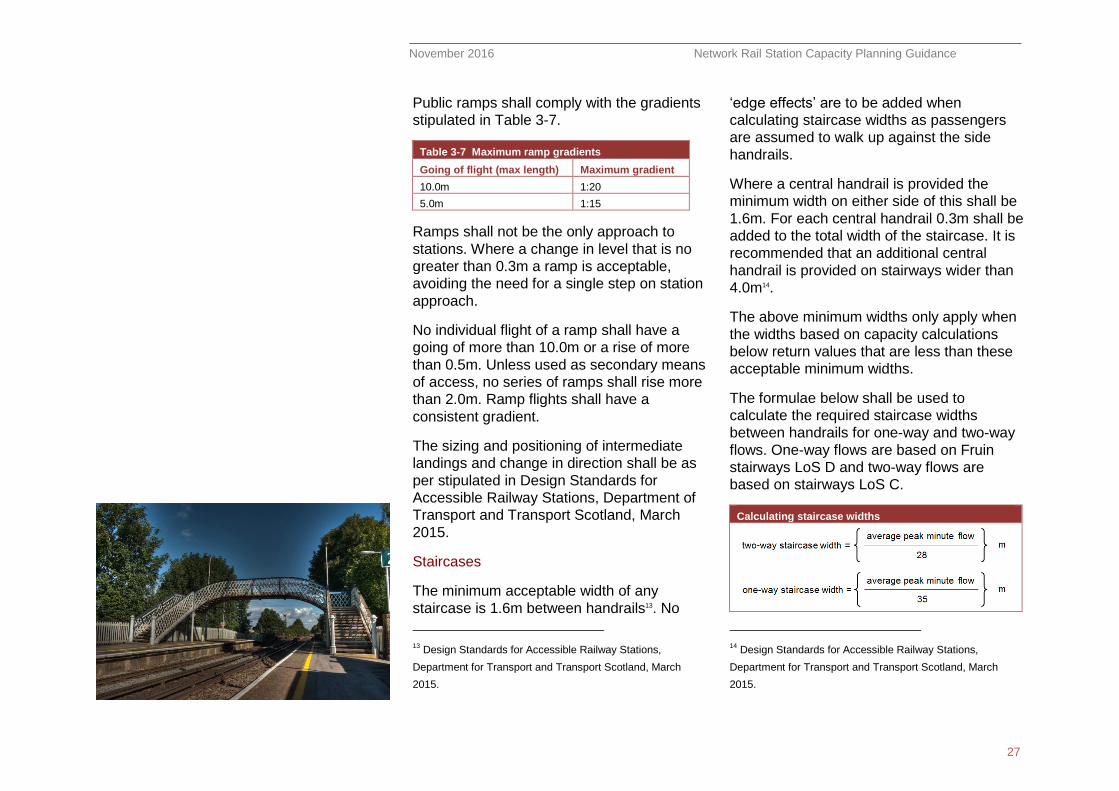
The sizing and positioning of intermediate
landings and change in direction shall be as
per stipulated in Design Standards for
Accessible Railway Stations, Department of
Transport and Transport Scotland, March
2015.
Staircases
The minimum acceptable width of any
staircase is 1.6m between handrails13. No
13
Design Standards for Accessible Railway Stations,
Department for Transport and Transport Scotland, March
2015.
‘edge effects’ are to be added when
calculating staircase widths as passengers
are assumed to walk up against the side
handrails.
Where a central handrail is provided the
minimum width on either side of this shall be
1.6m. For each central handrail 0.3m shall be
added to the total width of the staircase. It is
recommended that an additional central
handrail is provided on stairways wider than
4.0m14.
The above minimum widths only apply when
the widths based on capacity calculations
below return values that are less than these
acceptable minimum widths.
The formulae below shall be used to
calculate the required staircase widths
between handrails for one-way and two-way
flows. One-way flows are based on Fruin
stairways LoS D and two-way flows are
based on stairways LoS C.
Calculating staircase widths
14
Design Standards for Accessible Railway Stations,
Department for Transport and Transport Scotland, March
2015.
November 2016 Network Rail Station Capacity Planning Guidance
28
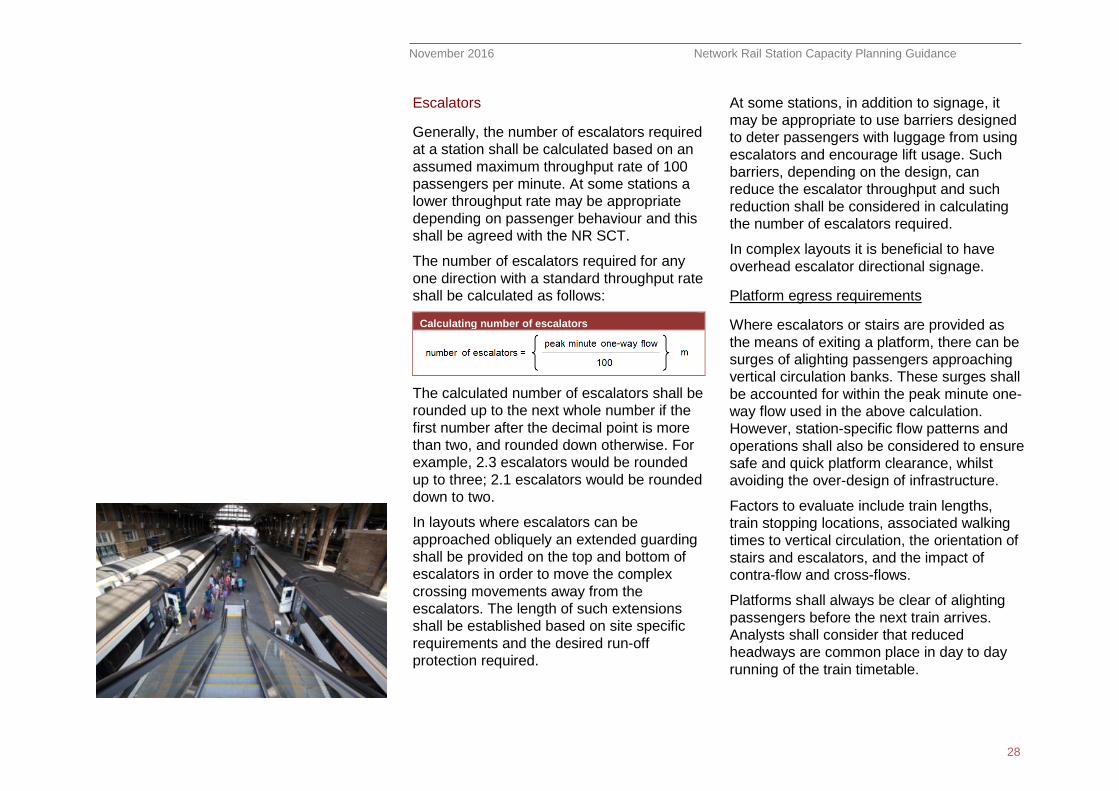
Escalators
Generally, the number of escalators required
at a station shall be calculated based on an
assumed maximum throughput rate of 100
passengers per minute. At some stations a
lower throughput rate may be appropriate
depending on passenger behaviour and this
shall be agreed with the NR SCT.
The number of escalators required for any
one direction with a standard throughput rate
shall be calculated as follows:
Calculating number of escalators
The calculated number of escalators shall be
rounded up to the next whole number if the
first number after the decimal point is more
than two, and rounded down otherwise. For
example, 2.3 escalators would be rounded
up to three; 2.1 escalators would be rounded
down to two.
In layouts where escalators can be
approached obliquely an extended guarding
shall be provided on the top and bottom of
escalators in order to move the complex
crossing movements away from the
escalators. The length of such extensions
shall be established based on site specific
requirements and the desired run-off
protection required.
At some stations, in addition to signage, it
may be appropriate to use barriers designed
to deter passengers with luggage from using
escalators and encourage lift usage. Such
barriers, depending on the design, can
reduce the escalator throughput and such
reduction shall be considered in calculating
the number of escalators required.
In complex layouts it is beneficial to have
overhead escalator directional signage.
Platform egress requirements
Where escalators or stairs are provided as
the means of exiting a platform, there can be
surges of alighting passengers approaching
vertical circulation banks. These surges shall
be accounted for within the peak minute one-
way flow used in the above calculation.
However, station-specific flow patterns and
operations shall also be considered to ensure
safe and quick platform clearance, whilst
avoiding the over-design of infrastructure.
Factors to evaluate include train lengths,
train stopping locations, associated walking
times to vertical circulation, the orientation of
stairs and escalators, and the impact of
contra-flow and cross-flows.
Platforms shall always be clear of alighting
passengers before the next train arrives.
Analysts shall consider that reduced
headways are common place in day to day
running of the train timetable.
November 2016 Network Rail Station Capacity Planning Guidance
29
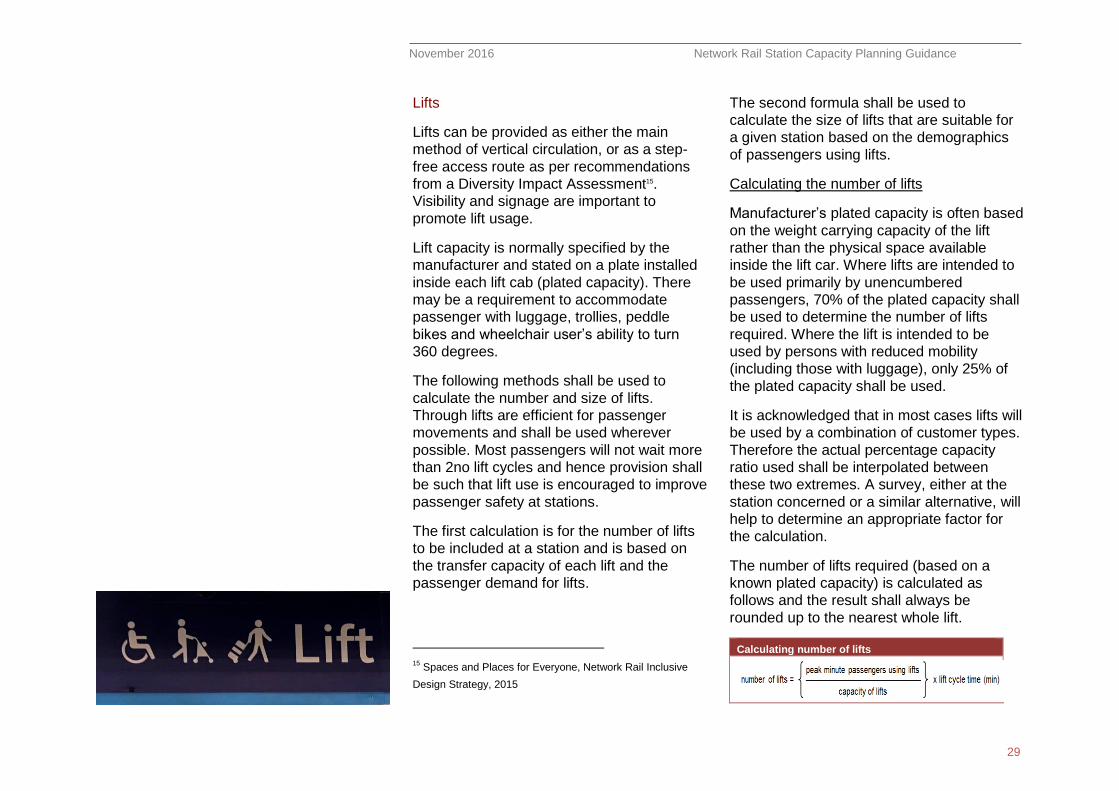
Lifts
Lifts can be provided as either the main
method of vertical circulation, or as a step-
free access route as per recommendations
from a Diversity Impact Assessment15.
Visibility and signage are important to
promote lift usage.
Lift capacity is normally specified by the
manufacturer and stated on a plate installed
inside each lift cab (plated capacity). There
may be a requirement to accommodate
passenger with luggage, trollies, peddle
bikes and wheelchair user’s ability to turn
360 degrees.
The following methods shall be used to
calculate the number and size of lifts.
Through lifts are efficient for passenger
movements and shall be used wherever
possible. Most passengers will not wait more
than 2no lift cycles and hence provision shall
be such that lift use is encouraged to improve
passenger safety at stations.
The first calculation is for the number of lifts
to be included at a station and is based on
the transfer capacity of each lift and the
passenger demand for lifts.
15
Spaces and Places for Everyone, Network Rail Inclusive
Design Strategy, 2015
The second formula shall be used to
calculate the size of lifts that are suitable for
a given station based on the demographics
of passengers using lifts.
Calculating the number of lifts
Manufacturer’s plated capacity is often based
on the weight carrying capacity of the lift
rather than the physical space available
inside the lift car. Where lifts are intended to
be used primarily by unencumbered
passengers, 70% of the plated capacity shall
be used to determine the number of lifts
required. Where the lift is intended to be
used by persons with reduced mobility
(including those with luggage), only 25% of
the plated capacity shall be used.
It is acknowledged that in most cases lifts will
be used by a combination of customer types.
Therefore the actual percentage capacity
ratio used shall be interpolated between
these two extremes. A survey, either at the
station concerned or a similar alternative, will
help to determine an appropriate factor for
the calculation.
The number of lifts required (based on a
known plated capacity) is calculated as
follows and the result shall always be
rounded up to the nearest whole lift.
Calculating number of lifts

November 2016 Network Rail Station Capacity Planning Guidance
30
Where: Peak Minute Passengers using Lifts is derived from the peak minute flow in the busiest direction of flow along the route served by the lift, multiplied by the proportion of people expected to use the lift. Capacity of Lifts is derived from the plated capacity multiplied by capacity ratio (as defined above).
Lift Cycle Time is the time in minutes for the lift to travel a complete cycle (including waiting time at each level).
Calculating the size of lifts
When calculating the required floor area of a
lift it is recommended that 0.45m2 per
unencumbered passenger is provided in the
lift cab.
This space provision shall be increased
proportionally for passengers with reduced
mobility, including those with luggage, up to
0.85m2 per passenger.
Figure 3.416 below shows the range of space
utilisation possible within a 16 person
capacity lift, between density values of 0.45
and 0.85m2 per passenger.
16
A standard wheelchair size of 0.8 x 1.2m has been
assumed here. The average passenger footprint of 0.4m x
0.6m (circa 0.3m2) is based on observations made at National
Rail stations and the average human ellipse as defined in
Pedestrian Planning and Design, John J. Fruin, Ph.D.
November 2016 Network Rail Station Capacity Planning Guidance
31
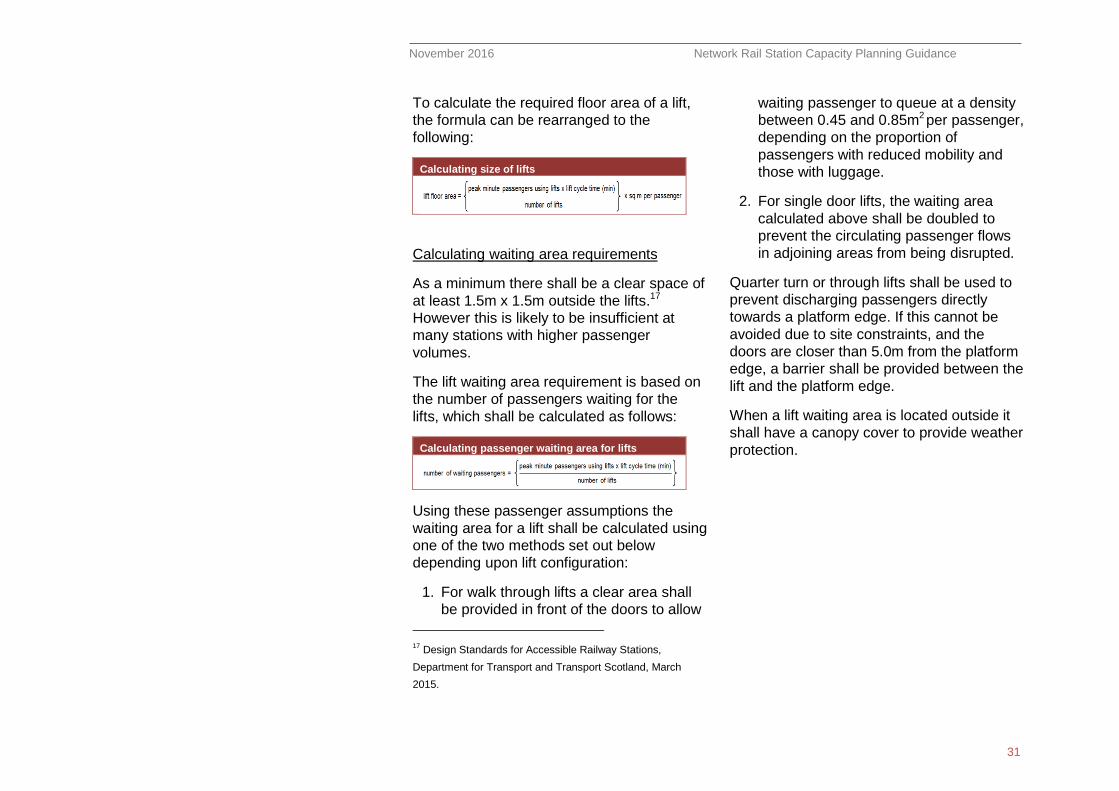
To calculate the required floor area of a lift,
the formula can be rearranged to the
following:
Calculating size of lifts
Calculating waiting area requirements
As a minimum there shall be a clear space of
at least 1.5m x 1.5m outside the lifts.17
However this is likely to be insufficient at
many stations with higher passenger
volumes.
The lift waiting area requirement is based on
the number of passengers waiting for the
lifts, which shall be calculated as follows:
Calculating passenger waiting area for lifts
Using these passenger assumptions the
waiting area for a lift shall be calculated using
one of the two methods set out below
depending upon lift configuration:
1. For walk through lifts a clear area shall
be provided in front of the doors to allow
17
Design Standards for Accessible Railway Stations,
Department for Transport and Transport Scotland, March
2015.
waiting passenger to queue at a density
between 0.45 and 0.85m2 per passenger,
depending on the proportion of
passengers with reduced mobility and
those with luggage.
2. For single door lifts, the waiting area
calculated above shall be doubled to
prevent the circulating passenger flows
in adjoining areas from being disrupted.
Quarter turn or through lifts shall be used to
prevent discharging passengers directly
towards a platform edge. If this cannot be
avoided due to site constraints, and the
doors are closer than 5.0m from the platform
edge, a barrier shall be provided between the
lift and the platform edge.
When a lift waiting area is located outside it
shall have a canopy cover to provide weather
protection.
November 2016 Network Rail Station Capacity Planning Guidance
32
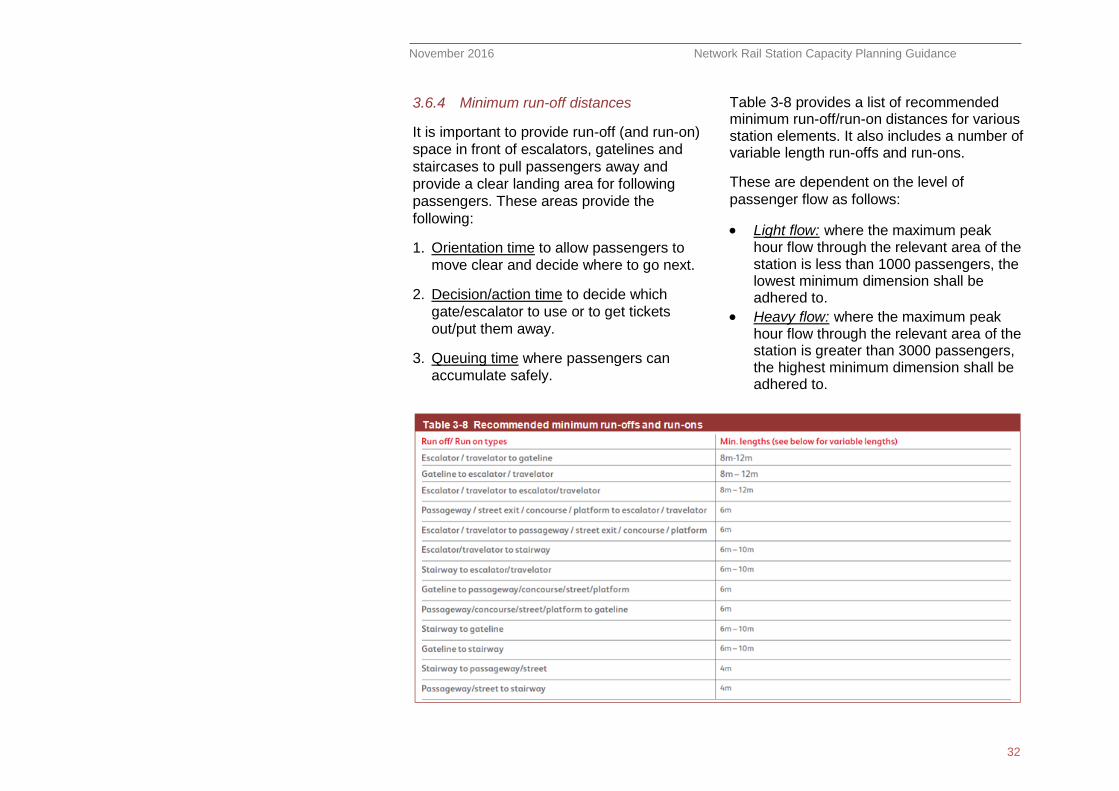
3.6.4 Minimum run-off distances
It is important to provide run-off (and run-on)
space in front of escalators, gatelines and
staircases to pull passengers away and
provide a clear landing area for following
passengers. These areas provide the
following:
1. Orientation time to allow passengers to
move clear and decide where to go next.
2. Decision/action time to decide which
gate/escalator to use or to get tickets
out/put them away.
3. Queuing time where passengers can
accumulate safely.
Table 3-8 provides a list of recommended minimum run-off/run-on distances for various station elements. It also includes a number of variable length run-offs and run-ons.
These are dependent on the level of
passenger flow as follows:
Light flow: where the maximum peak hour flow through the relevant area of the station is less than 1000 passengers, the lowest minimum dimension shall be adhered to.
Heavy flow: where the maximum peak hour flow through the relevant area of the station is greater than 3000 passengers, the highest minimum dimension shall be adhered to.
November 2016 Network Rail Station Capacity Planning Guidance
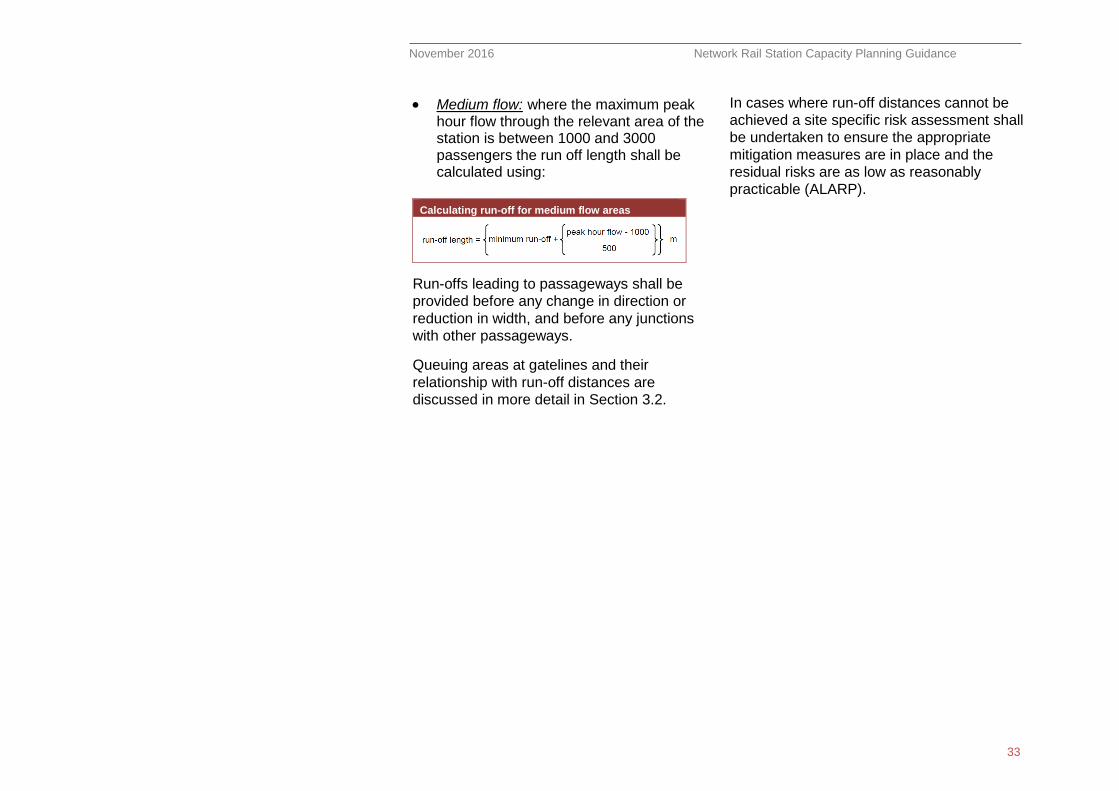
33
Medium flow: where the maximum peak hour flow through the relevant area of the station is between 1000 and 3000 passengers the run off length shall be calculated using:
Calculating run-off for medium flow areas
Run-offs leading to passageways shall be
provided before any change in direction or
reduction in width, and before any junctions
with other passageways.
Queuing areas at gatelines and their
relationship with run-off distances are
discussed in more detail in Section 3.2.
In cases where run-off distances cannot be
achieved a site specific risk assessment shall
be undertaken to ensure the appropriate
mitigation measures are in place and the
residual risks are as low as reasonably
practicable (ALARP).
November 2016 Network Rail Station Capacity Planning Guidance
34
4 Planning for Abnormal Conditions
It is important to ensure that stations continue to function acceptably during planned and unplanned events affecting train service, passenger demand or station layout.
The minimum space requirements outlined in
Section 3 relate to station performance
during “normal” conditions. However it is
important to ensure that a station continues
to function acceptably during various
abnormal scenarios. The temporary nature of
these scenarios lower the thresholds in terms
of acceptable density conditions and at the
same time ensure that passenger safety is
maintained (see Figure 1.1).
4.1 Perturbation
Service perturbation is defined as a
significant delay to trains, leading to
increased waiting in the station environment,
either on the platforms or the concourses.
The impact of service perturbation is different
for each station.
For termini and larger interchange stations,
perturbation represents a 15-minute delay to
one group of services (e.g. Main Line or
Relief Line), or in one direction (e.g. Up or
Down Line). For smaller stations perturbation
represents the cancellation of a train service.
For assessment purposes the busiest 15-
minute period and the busiest train service
respectively shall be used.
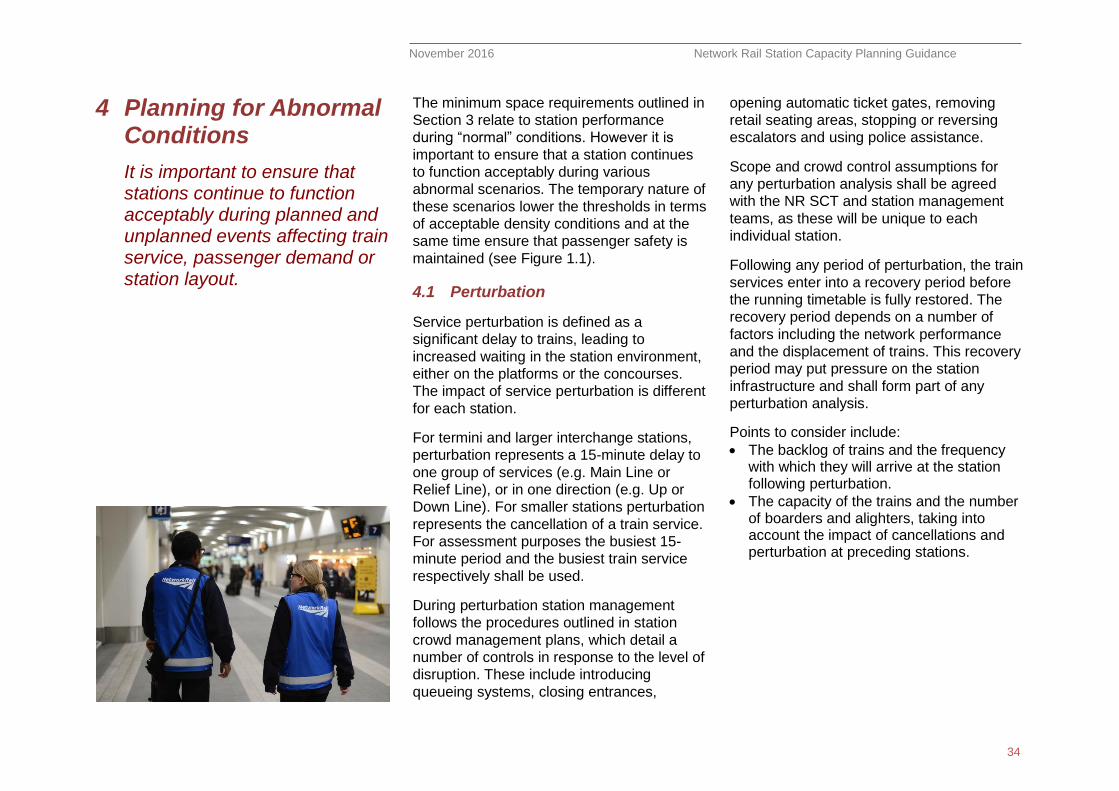
During perturbation station management
follows the procedures outlined in station
crowd management plans, which detail a
number of controls in response to the level of
disruption. These include introducing
queueing systems, closing entrances,
opening automatic ticket gates, removing
retail seating areas, stopping or reversing
escalators and using police assistance.
Scope and crowd control assumptions for
any perturbation analysis shall be agreed
with the NR SCT and station management
teams, as these will be unique to each
individual station.
Following any period of perturbation, the train
services enter into a recovery period before
the running timetable is fully restored. The
recovery period depends on a number of
factors including the network performance
and the displacement of trains. This recovery
period may put pressure on the station
infrastructure and shall form part of any
perturbation analysis.
Points to consider include:
The backlog of trains and the frequency with which they will arrive at the station following perturbation.
The capacity of the trains and the number of boarders and alighters, taking into account the impact of cancellations and perturbation at preceding stations.
November 2016 Network Rail Station Capacity Planning Guidance
35
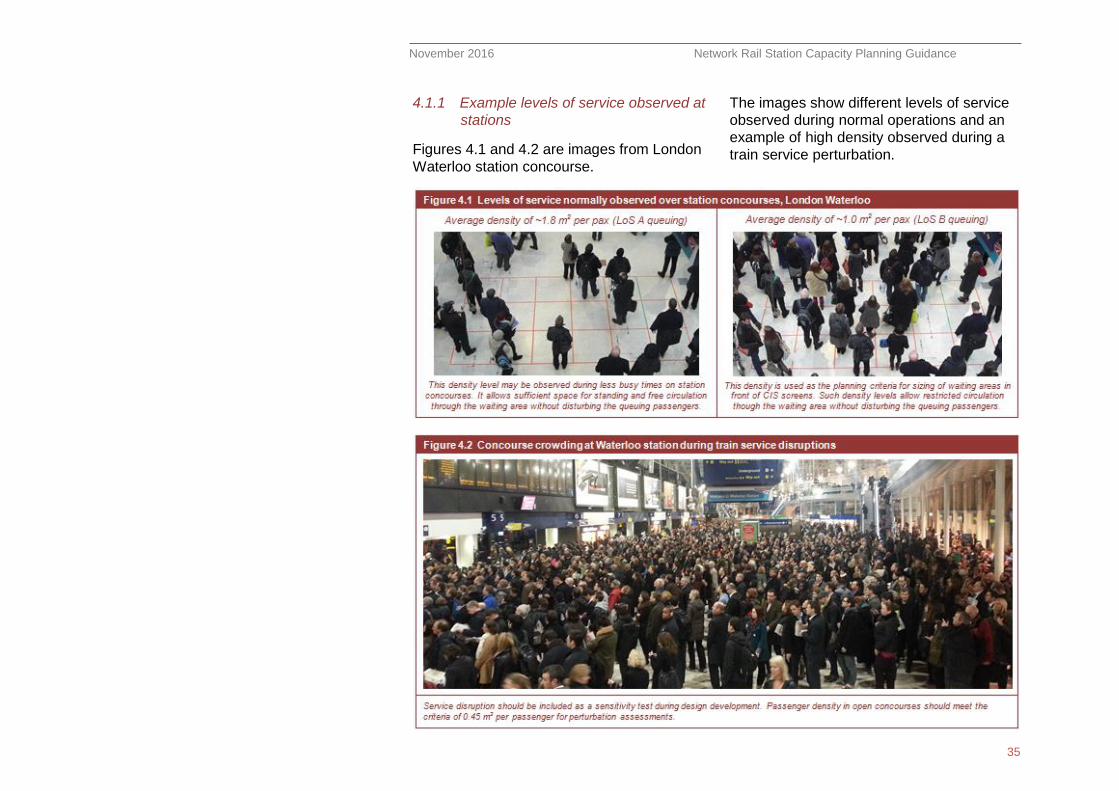
4.1.1 Example levels of service observed at
stations
Figures 4.1 and 4.2 are images from London
Waterloo station concourse.
The images show different levels of service
observed during normal operations and an
example of high density observed during a
train service perturbation.
November 2016 Network Rail Station Capacity Planning Guidance
36
4.2 Construction
Careful planning and management of
construction phasing is required to complete
project works on time whilst maintaining safe
and efficient station operations. The scope of
construction phasing scenarios shall be
agreed with the NR SCT, the project and
station management teams.
Of particular importance during temporary
construction works is the safety of
passengers during service perturbation and
emergency evacuation. During each
assessment the busiest time period for the
particular area in question shall be used.
4.3 Special events
Events taking place at or in the vicinity of
stations can lead to a temporary change in
passenger flows at stations and their
curtilage. A passenger count may need to be
carried out to estimate change in flows.
During special events station management
follows the procedures outlined in the station
crowd management plans. This specifies a
number of controls for ensuring passengers
can pass through the station safely and
quickly. Scope of any special event analysis
carried out shall therefore be agreed with the
NR SCT, the project and station
management teams.
4.4 Emergency evacuation
Emergency evacuations of all or part of a
station are required to meet standard escape
time. Evacuation may occur due to fire,
security reasons or overcrowding. Any
station design shall consider the following
two emergency scenarios:
4.4.1 Train on fire scenario
The evacuation load shall be assumed to
include the following:
Station occupancy at time of evacuation shall be based on peak usage, incorporating a five minute delay to the scheduled train service in the busiest direction only. The assumed five minute delay shall result in a build-up of passengers during the high peak, either on the concourse or platforms, depending on the station type. In this instance the busiest direction refers to the train service or platform that is used by the greatest volume of boarding passengers, so as to maximise the accumulation load.
In addition to the above all occupants of a crush-loaded train (on fire), plus those normally expected to alight from the next train in the other direction or any other lines, shall be evacuated.
November 2016 Network Rail Station Capacity Planning Guidance
37
A train service in its typical formation for the appropriate station or route shall be assumed to arrive crush loaded at the first platform. The next timetabled train service shall arrive into the station at the allocated platform. All passengers within the station and alighting from these two trains shall be evacuated in accordance with the individual station fire evacuation plan.
All exit routes can be counted as available for use and escalators continue to run as before the emergency.
The analysis shall not assume passengers passing along the platform or through the train past the source of a fire.
4.4.2 Fire within the station structure
The evacuation load shall be assumed to
include the following:
Occupancy at time of evacuation shall be based on peak usage with 5-minute delay to the scheduled train service in the busiest direction only.
This shall result in a build-up of passengers during the peak 15-minute period, either on the concourse or platforms, depending on the station type. In this instance the busiest direction refers to the train service or platform that is used by the greatest volume of
boarding passengers, so as to maximise the accumulation.
The exit route with the greatest capacity shall be discounted (as it could be blocked by fire).
This route shall be calculated based on the flow that can be achieved through each exit route, which is based on the width and flow rate per minute. Refer to Figure 1.1 for guidance on the flow rates to be used during evacuations.
Passengers waiting to board plus those normally alighting from the next train in each direction shall be evacuated.
The next two timetabled train services, during the peak 15-minute period, shall be assumed to arrive into the station at their allocated platforms. All passengers within the station and alighting from these two trains shall be evacuated in accordance with the station fire evacuation plan.
It is recognised that in some cases the timetable is unlikely to deliver two trains simultaneously. As a worse-case scenario it would be appropriate to adjust the arrival time of one of the services to coincide with the arrival of the other.
November 2016 Network Rail Station Capacity Planning Guidance
38
4.4.3 Emergency Evacuation Assessments
When carrying out emergency evacuation
assessments it is advised that a number of
scenarios are considered to stress test
various elements and areas of the station.
This shall be done in collaboration with the
project, station management team and the
Network Rail Fire Safety Engineer, in
accordance with the station fire evacuation
plan.
4.4.4 Maximum Evacuation Times
Where modification or refurbishments are
planned for an existing surface and sub-
surface railway station the following
maximum times shall be used to validate the
proposed design:
Surface platforms:
8 minutes for non-rafted platforms.
5 minutes for rafted platforms.
Additional evacuation time allowed through station concourse or to final exit:
2 minutes for rafted concourse with escape in one direction only.
3 minutes for rafted concourse with escape in more than one direction.
3 minutes for non-rafted concourse with escape in one direction only.
4 minutes for non-rafted concourse with escape in more than one direction.
Sub-surface platforms:
4 minutes to evacuate platforms.
Additional 2 minutes to reach protected route.
4.4.5 Fire Engineered Solution
There may be instances where existing
platforms cannot meet the evacuation times
given above because of existing architectural
constraints such as stairway and subway
widths. In such cases the following guidance
is applicable.
Where any fire engineered approach is to be
considered the evacuation assessment shall
be based on the Actual Safe Evacuation
Time (ASET) against the Required Safe
Evacuation Time (RSET).
In most cases, it will be loss of visibility due
to the spread of smoke that determines the
initial threat to life and consequently the
available safe egress time (ASET).
RSET represents the time taken (from
ignition) for all of the occupants to reach a
place of safety.
The tenability criteria used for this
assessment and the margin of safety must
be agreed with the Network Rail Fire Safety
Engineer.
November 2016 Network Rail Station Capacity Planning Guidance
39
5 Station Performance Categorisation
All assessments shall rate the performance of stations with respect to the scenarios analysed.
5.1 Station performance categorisation
In some cases one or more station elements
may impede the circulation of passengers if
the core requirements defined in this
document are not correctly met. This can
have a direct impact on public safety and
train performance. These risks shall be
articulated by the analysts using the analysis
outputs e.g. high passenger density near
platform edge or high density on stairs that
may result in in slip, trips and falls.
Analysts shall rate the performance of a
station design based on the assumed
passenger demand scenarios and different
train timetables, as relevant. The station
design performance rating shall be based on
the following categories:
Normal – Applicable where sizing of
individual station elements is such that the
overall station is expected to operate with
minimal management interventions and no
residual risks have been identified to
passenger safety or train performance.
Abnormal – If the sizing of individual station
elements is such that parts of the station
regularly needs planned management
interventions to reduce the risks to
passenger safety and train performance. If it
is not possible to improve the situation
through design then a risk assessment shall
be undertaken to verify that the residual risks
are within ALARP level after implementing
any mitigation measures.
Degraded – In cases where the sizing of
station infrastructure is such that regular
management interventions fail to reduce the
safety and train performance risks. Here,
further disruptive measures are necessary.
These may include; changes to the train
timetable, altering train lengths, diverting
passengers to other stations or partial station
closures. In such cases immediate mitigation
measures are required to temporarily reduce
the identified risks down to an ALARP level
until effective design and operational
interventions can be made to move into
‘normal’ or ‘abnormal’ categories.
Emergency – This is a hypothetical situation
where the safety and train performance risks
cannot be reduced even after introducing any
reasonable mitigation measures. Such a
situation should never be realised because
Network Rail’s Long Term Planning Process
will ensure a periodic review of station
environments and actively seek funding to
deliver station enhancements.
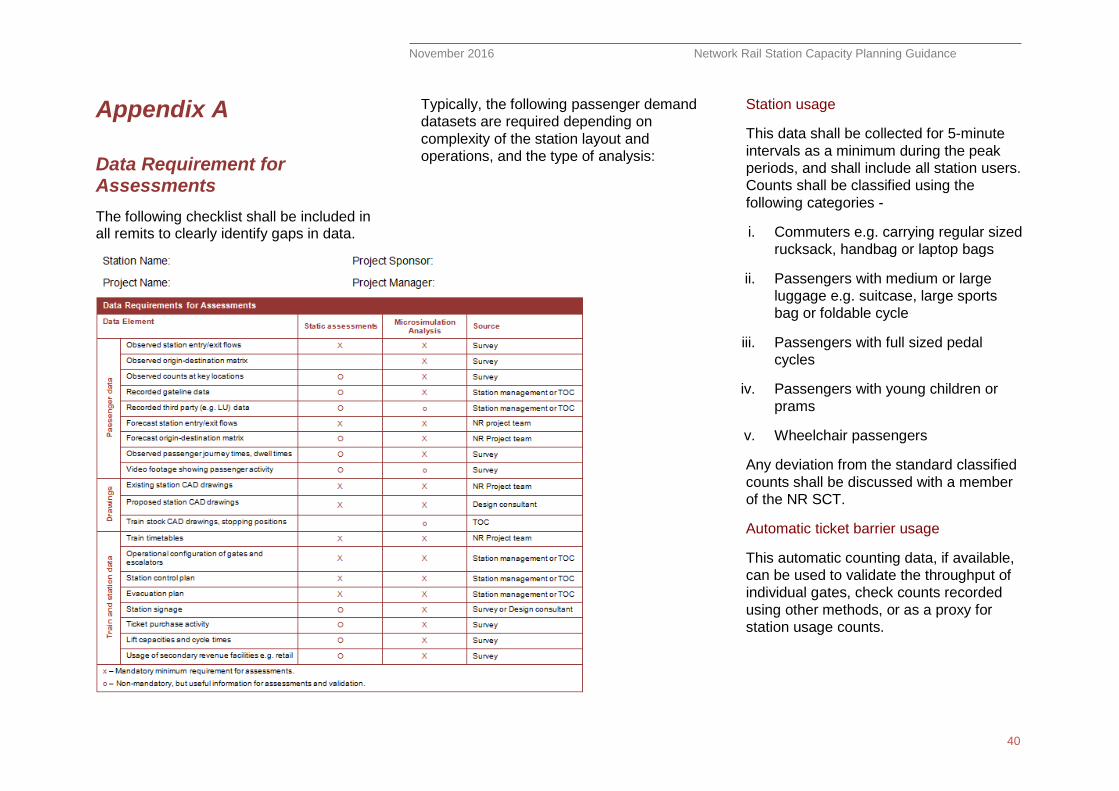
November 2016 Network Rail Station Capacity Planning Guidance
40
Appendix A
Data Requirement for Assessments
The following checklist shall be included in all remits to clearly identify gaps in data.
Typically, the following passenger demand
datasets are required depending on
complexity of the station layout and
operations, and the type of analysis:
Station usage
This data shall be collected for 5-minute
intervals as a minimum during the peak
periods, and shall include all station users.
Counts shall be classified using the
following categories -
i. Commuters e.g. carrying regular sized
rucksack, handbag or laptop bags
ii. Passengers with medium or large
luggage e.g. suitcase, large sports
bag or foldable cycle
iii. Passengers with full sized pedal
cycles
iv. Passengers with young children or
prams
v. Wheelchair passengers
Any deviation from the standard classified
counts shall be discussed with a member
of the NR SCT.
Automatic ticket barrier usage
This automatic counting data, if available,
can be used to validate the throughput of
individual gates, check counts recorded
using other methods, or as a proxy for
station usage counts.
November 2016 Network Rail Station Capacity Planning Guidance
41
Origin and destination pairing
This data can be gathered by various
methods including: ‘colour card’ survey,
interviews, ‘people following’, video
analytics or by using more advanced
methods that rely on technology to track
devices that passengers carry with them
i.e. mobile phones and tablet devices.
Peak one minute flow
This shall be used to understand the
concentration of flow in different areas of
station; e.g. flow on stairs, passageways
and through ticket barriers.
Counts at other key locations
These shall be recorded for 5-minute
intervals during peak times and can be
used to validate routing of passengers
within stations; e.g. counts at stairs,
passageways, escalators and ticket gates.
Train usage
Some platforms may be served by multiple
train services with different loadings.
Furthermore, there may be a bias towards
the use of certain train carriages (e.g. car
5 could be more attractive due to the
position of stairs at the station).
This may vary by train service and time of
day. Boarding and alighting data can be
collected using manual survey or
advanced methods such as video
analytics or passengers tracking.
Journey time
These measurements shall be made
during free flow conditions in order to
benchmark unimpeded journey times
experienced by passengers. This can be
used to calculate the delay caused by
congestion and support business case
development.
Passenger behaviour
Video footage recorded at different
locations can be very useful to understand
behavioural characteristics of passengers
that may be specific to a station
environment.
Train operations
The actual train arrival, departure and
dwell times shall be recorded. In case of
stations where passengers wait in a
concourse area away from the platforms,
the boarding announcement time shall
also be observed. Appendix E includes an
example of train timetable information that
is available from the TOC or Network Rail.
Train rolling stock
At some stations, train services using different rolling stock may call at the same platform and this may vary by time of day (i.e. peak and off-peak services using different rolling stock). Train stopping locations shall be observed for different services and type of rolling stock. Note that the number of doors per carriage, width of each door, number of seats and standing capacity may vary depending on the type of rolling stock.
Platform occupancy
At many stations platforms can be used by trains serving different routes. At such stations passengers dwell on the platform for the first, second or subsequent services departing from the same platform. At such stations platform occupancy shall be recorded to include in capacity calculations for platform width and canopy sizing. This data can be collected by video analysis with a count at set intervals or before and after every train departure. Alternatively passenger tracking can be used if deemed appropriate.
November 2016 Network Rail Station Capacity Planning Guidance
42
Appendix B
Documentation and Deliverables
It is important that all assumptions, demand data, analysis, outputs and recommendations are reported in a clear and succinct manner.
The following reports shall be produced for
a station capacity assessment depending
upon the method of analysis used.
Baseline report including site visit
notes and survey observations
Model validation report in case of
microsimulation analysis
Capacity assessment report
Audit report
Baseline report
All observations and information gathered
from the initial site visit and survey shall be
summarised in a Baseline report. The
findings of this study may have an impact
on the type and scope of the assessment.
It is recommended for major station
redevelopment schemes, a standalone
baseline study shall be undertaken.
Model validation report
Validation is a process of confirming that a
microsimulation model accurately reflects
reality, and involves comparing simulated
outputs from the current situation or Base
Year with real life observations and other
survey data.
Model validation is a default requirement
when undertaking microsimulation
analyses for Network Rail. Deviation from
this requirement shall be discussed and
agreed with the NR SCT.
A base year model shall always be
validated when the microsimulation is
being undertaken for an existing station.
The microsimulation model is considered
validated if the variations between
simulated outputs and on-site
observations (or survey) are less than
10%. If the variations are greater than
10% then the reasons for this shall be
investigated and discussed with the NR
SCT. If necessary, the base model shall
be revised to achieve the best validation
that is practically possible.
A validation study shall cover the
following:
Visual validation
This is the initial step where the animated
videos from a microsimulation model are
compared with real life video footage or
photographs. The animation of simulated
passenger movements is run to check for
any obvious inconsistencies in routing,
behaviour and passenger volumes.
Passenger densities observed in real life
shall be compared against the simulated
congestion levels e.g. cumulative mean
density and corresponding Fruin LoS.

November 2016 Network Rail Station Capacity Planning Guidance
43
Origin-Destination and cordon count
checks
The surveyed counts and input demand
matrices shall be compared against the
output origin-destination matrix and cordon
counts at specific locations. This is to
confirm that the passenger volumes and
route choice have been accurately
simulated in the model.
Journey time comparison
The simulated journey times on key routes
shall be compared against the observed
journey times in free-flow and crowded
conditions. This is to ensure confidence in
the simulated passenger behaviour in the
model.
Flow-rate comparison
The simulated flow-rates on stairs and
along passageways shall be compared
with the on-site observations. This is to
ensure confidence in simulated walk
speeds and passenger behaviour.
Capacity assessment report
This is the main deliverable for a station
capacity assessment. This report shall
clearly explain the key assumptions,
passenger demand, station layout and
operations being assessed.
A good capacity assessment report shall
include the relevant analysis outputs (see
Appendix C and D) and recommendations
for the design and operations team for NR
to pursue.
Station designs shall be categorised
based on Section 5.1 in relation to the
different passenger demand and train
timetable scenarios considered in the
analysis.
Any areas of non-compliances with
industry standards and planning criteria
stipulated here shall be clearly highlighted
in reports and suitable design solutions
shall be implemented or recommended.
Other operational mitigation measures
shall only be recommended where there is
no feasible design solution. In such cases
longevity of operational controls and
residual risks shall be clearly stated.
Audit report
The following items shall be covered within
an audit:
Suitability of demand data and other
operational assumptions
Accuracy of passenger and train data,
and other modelling assumptions
Compliance with general industry best
practice methods for model
development
Check if relevant scenarios have been
assessed
Accuracy and relevance of the range
of modelling outputs included in the
report
It is recommended that a structured audit
checklist is used and shall be relevant to
the chosen method for capacity analysis.
In some cases external audit of
microsimulation models and reports may
be necessary. The NR SCT will identify
when such an external audit is required.
November 2016 Network Rail Station Capacity Planning Guidance
44
Appendix C
Presentation of Outputs
The analysis requirements will be defined clearly in the remit. The following outputs are generally useful depending upon the type of analysis undertaken.
Static analysis outputs
The outputs that can be derived from a
spreadsheet based static analysis include:
Gatelines
Number of gates in a gateline, configuration of gates for various scenarios (entry / exit), time to process peak demand and minimum run-off.
Concourse
Sizing of concourse space and CIS accumulation areas, density at peak times.
Stairs and passageways
Clear width required for peak passenger demand, density and flow-rate at peak times, journey time along stair or passageway for free-flow and crowded conditions.
Lifts
Size of lifts and waiting area in front of doors, number of lifts required based on passenger demand, lift capacity and cycle time, average waiting times during peak periods.
Escalators
Number of escalators, minimum run-on and run-offs, operational configuration for various scenarios (up / down) based on passenger demand, peak flow-rate.
Platforms
Width of platforms and platform extensions, density at peak times, location of platform furniture, canopy length, and platform clearance time after peak train arrival.
Evacuation times
Using specified walking speeds and evacuation flow-rates through different areas of the station.
Microsimulation analysis outputs
Typically the following outputs can be derived from a microsimulation model of passenger movement in addition to the actual animation of passenger movement in 2D or 3D format. Outputs that are most relevant to a project or study shall be presented in a capacity assessment report.
Gatelines
Peak 5-minute maps showing mean density based on Fruin queuing LoS scale.
Flow-rates during peak periods to show the maximum and average throughput that is simulated in the models. In most cases, the throughput of individual gates shall be capped at 25ppm per gate (see section 3.2 for different types of gates used on the network).
November 2016 Network Rail Station Capacity Planning Guidance
45
Simulated gateline clearance times shall be presented as a histogram (see Figure C1).
Concourse
Peak 15-minute maps showing mean density based on Fruin walkways LoS scale. A smaller time interval may be used at some stations to assess performance in greater detail.
Space utilisation maps to highlight the heavily used areas and paths, and under-utilised areas.
Average and maximum journey times between all different locations during the peak periods. Journey times presented as histograms between each origin and destination pair.
Stairs and passageways
Peak 5-minute maps showing mean density based on Fruin stairway and walkway LoS, as applicable on the stairs and along passageways.
Peak 5-minute mean density maps showing Fruin queuing LoS at the top and bottom of stairs.
Maximum and average flow-rate simulated on stairs and along passageways.
Average and maximum journey times on stairs and along passageways during the
peak periods. Journey times may be presented as histograms.
Lifts
Peak 5-minute mean density maps showing Fruin queuing LoS in the waiting area in front of the lift doors.
Maximum and average number of passenger queuing for the lifts in a simulation.
Maximum and average transfer time between different levels including waiting time.
Escalators
Maximum and average flow-rate simulated on escalators.
Platforms
Peak 5-minute mean density maps showing Fruin walkway LoS over platforms and peak 15-minute mean density maps showing queuing LoS.
Maximum and average waiting times for passenger on platforms in a simulation. This may be as a histogram for each train service, if required.
Maximum and average platform clearance time for alighting passengers in the simulation. This shall be measured from the train doors to the platform exit.
Emergency egress analysis Evacuation maps showing the length of time taken by the last person to clear different areas of a station.
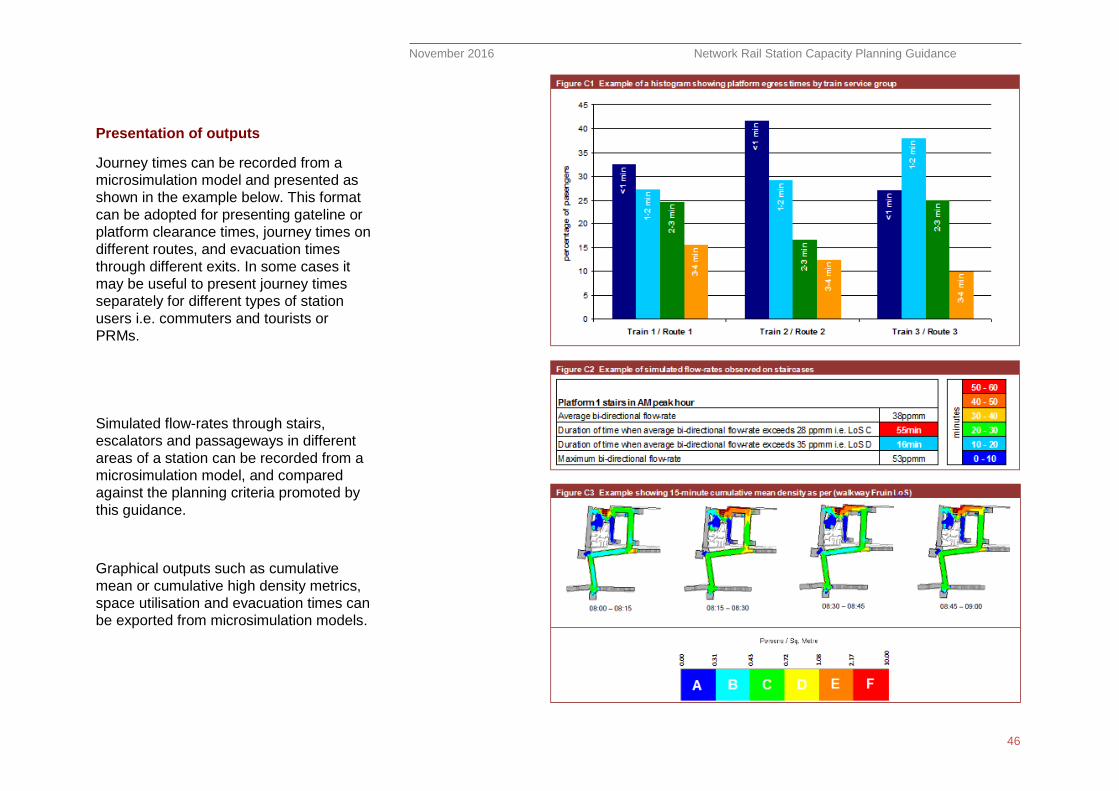
November 2016 Network Rail Station Capacity Planning Guidance
46
Presentation of outputs
Journey times can be recorded from a
microsimulation model and presented as
shown in the example below. This format
can be adopted for presenting gateline or
platform clearance times, journey times on
different routes, and evacuation times
through different exits. In some cases it
may be useful to present journey times
separately for different types of station
users i.e. commuters and tourists or
PRMs.
Simulated flow-rates through stairs,
escalators and passageways in different
areas of a station can be recorded from a
microsimulation model, and compared
against the planning criteria promoted by
this guidance.
Graphical outputs such as cumulative
mean or cumulative high density metrics,
space utilisation and evacuation times can
be exported from microsimulation models.
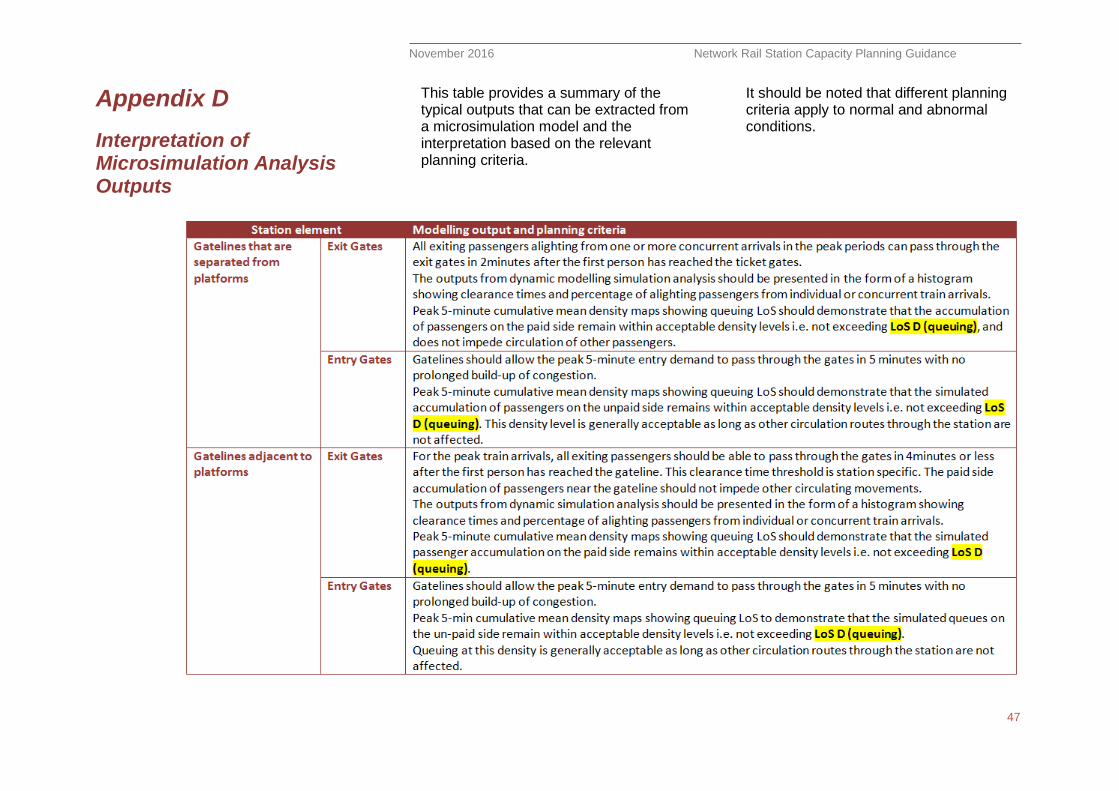
November 2016 Network Rail Station Capacity Planning Guidance
47
Appendix D
Interpretation of Microsimulation Analysis Outputs
This table provides a summary of the typical outputs that can be extracted from a microsimulation model and the interpretation based on the relevant planning criteria.
It should be noted that different planning criteria apply to normal and abnormal conditions.
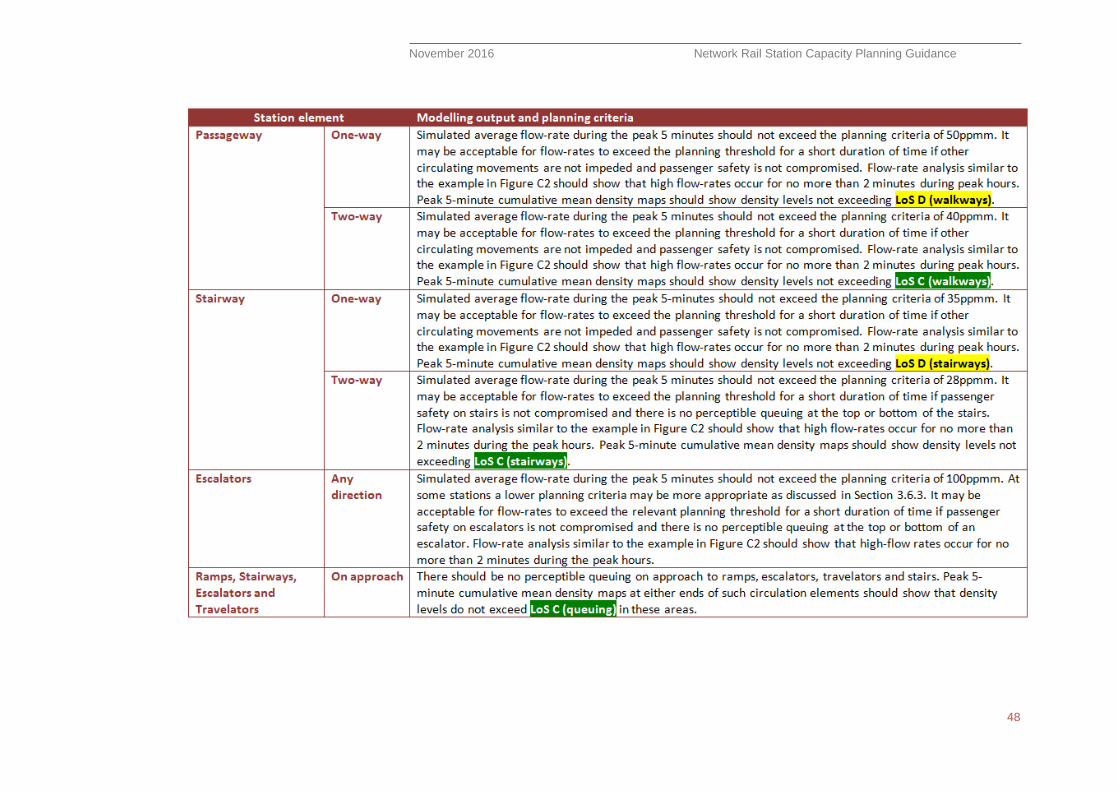
November 2016 Network Rail Station Capacity Planning Guidance
48

November 2016 Network Rail Station Capacity Planning Guidance
49
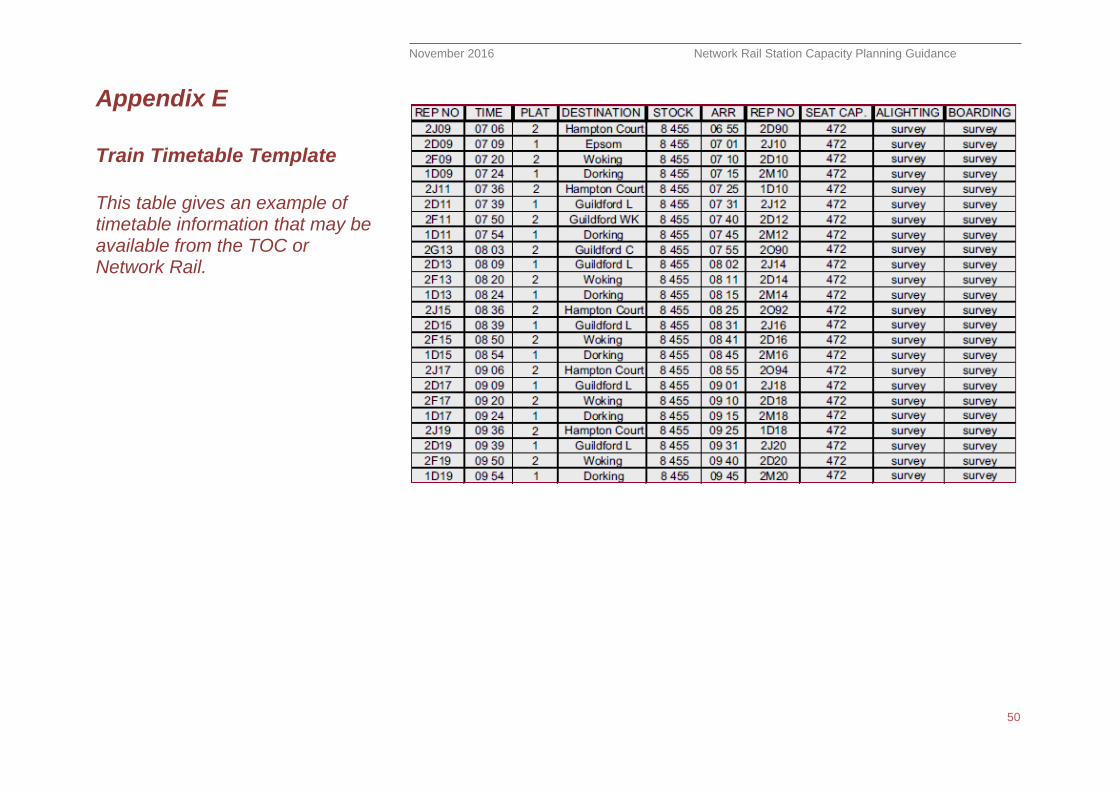
November 2016 Network Rail Station Capacity Planning Guidance
50
Appendix E
Train Timetable Template
This table gives an example of timetable information that may be available from the TOC or Network Rail.
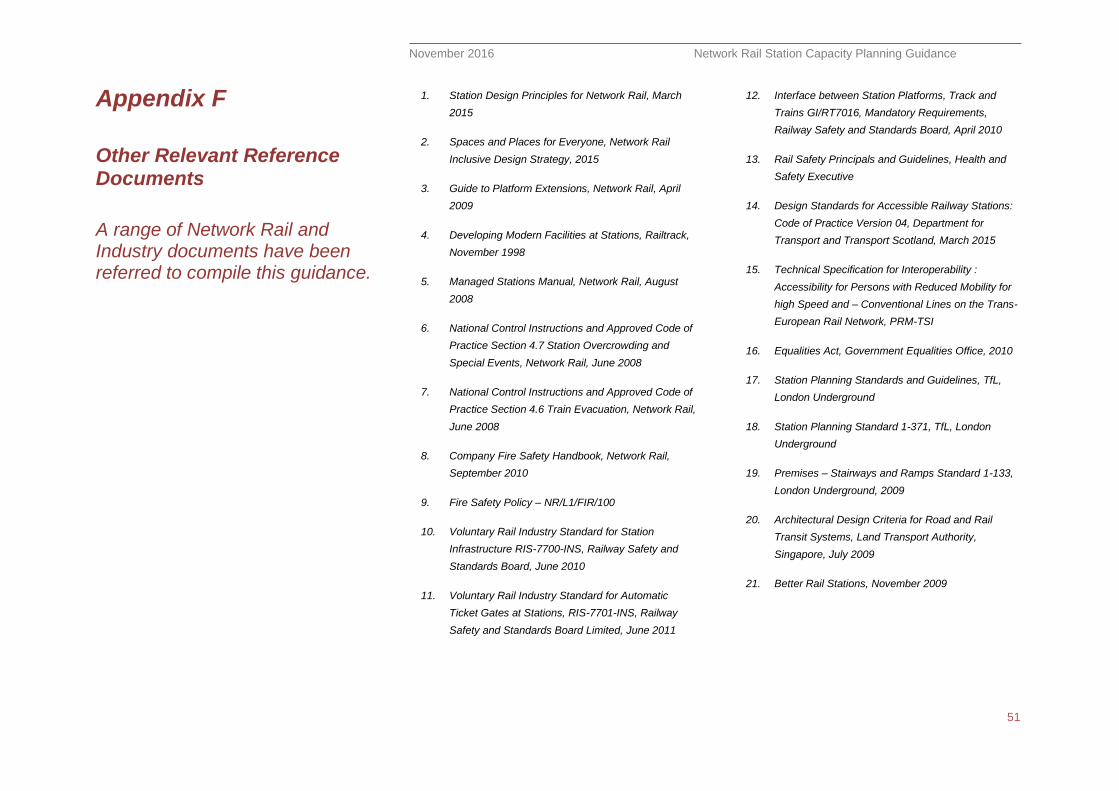
November 2016 Network Rail Station Capacity Planning Guidance
51
Appendix F
Other Relevant Reference Documents
A range of Network Rail and Industry documents have been referred to compile this guidance.
1. Station Design Principles for Network Rail, March
2015
2. Spaces and Places for Everyone, Network Rail
Inclusive Design Strategy, 2015
3. Guide to Platform Extensions, Network Rail, April
2009
4. Developing Modern Facilities at Stations, Railtrack,
November 1998
5. Managed Stations Manual, Network Rail, August
2008
6. National Control Instructions and Approved Code of
Practice Section 4.7 Station Overcrowding and
Special Events, Network Rail, June 2008
7. National Control Instructions and Approved Code of
Practice Section 4.6 Train Evacuation, Network Rail,
June 2008
8. Company Fire Safety Handbook, Network Rail,
September 2010
9. Fire Safety Policy – NR/L1/FIR/100
10. Voluntary Rail Industry Standard for Station
Infrastructure RIS-7700-INS, Railway Safety and
Standards Board, June 2010
11. Voluntary Rail Industry Standard for Automatic
Ticket Gates at Stations, RIS-7701-INS, Railway
Safety and Standards Board Limited, June 2011
12. Interface between Station Platforms, Track and
Trains GI/RT7016, Mandatory Requirements,
Railway Safety and Standards Board, April 2010
13. Rail Safety Principals and Guidelines, Health and
Safety Executive
14. Design Standards for Accessible Railway Stations:
Code of Practice Version 04, Department for
Transport and Transport Scotland, March 2015
15. Technical Specification for Interoperability :
Accessibility for Persons with Reduced Mobility for
high Speed and – Conventional Lines on the Trans-
European Rail Network, PRM-TSI
16. Equalities Act, Government Equalities Office, 2010
17. Station Planning Standards and Guidelines, TfL,
London Underground
18. Station Planning Standard 1-371, TfL, London
Underground
19. Premises – Stairways and Ramps Standard 1-133,
London Underground, 2009
20. Architectural Design Criteria for Road and Rail
Transit Systems, Land Transport Authority,
Singapore, July 2009
21. Better Rail Stations, November 2009
November 2016 Network Rail Station Capacity Planning Guidance
DOCUMENT IDENTITY
Network Rail Station Capacity Planning Guidance AUTHORISATION CONTROL
Author Approver
Shravan Patel
Senior Station Capacity Planner
Isabelle Milford
Station Capacity Manager
REVISION CONTROL
Version Date Description of changes
1.0 May 2011 First Issue
2.0 November 2016
Formulae updated for gatelines, platforms, lifts and canopy lengths. Clarity on other design considerations for escalators, overhead signage, planning thresholds, interpretation of dynamic analysis outputs and constrained flow concepts to prevent over deign. Updates relating to changes in industry standards and codes of practice. Re-write to improve usability.