statistical analysis of grain–size characteristics of
TRANSCRIPT

American Journal of Earth Sciences 2019; 6(1): 1-13
http://www.openscienceonline.com/journal/ajes
ISSN: 2381-4624 (Print); ISSN: 2381-4632 (Online)
Statistical Analysis of Grain–Size Characteristics of Streambed Sediments in River Catchments of the Lake Tana Basin, Northwest Ethiopia
Veeranarayana Balabathina1, *
, Ravi Kumar Kandula2
1Department of Geology, College of Natural & Computational Sciences, University of Gondar, Gondar, Ethiopia 2Department of Geology, College of Science & Technology, Andhra University, Waltair, India
Email address
*Corresponding author
To cite this article Veeranarayana Balabathina, Ravi Kumar Kandula. Statistical Analysis of Grain–Size Characteristics of Streambed Sediments in River
Catchments of the Lake Tana Basin, Northwest Ethiopia. American Journal of Earth Sciences. Vol. 6, No. 1, 2019, pp. 1-13.
Received: December 1, 2018; Accepted: December 19, 2018; Published: March 6, 2019
Abstract
This paper presents a statistical analysis of grain-size distributions in the samples of bed-material load sediments from the
Megech, Reb, Gumara, Gilgel Abbay, and Tana West rivers in the drainage basin area of lake Tana. In this study thirty one
streambed sediment samples were collected from these five river’s catchment areas. Grain size analysis was performed and
descriptive statistics for the grain-size parameters (mean size, sorting, skewness, and kurtosis) have been computed. Data were
analyzed by a range of grain size data analysis methods, such as correlation (Pearson’s correlation), bi-variant scatter plots,
box-plots, cumulative probability curves and C-M plots to reveal the effect of controlling variables upon the grain size spatial
pattern. Multivariate statistical analysis methods, such as One-way ANOVA, Linear regression analysis and Student’s t-test
were also used to discriminate within and between different catchment areas of lake Tana. The statistical analysis indicated that
grain-size variations among different river catchments are statistically significant while there is no significant variation within
a particular catchment except for the Megech and Gilgel Abbay, and also revealed that there is no statistically significant
variation in sediments between two adjacent river catchments of the lake except between Megech and Reb, and Megech and
Tana West. These variations may be attributed to various variables like drainage density, lithology, diversity of the sources of
the sediments, physiographic setting, lateral distance to lake and transport dynamics. Field evidence from this study suggests
that variables controlling within river catchment grain-size variability are strongly site specific.
Keywords
Catchment Areas, Grain-Size Distribution, Cumulative Curves, Statistical Analysis
1. Introduction
Sandy fluvial systems with their sediment transport and
deposition features in different settings, particularly in
highland areas, are dynamic and sensitive parts of lake basin
environment. Natural and anthropogenic factors often
produce changes in their conditions. Understanding how
grain-size distributions relate to these is important both in
modern systems and about ancient deposits. Grain-size
analysis, therefore, provides important clues to the sediment
provenance, transport history and depositional conditions [1-
3]. Hence, studying the grain-size distribution is important
for monitoring watershed impacts and changes in stream
habitat [4]. The grain-size statistical parameters such as mean
size, sorting, skewness, and sorting are useful to describe
grain-size distribution of the sediments. These parameters
also form the basis of many schemes for characterization of
sediments and in classifying sedimentary environments [5].
There are many methods for quantifying grain-size data and
presenting them in a graphical or statistical form as well

2 Veeranarayana Balabathina and Ravi Kumar Kandula: Statistical Analysis of Grain–Size Characteristics of
Streambed Sediments in River Catchments of the Lake Tana Basin, Northwest Ethiopia
more sophisticated multivariate statistical techniques have
been explored [6].
As there were no previously published granulometric
studies on the streambed sediments of the drainage basin of
lake Tana, the present study is intended to contribute to the
understanding of streambed sediment characterization and
to the general knowledge of sediment deposition patterns in
river catchments of the lake basin. Therefore, the current
study was focused on investigating the variations among
catchments of the lake Tana basin using grain-size
statistical parameters of various streambed material load
sediments. The main objectives of this work was to
interpret the mechanisms of sediment deposition by
applying comprehensive statistical analysis of sediment
grain-size distributions using various methods such as bi-
variant scatter plots, box-plots, probability accumulation
graphsand CM plots. Multivariate statistical analyses were
also used to find out intra- and inter-catchment variations of
grain sizes.
2. Study Area
Lake Tana, the largest fresh water lake in Ethiopia, is
located in a depression of the northwestern highlands of
Ethiopian plateau at an elevation of about 1800m (m.a.s.l)
(Figure 1). It is nearly a circular basin of 70km in
diameter [7]. It was formed by recent volcanic activity (a
volcanic blockage) related to a set of north-south faults,
known as the Lake Tana Rift [8-10]. This basin represents
a proto-rift west of the present East African Rift System
[11], associated with the oldest volcanic rocks. Lake Tana
presently having a surface area of 3,250 km2 and volume
of 28 km3, is relatively a smaller than the other East
African Great Lakes. The lake is surrounded by a
relatively small drainage basin of only four times of its
surface area, which is a sub-basin of the Abbay River, one
of the major river basins of Ethiopia. The Tana lake basin
drains 13750 km² of very broken and mountainous terrain,
with uplands and valleys, and is surrounded by occasional
rocky peaks with a total relief exceeding 4000 m which
are of volcanic origin (Figure 2). A little of the basin
draining to the lake is above 2575 m but rises to nearly
4000 m to the northeast, east and southeast. The total
annual runoff yield of the lake watershed is about 6.9
x109m
3 [12].
The lake has many tributaries that rise on the Ethiopian
plateau and major inflows to the lake that include the rivers
Gilgel Abbay (from the south), Megech (from the north) and,
Rib and Gumara rivers (from the east) with a high and
perennial, but highly seasonal, runoff [13]. More than 40
seasonal streams most of which are located in the west of
lake Tana also feed the lake with trivial runoff yield that
depends mostly on the local climate.
The alternating dry and rainy seasons result in difference
of runoff between the lowest (May-June) and the highest
(October-November). A typical radial drainage pattern is
observed around the lake basin that has provided a possible
site for storage to centripetal drainage pattern. The study
area is totally covered by volcanic rocks in the form of
composite volcanoes mainly alkaline basalts, trachytes and
phonolites (Figure 3). The runoff in the hilly catchments of
the lake Tana basin is characterized by significant spatial
variations, in terms of drainage density, topography,
lithology, land use, and rainfall which were found to affect
the runoff depth and runoff coefficients in the lake Tana
basin [14].
Figure 1. Location of study area.

American Journal of Earth Sciences 2019; 6(1): 1-13 3
Figure 2. Elevation and Drainage network of Lake Tana.
Figure 3. Geology map of study area.
3. Methods and Materials
In late 2017, thirty one sediment samples of bed-material
load were collected from the mobile streambeds in the
catchment areas of the rivers namely, Megech (11 samples),
Rib (5 samples), Gumara (5 samples), Gilgel Abbay (5
samples), and Tana West (5 samples). The sample locations
are shown in Figure 4. In order to ensure the quality of the
results, samples were collected from unmodified non-
depositional regions of streambeds in the basin which, in
general, were low in the fine-grained materials (less than 5%
of <60 µm over this area). Bed-load samples were skimmed
directly from the bed surfaces and collected into a plastic
sample container by using a grab sampler.
All bed-load sediment samples were dried and sieved
using 0.5phi intervals from -3.5 to +4.0 phi for grain-size
analysis. The grain-size data obtained were used to calculate
the grain-size statistical parameters such as mean size,
sorting, skewness, and kurtosis. The graphical computational
method of Folk and Ward (1957) was used for determination
of statistical size parameters. The statistical analysis results
and graphical representations of the data were performed by
using Gradistat software 8.0 [15] and SPSS 20. SPAN index
is calculated by the percentile (D10, D50 and D90) values
from the grain-size distribution to assess the relative
contribution of either the coarse or the finer granular
components. The graphical representations such as Box-plots
for determining the range of average grain- size parameters,
Bi-variant scattergraphs between mean size vs. sorting, mean
size vs. skewness, and sorting vs. skewness for understanding
the relationship between different grain-size parameters, CM
plots for relating the grain-size characteristics of the
sediments to the processes of their deposition and sediment
transport patterns, and trivariant plots for determining the
relationship between gravel-sand-mud from the bed-load
samples, and frequency curves, cumulative curves,
cumulative probability distribution graphs were prepared to
discriminate various parameters. In an attempt to better
understand how grain- size characteristics can vary within
and among river catchments of lake Basin, the results were
statistically analyzed using various statistical applications
like One-way Analysis of Variance (ANOVA), Linear
regression analysis, and Student’s t-test.
The SRTM Digital Elevation Model (DEM) data were
used to extract the drainage network of the lake Tana basin
and the drainage channels on the basis of which they were
classified into three orders. The boundary of the basin as well
as of the major river catchment areas were created from
topographic maps using GIS. The elevation and slope maps
were generated from the fine resolution DEM. Digital terrain
model was generated using Landsat-7 ETM+ satellite
imagery and DEM data. These data sets were processed with
the help of geo-processing techniques and various tools in
Arc GIS 10.3.1 and Erdas 10.2.

4 Veeranarayana Balabathina and Ravi Kumar Kandula: Statistical Analysis of Grain–Size Characteristics of
Streambed Sediments in River Catchments of the Lake Tana Basin, Northwest Ethiopia
Figure 4. Sample locations of study area.
4. Results and Discussion
Different grain-size statistical parameters for the
streambed sediments from the river catchments of lake Tana
basin showed distinct differences in their values (Table 1).
Table 2 summarizes these grain-size parameters in percentage
distribution of sediment characteristics of the different
catchment areas. Sediment samples from the streambeds of
the Megech river catchment in the northern part of the lake
Tana basin were covered by medium to very coarse sand,
moderately to poorly sorted, very coarse skewed (negatively
skewed) to symmetrical, and meso to leptokurtic. The
streambeds of the Reb river catchment were mostly
composed of coarse sand, poorly sorted, very coarse skewed
to symmetrical and lepto to meso kurtic. The Gumara river
catchment area had streambed sediments of very coarse to
coarse sand that were poorly sorted, coarse skewed to
symmetrical, and lepto to platy kurtic. The Gilgel Abbay
river catchment in the southern part of the lake Tana basin
had bed-load sediments mainly composed of coarse sand,
poorly sorted, near symmetrical and leptokurtic. The interim
catchments of the Tana-West were basically covered by very
coarse to coarse sand that were poorly sorted, very coarse
skewed to symmetrical, and lepto to meso kurtic.
Table 1. Descriptive statistical analysis for the grain-size parameters (Logarithmic (ɸ) Folk and Ward, (1957) Graphical measures).
Catchment Area
Meansize (Mz)/ (ɸ) Sorting (σ) Skewness (Sk) Kurtosis (KG) D10 (ɸ) D50 (ɸ) D90 (ɸ) SPAN Index
MEGECH Minimum -0.090 0.788 -0.376 0.962 -2.209 0.119 1.349 1.574
Maximum 1.452 1.501 0.100 1.481 0.379 1.350 2.561 31.359
Average 0.565 1.297 -0.166 1.188 -1.268 0.699 2.025 10.880
Deviation 0.517 0.840 0.706 0.546 0.729 0.471 0.433 11.397
RIB Minimum 0.120 1.229 -0.345 1.018 -2.525 0.181 1.566 4.748
Maximum 0.553 1.983 -0.056 1.368 -1.490 1.094 2.670 17.639
Average 0.393 1.478 -0.139 1.174 -1.746 0.544 2.155 9.097
Deviation 0.162 0.295 0.116 0.141 0.439 0.334 0.412 4.951
GUMARA Minimum -0.616 1.267 -0.145 0.877 -2.230 -0.537 0.952 -5.924
Maximum 0.910 1.494 0.034 1.167 -0.855 0.924 2.564 15.905
Average 0.270 1.349 -0.057 1.020 -1.485 0.340 1.933 5.182
Deviation 0.554 0.087 0.069 0.115 0.511 0.546 0.631 7.783
GIGELABBAY Minimum 0.623 1.031 -0.024 1.171 -0.914 0.554 1.693 4.060
Maximum 0.720 1.081 0.029 1.364 -0.565 0.645 2.054 4.705
Average 0.682 1.062 0.008 1.267 -0.768 0.615 1.936 4.409
Deviation 0.036 0.019 0.026 0.075 0.127 0.037 0.158 0.283
TANA WEST Minimum -0.491 1.157 -0.349 1.008 -2.046 -0.418 0.960 -105.06
Maximum 0.909 1.589 0.033 1.470 -1.105 1.193 2.529 6.926
Average 0.251 1.345 -0.133 1.159 -1.731 0.379 1.849 -19.274
Deviation 0.532 0.183 0.142 0.182 0.380 0.622 0.593 48.268
Table 2. Percentage distribution of grain-size statistical parameters (in percentage of the total no. at each location of the river catchment).
MEGECH RIB GUMARA GIGEL ABBAY TANA WEST
Mean size (Mz)
MG 1.49 2.22 0.93 0.54 1.24
FG 4.91 5.96 5.40 2.65 5.89
VFG 8.03 8.73 12.97 5.27 12.78
VCS 16.87 17.23 21.91 15.31 19.88
CS 27.23 30.21 26.47 40.12 27.83
MS 29.14 22.41 21.58 26.74 22.07
FS 9.63 9.80 7.16 7.62 8.32
VFS 2.67 3.41 3.55 1.74 1.96
Sorting (σ) MoS 9.09 0.00 0.00 0.00 0.00
PS 90.90 100.00 100.00 100.00 100.00
Skewness (Sk) NSy 27.27 60.00 80.00 100.00 40.00
CSk 54.54 20.00 20.00 0.00 40.00

American Journal of Earth Sciences 2019; 6(1): 1-13 5
MEGECH RIB GUMARA GIGEL ABBAY TANA WEST
VCSk 0.00 20.00 0.00 0.00 20.00
Kurtosis (KG)
LKu 63.63 60.00 20.00 100.00 40.00
MKu 36.36 40.00 60.00 0.00 60.00
PKu 0.00 0.00 20.00 0.00 0.00
MG = Medium Gravel; FG= Fine Gravel; VFG= Very Fine Gravel; VCS= Very Coarse Sand; CS= Coarse Sand; MS= Medium Sand; FS= Fine Sand; VFS=
Very Fine Sand; MoS = Moderately Sorted; PS= Poorly Sorted; NSy= Near Symmetrical; CSk= Coarse Skewed; VCSk=Very Coarse Skewed; LKu=Lepto
Kurtic; MKu= Meso Kurtic; PKu= Platy Kurtic.
4.1. Graphical Representations of Grain-Size Trends of the River Catchments
Figure 5. Box-plots of measured statistical size parameters for bed-material load samples from each river catchment.
Box-plots show the inter-quartile range of observations of
statistical grain-size parameters in each river catchment area
(Figure 5). Generally, mean sizes of the bed-material load
sediments were noticeably coarse sand in each catchment.
However, a little variation in the mean sizes within the same
river catchment was observed. Overall, the Gumara tends to be
the coarsest river and the Gilgel Abbay the least coarse,
although these differences are small. Sorting for bed-load
samples from all catchments were, in general, poorly sorted.
Gilgel Abbay streambed sediments had the lowest average
value for sorting i.e., are more inclined towards moderately
sorted than the corresponding values of the samples from the
other sites. Asymmetry parameters also showed that the values
of the bed-load samples tend to be symmetric or slightly
skewed toward coarse-grained particles. Except the catchment
of the Gilgel Abbay that was symmetrical, the catchments of
all other rivers were covered by sediments having grain-sizes
skewed towards the coarse fraction (negatively skewed).
Kurtosis parameters showed that the Megech, Reb and Gilgel
Abbay rivers were lepto kurtic having the highest average
values than Gumara and Tana West rivers were meso kurtic.
Results of all the samples analysis indicated that the
catchments of lake Tana is mainly composed of coarse sand
(M=0.4ɸ) and size range of very coarse to medium sand (-0.1
6 Veeranarayana Balabathina and Ravi Kumar Kandula: Statistical Analysis of Grain–Size Characteristics of
Streambed Sediments in River Catchments of the Lake Tana Basin, Northwest Ethiopia
to 1.25ɸ); poorly sorted (M=1.35ɸ) ranging from moderately
to poorly sorted sands (0.9 to 1.6ɸ); coarse skewed (negatively
skewed, M=-0.15ɸ) ranging from symmetry to slight coarse-
grained asymmetry (0.1 to -0.35ɸ); leptokurtic (M=1.2ɸ)
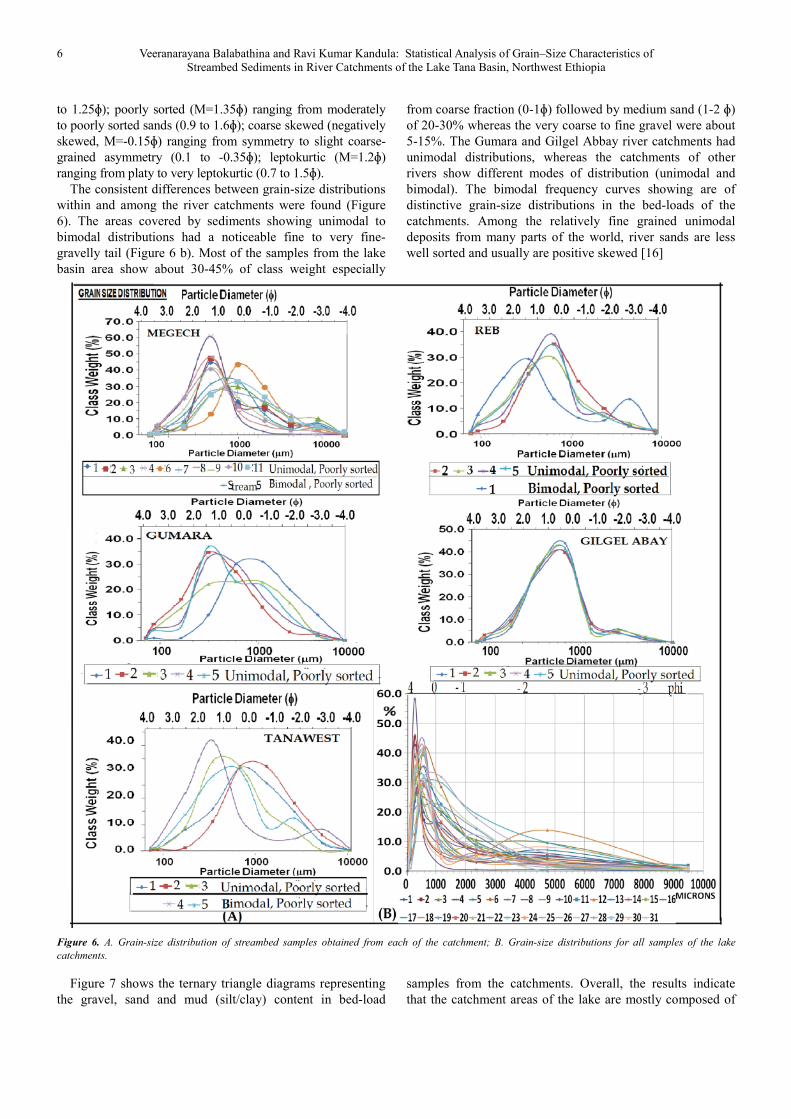
ranging from platy to very leptokurtic (0.7 to 1.5ɸ). The consistent differences between grain-size distributions
within and among the river catchments were found (Figure
6). The areas covered by sediments showing unimodal to
bimodal distributions had a noticeable fine to very fine-
gravelly tail (Figure 6 b). Most of the samples from the lake
basin area show about 30-45% of class weight especially
from coarse fraction (0-1ɸ) followed by medium sand (1-2 ɸ)
of 20-30% whereas the very coarse to fine gravel were about
5-15%. The Gumara and Gilgel Abbay river catchments had
unimodal distributions, whereas the catchments of other
rivers show different modes of distribution (unimodal and
bimodal). The bimodal frequency curves showing are of
distinctive grain-size distributions in the bed-loads of the
catchments. Among the relatively fine grained unimodal
deposits from many parts of the world, river sands are less
well sorted and usually are positive skewed [16]
Figure 6. A. Grain-size distribution of streambed samples obtained from each of the catchment; B. Grain-size distributions for all samples of the lake
catchments.
Figure 7 shows the ternary triangle diagrams representing
the gravel, sand and mud (silt/clay) content in bed-load
samples from the catchments. Overall, the results indicate
that the catchment areas of the lake are mostly composed of

American Journal of Earth Sciences 2019; 6(1): 1-13 7
gravelly sand with a few samples in sandy gravel texture.
Among all five catchment areas, the mud (silt/clay) content
in bed-load samples appears less than 5% having a
significant fine-grained tail. The textural group for the
sediments of Gumara river catchment varied from sandy
gravel to gravelly sand. The ternary plots also show that all
samples are noticeably homogeneous however with a little
variation in gravel, sand and mud content. The bed-load
samples of the catchment areas appeared diverse in color
mostly from blackish, grey, brownish, grayish brown to dusty
with composite mineral compositions (mainly composed of
tephra are intercalated with the fluvial deposits) that
correspond to the provinces of topographic massifs in the
area.
Figure 7. A Ternary triangle plots showing the distribution of gravel, sand and mud sized sediments; B. Ternary plots for all samples of the lake catchments.

8 Veeranarayana Balabathina and Ravi Kumar Kandula: Statistical Analysis of Grain–Size Characteristics of
Streambed Sediments in River Catchments of the Lake Tana Basin, Northwest Ethiopia
The slope has significant effect on the velocity of
overland flow in the river catchments of the lake because of
high topography and very broken and hilly, with grassy
uplands, swamp valleys and sparse vegetation. Most of the
lake basin is under nearly level to very gentle slopes (0.5-2
to 2-5%) covering about 27%, gentle to moderately slopes
(5-9 to 9-15%) about 30%, strong to steep slopes (15-
100%) about 22%, and very steep slopes (>100%) covering
about 21% of the basin (Figure 8). Very gentle slopes are
observed in the downstream, plain or undulating plateau
except the Tana West whereas the above lower part of all of
the catchments has moderate slopes are in association with
lava flows and foot of mountains. Steep slopes are mostly
observed in the west, north, northwest and northeast of the
basin in association with mountain peaks which are of
volcanic origin and are characterized with high drainage
density, high stream frequency and high flood potentiality.
This may impact on hydrodynamics of the catchments
sediments to the basin. Much less stream frequency and low
drainage density are found on the very gentle slopes
covering the plains.
Figure 8. Percent Slope map of the Lake Tana Basin.
Sample grain-size cumulative distributions for each
catchment were plotted on semi-logarithmic scale (Figure
9), showing composites in spatial variations of grain-size
distribution curves. The distribution curves indicate that
these catchments are composed of composite sediments.
However, the distribution curves for the samples of Gilgel
Abbay catchment, follows the same trend and all bed-load
samples are considered to have unimodal distribution,
with noticeable coarse grained tail. Cumulative
distribution curves on a probability scale for all bed-load
samples of the catchments are shown in Figure 9b with
particular regard to their inclination and spread of the
grain-size. They appear on a probability scale as segments
(A, B, C) with different inclination and are distinguished
with the course of the cumulative curves for the prevailing
fractions of the deposit (>60% of the total sample mass)
and the sorting of these fractions, as marked by the
section’s inclination [17]. Cumulative curves for all
catchment samples comprise curves in which the major
section represents poorly sorted material, and it is
characterized by a steeply inclined section ‘A’ within the
75-85° interval indicating that admixtures of more coarser
and very less finer grains occur as well (segments C and
B). These cumulative curves are characteristic of fluvial
deposits (particularly in meandering and braided-rivers) of
largest grain-size derived from high-energy currents and
transported in the limit of upper competence of a given
density medium. According to the Visher’s (1969) [18]
classification system, the distinction of size population is
mostly traction and saltation populations indicate to those
channel sediments that are transported through rolling and
dragging, and by saltation.
Figure 10a shows the C-M diagram wherein the values of
the first percentile (C) are plotted against the median (M)
whichare obtained from the cumulative probability curves.
The C-M diagram has been widely used as a technique to
relate the grain-size characteristics of sediments to the
processes of their deposition and mode of transportation [19].
In addition, it provides an evaluation on the hydrodynamic
forces working during the deposition of the sediments. This
C-M diagram shows the two types of characteristic zones
according to Passega (1964) and Ludwikowska-Kedzia [20-
21] indicating different modes of transport of grains and
sedimentation. The C-M patterns results of both the zones
show that these deposits are covered by varying mode of
transport, ranging from transport exclusively through rolling
(N or NO) to saltation with a contribution of rolling (PQ).
The suspension is much less rapid than the saltation from
rolling indicated that sediments were transported as bed-load
through a mixed of both modes of rolling and saltation with a
contribution of rolling which are characteristic of flood plain.
Upward shifts of the basic limits towards higher ‘C’ values
indicate thatthe sediment deposits in river catchments of
various gradients and current dynamics. No samples were
identified to be transported as suspended materials on the
diagram. Some of the samples do not point explicitly to a
particular environment because of variability in depositional
conditions within settings as well as due to process of similar
hydrodynamic conditions in different environments. The bi-
variant scatter plots between one percentile (C) and median

American Journal of Earth Sciences 2019; 6(1): 1-13 9
(M) as shown Figure 10b.
Figure 9. A. Cumulative particle size distribution curves showing composite samples from the five catchment areas of the lake basin; B. Cumulative
probability distribution curves.

10 Veeranarayana Balabathina and Ravi Kumar Kandula: Statistical Analysis of Grain–Size Characteristics of
Streambed Sediments in River Catchments of the Lake Tana Basin, Northwest Ethiopia
Figure 10. A. C-M plot; B. Bi-variant plot between C and M.
For discriminating the depositional environments and
understanding of the energy processes, bi-variant plots are
made between the grain-size parameters [22]. The bi-variant
plots between mean size and sorting, mean size and
skewness, and sorting and skewness are shown in Figure 11.
The bi-variant plots between mean size and sorting of
sediments of the Megech (Pearson’s correlation coefficient, r
=−0.494, Sig. (2-tailed) p=0.122), Reb (r=0.743, p=0.050),
Gumara (r=0.239, p=0.698), Gilgel Abbay (r=0.693,
p=0.195) and Tana West river catchments (r=0.741, p=0.170)
show both negative and positive correlations. The plot of
mean size against sorting for the Megech shows a negative
correlation and the coefficient of determination (r2) indicated
that the sorting decreases (progressively moderate to poorly
sorting) with the increasing grain-sizes, while other
catchments do not show any significant trends. In general,
these catchments are distinguished by having poorly sorted
sediments in the size range of coarse to very coarse fraction.
The bi-variant plots of mean size against skewness for
the Reb (r= −0.457, p=0.439) and Tana West (r= −0.780,
p=0.120) show a negative correlation and indicate that
skewness increases (from coarse skewed to symmetrical)
with the increasing grain-size, while the plots for the
Megech (r=0.165, p=0.628), Gumara (r=0.173, p=0.781),
Gilgel Abbay (r= 0.594, p= 0.291) do not show any
significant trends i.e., skewness increases (fine skewed)
with the decreasing grain-size. With this, the higher content
of coarse sediment fraction did not obviously affect
sediment sorting in the samples of all catchments except for
the Megech and did result in an increased degree of
skewness.
The bi-variant plots between sorting and skewness for the
Gumara (r= 0.611, p=0.273) and Gilgel Abbay (r= 0.116,
p= 0.852) show a positive correlation and indicate that the
skewness increases (i.e., fine skewed, +ve) with the
decreasing sorting (i.e., poorly sorted), while the plots for
Megech (r= −0.638, p=0.017), Reb (r=−0.917, p=0.014),
Tana West (r= −0.717, p=0.173) do not show any
significant trends i.e., slightly skewed towards the coarse
fractions (− ve skewed) with the decreasing sorting.
Plotting of skewness against kurtosis is a powerful tool for
interpreting the genesis of sediment, by quantifying the
degree of normality of its size distribution [23]. In general,
sediments from most of the catchments lie within coarse
skewed and meso to leptokurtic field (Table 2). The
coarsely skewed sediments did not obviously affect
sediment kurtosis in the samples.
The results of bi-variant plots between mean sizes vs.
sorting for all samples of the catchment of lake Tana show
a negative correlation (r=−0.047, p=0.802, r2=0.028) i.e.,
the sorting decreases with the increasing grain-size. The
higher content of coarse sediment fraction did obviously
affect sediment sorting in the samples. The mean sizes vs.
skewness results also show negative correlation
(r=−0.060, p=0.749, r2=0.002) i.e., the skewness increases
with the increasing grain-size. The higher content of
coarse sediment fraction did result in an increased degree
of skewness. Whereas, the bi-variant plots between sorting
vs. skewness and skewness vs. kurtosis do not show any
significant trends (i.e., indicating as a negative
correlation).

American Journal of Earth Sciences 2019; 6(1): 1-13 11
Figure 11. Bi-variant plots showing the relationship between the grain-size and sorting; grain-size and Skewness, and Sorting and Skewness of the sediments
from each catchment of the lake.

12 Veeranarayana Balabathina and Ravi Kumar Kandula: Statistical Analysis of Grain–Size Characteristics of
Streambed Sediments in River Catchments of the Lake Tana Basin, Northwest Ethiopia
4.2. Statistical Characterization of
Streambed Sediments of the
Catchments
In an attempt to obtain a similarity between and within the
catchments, statistical treatments were applied to the
streambed samples from all of the catchment areas. One-way
ANOVA analysis, Liner Regression analysis and the Student
t-test analysis were used in the present work. To confirm the
statistical discrimination results of the bi-variant plot, CM
plot and probability accumulation distribution, as well as to
define the controlling variables of each catchment. The
analysises were performed using a data matrix comprising
variables of grain-size statistical parameters and 31 sample
location attributes of all five catchments.
The results of One-way ANOVA analysis (Table 3)
revealed that there was a significant differences among the
five river catchments on sediment textures, F (4, 26) = 0.027,
p <0.05, ɳ2
ρ =0.24. This testing also revealed significant
differences between pairs of regions with North and South
having more textural variations than East and West, i.e., the
Megech from north, (M=0.56, S.D= 0.52); Gilgel Abbay
from south, (M=0.68, S.D=0.036); Reb (M=0.30, S.D= 0.16)
and Gumara from east (M= 0.27 S.D=0.25); and Tana West,
(M=0.25 S.D=0.53). These findings indicate that there are
more grain-size variations in river catchments from north and
south regions of lake Tana basin. This is attributable to the
unlikeness in the physiographic setting.
Table 3. Results of One-Way ANOVA.
Source of variation Degree of freedom (df) Variance Ratio (F) Sig. (p) Remark at 5% LS*
Between catchments 4 &26 4.398 0.027 Significant
*LS= Level of Significance @0.05
The ANOVA results of Linear regression (Table 4) revealed that there was a statistically significant difference in streambeds
within the Megech and Gilgel Abbay catchments, while there was no statistically significant difference in streambeds of the
Reb, Gumara and Tana West catchments. This indicates that there may be variations in the conditions of sediment deposition.
Table 4. Results of ANOVA in Liner Regression analysis.
Source of variation Catchments Degree of freedom (df) Variance Ratio (F) Sig. Remark at 5% LS
Within catchments
Megech 1&9 3.382 0.039 Significant
Reb 1&3 0.009 0.929 Not Significant
Gumara 1&3 0.619 0.489 Not Significant
Gilgel Abbay 1&3 5.849 0.044 Significant
Tana West 1&3 2.234 0.232 Not Significant
The Student’s t-test analysis results revealed that there was a statistically significant difference in grain-size parameters of
streambed sediments of the Megech and Reb, and, Megech and Tana West catchments, while there was no statistically
significant difference in the streambed sediments of the Reb and Gumara, Gumara and Gilgel Abbay, and, Gilgel Abbay and
Tana West catchments.
Table 5. Results of Students’ t-test (clock-wise paired samples test).
Catchments t df Sig. Remark at 5% LS
Megech vs. Reb 2.244 10 0.047 Significant
Reb vs. Gumara 0.415 10 0.687 Not Significant
Gumara vs. Gilgel Abbay -1.569 10 0.148 Not Significant
Gilgel Abbay vs. Tana West 1.616 10 0.137 Not Significant
Tana West vs. Megech -2.739 10 0.021 Significant
5. Conclusions
Using the statistical grain-size parameters various
graphical plots are made for seeing the trends and
characterization of the river catchments that influence in turn
the character of the lake Tana basin. Multivariate statistical
techniques were also employed for discriminating intra- and
inter-catchment variations of grain sizes. The results indicate
statistically significant variation among different river
catchments, while there is no statistically significant variation
within a particular river catchment except for the Megech
and Gilgel Abbay. These variations may be due to the
variables like diversity in the sources of the sediments, the
hydrodynamic forces, lateral distance and the physiographic
setting of the study area. The results suggest that these
variables are most affecting the grain-size patterns and the
role of particular variable is differed between various river
catchments. It is also noted that variables controlling within
any given river catchment grain-size variability are strongly
site specific.
Acknowledgements
The authors would like to thank the fieldwork
collaboration efforts of team members. We are also grateful

American Journal of Earth Sciences 2019; 6(1): 1-13 13
to the Manager, Ethiopian High way Road and Construction
Material office, Gondar for providing the laboratory facilities
for sample analysis. Our appreciation is expressed to their
staff members for technical assistance. Finally, our sincere
thanks to Prof. R. P. Raju, Department of Environmental &
OHS, and University of Gondar for their unconditional
support.
References
[1] Folk, R. L. and Ward, W. C., “Brazos Sungai Bar: A study in the significance of grain size parameters,” Journal of Sedimentary Petrology, 27 (1): 3-26, 1957.
[2] Friedman, G. M., “Difference in size distributions of populations of particles among sands of various origins,” Sedimentology, 26, 1-30, 1979.
[3] Bui, E. N., Mazullo, J., and Wilding, L. P, “Using quartz grain size and shape analysis to distinguish between aeolian and fluvial deposits in the Dallol Bosso of Niger (West Africa),” Earth Surface Processes and Landforms, 14, 157–166, 1990.
[4] Lara B. Hedrick, James T. Anderson, Stuart A. Welsh and Lian-Shin Lin, “Sedimentation in Mountain Streams: A Review of Methods of Measurement,” Natural Resources, Vol. 4, 92-104, 2013.
[5] A. S. Alsharhan and A. A. El-Sammak, “Grain-Size Analysis and Characterization of Sedimentary Environments of the UnitedArab Emirates Coastal Area,” Journal of Coastal Research, Vol. 20, No. 2, pp. 464-477, 2004.
[6] Boggs, S., “Principles of Sedimentology and Stratigraphy prentice Hall, Englewood Cliffs,” New Jersey, pp. 79-93, 1995.
[7] Begosew Abate, Christian Koeberl, Paul C. Buchanan and Wilferd Korner, “Pertography and geochemistry of basic and rhylotic rocks from lake Tana and the Gimjabet – Kosober areas (north central Ethiopia),” Journal of African Earth sciences, Vol. 26, no. 1, pp. 119-134, 1998.
[8] Mohr, P. A, “The Geology of Ethiopia,” Haileslassie I University, Addis Ababa, pp 253, 1971.
[9] Kazmin, V, “The Geology of Ethiopia: Explanatory note to the geological map of Ethiopia,” Ministry of Mines, GSE, Addis Ababa, pp. 82-104, 1972.
[10] Merla, G., Abbate, E., Azzaroli, A., Bruni, P., Canuti, P., Fazzuoli, M., Sagri, M, and Tacconi, P., “Comments to the
geological map of Ethiopia and Somalia,” Consiglio Nazionaledelle Ricerche, Firenze, Pergamon, p. 95, 1979.
[11] Berhe, S. M, Desta, B., Nicoletti, M. and Teferra, M, “Geology, geochemistry and geodynamic implications of the Cenozoic magmatic province in W and SE Ethiopia,” Journal of Geological Society, London 14, 231-226, 1987.
[12] Mekete Dessie, Niko E. C. Verhoest, Valentijn R. N. Pauwels, Jean Poesen, Enyew Adgo, Jozef Deckers, and Jan Nyssen., “The water balance of Lake Tana,” Tropical Lakes 2015.
[13] J. V. Sutcliffe and Y. P. Park, “The Hydrology of the Nile” IAHS special publication, no. 5, 127-143. 1999.
[14] Mekete Dessie, Niko E. C. Verhoest, Teshager Admasu, Valentijn R. N. Pauwels, Jean Poesen, Enyew Adgo, Jozef Deckers, and Jan Nyssen, “Effects of the floodplain on river discharge into Lake Tana (Ethiopia),” Journal of Hydrology, 519, pp. 699–710, 2014.
[15] Blott, S. J., Pye, K., “Gradistat: a grain size distribution and statistics package for the analysis of unconsolided sediment,” Earth Surf. Process. Landforms, 26, 1237-1248, 2001.
[16] Tucker, M., “Techniques in Sedimentology,” Blackwell Scientific Publications, pp. 63-86, 1990.
[17] Elżbieta Mycielska-Dowgiałło and Małgorzata Ludwikowska-Kędzia, “Alternative interpretations of grain-size data from Quaternary deposits,” Geologos, 17 (4): 189–203, 2011.
[18] Visher, G. S, “Grain size distributions and depositional process,” J Sed Petrol, 39: 1074-1106, 1969.
[19] Passega, R., and Byramjee, R, “Grain-size image of clastic deposits,” Sedimentology, 13: 233-252, 1969.
[20] Passega, R, “Grain size representation by CM patterns as a geologic tool,” Journal of Sedimentary Research, 34, 830–847, 1964.
[21] Ludwikowska-Kędzia, M, “Ewolucja środkowego odcinka doliny rzeki Belnianki w późnym glacjale i holocenie (Evolution of the Middle Segment of the Belnianka River Valley in the Late Glacial and Holocene),” Warsaw: Dialog Press, p. 180, 2000.
[22] Stewart, H. B, “Sedimentary reflection on depositional environment, in San Mignellagoon,” Baju California, Mexico AAPG Bull, Vol. 42, pp. 2567-2618, 1958.
[23] Folk, R. L., “A review of the grain size parameters,” Sedimentology, pp. 73-93, 1966.