statistical and spatial analysis of displacements … · statistical and spatial analysis of ......
TRANSCRIPT
STATISTICAL AND SPATIAL ANALYSIS OF DISPLACEMENTS
Krzysztof Bojarowski Institute of Geodesy
University of Warmia and Mazury Email: [email protected]
Abstract: Objects and engineering structures or their parts are subject to displacement resulting from numerous internal and external factors. Determination of the magnitude of those changes is possible on the basis of cyclic measurements of changes in position of points determining the geometrical relations in the studied object. Processing the measurement results aims at determination of the characteristics of those changes and assessment of possible hazards. The paper proposes a methodology for processing vertical displacements using the spatial information systems. In this case both statistical analyses and development of a graphic model allowing complex assessment of the status of the object was possible.
1. Introduction Digital maps, frequently as components of the spatial information system, are currently
commonly used in all those fields where use of spatial data is necessary. Those systems, particularly in combination with data collection systems, form the basic platform in planning, implementation, recording, and monitoring of the majority of engineering structures. Studies related to the use of spatial information systems (SIS) and design support systems (CAD) in engineering geodesy, including recording and visualization of displacement, have been carried out at the University of Warmia and Mazury in Olsztyn for years. Those studies have resulted in publications of general nature as well as products representing specific applications of the systems[1,2,3,4,5,10]. In particular, outputs concerning design of engineering structures on the basis of the digital map, 3D visualization of spatial dislocations of objects and recording, modeling and visualization of surface, including sea bottom, changes dynamics should be mentioned.
2. General outline of activities
Monitoring of dislocations and deformations of structures, as well as determination in the spatial land setup as a consequence of natural processes and human activities are among particularly difficult and responsible tasks performed by surveyors [7,8,9]. It does not have to be reminded that the importance of such works is determined first of all by the need to provide continual and effective control of objects’ stability while the basic difficulties are linked to the necessity of including the time factor in planning the survey cycles and interpretation of results.
Processing of the dislocation survey results implemented by traditional methods included digital specifications and different types of graphs, usually vertical dislocation profiles presented in 2D system as well as drawings and maps of horizontal dislocations. The new
3rd IAG / 12th FIG Symposium, Baden, May 22-24, 2006

opportunities of presentation and interpretation of dislocation survey results appeared as a consequence of the development of spatial determination methods exemplified by laser scanning and GPS measurement methods. At the same time determination of the components of dislocations in three basic directions allowed 3D presentation of results, including 3D sketch format. Such methodologies, however, used to be relatively arduous as a consequence of impossibility of automating them. Such possibilities have developed during the recent years as a result of development of special computer systems committed to processing and visualization of spatial information [6].
The process of determining the deformations and dislocations and processing the results can be explained in the general diagram presented as fig. 1.
DATA COLLECTION
FINAL COMPILATIONS AND CONCLUSIONS
DEFINING THE PHENOMENON
SELECTION OF SPATIAL REFERENCE SYSTEM
DETERMINING THE FEATURES AND SELECTION OF
MEASUREMENT METHODS
GEODESIC SURVEY
RECORDING OF FEATURES
STATISTICAL CALCULATIONS SPATIAL ANALYSES
SPATIAL INFORMATION SYSTEM
ATTRIBUTES
DIGITAL MAP
Figure 1: General outline of activities
Defining the problem related to spatial positioning of the objects selected for the studies
means determining the type of structure and its attributes as well as methods of registration and analysis. Another stage involves selection of the spatial reference system. Following definition of the problem and selection of the system, practical implementation of the task can start. That represents development of spatial information system where an earlier established system can be used as a platform for selection of objects or objects matching the earlier made assumptions can be registered. When the platform prepared in that way is available, spatial indicators that define the change in position, differentiation of quantitative and qualitative characteristics of objects and, if required, other spatial parameters can be calculated.
3rd IAG / 12th FIG Symposium, Baden, May 22-24, 2006

3. Spatial system database structure
The possibility of determining the dislocations of the analyzed object that appeared during the investigated period of time depends on performance of observations of selected object points at the beginning (t0) and the end of that period (ti). Assuming the results of one of those measurements for the baseline and the results of the following one for the actual ones it is possible to calculate the quantitative values of dislocations during that period. To satisfy their tasks, the dislocation measurements must be scheduled taking into consideration both the type of object and the reasons for observing it as well as additional circumstances and periodic quantification of dislocation values should satisfy the following basic conditions: 1. Correctness, i.e. agreement of the determined values with the actual changes in position of
the observed objects, within the influence limits of accidental measurement errors. 2. Minimum accuracy determined by the needs decided by the interpreters of those values for
individual types of objects. 3. Currency, meaning that the time between commencement of each measurement period and
passing the measured values to the interpreters will be shortened to the reasonable minimum. The need to secure those characteristics for the methods applied for determination of
dislocations results in the necessity of applying appropriate measurement and calculation methodologies and established organizational practices. Currently the methods of determination in the 3D system are most frequently applied. That results in determining changes in position of points expressed by three components of dislocation vector in a fixed reference system and assumed time period, which can then be used for analyses and studies ass well as graphic presentations.
The application of spatial information systems for investigating deformations and dislocations allows determination of geometric and topologic relations describing the spatial system of the investigated points as well as conducting statistical analyses. The basic conditions allowing the investigations and correct interpretation of results are:
- determining the object’s characteristics including the caused of changes, - determining geometric relations characterizing the subject object, including the
recorded points used for database structure development, - selection of statistical analyses allowing interpretation of the phenomenon studied.
Figure 2: Examples of objects’ geometrization
3rd IAG / 12th FIG Symposium, Baden, May 22-24, 2006
Spatial information systems allow spatial reproduction of object dimensions on the basis of
the measured points and as a consequence performance of studies on the basis similar to actual conditions. As a consequence, determination of the principles of classification and identification of the studied objects as well as appropriate selection of control points representing those objects (fig. 2) are the main criteria determining effectiveness of the analyses.
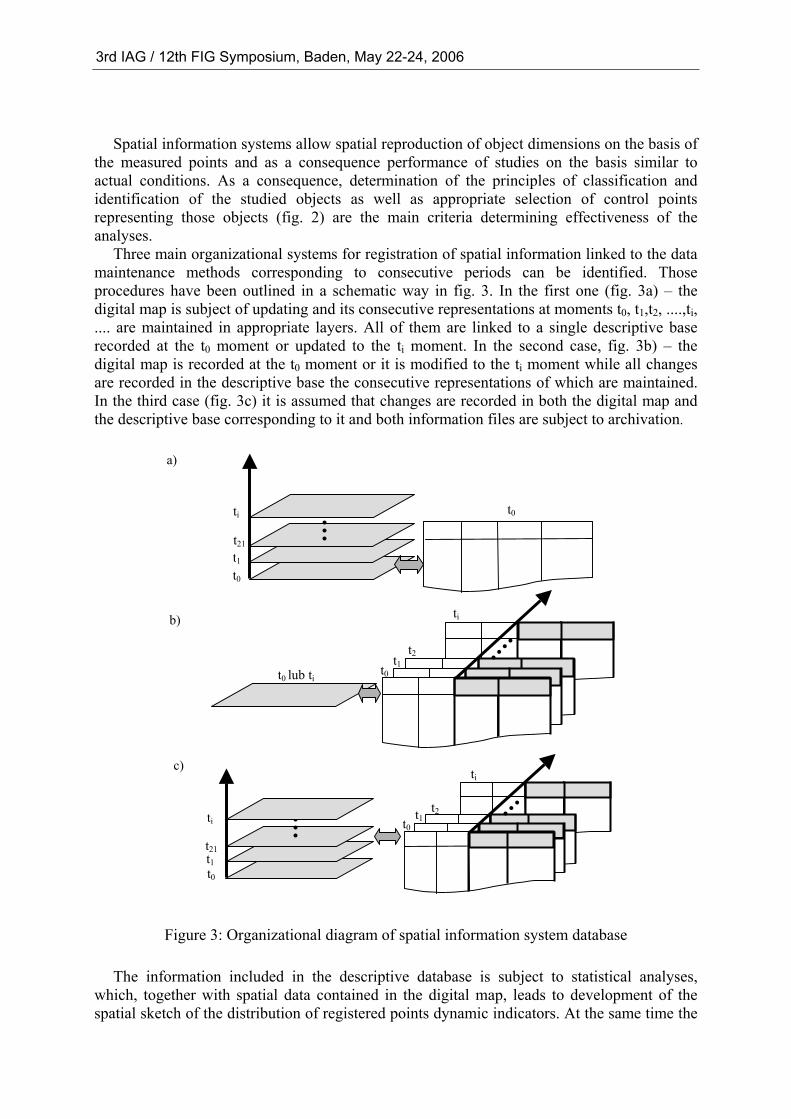
Three main organizational systems for registration of spatial information linked to the data maintenance methods corresponding to consecutive periods can be identified. Those procedures have been outlined in a schematic way in fig. 3. In the first one (fig. 3a) – the digital map is subject of updating and its consecutive representations at moments t0, t1,t2, ....,ti, .... are maintained in appropriate layers. All of them are linked to a single descriptive base recorded at the t0 moment or updated to the ti moment. In the second case, fig. 3b) – the digital map is recorded at the t0 moment or it is modified to the ti moment while all changes are recorded in the descriptive base the consecutive representations of which are maintained. In the third case (fig. 3c) it is assumed that changes are recorded in both the digital map and the descriptive base corresponding to it and both information files are subject to archivation.
a)
t0
t1
t21
ti t0t1
t2
ti
b)
t0t1
t2
ti
t0 lub ti
t0
t1
t21
ti t0
c)
Figure 3: Organizational diagram of spatial information system database
The information included in the descriptive database is subject to statistical analyses, which, together with spatial data contained in the digital map, leads to development of the spatial sketch of the distribution of registered points dynamic indicators. At the same time the
3rd IAG / 12th FIG Symposium, Baden, May 22-24, 2006
summary information and graphs are prepared and at the final stage the assessment and projection of object deformations are prepared. Visualization of dislocations and deformations of spatial objects obviously cannot substitute for careful analyses of control measurements digital results. However, because of clarity and suggestive nature of such presentations, they should form obvious supplements to digital analyses as they allow a significant expansion of the scope of conclusions drawn. In particular, that applies to those cases where, as a consequence of the dynamics of changes, it is necessary to take fast and straightforward decisions.
4. Examples Planning of spatial development requires assessment of changes in the environment and
terrain setup that occurred during the earlier periods. In such studies archival cartographic materials from consecutive periods processed to the digital forms could be used in connection with the transformation to the common system. In such cases all basic information is registered in the consecutive layers of the digital map while only the supplementary information is registered in the descriptive base. That is justified in particular by use of such maps as the main base for spatial analyses.
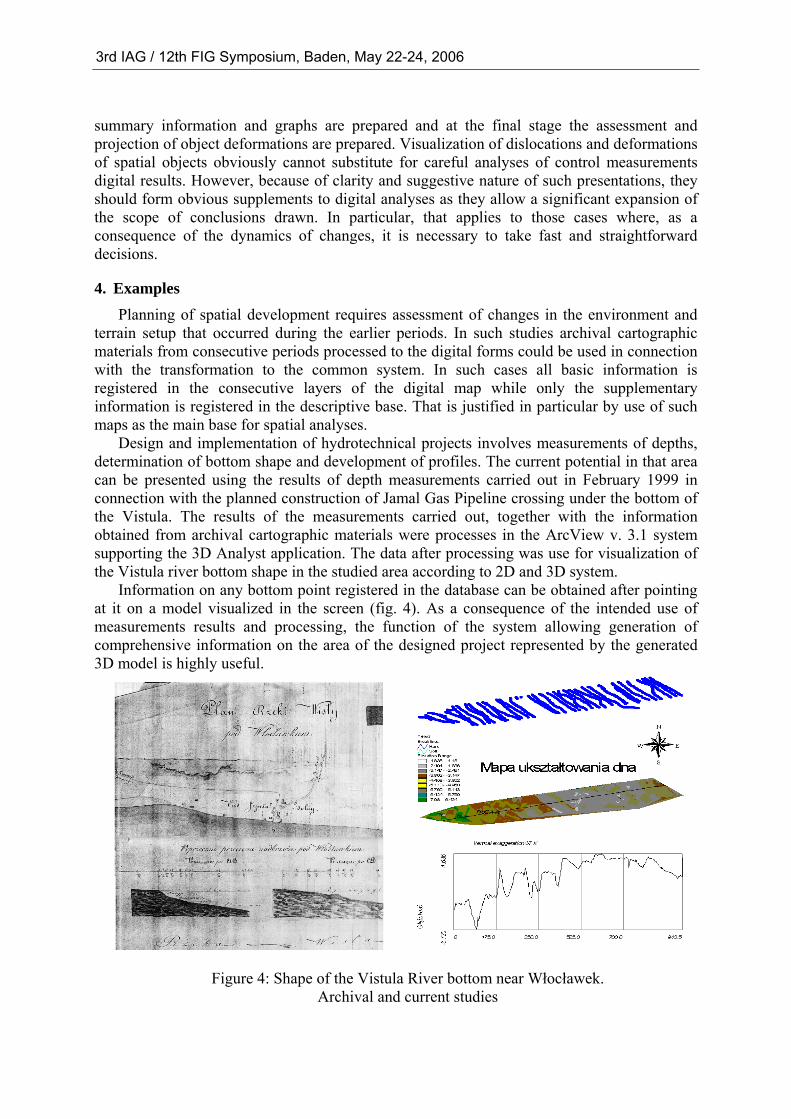
Design and implementation of hydrotechnical projects involves measurements of depths, determination of bottom shape and development of profiles. The current potential in that area can be presented using the results of depth measurements carried out in February 1999 in connection with the planned construction of Jamal Gas Pipeline crossing under the bottom of the Vistula. The results of the measurements carried out, together with the information obtained from archival cartographic materials were processes in the ArcView v. 3.1 system supporting the 3D Analyst application. The data after processing was use for visualization of the Vistula river bottom shape in the studied area according to 2D and 3D system.
Information on any bottom point registered in the database can be obtained after pointing at it on a model visualized in the screen (fig. 4). As a consequence of the intended use of measurements results and processing, the function of the system allowing generation of comprehensive information on the area of the designed project represented by the generated 3D model is highly useful.
Figure 4: Shape of the Vistula River bottom near Włocławek. Archival and current studies
3rd IAG / 12th FIG Symposium, Baden, May 22-24, 2006

Analysis of overhead crane beam dislocations can be one of the examples corresponding to the second pattern. It can be assumed that the geometric pattern of the beam at t0 time is recorded in the digital map and updated for consecutive moments ti, and the current variant is stored in the memory. The descriptive base in which the information on position of recorded measurement points and measurement conditions at all consecutive moments of measurement performance is subject of archivation (fig. 5). That data can serve spatial analysis and projecting changes as well as determining the status of the subject object under specified conditions.
Figure 5: Analysis of changes in vertical dislocations The third case presented in fig. 6 is the most general [5]. It applies to all those situations when archivation of all determined geometric and descriptive information is necessary. The need for archivation of consecutive representations of the digital map and the descriptive base corresponding to it occurs usually in case of determination of dislocations and deformations of objects as a result of the need to prevent possible risks. As a consequence the example illustrating the third variant (fig. 6) concerns determination of changes in depth of post-flotation waste dump in Lubin-Głogów Copper Basin. In this case it was assumed that projecting the changes requires using both the digital map for consecutive moments t0, t1, t2, ... tn, and the variants of the descriptive database corresponding to those moments.
Figure 6: Bottom depth alterations
Horizontal dislocation Point Number p1 p2 p3 p4 p5 p6
1 0,05 0,17 0,51 0,64 0,67 0,7 2 -0,31 -1,14 -1,59 -1,08 -2,54 -2,6 3 -0,5 -1,74 -2,51 -3,05 -4,02 -3,87 4 -0,47 -1,47 -2,04 -2,08 -2,97 -2,85 5 -0,01 0,02 -0,11 0,19 0,19 0,29 m 0,08 0,22 0,28 0,29 0,31 0,33
p1 p2 p31
p4 p5
-5
-4
-3
-2
-1
0
1
1 2 3 4 5
3rd IAG / 12th FIG Symposium, Baden, May 22-24, 2006

5. Conclusion
In conclusion it must be stated that the spatial information systems are an effective tool for
processing the results of deformation and dislocation measurements. The possibility of carrying out statistical analyses and detecting geometric and topologic dependences should be highlighted in particular. The results of operations can be visualized in a digital map and presented in the form of summary specifications and graphs.
So far, despite the numerous benefits offered, the spatial information systems have been used too little in engineering survey. The basic reasons are, probably, the difficulties involved in the necessity to define the scopes of activities of surveyors, designers and constructors. However, establishment of consistent spatial information systems using GIS type software would allow not only eliminating those difficulties but also establishment of highly effective systems for transfer of information among all groups of specialists involved in implementation of investment projects. References: [1] Bojarowski K. 1998: Registration and visualization of the sea bottom dynamics with the
ARC/INFO, ArcView system. Proceedings of the 3rd National Conference of Users of the ESRI Programs, Warsaw.
[2] Bojarowski K., Szacherska M.K., Wasilewski A. 1997: Spatial information systems applied in designing and the surveying attendance of constructions. Proceedings of the 3rd Conference on „Problems of automatization in industrial surveying”, Warsaw.
[3] Bojarowski K. Use of spatial models of the GRID type for analysis of changes in area structures. Proceedings of the Scientific-Technical Conference “Exsplo-Ship”. Świnoujście-Copenhagen 2004.
[4] Bojarowski K., Gościewski D. Some concepts of processing big spatial data sets. Technical Sciences Vol. 7, University of Warmia and Mazury. Olsztyn 2004.
[5] Jackowski M., Tusk D. 1999: Visualization and estimation of bottom configuration alterations of the Iron Bridge reservoir with the ArcView v. 3.0 system. Master’s thesis. University of Agriculture and Technology, Olsztyn.
[6] Kurczyński Z. Technological conditions of digital terrain model generation. Papers and Projects of the Institute of Geodesy and Cartography. Warsaw 1999
[7] Loesekraut H. 1980: Kontinuierliche Messungen in der Ingenieur-Geodäsie. Veröffentlichung des Geod. Inst. der RWTH Aachen, Heft 28.
[8] Pelzer H. u. a. 1976: Deformationsmessungen. Zeitschrift für Vermessungswesen. Sonderheft 19.
[9] Pelzer H., Gerstenecker C., 1980: Measurements of Distance and Tilt Changes in Fissures of Northern Iceland. Journal of Geophysics 47.
[10] Szacherska M.K., Bojarowski K. 1998: Spatial information systems in the designing and registration of the architectural and engineering objects. Proceedings of the 4th Polish-Dutch Symposium on „Cadastral, geodetic and cartographic information in land planning”. Delft.
3rd IAG / 12th FIG Symposium, Baden, May 22-24, 2006