statistical methods for microbiome data analysis
TRANSCRIPT

Statistical Methods for Microbiome DataAnalysis
Hongzhe [email protected], http://statgene.med.upenn.edu
University of Pennsylvania Perelman School of Medicine
April 25, 2012

Outline of My Talk
Outline
� Microbiome, Diseases, Technologies and Data
� Methods for Microbiome Data Analysis
� Kernel-based Regression Methods for Testing the Effect ofMicrobiome Composition on an Outcome
� Sparse Dirichlet-multinomial Regression for SimultaneousSelection of Microbiome-associated Covariates and TheirAffected Taxa
� Future Work
H.Li (Penn) Microbiome data analysis April 25, 2012 2 / 42

Microbiome, Diseases, Technologies and Data
The Human Microbiome
� Microbiome as extended human genome� 1013 human cells vs 1014 bacterial cells� Consist of Prokaryotes, Archaea, Fungi,
and Viruses� More than 3× 10⁶ genes provided by our
gut microbiome� Distinctive microbiomes at different body
sites (GI, lung, skin etc.)� The human microbiome may explain the
missing link between genetic variation anddisease
� The human microbiome in health� Digestive enzyme activity� Synthesis of vitamins� Interaction with the immune system� Protection from pathogens, etc.
External auditory canal
Gastrointestinal tract
Hair on the head
Nostril
Skin
Firmicutes
Actinobacteria
Bacteroidetes
Cyanobacteria
Fusobacteria
Proteobacteria
Mouth
Penis Vagina
Oesophagus
Nat Rev Microbiol. 2011 Apr;9(4):279-90.
H.Li (Penn) Microbiome data analysis April 25, 2012 3 / 42

Microbiome, Diseases, Technologies and Data
Microbiome and Human DiseasesGut-brain hypothesis1. Autism�C. bolteae / clostridia sporesMechanism unkown2. Mood: depression, anxiety
Hygiene hypothesis:Exagerrated innate immune responseUpregulation of regulatory T cellsafter capture of Ags by DCs�Bifidobacteria, Gram +ve organisms�Clostridia
Peripheral vascular disease
Inflammatory bowel disease
�Bacteroidetes and �Actinobacteria in obese Altered energy / lipid metabolismHigher relative abundance of glycoside hydrolases,carbohydrate-binding modules,glycosyltransferases, polysaccharide lyases, and carbohydrate esterases in the BacteroidetesTLR mediated
Hypertension / ischemicheartdisease
Biliary disease
Colon cancer
Altered xenobiotic / drug metabolism
Diet high in red meat and animal fatLow SCFA / butyrateHigh fecal fatsLow vitamin absorption� 7α dehydroxylating bacteria:cholic acid�deoxycholic acid (co-carcinogen)Low in H2S metabolizing bacteria
Obesity / metabolic syndrome
Asthma / atopy
e.g. Paracetamol metabolism:� predose urinary p-cresol sulfate leads to � postdose urinaryacetaminophen sulfate : acetaminophen glucuronide.Bacterially mediated p-cresol generation and competitiveo-sulfonation of p-cresol reduces the effective systemic capacityto sulfonate acetaminophen.
Hygiene hypothesisAltered immune response: TLR signalingLess microbial diversityActivation of specific species: for example, Escherichia
Result of metabolic syndromeAltered lipid deposition / metabolism
Altered enterohepatic circulation of bile
Kinross et al. Genome Medicine 2011, 3:14
H.Li (Penn) Microbiome data analysis April 25, 2012 4 / 42

Microbiome, Diseases, Technologies and Data
Technologies - Next Generation Sequencing
� 16S rRNA gene targeted sequencing� Structural component of the prokaryotic ribosome� Used as a molecular clock to identify phylogeny� Portions are constant, allowing amplification� Portions are variable, allowing identification
16S rRNA gene
100 nt
V1 V2 V3 V4 V5 V6 V7 V8 V9F27
454
F357
R534
R926
F968
R149
2
Amplicon 454 FLX Titanium readVariable region Length approx. 1.5kb
� Alternative: whole genome sequencing (shotgun metagenomics) (Qin etal Nature 2010; Arumugam et al Nature 2011).
H.Li (Penn) Microbiome data analysis April 25, 2012 5 / 42

Microbiome, Diseases, Technologies and Data
16S Sequences Processing Pipeline
Extract DNA and PCR amplify with barcoded primer
Pool amplicons
Pyrosequenceamplicons using 454’s
GS FLX instrument
> AGTGAGAGAAGCAGGGTCGTAATGTT . . .> AGTGCGATGCGTAGGGTCGTAATGCG . . .
> AGTGCGATGCGTAGGGTCGTAATGTA . . .> AGTGGATGCTCT AGGGTCGTAATGCA . . .
> AGTGTCACGGTGAGGGTCGTAATGGG . . .> AGTGGATGCTCT AGGGTCGTAATGTT . . .> AGTGTCACGGTGAGGGTCGTAATGCC . . .> AGTGAGAGAAGCAGGGTCGTAATCAC . . .. . .
Quality control, assign sequences to samples using barcode and denoise
align to reference alignment (e.g., using PYNAST), infer phylogeny (FastTree)Thousands of OTUs,
100’s of samples
OTU1
OTU2
OTU3
OTU1OTU2
OTU3
OTUq
RDP classifier
Species level OTUs can be summarized into higher levels
Cluster sequences into OTUs (97% level),
Assign lineages by
OTU: Operational Taxonomic Unit
H.Li (Penn) Microbiome data analysis April 25, 2012 6 / 42

Microbiome, Diseases, Technologies and Data
Penn Gut Microbiome Project - COMBO
� Cross-sectional study Of diet and stoolMicroBiOme composition (COMBO).
� Collaborators: Gary Wu and Jim Lewis(GI) and Rick Bushman (Microbiology).
� Data� 98 subjects/stool samples� ∼ 900, 000 high quality, partial ( 370bp)
16S rRNA gene sequences, 17, 303 OTUsat 97% similarity, 119 genera
� 214 nutrients (FFQ diet questionnaire),demographic data such as BMI.
� Goal: Assess the diet effect on gutmicrobiome composition; Assess theeffect of the microbiome on BMI afteradjusting for diet
Host lifestyle
Host pathobiology
Host environment
Transient communitymembers
Host immune system
Host physiology
Host genotype
Core human microbiome
Variable human microbiome
Nature 449, 804-810
H.Li (Penn) Microbiome data analysis April 25, 2012 7 / 42

Microbiome, Diseases, Technologies and Data
Penn Gut Microbiome Project - Results
Wu, Chen et. al (Science 2011).
Peonidin, anthocyanidinM
alvidin, anthocyanidinPetunidin, anthocyanidinTotal anthocyanidinsDelphinidin, anthocyanidinPelargonidin, anthocyanidinPotassiumPotassium
w/o suppl.M
agnesiumM
agnesium w/o suppl.
Free Choline, choline−contrib. metabolite
Free Choline w/o suppl.Natural Food FolateAOAC fiberPantothenic Acid w/o suppl.Naringenin, flavanoneVitam
in E w/o vit. suppl. Proanthocyanidin, 4−6m
ersProanthocyanidin, trim
ersProanthocyanidin, 7−10m
ersCyanidin, anthocyanidinProanthocyanidin, polym
ersProanthocyanidin, dim
ersCatechin, flavan−3−olAlcoholPhenylalanine, Aspartam
eAspartic Acid, Aspartam
eAspartam
efort. foodsCaffeineRetinolRetinol Equivalents of Vit ATotal Folate post 1998Folate Equivalents, suppl. & fort. foodsRiboflavin B2 w/o vit. pillsHistidineThreonineM
ethionineLysineLeucineTyrosineValineIsoleucineProteinPhenylalanineSerineTryptophanG
lycineAlanineArginineAsparateCholine, PhosphatidylcholineCholine, Phosphatidylcholine w/o suppl.Total Choline, no betaineCholine w/o suppl.Sum
of Betaine & CholineCystineG
lutamate
ProlineVitam
in D w/o vit. pillsCholine, G
lycerophosphocholineCholine, PhosphocholinePhosphorousPhosphorous w/o suppl.CalciumCalcium
w/o vit. pillsDairy ProteinDairy CalciumAnim
al ProteinCholine, Sphingom
yelinCholesterolTaurinePalm
itoleic fatty acidHydroxyprolineAnim
al fatc9,t11 conjug diene isom
er 18:2 LinoleicPalm
itic fatty acidSaturated fatStearic fatty acidPalm
itelaidic trans fatty acidSodiumDihydrophylloquinone Vitam
in K1 Trans O
leic fatty acidTotal TransTotal Trans/Cis Trans LinoleicEicosenoic fatty acidG
amm
a Linolenic fatty acidG
amm
a linolenic fatty acidFructoseG
lucoseCarbohydratesTotal SugarsSucroseG
lycemic Index
Maltose
Eriodictyol, flavononeAdded G
erm from
wheatsVitam
in E, Food Fortification
* * * * * * * * ** * * * * * * *
** * * * * * *
* * * ** * * * * * * * * * * * * * *
* * * * * *
* **
* * ** * * * * * * * * *
* * * ***
* * * ** * ** *
* * * * * * * * * ** * * * * ** * * * * * * * * * *
* * ** *
* * * * *
* * * * * * * * * * * * * * * * * * * * * * * * * * * * * * * * ** ** * *
**
* * * * * * * ** * * * * * * * * * *
* * * * * * * *
BacteroidesPrevotella−0.2
00.2
Spearman Correlation
PhylumFirm
icutesBacteroidetesActinobacteriaProteobacteria
Amino Acidsand
Choline
Fiberand
Plant DerivedCom
pounds
Fats
Carbohydrates
Fig. 1
H.Li (Penn) Microbiome data analysis April 25, 2012 8 / 42

Microbiome, Diseases, Technologies and Data
COMBO OTU Abundance Table
4030 . . . . . .4023 . . . . .4013 . . . . .4005 . . . . .3085 . . . . .3079 . . . . .3072 . . . . .3065 . . . . .3057 . . . . .3050 . . . . .3044 . . . . .3038 . . . . .3030 . . . . .3023 . . . . .3016 . . . . .3009 . . . . .3001
OTU abundances for the gut microbiome0 2 4 6 8 10
Log2
Actinobacteria Bacteroidetes Firmicutes Fusobacteria Proteobacteria TM7
ID
count
H.Li (Penn) Microbiome data analysis April 25, 2012 9 / 42

Microbiome, Diseases, Technologies and Data
Data Summarization and Statistical ChallengesData: n samples, q OTUs.
� LEVEL I: count data and phylogenetic tree (T )
yi = {yi1, · · · , yiq}, i = 1, · · · , n
� LEVEL II: proportion data and phylogenetic tree (T )
pi = {pi1, · · · , piq}, i = 1, · · · , n;
q∑j=1
pij = 1
� LEVEL III: distances between microbiome samples
dij = f(yi,yj , T ), i, j = 1, · · · , n
Statistical challenges
Phylogenetic information, count data and over-dispersion, dependencystructures of composition data etc.
H.Li (Penn) Microbiome data analysis April 25, 2012 10 / 42
Methods for Microbiome Data Analysis Kernel-based Score Test
Methods for Microbiome Data Analysis
Kernel-based Regression Methods and a Generalized UniFrac Distance(Chen and Li (2012): Bioinformatics, in revision.)
H.Li (Penn) Microbiome data analysis April 25, 2012 11 / 42

Methods for Microbiome Data Analysis Kernel-based Score Test
Notations and Problem Setup
Data
� yi: outcome (binary/continuous)
� xi = (xi1, · · · , xip): p covariates
� zi = (zi1, · · · , ziq): q OTUs on a phylogenetic tree (q large)
Goal
� Test the effect of z on y after adjusting for the effects of x.
Method
� Semi-parametric regression: g(µi;xi, zi) = xTi β + h(zi)
� µi: mean of the outcome variable� g(.): link function� h(z): modeled non-parametrically
� The goal becomes testing h(z) = 0
H.Li (Penn) Microbiome data analysis April 25, 2012 12 / 42

Methods for Microbiome Data Analysis Kernel-based Score Test
Kernel-based Estimation and Test
(Wahba 1990, Vapnik 1998, Schølkopf 2002, Liu et. al 2007,2008 )
Let h(.) ∈ HK , the function space generated by a kernel function K(., .). Liu et.al connected the kernel-based semi-parametric regression model to a generalizedmixed effects model:
g(µi) = xTi β + hi,
where β are fixed effects and h ∼ N(0, τK) are subject-specific random effects.
Testing h(z) = 0 is equivalent to the variance component test:
H0 : h(z) = 0⇔ H0 : τ = 0.
Score statistic
Q =1
2φ(y − µ̂0)TK(y − µ̂0)
The distribution of Q can be approximated by a scaled χ2 distribution.
H.Li (Penn) Microbiome data analysis April 25, 2012 13 / 42

Methods for Microbiome Data Analysis Kernel-based Score Test
Kernels for Microbiome Data
� Kernel as a similarity measure and create kernel from distance:
K = −1
2(I − 11′
n)D2(I − 11′
n),
where D is the distance matrix. It is easy to verify: D2ij = Kii +Kjj − 2Kij .
� The key is to use a distance that characterizes well the relationshipbetween microbiome samples.
� UniFrac distance is the most popular distance measure, but we willimprove on it.
H.Li (Penn) Microbiome data analysis April 25, 2012 14 / 42

Methods for Microbiome Data Analysis Kernel-based Score Test
UniFrac Distance (Knight 2005, 2007)
Unweighted UniFrac distance: the fraction of the branch length of the tree that is
unique to any community.
Unique Fraction (UniFrac) metric
• A branch length-based, qualitative phylogenetic β diversity measure
• Distance = fraction of the total branch length that is unique to any sample
A. Identical sequence sets: all seqs in red + blue set. 100% branch length shared (purple). UniFrac score = 0.
C. Unrelated sequence sets: seqs in red have no close relatives in blue. 0% branch length shared. UniFrac score = 1.
B. Related sequence sets: seqs in red have relatives in blue. ~50% branch length shared. UniFrac score = 0.5.
Red vs YellowShared=OrangeUniFrac = 0.3
Red vs BlueShared=PurpleUniFrac = 0.7
Yellow vs BlueShared=GreenUniFrac = 0.6
R YR
B
Y
B
0
0
0
.3
.3
.7
.7
.6
.6
R
Y
B
Distance Matrix Cluster of environments
D. UniFrac distances can be measured beween each pair of sequence sets on a single tree. The resulting distance matrix of pairwise distances can be used for clustering, PCoA, and other multivariate analyses.
Lozupone and Knight. UniFrac: a new phylogenetic method for comparing microbial communities. AEM, 2005.
� Most efficient in detecting thedifference in communitymembership
� Also difference in rare lineages,differs in probability of being pickedup by the sequencing machine
Weighted UniFrac distance:
Formula
dW =
m∑i=1
bi
∣∣∣pAi − pBi ∣∣∣m∑i=1
bi
∣∣∣pAi + pBi
∣∣∣� Most efficient in detecting
difference in abundant lineages
� Absolute difference puts too muchweight on abundant lineages
H.Li (Penn) Microbiome data analysis April 25, 2012 15 / 42

Methods for Microbiome Data Analysis Kernel-based Score Test
Generalized UniFrac Distances
(Chen and Li, 2012 Bioinformatics, revision)
Weighted and unweighted UniFrac place too much emphasis either onabundant lineages or rare lineages. We propose generalized UniFracdistance to fill the holes.
Generalized UniFrac Distance
d(α) =
m∑i=1
bi(pAi + pBi )α
∣∣∣∣pAi − pBipAi + pBi
∣∣∣∣m∑i=1
bi(pAi + pBi )α
,
where α ∈ [0, 1] controls the weight. From α = 1 to 0, more emphasis isplaced on low abundance lineages. When α = 1, d(α) is reduced to dW ;When α = 0 and pi = I(pi > 0), d(α) is reduced to dU .
H.Li (Penn) Microbiome data analysis April 25, 2012 16 / 42

Methods for Microbiome Data Analysis Kernel-based Score Test
Simulation
� Proportions are generated from a DirichletDistribution
(pi1, pi2, · · · , piq) ∼ D(π1, π2, · · · , πq, θ)
� Counts are generated from a Multinomial Distribution
(zi1, zi2, · · · , ziq) ∼M(pi1, pi2, · · · , piq, ni)
� Outcome depends on the underlying proportions of aselected OTU cluster
yi ∼ N(
qs∑j=1
αsjpisj , 1) OR
yi ∼ B(1,1
1 + exp{−∑qsj=1 αsjpisj}
)
H.Li (Penn) Microbiome data analysis April 25, 2012 17 / 42

Methods for Microbiome Data Analysis Kernel-based Score Test
Power Comparison - Binary Outcome
n = 100. An OTU cluster affects a disease outcome.
Effect
Pow
er
0.2
0.4
0.6
0.8
0.2
0.4
0.6
0.8
Cluster 12 (19.4%)
●
●
●
●
●
●
●
●
●
●
Cluster 4 (1.5%)
●
●
●
●
●
●
●
●
●
●
2 4 6 8 10
Cluster 13 (5.7%)
●
●
●
●
●
●
●
●
●
●
Cluster 19 (0.3%)
●
●
●
●
●
●
●
●
●
●
2 4 6 8 10
Kernel type● dW d(0.5) d(0) dU L
H.Li (Penn) Microbiome data analysis April 25, 2012 18 / 42

Methods for Microbiome Data Analysis Kernel-based Score Test
Power Comparison - Continuous Outcome
n = 100. An OTU cluster affects a quantitative trait.
Effect
Pow
er
0.2
0.4
0.6
0.8
1.0
0.2
0.4
0.6
0.8
1.0
Cluster 12 (19.4%)
●
●
●
●
●
●
●
● ● ●
Cluster 4 (1.5%)
●
●
●
●
●
●
●
●
●
●
2 4 6 8 10
Cluster 13 (5.7%)
●
●
●
●
●
●
●
● ● ●
Cluster 19 (0.3%)
●
●
●
●
●
●
●
●
●
●
2 4 6 8 10
Kernel type● dW d(0.5) d(0) dU L
H.Li (Penn) Microbiome data analysis April 25, 2012 19 / 42

Methods for Microbiome Data Analysis Kernel-based Score Test
Application to COMBO Data
Microbiome’s effects on BMI (n = 98).
Kernel type dW d(0.5) d(0) dU
p-value (original scale) 0.22 0.03 4.3E-5 6.7E-6p-value (dichotomized by 25) 0.21 0.02 7.9E-5 4.2E-5
Fat intake is a confounding factor, since it is correlated with both BMI(r = 0.32, p = 0.001) and microbiome composition (p < 0.05). Kernel-basedscore test after adjusting for fat intake:
Kernel type dW d(0.5) d(0) dU
p-value (microbiome) 0.36 0.11 6.5E-3 3.3E-3p-value (fat) 0.001 0.006 0.012 0.036
Conclusion: Microbiome composition can affect BMI independent of fat intake.
H.Li (Penn) Microbiome data analysis April 25, 2012 20 / 42

Methods for Microbiome Data Analysis Sparse Dirichlet-multinomial regression
Methods for Microbiome Data Analysis
Sparse Dirichlet-multinomial Regression for Taxon-level Analysis(Chen and Li (2012): Annals of Applied Statistics, in revision)
H.Li (Penn) Microbiome data analysis April 25, 2012 21 / 42

Methods for Microbiome Data Analysis Sparse Dirichlet-multinomial regression
Notations and Problem Setup
Data
� yi = (yi1, · · · , yiq): q OTU counts
� xi = (xi1, · · · , xip): p covariates/nutrients
Goal
� Select covariates and their affected OTUs - an association graph.
Method� Sparse regression model
� Probability distribution for the count data� Link function that connects the counts to covariates� Penalty function used to induce sparsity
H.Li (Penn) Microbiome data analysis April 25, 2012 22 / 42

Methods for Microbiome Data Analysis Sparse Dirichlet-multinomial regression
Overdispersion of OTU Counts
H.Li (Penn) Microbiome data analysis April 25, 2012 23 / 42

Methods for Microbiome Data Analysis Sparse Dirichlet-multinomial regression
Dirichlet-Multinomial DistributionA compound distribution
fDM (y1, y2, · · · , yq;γ) =
∫fM (y1, y2, · · · , yq;π)fD(π;γ)dπ
� OTU counts follow a Multinomial distribution
fM (y1, y2, · · · , yq;π) =
(y+y
) q∏j=1
πyjj , y+ =
q∑j=1
yj
� OTU composition follows a Dirichlet distribution
fD(π1, π2, · · · , πq;γ) =Γ(γ+)∏qj=1 Γ(γj)
q∏j=1
πγj−1j , γ+ =
q∑j=1
γj
q OTUs ⇒ q free parameters γ1, γ2, · · · , γq. γj ∝ E(Yj) and γ+ =∑qj=1 γj
controls the degree of overdispersion.H.Li (Penn) Microbiome data analysis April 25, 2012 24 / 42

Methods for Microbiome Data Analysis Sparse Dirichlet-multinomial regression
Link Function
Effects of covariates on jth OTU:
γj(xi;βj∗) = exp(βj0 +
p∑k=1
βjkxik),
βjk indicates the strength of kth covariate on jth OTU, βj0 determinesthe baseline abundance of jth OTU. β: q × (p+ 1) coefficient matrix.
βq0 βq1 … … βqk … … βqp
… … … … … … … …
βj0 βj1 … … βjk … … βjp
… … … … … … … …
β10 β11 … … β1k … … β1p
β*0 β*1 β*k β*p
βq*
βj*
β1*
γq(xi; βq*)
γj(xi; βj*)
γ1(xi; β1*)
Intercept k th nutrient
j th OTU
H.Li (Penn) Microbiome data analysis April 25, 2012 25 / 42

Methods for Microbiome Data Analysis Sparse Dirichlet-multinomial regression
Likelihood Ratio Test (LRT)
Log-likelihood function
l(β;Y,X) =
n∑i=1
Γ̇
q∑j=1
γj(xi;βj∗)
− Γ̇
q∑j=1
yij +
q∑j=1
γj(xi;βj∗)
+
q∑j=1
{Γ̇(yij + γj(xi;βj∗)
)− Γ̇
(γj(xi;βj∗)
)} .LRT for kth covariate effect
H0 : β1k = · · · = βqk = 0 vs H1 : (β1k, · · · , βqk) ∈ IRq\0.
H0 : βjk = 0.
H.Li (Penn) Microbiome data analysis April 25, 2012 26 / 42

Methods for Microbiome Data Analysis Sparse Dirichlet-multinomial regression
Likelihood Ratio Test (LRT) cont’d
� Application� LRT can be used for testing the association of a covariate with the overall
microbiome composition.
� Limitations� It does not tell which OTUs account for the association� If only a few OTUs are effected, LRT can be less powerful due to large DFs� Multiple testing problems especially with multiple correlated covariates
� Alternative� Variable selection approach based on penalization.
H.Li (Penn) Microbiome data analysis April 25, 2012 27 / 42

Penalized Maximum Likelihood Estimation (PMLE)Goal: select microbiome-associated covariates - nonzero columns of βand their associated OTUs - nonzero βjk in the selected columns.
βq0 βq1 … … βqk … … βqp
… … … … … … … …
βj0 βj1 … … βjk … … βjp
… … … … … … … …
β10 β11 … … β1k … … β1p
β*0 β*1 β*k β*p
βq*
βj*
β1*
γq(xi; βq*)
γj(xi; βj*)
γ1(xi; β1*)
Intercept k th nutrient
j th OTU
Penalized likelihood estimation: β̂ = argmin pl(β;Y,X, c, λ)
pl(β;Y,X, c, λ) = −l(β;Y,X) +
sparse group l1︷ ︸︸ ︷cλ
p∑k=1
√q ‖β∗k‖2︸ ︷︷ ︸
group l1
+ (1− c)λp∑k=1
‖β∗k‖1︸ ︷︷ ︸l1
,
‖β∗k‖2 =
√√√√ q∑j=1
β2kj , ‖β∗k‖1 =
q∑j=1
|βkj |.

Methods for Microbiome Data Analysis Sparse Dirichlet-multinomial regression
Block Coordinate Gradient Descent Algorithm
(Tseng 2007, Meier 2008)
Step Algorithm
1 Let β ∈ IRq×(p+1) be an initial parameter vector2 For k = 0, · · · , p
d← arg mind|d∗t=0,t6=k{plQ(d)}if d 6= 0α← line searchβ ← β + αdend
end3 Repeat step 2 until some convergence criterion is met
An inexact line search using the Armijo rule is performed. Let α(t) be the largest value in
{α0δl}l≥0 such that pl(β̂(t)
+ α(t)d(t))− pl(β̂(t)) ≤ α(t)σ∆(t), where 0 < δ < 1, 0 < σ < 1,
α0 > 0, and ∆(t) is the improvement in the objective function pl(β) using a linear
approximation.
H.Li (Penn) Microbiome data analysis April 25, 2012 29 / 42

Methods for Microbiome Data Analysis Sparse Dirichlet-multinomial regression
Simulation Strategy
� Two growth models
� Exponential growth: πij =exp{βj0+
∑pk=1 βjkxik}∑q
j=1 exp{βj0+∑p
k=1 βjkxik}� Linear growth: πij =
βj0+∑p
k=1 βjkxik∑qj=1(βj0+
∑pk=1 βjkxik)
� Counts are generated by
f∗DM (y1, y2, ..., yq ;π, θ) =(y+y
)∏qj=1
∏yjk=1{πj(1− θ) + (k − 1)θ}∏y+
k=1{1− θ + (k − 1)θ},
θ is the overdispersion parameter.
� 100 samples, ∼ 5000 reads each sample, 40 genus-level OTUs, 100covariates, 4 relevant covariates with each affecting 4 OTUs.θ = 0.025.
� Evaluate selection performance using Recall, Precision and F1 measure.
H.Li (Penn) Microbiome data analysis April 25, 2012 30 / 42

Methods for Microbiome Data Analysis Sparse Dirichlet-multinomial regression
Simulation - PMLE (DM vs D vs M, SGL vs L)DM - Dirichlet-multinomial; D - Dirichlet; M - Multinomial regression models
SGL - sparse group l1 penalty; L - l1 penalty. The tuning parameters are selected
based on BIC with the coefficients re-estimated.
Mea
sure
0.0
0.2
0.4
0.6
0.8
0.0
0.2
0.4
0.6
0.8
Recall Precision F1
Within−group
Group
DM−L DM−SGL D−L D−SGL M−L M−SGL
H.Li (Penn) Microbiome data analysis April 25, 2012 31 / 42

Methods for Microbiome Data Analysis Sparse Dirichlet-multinomial regression
Simulation - PMLE (Model Misspecification)
DM - Dirichlet-multinomial; D - Dirichlet; M - Multinomial regression models
SGL - sparse group l1 penalty; L - l1 penalty.M
easu
re 0.0
0.2
0.4
0.6
0.8
0.0
0.2
0.4
0.6
0.8
Recall
Exponentialgrowth
Lineargrowth
Precision
Exponentialgrowth
Lineargrowth
F1
Exponentialgrowth
Lineargrowth
Within−group
Group
DM−L DM−SGL D−L D−SGL M−L M−SGL
H.Li (Penn) Microbiome data analysis April 25, 2012 32 / 42
Methods for Microbiome Data Analysis Sparse Dirichlet-multinomial regression
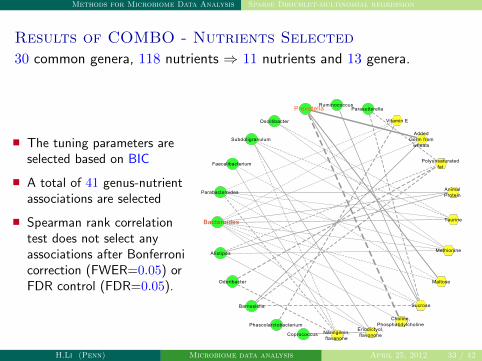
Results of COMBO - Nutrients Selected
30 common genera, 118 nutrients ⇒ 11 nutrients and 13 genera.
� The tuning parameters areselected based on BIC
� A total of 41 genus-nutrientassociations are selected
� Spearman rank correlationtest does not select anyassociations after Bonferronicorrection (FWER=0.05) orFDR control (FDR=0.05).
Alistipes
Oscillibacter
Bacteroides
Faecalibacterium
Subdoligranulum
Odoribacter
Parabacteroides
Naringenin,flavanone
ParasutterellaRuminococcus
Eriodictyol,flavonone
Prevotella
Barnesiella
Phascolarctobacterium
Coprococcus
Taurine
AddedGerm from
wheats
Choline,Phosphatidylcholine
Maltose
Methionine
Sucrose
Polyunsaturatedfat
Vitamin E
AnimalProtein
H.Li (Penn) Microbiome data analysis April 25, 2012 33 / 42

Methods for Microbiome Data Analysis Sparse Dirichlet-multinomial regression
Results of COMBO - Nutrients Selected
30 common genera, 118 nutrients ⇒ 11 nutrients and 13 genera.
Alistipes
Oscillibacter
Bacteroides
Faecalibacterium
Subdoligranulum
Odoribacter
Parabacteroides
Naringenin,flavanone
ParasutterellaRuminococcus
Eriodictyol,flavonone
Prevotella
Barnesiella
Phascolarctobacterium
Coprococcus
Taurine
AddedGerm from
wheats
Choline,Phosphatidylcholine
Maltose
Methionine
AnimalProtein
Polyunsaturatedfat
Vitamin E
Sucrose
H.Li (Penn) Microbiome data analysis April 25, 2012 34 / 42

Methods for Microbiome Data Analysis Sparse Dirichlet-multinomial regression
Results of COMBO - Nutrients Selected
30 common genera, 118 nutrients ⇒ 11 nutrients and 13 genera.
Alistipes
Oscillibacter
Bacteroides
Faecalibacterium
Subdoligranulum
Odoribacter
Parabacteroides
Naringenin,flavanone
ParasutterellaRuminococcus
Eriodictyol,flavonone
Prevotella
Barnesiella
Phascolarctobacterium
Coprococcus
Taurine
AddedGerm from
wheats
Choline,Phosphatidylcholine
Maltose
Methionine
Sucrose
Polyunsaturatedfat
Vitamin E
AnimalProtein
H.Li (Penn) Microbiome data analysis April 25, 2012 35 / 42

Methods for Microbiome Data Analysis Sparse Dirichlet-multinomial regression
Results of COMBO - Nutrients Selected
30 common genera, 118 nutrients ⇒ 11 nutrients and 13 genera.
Odoribacter
Bacteroides
Alistipes
Faecalibacterium
Parabacteroides
Barnesiella
Subdoligranulum
Parasutterella
Oscillibacter Vitamin E
AddedGerm from
wheats
Polyunsaturatedfat
PrevotellaRuminococcus
Choline,Phosphatidylcholine
Methionine
Coprococcus
Maltose
Taurine
Naringenin,flavanone
PhascolarctobacteriumEriodictyol,flavonone
Sucrose
AnimalProtein
H.Li (Penn) Microbiome data analysis April 25, 2012 36 / 42

Methods for Microbiome Data Analysis Sparse Dirichlet-multinomial regression
Results of COMBO Data Analysis - Model Fit 1
Fit the DM model with the selected 41 coefficients and compare it to the model
with intercepts only (null model). The log likelihood for the two models are
−60082 and −60202, respectively. ∆ = 120.
0 20 40 60 80 100
020
4060
8010
0
Model fitting with selected coefficients
Observed counts
Fitt
ed c
ount
s
r2= 0.79
0 20 40 60 80 100
020
4060
8010
0
Model fitting with intercepts only
Observed counts
Fitt
ed c
ount
s
r2= 0.70
H.Li (Penn) Microbiome data analysis April 25, 2012 37 / 42
Methods for Microbiome Data Analysis Sparse Dirichlet-multinomial regression
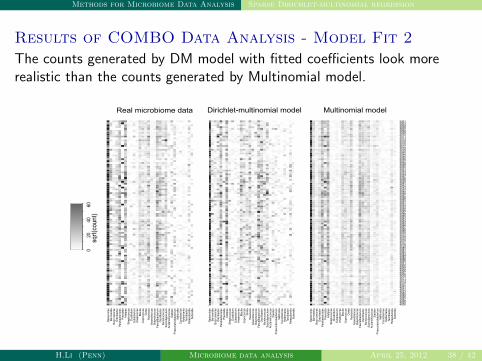
Results of COMBO Data Analysis - Model Fit 2
The counts generated by DM model with fitted coefficients look morerealistic than the counts generated by Multinomial model.
Bact
eroi
des
Barn
esie
llaBu
tyric
imon
asO
dorib
acte
rPa
raba
cter
oide
sPr
evot
ella
Alist
ipes
Stre
ptoc
occu
sCl
ostri
dium
Euba
cter
ium
Anae
rovo
rax
Blau
tiaCo
proc
occu
sDo
rea
Rose
buria
Anae
rotru
ncus
Buty
ricico
ccus
Faec
alib
acte
rium
Osc
illiba
cter
Rum
inoc
occu
sSu
bdol
igra
nulu
mAc
idam
inoc
occu
sDi
alist
erPh
asco
larc
toba
cter
ium
Veillo
nella
Copr
obac
illus
Hold
eman
iaTu
ricib
acte
rPa
rasu
ttere
llaSu
ttere
lla
40304029402840274026402540244023402240214020401740144013401140104009400740064005400440024001400030863085308430833082308130803079307830773076307530743072307030693068306730663065306430633062306030593057305630553053305230513050304930483047304630453044304330423041304030393038303730343033303230313030302930283027302630253023302230203019301830173016301530143013301130103009300830073006300430033001
020
4060
sqrt(
coun
t)
Real microbiome data Dirichlet-multinomial model Multinomial model
H.Li (Penn) Microbiome data analysis April 25, 2012 38 / 42

Methods for Microbiome Data Analysis Sparse Dirichlet-multinomial regression
Summary
� Kernel-based regression methods for testing the significance ofmicrobiome composition on an outcome� Phylogenetic information can be readily incorporated into kernels� Adjusting the effects of other covariates is natural� Extension: tune α and get a valid p-value
� Sparse Dirichlet-multinomial regression model for selectingmicrobiome-associated covariates and their affected OTUs� Dirichlet-multinomial model is used to account for overdispersion of OTU
counts� Sparse group l1 penalty is used for simultaneous selection of both
covariates and OTUs� Extension: incorporate the phylogenetic tree information by imposing a
smoothness penalty (Chen and Li, 2012 Biostatistics, in revision)
H.Li (Penn) Microbiome data analysis April 25, 2012 39 / 42

Future work
Future Direction
� Modeling phylogenetic information, overdispersion and excessive zerosunder a common framework
� Dissecting the relationship between host genotypes, microbiome anddisease
� Correlating different microbial communities: bacterial, fungi, archealand viral communities
� Computational and statistical analysis of shotgun metagenomic data� Assembly, taxonomic classification, function prediction, etc.� Modeling the metagenome using Latent Dirichlet Allocation (LDA)
� Integrating metagenomics, meta-transcriptomics and meta-proteomics
H.Li (Penn) Microbiome data analysis April 25, 2012 40 / 42

Future work
Acknowledgements
Many thanks to:
� Jun Chen, PhD student
� Rick Bushman, PhD (Microbiology)
� Gary Wu, MD (Gastroenterology)
� James Lewis, MD (Gastroenterology)
� People in their labs.
H.Li (Penn) Microbiome data analysis April 25, 2012 41 / 42

Future work
Thank you!
H.Li (Penn) Microbiome data analysis April 25, 2012 42 / 42