statistical process control - opusworks - speed toasq.qualitycampus.com/guides/com_000_01100.pdf ·...
TRANSCRIPT

Statistical Process Control SPC Starter Kit
Student Guide

First Edition (July 1992), Second Edition (July 1995), Third Edition (December 2000) Fourth Edition (February 2003) Please address any reader comments to The Quality Group, 6059 Boylston Drive, Suite 250, Atlanta, GA 30328. The Quality Group may use or distribute any of the information you supply in any way it believes appropriate without incurring any obligation. You may, of course, continue to use the information you supply. Copyright © 1992, 1995. All rights reserved.
Table of Contents
SPC Starter Kit Course Introduction………………………………………... ……1
SPC and Variation………………………………………………….………. ……3
The Challenge of Quality……………………………………………………. ……5
Quality Control by Inspection……………………………………………….. ……7
SPC……………………………………………………………………………. ……9
So What?……………………………………………………………………… …..14
Data and Variation…………………………………………………………. …..17
What are Variables and Attribute Data?…………………………………… …..19
What is Variation?……………………………………………………………. …..26
Pictures of Numbers…………………………………………………………. …..37
Histograms: Pictures of Numbers…………………………………………. …..40
Specs and Process Capability……………………………………………… …..54
Introduction to Control Charts…………………………………………….. …..65
What is a Control Chart?……………………………………………………. …..68
What Are Control Charts Used For?……………………………………….. …..73
Control Chart Rules………………………………………………………….. …..76
How Are Control Charts Used?…………………………………………….. …..78
What You Can and Can’t Do with Control Charts?………………………. …..81
Glossary………………………………………………………………………... …..91

SPC Starter Kit
Contents This course group contains three courses. SPC and Variation You'll learn what SPC is and how it differs from the usual method of quality control. You'll also see the benefits of using SPC, both for you and your company. The principles underlying SPC are introduced using a marble and funnel experiment. Two different kinds of variation are defined, and you'll see that SPC can be used to help detect unusual variation in manufacturing processes. Pictures of Numbers Histograms are a way to make the patterns caused by variation visible. You'll learn to name the parts of a histogram and see how we can use histograms to help us understand some aspects of how processes behave. Introduction to Control Charts You'll see what control charts are and how they are used to detect special causes of variation in a process. You'll also learn the parts of the control chart and the role each part plays in helping you control a process. Finally, you'll learn some basic rules for interpreting control charts.
SPC Starter Kit -- SPC and Variation Page 1

VARIATION
Page 2 SPC Starter Kit – SPC and Variation

SPC and Variation
Highlights: What is SPC?
Making quality products is very important. • Customers demand high-quality products.
• To be competitive in the global marketplace, quality is more important than ever.
The cost of ensuring quality through inspection is high. • Defects, rework, scrap, and inspections cost money.
• Detection methods of quality control have been effective in the past, but very costly.
Statistical Process Control (SPC) is a method that reduces our production costs and gives us even better control over our quality. SPC can help you: • Keep track of your process, and make adjustments
before defective parts are produced.
• Detect or identify causes of defects.
SPC Starter Kit -- SPC and Variation Page 3
P
Terms Defined in theGlossary
• Statistical Process Control (SPC)
• Statistical Control
• Detection method
• Prevention method
• Process
• Sample
age 4 SPC Starter Kit – SPC and Variation
Content Review
The Challenge of Quality Quality can be defined as making a product that is as close to our standard of excellence as possible. Those words are chosen carefully because some companies define quality as making a product acceptable to the customer. We know that's not good enough, because we are serious about competing in the marketplace. Our products must continue to be better than good.
An example American automakers have been learning the lessons of quality the hard way. The market share of major American automakers has been slipping steadily over the past 15 years while Japanese and other foreign manufacturers have increased market share. Because of their crisis, American automakers are changing how they look at quality, as well as the way they make cars. The auto-buying public has demanded the highest quality at the lowest cost. Not only are American automakers working hard to install quality improvement programs in their factories, they are now imposing their standards of quality on their suppliers. For example, a transmission used in an American car came from two different suppliers. Both met spec. However, one transmission performed better because there was less difference or "play" from one piece to another. This supplier was using SPC while the other was not. The supplier using SPC was making parts closer to the target value. It was not long before the other supplier realized he would soon be losing business unless he began to use SPC as well.
SPC Starter Kit -- SPC and Variation Page 5
Making parts to spec wasn't good enough for the auto maker. It was more important to make transmission parts closer to the target value so that repairs costs would be avoided or minimal. They needed transmissions that were consistently the same, with no differences from one part or one transmission to the other; in other words, better than spec. Clearly only those suppliers who can guarantee high-quality parts can survive in this kind of demanding, competitive marketplace. Put simply, people would rather buy high-quality products because they work better and last longer. To win business from new customers and keep old customers, we must produce high-quality products consistently. Less waste and scrap, and less inspection, together with higher yields, will reduce our costs.
The answer
to the competition
High Quality Products + Lower Manufacturing Costs = Competitive
Edge To improve our quality and lower costs, we need to control how we make each part of our products. By controlling such things as our methods of production, our materials, and our tools, we can control the quality of our products. And, if we can control the quality, we can improve the quality. Let's look at two ways of achieving quality: Quality Control by Inspection and SPC.
Page 6 SPC Starter Kit – SPC and Variation
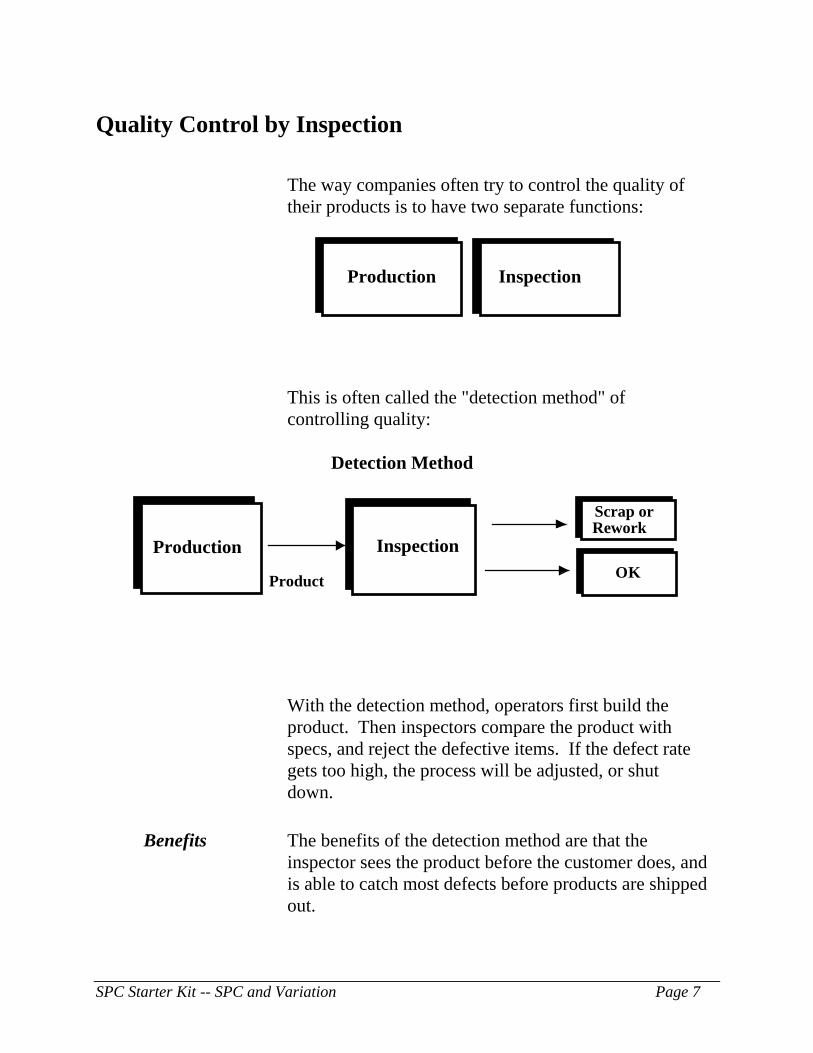
Quality Control by Inspection The way companies often try to control the quality of their products is to have two separate functions:
Production Inspection
This is often called the "detection method" of controlling quality:
Detection Method
Production Inspection
Scrap orRework
OKProduct
With the detection method, operators first build the product. Then inspectors compare the product with specs, and reject the defective items. If the defect rate gets too high, the process will be adjusted, or shut down.
Benefits The benefits of the detection method are that the inspector sees the product before the customer does, and is able to catch most defects before products are shipped out.
SPC Starter Kit -- SPC and Variation Page 7
Drawbacks The drawbacks of the detection method are that the inspector may miss defects, and the product may get shipped out accidentally. The extra step of inspection costs a lot. Defects are caught at the point where products are most expensive, usually at the end of the line. The biggest drawback is that the inspection process only catches defects and doesn't always provide timely or specific information about why the defects were made in the first place.
Page 8 SPC Starter Kit – SPC and Variation
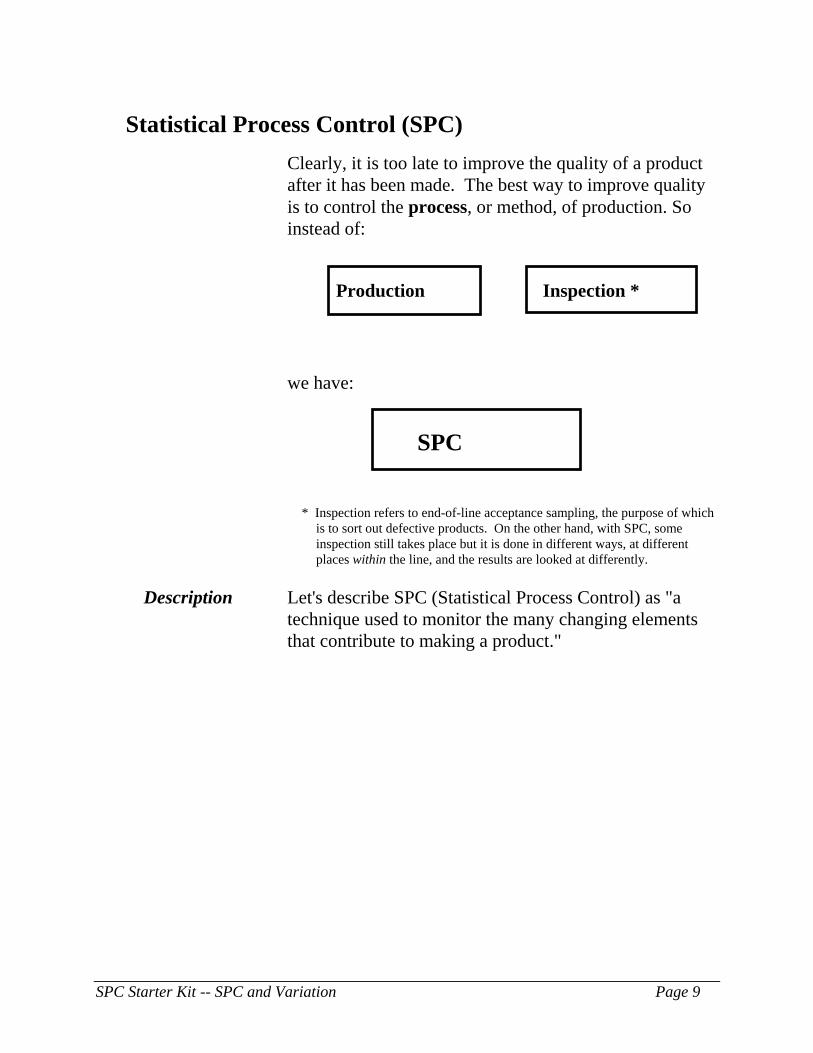
Statistical Process Control (SPC) Clearly, it is too late to improve the quality of a product after it has been made. The best way to improve quality is to control the process, or method, of production. So instead of:
Production Inspection *
we have:
SPC
* Inspection refers to end-of-line acceptance sampling, the purpose of which
is to sort out defective products. On the other hand, with SPC, some inspection still takes place but it is done in different ways, at different places within the line, and the results are looked at differently.
Description Let's describe SPC (Statistical Process Control) as "a technique used to monitor the many changing elements that contribute to making a product."
SPC Starter Kit -- SPC and Variation Page 9

This is often called the "prevention method" of controlling quality:
Prevention Method
Production with SPC Inspection OKProduct Possible reduction
or eliminationSelective Measurement- Tools- Process- Product
As the illustration shows, an operator monitors both process and quality by using SPC. With SPC, the operator uses techniques to keep track of how the process is doing by measuring tool, process or product parameters. It's simply a method for getting the process to talk to us. If the process starts to drift, often the operator can correct it before it produces defects. If we understand how the parts of the process change and vary, we can improve the process to make sure the change is as small as possible. Inspection of the product afterwards can be reduced and sometimes eliminated. By keeping "in touch" with the process, SPC can help you answer these questions:
1. Is the process changing or consistent?
2. Is the process capable of making high-quality products?
Page 10 SPC Starter Kit – SPC and Variation
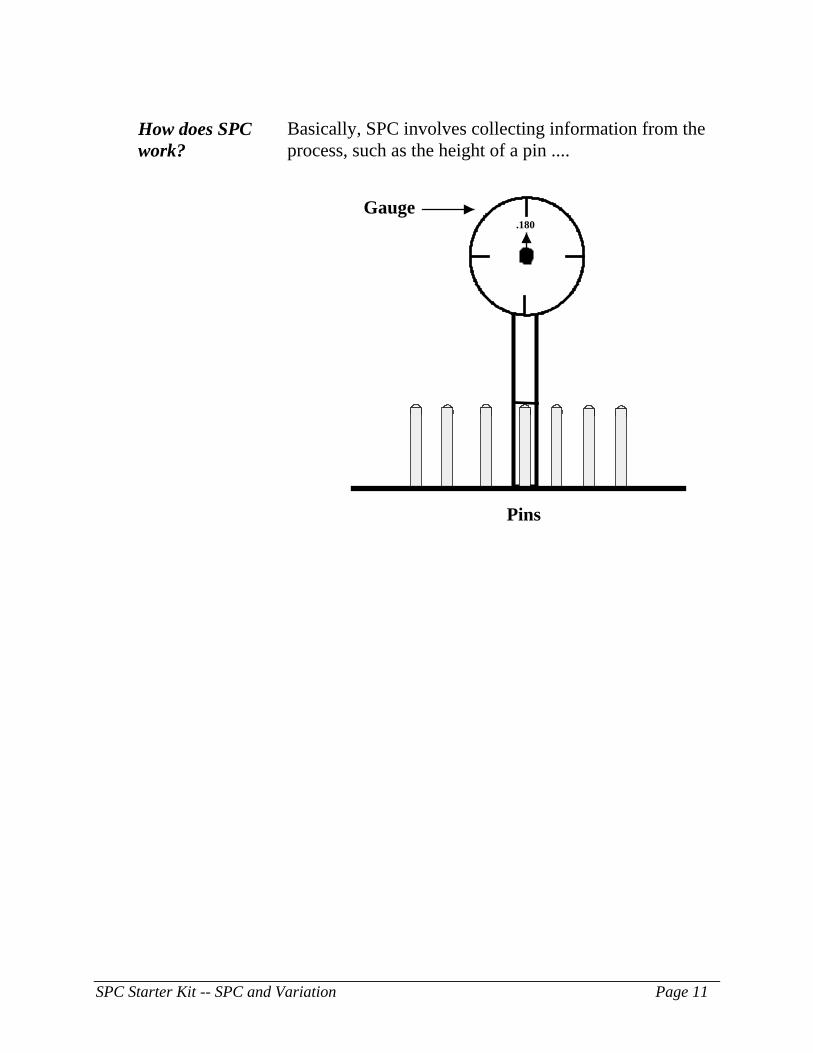
How does SPC work?
Basically, SPC involves collecting information from the process, such as the height of a pin ....
.180Gauge
Pins
SPC Starter Kit -- SPC and Variation Page 11
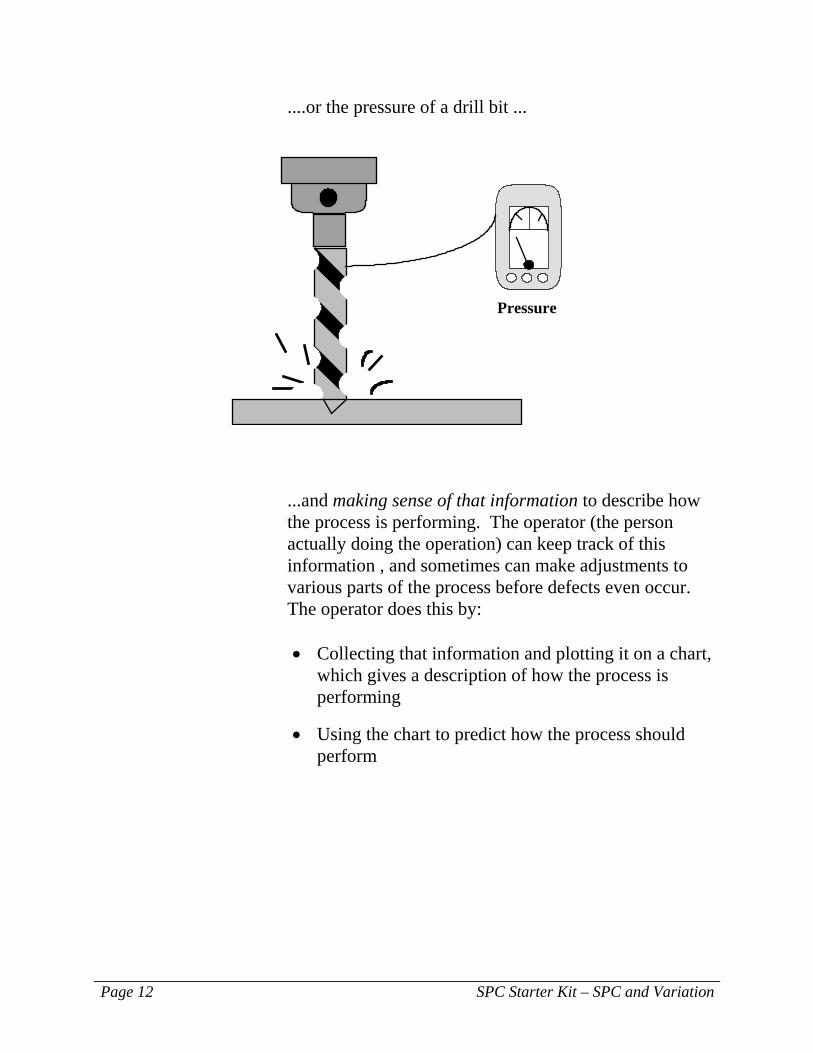
....or the pressure of a drill bit ...
Pressure
...and making sense of that information to describe how the process is performing. The operator (the person actually doing the operation) can keep track of this information , and sometimes can make adjustments to various parts of the process before defects even occur. The operator does this by: • Collecting that information and plotting it on a chart,
which gives a description of how the process is performing
• Using the chart to predict how the process should perform
Page 12 SPC Starter Kit – SPC and Variation
So, SPC is nothing more than making the process talk to us through the information we collected and plotted on charts. It can tell us when there are all kinds of changes in the process, such as: • Height of a pin
• Pressure of a drill bit
• Photoresist thickness
• Plating thickness
• Line-width dimensions
• Wear on a bearing
If we understand how the parts of the process change or vary, we can improve the process to ensure that the change is as small as possible.
SPC Starter Kit -- SPC and Variation Page 13

So What? There are many benefits to using SPC, some of which have a direct, positive impact on you. Generally, SPC means: • Less cost to make the product
• Less reworking of the product, and less need for inspection
• Less scrap and waste
• Higher quality, yields, and productivity
• Satisfied customers (whether they be the consumer,or the next person down the line from you)
But, equally importantly, SPC gives you: • More of a sense of control over the process, and your
workstation
• A more interesting and challenging job
• An expanded role in the making of a product
• Potentially, more satisfaction for you personally if you are successful in finding and correcting the cause of defects, as well as career opportunities in the field of SPC
Page 14 SPC Starter Kit – SPC and Variation

Most of all, using SPC can help you feel that you are part of a team. It can go a long way in helping to strengthen the relationships and communication between shifts.
SPC Starter Kit -- SPC and Variation Page 15

VARIATION
Page 16 SPC Starter Kit – SPC and Variation
SPC and Variation
Highlights: Data and Variation
Data can tell us how well or how poorly our process is doing. • This information lets us compare and evaluate how
the process is behaving, and should behave in the future.
• Both variables data and attribute data tell us something about the process.
To build quality into our products, we have to fight variation in the process. • Some variation in a process is unavoidable.
• Variation in a process tends to form a pattern, which can help us predict how the process will perform.
• Our goal is to eliminate unusual or excessive variation with SPC.
SPC Starter Kit -- SPC and Variation Page 17
Variation can be caused by both common causes and special causes. • If the variation is relatively small and is stable, we
are more likely to make quality products. The variation is probably due to common causes.
• If there is a lot of variation and the process is unstable, our products will drop in quality. That kind of variation is probably due to special causes.
It is very important that we know the difference between common causes and special causes. • SPC will help us find out whether the variation is due
to common or special causes.
• The best way to keep track of how a process is behaving is to make the process "talk to us" by putting the numbers into pictures.
Terms Defined in the Glossary
• Data
• Variation
• Special cause
• Common cause
• Variables data
• Attribute data
Page 18 SPC Starter Kit – SPC and Variation
Content Review
What are Variables and Attribute Data?
One way of learning about a process is by collecting data about it. Data is simply a collection of numbers that tell us what the tool or process is doing. For example, the following numbers could all be data about a process:
Measurementdata,information
• 22 mils off center
• 1800 RPM
• 2 bent pins per board
When organized and presented in a picture, data can give you valuable information about how well or how poorly a process is operating. This is the basic idea of SPC. This information about a process allows you to evaluate how the process is behaving, and should behave. There are two types of data that we could collect in a process:
Types of data
• Variables data
• Attribute data
SPC Starter Kit -- SPC and Variation Page 19

Variables data Variables data is measured and can have many different values, such as length, pressure, or temperature. Measurements such as .027 inches, 35.6 psi, or 210 degrees F are all variables data.
Attribute data Data that is counted rather than measured (for example, a part is accepted or not, go/no-go, yes/no, pass/fail, or good/bad) is called attribute data. Attribute data focuses on one attribute or characteristic of a process, such as accepted or rejected. Foreign material counts or defects per hundred panels could all be attribute data -- collecting counts of one attribute or characteristic of a process.
Examples of variables andattribute data
Let's look at the drill from the previous unit:
Pressure
Page 20 SPC Starter Kit – SPC and Variation

Here is the kind of information both types of data would tell us:
Attribute Data Variables Data Hole goes through
or not How fast the drill is
going in revolutions per second
Hole is on center or not
Pressure of the drill on the work in pounds per square inch
Drill bit has gone through the material, or has not
How close to center the hole is in inches
Both attribute and variables data can be used to monitor a process. However, variables data gives you more information. If you have a choice, use variables data because you can better understand the changes taking place. So, data can tell us a lot of information. When data is collected and viewed, what was thought to be a constant process can be shown to contain small fluctuations or changes. These changes represent the variation of the process and are the subject of our next lesson.
SPC Starter Kit -- SPC and Variation Page 21
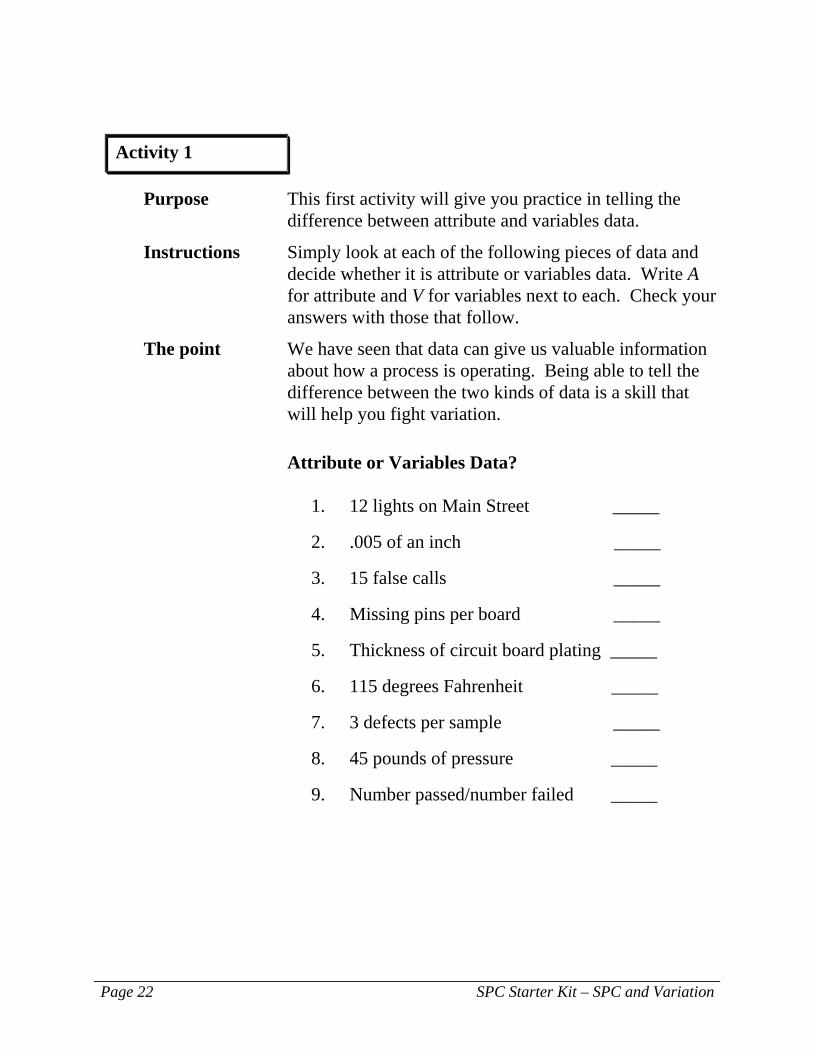
Activity 1
Purpose This first activity will give you practice in telling the difference between attribute and variables data.
Instructions Simply look at each of the following pieces of data and decide whether it is attribute or variables data. Write A for attribute and V for variables next to each. Check your answers with those that follow.
The point We have seen that data can give us valuable information about how a process is operating. Being able to tell the difference between the two kinds of data is a skill that will help you fight variation. Attribute or Variables Data?
1. 12 lights on Main Street _____
2. .005 of an inch _____
3. 15 false calls _____
4. Missing pins per board _____
5. Thickness of circuit board plating _____
6. 115 degrees Fahrenheit _____
7. 3 defects per sample _____
8. 45 pounds of pressure _____
9. Number passed/number failed _____
Page 22 SPC Starter Kit – SPC and Variation

10. Number of "yes's"/number of "no's" _____
11. Number accepted/number rejected _____
12. .0025 mm _____
13. Go/no-go _____
14. Good/bad _____
SPC Starter Kit -- SPC and Variation Page 23

Attribute or Variables Data?
Answers to Activity 1
1. 12 lights on Main Street A
Counting the number of lights
2. .005 of an inch V
Measuring part of an inch
3. 15 false calls A
Counting the number of false calls
4. Missing pins per board A
Counting the missing pins per board
5. Thickness of circuit board plating V
Measuring the thickness of plating
6. 115 degrees Fahrenheit V
Measuring the temperature
7. 3 defects per sample A
Counting the number of defects in a sample
8. 45 pounds of pressure V
Measuring the amount of pressure
9. Number passed/number failed A
Counting the numbers in these two categories
Page 24 SPC Starter Kit – SPC and Variation

10. Number of "yes's"/number of "no's" A
Counting the numbers in these two categories
11. Number accepted/number rejected A
Counting the numbers in these two categories
12. .0025 mm V
Measuring the length in millimeters
13. Go/no-go A
Counting the number of "go's" and "no-go's"
14. Good/bad A
Counting the number of "good" and "bad"
SPC Starter Kit -- SPC and Variation Page 25

What is Variation?
Things vary The results of a process change each time an activity or operation occurs, because no two activities or operations are exactly alike. Things that contribute to these changes include the raw material, the machine itself, the operator, and the measuring instrument. To build quality into our products, we have to keep variation in the process to a minimum. Variation is the enemy of quality. In manufacturing, we fight variation with SPC! And SPC fights variation by using data. Even though the operation may appear to be the same, it really does change. Consider the following examples: • Temperatures in a routine process hover between two
and three degrees of each other.
• We get 20 miles per gallon one week and 22 miles
per gallon the next.
Page 26 SPC Starter Kit – SPC and Variation
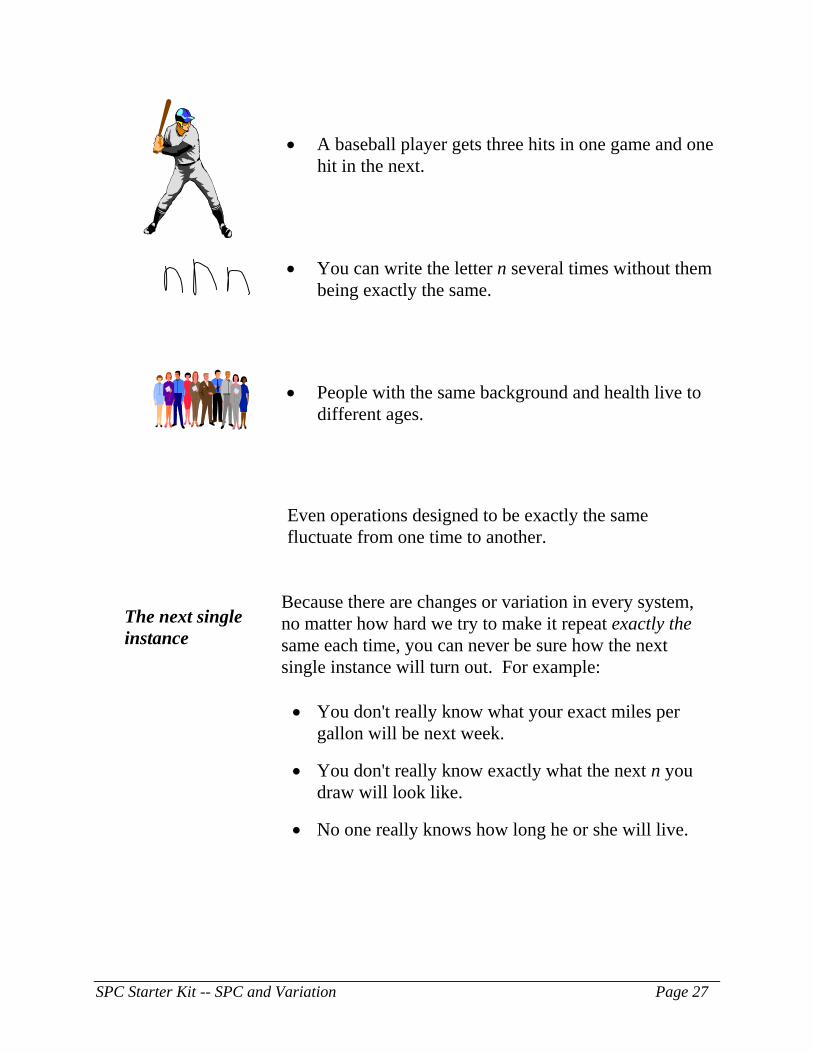
• A baseball player gets three hits in one game and one hit in the next.
• You can write the letter n several times without them being exactly the same.
• People with the same background and health live to different ages.
Even operations designed to be exactly the same fluctuate from one time to another.
Because there are changes or variation in every system, no matter how hard we try to make it repeat exactly the same each time, you can never be sure how the next single instance will turn out. For example:
The next single instance
• You don't really know what your exact miles per
gallon will be next week.
• You don't really know exactly what the next n you draw will look like.
• No one really knows how long he or she will live.
SPC Starter Kit -- SPC and Variation Page 27
Variations form a predictable pattern
However, when all these changes are looked at together, they form a pattern from which we can predict fairly accurately how the next set of activities or operations should act. For example: • A baseball player with a batting average of .350 will
probably get a hit out of the next three at-bats.
• If you know you get about 25 miles per gallon in the city and 30 miles per gallon on the highway, chances are you can predict your mileage for next week if you know where you'll be driving.
• There is something about the way you make n's that makes them distinct and recognizable.
• Despite the fact that people don't know how long they will live, insurance companies can tell you with great accuracy what percentage of people will live to different ages.
By looking at variation, we are able to describe how a group of individual samples clusters around a central point. Knowing this can help us evaluate how a process behaves and predict how it should behave in the future.
Why is understanding variation so important?
Page 28 SPC Starter Kit – SPC and Variation
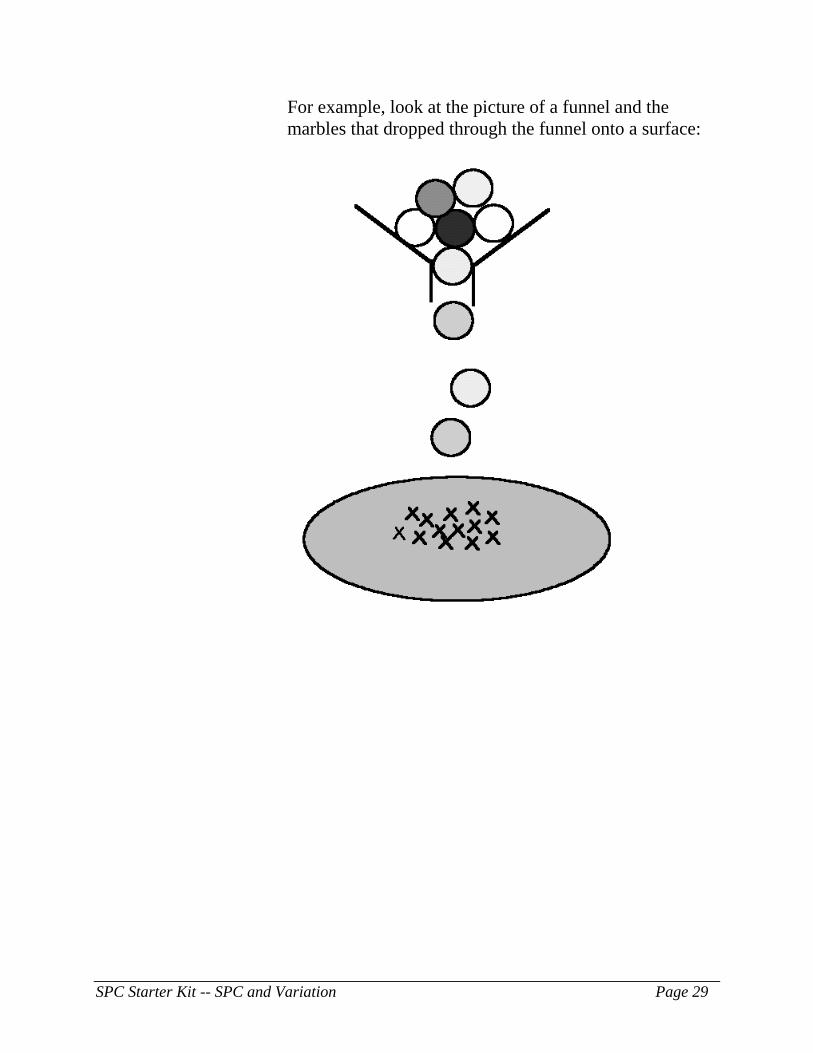
For example, look at the picture of a funnel and the marbles that dropped through the funnel onto a surface:
SPC Starter Kit -- SPC and Variation Page 29

Each marble is the same, and if the funnel never changes, the marbles still don't land in exactly the same place every time. Where they do end up actually forms a pattern that allows us to see the general area where they are most likely to land the next time.
Page 30 SPC Starter Kit – SPC and Variation
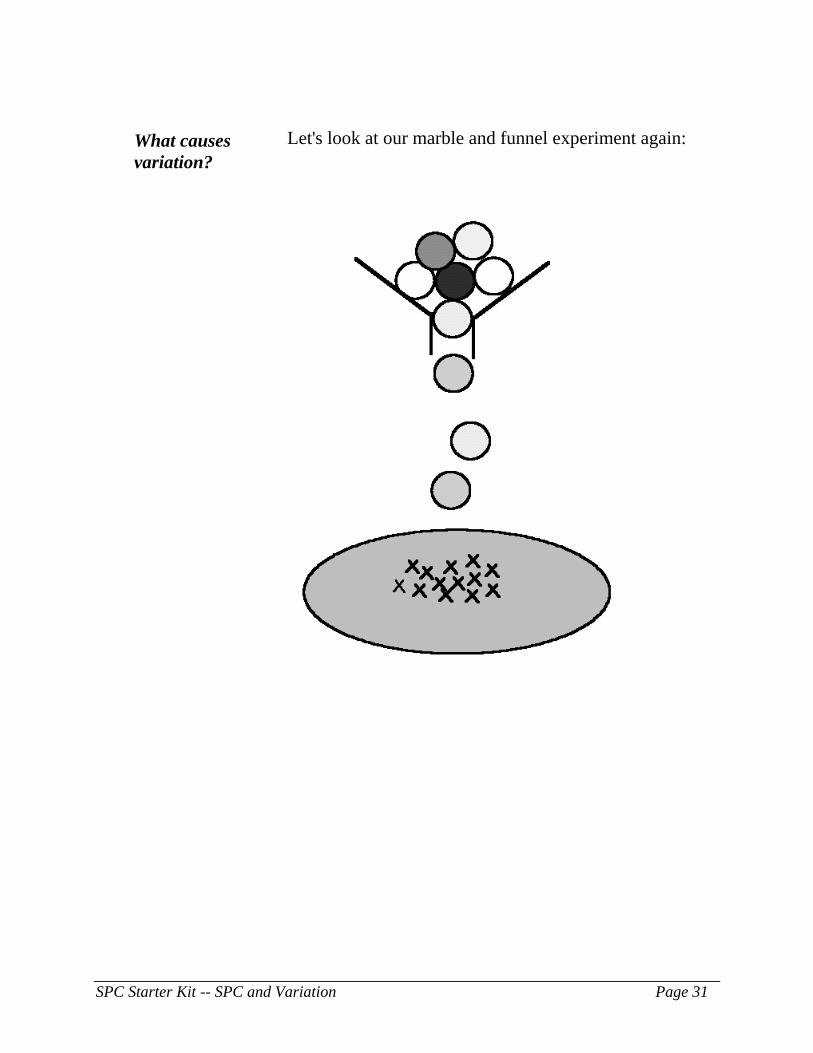
What causes variation?
Let's look at our marble and funnel experiment again:
SPC Starter Kit -- SPC and Variation Page 31

Suppose two of the marbles were chipped or not quite as round as the others. That may well affect how they would fall through the funnel. If they landed away from the other X's, we would say that the difference from the others' landing pattern was due to special causes; in this case, being chipped or not perfectly round. You will notice that most of the other marbles dropped in about the same place, although not exactly the same. This slight variation is simply due to common causes -- causes that are natural to the system itself.
Special causes Special causes, like the chipped marbles, tend to produce relatively large, unusual variations. They often come from outside the process -- for example, from a bad batch of raw material, or a voltage surge. Special causes can quickly make a process unpredictable, and could create a lot of defects and scrap. Common causes tend to produce regular variations -- differences of a mil or two between two sets of holes, or differences of temperature in a clean room. These come from small changes in material or environment, and from the design of the tool or process itself.
Common causes
Examples Let's look again at some familiar examples, and compare special causes with common causes: • A common cause of a change in room temperature
may be the number of lights on in the room or the number of people. A special cause may be a broken furnace or a window left open.
Page 32 SPC Starter Kit – SPC and Variation

• A common cause of a change in the water level of a swimming pool may be ordinary evaporation, sporadic rainfall, or normal swimming activities. A special cause may be a leak, a series of severe thunderstorms, or a broken filter pipe.
• A common cause of a change in the amount of time it takes to drive the same route to work each day could be a slight change in the amount of traffic from day to day or having to stop at one more or less traffic light. A special cause could be construction on another road that forces more traffic to travel on your route or a local school holiday that dramatically reduces traffic volume.
SPC fights variation
To help us achieve higher quality at lower costs, we need to be able to distinguish between special causes of variation, which can create a lot of defects and should be investigated, and common causes, which are a part of the process itself. It is often hard to tell where variation comes from just by looking at it. For example, a special cause may keep coming back if not corrected, until that variation looks so regular that you mistake it for a common cause. What SPC does for us in the manufacturing setting is give us the ability to monitor and control a lot of the problems we couldn't go after before. Our goal is to make our process predictable. Since special causes make our process unpredictable, we use SPC to help detect, identify, and eliminate special causes of variation.
SPC Starter Kit -- SPC and Variation Page 33
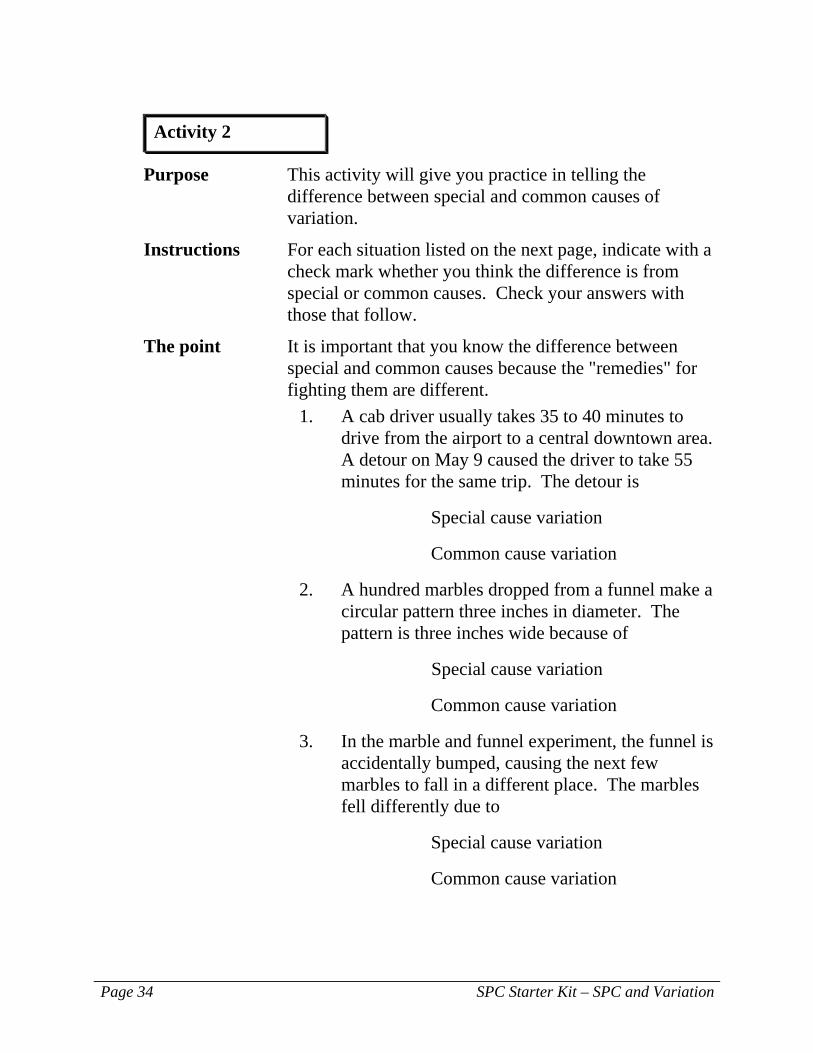
Activity 2
Purpose This activity will give you practice in telling the difference between special and common causes of variation.
Instructions For each situation listed on the next page, indicate with a check mark whether you think the difference is from special or common causes. Check your answers with those that follow.
The point It is important that you know the difference between special and common causes because the "remedies" for fighting them are different.
1. A cab driver usually takes 35 to 40 minutes to drive from the airport to a central downtown area. A detour on May 9 caused the driver to take 55 minutes for the same trip. The detour is
Special cause variation
Common cause variation
2. A hundred marbles dropped from a funnel make a circular pattern three inches in diameter. The pattern is three inches wide because of
Special cause variation
Common cause variation
3. In the marble and funnel experiment, the funnel is accidentally bumped, causing the next few marbles to fall in a different place. The marbles fell differently due to
Special cause variation
Common cause variation
Page 34 SPC Starter Kit – SPC and Variation
4. A person drives to work every day without getting lost. One day, because she couldn't find her car keys, she was late and anxious about getting to work on time. As she was driving, she was thinking about what she would say to her boss and she missed a turn. Her distractions were
Special cause variation
Common cause variation
5. The basketball team at the local high school has been scoring between 75 and 85 points a game for the last 10 games. On Parents Day, the team scored 105 points, beating their opponents by over 35 points. Having parents watching the game may have been a
Special cause variation
Common cause variation
SPC Starter Kit -- SPC and Variation Page 35
Answers to Activity 2
1. Special cause variation: A detour is something unusual.
2. Common cause variation: The three-inch-wide pattern is a "natural" and stable pattern that emerges after a number of marbles drop.
3. Special cause variation: When the funnel was bumped, the funnel height changed, causing the marbles to fall in a different place.
4. Special cause variation: Losing her keys and being distracted and anxious were unusual events that changed the normal pattern of getting work.
Special cause variation: Having parents watching in the stands may have been the reason more points than usual were scored.
Page 36 SPC Starter Kit – SPC and Variation