statistics on growth, energy, and … on growth, energy, and bilateral trade in the greater mekong...
TRANSCRIPT

+
STATISTICS ON GROWTH, ENERGY, AND BILATERAL TRADE IN THE GREATER MEKONG SUBREGIONTHIRD EDITION
Greater Mekong Subregion
18–20 September 2017 • Ha Noi, Viet Nam


STATISTICS ON GROWTH, ENERGY, AND BILATERAL TRADE IN THE GREATER MEKONG SUBREGIONTHIRD EDITION
Greater Mekong Subregion
18–20 September 2017 • Ha Noi, Viet Nam


Contents
Foreword xiAcknowledgments xiiAbbreviations xiii
Key Macro Indicators 1Table 1.1A: Gross Domestic Product at Purchasing Power Parity
(Current international dollars, billion) 2Table 1.1B: Gross Domestic Product at Market Prices (Current $, billion) 2Table 1.1C: Gross Domestic Product at Purchasing Power Parity
(Constant 2005 international dollars, billion) 3Figure 1.1: Gross Domestic Product at Purchasing Power Parity
(Constant 2005 international dollars, trillion, and % growth rate) 3Table 1.1D: Gross Domestic Product at Market Prices (Constant 2005 $, billion) 4Figure 1.2: GMS Gross Domestic Product at Market Prices
(Constant 2005 $, billion, and % growth rate) 4Table 1.2A: GMS Gross Domestic Product (% Growth rate, weighted by GDP at PPP
current international dollars) 5Table 1.2B: GMS Gross Domestic Product (% Growth rate, weighted by GDP
at market prices, current $) 5Figure 1.3: Comparative GMS Gross Domestic Product (% Growth rate) 6Table 1.3A: Gross Domestic Product per Capita at Purchasing Power Parity
(Current international dollars) 7Figure 1.4: Gross Domestic Product per Capita at Purchasing Power Parity, 2015
(Current international dollars) 7Table 1.3B: Gross Domestic Product per Capita at Market Prices (Current $) 8Figure 1.5: Gross Domestic Product per Capita at Market Prices, 2015 (Current $) 8Table 1.3C: Gross Domestic Product per Capita at Purchasing Power Parity
(Constant 2005 international dollars) 9Figure 1.6: Gross Domestic Product per Capita at Purchasing Power Parity, 2015
(Constant 2005 international dollars) 9Table 1.3D: Gross Domestic Product per Capita at Market Prices (Constant 2005 $) 10Figure 1.7: Gross Domestic Product per Capita at Market Prices, 2015 (Constant 2005 $) 10Table 1.4: Total Population (Million) 11Table 1.5: Total Merchandise Exports ($ million) 11Table 1.6: Total Merchandise Imports ($ million) 12

iv
Table 1.7: Merchandise Trade Balance ($ million) 12Figure 1.8: GMS Merchandise Trade and Trade Balance ($ billion) 13Table 1.8: Total Services Exports ($ million) 14Table 1.9: Total Services Imports ($ million) 14Table 1.10: Total Services Trade Balance ($ million) 15Figure 1.9: GMS Services Trade and Trade Balance ($ billion) 15Table 1.11: Intra-GMS Trade ($ billion and % share) 16Figure 1.10: Intra-GMS Trade ($ billion and % share) 16Table 1.12: Total GMS Bilateral Foreign Direct Investment Inflows, 2010–2015 ($ million) 17Figure 1.11: Total GMS Bilateral Foreign Direct Investment Inflows, 2010–2015 ($ million) 17Table 1.13: Total GMS Foreign Direct Investment Inflows to Cambodia ($ million) 18Table 1.14: Total GMS Foreign Direct Investment Inflows to Guangxi, PRC ($ million) 18Table 1.15: Total GMS Foreign Direct Investment Inflows to Yunnan, PRC ($ million) 18Table 1.16: Total GMS Foreign Direct Investment Inflows to Lao PDR ($ million) 18Table 1.17: Total GMS Foreign Direct Investment Inflows to Myanmar ($ million) 19Table 1.18: Total GMS Foreign Direct Investment Inflows to Thailand ($ million) 19Table 1.19: Total GMS Foreign Direct Investment Inflows to Viet Nam ($ million) 19Table 1.20: Trade Openness (% of GDP) 20Figure 1.12: Trade Openness (% of GDP) 20Table 1.21A: GMS Foreign Direct Investment Inflows from the World ($ million) 21Table 1.21B: Foreign Direct Investment Openness (% of GDP) 21Figure 1.13: Foreign Direct Investment Openness (% of GDP) 22
Infrastructure 23Table 2.1: Roads, Passengers Carried (Million passenger-km) 24Table 2.2: Railways, Passengers Carried (Million passenger-km) 24Table 2.3: Air Transport, Volume of Passenger Traffic (Million passenger-km) 25Table 2.4: Waterways, Volume of Passenger Traffic (Million passenger-km) 25Figure 2.1: Passenger Traffic by Transport Mode—Guangxi, PRC (Billion passenger-km) 26Figure 2.2: Passenger Traffic by Transport Mode—Yunnan, PRC (Billion passenger-km) 26Figure 2.3: Passenger Traffic by Transport Mode—Lao PDR (Billion passenger-km) 27Figure 2.4: Passenger Traffic by Transport Mode—Myanmar (Billion passenger-km) 27Figure 2.5: Passenger Traffic by Transport Mode—Thailand (Billion passenger-km) 28Figure 2.6: Passenger Traffic by Transport Mode—Viet Nam (Billion passenger-km) 28Table 2.5: Roads, Goods Transported (Million ton-km) 29Table 2.6: Railways, Goods Transported (Million ton-km) 29Table 2.7: Air Transport, Freight (Million ton-km) 30Table 2.8: Waterways, Volume of Freight Traffic (Million ton-km) 30Figure 2.7: Goods Transported by Transport Mode—Guangxi, PRC (Billion ton-km) 31Figure 2.8: Goods Transported by Transport Mode—Yunnan, PRC (Billion ton-km) 31Figure 2.9: Goods Transported by Transport Mode—Lao PDR (Billion ton-km) 32Figure 2.10: Goods Transported by Transport Mode—Myanmar (Billion ton-km) 32Figure 2.11: Goods Transported by Transport Mode—Thailand (Billion ton-km) 33

v
Figure 2.12: Goods Transported by Transport Mode—Viet Nam (Billion ton-km) 33Table 2.9: Container Port Traffic (TEU ‘000) 34Table 2.10: Liner Shipping Connectivity Index 34Figure 2.13: Liner Shipping Connectivity Index 35Table 2.11: Liner Shipping Bilateral Connectivity Index 36Figure 2.14: Liner Shipping Bilateral Connectivity Index—Cambodia 38Figure 2.15: Liner Shipping Bilateral Connectivity Index—PRC 38Figure 2.16: Liner Shipping Bilateral Connectivity Index—Myanmar 39Figure 2.17: Liner Shipping Bilateral Connectivity Index—Thailand 39Figure 2.18: Liner Shipping Bilateral Connectivity Index—Viet Nam 40Table 2.12: Fixed Telephone Line Subscriptions (per 100 persons) 41Table 2.13: Internet Users (per 100 persons) 41Table 2.14: Mobile Cellular Subscriptions (per 100 persons) 42Figure 2.19: GMS ICT Subscriptions (per 100 persons) 42Table 2.15: Length of Roads (Kilometer) 43Figure 2.20: Length of Roads (Kilometer) 43Table 2.16: Rail Lines (Total route-km) 44Figure 2.21: Rail Lines (Total route-km) 44
Energy 45SUMMARY TABLESTable 3A 1.1: Total Primary Energy Production (Mtoe) 46Table 3A 1.2: Total Energy Imports (Mtoe) 46Table 3A 1.3: Total Energy Exports (Mtoe) 47Table 3A 1.4: Total Energy Trade Balance (Mtoe) 47Table 3A 1.5: Total Primary Energy Supply (Mtoe) 48Table 3A 1.6: Total Final Energy Consumption (Mtoe) 48Table 3A 1.7: Total Power Generation (TWh) 49Table 3A 1.8: Total Power Imports (TWh) 49Table 3A 1.9: Total Power Exports (TWh) 50Table 3A 1.10: Power Trade Balance (TWh) 50Table 3A 1.11: Total Power Supply (TWh) 51Table 3A 1.12: Total Final Power Consumption (TWh) 51Figure 3A 1.1: Energy Sector—GMS 52Figure 3A 1.2: Energy Sector—Cambodia 52Figure 3A 1.3: Energy Sector—Guangxi, PRC 53Figure 3A 1.4: Energy Sector—Yunnan, PRC 53Figure 3A 1.5: Energy Sector—Lao PDR 54Figure 3A 1.6: Energy Sector—Myanmar 54Figure 3A 1.7: Energy Sector—Thailand 55Figure 3A 1.8: Energy Sector—Viet Nam 55

vi
ENERGY INDICATORSTable 3B 1.1: Total Primary Energy Supply per Capita (toe/person) 56Table 3B 1.2: Total Final Energy Consumption per Capita (toe/person) 56Figure 3B 1.1: GMS Total Primary Energy Supply and Total Final Energy Consumption
per Capita (toe/person) 57Table 3B 1.3: Total Primary Energy Supply/GDP (toe/2005 PPP international dollar, million) 58Table 3B 1.4: Total Primary Energy Consumption/GDP
(toe/2005 PPP international dollar, million) 58Figure 3B 1.2: GMS Total Primary Energy Supply/GDP and Total Final Energy Consumption/GDP (toe/2005 PPP international dollar, million) 59Table 3B 1.5: Total Primary Energy Supply/GDP (toe/2005 $, million) 60Table 3B 1.6: Total Primary Energy Consumption/GDP (toe/2005 $, million) 60Figure 3B 1.3: GMS Total Primary Energy Supply/GDP and Total Final Energy Consumption/GDP
(toe/2005 $, million) 61Table 3B 1.7: Electricity Consumption per Capita (kWh/person) 62Figure 3B 1.4: GMS Electricity Consumption per Capita (kWh/person) 62Table 3B 1.8A: Oil Import Dependency Ratio by Total Imports (%) 63Table 3B 1.8B: Oil Import Dependency Ratio by Net Imports (%) 63Figure 3B 1.5: GMS Comparative Oil Dependency Ratios (%) 64
COUNTRY TABLESTable 3C 1.1: Primary Energy Production—Cambodia 65Table 3C 1.2: Energy Imports—Cambodia 65Table 3C 1.3: Energy Exports—Cambodia 66Table 3C 1.4: Total Primary Energy Supply—Cambodia 66Figure 3C 1.1: Primary Energy Supply—Cambodia 67Table 3C 1.5: Final Energy Consumption by Type—Cambodia 68Table 3C 1.6: Power Generation—Cambodia 68Figure 3C 1.2: Power Generation—Cambodia 69Table 3C 2.1: Primary Energy Production—Guangxi, PRC 70Table 3C 2.2: Intra-National Energy Transfers—Guangxi, PRC 70Table 3C 2.3: Energy Imports—Guangxi, PRC 71Table 3C 2.4: Energy Exports—Guangxi, PRC 71Table 3C 2.5: Total Primary Energy Supply—Guangxi, PRC 72Table 3C 2.6: Total Final Energy Consumption by Type—Guangxi, PRC 72Figure 3C 1.3: Primary Energy Supply—Guangxi, PRC 73Table 3C 3.1: Primary Energy Production—Yunnan, PRC 74Table 3C 3.2: Intra-National Energy Transfers—Yunnan, PRC 74Table 3C 3.3: Energy Imports—Yunnan, PRC 75Table 3C 3.4: Energy Exports—Yunnan, PRC 75Table 3C 3.5: Total Primary Energy Supply—Yunnan, PRC 76Table 3C 3.6: Total Final Energy Consumption by Type—Yunnan, PRC 76Figure 3C 1.4: Primary Energy Supply—Yunnan, PRC 77
vii
Table 3C 4.1: Primary Energy Production—Lao PDR 78Table 3C 4.2: Energy Imports—Lao PDR 78Table 3C 4.3: Energy Exports—Lao PDR 79 Table 3C 4.4: Primary Energy Supply—Lao PDR 79Figure 3C 1.5: Primary Energy Supply—Lao PDR 80Table 3C 4.5: Final Energy Consumption by Type—Lao PDR 81Table 3C 4.6: Power Generation—Lao PDR 81Figure 3C 1.6: Power Generation—Lao PDR 82Table 3C 5.1: Primary Energy Production—Myanmar 83Table 3C 5.2: Energy Imports—Myanmar 83Table 3C 5.3: Energy Exports—Myanmar 84Table 3C 5.4: Total Primary Energy Supply—Myanmar 84Figure 3C 1.7: Primary Energy Supply—Myanmar 85Table 3C 5.5: Final Energy Consumption by Type—Myanmar 86Table 3C 5.6: Power Generation—Myanmar 86Figure 3C 1.8: Power Generation—Myanmar 87Table 3C 6.1: Primary Energy Production—Thailand 88Table 3C 6.2: Energy Imports—Thailand 88Table 3C 6.3: Energy Exports—Thailand 89Table 3C 6.4: Total Primary Energy Supply—Thailand 89Figure 3C 1.9: Primary Energy Supply—Thailand 90Table 3C 6.5: Final Energy Consumption by Type—Thailand 91Table 3C 6.6: Power Generation—Thailand 91Figure 3C 1.10: Power Generation—Thailand 92Table 3C 7.1: Primary Energy Production—Viet Nam 93Table 3C 7.2: Energy Imports—Viet Nam 93Table 3C 7.3: Energy Exports—Viet Nam 94Table 3C 7.4: Total Primary Energy Supply—Viet Nam 94Figure 3C 1.11: Primary Energy Supply—Viet Nam 95Table 3C 7.5: Final Energy Consumption by Type—Viet Nam 96Table 3C 7.6: Power Generation—Viet Nam 96Figure 3C 1.12: Power Generation—Viet Nam 97
Bilateral Trade with Greater Mekong Subregion 99Table 4A 1.1: Trade with GMS—Cambodia 100Figure 4.1: Intra-GMS Trade—Cambodia 100 Figure 4.2: Trade with GMS—Cambodia 101Table 4A 1.2: Trade with GMS—PRC 102Figure 4.3: Intra-GMS Trade—PRC 102Figure 4.4: Trade with GMS—PRC 103Table 4A 1.3: Trade with GMS—Lao PDR 104Figure 4.5: Intra-GMS Trade—Lao PDR 104Figure 4.6: Trade with GMS—Lao PDR 105

viii
Table 4A 1.4: Trade with GMS—Myanmar 106Figure 4.7: Intra-GMS Trade—Myanmar 106Figure 4.8: Trade with GMS—Myanmar 107Table 4A 1.5: Trade with GMS—Thailand 108Figure 4.9: Intra-GMS Trade—Thailand 108Figure 4.10: Trade with GMS—Thailand 109Table 4A 1.6: Trade with GMS—Viet Nam 110Figure 4.11: Intra-GMS Trade—Viet Nam 110Figure 4.12: Trade with GMS—Viet Nam 111
Logistics and Trade Facilitation 113Table 5.1A: Overall Logistics Performance Index Rank 114Table 5.1B: Overall Logistics Performance Index 114Figure 5.1: Overall Logistics Performance Index Rank 114Table 5.2: Logistics Performance Index Score Ability to Track and Trace Consignments 115Figure 5.2: Logistics Performance Index Score Ability to Track and Trace Consignments 115Table 5.3: Logistics Performance Index Score Competence and Quality of Logistics Services 116Figure 5.3: Logistics Performance Index Score Competence and Quality of Logistics Services 116Table 5.4: Logistics Performance Index Score Ease of Arranging Competitively-Priced Shipments 117Figure 5.4: Logistics Performance Index Score Ease of Arranging Competitively-Priced Shipments 117Table 5.5: Logistics Performance Index Score Efficiency of Customs Clearance Process 118Figure 5.5: Logistics Performance Index Score Efficiency of Customs Clearance Process 118Table 5.6: Logistics Performance Index Score Frequency with which Shipments Reach
Consignee 119Figure 5.6: Logistics Performance Index Score Frequency with which Shipments Reach
Consignee 119Table 5.7: Logistics Performance Index Score Quality of Trade and Transport-Related
Infrastructure 120Figure 5.7: Logistics Performance Index Score Quality of Trade and Transport-Related
Infrastructure 120Table 5.8: Quality of Port Infrastructure 121Figure 5.8: Quality of Port Infrastructure 121Table 5.9: Burden of Customs Procedures 122Figure 5.9: Burden of Customs Procedures 122Table 5.10: OECD Trade Facilitation Indicators 123Figure 5.10A: OECD Trade Facilitation Indicators—Cambodia 124Figure 5.10B: OECD Trade Facilitation Indicators—PRC 124Figure 5.10C: OECD Trade Facilitation Indicators—Lao PDR 124Figure 5.10D: OECD Trade Facilitation Indicators—Myanmar 124Figure 5.10E: OECD Trade Facilitation Indicators—Thailand 125Figure 5.10F: OECD Trade Facilitation Indicators—Viet Nam 125

ix
Doing Business 127Table 6.1: Ease of Doing Business Rank 128Figure 6.1: Ease of Doing Business Rank 128Table 6.2: Time Required to Start a Business (Days) 129Figure 6.2: Time Required to Start a Business (Days) 129Table 6.3: Start-Up Procedures to Register a Business (Number) 130Figure 6.3: Start-Up Procedures to Register a Business (Number) 130Table 6.4: Time Required to Get Electricity (Days) 131Figure 6.4: Time Required to Get Electricity (Days) 131Table 6.5: Time Required to Enforce a Contract (Days) 132Figure 6.5: Time Required to Enforce a Contract (Days) 132Table 6.6: Documents Required for Export (Number) 133Table 6.7: Documents Required to Import (Number) 133Figure 6.6: Documents Required for Export and Import, 2014 (Number) 133Table 6.8: Time to Export (Days) 134Table 6.9: Time to Import (Days) 134Figure 6.7: Time to Export and Import, 2014 (Days) 134Table 6.10: Cost to Export ($ per container) 135Table 6.11: Cost to Import ($ per container) 135Figure 6.8: Cost to Export and Import, 2014 ($ per container) 135Table 6.12: Time to Resolve Insolvency (Years) 136Figure 6.9: Time to Resolve Insolvency (Years) 136Table 6.13A: Bilateral Trade Cost—Cambodia, Tariff and Nontariff (%) 137Table 6.13B: Bilateral Trade Cost—Cambodia, Nontariff (%) 137Figure 6.10: Bilateral Trade Cost—Cambodia, Tariff and Nontariff (%) 138Table 6.14A: Bilateral Trade Cost—PRC, Tariff and Nontariff (%) 139Table 6.14B: Bilateral Trade Cost—PRC, Nontariff (%) 139Figure 6.11: Bilateral Trade Cost—PRC, Tariff and Nontariff (%) 140Table 6.15A: Bilateral Trade Cost—Lao PDR, Tariff and Nontariff (%) 141Table 6.15B: Bilateral Trade Cost—Lao PDR, Nontariff (%) 141Figure 6.12: Bilateral Trade Cost—Lao PDR, Tariff and Nontariff (%) 142Table 6.16A: Bilateral Trade Cost—Thailand, Tariff and Nontariff (%) 143Table 6.16B: Bilateral Trade Cost—Thailand, Nontariff (%) 143Figure 6.13: Bilateral Trade Cost—Thailand, Tariff and Nontariff (%) 144Table 6.17A: Bilateral Trade Cost—Viet Nam, Tariff and Nontariff (%) 145Table 6.17B: Bilateral Trade Cost—Viet Nam, Nontariff (%) 145Figure 6.14: Bilateral Trade Cost—Viet Nam, Tariff and Nontariff (%) 146
Appendixes 147References 149


xi
This is the third edition of the Greater Mekong Subregion (GMS) statistical booklet produced by the GMS Secretariat of the Regional Cooperation and Operations Coordination Division, Southeast Asia Department, Asian Development Bank (ADB). This newest edition improves on the previous ones, with the inclusion of two new important chapters: the Energy Sector, and GMS Bilateral Trade. The GMS energy sector includes basic energy indicators; data on supply, production, and consumption of energy and power; energy and power trade; and a set of country tables with disaggregated data by type of fuel. The chapter on bilateral trade includes data within GMS, and between GMS and the world. In this edition, estimation of some existing indicators have also been improved through the use of provincial rather than national data, where possible. Moreover, new data have been added, most important of which are time series estimates of constant gross domestic product and supply-side infrastructure indicators.
The GMS Secretariat published and disseminated the first statistical database booklet at the 20th Ministerial Conference, Nay Pyi Taw, Myanmar, in September 2015. The first booklet consisted of five chapters of data, indicators, and figures on the Millennium Development Goals, regional macroeconomy, transport infrastructure, merchandise and services trade, as well as logistics performance and trade facilitation. The second edition extended the time series for all indicators back to 1992, the inception year of GMS. More diversified indicators were added and estimated to capture sectoral characteristics and structural shifts, and definitions are included for all indicators.
To date, a GMS online statistical database (http://www.greatermekong.org/statistics/) subsite, launched in November 2016, houses all data and indicators. Work on the subsite is being done to make it fully interactive.
The GMS is an economic area bound together by the Mekong River, covering 2.6 million square kilometers, with a combined population of 339 million as of 2015. The GMS countries are Cambodia, the People’s Republic of China (specifically Yunnan Province and Guangxi Zhuang Autonomous Region), Lao People’s Democratic Republic, Myanmar, Thailand, and Viet Nam. In 1992, with assistance from ADB, the six countries entered into a project-based program of subregional economic cooperation in sectors such as agriculture, energy, environment, human resource development, private sector investment, telecommunications, tourism, trade, and transport. As of end-December 2016, ADB has provided $7.3 billion for investments and $130.7 million for technical assistance.
Coung Minh NguyenPrincipal Regional Cooperation SpecialistHead, GMS SecretariatRegional Cooperation and Operations Coordination DivisionSoutheast Asia DepartmentAsian Development BankSeptember 2017
Foreword

xii
Cuong Minh Nguyen, principal regional cooperation specialist and head of the Greater Mekong Subregion Secretariat, Southeast Asia Department (SERD), Asian Development Bank (ADB), managed the publication of the third edition of this booklet. Elizabeth S. Tan, economist (consultant) prepared the data and coordinated the production. Substantial comments were provided by the Greater Mekong Subregion Secretariat; ADB resident missions in Cambodia, People’s Republic of China, Lao People’s Democratic Republic, Myanmar, Thailand, and Viet Nam; SERD sector divisions; and the Economic Research and Regional Cooperation Department of ADB.
Erickson Mercado (consultant graphic artist) did the layout and design of the report. Carmelo Ubay (IT and web consultant), provided assistance in generating tables and figures. The report was edited by Ma. Theresa Mercado (consultant editor) and proofread by Judy Yniguez (consultant proofreader).
Josephine Duque-Comia and Cira T. Rudas of the Regional Cooperation and Operations Coordination Division, SERD, provided valuable administrative support during the review, approval, and printing process.
Alfredo PerdigueroDirectorRegional Cooperation and Operations Coordination DivisionSoutheast Asia DepartmentAsian Development Bank September 2017
Acknowledgments

xiii
Abbreviations
ADB Asian Development Bank
ARIC ADB Asian Regional Integration Center
ASEAN Association of Southeast Asian Nations
EBOPS Extended Balance of Payments Services Classification
ESCAP Economic and Social Commission for Asia and the Pacific
FDI foreign direct investment
GDP gross domestic product
GMS Greater Mekong Subregion
GNI gross national income
ICT information and communication technology
IEA International Energy Agency
IMF International Monetary Fund
kWh kilowatt-hour
km kilometer
Lao PDR Lao People’s Democratic Republic
LPI logistics performance index
Mtoe million ton of oil equivalent
OECD Organisation for Economic Co-operation and Development
PPP purchasing power parity
PRC People’s Republic of China
toe ton of oil equivalent
TWh terawatt-hour
UNCOMTRADE United Nations Commodity Trade
UNCTAD United Nations Conference on Trade and Development


01Key Macro Indicators

2
STATISTICS ON
GRO
WTH
, ENERG
Y, AN
D BILATERA
L TRAD
E IN TH
E GREATER M
EKON
G SU
BREGIO
N
Table 1.1A: Gross Domestic Product at Purchasing Power Parity (Current international dollars, billion)
Item 1992 1993 1994 1995 1996 1997 1998 1999 2000 2001 2002 2003 2004 2005 2006 2007 2008 2009 2010 2011 2012 2013 2014 2015
GMS 455 510 565 626 683 736 731 780 840 902 982 1,080 1,184 1,325 1,471 1,629 1,752 1,834 2,019 2,178 2,385 2,567 2,729 2,902Cambodia 5 7 8 9 9 10 10 12 13 15 16 18 20 23 27 30 33 33 35 39 42 46 50 54Guangxi, PRC 35 42 49 55 59 64 68 72 77 84 94 104 122 139 165 193 221 246 289 334 367 404 440 475Yunnan, PRC 33 38 40 45 53 59 65 70 74 79 86 94 109 121 139 158 179 195 218 254 290 331 360 385Lao PDR 5 5 6 6 7 8 8 9 10 10 11 12 13 15 16 18 20 23 23 26 28 32 34 37Myanmar … … … … … 34 37 41 48 55 63 73 85 99 116 133 150 167 183 197 215 237 262 286Thailand 300 334 368 406 438 433 404 429 459 485 523 572 624 671 726 786 816 816 888 914 998 1,041 1,068 1,110Viet Nam 76 85 94 105 117 129 138 146 160 175 190 208 211 256 282 310 334 355 382 414 444 476 513 553
.... data not available at the time of this publication, GDP = gross domestic product, GMS = Greater Mekong Subregion, Lao PDR = Lao People’s Democratic Republic, PPP = purchasing power parity, PRC = People’s Republic of China. GDP at PPP is estimated by valuing gross domestic product, at a common currency and uniform price level, using PPP conversion factors. GDP is the sum of the gross value-added by all resident producers in the economy plus any taxes and minus any subsidies not included in the value of the products. PPP conversion factor is the number of units of country B’s currency needed in country B to purchase the same quantity of an individual good or service, which one unit of country A’s currency can purchase in country A. Sources: GMS Secretariat estimates using data from the Asian Development Bank Statistical Database System. https://sdbs.adb.org. (accessed December 2016); Guangxi Statistical Bureau. 2016. Guangxi Statistical Yearbook. Beijing: [People’s Republic of] China Statistics Press; International Monetary Fund. World Economic Outlook Database. https://www.imf.org/external/pubs/ft/weo/2016/01/weodata/index.aspx (accessed February 2017); and Statistical Bureau of Yunnan Province. 2016. Yunnan Statistical Yearbook. Beijing: [People’s Republic of] China Statistics Press.
Table 1.1B: Gross Domestic Product at Market Prices (Current $, billion)
Item 1992 1993 1994 1995 1996 1997 1998 1999 2000 2001 2002 2003 2004 2005 2006 2007 2008 2009 2010 2011 2012 2013 2014 2015
GMS 148 166 192 228 252 224 191 207 221 218 241 274 315 359 423 513 621 645 772 906 1,006 1,101 1,148 1,170Cambodia 2 3 3 3 4 3 3 4 4 4 4 5 5 6 7 9 10 10 11 13 14 15 17 18Guangxi, PRC 10 11 14 18 20 22 23 24 25 28 30 34 41 49 60 77 101 114 141 181 207 233 255 270Yunnan, PRC 10 10 11 15 18 20 22 23 24 26 28 31 37 42 50 63 82 90 107 138 163 191 209 219Lao PDR 1 1 2 2 2 2 1 1 2 2 2 2 2 3 4 4 5 6 7 8 9 11 12 12Myanmar … … … … … … … … 9 6 7 10 11 12 15 20 32 37 50 60 60 60 66 63Thailand 115 129 146 169 183 150 114 127 126 120 134 152 173 189 222 263 291 282 341 371 397 420 404 395Viet Nam 10 13 16 21 25 27 27 29 31 33 35 40 45 58 66 77 99 106 116 136 156 171 186 194
.... data not available at the time of this publication, GDP = gross domestic product, GMS = Greater Mekong Subregion, Lao PDR = Lao People’s Democratic Republic, PRC = People’s Republic of China. GDP at purchaser’s prices is the sum of gross value added by all resident producers in the economy plus any product taxes and minus any subsidies not included in the value of the products. It is calculated without making deductions for depreciation of fabricated assets or for depletion and degradation of natural resources. Dollar figures for GDP are converted from domestic currencies using single year official exchange rates. For countries where the official exchange rate does not reflect the rate effectively applied to actual foreign exchange transactions, an alternative conversion factor, the Atlas method, is used. Sources: GMS Secretariat estimates using data from the Asian Development Bank Statistical Database System. https://sdbs.adb.org. (accessed December 2016); Guangxi Statistical Bureau. 2016. Guangxi Statistical Yearbook. Beijing: [People’s Republic of] China Statistics Press; World Bank. World Development Indicators Database. http://data.worldbank.org/data-catalog/world-development-indicators (accessed February 2017); and Statistical Bureau of Yunnan Province. 2016. Yunnan Statistical Yearbook. Beijing: [People’s Republic of] China Statistics Press.

3
01 | Key Macro Indicators
Table 1.1C: Gross Domestic Product at Purchasing Power Parity (Constant 2005 international dollars, billion)
Item 1992 1993 1994 1995 1996 1997 1998 1999 2000 2001 2002 2003 2004 2005 2006 2007 2008 2009 2010 2011 2012 2013 2014 2015
GMS 449 497 539 585 627 636 626 658 691 725 776 835 906 967 1,041 1,124 1,185 1,232 1,341 1,421 1,532 1,625 1,700 1,793Cambodia … 8 9 9 10 10 11 12 13 14 15 16 18 20 22 25 26 26 28 30 32 34 37 39Guangxi, PRC 37 44 50 55 59 62 65 68 71 76 83 91 103 116 132 151 169 187 215 244 265 287 309 332Yunnan, PRC 36 39 41 45 52 57 63 66 68 71 76 82 93 100 111 124 137 148 162 185 209 235 252 269Lao PDR 4 5 5 5 6 6 6 7 7 8 8 9 9 10 11 11 12 13 14 15 17 18 20 21Myanmar 15 16 17 18 19 20 21 24 27 30 34 38 43 49 56 62 69 76 83 88 94 102 111 119Thailand 280 303 327 354 374 363 336 351 367 379 403 432 459 478 502 529 538 534 574 579 621 638 643 661Viet Nam 77 83 91 99 109 117 124 130 139 148 157 168 180 194 207 222 235 248 263 280 295 311 329 351
… data not available at the time of this publication, GDP = gross domestic product, GMS = Greater Mekong Subregion, Lao PDR = Lao People’s Democratic Republic, PPP = purchasing power parity, PRC = People’s Republic of China. GDP at PPP constant 2005 international dollars is GDP in local currency unit converted to international dollars using 2005 PPP rates. PPP conversion factor is the number of units of country B’s currency needed in country B to purchase the same quantity of an individual good or service, which one unit of country A’s currency can purchase in country A.Constant GDP of Guangxi and Yunnan, in local currency unit, is estimated by using the implicit GDP deflator of the PRC.For the computation of constant GDP and GDP growth rate estimates, see Appendix 1.Sources: GMS Secretariat estimates using data from the Asian Development Bank Statistical Database System. https://sdbs.adb.org. (accessed December 2016); Guangxi Statistical Bureau. 2016. Guangxi Statistical Yearbook. Beijing: [People’s Republic of] China Statistics Press; World Bank. World Development Indicators Database. http://data.worldbank.org/data-catalog/world-development-indicators (accessed February 2017); and Statistical Bureau of Yunnan Province. 2016. Yunnan Statistical Yearbook. Beijing: [People’s Republic of] China Statistics Press.
Trilli
on
% G
row
th ra
te
10
8
6
4
2
0
2.0
1.6
1.2
0.8
0.4
0.02011 2012 2013 2014 2015
6.0
7.9
6.0
4.65.5
GDP at PPP (constant 2005 international dollars) GDP (% growth rate)
GDP = gross domestic product, GMS = Greater Mekong Subregion, PPP = purchasing power parity.Sources: GMS Secretariat estimates using data from the Asian Development Bank Statistical Database System. https://sdbs.adb.org. (accessed December 2016); Guangxi Statistical Bureau. 2016. Guangxi Statistical Yearbook. Beijing: [People’s Republic of] China Statistics Press; World Bank. World Development Indicators Database. http://data.worldbank.org/data-catalog/world-development-indicators (accessed February 2017); and Statistical Bureau of Yunnan Province. 2016. Yunnan Statistical Yearbook. Beijing: [People’s Republic of] China Statistics Press.
Figure 1.1: GMS Gross Domestic Product at Purchasing Power Parity (Constant 2005 international dollars, trillion, and % growth rate)

4
STATISTICS ON
GRO
WTH
, ENERG
Y, AN
D BILATERA
L TRAD
E IN TH
E GREATER M
EKON
G SU
BREGIO
NTable 1.1D: Gross Domestic Product at Market Prices (Constant 2005 $, billion)
Item 1992 1993 1994 1995 1996 1997 1998 1999 2000 2001 2002 2003 2004 2005 2006 2007 2008 2009 2010 2011 2012 2013 2014 2015
GMS 169 187 203 220 236 238 234 246 258 270 288 310 337 359 386 417 440 456 498 528 571 605 632 666Cambodia … 2 3 3 3 3 3 4 4 4 5 5 6 6 7 8 8 8 9 9 10 11 11 12Guangxi, PRC 16 18 21 23 25 26 28 29 30 32 35 38 44 49 56 63 71 78 91 103 111 121 130 140Yunnan, PRC 15 17 17 19 22 24 26 28 29 30 32 35 39 42 47 52 57 62 68 78 88 99 106 113Lao PDR 1 1 1 1 2 2 2 2 2 2 2 2 3 3 3 3 3 4 4 4 5 5 5 6Myanmar 4 4 4 4 5 5 5 6 7 7 8 9 11 12 14 15 17 19 20 21 23 25 27 29Thailand 111 120 130 140 148 144 133 139 145 150 159 171 182 189 199 210 213 212 227 229 246 253 255 262Viet Nam 23 25 27 30 32 35 37 39 41 44 47 50 54 58 62 66 70 74 78 83 88 92 98 104
… data not available at the time of this publication, GDP = gross domestic product, GMS = Greater Mekong Subregion, Lao PDR = Lao People’s Democratic Republic, PRC = People’s Republic of China.GDP at purchaser’s prices is the sum of gross value added by all resident producers in the economy plus any product taxes and minus any subsidies not included in the value of the products. It is calculated without making deductions for depreciation of fabricated assets or for depletion and degradation of natural resources. Data are in constant 2005 dollars. Dollar figures for GDP are converted from domestic currencies using 2005 official exchange rates. For some countries where the official exchange rate does not reflect the rate effectively applied to actual foreign exchange transactions, an alternative conversion factor, the Atlas method, is used. Constant GDP of Guangxi and Yunnan, in local currency unit, is estimated by using the implicit GDP deflator of the PRC. For the computation of constant GDP and GDP growth rate estimates, see Appendix 1. Sources: GMS Secretariat estimates using data from the Asian Development Bank Statistical Database System. https://sdbs.adb.org. (accessed December 2016); Guangxi Statistical Bureau. 2016. Guangxi Statistical Yearbook. Beijing: [People’s Republic of] China Statistics Press; World Bank. World Development Indicators Database. http://data.worldbank.org/data-catalog/world-development-indicators (accessed February 2017); and Statistical Bureau of Yunnan Province. 2016. Yunnan Statistical Yearbook. Beijing: [People’s Republic of] China Statistics Press.
GDP = gross domestic product, GMS = Greater Mekong Subregion.Sources: GMS Secretariat estimates using data from the Asian Development Bank Statistical Database System. https://sdbs.adb.org. (accessed December 2016); Guangxi Statistical Bureau. 2016. Guangxi Statistical Yearbook. Beijing: [People’s Republic of] China Statistics Press; World Bank. World Development Indicators Database. http://data.worldbank.org/data-catalog/world-development-indicators (accessed February 2017); and Statistical Bureau of Yunnan Province. 2016. Yunnan Statistical Yearbook. Beijing: [People’s Republic of] China Statistics Press.
Figure 1.2: GMS Gross Domestic Product at Market Prices (Constant 2005 $, billion, and % growth rate)
% G
row
th ra
te
10
8
6
4
2
0
Billio
n
750
600
450
300
150
0
6.1
8.1
6.1
4.55.4
2011 2012 2013 2014 2015GDP at market prices (constant 2005 $) GDP (% growth rate)

5
01 | Key Macro Indicators
Table 1.2A: GMS Gross Domestic Product (% Growth rate, weighted by GDP at PPP current international dollars)Item 1992 1993 1994 1995 1996 1997 1998 1999 2000 2001 2002 2003 2004 2005 2006 2007 2008 2009 2010 2011 2012 2013 2014 2015
GMS 9.7 9.3 8.4 8.6 7.2 1.4 (1.2) 5.1 5.4 5.1 7.2 7.9 8.5 6.9 7.8 8.0 5.5 4.1 8.8 5.9 7.8 6.0 4.6 5.4 Cambodia 7.0 4.1 9.2 6.5 5.3 5.7 5.0 12.6 8.4 7.7 7.0 8.5 10.3 13.3 10.8 10.2 6.7 0.1 6.0 7.1 7.3 7.4 7.1 6.9 Guangxi, PRC 15.2 17.0 14.0 9.9 6.5 5.3 6.1 4.5 3.4 7.4 10.1 8.9 13.8 11.7 14.6 13.8 11.8 10.7 15.3 13.2 8.6 8.4 7.6 7.7 Yunnan, PRC 10.5 9.9 4.1 9.3 16.6 8.7 10.2 5.1 3.7 4.2 7.5 7.7 12.7 8.1 10.8 11.0 10.6 8.5 9.5 13.8 13.2 12.3 7.4 6.7 Lao PDR 7.0 5.8 8.1 7.1 6.9 6.9 4.4 4.1 6.3 4.6 6.9 6.2 7.0 6.8 7.2 9.3 7.8 7.5 8.1 8.0 7.9 7.9 7.6 4.9 Myanmar 9.7 6.0 7.5 6.9 6.4 5.7 5.8 10.9 13.7 11.3 12.0 13.8 13.6 13.6 13.1 12.0 10.3 10.6 9.6 5.6 7.3 8.4 8.0 7.3 Thailand 9.3 8.7 8.0 8.1 5.7 (2.8) (7.6) 4.6 4.5 3.4 6.1 7.2 6.3 4.2 5.0 5.4 1.7 (0.7) 7.5 0.8 7.2 2.7 0.8 2.8 Viet Nam 8.7 8.1 8.8 9.5 9.3 8.2 5.8 4.8 6.8 6.9 7.1 7.3 7.8 7.5 7.0 7.1 5.7 5.4 6.4 6.2 5.2 5.4 6.0 6.7
( ) = negative, GDP = gross domestic product, GNI = gross national income, GMS = Greater Mekong Subregion, Lao PDR = Lao People’s Democratic Republic, PPP = purchasing power parity, PRC = People’s Republic of China.GDP growth rate is % change of constant GDP in local currency unit, year-on-year. The GMS GDP growth rates use GDP rather than GNI shares as weights since Guangxi and Yunnan do not have GNI estimates. From 1992 to 1996, the GMS GDP growth rate excludes Myanmar’s weight: No estimates of PPP conversion factor are available. Constant GDP of Guangxi and Yunnan, PRC, in local currency unit, is estimated by using PRC’s implicit GDP deflator. For the computation of constant GDP and GDP growth rate estimates, see Appendix 1. Sources: GMS Secretariat estimates using data from the Asian Development Bank Statistical Database System. https://sdbs.adb.org. (accessed December 2016); Guangxi Statistical Bureau. 2016. Guangxi Statistical Yearbook. Beijing: [People’s Republic of] China Statistics Press; International Monetary Fund. World Economic Outlook Database. https://www.imf.org/external/pubs/ft/weo/2016/01/weodata/index.aspx (accessed February 2017); World Bank. World Development Indicators Database. http://data.worldbank.org/data-catalog/world-development-indicators (accessed February 2017); Statistical Bureau of Yunnan Province. 2016. Yunnan Statistical Yearbook. Beijing: [People’s Republic of] China Statistics Press.
Table 1.2B: GMS Gross Domestic Product (% Growth rate, weighted by GDP at market prices, current $)Item 1992 1993 1994 1995 1996 1997 1998 1999 2000 2001 2002 2003 2004 2005 2006 2007 2008 2009 2010 2011 2012 2013 2014 2015
GMS 9.7 9.2 8.3 8.4 6.9 0.6 (1.7) 4.8 5.0 4.9 7.1 7.8 8.6 6.7 7.7 8.0 5.7 4.3 9.2 6.6 8.2 6.4 4.9 5.6 Cambodia 7.0 4.1 9.2 6.5 5.3 5.7 5.0 12.6 8.4 7.7 7.0 8.5 10.3 13.3 10.8 10.2 6.7 0.1 6.0 7.1 7.3 7.4 7.1 6.9 Guangxi, PRC 15.2 17.0 14.0 9.9 6.5 5.3 6.1 4.5 3.4 7.4 10.1 8.9 13.8 11.7 14.6 13.8 11.8 10.7 15.3 13.2 8.6 8.4 7.6 7.7 Yunnan, PRC 10.5 9.9 4.1 9.3 16.6 8.7 10.2 5.1 3.7 4.2 7.5 7.7 12.7 8.1 10.8 11.0 10.6 8.5 9.5 13.8 13.2 12.3 7.4 6.7 Lao PDR 7.0 5.8 8.1 7.1 6.9 6.9 4.4 4.1 6.3 4.6 6.9 6.2 7.0 6.8 7.2 9.3 7.8 7.5 8.1 8.0 7.9 7.9 7.6 4.9 Myanmar 9.7 6.0 7.5 6.9 6.4 5.7 5.8 10.9 13.7 11.3 12.0 13.8 13.6 13.6 13.1 12.0 10.3 10.6 9.6 5.6 7.3 8.4 8.0 7.3 Thailand 9.3 8.7 8.0 8.1 5.7 (2.8) (7.6) 4.6 4.5 3.4 6.1 7.2 6.3 4.2 5.0 5.4 1.7 (0.7) 7.5 0.8 7.2 2.7 0.8 2.8 Viet Nam 8.7 8.1 8.8 9.5 9.3 8.2 5.8 4.8 6.8 6.9 7.1 7.3 7.8 7.5 7.0 7.1 5.7 5.4 6.4 6.2 5.2 5.4 6.0 6.7
( ) = negative, GDP = gross domestic product, GMS = Greater Mekong Subregion, GNI = gross national income, Lao PDR = Lao People’s Democratic Republic, PRC = People’s Republic of China.GDP growth rate is % change of constant GDP in local currency unit, year-on-year. The GMS GDP growth rates use GDP rather than GNI shares as weights since Guangxi and Yunnan do not have GNI estimates. From 1992 to 1999, the GMS GDP growth rate excludes Myanmar’s weight: No estimates of the Atlas method conversion factor are available. Constant GDP of Guangxi and Yunnan, PRC, in local currency unit, is estimated by using PRC’s implicit GDP deflator. For the computation of constant GDP and GDP growth rate estimates, see Appendix 1. Sources: GMS Secretariat estimates using data from the Asian Development Bank Statistical Database System. https://sdbs.adb.org. (accessed December 2016); Guangxi Statistical Bureau. 2016. Guangxi Statistical Yearbook. Beijing: [People’s Republic of] China Statistics Press; World Bank. World Development Indicators Database. http://data.worldbank.org/data-catalog/world-development-indicators (accessed February 2017); Statistical Bureau of Yunnan Province. 2016. Yunnan Statistical Yearbook. Beijing: [People’s Republic of] China Statistics Press.

6
STATISTICS ON
GRO
WTH
, ENERG
Y, AN
D BILATERA
L TRAD
E IN TH
E GREATER M
EKON
G SU
BREGIO
N
% G
row
th ra
te
10
8
6
4
2
0
5.96.6
7.8 8.2
6.0 6.4
4.6 4.9 5.4 5.6
2011 2012 2013 2014 2015Weighted by GDP at PPP current international dollars Weighted by GDP at market prices, current $
GDP = gross domestic product, GMS = Greater Mekong Subregion, PPP = purchasing power parity.Sources: GMS Secretariat estimates using data from the Asian Development Bank Statistical Database System. https://sdbs.adb.org. (accessed December 2016); Guangxi Statistical Bureau. 2016. Guangxi Statistical Yearbook. Beijing: [People’s Republic of] China Statistics Press; World Bank. World Development Indicators Database. http://data.worldbank.org/data-catalog/world-development-indicators (accessed February 2017); Statistical Bureau of Yunnan Province. 2016. Yunnan Statistical Yearbook. Beijing: [People’s Republic of] China Statistics Press.
Figure 1.3: Comparative GMS Gross Domestic Product (% Growth rate)

7
01 | Key Macro Indicators
Table 1.3A: Gross Domestic Product per Capita at Purchasing Power Parity (Current international dollars)
Item 1992 1993 1994 1995 1996 1997 1998 1999 2000 2001 2002 2003 2004 2005 2006 2007 2008 2009 2010 2011 2012 2013 2014 2015
GMS 2,045 2,260 2,466 2,696 2,904 2,588 2,537 2,672 2,843 3,020 3,250 3,538 3,842 4,259 4,689 5,154 5,501 5,715 6,238 6,677 7,295 7,742 8,127 8,572Cambodia 563 727 760 801 833 870 901 1,001 1,087 1,175 1,251 1,361 1,518 1,747 1,964 2,189 2,347 2,332 2,462 2,649 2,845 3,063 3,284 3,496Guangxi, PRC 798 943 1,087 1,208 1,295 1,373 1,461 1,537 1,610 1,753 1,942 2,139 2,486 2,830 3,324 3,861 4,377 4,825 5,602 6,430 7,005 7,648 8,046 8,614Yunnan, PRC 873 967 1,018 1,123 1,314 1,434 1,579 1,665 1,744 1,837 1,981 2,151 2,471 2,721 3,091 3,507 3,944 4,274 4,742 5,477 6,501 7,058 7,640 8,125Lao PDR 1,090 1,149 1,237 1,319 1,405 1,571 1,627 1,690 1,808 1,906 2,039 2,178 2,361 2,563 2,824 3,074 3,319 3,709 3,744 4,120 4,303 4,806 5,127 5,416Myanmar … … … … … 750 792 881 1,012 1,140 1,284 1,477 1,708 1,986 2,298 2,624 2,931 3,242 3,535 3,781 4,100 4,480 4,901 5,315Thailand 5,192 5,729 6,268 6,854 7,311 7,152 6,601 6,926 7,314 7,651 8,153 8,820 9,546 10,194 10,978 11,850 12,273 12,258 13,309 13,655 14,853 15,435 15,776 16,334Viet Nam 1,116 1,213 1,326 1,459 1,598 1,731 1,823 1,910 2,058 2,222 2,388 2,584 2,596 3,103 3,384 3,681 3,924 4,123 4,396 4,716 5,001 5,300 5,657 6,035
.... data not available at the time of this publication, GDP = gross domestic product, GMS = Greater Mekong Subregion, Lao PDR = Lao People’s Democratic Republic, PPP = purchasing power parity, PRC = People’s Republic of China. GDP per capita at PPP current international dollar is GDP at PPP current international dollars divided by total population. Sources: GMS Secretariat estimates using data from the Asian Development Bank Statistical Database System. https://sdbs.adb.org. (accessed December 2016); Guangxi Statistical Bureau. 2016. Guangxi Statistical Yearbook. Beijing: [People’s Republic of] China Statistics Press; International Monetary Fund. World Economic Outlook Database. https://www.imf.org/external/pubs/ft/weo/2016/01/weodata/index.aspx (accessed February 2017); Statistical Bureau of Yunnan Province. 2016. Yunnan Statistical Yearbook. Beijing: [People’s Republic of] China Statistics Press.
Curre
nt in
tern
atio
nal d
olla
rs
17,500
12,500
15,000
7,500
10,000
5,000
2,500
0
16,334
8,614 8,1256,035 5,416 5,315
3,496
Thailand Guangxi, PRC Yunnan, PRC Viet Nam Lao PDR Myanmar Cambodia
Lao PDR = Lao People’s Democratic Republic, PRC = People’s Republic of China.Sources: GMS Secretariat estimates using data from the Asian Development Bank Statistical Database System. https://sdbs.adb.org. (accessed December 2016); Guangxi Statistical Bureau. 2016. Guangxi Statistical Yearbook. Beijing: [People’s Republic of] China Statistics Press; International Monetary Fund. World Economic Outlook Database. https://www.imf.org/external/pubs/ft/weo/2016/01/weodata/index.aspx (accessed February 2017); Statistical Bureau of Yunnan Province. 2016. Yunnan Statistical Yearbook. Beijing: [People’s Republic of] China Statistics Press.
Figure 1.4: Gross Domestic Product per Capita at Purchasing Power Parity, 2015 (Current international dollars)
8
STATISTICS ON
GRO
WTH
, ENERG
Y, AN
D BILATERA
L TRAD
E IN TH
E GREATER M
EKON
G SU
BREGIO
N
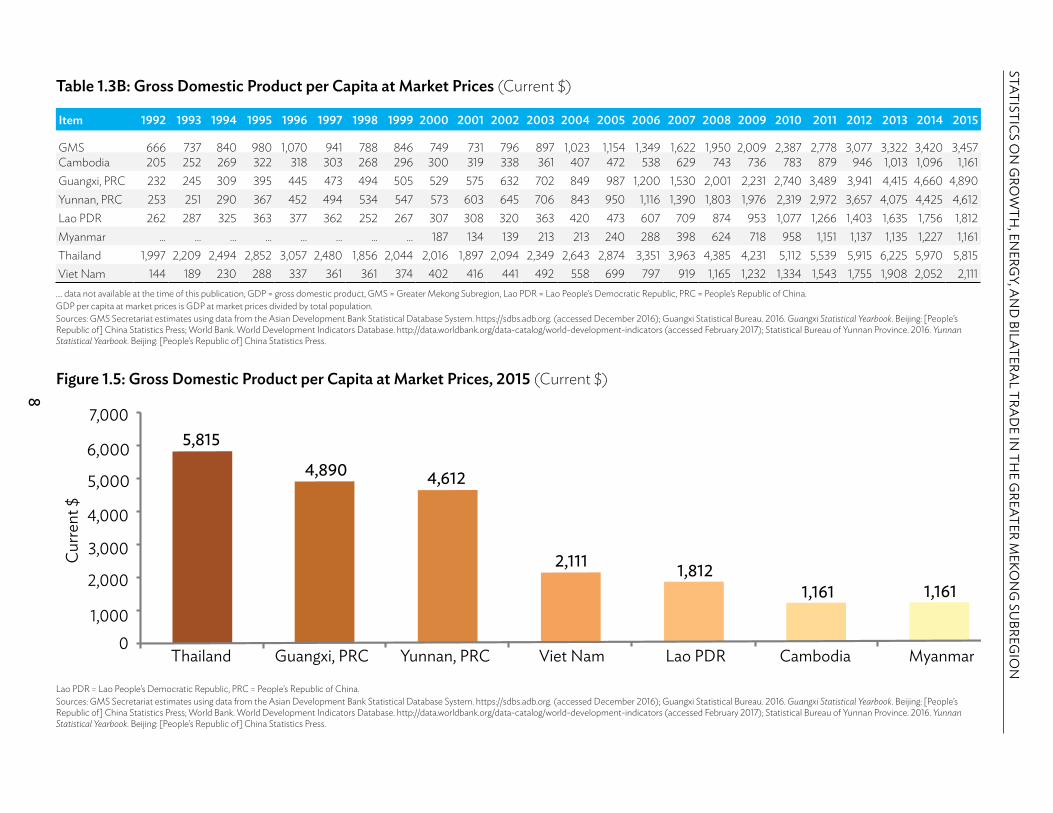
Table 1.3B: Gross Domestic Product per Capita at Market Prices (Current $)
Item 1992 1993 1994 1995 1996 1997 1998 1999 2000 2001 2002 2003 2004 2005 2006 2007 2008 2009 2010 2011 2012 2013 2014 2015
GMS 666 737 840 980 1,070 941 788 846 749 731 796 897 1,023 1,154 1,349 1,622 1,950 2,009 2,387 2,778 3,077 3,322 3,420 3,457Cambodia 205 252 269 322 318 303 268 296 300 319 338 361 407 472 538 629 743 736 783 879 946 1,013 1,096 1,161Guangxi, PRC 232 245 309 395 445 473 494 505 529 575 632 702 849 987 1,200 1,530 2,001 2,231 2,740 3,489 3,941 4,415 4,660 4,890Yunnan, PRC 253 251 290 367 452 494 534 547 573 603 645 706 843 950 1,116 1,390 1,803 1,976 2,319 2,972 3,657 4,075 4,425 4,612Lao PDR 262 287 325 363 377 362 252 267 307 308 320 363 420 473 607 709 874 953 1,077 1,266 1,403 1,635 1,756 1,812Myanmar … … … … … … … … 187 134 139 213 213 240 288 398 624 718 958 1,151 1,137 1,135 1,227 1,161Thailand 1,997 2,209 2,494 2,852 3,057 2,480 1,856 2,044 2,016 1,897 2,094 2,349 2,643 2,874 3,351 3,963 4,385 4,231 5,112 5,539 5,915 6,225 5,970 5,815Viet Nam 144 189 230 288 337 361 361 374 402 416 441 492 558 699 797 919 1,165 1,232 1,334 1,543 1,755 1,908 2,052 2,111
.... data not available at the time of this publication, GDP = gross domestic product, GMS = Greater Mekong Subregion, Lao PDR = Lao People’s Democratic Republic, PRC = People’s Republic of China. GDP per capita at market prices is GDP at market prices divided by total population.Sources: GMS Secretariat estimates using data from the Asian Development Bank Statistical Database System. https://sdbs.adb.org. (accessed December 2016); Guangxi Statistical Bureau. 2016. Guangxi Statistical Yearbook. Beijing: [People’s Republic of] China Statistics Press; World Bank. World Development Indicators Database. http://data.worldbank.org/data-catalog/world-development-indicators (accessed February 2017); Statistical Bureau of Yunnan Province. 2016. Yunnan Statistical Yearbook. Beijing: [People’s Republic of] China Statistics Press.
Curre
nt $
7,000
5,000
6,000
3,000
4,000
2,000
1,0000
5,815
4,890 4,612
2,111 1,8121,161 1,161
Thailand Guangxi, PRC Yunnan, PRC Viet Nam Lao PDR MyanmarCambodia
Lao PDR = Lao People’s Democratic Republic, PRC = People’s Republic of China. Sources: GMS Secretariat estimates using data from the Asian Development Bank Statistical Database System. https://sdbs.adb.org. (accessed December 2016); Guangxi Statistical Bureau. 2016. Guangxi Statistical Yearbook. Beijing: [People’s Republic of] China Statistics Press; World Bank. World Development Indicators Database. http://data.worldbank.org/data-catalog/world-development-indicators (accessed February 2017); Statistical Bureau of Yunnan Province. 2016. Yunnan Statistical Yearbook. Beijing: [People’s Republic of] China Statistics Press.
Figure 1.5: Gross Domestic Product per Capita at Market Prices, 2015 (Current $)
9
01 | Key Macro Indicators
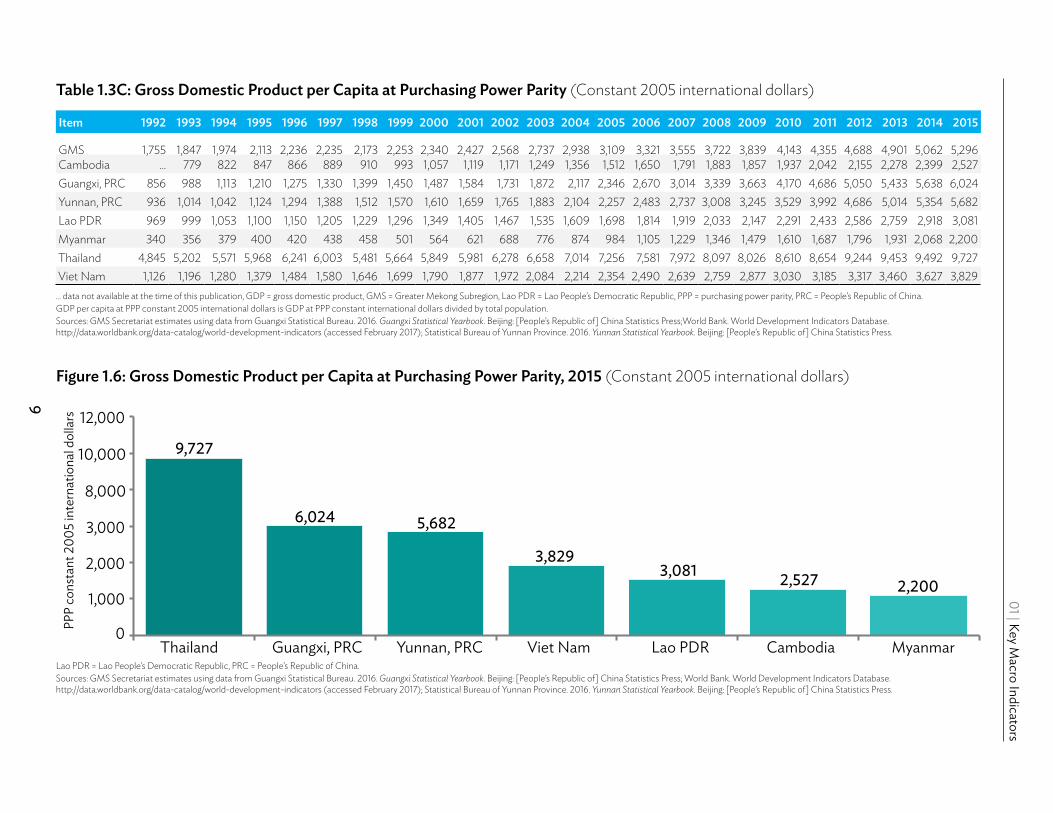
Table 1.3C: Gross Domestic Product per Capita at Purchasing Power Parity (Constant 2005 international dollars)
Item 1992 1993 1994 1995 1996 1997 1998 1999 2000 2001 2002 2003 2004 2005 2006 2007 2008 2009 2010 2011 2012 2013 2014 2015
GMS 1,755 1,847 1,974 2,113 2,236 2,235 2,173 2,253 2,340 2,427 2,568 2,737 2,938 3,109 3,321 3,555 3,722 3,839 4,143 4,355 4,688 4,901 5,062 5,296Cambodia … 779 822 847 866 889 910 993 1,057 1,119 1,171 1,249 1,356 1,512 1,650 1,791 1,883 1,857 1,937 2,042 2,155 2,278 2,399 2,527Guangxi, PRC 856 988 1,113 1,210 1,275 1,330 1,399 1,450 1,487 1,584 1,731 1,872 2,117 2,346 2,670 3,014 3,339 3,663 4,170 4,686 5,050 5,433 5,638 6,024Yunnan, PRC 936 1,014 1,042 1,124 1,294 1,388 1,512 1,570 1,610 1,659 1,765 1,883 2,104 2,257 2,483 2,737 3,008 3,245 3,529 3,992 4,686 5,014 5,354 5,682Lao PDR 969 999 1,053 1,100 1,150 1,205 1,229 1,296 1,349 1,405 1,467 1,535 1,609 1,698 1,814 1,919 2,033 2,147 2,291 2,433 2,586 2,759 2,918 3,081Myanmar 340 356 379 400 420 438 458 501 564 621 688 776 874 984 1,105 1,229 1,346 1,479 1,610 1,687 1,796 1,931 2,068 2,200Thailand 4,845 5,202 5,571 5,968 6,241 6,003 5,481 5,664 5,849 5,981 6,278 6,658 7,014 7,256 7,581 7,972 8,097 8,026 8,610 8,654 9,244 9,453 9,492 9,727Viet Nam 1,126 1,196 1,280 1,379 1,484 1,580 1,646 1,699 1,790 1,877 1,972 2,084 2,214 2,354 2,490 2,639 2,759 2,877 3,030 3,185 3,317 3,460 3,627 3,829
… data not available at the time of this publication, GDP = gross domestic product, GMS = Greater Mekong Subregion, Lao PDR = Lao People’s Democratic Republic, PPP = purchasing power parity, PRC = People’s Republic of China. GDP per capita at PPP constant 2005 international dollars is GDP at PPP constant international dollars divided by total population.Sources: GMS Secretariat estimates using data from Guangxi Statistical Bureau. 2016. Guangxi Statistical Yearbook. Beijing: [People’s Republic of] China Statistics Press;World Bank. World Development Indicators Database. http://data.worldbank.org/data-catalog/world-development-indicators (accessed February 2017); Statistical Bureau of Yunnan Province. 2016. Yunnan Statistical Yearbook. Beijing: [People’s Republic of] China Statistics Press.
PPP
cons
tant
200
5 in
tern
atio
nal d
olla
rs 12,000
8,000
10,000
3,000
2,000
1,000
0
9,727
6,024 5,682
3,8293,081 2,527 2,200
Thailand Guangxi, PRC Yunnan, PRC Viet Nam Lao PDR MyanmarCambodiaLao PDR = Lao People’s Democratic Republic, PRC = People’s Republic of China.Sources: GMS Secretariat estimates using data from Guangxi Statistical Bureau. 2016. Guangxi Statistical Yearbook. Beijing: [People’s Republic of] China Statistics Press; World Bank. World Development Indicators Database. http://data.worldbank.org/data-catalog/world-development-indicators (accessed February 2017); Statistical Bureau of Yunnan Province. 2016. Yunnan Statistical Yearbook. Beijing: [People’s Republic of] China Statistics Press.
Figure 1.6: Gross Domestic Product per Capita at Purchasing Power Parity, 2015 (Constant 2005 international dollars)

10
STATISTICS ON
GRO
WTH
, ENERG
Y, AN
D BILATERA
L TRAD
E IN TH
E GREATER M
EKON
G SU
BREGIO
N
Table 1.3D: Gross Domestic Product per Capita at Market Prices (Constant 2005 $)
Item 1992 1993 1994 1995 1996 1997 1998 1999 2000 2001 2002 2003 2004 2005 2006 2007 2008 2009 2010 2011 2012 2013 2014 2015
GMS 662 695 743 796 841 838 812 841 872 902 955 1,017 1,092 1,154 1,232 1,319 1,381 1,422 1,538 1,618 1,745 1,825 1,883 1,969Cambodia … 243 257 265 271 278 284 310 330 349 366 390 424 472 515 560 588 580 605 638 673 712 750 789Guangxi, PRC 360 416 468 509 536 560 589 610 625 666 728 788 890 987 1,123 1,268 1,405 1,541 1,754 1,972 2,125 2,286 2,372 2,534Yunnan, PRC 394 427 438 473 544 584 636 661 677 698 743 792 885 950 1,045 1,152 1,266 1,365 1,485 1,679 1,972 2,109 2,253 2,390Lao PDR 272 280 295 308 323 338 345 363 378 394 411 430 451 476 509 538 570 602 642 682 725 774 818 864Myanmar 83 87 92 97 102 107 112 122 137 151 168 189 213 240 269 299 328 360 392 411 438 470 504 536Thailand 1,919 2,061 2,207 2,364 2,472 2,378 2,171 2,244 2,317 2,369 2,487 2,638 2,778 2,874 3,003 3,158 3,207 3,179 3,410 3,428 3,662 3,745 3,760 3,853Viet Nam 335 355 380 410 441 470 489 505 532 558 586 619 658 699 740 784 820 855 900 947 986 1,028 1,078 1,138
… data not available at the time of this publication, GDP = gross domestic product, GMS = Greater Mekong Subregion, Lao PDR = Lao People’s Democratic Republic, PRC = People’s Republic of China.GDP per capita at market prices in constant 2005 dollars is GDP at market prices in constant 2005 dollars divided by total population. Constant GDP of Guangxi and Yunnan, PRC, in local currency unit, is estimated using the implicit GDP deflator of the PRC. Sources: GMS Secretariat estimates using data from Guangxi Statistical Bureau. 2016. Guangxi Statistical Yearbook. Beijing: [People’s Republic of] China Statistics Press; World Bank. World Development Indicators Database. http://data.worldbank.org/data-catalog/world-development-indicators (accessed February 2017); Statistical Bureau of Yunnan Province. 2016. Yunnan Statistical Yearbook. Beijing: [People’s Republic of] China Statistics Press.
Lao PDR = Lao People’s Democratic Republic, PRC = People’s Republic of China.Sources: GMS Secretariat estimates using data from Guangxi Statistical Bureau. 2016. Guangxi Statistical Yearbook. Beijing: [People’s Republic of] China Statistics Press; World Bank. World Development Indicators Database. http://data.worldbank.org/data-catalog/world-development-indicators (accessed February 2017); Statistical Bureau of Yunnan Province. 2016. Yunnan Statistical Yearbook. Beijing: [People’s Republic of] China Statistics Press.
Figure 1.7: Gross Domestic Product per Capita at Market Prices, 2015 (Constant 2005 $)
Cons
tant
200
5 $
4,500
3,5003,000
4,000
2,5002,000
1,000500
1,500
0
3,853
2,534 2,390
1,138864 789
536
Thailand Guangxi, PRC Yunnan, PRC Viet Nam Lao PDR MyanmarCambodia

11
01 | Key Macro Indicators
Table 1.4:Total Population (Million)
Item 1992 1993 1994 1995 1996 1997 1998 1999 2000 2001 2002 2003 2004 2005 2006 2007 2008 2009 2010 2011 2012 2013 2014 2015
GMS 266 269 273 277 281 284 288 292 295 299 302 305 308 311 314 316 319 321 324 326 327 332 336 339Cambodia 10 10 10 11 11 11 12 12 12 12 13 13 13 13 14 14 14 14 14 15 15 15 15 16Guangxi, PRC 44 44 45 45 46 46 47 47 48 48 48 49 49 49 50 50 50 51 52 52 52 53 55 55Yunnan, PRC 38 39 39 40 40 41 41 42 42 43 43 44 44 45 45 45 45 46 46 46 45 47 47 47Lao PDR 4 5 5 5 5 5 5 5 5 5 6 6 6 6 6 6 6 6 6 6 6 7 7 7Myanmar 43 44 44 45 45 46 47 47 48 48 49 49 50 50 50 51 51 51 52 52 53 53 53 54Thailand 58 58 59 59 60 61 61 62 63 63 64 65 65 66 66 66 66 67 67 67 67 67 68 68Viet Nam 68 70 71 72 73 74 75 77 78 79 80 80 81 82 83 84 85 86 87 88 89 90 91 92
GMS = Greater Mekong Subregion, Lao PDR = Lao People’s Democratic Republic, PRC = People’s Republic of China.De facto population includes all persons physically present in the country during census day, including foreign, military, and diplomatic personnel and their accompanying household members; and transient foreign visitors in the country or in harbors.Sources: GMS Secretariat estimates using data from Guangxi Statistical Bureau. 2016. Guangxi Statistical Yearbook. Beijing: [People’s Republic of] China Statistics Press; World Bank. World Development Indicators Database. http://data.worldbank.org/data-catalog/world-development-indicators (accessed February 2017); Statistical Bureau of Yunnan Province. 2016. Yunnan Statistical Yearbook. Beijing: [People’s Republic of] China Statistics Press.
Table 1.5: Total Merchandise Exports ($ million)
Item 1995 1996 1997 1998 1999 2000 2001 2002 2003 2004 2005 2006 2007 2008 2009 2010 2011 2012 2013 2014 2015
GMS 67,189 67,405 72,941 68,638 74,491 89,670 87,106 93,199 111,837 136,278 158,366 190,063 226,504 268,637 239,869 304,373 370,187 407,004 443,575 485,577 477,554Cambodia 323 278 568 789 1,180 1,564 1,833 2,075 2,431 3,002 3,293 4,062 4,658 5,040 4,891 5,873 7,976 9,483 10,972 13,095 14,726
Guangxi, PRC 2,246 1,916 2,383 2,418 1,247 1,493 1,236 1,508 1,970 2,396 2,877 3,599 5,113 7,351 8,371 9,610 12,459 15,468 18,695 24,330 28,026
Yunnan, PRC 1,215 1,096 1,172 1,174 1,034 1,175 1,244 1,430 1,677 2,239 2,642 3,391 4,736 4,987 4,514 7,606 9,473 10,018 15,959 18,802 16,626
Lao PDR 244 278 261 204 235 365 334 339 369 442 609 1,086 1,166 1,411 1,424 2,072 3,024 3,239 3,930 4,664 4,046
Myanmar 1,292 1,229 1,147 1,071 1,295 2,022 2,879 2,879 2,813 3,269 3,790 4,658 4,943 6,557 6,071 6,633 8,496 8,604 10,996 24,205 13,309
Thailand 56,439 55,678 58,283 53,583 58,423 68,819 64,919 68,108 80,323 96,248 110,110 130,580 153,571 175,908 152,497 195,312 228,824 229,545 228,527 227,573 210,883
Viet Nam 5,428 6,930 9,128 9,398 11,077 14,233 14,661 16,861 22,254 28,683 35,045 42,687 52,317 67,382 62,100 77,267 99,936 130,646 154,495 172,907 189,937
GMS=Greater Mekong Subregion, Lao PDR=Lao People’s Democratic Republic, PRC=People’s Republic of China.Total merchandise exports consist of sales, barter, or gifts or grants, of goods from residents to nonresidents. Data for Guangxi and Yunnan, PRC, are based on the location of the exporters. Sources: GMS Secretariat estimates; Guangxi Statistical Bureau. 2016. Guangxi Statistical Yearbook. Beijing: [People’s Republic of] China Statistics Press; and Statistical Bureau of Yunnan Province. 2016. Yunnan Statistical Yearbook. Beijing: [People’s Republic of] China Statistics Press; UNCOMTRADE. https://comtrade.un.org (accessed May 2017).

12
STATISTICS ON
GRO
WTH
, ENERG
Y, AN
D BILATERA
L TRAD
E IN TH
E GREATER M
EKON
G SU
BREGIO
N
Table 1.6: Total Merchandise Imports ($ million)
Item 1995 1996 1997 1998 1999 2000 2001 2002 2003 2004 2005 2006 2007 2008 2009 2010 2011 2012 2013 2014 2015
GMS 84,908 88,864 80,117 58,609 66,640 82,292 82,999 89,698 107,178 134,626 164,392 186,462 224,182 280,302 229,699 310,435 390,453 433,916 472,624 479,558 470,669Cambodia 1,299 1,316 1,363 1,284 1,461 1,991 2,076 2,331 2,674 3,259 3,891 5,092 5,930 7,560 6,368 9,973 11,849 14,072 15,570 15,984 16,601
Guangxi, PRC 965 915 686 566 506 545 562 923 1,222 1,893 2,305 3,075 4,164 5,891 5,835 8,096 10,872 14,005 14,142 16,223 23,236
Yunnan, PRC 681 826 765 730 625 638 745 797 991 1,509 2,097 2,840 4,044 4,612 3,505 5,762 6,580 10,987 9,870 10,820 7,901
Lao PDR 563 560 542 502 563 606 649 642 722 974 1,124 1,476 1,883 2,528 2,612 3,262 4,240 5,802 6,681 7,258 6,572
Myanmar 2,452 2,697 2,973 2,438 2,275 2,737 2,411 2,589 2,902 3,101 3,214 3,501 5,027 6,302 6,397 9,096 12,549 15,587 18,880 22,382 22,338
Thailand 70,781 72,316 62,462 42,370 50,309 61,921 61,961 64,645 75,824 94,403 118,164 128,584 143,761 178,613 133,770 182,393 228,483 247,576 250,708 227,932 202,019
Viet Nam 8,167 10,233 11,327 10,720 10,901 13,854 14,597 17,772 22,843 29,488 33,597 41,893 59,374 74,797 71,212 91,853 115,880 125,888 156,772 178,959 192,001
GMS=Greater Mekong Subregion, Lao PDR=Lao People’s Democratic Republic, PRC=People’s Republic of China.Total merchandise imports consist of purchases, barter, or receipts of gifts or grants, of goods by residents from nonresidents.Imports of Guangxi and Yunnan, PRC, are based on the location of importers. Sources: GMS Secretariat estimates; Guangxi Statistical Bureau. 2016. Guangxi Statistical Yearbook. Beijing: [People’s Republic of] China Statistics Press; and Statistical Bureau of Yunnan Province. 2016. Yunnan Statistical Yearbook. Beijing: [People’s Republic of] China Statistics Press; UNCOMTRADE. https://comtrade.un.org (accessed May 2017).
Table 1.7: Merchandise Trade Balance ($ million)
Item 1995 1996 1997 1998 1999 2000 2001 2002 2003 2004 2005 2006 2007 2008 2009 2010 2011 2012 2013 2014 2015
GMS (17,719) (21,459) (7,176) 10,028 7,851 7,378 4,107 3,500 4,659 1,652 (6,026) 3,601 2,322 (11,665) 10,170 (6,063) (20,266) (26,912) (29,049) 6,019 6,885 Cambodia (976) (1,037) (796) (495) (281) (427) (243) (256) (242) (257) (598) (1,029) (1,272) (2,520) (1,477) (4,099) (3,872) (4,588) (4,598) (2,889) (1,874)
Guangxi, PRC 1,281 1,001 1,697 1,853 741 948 674 585 748 503 572 523 949 1,461 2,536 1,514 1,586 1,463 4,553 8,107 4,789
Yunnan, PRC 535 270 408 444 409 537 499 633 685 730 545 551 692 375 1,009 1,843 2,893 (969) 6,089 7,982 8,725
Lao PDR (319) (283) (281) (298) (328) (241) (316) (303) (353) (532) (516) (390) (717) (1,117) (1,189) (1,190) (1,217) (2,562) (2,752) (2,594) (2,526)
Myanmar (1,160) (1,468) (1,826) (1,367) (981) (716) 469 290 (89) 168 576 1,156 (83) 255 (326) (2,463) (4,053) (6,983) (7,883) 1,824 (9,029)
Thailand (14,341) (16,638) (4,179) 11,213 8,114 6,898 2,959 3,463 4,499 1,845 (8,054) 1,996 9,810 (2,705) 18,728 12,918 341 (18,031) (22,181) (359) 8,864
Viet Nam (2,739) (3,304) (2,198) (1,322) 176 379 64 (912) (590) (806) 1,448 795 (7,057) (7,414) (9,112) (14,586) (15,943) 4,758 (2,278) (6,052) (2,064)
( ) = negative, GMS=Greater Mekong Subregion, Lao PDR=Lao People’s Democratic Republic, PRC=People’s Republic of China.Merchandise trade balance is the difference between total merchandise exports and total merchandise imports.Sources: GMS Secretariat estimates using data from Guangxi Statistical Bureau. 2016. Guangxi Statistical Yearbook. Beijing: [People’s Republic of] China Statistics Press; and Statistical Bureau of Yunnan Province. 2016. Yunnan Statistical Yearbook. Beijing: [People’s Republic of] China Statistics Press; UNCOMTRADE. https://comtrade.un.org (accessed May 2017).

13
01 | Key Macro Indicators
$ bi
llion
600
500
300
400
200
100
0
-100-20 -27 -29
6 7
370 390 407 434 444 473 480486 478 471
Merchandise Exports Merchandise Imports Merchandise Trade Balance (Exports-Imports)
2011 2012 2013 2014 2015
GMS = Greater Mekong Subregion.Sources: GMS Secretariat estimates; Guangxi Statistical Bureau. 2016. Guangxi Statistical Yearbook. Beijing: [People’s Republic of] China Statistics Press; and Statistical Bureau of Yunnan Province. 2016. Yunnan Statistical Yearbook. Beijing: [People’s Republic of] China Statistics Press; UNCOMTRADE. https://comtrade.un.org (accessed May 2017).
Figure 1.8: GMS Merchandise Trade and Trade Balance ($ billion)

STATISTICS ON GROWTH, ENERGY, AND BILATERAL TRADE IN THE GREATER MEKONG SUBREGION
14
Table 1.8: Total Services Exports ($ million)
Table 1.9: Total Services Imports ($ million)
Item 2005 2006 2007 2008 2009 2010 2011 2012 2013 2014 2015 2016
GMS 104,262 125,644 164,067 187,759 161,092 223,047 255,321 265,919 283,505 293,430 299,167 291,327Cambodia 1,118 1,325 1,433 1,527 1,812 2,028 2,730 3,192 3,486 3,811 3,946 4,035PRC 78,469 94,071 125,447 145,343 122,563 178,339 201,047 201,576 207,006 219,131 217,556 208,488Lao PDR 204 223 278 402 397 511 550 577 781 764 799 …Myanmar 281 314 335 357 349 369 758 1,231 2,746 3,138 3,857 …Thailand 19,925 24,612 30,114 33,125 30,204 34,340 41,545 49,722 58,776 55,536 61,759 66,419Viet Nam 4,265 5,100 6,460 7,006 5,766 7,460 8,691 9,620 10,710 11,050 11,250 12,385
.... data not available or not publishable at the time of this publication, GMS = Greater Mekong Subregion, Lao PDR = Lao People’s Democratic Republic, PRC = People’s Republic of China.Total services exports consist of sales, barter, or gifts or grants, of services from residents to nonresidents.No data for the provinces of Guangxi and Yunnan. National data for the People’s Republic of China used. Services trade data for all countries, except Viet Nam, use balance of payments methodology 6 (BPM6). Services trade data of Viet Nam use balance of payments methodology 5 (BPM5).Sources: GMS Secretariat estimates and UNCTAD STATS Database. www.unctadstat.unctad.org (accessed July 2017).
Item 2005 2006 2007 2008 2009 2010 2011 2012 2013 2014 2015 2016
GMS 116,397 139,972 175,888 212,000 190,179 246,678 308,536 341,355 396,308 497,716 499,804 515,714Cambodia 642 804 817 900 830 970 1,314 1,535 1,757 1,882 1,910 1,972PRC 83,971 100,838 129,126 156,397 145,979 193,401 247,844 281,300 330,608 432,823 435,847 453,014Lao PDR 39 37 44 108 136 263 331 339 534 497 585 …Myanmar 497 557 653 617 617 789 1,090 1,459 2,187 2,267 2,443 …Thailand 26,798 32,614 38,071 46,021 34,430 41,333 46,097 45,671 47,402 45,247 42,518 42,199Viet Nam 4,450 5,122 7,177 7,956 8,187 9,921 11,859 11,050 13,820 15,000 16,500 18,529
.... data not available or not publishable at the time of this publication, GMS = Greater Mekong Subregion, Lao PDR = Lao People’s Democratic Republic, PRC = People’s Republic of China.Total services imports consist of purchases, barter, or receipts of gifts or grants, of services by residents from nonresidents.No data for the provinces of Guangxi and Yunnan. National data for the People’s Republic of China used. Services trade data for all countries, except Viet Nam, use balance of payments methodology 6 (BPM6). Services trade data of Viet Nam use balance of payments methodology 5 (BPM5).Sources: GMS Secretariat estimates and UNCTAD STATS Database. www.unctadstat.unctad.org (accessed July 2017).
01 | Key Macro Indicators
15
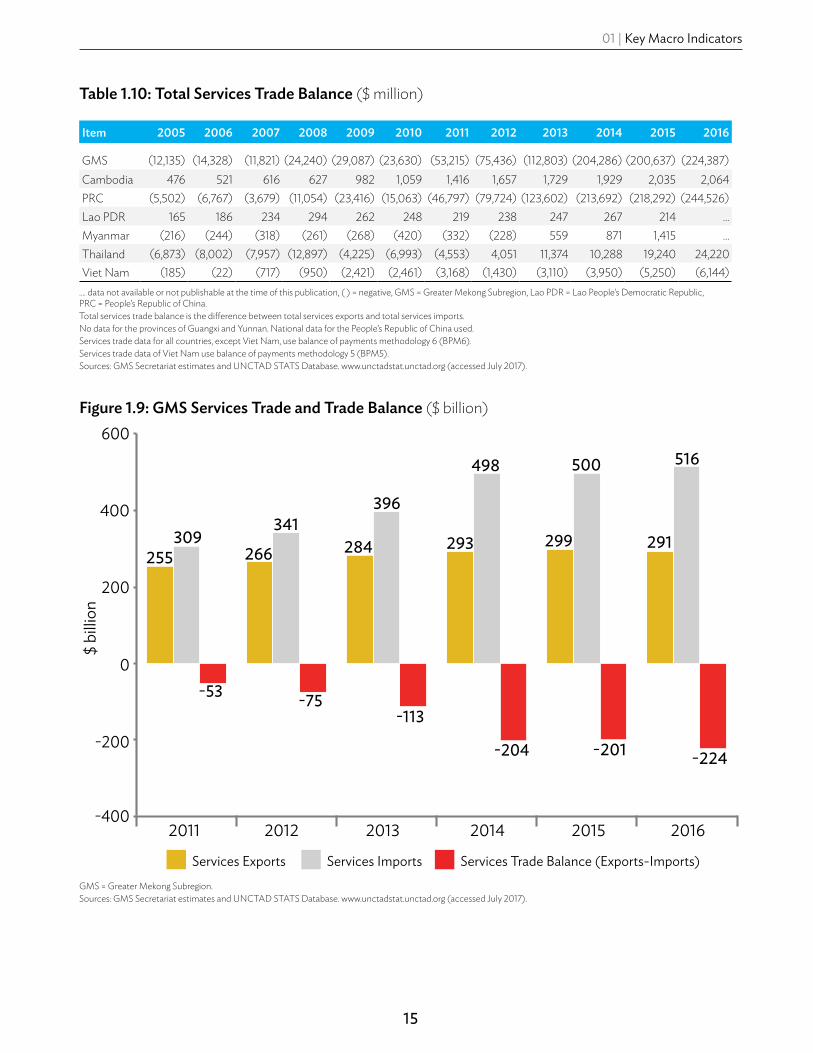
Table 1.10: Total Services Trade Balance ($ million)
Item 2005 2006 2007 2008 2009 2010 2011 2012 2013 2014 2015 2016
GMS (12,135) (14,328) (11,821) (24,240) (29,087) (23,630) (53,215) (75,436) (112,803) (204,286) (200,637) (224,387)Cambodia 476 521 616 627 982 1,059 1,416 1,657 1,729 1,929 2,035 2,064 PRC (5,502) (6,767) (3,679) (11,054) (23,416) (15,063) (46,797) (79,724) (123,602) (213,692) (218,292) (244,526)Lao PDR 165 186 234 294 262 248 219 238 247 267 214 …Myanmar (216) (244) (318) (261) (268) (420) (332) (228) 559 871 1,415 …Thailand (6,873) (8,002) (7,957) (12,897) (4,225) (6,993) (4,553) 4,051 11,374 10,288 19,240 24,220 Viet Nam (185) (22) (717) (950) (2,421) (2,461) (3,168) (1,430) (3,110) (3,950) (5,250) (6,144)
.... data not available or not publishable at the time of this publication, ( ) = negative, GMS = Greater Mekong Subregion, Lao PDR = Lao People’s Democratic Republic, PRC = People’s Republic of China.Total services trade balance is the difference between total services exports and total services imports.No data for the provinces of Guangxi and Yunnan. National data for the People’s Republic of China used. Services trade data for all countries, except Viet Nam, use balance of payments methodology 6 (BPM6). Services trade data of Viet Nam use balance of payments methodology 5 (BPM5).Sources: GMS Secretariat estimates and UNCTAD STATS Database. www.unctadstat.unctad.org (accessed July 2017).
GMS = Greater Mekong Subregion.Sources: GMS Secretariat estimates and UNCTAD STATS Database. www.unctadstat.unctad.org (accessed July 2017).
Figure 1.9: GMS Services Trade and Trade Balance ($ billion)
$ bi
llion
600
400
200
-200
0
-400
-53 -75-113
-204 -201 -224
255309
266
341284
396
293
498
299
500
291
516
Services Exports Services Imports Services Trade Balance (Exports-Imports)
2011 2012 2013 2014 20162015

16
STATISTICS ON
GRO
WTH
, ENERG
Y, AN
D BILATERA
L TRAD
E IN TH
E GREATER M
EKON
G SU
BREGIO
N
Table 1.11: Intra-GMS Trade ($ billion and % share)
Item 1992 1993 1994 1995 1996 1997 1998 1999 2000 2001 2002 2003 2004 2005 2006 2007 2008 2009 2010 2011 2012 2013 2014 2015
Trade Share (%) 2.0 2.1 2.6 3.2 3.1 3.2 3.3 3.6 4.0 4.2 4.2 4.3 4.4 4.6 4.7 4.9 5.1 5.8 5.9 6.1 6.5 6.9 8.0 9.3
Intra-GMS Trade ($ billion) 5 6 9 14 14 15 15 18 26 29 34 46 62 79 100 128 159 153 207 265 302 343 413 444
GMS = Greater Mekong Subregion.Intraregional trade share = (Tii/Ti) x 100 where Tii is intraregional trade, i.e., exports of region i to region i plus imports of region i from region i; and Ti = total exports of region i to the world plus total imports of region i from the world.Source: Asian Development Bank. Asian Regional Integration Center Integration Database. https://aric.adb.org/fta (accessed December 2016).
$ bi
llion
500
400
300
100
200
0
% sh
are
10
8
6
2
4
05 6 9 14 14 15 15 18 26 29 34 46 62 79 100128
159 153207
265 302 343
Intra-GMS Trade Trade Share (%)
201220112010200920082007200620052004200320022001200019991998199719961995199419931992 2013 2014 2015
1
1
1
444413
GMS = Greater Mekong Subregion.Source: Asian Development Bank. Asian Regional Integration Center Integration Database. https://aric.adb.org/fta (accessed December 2016).
Figure 1.10: Intra-GMS Trade ($ billion and % share)

01 | Key Macro Indicators
17
Table 1.12: Total GMS Bilateral Foreign Direct Investment Inflows, 2010–2015 ($ million)
Origin Host 2010 2011 2012 2013 2014 2015
GMS GMS 436 285 451 818 608 1,280Cambodia 210 112 264 116 226 249Guangxi, PRC 6 … 0 8 7 11Yunnan, PRC 3 … 27 9 33 12Lao PDR 135 73 0 0 133 209Myanmar 3 4 31 511 105 656Thailand 6 -2 27 7 5 6Viet Nam 73 99 102 167 99 137
.... data not available at the time of this publication, FDI = foreign direct investment, GMS = Greater Mekong Subregion, Lao PDR = Lao People’s Democratic Republic, PRC = People’s Republic of China.Intra-GMS foreign direct investment inflows are inflows within the GMS, i.e., host and origin of FDI are all GMS members only. FDI inflows is net inflows of investment to acquire a lasting management interest (10% or more of voting stock) in an enterprise operating in an economy other than that of the investor.Sources: GMS Secretariat estimates; the Association of Southeast Asian Nations Secretariat Database. http://data.aseanstats.org (accessed February 2017); Guangxi Statistical Bureau. 2016. Guangxi Statistical Yearbook. Beijing: [People’s Republic of] China Statistics Press; and Statistical Bureau of Yunnan Province. 2016. Yunnan Statistical Yearbook. Beijing: [People’s Republic of] China Statistics Press.
FDI = foreign direct investment, GMS = Greater Mekong Subregion, Lao PDR = Lao People’s Democratic Republic, PRC = People’s Republic of China.Sources: GMS Secretariat estimates; the Association of Southeast Asian Nations Secretariat Database. http://data.aseanstats.org (accessed February 2017); Guangxi Statistical Bureau. 2016. Guangxi Statistical Yearbook. Beijing: [People’s Republic of] China Statistics Press; and Statistical Bureau of Yunnan Province. 2016. Yunnan Statistical Yearbook. Beijing: [People’s Republic of] China Statistics Press.
Figure 1.11: Total GMS Bilateral Foreign Direct Investment Inflows, 2010–2015 ($ million)
$ m
illion
1,500
1,309
1,178
678
550
84 50 31
Myanmar Cambodia Viet Nam ThailandLao PDR Yunnan, PRC Guangxi, PRC
750
1,000
1,250
500
250
0
STATISTICS ON GROWTH, ENERGY, AND BILATERAL TRADE IN THE GREATER MEKONG SUBREGION
18
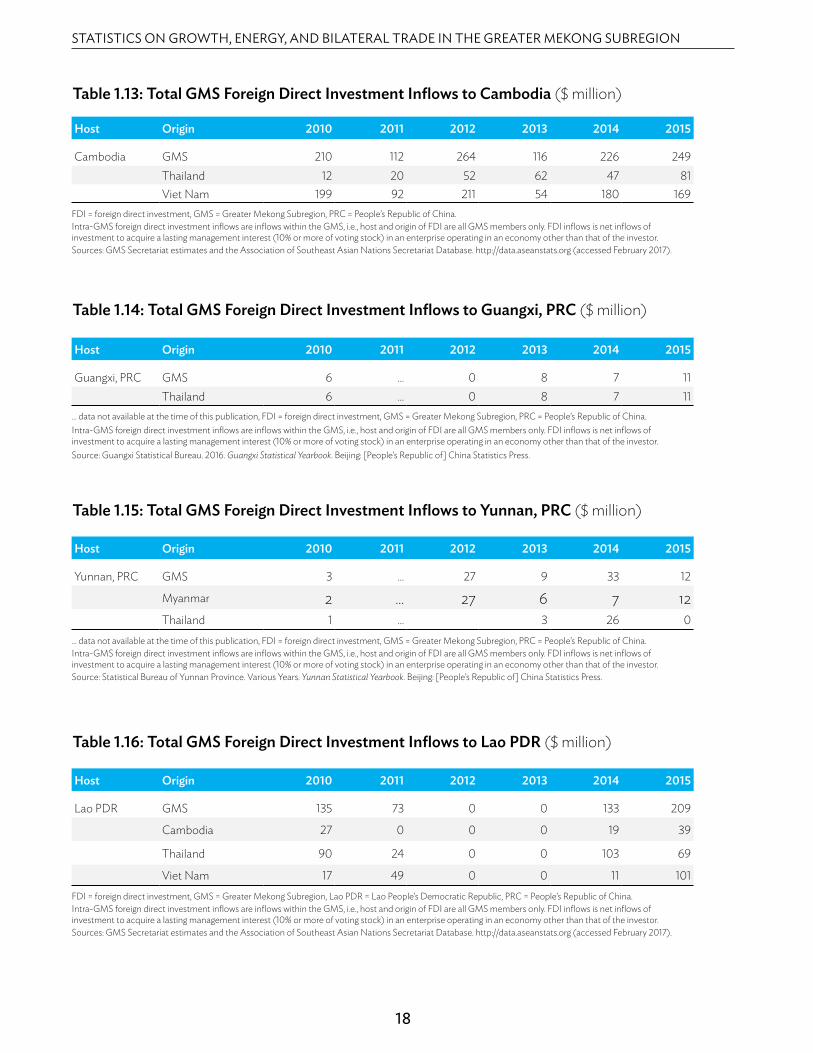
Table 1.13: Total GMS Foreign Direct Investment Inflows to Cambodia ($ million)
Host Origin 2010 2011 2012 2013 2014 2015
Cambodia GMS 210 112 264 116 226 249Thailand 12 20 52 62 47 81Viet Nam 199 92 211 54 180 169
FDI = foreign direct investment, GMS = Greater Mekong Subregion, PRC = People’s Republic of China.Intra-GMS foreign direct investment inflows are inflows within the GMS, i.e., host and origin of FDI are all GMS members only. FDI inflows is net inflows of investment to acquire a lasting management interest (10% or more of voting stock) in an enterprise operating in an economy other than that of the investor.Sources: GMS Secretariat estimates and the Association of Southeast Asian Nations Secretariat Database. http://data.aseanstats.org (accessed February 2017).
Table 1.14: Total GMS Foreign Direct Investment Inflows to Guangxi, PRC ($ million)
Host Origin 2010 2011 2012 2013 2014 2015
Guangxi, PRC GMS 6 … 0 8 7 11Thailand 6 … 0 8 7 11
… data not available at the time of this publication, FDI = foreign direct investment, GMS = Greater Mekong Subregion, PRC = People’s Republic of China.Intra-GMS foreign direct investment inflows are inflows within the GMS, i.e., host and origin of FDI are all GMS members only. FDI inflows is net inflows of investment to acquire a lasting management interest (10% or more of voting stock) in an enterprise operating in an economy other than that of the investor.Source: Guangxi Statistical Bureau. 2016. Guangxi Statistical Yearbook. Beijing: [People’s Republic of] China Statistics Press.
Table 1.15: Total GMS Foreign Direct Investment Inflows to Yunnan, PRC ($ million)
Host Origin 2010 2011 2012 2013 2014 2015
Yunnan, PRC GMS 3 … 27 9 33 12
Myanmar 2 … 27 6 7 12Thailand 1 … 3 26 0
… data not available at the time of this publication, FDI = foreign direct investment, GMS = Greater Mekong Subregion, PRC = People’s Republic of China.Intra-GMS foreign direct investment inflows are inflows within the GMS, i.e., host and origin of FDI are all GMS members only. FDI inflows is net inflows of investment to acquire a lasting management interest (10% or more of voting stock) in an enterprise operating in an economy other than that of the investor.Source: Statistical Bureau of Yunnan Province. Various Years. Yunnan Statistical Yearbook. Beijing: [People’s Republic of] China Statistics Press.
Table 1.16: Total GMS Foreign Direct Investment Inflows to Lao PDR ($ million)
Host Origin 2010 2011 2012 2013 2014 2015
Lao PDR GMS 135 73 0 0 133 209
Cambodia 27 0 0 0 19 39
Thailand 90 24 0 0 103 69
Viet Nam 17 49 0 0 11 101FDI = foreign direct investment, GMS = Greater Mekong Subregion, Lao PDR = Lao People’s Democratic Republic, PRC = People’s Republic of China.Intra-GMS foreign direct investment inflows are inflows within the GMS, i.e., host and origin of FDI are all GMS members only. FDI inflows is net inflows of investment to acquire a lasting management interest (10% or more of voting stock) in an enterprise operating in an economy other than that of the investor.Sources: GMS Secretariat estimates and the Association of Southeast Asian Nations Secretariat Database. http://data.aseanstats.org (accessed February 2017).
01 | Key Macro Indicators
19
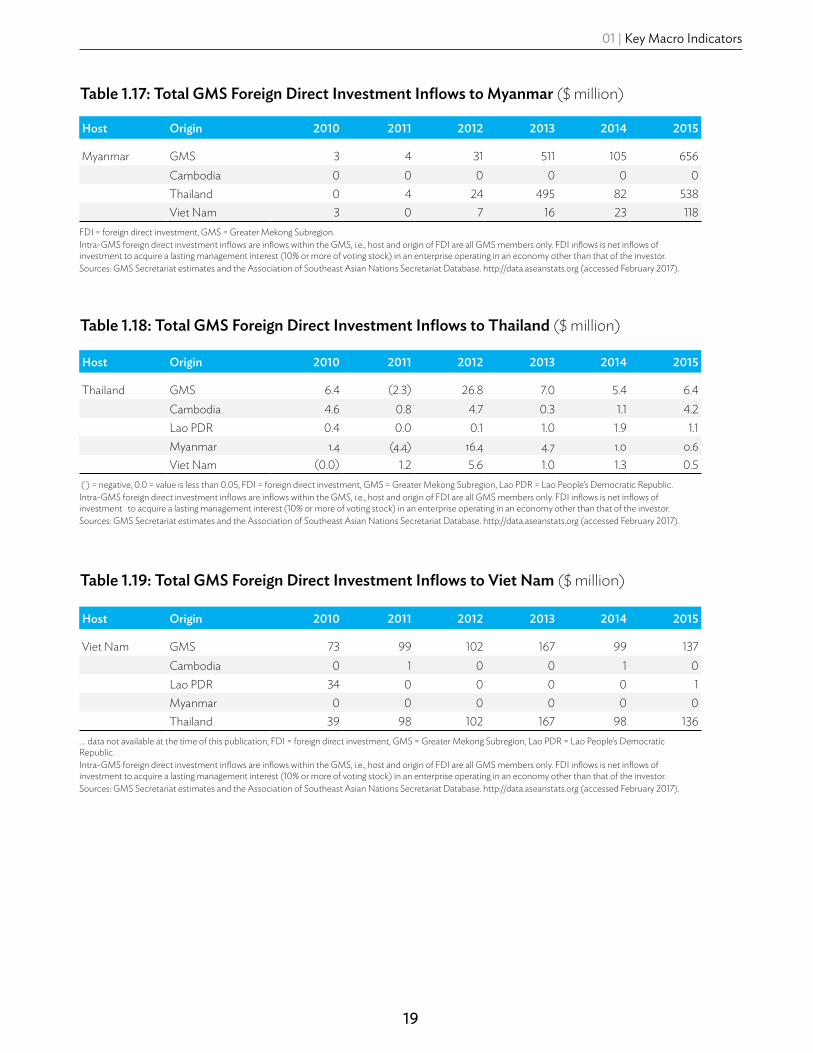
Table 1.17: Total GMS Foreign Direct Investment Inflows to Myanmar ($ million)
Host Origin 2010 2011 2012 2013 2014 2015
Myanmar GMS 3 4 31 511 105 656Cambodia 0 0 0 0 0 0Thailand 0 4 24 495 82 538Viet Nam 3 0 7 16 23 118
FDI = foreign direct investment, GMS = Greater Mekong Subregion.Intra-GMS foreign direct investment inflows are inflows within the GMS, i.e., host and origin of FDI are all GMS members only. FDI inflows is net inflows of investment to acquire a lasting management interest (10% or more of voting stock) in an enterprise operating in an economy other than that of the investor.Sources: GMS Secretariat estimates and the Association of Southeast Asian Nations Secretariat Database. http://data.aseanstats.org (accessed February 2017).
Table 1.18: Total GMS Foreign Direct Investment Inflows to Thailand ($ million)
Host Origin 2010 2011 2012 2013 2014 2015
Thailand GMS 6.4 (2.3) 26.8 7.0 5.4 6.4 Cambodia 4.6 0.8 4.7 0.3 1.1 4.2 Lao PDR 0.4 0.0 0.1 1.0 1.9 1.1 Myanmar 1.4 (4.4) 16.4 4.7 1.0 0.6 Viet Nam (0.0) 1.2 5.6 1.0 1.3 0.5
( ) = negative, 0.0 = value is less than 0.05, FDI = foreign direct investment, GMS = Greater Mekong Subregion, Lao PDR = Lao People’s Democratic Republic. Intra-GMS foreign direct investment inflows are inflows within the GMS, i.e., host and origin of FDI are all GMS members only. FDI inflows is net inflows of investment to acquire a lasting management interest (10% or more of voting stock) in an enterprise operating in an economy other than that of the investor.Sources: GMS Secretariat estimates and the Association of Southeast Asian Nations Secretariat Database. http://data.aseanstats.org (accessed February 2017).
Table 1.19: Total GMS Foreign Direct Investment Inflows to Viet Nam ($ million)
Host Origin 2010 2011 2012 2013 2014 2015
Viet Nam GMS 73 99 102 167 99 137 Cambodia 0 1 0 0 1 0 Lao PDR 34 0 0 0 0 1 Myanmar 0 0 0 0 0 0 Thailand 39 98 102 167 98 136
.... data not available at the time of this publication, FDI = foreign direct investment, GMS = Greater Mekong Subregion, Lao PDR = Lao People’s Democratic Republic.Intra-GMS foreign direct investment inflows are inflows within the GMS, i.e., host and origin of FDI are all GMS members only. FDI inflows is net inflows of investment to acquire a lasting management interest (10% or more of voting stock) in an enterprise operating in an economy other than that of the investor.Sources: GMS Secretariat estimates and the Association of Southeast Asian Nations Secretariat Database. http://data.aseanstats.org (accessed February 2017).

20
STATISTICS ON
GRO
WTH
, ENERG
Y, AN
D BILATERA
L TRAD
E IN TH
E GREATER M
EKON
G SU
BREGIO
N
Table 1.20: Trade Openness (% of GDP)
Item 1995 1996 1997 1998 1999 2000 2001 2002 2003 2004 2005 2006 2007 2008 2009 2010 2011 2012 2013 2014 2015
GMS 66.9 62.1 68.2 66.8 68.2 77.7 77.9 76.0 79.9 85.9 89.9 89.0 87.9 88.4 72.8 79.6 84.0 83.6 83.2 84.0 81.0Cambodia 47.1 45.5 56.2 66.4 74.9 97.2 98.3 102.9 109.6 117.3 114.2 125.8 122.5 121.7 108.2 140.9 154.5 167.8 173.8 173.0 173.3Guangxi, PRC 17.9 13.9 14.0 12.9 7.4 8.1 6.5 8.0 9.4 10.3 10.7 11.2 12.1 13.1 12.5 12.5 12.9 14.3 14.1 15.9 19.0Yunnan, PRC 13.0 10.5 9.6 8.6 7.2 7.5 7.7 8.0 8.6 10.1 11.2 12.5 14.0 11.7 8.9 12.5 11.7 12.9 13.5 14.2 11.2Lao PDR 45.8 44.7 43.8 54.3 56.8 59.2 58.7 55.8 53.9 59.6 63.8 72.3 72.4 74.5 68.8 79.1 90.1 99.5 98.6 101.5 86.2Myanmar … … … … … 53.4 81.7 80.7 54.6 60.3 58.4 56.3 49.4 40.4 33.8 31.7 35.1 40.5 49.7 71.0 56.9Thailand 75.3 69.9 80.4 84.4 85.8 103.4 105.5 98.8 102.5 110.3 120.6 116.9 113.1 121.7 101.7 110.8 123.4 120.1 114.1 112.7 104.5Viet Nam 65.6 69.6 76.2 73.9 76.6 90.1 89.5 98.8 114.0 128.1 119.1 127.4 144.3 143.4 125.7 145.9 159.2 164.6 181.8 189.0 197.3
… data not available at the time of this publication, GDP = gross domestic product, GMS = Greater Mekong Subregion, Lao PDR = Lao People’s Democratic Republic, PRC = People’s Republic of China. Trade openness is the ratio of total world trade and GDP. Source: GMS Secretariat estimates.
% G
DP
200
150
100
50
0
Viet Nam ThailandCambodia
2011 2012 2013 2014 2015
Lao PDR Myanmar Guangxi, PRC Yunnan, PRC
GDP = gross domestic product, GMS = Greater Mekong Subregion, Lao PDR = Lao People’s Democratic Republic, PRC = People’s Republic of China. Sources: GMS Secretariat estimates.
Figure 1.12: Trade Openness (% of GDP)

21
01 | Key Macro Indicators
Table 1.21A: GMS Foreign Direct Investment Inflows from the World ($ million)
Host 1992 1993 1994 1995 1996 1997 1998 1999 2000 2001 2002 2003 2004 2005 2006 2007 2008 2009 2010 2011 2012 2013 2014 2015
GMS 3,018 3,781 4,595 5,083 6,613 8,115 11,167 8,744 5,497 6,946 5,452 9,087 8,784 10,856 13,086 16,776 22,056 17,556 33,100 16,332 30,449 31,650 19,831 33,104Cambodia 33 54 69 151 294 168 243 232 149 149 145 84 131 381 483 867 845 928 1,342 1,372 1,835 1,872 1,720 1,701Guangxi, PRC 180 872 815 670 666 880 886 637 525 384 417 456 296 379 447 684 971 1,035 912 1,014 749 700 1,001 1,722Yunnan, PRC 23 0 203 0 180 0 146 0 0 0 112 0 142 0 302 0 777 0 1,329 1,738 2,189 2,515 2,706 2,992Lao PDR 8 30 59 95 160 86 45 52 34 24 5 19 17 28 187 324 228 190 279 301 294 427 721 1,220Myanmar 149 92 135 318 581 879 684 304 91 15 18 1,855 730 110 724 2 603 27 6,669 1,118 497 584 946 2,824Thailand 2,151 1,807 1,369 2,070 2,338 3,882 7,492 6,106 3,410 5,073 3,355 5,222 5,859 8,004 8,542 7,918 9,052 7,776 14,568 3,271 16,517 16,652 3,537 10,845Viet Nam 474 926 1,945 1,780 2,395 2,220 1,671 1,412 1,289 1,300 1,400 1,450 1,610 1,954 2,400 6,981 9,579 7,600 8,000 7,519 8,368 8,900 9,200 11,800
GMS = Greater Mekong Subregion, Lao PDR = Lao People’s Democratic Republic, PRC = People’s Republic of China.Foreign direct investment inflow is net inflows of investment to acquire a lasting management interest (10% or more of voting stock) in an enterprise operating in an economy other than that of the investor.Sources: GMS Secretariat estimates; Guangxi Statistical Bureau. Various Years. Guangxi Statistical Yearbook. Beijing: [People’s Republic of] China Statistics Press; UNCTAD STATS Database. www.unctadstats.unctad.org (accessed February 2017); and Statistical Bureau of Yunnan Province. Various Years. Yunnan Statistical Yearbook. Beijing: [People’s Republic of] China Statistics Press.
Table 1.21B: Foreign Direct Investment Openness (% of GDP)
Host 1992 1993 1994 1995 1996 1997 1998 1999 2000 2001 2002 2003 2004 2005 2006 2007 2008 2009 2010 2011 2012 2013 2014 2015
GMS 1.9 2.2 2.3 2.1 2.4 3.2 5.5 4.1 2.5 3.2 2.3 3.3 2.8 3.0 3.1 3.3 3.6 2.7 4.3 1.8 3.0 2.9 1.7 2.8Cambodia 1.7 2.1 2.5 4.4 8.4 4.9 7.8 6.6 4.1 3.8 3.4 1.8 2.5 6.1 6.6 10.0 8.2 8.9 11.9 10.7 13.1 12.3 10.2 9.4Guangxi, PRC 1.8 8.0 5.9 3.7 3.3 4.0 3.8 2.7 2.1 1.4 1.4 1.3 0.7 0.8 0.8 0.9 1.0 0.9 0.6 0.6 0.4 0.3 0.4 0.6Yunnan, PRC 0.2 0.0 1.8 0.0 1.0 0.0 0.7 0.0 0.0 0.0 0.4 0.0 0.4 0.0 0.6 0.0 0.9 0.0 1.2 1.3 1.3 1.3 1.3 1.4Lao PDR 0.7 2.3 3.8 5.4 8.5 4.7 3.5 3.7 2.1 1.4 0.3 1.0 0.7 1.0 5.3 7.7 4.3 3.2 4.1 3.7 3.2 4.0 6.1 9.9Myanmar … … … … … … … … 1.0 0.2 0.3 17.7 6.9 0.9 5.0 0.0 1.9 0.1 13.5 1.9 0.8 1.0 1.4 4.5Thailand 1.9 1.4 0.9 1.2 1.3 2.6 6.6 4.8 2.7 4.2 2.5 3.4 3.4 4.2 3.9 3.0 3.1 2.8 4.3 0.9 4.2 4.0 0.9 2.7Viet Nam 4.8 7.0 11.9 8.6 9.7 8.3 6.1 4.9 4.1 4.0 4.0 3.7 3.5 3.4 3.6 9.0 9.7 7.2 6.9 5.5 5.4 5.2 4.9 6.1
… data not available at the time of this publication, FDI = foreign direct investment, GDP = gross domestic product, GMS = Greater Mekong Subregion, Lao PDR = Lao People’s Democratic Republic, PRC = People’s Republic of China.FDI openness is the ratio of FDI inflows and GDP. Sources: GMS Secretariat estimates using data from UNCTAD STATS Database. www.unctadstats.unctad.org (accessed February 2017); and World Bank. World Development Indicators Database. http://data.worldbank.org/data-catalog/world-development-indicators (accessed February 2017).

22
STATISTICS ON
GRO
WTH
, ENERG
Y, AN
D BILATERA
L TRAD
E IN TH
E GREATER M
EKON
G SU
BREGIO
N
% G
DP
15.0
12.5
7.5
10.0
2.5
5.0
0.0Viet Nam ThailandCambodia Lao PDR Myanmar Guangxi, PRCYunnan, PRC
20122011 2013 2014 2015
FDI = foreign direct investment, GDP = gross domestic product, GMS = Greater Mekong Subregion, Lao PDR = Lao People’s Democratic Republic, PRC = People’s Republic of China.Sources: GMS Secretariat estimates using data from UNCTAD STATS Database. www.unctadstats.unctad.org (accessed February 2017); and World Bank. World Development Indicators Database. http://data.worldbank.org/data-catalog/world-development-indicators (accessed February 2017).
Figure 1.13: Foreign Direct Investment Openness (% of GDP)
02Infrastructure

24
STATISTICS ON
GRO
WTH
, ENERG
Y, AN
D BILATERA
L TRAD
E IN TH
E GREATER M
EKON
G SU
BREGIO
N
Table 2.1: Roads, Passengers Carried (Million passenger-km)
Item 1992 1993 1994 1995 1996 1997 1998 1999 2000 2001 2002 2003 2004 2005 2006 2007 2008 2009 2010 2011 2012 2013 2014 2015
Guangxi, PRC 13,339 16,404 16,532 18,078 22,597 28,032 29,263 33,230 34,794 37,207 38,270 36,735 41,064 43,877 47,143 53,693 56,352 61,828 69,532 77,651 85,798 41,573 43,060 41,082
Yunnan, PRC 6,989 7,338 10,177 9,310 10,240 11,947 13,180 16,420 17,120 23,276 21,010 19,287 22,721 23,312 24,771 26,580 27,298 30,222 35,210 42,457 47,020 32,310 32,106 33,021
Lao PDR … … … 749 930 1,101 1,208 1,290 1,424 1,463 1,573 1,516 2,079 1,676 1,869 2,114 2,113 2,197 2,556 2,372 2,619 2,740 2,980 3,414
Myanmar 2,592 2,334 2,568 2,568 2,409 2,009 1,679 1,461 1,356 1,571 2,131 2,183 2,195 2,259 2,298 2,407 2,464 2,462 2,121 2,129 2,126 1,733 777 727
Viet Nam 10,621 10,601 11,150 15,944 18,025 19,074 20,179 21,277 22,376 23,395 25,598 30,459 34,266 38,602 43,569 49,372 54,221 61,509 69,197 78,013 84,982 90,320 96,885 104,991
.... data not available at the time of this publication, km = kilometer, Lao PDR = Lao People’s Democratic Republic, PRC = People’s Republic of China.Passengers carried by roads are the number of passengers transported by road multiplied by kilometers traveled. Data for Guangxi and Yunnan, PRC are passenger-km (highways), the same data source for the national total. Data for Lao PDR are passengers traffic by land. Viet Nam 2015 data are preliminary. Sources: GMS Secretariat estimates; Guangxi Statistical Bureau. 2016. Guangxi Statistical Yearbook. Beijing: [People’s Republic of] China Statistics Press; Lao Statistics Bureau. Various Issues. Lao PDR Statistical Yearbook. Vientiane: Lao Statistics Bureau; Central Statistical Organization. Various Issues. Myanmar Statistical Yearbook. Yangon: Central Statistical Organization; Viet Nam General Statistics Office Database. http://www.gso.gov.vn/Default_en.aspx?tabid=491 (accessed May 2017); and Statistical Bureau of Yunnan Province. 2016. Yunnan Statistical Yearbook. Beijing: [People’s Republic of] China Statistics Press.
Table 2.2: Railways, Passengers Carried (Million passenger-km)
Item 1992 1993 1994 1995 1996 1997 1998 1999 2000 2001 2002 2003 2004 2005 2006 2007 2008 2009 2010 2011 2012 2013 2014 2015
GMS 30,867 34,362 34,622 33,199 30,330 30,053 29,254 30,684 32,211 33,085 33,537 32,229 33,293 35,714 38,277 40,802 43,638 41,404 44,267 46,219 43,518 44,330 48,459 50,336
Cambodia 113 80 39 39 42 49 43 50 45 33 … 45 45 45 … … … … … … … … … …
Guangxi, PRC 8,319 11,200 11,859 11,214 9,379 9,440 9,177 10,536 11,448 11,623 11,702 10,546 11,618 13,173 15,090 17,405 18,810 16,744 18,213 19,448 18,772 19,367 23,696 31,822
Yunnan , PRC 2,029 2,286 2,441 2,303 2,057 2,273 2,476 3,282 3,135 3,179 3,050 3,007 3,730 4,104 4,722 5,263 6,661 6,337 8,073 9,191 9,199 9,934 10,322 11,140
Lao PDR … … … … … … … … … … … … … … … … … … … … … … 122 99
Myanmar 4,986 5,172 4,673 4,535 4,386 4,010 4,069 4,200 4,447 4,503 4,710 4,311 4,191 4,778 5,307 5,437 5,389 5,371 5,357 4,977 3,808 3,584 3,416 3,133
Thailand 13,669 13,702 13,814 12,975 12,205 11,804 10,947 9,894 9,935 10,321 10,378 10,251 9,332 9,052 8,824 8,038 8,217 8,814 8,246 8,032 7,139 7,029 6,542 …
Viet Nam 1,752 1,921 1,796 2,133 2,261 2,476 2,542 2,722 3,200 3,426 3,697 4,069 4,376 4,563 4,334 4,660 4,560 4,138 4,378 4,571 4,601 4,417 4,482 4,241
.... data not available at the time of this publication, GMS = Greater Mekong Subregion, km = kilometer, Lao PDR = Lao People’s Democratic Republic, PRC = People’s Republic of China.Passengers carried by railways are the number of passengers transported by rail multiplied by kilometers traveled.Indicator for Myanmar estimated using data (passenger-miles) from Central Statistical Organization. Various Issues. Myanmar Statistical Yearbook. Yangon: Central Statistical Organization. All Myanmar data are for a fiscal year April to March.Sources: Guangxi Statistical Bureau. 2016. Guangxi Statistical Yearbook. Beijing: [People’s Republic of] China Statistics Press; Central Statistical Organization. Various Issues. Lao Statistics Bureau. Various Issues. Lao PDR Statistical Yearbook. Vientiane: Lao Statistics Bureau; Myanmar Statistical Yearbook. Yangon: Central Statistical Organization; National Statistical Office. Various Issues. Thailand Statistical Yearbook. Bangkok: National Statistical Office; Viet Nam General Statistics Office Database. http://www.gso.gov.vn/Default_en.aspx?tabid=491 (accessed June 2017); World Bank. World Development Indicators Database. http://data.worldbank.org/data-catalog/world-development-indicators (accessed May 2017); and Statistical Bureau of Yunnan Province. 2016. Yunnan Statistical Yearbook. Beijing: [People’s Republic of] China Statistics Press.

25
02 | Infrastructure
Table 2.3: Air Transport, Volume of Passenger Traffic (Million passenger-km)
Item 1992 1993 1994 1995 1996 1997 1998 1999 2000 2001 2002 2003 2004 2005 2006 2007 2008 2009 2010 2011 2012 2013 2014 2015
Yunnan, PRC 946 1,529 2,036 2,145 2,661 2,978 3,271 4,034 3,457 3,883 4,010 3,960 5,234 5,639 6,630 7,376 7,076 8,131 8,903 9,234 10,601 12,540 14,698 15,540
Lao PDR … … … 57 122 683 132 171 178 180 201 163 216 181 190 245 351 369 83 171 159 217 232 188
Myanmar 199 232 282 293 280 210 196 208 231 247 260 194 163 118 121 127 132 116 170 221 248 202 246 350
Viet Nam 1,012 1,403 2,371 4,094 3,948 3,922 3,867 4,042 4,383 6,111 7,101 7,112 9,367 11,124 12,817 14,682 16,152 16,508 21,162 23,269 23,626 26,878 34,708 42,068
.... data not available at the time of this publication, km=kilometer, Lao PDR=Lao People’s Democratic Republic, PRC=People’s Republic of China.Passengers carried by air transport are the number of passengers transported by air multiplied by kilometers traveled.Indicator for Myanmar estimated using data (passenger-miles) from Central Statistical Organization. Various Issues. Myanmar Statistical Yearbook. Yangon: Central Statistical Organization. All Myanmar data are for a fiscal year April to March.Sources: GMS Secretariat estimates; Lao Statistics Bureau. Various Issues. Lao PDR Statistical Yearbook. Vientiane: Lao Statistics Bureau; Central Statistical Organization. Various Issues. Myanmar Statistical Yearbook. Yangon: Central Statistical Organization; Viet Nam General Statistics Office Database. http://www.gso.gov.vn/Default_en.aspx?tabid=491 (accessed May 2017); and Statistical Bureau of Yunnan Province. 2016. Yunnan Statistical Yearbook. Beijing: [People’s Republic of] China Statistics Press.
Table 2.4: Waterways, Volume of Passenger Traffic (Million passenger-km)
Item 1992 1993 1994 1995 1996 1997 1998 1999 2000 2001 2002 2003 2004 2005 2006 2007 2008 2009 2010 2011 2012 2013 2014 2015
Guangxi, PRC 731 772 548 549 393 346 257 252 254 263 270 227 261 258 301 329 165 170 178 201 228 192 248 271
Yunnan, PRC 34 37 33 35 37 38 58 64 78 82 90 88 91 105 117 121 154 155 178 196 202 223 237 250
Lao PDR … … … 19 27 46 34 48 73 79 77 45 22 40 46 51 49 49 66 49 72 82 80 86
Myanmar 971 993 849 863 791 698 757 730 736 764 774 774 831 948 1,054 1,160 1,261 1,320 1,452 855 338 235 156 88
Viet Nam 1,145 1,311 1,412 1,937 2,207 2,303 2,395 2,466 2,510 2,693 2,957 2,739 3,158 3,407 3,189 3,151 3,246 3,048 3,195 2,856 2,835 2,914 2,986 3,048
.... data not available at the time of this publication, km = kilometer, Lao PDR = Lao People’s Democratic Republic, PRC = People’s Republic of China.Passengers carried by waterways are the number of passengers transported by waterways multiplied by kilometers traveled.Indicator for Myanmar estimated using data (passenger-miles) from Central Statistical Organization. Various Issues. Myanmar Statistical Yearbook. Yangon: Central Statistical Organization. All Myanmar data are for a fiscal year April to March. Sources: GMS Secretariat estimates; Guangxi Statistical Bureau. 2016. Guangxi Statistical Yearbook. Beijing: [People’s Republic of] China Statistics Press; Lao Statistics Bureau. Various Issues. Lao PDR Statistical Yearbook. Vientiane: Lao Statistics Bureau; Central Statistical Organization. Various Issues. Myanmar Statistical Yearbook. Yangon: Central Statistical Organization; Viet Nam General Statistics Office Database. http://www.gso.gov.vn/Default_en.aspx?tabid=491 (accessed May 2017); Statistical Bureau of Yunnan Province. 2016. Yunnan Statistical Yearbook. Beijing: [People’s Republic of] China Statistics Press.

26
STATISTICS ON
GRO
WTH
, ENERG
Y, AN
D BILATERA
L TRAD
E IN TH
E GREATER M
EKON
G SU
BREGIO
N
km=kilometer, PRC=People’s Republic of China. Source: Guangxi Statistical Bureau. 2016. Guangxi Statistical Yearbook. Beijing: [People’s Republic of] China Statistics Press.
km=kilometer, PRC=People’s Republic of China. Source: Statistical Bureau of Yunnan Province. 2016. Yunnan Statistical Yearbook. Beijing: [People’s Republic of] China Statistics Press.
Figure 2.1: Passenger Traffic by Transport Mode—Guangxi, PRC (Billion passenger-km)
Figure 2.2: Passenger Traffic by Transport Mode—Yunnan, PRC (Billion passenger-km)
Billio
n pa
ssen
ger–
km80
60
0
20
40
2013 2014 2015
Roads Railways Waterways
41.1
31.8
0.3
43.1
23.7
0.2
41.6
19.4
0.2
Billio
n pa
ssen
ger–
km
70
60
50
0
10
20
30
40
2013 2014 2015
Roads Railways Air Transport Waterways
32.3
12.5
9.9
0.2
32.1
10.3
14.7
0.2
33.0
15.5
11.1
0.3

27
02 | Infrastructure
km=kilometer, Lao PDR=Lao People’s Democratic Republic. Source: Lao Statistics Bureau. Various Issues. Lao PDR Statistical Yearbook. Vientiane: Lao Statistics Bureau.
km=kilometer. Sources: GMS Secretariat estimates and Central Statistical Organization. Various Issues. Myanmar Statistical Yearbook. Yangon: Central Statistical Organization.
Figure 2.3: Passenger Traffic by Transport Mode—Lao PDR (Billion passenger-km)
Figure 2.4: Passenger Traffic by Transport Mode—Myanmar (Billion passenger-km)
Billio
n pa
ssen
ger–
km4
3
0
1
2
2013 2014 2015Roads Railways Air Transport Waterways
2.7
0.10.2
3.0
0.10.10.2
3.4
0.10.10.2
Roads Railways Air Transport Waterways
Billio
n pa
ssen
ger–
km
7
6
5
0
1
2
3
4
2013 2014 2015
1.7
3.6
0.20.2
0.8
3.4
0.20.2
0.7
3.1
0.10.4

28
STATISTICS ON
GRO
WTH
, ENERG
Y, AN
D BILATERA
L TRAD
E IN TH
E GREATER M
EKON
G SU
BREGIO
N
km=kilometer. No 2015 data. Source: National Statistical Office. Various Issues. Thailand Statistical Yearbook. Bangkok: National Statistical Office.
km=kilometer. Source: Viet Nam General Statistics Office Database. http://www.gso.gov.vn/Default_en.aspx?tabid=491 (accessed June 2017).
Figure 2.5: Passenger Traffic by Transport Mode—Thailand (Billion passenger-km)
Figure 2.6: Passenger Traffic by Transport Mode—Viet Nam (Billion passenger-km)
Railways
Billio
n pa
ssen
ger–
km8
6
0
2
4
2013 2014 2015
7.06.5
Roads Railways Air Transport Waterways
Billio
n pa
ssen
ger–
km
175
125
150
0
50
25
75
100
2013 2014 2015
90.3 96.9
26.94.42.9
105
42.1
4.23.0
34.7
4.53.0

29
02 | Infrastructure
Table 2.5: Roads, Goods Transported (Million ton-km)
Item 1992 1993 1994 1995 1996 1997 1998 1999 2000 2001 2002 2003 2004 2005 2006 2007 2008 2009 2010 2011 2012 2013 2014 2015
Guangxi, PRC 10,272 10,323 14,036 14,339 17,058 18,348 19,048 20,210 20,944 21,210 21,851 21,710 23,562 25,843 28,685 30,223 79,996 93,470 117,345 149,404 187,829 185,718 190,270 212,260
Yunnan, PRC 17,392 13,406 18,599 19,210 22,853 25,396 27,312 28,814 29,665 31,849 33,320 35,764 36,508 38,196 40,946 45,083 46,863 49,614 54,853 61,727 70,251 92,198 100,235 107,789
Lao PDR … … … 82 72 95 105 121 162 171 163 242 328 260 266 277 287 296 513 319 363 388 395 440
Myanmar 169 236 238 266 244 287 285 297 342 366 376 22 445 489 509 548 568 569 569 576 574 555 470 366
Viet Nam 2,075 2,437 2,646 5,064 5,711 6,203 6,652 7,058 7,970 9,185 10,668 12,338 14,939 17,668 20,537 24,647 27,968 31,587 36,179 40,130 43,469 45,668 48,190 51,419
.... data not available at the time of this publication, km = kilometer, Lao PDR = Lao People’s Democratic Republic, PRC = People’s Republic of China. Goods transported by roads are the volume of goods transported by road vehicles, measured in millions of metric tons multiplied by kilometers traveled. Data for Guangxi and Yunnan, PRC are freight ton-km (highways). Data for Lao PDR are freight traffic by land. Indicator for Myanmar estimated using data (long-ton miles) from Central Statistical Organization. Various Issues. Myanmar Statistical Yearbook. Yangon: Central Statistical Organization. All Myanmar data are for a fiscal year April to March.Viet Nam 2015 data are preliminary.Sources: GMS Secretariat estimates; Guangxi Statistical Bureau. 2016. Guangxi Statistical Yearbook. Beijing: [People’s Republic of] China Statistics Press; Lao Statistics Bureau. Various Issues. Lao PDR Statistical Yearbook. Vientiane: Lao Statistics Bureau; Central Statistical Organization. Various Issues. Myanmar Statistical Yearbook. Yangon: Central Statistical Organization; Viet Nam General Statistics Office Database. http://www.gso.gov.vn/Default_en.aspx?tabid=491 (accessed May 2017); Statistical Bureau of Yunnan Province. 2016. Yunnan Statistical Yearbook. Beijing: [People’s Republic of] China Statistics Press.
Table 2.6: Railways, Goods Transported (Million ton-km)
Item 1992 1993 1994 1995 1996 1997 1998 1999 2000 2001 2002 2003 2004 2005 2006 2007 2008 2009 2010 2011 2012 2013 2014 2015
GMS 46,311 49,260 51,114 52,578 52,954 55,644 60,924 62,496 73,373 77,260 83,608 91,598 105,148 112,916 116,763 129,165 133,265 124,832 133,344 134,426 131,539 127,154 123,820 109,529
Cambodia 28 34 16 6 10 36 76 77 92 111 … … … 92 … … … … … … … … … …
Guangxi, PRC 31,098 33,521 34,814 35,161 34,630 36,673 41,346 41,460 48,514 50,415 54,092 60,639 71,335 77,773 84,602 92,894 91,286 82,525 89,133 89,538 86,001 80,943 77,085 67,453
Yunnan, PRC 10,092 10,623 10,786 11,424 12,224 12,900 14,108 15,264 18,076 19,658 21,580 23,579 26,001 27,037 27,721 31,423 33,620 34,095 35,831 36,970 37,975 39,024 39,059 37,183
Myanmar 942 1,045 1,056 994 1,041 1,019 1,104 1,233 1,352 1,298 1,303 1,081 982 1,028 993 965 1,027 1,186 1,258 1,301 1,085 928 910 857
Thailand 3,075 3,059 3,072 3,242 3,365 3,483 2,921 3,016 3,384 3,724 3,908 3,908 4,085 4,037 … … 3,161 3,161 3,161 2,455 2,455 2,455 2,455 …
Viet Nam 1,077 978 1,370 1,751 1,684 1,533 1,369 1,446 1,955 2,054 2,725 2,392 2,745 2,949 3,447 3,883 4,171 3,865 3,961 4,162 4,023 3,804 4,312 4,036
.... data not available at the time of this publication, GMS = Greater Mekong Subregion, km = kilometer, Lao PDR = Lao People’s Democratic Republic, PRC = People’s Republic of China. Goods transported by railways are the volume of goods transported by railways, measured in millions of metric tons multiplied by kilometers traveled.Lao PDR only has a 3.5-kilometer railway linking Vientiane with Thailand’s Nong Khai province. Indicator for Myanmar estimated using data (long-ton miles) from Central Statistical Organization. Various Issues. Myanmar Statistical Yearbook. Yangon: Central Statistical Organization. All Myanmar data are for a fiscal year April to March.Viet Nam 2015 data are preliminary. Sources: GMS Secretariat estimates; Guangxi Statistical Bureau. 2016. Guangxi Statistical Yearbook. Beijing: [People’s Republic of] China Statistics Press; Central Statistical Organization. Various Issues. Myanmar Statistical Yearbook. Yangon: Central Statistical Organization; National Statistical Office. Various Issues. Thailand Statistical Yearbook. Bangkok: National Statistical Office; Viet Nam General Statistics Office Database. http://www.gso.gov.vn/Default_en.aspx?tabid=491 (accessed June 2017); World Bank. World Development Indicators Database. http://data.worldbank.org/data-catalog/world-development-indicators (accessed May 2017); and Statistical Bureau of Yunnan Province. 2016. Yunnan Statistical Yearbook. Beijing: [People’s Republic of] China Statistics Press.

30
STATISTICS ON
GRO
WTH
, ENERG
Y, AN
D BILATERA
L TRAD
E IN TH
E GREATER M
EKON
G SU
BREGIO
N
Table 2.7: Air Transport, Freight (Million ton-km)
Item 1992 1993 1994 1995 1996 1997 1998 1999 2000 2001 2002 2003 2004 2005 2006 2007 2008 2009 2010 2011 2012 2013 2014 2015
Cambodia … … … … … … … … … … 4.1 3.3 3.1 1.2 1.1 2.0 0.7 1.0 0.0 0.1 0.1 1.1 1.8 2.3
Yunnan, PRC 13.0 24.0 26.0 31.0 44.0 76.0 102.0 111.0 113.0 125.0 100.0 90.0 118.0 123.0 132.0 131.0 116.0 116.0 129.0 104.0 112.0 143.0 160.0 151.0
Lao PDR 0.8 0.8 0.8 0.9 0.9 0.9 1.7 1.5 1.7 1.6 1.8 1.9 2.3 2.5 2.5 2.6 2.6 2.4 0.1 0.4 1.0 1.4 1.4 1.4
Myanmar 1.1 1.1 1.1 1.2 1.2 7.6 6.6 6.2 0.8 0.9 2.0 2.1 2.5 2.7 2.8 2.9 2.8 2.6 2.1 3.5 3.8 2.9 3.9 3.4
Thailand 925.9 1060.3 1236.7 1307.9 1348.2 1628.3 1522.2 1670.6 1712.9 1669.2 1823.6 1764.1 1868.6 2002.4 2106.9 2454.6 2289.0 2132.6 2938.7 2870.8 2758.4 2640.4 2514.9 2134.1
Viet Nam 17.6 19.0 35.7 89.2 107.1 120.2 116.6 105.5 114.1 158.2 171.8 210.6 235.8 239.3 269.4 279.9 295.6 316.6 426.8 426.7 475.1 469.8 534.4 556.1
.... data not available at the time of this publication, 0.0 = value is less than 0.05, km = kilometer, Lao PDR = Lao People’s Democratic Republic, PRC = People’s Republic of China.Air freight is the volume of freight, express, and diplomatic bags carried on each flight stage (operation of an aircraft from takeoff to its next landing), measured in metric tons multiplied by kilometers traveled.Viet Nam 2015 data are preliminary.Sources: Viet Nam General Statistics Office Database. http://www.gso.gov.vn/Default_en.aspx?tabid=491 (accessed May 2017); World Bank. World Development Indicators Database. http://data.worldbank.org/data-catalog/world-development-indicators (accessed June 2017); and Statistical Bureau of Yunnan Province. 2016. Yunnan Statistical Yearbook. Beijing: [People’s Republic of] China Statistics Press.
Table 2.8: Waterways, Volume of Freight Traffic (Million ton-km)
Item 1992 1993 1994 1995 1996 1997 1998 1999 2000 2001 2002 2003 2004 2005 2006 2007 2008 2009 2010 2011 2012 2013 2014 2015
Guangxi, PRC 6,442 7,351 10,048 9,793 8,923 9,208 9,141 8,150 7,603 8,316 10,131 11,906 14,669 17,275 20,608 28,534 49,741 60,567 86,199 108,881 137,234 118,976 119,636 126,469
Yunnan, PRC 88 108 98 106 123 121 96 92 98 99 120 154 212 293 422 459 516 542 691 819 871 1,165 1,309 1,244
Lao PDR … … … 7 23 27 23 26 59 64 70 56 50 41 43 61 68 70 70 70 79 85 95 99
Myanmar 607 636 624 581 590 605 632 614 621 640 668 770 817 820 937 1,049 1,153 1,239 1,369 937 598 510 509 339
Viet Nam 1,817 2,335 1,971 8,671 9,036 10,391 12,962 13,827 14,346 16,937 15,937 15,492 16,415 17,999 18,844 22,236 24,868 31,250 31,679 34,372 36,623 38,454 40,100 41,904
.... data not available at the time of this publication, km = kilometer, Lao PDR = Lao People’s Democratic Republic, PRC = People’s Republic of China.Goods transported by waterways are the volume of goods transported by waterways, measured in millions of metric tons multiplied by kilometers traveled.Indicator for Myanmar estimated using data (long-ton miles) from Central Statistical Organization. Various Issues. Myanmar Statistical Yearbook. Yangon: Central Statistical Organization. All Myanmar data are for a fiscal year April to March. 2014. Sources: GMS Secretariat estimates; Guangxi Statistical Bureau. 2016. Guangxi Statistical Yearbook. Beijing: [People’s Republic of] China Statistics Press; Central Statistical Organization. Various Issues. Lao Statistics Bureau. Various Issues. Lao PDR Statistical Yearbook. Vientiane: Lao Statistics Bureau; Myanmar Statistical Yearbook. Yangon: Central Statistical Organization; Viet Nam General Statistics Office Database. http://www.gso.gov.vn/Default_en.aspx?tabid=491 (accessed June 2017); and Statistical Bureau of Yunnan Province. 2016. Yunnan Statistical Yearbook. Beijing: [People’s Republic of] China Statistics Press.

31
02 | Infrastructure
km=kilometer, PRC=People’s Republic of China. Source: Guangxi Statistical Bureau. 2016. Guangxi Statistical Yearbook. Beijing: [People’s Republic of] China Statistics Press.
km=kilometer, PRC=People’s Republic of China. Source: Statistical Bureau of Yunnan Province. 2016. Yunnan Statistical Yearbook. Beijing: [People’s Republic of] China Statistics Press.
Figure 2.7: Goods Transported by Transport Mode—Guangxi, PRC (Billion ton-km)
Figure 2.8: Goods Transported by Transport Mode—Yunnan, PRC (Billion ton-km)
Roads Railways Waterways
Billio
n to
n–km
500
400
0
100
200
300
2013 2014 2015
185.7
119.0
80.9
190.3
119.6
77.1
212.3
126.5
67.5
Roads Railways Air Transport Waterways
Billio
n to
n–km
175
150
125
0
25
50
75
100
2013 2014 2015
92.2
39.0
100.2
39.1
107.8
37.2

32
STATISTICS ON
GRO
WTH
, ENERG
Y, AN
D BILATERA
L TRAD
E IN TH
E GREATER M
EKON
G SU
BREGIO
N
km=kilometer, Lao PDR=Lao People’s Democratic Republic. Source: Lao Statistics Bureau. Various Issues. Lao PDR Statistical Yearbook. Vientiane: Lao Statistics Bureau.
km=kilometer. Sources: GMS Secretariat estimates and Central Statistical Organization. Various Issues. Myanmar Statistical Yearbook. Yangon: Central Statistical Organization.
Figure 2.9: Goods Transported by Transport Mode—Lao PDR (Billion ton-km)
Figure 2.10: Goods Transported by Transport Mode—Myanmar (Billion ton-km)
Billio
n to
n–km
0.6
0.5
0.4
0.0
0.2
0.1
0.3
Roads Air Transport Waterways2013 2014 2015
0.4
0.1
0.4
0.1
0.4
0.1
Roads Railways Air Transport Waterways
Billio
n to
n–km
2.5
2.0
0.0
1.0
0.5
1.5
2013 2014 2015
0.9
0.6
0.5
0.9
0.5
0.50.3
0.4
0.9
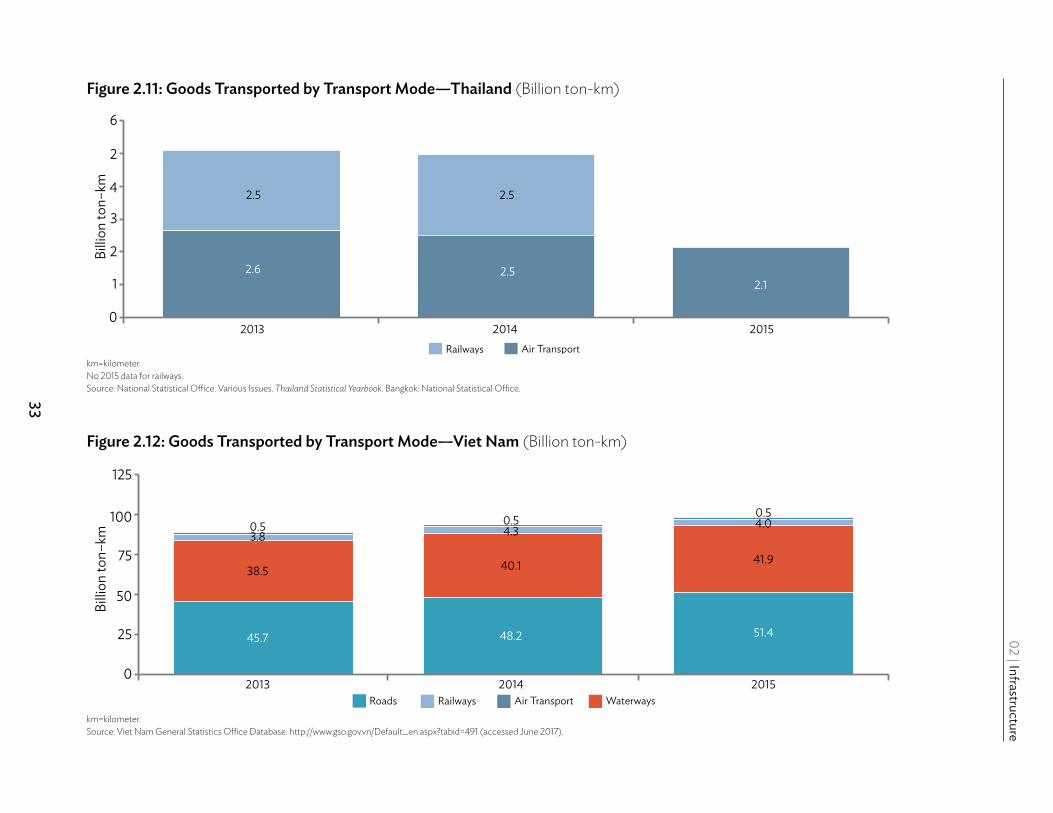
33
02 | Infrastructure
km=kilometer. No 2015 data for railways. Source: National Statistical Office. Various Issues. Thailand Statistical Yearbook. Bangkok: National Statistical Office.
km=kilometer. Source: Viet Nam General Statistics Office Database. http://www.gso.gov.vn/Default_en.aspx?tabid=491 (accessed June 2017).
Figure 2.11: Goods Transported by Transport Mode—Thailand (Billion ton-km)
Figure 2.12: Goods Transported by Transport Mode—Viet Nam (Billion ton-km)
Railways Air Transport
Billio
n to
n–km
6
2
0
3
1
2
4
2013
2.5
2.6
2.5
2.12.5
2014 2015
Billio
n to
n–km
125
100
0
50
25
75
Roads Railways Air Transport Waterways2013 2014 2015
45.7
38.5
3.80.5
48.2
40.1
4.30.5
51.4
41.9
4.00.5
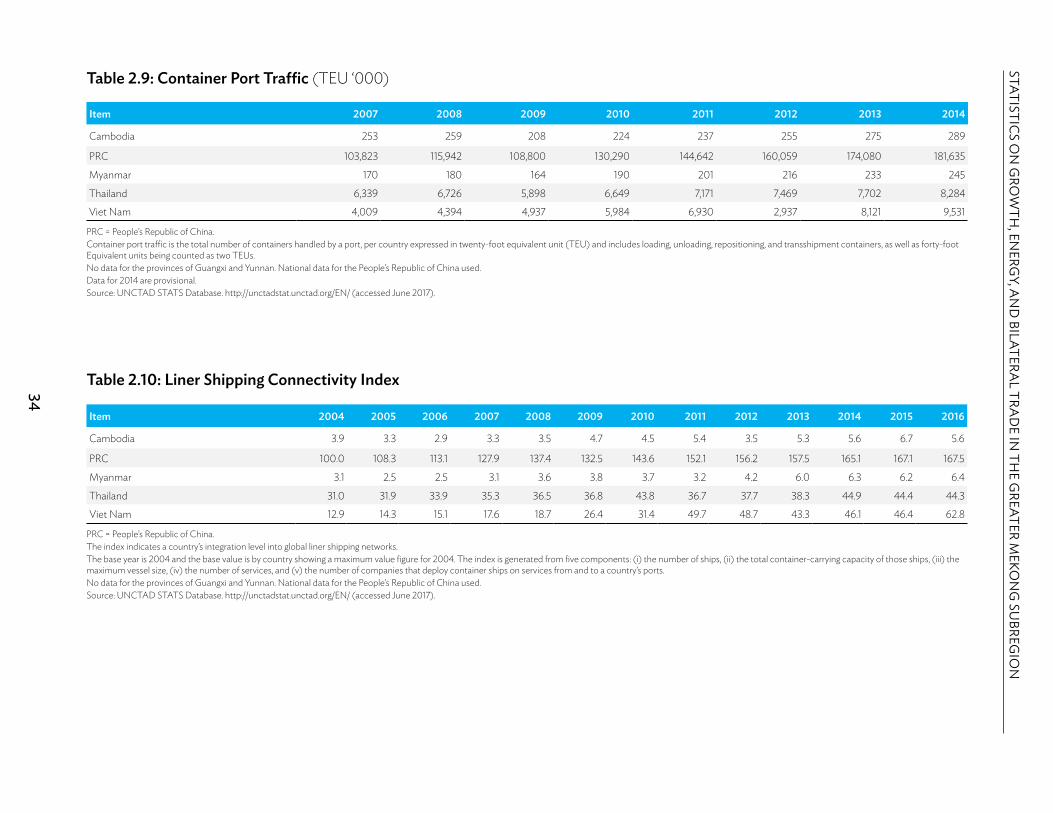
34
STATISTICS ON
GRO
WTH
, ENERG
Y, AN
D BILATERA
L TRAD
E IN TH
E GREATER M
EKON
G SU
BREGIO
N
Table 2.9: Container Port Traffic (TEU ‘000)
Item 2007 2008 2009 2010 2011 2012 2013 2014
Cambodia 253 259 208 224 237 255 275 289
PRC 103,823 115,942 108,800 130,290 144,642 160,059 174,080 181,635
Myanmar 170 180 164 190 201 216 233 245
Thailand 6,339 6,726 5,898 6,649 7,171 7,469 7,702 8,284
Viet Nam 4,009 4,394 4,937 5,984 6,930 2,937 8,121 9,531
PRC = People’s Republic of China.Container port traffic is the total number of containers handled by a port, per country expressed in twenty-foot equivalent unit (TEU) and includes loading, unloading, repositioning, and transshipment containers, as well as forty-foot Equivalent units being counted as two TEUs.No data for the provinces of Guangxi and Yunnan. National data for the People’s Republic of China used. Data for 2014 are provisional.Source: UNCTAD STATS Database. http://unctadstat.unctad.org/EN/ (accessed June 2017).
Table 2.10: Liner Shipping Connectivity Index
Item 2004 2005 2006 2007 2008 2009 2010 2011 2012 2013 2014 2015 2016
Cambodia 3.9 3.3 2.9 3.3 3.5 4.7 4.5 5.4 3.5 5.3 5.6 6.7 5.6
PRC 100.0 108.3 113.1 127.9 137.4 132.5 143.6 152.1 156.2 157.5 165.1 167.1 167.5
Myanmar 3.1 2.5 2.5 3.1 3.6 3.8 3.7 3.2 4.2 6.0 6.3 6.2 6.4
Thailand 31.0 31.9 33.9 35.3 36.5 36.8 43.8 36.7 37.7 38.3 44.9 44.4 44.3
Viet Nam 12.9 14.3 15.1 17.6 18.7 26.4 31.4 49.7 48.7 43.3 46.1 46.4 62.8
PRC = People’s Republic of China. The index indicates a country’s integration level into global liner shipping networks.The base year is 2004 and the base value is by country showing a maximum value figure for 2004. The index is generated from five components: (i) the number of ships, (ii) the total container-carrying capacity of those ships, (iii) the maximum vessel size, (iv) the number of services, and (v) the number of companies that deploy container ships on services from and to a country’s ports.No data for the provinces of Guangxi and Yunnan. National data for the People’s Republic of China used. Source: UNCTAD STATS Database. http://unctadstat.unctad.org/EN/ (accessed June 2017).

35
02 | Infrastructure
PRC=People’s Republic of China. Source: UNCTAD STATS Database. http://unctadstat.unctad.org/EN/ (accessed June 2017).
Figure 2.13: Liner Shipping Connectivity Index
Inde
x
200
150
0
50
100
PRC Cambodia Myanmar Thailand Viet Nam2014 2015 2016
165.1
46.1 44.9
6.3 5.6
167.1
46.4 44.4
6.2 6.7
167.5
62.844.3
6.4 5.6
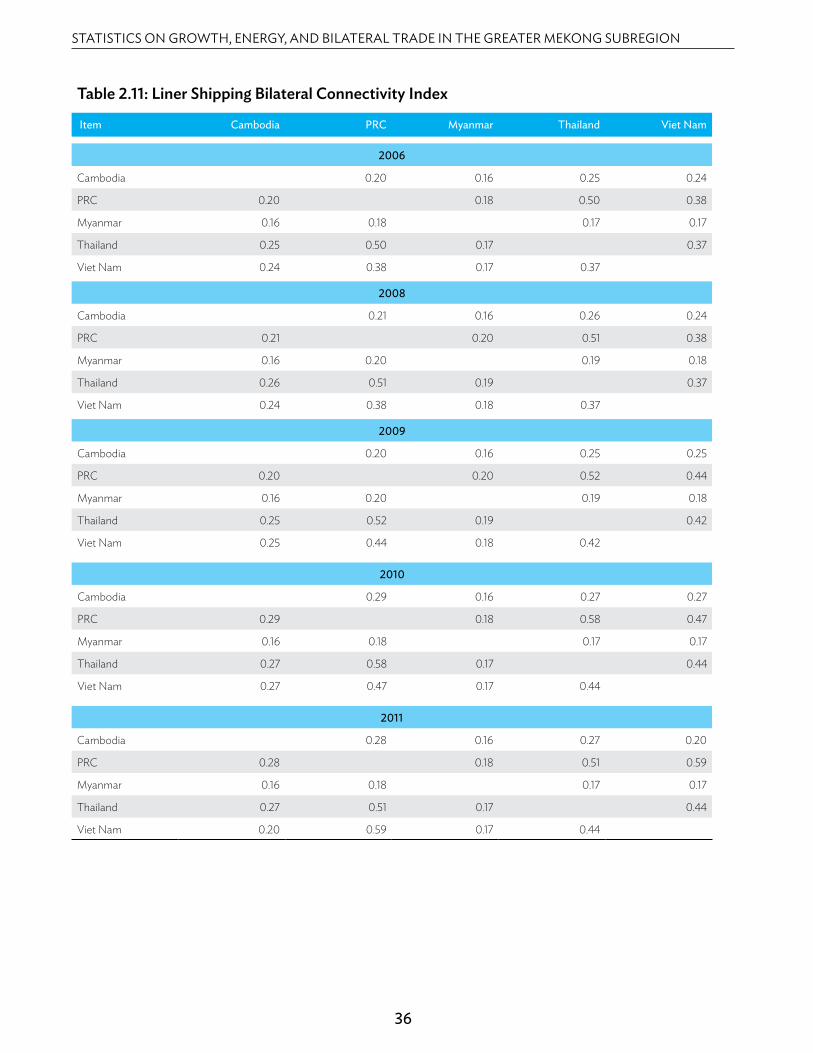
STATISTICS ON GROWTH, ENERGY, AND BILATERAL TRADE IN THE GREATER MEKONG SUBREGION
36
Table 2.11: Liner Shipping Bilateral Connectivity Index
Item Cambodia PRC Myanmar Thailand Viet Nam
2006
Cambodia 0.20 0.16 0.25 0.24
PRC 0.20 0.18 0.50 0.38
Myanmar 0.16 0.18 0.17 0.17
Thailand 0.25 0.50 0.17 0.37
Viet Nam 0.24 0.38 0.17 0.37
2008
Cambodia 0.21 0.16 0.26 0.24
PRC 0.21 0.20 0.51 0.38
Myanmar 0.16 0.20 0.19 0.18
Thailand 0.26 0.51 0.19 0.37
Viet Nam 0.24 0.38 0.18 0.37
2009
Cambodia 0.20 0.16 0.25 0.25
PRC 0.20 0.20 0.52 0.44
Myanmar 0.16 0.20 0.19 0.18
Thailand 0.25 0.52 0.19 0.42
Viet Nam 0.25 0.44 0.18 0.42
2010
Cambodia 0.29 0.16 0.27 0.27
PRC 0.29 0.18 0.58 0.47
Myanmar 0.16 0.18 0.17 0.17
Thailand 0.27 0.58 0.17 0.44
Viet Nam 0.27 0.47 0.17 0.44
2011
Cambodia 0.28 0.16 0.27 0.20
PRC 0.28 0.18 0.51 0.59
Myanmar 0.16 0.18 0.17 0.17
Thailand 0.27 0.51 0.17 0.44
Viet Nam 0.20 0.59 0.17 0.44
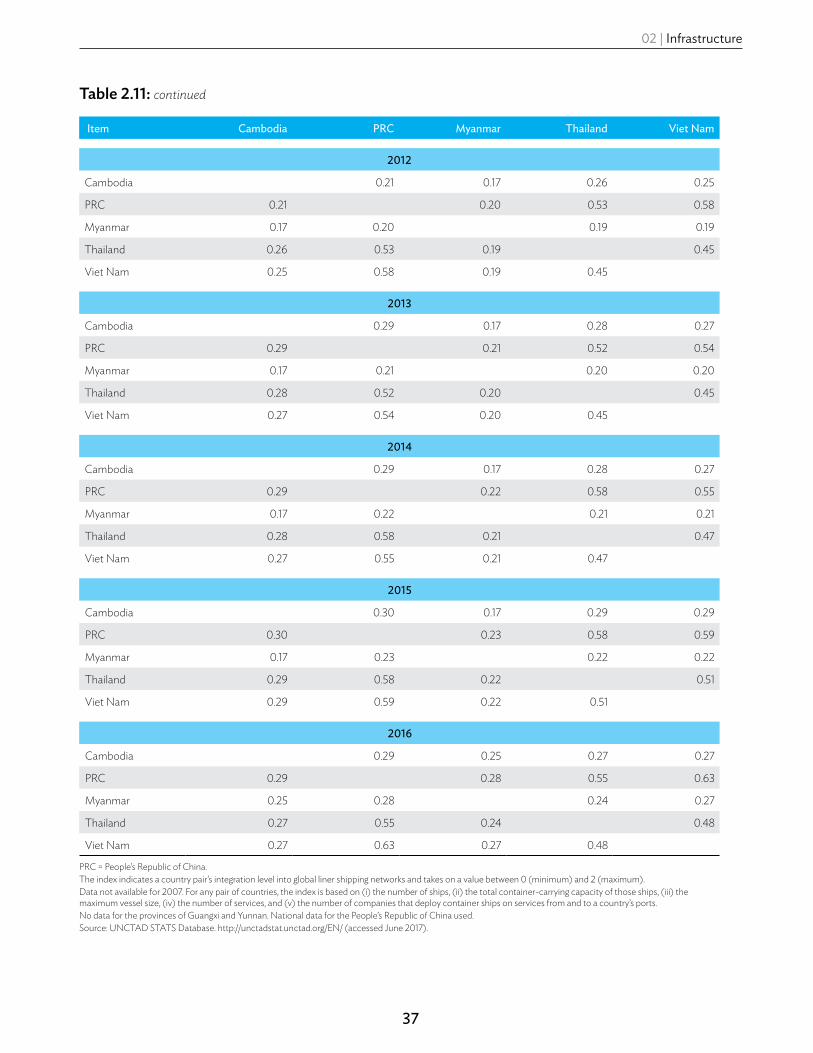
02 | Infrastructure
37
Item Cambodia PRC Myanmar Thailand Viet Nam
2012
Cambodia 0.21 0.17 0.26 0.25
PRC 0.21 0.20 0.53 0.58
Myanmar 0.17 0.20 0.19 0.19
Thailand 0.26 0.53 0.19 0.45
Viet Nam 0.25 0.58 0.19 0.45
2013
Cambodia 0.29 0.17 0.28 0.27
PRC 0.29 0.21 0.52 0.54
Myanmar 0.17 0.21 0.20 0.20
Thailand 0.28 0.52 0.20 0.45
Viet Nam 0.27 0.54 0.20 0.45
2014
Cambodia 0.29 0.17 0.28 0.27
PRC 0.29 0.22 0.58 0.55
Myanmar 0.17 0.22 0.21 0.21
Thailand 0.28 0.58 0.21 0.47
Viet Nam 0.27 0.55 0.21 0.47
2015
Cambodia 0.30 0.17 0.29 0.29
PRC 0.30 0.23 0.58 0.59
Myanmar 0.17 0.23 0.22 0.22
Thailand 0.29 0.58 0.22 0.51
Viet Nam 0.29 0.59 0.22 0.51
2016
Cambodia 0.29 0.25 0.27 0.27
PRC 0.29 0.28 0.55 0.63
Myanmar 0.25 0.28 0.24 0.27
Thailand 0.27 0.55 0.24 0.48
Viet Nam 0.27 0.63 0.27 0.48
PRC = People’s Republic of China.The index indicates a country pair’s integration level into global liner shipping networks and takes on a value between 0 (minimum) and 2 (maximum).Data not available for 2007. For any pair of countries, the index is based on (i) the number of ships, (ii) the total container-carrying capacity of those ships, (iii) the maximum vessel size, (iv) the number of services, and (v) the number of companies that deploy container ships on services from and to a country’s ports.No data for the provinces of Guangxi and Yunnan. National data for the People’s Republic of China used. Source: UNCTAD STATS Database. http://unctadstat.unctad.org/EN/ (accessed June 2017).
Table 2.11: continued

38
STATISTICS ON
GRO
WTH
, ENERG
Y, AN
D BILATERA
L TRAD
E IN TH
E GREATER M
EKON
G SU
BREGIO
N
PRC= People’s Republic of China. Source: UNCTAD STATS Database. http://unctadstat.unctad.org/EN/ (accessed June 2017).
PRC= People’s Republic of China. Source: UNCTAD STATS Database. http://unctadstat.unctad.org/EN/ (accessed June 2017).
Figure 2.14: Liner Shipping Bilateral Connectivity Index—Cambodia
Figure 2.15: Liner Shipping Bilateral Connectivity Index—PRC
Inde
x0.35
0.25
0.30
0.00
0.05
0.10
0.15
0.20
PRC Myanmar Thailand Viet Nam2014 2015 2016
0.29 0.28 0.27
0.17
0.30 0.29 0.29
0.17
0.290.27 0.27
0.25
Inde
x
0.70
0.50
0.60
0.00
0.10
0.20
0.30
0.40
2014 2015 2016
0.550.58
0.29
0.22
0.59 0.58
0.30
0.23
0.63
0.55
0.29 0.28
Cambodia Myanmar Thailand Viet Nam

39
02 | Infrastructure
PRC=People’s Republic of China. Source: UNCTAD STATS Database. http://unctadstat.unctad.org/EN/ (accessed June 2017).
PRC=People’s Republic of China. Source: UNCTAD STATS Database. http://unctadstat.unctad.org/EN/ (accessed June 2017).
Figure 2.16: Liner Shipping Bilateral Connectivity Index—Myanmar
Figure 2.17: Liner Shipping Bilateral Connectivity Index—Thailand
Inde
x0.30
0.20
0.25
0.00
0.05
0.10
0.15
2014 2015 2016
0.22 0.21 0.21
0.17
0.23 0.22 0.22
0.17
0.28 0.270.24 0.25
PRCCambodia Thailand Viet Nam
Inde
x
0.70
0.50
0.60
0.00
0.20
0.10
0.30
0.40
2014 2015 2016
0.58
0.47
0.280.21
0.580.51
0.290.22
0.550.48
0.27 0.24
PRCCambodia Myanmar Viet Nam
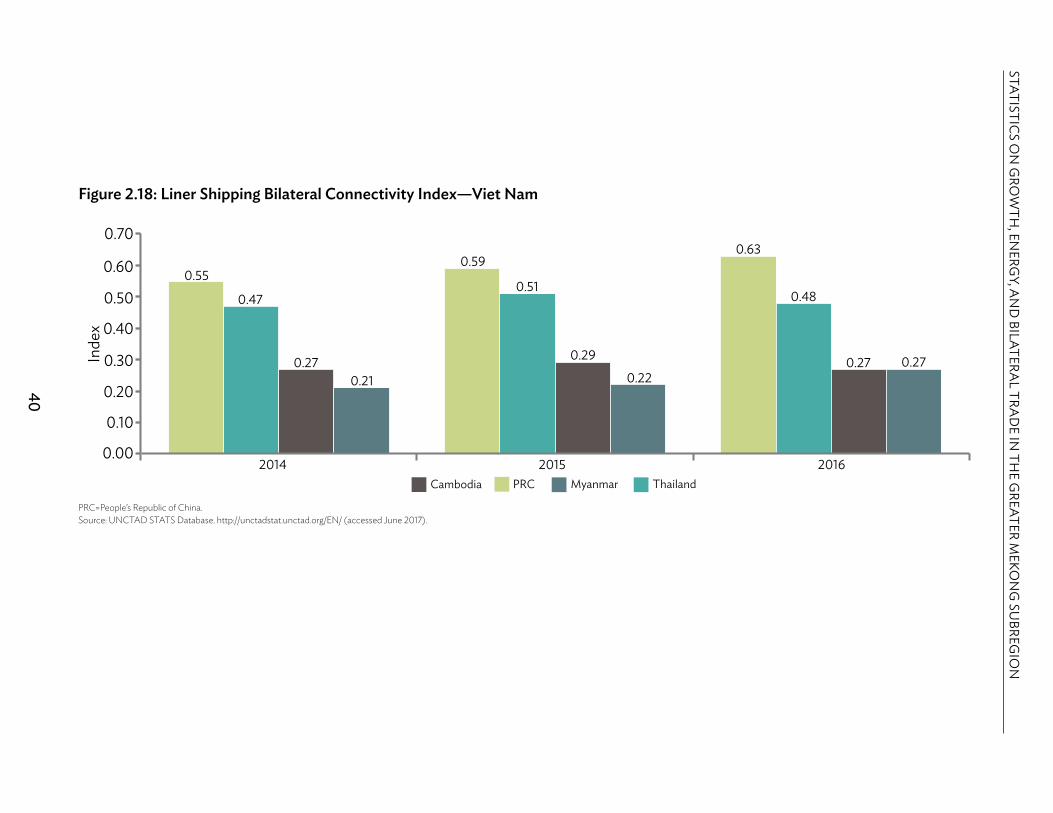
40
STATISTICS ON
GRO
WTH
, ENERG
Y, AN
D BILATERA
L TRAD
E IN TH
E GREATER M
EKON
G SU
BREGIO
N
PRC=People’s Republic of China. Source: UNCTAD STATS Database. http://unctadstat.unctad.org/EN/ (accessed June 2017).
Figure 2.18: Liner Shipping Bilateral Connectivity Index—Viet Nam
Inde
x
0.70
0.50
0.60
0.00
0.20
0.10
0.30
0.40
2014 2015 2016
0.55
0.47
0.270.21
0.59
0.51
0.29
0.22
0.63
0.48
0.27 0.27
PRCCambodia Myanmar Thailand
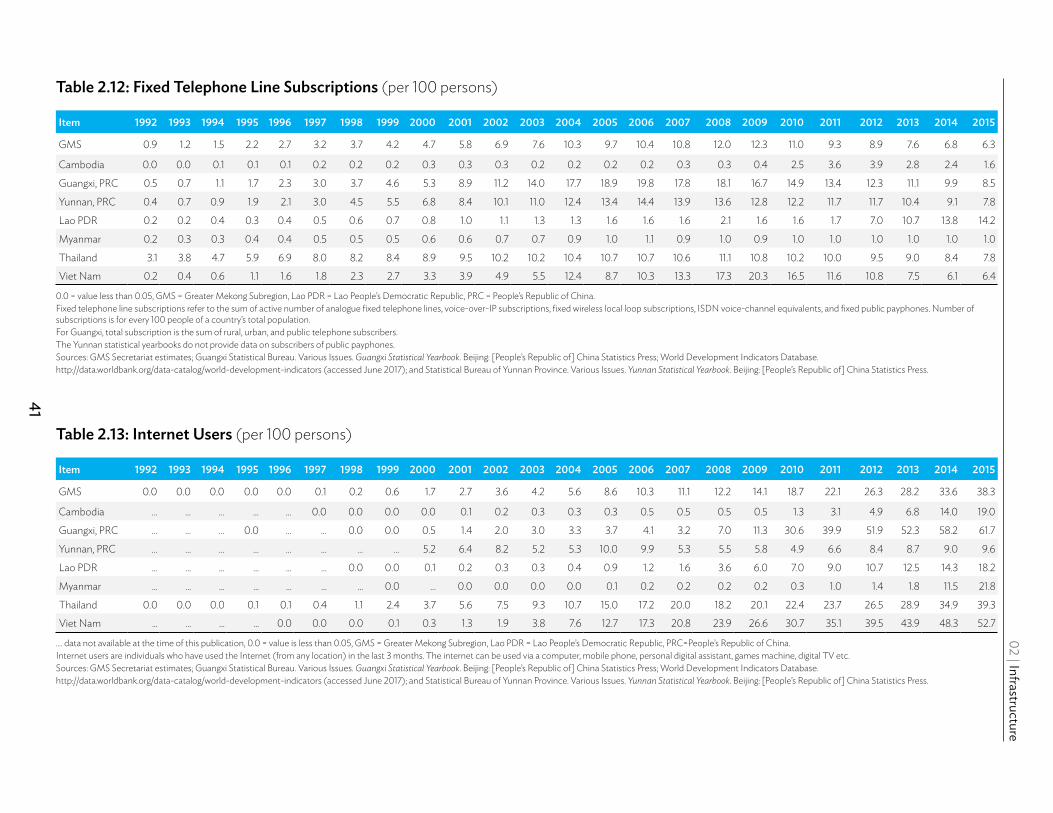
41
02 | Infrastructure
Table 2.12: Fixed Telephone Line Subscriptions (per 100 persons)
Item 1992 1993 1994 1995 1996 1997 1998 1999 2000 2001 2002 2003 2004 2005 2006 2007 2008 2009 2010 2011 2012 2013 2014 2015
GMS 0.9 1.2 1.5 2.2 2.7 3.2 3.7 4.2 4.7 5.8 6.9 7.6 10.3 9.7 10.4 10.8 12.0 12.3 11.0 9.3 8.9 7.6 6.8 6.3
Cambodia 0.0 0.0 0.1 0.1 0.1 0.2 0.2 0.2 0.3 0.3 0.3 0.2 0.2 0.2 0.2 0.3 0.3 0.4 2.5 3.6 3.9 2.8 2.4 1.6
Guangxi, PRC 0.5 0.7 1.1 1.7 2.3 3.0 3.7 4.6 5.3 8.9 11.2 14.0 17.7 18.9 19.8 17.8 18.1 16.7 14.9 13.4 12.3 11.1 9.9 8.5
Yunnan, PRC 0.4 0.7 0.9 1.9 2.1 3.0 4.5 5.5 6.8 8.4 10.1 11.0 12.4 13.4 14.4 13.9 13.6 12.8 12.2 11.7 11.7 10.4 9.1 7.8
Lao PDR 0.2 0.2 0.4 0.3 0.4 0.5 0.6 0.7 0.8 1.0 1.1 1.3 1.3 1.6 1.6 1.6 2.1 1.6 1.6 1.7 7.0 10.7 13.8 14.2
Myanmar 0.2 0.3 0.3 0.4 0.4 0.5 0.5 0.5 0.6 0.6 0.7 0.7 0.9 1.0 1.1 0.9 1.0 0.9 1.0 1.0 1.0 1.0 1.0 1.0
Thailand 3.1 3.8 4.7 5.9 6.9 8.0 8.2 8.4 8.9 9.5 10.2 10.2 10.4 10.7 10.7 10.6 11.1 10.8 10.2 10.0 9.5 9.0 8.4 7.8
Viet Nam 0.2 0.4 0.6 1.1 1.6 1.8 2.3 2.7 3.3 3.9 4.9 5.5 12.4 8.7 10.3 13.3 17.3 20.3 16.5 11.6 10.8 7.5 6.1 6.4
0.0 = value less than 0.05, GMS = Greater Mekong Subregion, Lao PDR = Lao People’s Democratic Republic, PRC = People’s Republic of China.Fixed telephone line subscriptions refer to the sum of active number of analogue fixed telephone lines, voice-over-IP subscriptions, fixed wireless local loop subscriptions, ISDN voice-channel equivalents, and fixed public payphones. Number of subscriptions is for every 100 people of a country’s total population.For Guangxi, total subscription is the sum of rural, urban, and public telephone subscribers. The Yunnan statistical yearbooks do not provide data on subscribers of public payphones. Sources: GMS Secretariat estimates; Guangxi Statistical Bureau. Various Issues. Guangxi Statistical Yearbook. Beijing: [People’s Republic of] China Statistics Press; World Development Indicators Database. http://data.worldbank.org/data-catalog/world-development-indicators (accessed June 2017); and Statistical Bureau of Yunnan Province. Various Issues. Yunnan Statistical Yearbook. Beijing: [People’s Republic of] China Statistics Press.
Table 2.13: Internet Users (per 100 persons)
Item 1992 1993 1994 1995 1996 1997 1998 1999 2000 2001 2002 2003 2004 2005 2006 2007 2008 2009 2010 2011 2012 2013 2014 2015
GMS 0.0 0.0 0.0 0.0 0.0 0.1 0.2 0.6 1.7 2.7 3.6 4.2 5.6 8.6 10.3 11.1 12.2 14.1 18.7 22.1 26.3 28.2 33.6 38.3
Cambodia ... ... ... ... ... 0.0 0.0 0.0 0.0 0.1 0.2 0.3 0.3 0.3 0.5 0.5 0.5 0.5 1.3 3.1 4.9 6.8 14.0 19.0
Guangxi, PRC … … … 0.0 … … 0.0 0.0 0.5 1.4 2.0 3.0 3.3 3.7 4.1 3.2 7.0 11.3 30.6 39.9 51.9 52.3 58.2 61.7
Yunnan, PRC … … … … … … … … 5.2 6.4 8.2 5.2 5.3 10.0 9.9 5.3 5.5 5.8 4.9 6.6 8.4 8.7 9.0 9.6
Lao PDR ... ... ... ... ... ... 0.0 0.0 0.1 0.2 0.3 0.3 0.4 0.9 1.2 1.6 3.6 6.0 7.0 9.0 10.7 12.5 14.3 18.2
Myanmar ... ... ... ... ... ... ... 0.0 … 0.0 0.0 0.0 0.0 0.1 0.2 0.2 0.2 0.2 0.3 1.0 1.4 1.8 11.5 21.8
Thailand 0.0 0.0 0.0 0.1 0.1 0.4 1.1 2.4 3.7 5.6 7.5 9.3 10.7 15.0 17.2 20.0 18.2 20.1 22.4 23.7 26.5 28.9 34.9 39.3
Viet Nam ... ... ... ... 0.0 0.0 0.0 0.1 0.3 1.3 1.9 3.8 7.6 12.7 17.3 20.8 23.9 26.6 30.7 35.1 39.5 43.9 48.3 52.7
.... data not available at the time of this publication, 0.0 = value is less than 0.05, GMS = Greater Mekong Subregion, Lao PDR = Lao People’s Democratic Republic, PRC=People’s Republic of China.Internet users are individuals who have used the Internet (from any location) in the last 3 months. The internet can be used via a computer, mobile phone, personal digital assistant, games machine, digital TV etc.Sources: GMS Secretariat estimates; Guangxi Statistical Bureau. Various Issues. Guangxi Statistical Yearbook. Beijing: [People’s Republic of] China Statistics Press; World Development Indicators Database. http://data.worldbank.org/data-catalog/world-development-indicators (accessed June 2017); and Statistical Bureau of Yunnan Province. Various Issues. Yunnan Statistical Yearbook. Beijing: [People’s Republic of] China Statistics Press.

42
STATISTICS ON
GRO
WTH
, ENERG
Y, AN
D BILATERA
L TRAD
E IN TH
E GREATER M
EKON
G SU
BREGIO
N
Table 2.14: Mobile Cellular Subscriptions (per 100 persons)
Item 1992 1993 1994 1995 1996 1997 1998 1999 2000 2001 2002 2003 2004 2005 2006 2007 2008 2009 2010 2011 2012 2013 2014 2015
GMS 0.1 0.2 0.3 0.5 0.7 0.8 1.0 1.2 2.6 5.1 9.7 12.4 15.9 19.6 27.0 41.0 55.3 66.4 74.4 84.8 92.3 95.3 107.3 107.6
Cambodia 0 0.0 0.1 0.1 0.2 0.3 0.5 0.7 1.1 1.8 3.0 3.9 6.6 8.0 12.7 18.8 30.4 44.3 56.7 94.3 128.8 134.4 133.4 133.8
Guangxi, PRC … … … 0.2 … … 1.1 1.6 3.5 5.7 8.9 13.4 17.9 20.7 24.2 27.4 32.2 38.5 42.9 48.7 55.0 62.2 64.9 65.1
Yunnan, PRC … … … … … … … … 4.7 7.9 11.6 14.4 16.6 20.2 23.8 29.8 36.0 42.4 48.8 55.9 64.8 72.5 79.5 79.9
Lao PDR 0.0 0.0 0.0 0.0 0.1 0.1 0.1 0.2 0.2 0.5 1.0 2.0 3.6 11.4 17.3 24.9 33.4 52.6 63.9 86.1 66.4 70.1 69.0 54.8
Myanmar 0 0.0 0.0 0.0 0.0 0.0 0.0 0.0 0.0 0.0 0.1 0.1 0.2 0.3 0.4 0.5 0.7 1.0 1.1 2.4 7.1 12.9 54.3 76.1
Thailand 0.4 0.7 1.3 2.2 3.1 3.6 3.2 3.8 4.9 11.9 27.2 33.4 41.2 46.2 60.6 79.8 93.1 99.1 107.5 115.8 126.6 139.1 143.4 151.5
Viet Nam 0.0 0.0 0.0 0.0 0.1 0.2 0.3 0.4 1.0 1.6 2.4 3.4 6.1 11.6 22.7 53.5 88.0 114.2 128.3 144.9 148.3 137.9 150.1 133.0
… data not available at the time of this publication, 0.0 = value less than 0.05, GMS = Greater Mekong Subregion, Lao PDR = Lao People’s Democratic Republic, PRC = People’s Republic of China.Mobile cellular subscriptions are subscriptions to a public mobile telephone service that provide access to the public switched telephone network using cellular technology. Sources: GMS Secretariat estimates; Guangxi Statistical Bureau. Various Issues. Guangxi Statistical Yearbook. Beijing: [People’s Republic of] China Statistics Press; World Development Indicators Database. http://data.worldbank.org/data-catalog/world-development-indicators (accessed June 2017); and Statistical Bureau of Yunnan Province. Various Issues. Yunnan Statistical Yearbook. Beijing: [People’s Republic of] China Statistics Press.
GMS=Greater Mekong Subregion, ICT=information and communication technology.Source: GMS Secretariat estimates.
Figure 2.19: GMS ICT Subscriptions (per 100 persons)
Subs
crip
tions
per
100
pers
ons 125
100
0
25
50
75
2013 2014 2015
95.3
28.2
7.6
107.3
33.6
6.8
107.6
38.3
6.3
Internet UsersFixed Telephone Lines Subscriptions Mobile Cellular Subscriptions
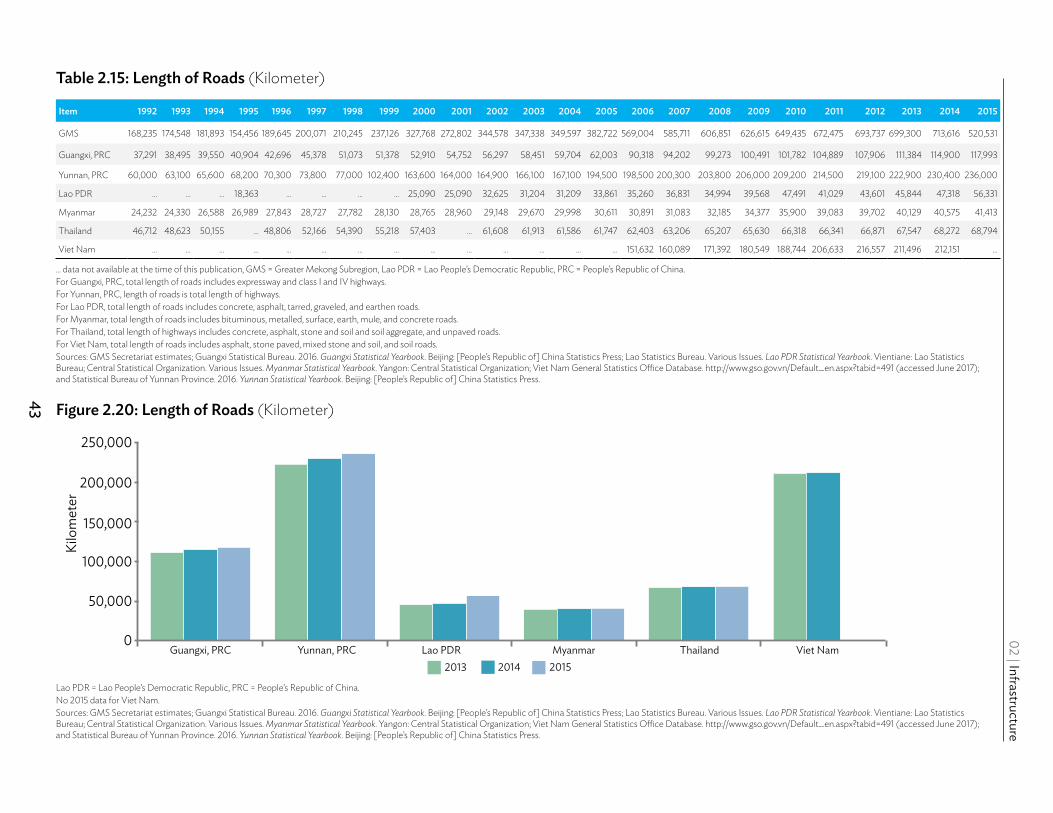
43
02 | Infrastructure
Table 2.15: Length of Roads (Kilometer)
Item 1992 1993 1994 1995 1996 1997 1998 1999 2000 2001 2002 2003 2004 2005 2006 2007 2008 2009 2010 2011 2012 2013 2014 2015
GMS 168,235 174,548 181,893 154,456 189,645 200,071 210,245 237,126 327,768 272,802 344,578 347,338 349,597 382,722 569,004 585,711 606,851 626,615 649,435 672,475 693,737 699,300 713,616 520,531
Guangxi, PRC 37,291 38,495 39,550 40,904 42,696 45,378 51,073 51,378 52,910 54,752 56,297 58,451 59,704 62,003 90,318 94,202 99,273 100,491 101,782 104,889 107,906 111,384 114,900 117,993
Yunnan, PRC 60,000 63,100 65,600 68,200 70,300 73,800 77,000 102,400 163,600 164,000 164,900 166,100 167,100 194,500 198,500 200,300 203,800 206,000 209,200 214,500 219,100 222,900 230,400 236,000
Lao PDR … … … 18,363 … … … … 25,090 25,090 32,625 31,204 31,209 33,861 35,260 36,831 34,994 39,568 47,491 41,029 43,601 45,844 47,318 56,331
Myanmar 24,232 24,330 26,588 26,989 27,843 28,727 27,782 28,130 28,765 28,960 29,148 29,670 29,998 30,611 30,891 31,083 32,185 34,377 35,900 39,083 39,702 40,129 40,575 41,413
Thailand 46,712 48,623 50,155 … 48,806 52,166 54,390 55,218 57,403 … 61,608 61,913 61,586 61,747 62,403 63,206 65,207 65,630 66,318 66,341 66,871 67,547 68,272 68,794
Viet Nam … … … … … … … … … … … … … … 151,632 160,089 171,392 180,549 188,744 206,633 216,557 211,496 212,151 …
… data not available at the time of this publication, GMS = Greater Mekong Subregion, Lao PDR = Lao People’s Democratic Republic, PRC = People’s Republic of China. For Guangxi, PRC, total length of roads includes expressway and class I and IV highways. For Yunnan, PRC, length of roads is total length of highways. For Lao PDR, total length of roads includes concrete, asphalt, tarred, graveled, and earthen roads. For Myanmar, total length of roads includes bituminous, metalled, surface, earth, mule, and concrete roads. For Thailand, total length of highways includes concrete, asphalt, stone and soil and soil aggregate, and unpaved roads. For Viet Nam, total length of roads includes asphalt, stone paved, mixed stone and soil, and soil roads. Sources: GMS Secretariat estimates; Guangxi Statistical Bureau. 2016. Guangxi Statistical Yearbook. Beijing: [People’s Republic of] China Statistics Press; Lao Statistics Bureau. Various Issues. Lao PDR Statistical Yearbook. Vientiane: Lao Statistics Bureau; Central Statistical Organization. Various Issues. Myanmar Statistical Yearbook. Yangon: Central Statistical Organization; Viet Nam General Statistics Office Database. http://www.gso.gov.vn/Default_en.aspx?tabid=491 (accessed June 2017); and Statistical Bureau of Yunnan Province. 2016. Yunnan Statistical Yearbook. Beijing: [People’s Republic of] China Statistics Press.
Lao PDR = Lao People’s Democratic Republic, PRC = People’s Republic of China. No 2015 data for Viet Nam. Sources: GMS Secretariat estimates; Guangxi Statistical Bureau. 2016. Guangxi Statistical Yearbook. Beijing: [People’s Republic of] China Statistics Press; Lao Statistics Bureau. Various Issues. Lao PDR Statistical Yearbook. Vientiane: Lao Statistics Bureau; Central Statistical Organization. Various Issues. Myanmar Statistical Yearbook. Yangon: Central Statistical Organization; Viet Nam General Statistics Office Database. http://www.gso.gov.vn/Default_en.aspx?tabid=491 (accessed June 2017); and Statistical Bureau of Yunnan Province. 2016. Yunnan Statistical Yearbook. Beijing: [People’s Republic of] China Statistics Press.
Figure 2.20: Length of Roads (Kilometer)
Kilo
met
er
250,000
200,000
0
50,000
100,000
150,000
2014Guangxi, PRC Yunnan, PRC Lao PDR Myanmar Thailand Viet Nam
2013 2015

44
STATISTICS ON
GRO
WTH
, ENERG
Y, AN
D BILATERA
L TRAD
E IN TH
E GREATER M
EKON
G SU
BREGIO
N
Table 2.16: Rail Lines (Total route-km)
Item 1992 1993 1994 1995 1996 1997 1998 1999 2000 2001 2002 2003 2004 2005 2006 2007 2008 2009 2010 2011 2012 2013 2014 2015
GMS 12,521 12,604 12,702 13,071 13,233 13,617 14,145 14,182 14,185 13,560 16,769 16,278 16,819 16,963 14,376 14,482 13,914 16,928 17,290 18,858 19,123 19,997 21,978 17,040
Cambodia 600 600 600 600 600 600 600 600 601 … 603 ... 603 650 650 650 ... ... ... ... ... ... ... ...
Guangxi, PRC a … … … … … … … … 2,725 2,715 2,751 2,751 2,751 2,733 2,737 2,736 2,736 3,126 3,174 3,163 3,164 3,982 4,711 5,086
Yunnan, PRC a 1,651 1,644 1,642 1,644 1,644 2,023 1,991 2,015 2,015 2,015 2,016 1,984 1,925 1,925 1,925 1,924 1,924 1,924 1,924 2,142 2,350 2,351 2,647 2,660
Myanmar 3,568 3,658 3,758 3,954 4,117 4,122 4,678 4,691 4,741 4,786 4,810 4,847 4,896 4,949 5,020 5,129 5,211 5,488 5,802 5,879 5,935 5,990 6,107 6,107
Thailand 3,870 3,870 3,870 4,041 4,041 4,041 4,044 4,044 4,103 4,044 4,044 4,044 4,044 4,035 4,044 4,043 4,043 4,043 4,043 5,327 5,327 5,327 5,327 ...
Viet Nam 2,832 2,832 2,832 2,832 2,832 2,832 2,832 2,832 ... ... 2,545 2,652 2,600 2,671 ... ... ... 2,347 2,347 2,347 2,347 2,347 3,186 3,186
… data not available at the time of this publication, GMS = Greater Mekong Subregion, km = kilometer, Lao PDR = Lao People’s Democratic Republic, PRC = People’s Republic of China. Rail lines are the length of railway route available for train service, irrespective of the number of parallel tracks. a Length of railways in operation. Lao PDR only has a 3.5-kilometer railway linking Vientiane with Thailand’s Nong Khai province. Sources: GMS Secretariat estimates; National Institute of Statistics. Various Issues. Cambodia Statistical Yearbook. Phnom Penh: National Institute of Statistics; Guangxi Statistical Bureau. 2016. Guangxi Statistical Yearbook. Beijing: [People’s Republic of] China Statistics Press; Central Statistical Organization. Various Issues. Myanmar Statistical Yearbook. Yangon: Central Statistical Organization; National Statistical Office. Various Issues. Thailand Statistical Yearbook. Bangkok: National Statistical Office; World Bank. World Development Indicators Database. http://data.worldbank.org/data-catalog/world-development-indicators (accessed June 2017); and Statistical Bureau of Yunnan Province. 2016. Yunnan Statistical Yearbook. Beijing: [People’s Republic of] China Statistics Press.
km=kilometer, PRC = People’s Republic of China. No 2015 data for Thailand. Sources: GMS Secretariat estimates; National Institute of Statistics. Various Issues. Cambodia Statistical Yearbook. Phnom Penh: National Institute of Statistics; Guangxi Statistical Bureau. 2016. Guangxi Statistical Yearbook. Beijing: [People’s Republic of] China Statistics Press; Central Statistical Organization. Various Issues. Myanmar Statistical Yearbook. Yangon: Central Statistical Organization; National Statistical Office. Various Issues. Thailand Statistical Yearbook. Bangkok: National Statistical Office; World Development Indicators Database. http://data.worldbank.org/data-catalog/world-development-indicators(accessed June 2017); and Statistical Bureau of Yunnan Province. 2016. Yunnan Statistical Yearbook. Beijing: [People’s Republic of] China Statistics Press.
Figure 2.21: Rail Lines (Total route-km)
Kilo
met
er
7,000
4,000
5,000
6,000
0
1,000
2,000
3,000
2014Guangxi, PRC Yunnan, PRC Myanmar Thailand Viet Nam
2013 2015

03Energy
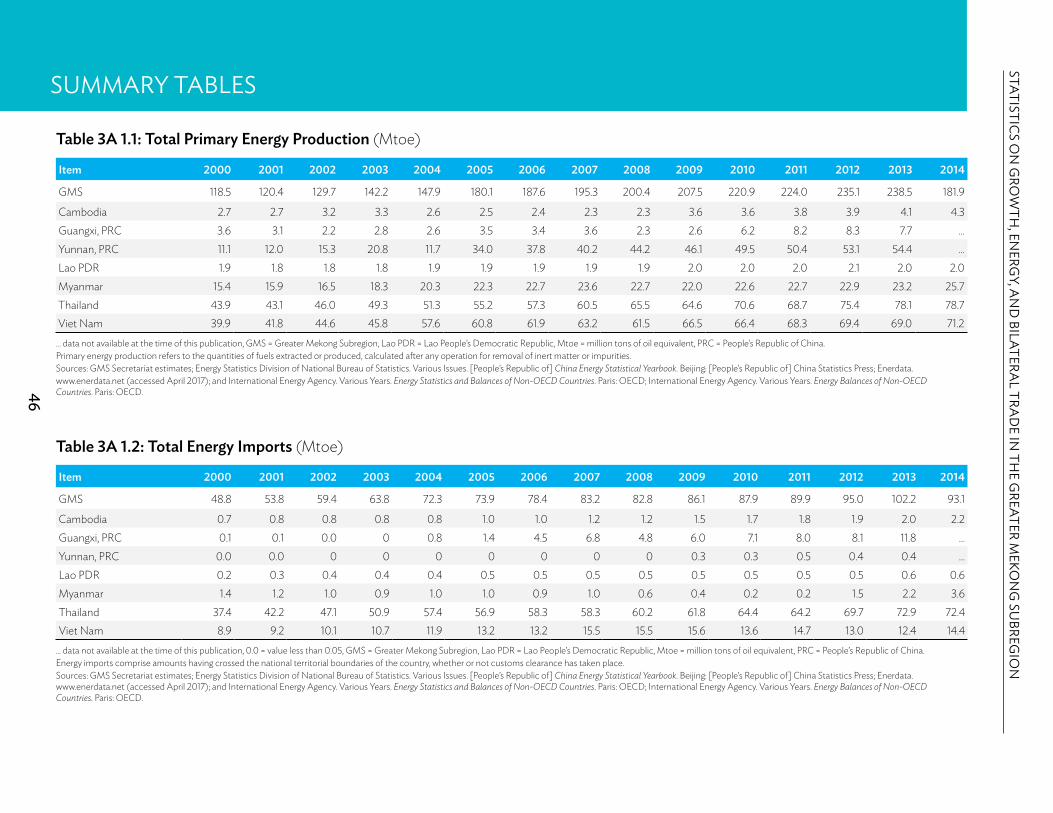
46
STATISTICS ON
GRO
WTH
, ENERG
Y, AN
D BILATERA
L TRAD
E IN TH
E GREATER M
EKON
G SU
BREGIO
N
SUMMARY TABLES
Table 3A 1.1: Total Primary Energy Production (Mtoe)
Item 2000 2001 2002 2003 2004 2005 2006 2007 2008 2009 2010 2011 2012 2013 2014
GMS 118.5 120.4 129.7 142.2 147.9 180.1 187.6 195.3 200.4 207.5 220.9 224.0 235.1 238.5 181.9
Cambodia 2.7 2.7 3.2 3.3 2.6 2.5 2.4 2.3 2.3 3.6 3.6 3.8 3.9 4.1 4.3Guangxi, PRC 3.6 3.1 2.2 2.8 2.6 3.5 3.4 3.6 2.3 2.6 6.2 8.2 8.3 7.7 …Yunnan, PRC 11.1 12.0 15.3 20.8 11.7 34.0 37.8 40.2 44.2 46.1 49.5 50.4 53.1 54.4 …Lao PDR 1.9 1.8 1.8 1.8 1.9 1.9 1.9 1.9 1.9 2.0 2.0 2.0 2.1 2.0 2.0Myanmar 15.4 15.9 16.5 18.3 20.3 22.3 22.7 23.6 22.7 22.0 22.6 22.7 22.9 23.2 25.7Thailand 43.9 43.1 46.0 49.3 51.3 55.2 57.3 60.5 65.5 64.6 70.6 68.7 75.4 78.1 78.7Viet Nam 39.9 41.8 44.6 45.8 57.6 60.8 61.9 63.2 61.5 66.5 66.4 68.3 69.4 69.0 71.2
… data not available at the time of this publication, GMS = Greater Mekong Subregion, Lao PDR = Lao People’s Democratic Republic, Mtoe = million tons of oil equivalent, PRC = People’s Republic of China.Primary energy production refers to the quantities of fuels extracted or produced, calculated after any operation for removal of inert matter or impurities.Sources: GMS Secretariat estimates; Energy Statistics Division of National Bureau of Statistics. Various Issues. [People’s Republic of] China Energy Statistical Yearbook. Beijing: [People’s Republic of] China Statistics Press; Enerdata. www.enerdata.net (accessed April 2017); and International Energy Agency. Various Years. Energy Statistics and Balances of Non-OECD Countries. Paris: OECD; International Energy Agency. Various Years. Energy Balances of Non-OECD Countries. Paris: OECD.
Table 3A 1.2: Total Energy Imports (Mtoe)
Item 2000 2001 2002 2003 2004 2005 2006 2007 2008 2009 2010 2011 2012 2013 2014
GMS 48.8 53.8 59.4 63.8 72.3 73.9 78.4 83.2 82.8 86.1 87.9 89.9 95.0 102.2 93.1
Cambodia 0.7 0.8 0.8 0.8 0.8 1.0 1.0 1.2 1.2 1.5 1.7 1.8 1.9 2.0 2.2Guangxi, PRC 0.1 0.1 0.0 0 0.8 1.4 4.5 6.8 4.8 6.0 7.1 8.0 8.1 11.8 …Yunnan, PRC 0.0 0.0 0 0 0 0 0 0 0 0.3 0.3 0.5 0.4 0.4 …Lao PDR 0.2 0.3 0.4 0.4 0.4 0.5 0.5 0.5 0.5 0.5 0.5 0.5 0.5 0.6 0.6Myanmar 1.4 1.2 1.0 0.9 1.0 1.0 0.9 1.0 0.6 0.4 0.2 0.2 1.5 2.2 3.6Thailand 37.4 42.2 47.1 50.9 57.4 56.9 58.3 58.3 60.2 61.8 64.4 64.2 69.7 72.9 72.4Viet Nam 8.9 9.2 10.1 10.7 11.9 13.2 13.2 15.5 15.5 15.6 13.6 14.7 13.0 12.4 14.4
… data not available at the time of this publication, 0.0 = value less than 0.05, GMS = Greater Mekong Subregion, Lao PDR = Lao People’s Democratic Republic, Mtoe = million tons of oil equivalent, PRC = People’s Republic of China.Energy imports comprise amounts having crossed the national territorial boundaries of the country, whether or not customs clearance has taken place.Sources: GMS Secretariat estimates; Energy Statistics Division of National Bureau of Statistics. Various Issues. [People’s Republic of] China Energy Statistical Yearbook. Beijing: [People’s Republic of] China Statistics Press; Enerdata. www.enerdata.net (accessed April 2017); and International Energy Agency. Various Years. Energy Statistics and Balances of Non-OECD Countries. Paris: OECD; International Energy Agency. Various Years. Energy Balances of Non-OECD Countries. Paris: OECD.
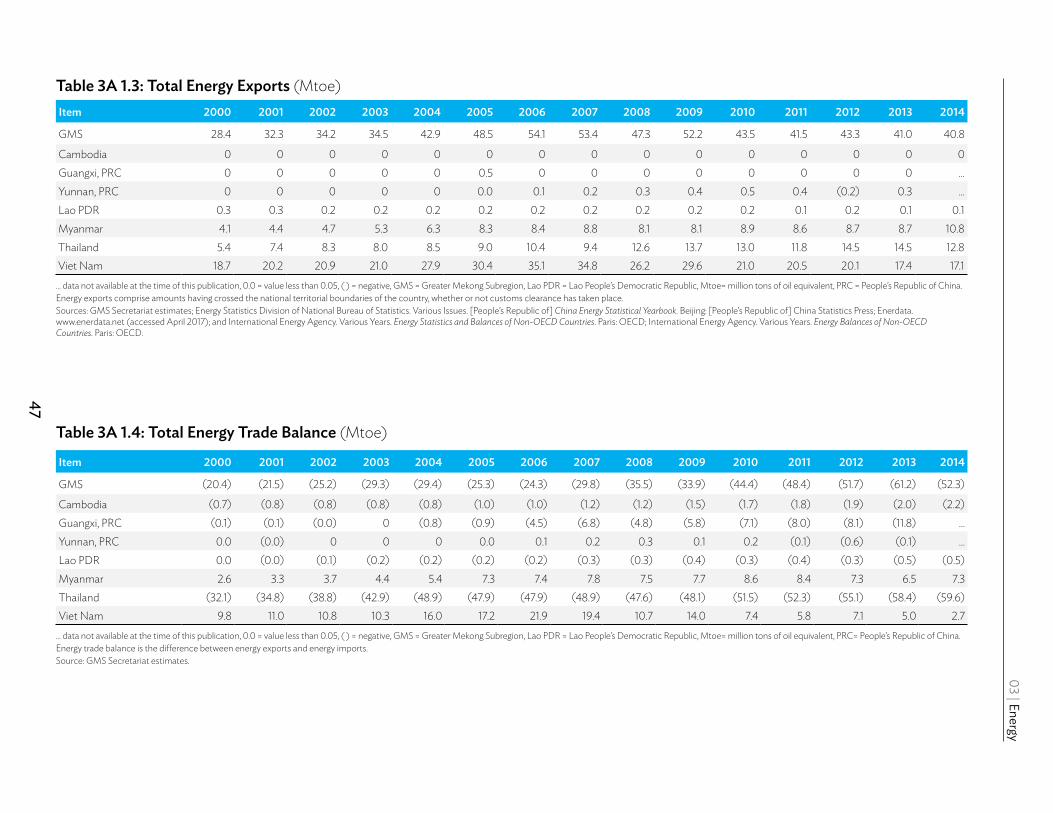
47
03 | Energy
Table 3A 1.3: Total Energy Exports (Mtoe)Item 2000 2001 2002 2003 2004 2005 2006 2007 2008 2009 2010 2011 2012 2013 2014
GMS 28.4 32.3 34.2 34.5 42.9 48.5 54.1 53.4 47.3 52.2 43.5 41.5 43.3 41.0 40.8
Cambodia 0 0 0 0 0 0 0 0 0 0 0 0 0 0 0Guangxi, PRC 0 0 0 0 0 0.5 0 0 0 0 0 0 0 0 …Yunnan, PRC 0 0 0 0 0 0.0 0.1 0.2 0.3 0.4 0.5 0.4 (0.2) 0.3 …Lao PDR 0.3 0.3 0.2 0.2 0.2 0.2 0.2 0.2 0.2 0.2 0.2 0.1 0.2 0.1 0.1Myanmar 4.1 4.4 4.7 5.3 6.3 8.3 8.4 8.8 8.1 8.1 8.9 8.6 8.7 8.7 10.8Thailand 5.4 7.4 8.3 8.0 8.5 9.0 10.4 9.4 12.6 13.7 13.0 11.8 14.5 14.5 12.8Viet Nam 18.7 20.2 20.9 21.0 27.9 30.4 35.1 34.8 26.2 29.6 21.0 20.5 20.1 17.4 17.1
… data not available at the time of this publication, 0.0 = value less than 0.05, ( ) = negative, GMS = Greater Mekong Subregion, Lao PDR = Lao People’s Democratic Republic, Mtoe= million tons of oil equivalent, PRC = People’s Republic of China.Energy exports comprise amounts having crossed the national territorial boundaries of the country, whether or not customs clearance has taken place.Sources: GMS Secretariat estimates; Energy Statistics Division of National Bureau of Statistics. Various Issues. [People’s Republic of] China Energy Statistical Yearbook. Beijing: [People’s Republic of] China Statistics Press; Enerdata. www.enerdata.net (accessed April 2017); and International Energy Agency. Various Years. Energy Statistics and Balances of Non-OECD Countries. Paris: OECD; International Energy Agency. Various Years. Energy Balances of Non-OECD Countries. Paris: OECD.
Table 3A 1.4: Total Energy Trade Balance (Mtoe)
Item 2000 2001 2002 2003 2004 2005 2006 2007 2008 2009 2010 2011 2012 2013 2014
GMS (20.4) (21.5) (25.2) (29.3) (29.4) (25.3) (24.3) (29.8) (35.5) (33.9) (44.4) (48.4) (51.7) (61.2) (52.3)
Cambodia (0.7) (0.8) (0.8) (0.8) (0.8) (1.0) (1.0) (1.2) (1.2) (1.5) (1.7) (1.8) (1.9) (2.0) (2.2)Guangxi, PRC (0.1) (0.1) (0.0) 0 (0.8) (0.9) (4.5) (6.8) (4.8) (5.8) (7.1) (8.0) (8.1) (11.8) …Yunnan, PRC 0.0 (0.0) 0 0 0 0.0 0.1 0.2 0.3 0.1 0.2 (0.1) (0.6) (0.1) …Lao PDR 0.0 (0.0) (0.1) (0.2) (0.2) (0.2) (0.2) (0.3) (0.3) (0.4) (0.3) (0.4) (0.3) (0.5) (0.5)Myanmar 2.6 3.3 3.7 4.4 5.4 7.3 7.4 7.8 7.5 7.7 8.6 8.4 7.3 6.5 7.3 Thailand (32.1) (34.8) (38.8) (42.9) (48.9) (47.9) (47.9) (48.9) (47.6) (48.1) (51.5) (52.3) (55.1) (58.4) (59.6)Viet Nam 9.8 11.0 10.8 10.3 16.0 17.2 21.9 19.4 10.7 14.0 7.4 5.8 7.1 5.0 2.7
… data not available at the time of this publication, 0.0 = value less than 0.05, ( ) = negative, GMS = Greater Mekong Subregion, Lao PDR = Lao People’s Democratic Republic, Mtoe= million tons of oil equivalent, PRC= People’s Republic of China.Energy trade balance is the difference between energy exports and energy imports.Source: GMS Secretariat estimates.

48
STATISTICS ON
GRO
WTH
, ENERG
Y, AN
D BILATERA
L TRAD
E IN TH
E GREATER M
EKON
G SU
BREGIO
N
Table 3A 1.5: Total Primary Energy Supply (Mtoe)
Item 2000 2001 2002 2003 2004 2005 2006 2007 2008 2009 2010 2011 2012 2013 2014
GMS 156.8 163.8 178.6 195.5 209.0 238.2 250.4 268.1 283.3 300.3 308.6 321.6 341.8 348.6 229.6
Cambodia 3.4 3.4 4.0 4.1 3.4 3.4 3.4 3.5 3.5 5.1 5.3 5.5 5.8 6.0 6.4Guangxi, PRC 17.9 18.5 18.8 22.1 31.8 34.5 39.8 44.7 47.4 52.3 49.9 58.3 62.4 60.3 …Yunnan, PRC 19.7 22.4 25.2 29.0 21.5 43.0 46.7 51.3 58.3 65.5 60.2 64.3 69.5 65.8 …Lao PDR 1.9 1.9 2.0 2.0 2.1 2.1 2.1 2.2 2.3 2.3 2.3 2.4 2.4 2.5 2.5Myanmar 12.8 12.5 13.0 14.1 14.8 14.9 15.1 15.7 15.1 14.3 14.0 14.3 15.7 16.6 19.3Thailand 72.3 74.4 82.3 89.1 96.3 99.0 101.0 105.2 108.1 107.7 117.8 117.7 126.2 135.7 134.8Viet Nam 28.7 30.6 33.4 35.1 39.0 41.3 42.3 45.5 48.6 53.1 58.9 59.1 59.8 61.7 66.6
… data not available at the time of this publication, GMS = Greater Mekong Subregion, Lao PDR= Lao People’s Democratic Republic, Mtoe= million tons of oil equivalent, PRC= People’s Republic of China.Total primary energy supply is primary energy production plus imports, less exports, plus adjustments in international marine bunkers (quantities delivered to ships of all flags engaged in international navigation) and international aviation bunkers (deliveries of aviation fuels to aircraft for international aviation), and changes in stocks. For Guangxi and Yunnan, total primary energy supply includes net intra-national transfers. Sources: GMS Secretariat estimates; Energy Statistics Division of National Bureau of Statistics. Various Issues. [People’s Republic of] China Energy Statistical Yearbook. Beijing: [People’s Republic of] China Statistics Press; Enerdata. www.enerdata.net (accessed April 2017); and International Energy Agency. Various Years. Energy Statistics and Balances of Non-OECD Countries. Paris: OECD; International Energy Agency. Various Years. Energy Balances of Non-OECD Countries. Paris: OECD.
Table 3A 1.6: Total Final Energy Consumption (Mtoe)
Item 2000 2001 2002 2003 2004 2005 2006 2007 2008 2009 2010 2011 2012 2013 2014
GMS 122.1 128.2 139.8 155.9 162.1 187.1 193.3 204.9 212.9 232.6 236.9 247.1 263.1 267.5 176.3
Cambodia 3.0 3.0 3.5 3.6 2.9 2.9 2.9 2.9 3.0 4.4 4.6 4.8 5.0 5.2 5.5Guangxi, PRC 15.0 16.0 16.1 20.8 24.9 29.8 32.5 35.7 38.4 43.6 40.9 46.1 49.7 47.9 …Yunnan, PRC 15.1 17.0 19.4 22.7 17.0 34.3 35.6 39.7 41.3 46.6 43.0 46.2 50.3 49.2 …Lao PDR 1.8 1.8 1.9 1.9 2.0 2.1 2.1 2.1 2.2 2.3 2.3 2.3 2.4 2.4 2.4Myanmar 11.5 11.3 11.6 12.4 12.7 13.0 13.0 13.2 12.5 12.7 13.0 13.3 14.5 15.3 17.0Thailand 50.6 52.4 58.7 63.8 69.1 69.9 71.6 72.8 74.3 78.5 84.9 85.7 91.8 95.9 95.9Viet Nam 25.1 26.7 28.6 30.7 33.5 35.1 35.6 38.4 41.2 44.7 48.2 48.7 49.4 51.7 55.5
… data not available at the time of this publication, GMS = Greater Mekong Subregion, Lao PDR= Lao People’s Democratic Republic, Mtoe= million tons of oil equivalent, PRC= People’s Republic of China.Total final consumption is equal to the sum of the consumption in the end-use sectors and reflects for the most part deliveries to consumers.Sources: GMS Secretariat estimates; Energy Statistics Division of National Bureau of Statistics. Various Issues. [People’s Republic of] China Energy Statistical Yearbook. Beijing: [People’s Republic of] China Statistics Press; Enerdata. www.enerdata.net (accessed April 2017); and International Energy Agency. Various Years. Energy Statistics and Balances of Non-OECD Countries. Paris: OECD; International Energy Agency. Various Years. Energy Balances of Non-OECD Countries. Paris: OECD.

49
03 | Energy
Table 3A 1.7: Total Power Generation (TWh)Item 2000 2001 2002 2003 2004 2005 2006 2007 2008 2009 2010 2011 2012 2013 2014
GMS 170.3 181.1 199.0 214.6 220.5 250.8 270.1 297.1 346.1 353.4 395.6 417.6 480.4 529.3 335.6
Cambodia 0.4 0.5 0.7 0.8 0.8 1.0 1.2 1.5 1.5 1.3 1.0 1.1 1.4 1.8 3.1Guangxi, PRC 16.9 17.6 18.6 19.3 17.2 19.6 24.4 32.4 51.3 47.7 47.5 41.5 52.5 49.2 …Yunnan, PRC 21.6 21.6 26.3 28.1 21.6 34.9 35.6 43.1 62.2 62.6 81.8 101.8 126.6 166.9 …Lao PDR 3.7 3.6 3.5 3.2 3.3 3.5 3.6 3.4 3.7 3.4 3.3 3.3 4.7 3.7 3.9Myanmar 5.1 4.7 5.1 5.4 5.6 6.0 6.2 6.4 6.6 7.0 7.5 9.9 10.7 12.2 14.2Thailand 96.0 102.4 109.0 117.0 125.7 132.2 138.7 143.4 147.4 148.4 159.5 156.0 166.8 170.4 173.6Viet Nam 26.6 30.6 35.8 40.9 46.2 53.7 60.5 67.0 73.4 83.2 94.9 104.1 117.6 125.1 140.9
… data not available at the time of this publication, GMS = Greater Mekong Subregion, Lao PDR= Lao People’s Democratic Republic, PRC= People’s Republic of China, TWh= terawatt-hour. Power generation shows the quantity, in watt-hour, generated by power plants. Sources: GMS Secretariat estimates; Energy Statistics Division of National Bureau of Statistics. Various Issues. [People’s Republic of] China Energy Statistical Yearbook. Beijing: [People’s Republic of] China Statistics Press; Enerdata. www.enerdata.net (accessed April 2017); and International Energy Agency. Various Years. Energy Statistics and Balances of Non-OECD Countries. Paris: OECD; International Energy Agency. Various Years. Energy Balances of Non-OECD Countries. Paris: OECD.
Table 3A 1.8: Total Power Imports (TWh)
Item 2000 2001 2002 2003 2004 2005 2006 2007 2008 2009 2010 2011 2012 2013 2014
GMS 2.8 3.1 3.0 2.7 3.7 5.2 6.5 7.7 6.8 9.6 17.0 20.5 18.0 21.4 19.7
Cambodia 0 0 0.0 0.0 0.0 0.0 0.1 0.1 0.3 0.7 1.4 1.6 1.9 2.1 1.8Guangxi, PRC 0 0 0 0 0 0 0 0 0 0 0 0 0 0 …Yunnan, PRC (0.3) 0 0 0 0 0 0 0 0 1.5 1.7 2.5 1.9 1.9 …Lao PDR 0.2 0.2 0.2 0.2 0.3 0.3 0.3 0.5 0.5 0.8 1.0 0.7 1.1 1.2 1.5Myanmar 0 0 0 0 0 0 0 0 0 0 0 0 0 0 0Thailand 3.0 2.9 2.8 2.5 3.4 4.4 5.2 4.5 2.8 2.4 7.3 10.7 10.3 12.6 12.3Viet Nam 0 0 0 0 0 0.4 1.0 2.6 3.2 4.1 5.6 5.0 2.7 3.7 4.1
… data not available at the time of this publication, 0.0 = value less than 0.05, ( ) = negative, GMS = Greater Mekong Subregion, Lao PDR= Lao People’s Democratic Republic, PRC= People’s Republic of China, TWh = terawatt-hour. Power imports are considered imported when they have crossed the national territorial boundaries of the country. Sources: GMS Secretariat estimates; Energy Statistics Division of National Bureau of Statistics. Various Issues. [People’s Republic of] China Energy Statistical Yearbook. Beijing: [People’s Republic of] China Statistics Press; Enerdata. www.enerdata.net (accessed April 2017); and International Energy Agency. Various Years. Energy Statistics and Balances of Non-OECD Countries. Paris: OECD; International Energy Agency. Various Years. Energy Balances of Non-OECD Countries. Paris: OECD.

50
STATISTICS ON
GRO
WTH
, ENERG
Y, AN
D BILATERA
L TRAD
E IN TH
E GREATER M
EKON
G SU
BREGIO
N
Table 3A 1.9: Total Power Exports (TWh)
Item 2000 2001 2002 2003 2004 2005 2006 2007 2008 2009 2010 2011 2012 2013 2014
GMS 3.2 3.2 3.0 2.6 2.9 3.5 4.1 5.8 6.7 8.1 10.0 8.7 3.2 7.5 4.1
Cambodia 0 0 0 0 0 0 0 0 0 0 0 0 0 0 0Guangxi, PRC 0 0 0 0 0 0 0 0 0 0 0 0 0 0 …Yunnan, PRC 0 0 0 0 0 0.3 0.8 2.6 3.2 4.1 5.6 4.6 (2.6) 3.9 …Lao PDR 3.1 3.0 2.7 2.4 2.5 2.6 2.6 2.3 2.4 2.0 1.8 1.4 2.6 1.1 1.0Myanmar 0 0 0 0 0 0 0 0 0 0 0 0 0 0 0Thailand 0.2 0.3 0.3 0.3 0.4 0.6 0.8 0.9 1.2 1.6 1.6 1.6 1.9 1.3 1.6Viet Nam 0 0 0 0 0 0 0 0 0 0.4 1.0 1.1 1.2 1.3 1.5
… data not available at the time of this publication, 0.0 = value less than 0.05, ( ) = negative, GMS = Greater Mekong Subregion, Lao PDR= Lao People’s Democratic Republic, PRC= People’s Republic of China, TWh = terawatt-hour. Power exports are considered exported when they have crossed the national territorial boundaries of the country. Sources: GMS Secretariat estimates; Energy Statistics Division of National Bureau of Statistics. Various Issues. [People’s Republic of] China Energy Statistical Yearbook. Beijing: [People’s Republic of] China Statistics Press; Enerdata. www.enerdata.net (accessed April 2017); and International Energy Agency. Various Years. Energy Statistics and Balances of Non-OECD Countries. Paris: OECD; International Energy Agency. Various Years. Energy Balances of Non-OECD Countries. Paris: OECD.
Table 3A 1.10: Power Trade Balance (TWh)
Item 2000 2001 2002 2003 2004 2005 2006 2007 2008 2009 2010 2011 2012 2013 2014
GMS 0.4 0.2 (0.0) (0.1) (0.8) (1.6) (2.4) (1.9) (0.1) (1.5) (7.0) (11.8) (14.8) (13.8) (15.6)
Cambodia 0 0 (0.0) (0.0) (0.0) (0.0) (0.1) (0.1) (0.3) (0.7) (1.4) (1.6) (1.9) (2.1) (1.8)Guangxi, PRC 0 0 0 0 0 0 0 0 0 0 0 0 0 0 …Yunnan, PRC 0.3 0 0 0 0 0.3 0.8 2.6 3.2 2.6 3.9 2.1 (4.5) 2.0 …Lao PDR 2.9 2.8 2.5 2.1 2.2 2.2 2.3 1.8 1.9 1.2 0.8 0.6 1.5 (0.1) (0.5)Myanmar 0 0 0 0 0 0 0 0 0 0 0 0 0 0 0Thailand (2.8) (2.6) (2.5) (2.2) (3.0) (3.8) (4.4) (3.6) (1.6) (0.9) (5.7) (9.0) (8.4) (11.3) (10.7)Viet Nam 0 0 0 0 0 (0.4) (1.0) (2.6) (3.2) (3.7) (4.6) (3.9) (1.5) (2.3) (2.6)
… data not available at the time of this publication, 0.0 = value less than 0.05, ( ) = negative, GMS = Greater Mekong Subregion, Lao PDR= Lao People’s Democratic Republic, PRC= People’s Republic of China, TWh = terawatt-hour. Power trade balance is the difference between power exports and power imports. Source: GMS Secretariat estimates.
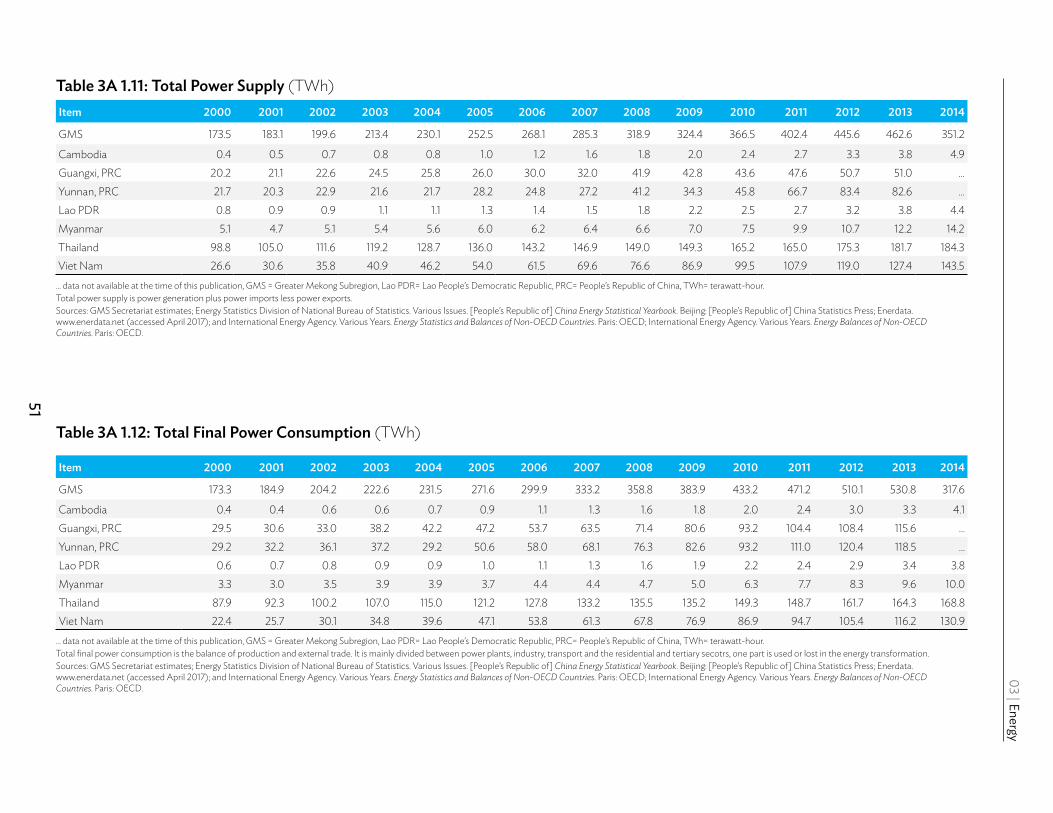
51
03 | Energy
Table 3A 1.11: Total Power Supply (TWh)Item 2000 2001 2002 2003 2004 2005 2006 2007 2008 2009 2010 2011 2012 2013 2014
GMS 173.5 183.1 199.6 213.4 230.1 252.5 268.1 285.3 318.9 324.4 366.5 402.4 445.6 462.6 351.2
Cambodia 0.4 0.5 0.7 0.8 0.8 1.0 1.2 1.6 1.8 2.0 2.4 2.7 3.3 3.8 4.9Guangxi, PRC 20.2 21.1 22.6 24.5 25.8 26.0 30.0 32.0 41.9 42.8 43.6 47.6 50.7 51.0 …Yunnan, PRC 21.7 20.3 22.9 21.6 21.7 28.2 24.8 27.2 41.2 34.3 45.8 66.7 83.4 82.6 …Lao PDR 0.8 0.9 0.9 1.1 1.1 1.3 1.4 1.5 1.8 2.2 2.5 2.7 3.2 3.8 4.4Myanmar 5.1 4.7 5.1 5.4 5.6 6.0 6.2 6.4 6.6 7.0 7.5 9.9 10.7 12.2 14.2Thailand 98.8 105.0 111.6 119.2 128.7 136.0 143.2 146.9 149.0 149.3 165.2 165.0 175.3 181.7 184.3Viet Nam 26.6 30.6 35.8 40.9 46.2 54.0 61.5 69.6 76.6 86.9 99.5 107.9 119.0 127.4 143.5
… data not available at the time of this publication, GMS = Greater Mekong Subregion, Lao PDR= Lao People’s Democratic Republic, PRC= People’s Republic of China, TWh= terawatt-hour. Total power supply is power generation plus power imports less power exports. Sources: GMS Secretariat estimates; Energy Statistics Division of National Bureau of Statistics. Various Issues. [People’s Republic of] China Energy Statistical Yearbook. Beijing: [People’s Republic of] China Statistics Press; Enerdata. www.enerdata.net (accessed April 2017); and International Energy Agency. Various Years. Energy Statistics and Balances of Non-OECD Countries. Paris: OECD; International Energy Agency. Various Years. Energy Balances of Non-OECD Countries. Paris: OECD.
Table 3A 1.12: Total Final Power Consumption (TWh)
Item 2000 2001 2002 2003 2004 2005 2006 2007 2008 2009 2010 2011 2012 2013 2014
GMS 173.3 184.9 204.2 222.6 231.5 271.6 299.9 333.2 358.8 383.9 433.2 471.2 510.1 530.8 317.6
Cambodia 0.4 0.4 0.6 0.6 0.7 0.9 1.1 1.3 1.6 1.8 2.0 2.4 3.0 3.3 4.1Guangxi, PRC 29.5 30.6 33.0 38.2 42.2 47.2 53.7 63.5 71.4 80.6 93.2 104.4 108.4 115.6 …Yunnan, PRC 29.2 32.2 36.1 37.2 29.2 50.6 58.0 68.1 76.3 82.6 93.2 111.0 120.4 118.5 …Lao PDR 0.6 0.7 0.8 0.9 0.9 1.0 1.1 1.3 1.6 1.9 2.2 2.4 2.9 3.4 3.8Myanmar 3.3 3.0 3.5 3.9 3.9 3.7 4.4 4.4 4.7 5.0 6.3 7.7 8.3 9.6 10.0Thailand 87.9 92.3 100.2 107.0 115.0 121.2 127.8 133.2 135.5 135.2 149.3 148.7 161.7 164.3 168.8Viet Nam 22.4 25.7 30.1 34.8 39.6 47.1 53.8 61.3 67.8 76.9 86.9 94.7 105.4 116.2 130.9
… data not available at the time of this publication, GMS = Greater Mekong Subregion, Lao PDR= Lao People’s Democratic Republic, PRC= People’s Republic of China, TWh= terawatt-hour. Total final power consumption is the balance of production and external trade. It is mainly divided between power plants, industry, transport and the residential and tertiary secotrs, one part is used or lost in the energy transformation.Sources: GMS Secretariat estimates; Energy Statistics Division of National Bureau of Statistics. Various Issues. [People’s Republic of] China Energy Statistical Yearbook. Beijing: [People’s Republic of] China Statistics Press; Enerdata. www.enerdata.net (accessed April 2017); and International Energy Agency. Various Years. Energy Statistics and Balances of Non-OECD Countries. Paris: OECD; International Energy Agency. Various Years. Energy Balances of Non-OECD Countries. Paris: OECD.

52
STATISTICS ON
GRO
WTH
, ENERG
Y, AN
D BILATERA
L TRAD
E IN TH
E GREATER M
EKON
G SU
BREGIO
N
GMS = Greater Mekong Subregion, Mtoe = million tons of oil equivalent, TWh = terawatt-hour.Sources: GMS Secretariat estimates; Energy Statistics Division of National Bureau of Statistics. Various Issues. [People’s Republic of] China Energy Statistical Yearbook. Beijing: [People’s Republic of] China Statistics Press; Enerdata. www.enerdata.net (accessed April 2017); and International Energy Agency. Various Years. Energy Statistics and Balances of Non-OECD Countries. Paris: OECD; International Energy Agency. Various Years. Energy Balances of Non-OECD Countries. Paris: OECD.
Mtoe = million tons of oil equivalent, TWh = terawatt-hour.Sources: GMS Secretariat estimates; International Energy Agency. Various Years. Energy Statistics and Balances of Non-OECD Countries. Paris: OECD; and International Energy Agency. Various Years. Energy Balances of Non-OECD Countries. Paris: OECD.
Figure 3A 1.1: Energy Sector—GMS
Figure 3A 1.2: Energy Sector—Cambodia
Mto
e600
400
500
0
100
200
300
-100
TWh
600
400
500
0
100
200
300
-1002000 2001 2002 2003 2004 2005 2006 2007 2008 2009 2010 2011 2012 2013
Total Power Supply (TWh)
Total Primary Energy Supply (Mtoe)
Total Final Power Consumption (TWh)
Total Final Energy Consumption (Mtoe)
Total Power Trade Balance (TWh)
Total Energy Trade Balance (Mtoe)
122
-20 -22 -25 -29 -29 -25 -24 -30 -36 -34 -44 -48 -52 -61
128 140 156 162 187
238
193
250209196179164 205 213
283268
233
300
237
309
247
322
263
342
268
349
157
Mto
e
8
4
6
-2
0
2
-4
TWh
8
4
6
-2
0
2
-42000 2001 2002 2003 2004 2005 2006 2007 2008 2009 2010 2011 2012 20142013
Total Power Supply (TWh)
Total Primary Energy Supply (Mtoe)
Total Final Power Consumption (TWh)
Total Final Energy Consumption (Mtoe)
Total Power Trade Balance (TWh)
Total Energy Trade Balance (Mtoe)
3.0 3.03.5 3.6
2.9 2.9
3.4
2.9
3.43.44.14.0
3.4
2.9 3.0
3.53.5 4.4
5.1
4.6
5.3
4.8
5.5
5.0
5.8
5.2 5.5
6.0 6.4
3.4
-0.8 -0.8 -0.8 -0.8 -1.0 -1.0 -1.2 -1.2 -1.5 -1.7 -1.8 -1.9 -2.0 -2.2
-0.7

53
03 | Energy
Mtoe = million tons of oil equivalent, PRC = People’s Republic of China, TWh = terawatt-hour.Sources: GMS Secretariat estimates and Energy Statistics Division of National Bureau of Statistics. Various Issues. [People’s Republic of] China Energy Statistical Yearbook. Beijing: [People’s Republic of] China Statistics Press.
Mtoe = million tons of oil equivalent, PRC = People’s Republic of China, TWh = terawatt-hour.Sources: GMS Secretariat estimates and Energy Statistics Division of National Bureau of Statistics. Various Issues. [People’s Republic of] China Energy Statistical Yearbook. Beijing: [People’s Republic of] China Statistics Press.
Figure 3A 1.3: Energy Sector—Guangxi, PRC
Figure 3A 1.4: Energy Sector—Yunnan, PRC
Mto
e120
60
90
0
30
-30
TWh
120
60
90
0
30
-302000 2001 2002 2003 2004 2005 2006 2007 2008 2009 2010 2011 2012 2013
Total Power Supply (TWh)
Total Primary Energy Supply (Mtoe)
Total Final Power Consumption (TWh)
Total Final Energy Consumption (Mtoe)
Total Power Trade Balance (TWh)
Total Energy Trade Balance (Mtoe)
-0.8 -0.9 -4.5 -6.8 -4.8 -5.8 -7.1 -8.0 -8.1 -11.8
22.120.8
31.8
24.918.816.1
18.516.0
39.8
32.534.5
29.8
44.7
35.7
47.4
38.4
52.3
43.6
49.9
40.9
58.3
46.1
62.4
49.7
60.3
47.9
17.915.0
Mto
e
120
150
60
90
0
30
-30
TWh
120
150
60
90
0
30
-302000 2001 2002 2003 2004 2005 2006 2007 2008 2009 2010 2011 2012 2013
Total Power Supply (TWh)
Total Primary Energy Supply (Mtoe)
Total Final Power Consumption (TWh)
Total Final Energy Consumption (Mtoe)
Total Power Trade Balance (TWh)
Total Energy Trade Balance (Mtoe)
29.0 21.525.222.4
46.743.051.3 58.3 65.5 60.2 64.3 69.5 65.8
19.722.7 17.019.417.0
34.3 39.735.6 41.3 46.6 43.0 46.2 50.3 49.2
15.1

54
STATISTICS ON
GRO
WTH
, ENERG
Y, AN
D BILATERA
L TRAD
E IN TH
E GREATER M
EKON
G SU
BREGIO
N
Lao PDR = Lao People’s Democratic Republic, Mtoe = million tons of oil equivalent, TWh = terawatt-hour.Sources: GMS Secretariat estimates and Enerdata. www.enerdata.net (accessed April 2017).
Mtoe = million tons of oil equivalent, TWh = terawatt-hour.Sources: GMS Secretariat estimates; International Energy Agency. Various Years. Energy Statistics and Balances of Non-OECD Countries. Paris: OECD, and International Energy Agency. Various Years. Energy Balances of Non-OECD Countries. Paris: OECD.
Figure 3A 1.5: Energy Sector—Lao PDR
Figure 3A 1.6: Energy Sector—Myanmar
Mto
e
4.0
5.0
2.0
3.0
0.0
1.0
-1.0
TWh
4.0
5.0
2.0
3.0
0.0
1.0
-1.02000 2001 2002 2003 2004 2005 2006 2007 2008 2009 2010 2011 2012 2013 2014
Total Power Supply (TWh)
Total Primary Energy Supply (Mtoe)
Total Final Power Consumption (TWh)
Total Final Energy Consumption (Mtoe)
Total Power Trade Balance (TWh)
Total Energy Trade Balance (Mtoe)
2.0 2.12.01.9 2.12.1 2.2 2.3 2.3 2.3 2.4 2.4 2.5 2.51.9
1.9 2.01.91.82.12.1 2.1 2.2 2.3 2.3 2.42.3 2.4 2.4
1.8
-0.2 -0.2-0.1 -0.2-0.2 -0.3 -0.3 -0.4 -0.3 -0.3-0.4 -0.5 -0.5
Mto
e
20.0
25.0
10.0
15.0
0.0
5.0
-5.0
TWh
20.0
25.0
10.0
15.0
0.0
5.0
-5.02000 2001 2002 2003 2004 2005 2006 2007 2008 2009 2010 2011 2012 2013 2014
Total Power Supply (TWh)
Total Primary Energy Supply (Mtoe)
Total Final Power Consumption (TWh)
Total Final Energy Consumption (Mtoe)
Total Power Trade Balance (TWh)
Total Energy Trade Balance (Mtoe)
14.1 14.813.012.5
15.114.9 15.7 15.1 14.3 14.0 14.315.7 16.6
19.3
12.812.4 12.711.611.3
13.013.0 13.2 12.5 12.7 13.0 13.3 14.5 15.317.0
11.5
4.45.4
3.73.3
7.47.3 7.8 7.5 7.7 8.6 8.4 7.3 6.5 7.3
2.6

55
03 | Energy
Mtoe = million tons of oil equivalent, TWh = terawatt-hour.Sources: GMS Secretariat estimates; International Energy Agency. Various Years. Energy Statistics and Balances of Non-OECD Countries. Paris: OECD, and International Energy Agency. Various Years. Energy Balances of Non-OECD Countries. Paris: OECD.
Mtoe = million tons of oil equivalent, TWh = terawatt-hour.Sources: GMS Secretariat estimates; International Energy Agency. Various Years. Energy Statistics and Balances of Non-OECD Countries. Paris: OECD, and International Energy Agency. Various Years. Energy Balances of Non-OECD Countries. Paris: OECD.
Figure 3A 1.7: Energy Sector—Thailand
Figure 3A 1.8: Energy Sector—Viet Nam
Mto
e
150
200
50
100
-50
0
-100
TWh
150
200
50
100
-50
0
-1002000 2001 2002 2003 2004 2005 2006 2007 2008 2009 2010 2011 2012 2013 2014
Total Power Supply (TWh)
Total Primary Energy Supply (Mtoe)
Total Final Power Consumption (TWh)
Total Final Energy Consumption (Mtoe)
Total Power Trade Balance (TWh)
Total Energy Trade Balance (Mtoe)
-43 -49-39-35 -48-48 -49 -48 -48 -52 -52 -55 -58 -60-32
89 968274
10199 105 108 108 118 118 126 136 135
72
64 6959527270 73 74 78 85 86 92 96 96
51
Mto
e
140120
160
6080
100
20
-200
40
TWh
140120
160
6080
100
200
40
-202000 2001 2002 2003 2004 2005 2006 2007 2008 2009 2010 2011 2012 2013 2014
Total Power Supply (TWh)
Total Primary Energy Supply (Mtoe)
Total Final Power Consumption (TWh)
Total Final Energy Consumption (Mtoe)
Total Power Trade Balance (TWh)
Total Energy Trade Balance (Mtoe)
31 3429273635 38 41 45 48 49 49 52 56
2510 161111 2217 19 11 14 7 6 7 5 310
35 3933314241 46 49 53 59 59 60 62 67
29

56
STATISTICS ON
GRO
WTH
, ENERG
Y, AN
D BILATERA
L TRAD
E IN TH
E GREATER M
EKON
G SU
BREGIO
N
ENERGY INDICATORS
Table 3B 1.1: Total Primary Energy Supply per Capita (toe/person)
Item 2000 2001 2002 2003 2004 2005 2006 2007 2008 2009 2010 2011 2012 2013
GMS 0.53 0.55 0.59 0.64 0.68 0.77 0.80 0.85 0.89 0.94 0.95 0.99 1.05 1.05Cambodia 0.28 0.28 0.31 0.32 0.26 0.26 0.25 0.25 0.25 0.36 0.37 0.38 0.39 0.40Guangxi, PRC 0.38 0.39 0.39 0.46 0.65 0.70 0.80 0.89 0.94 1.03 0.97 1.12 1.19 1.14Yunnan, PRC 0.46 0.52 0.58 0.66 0.49 0.97 1.04 1.14 1.28 1.43 1.31 1.39 1.56 1.40Lao PDR 0.35 0.34 0.36 0.35 0.37 0.37 0.37 0.37 0.37 0.38 0.37 0.38 0.38 0.38Myanmar 0.27 0.26 0.27 0.29 0.30 0.30 0.30 0.31 0.30 0.28 0.27 0.27 0.30 0.31Thailand 1.15 1.17 1.28 1.37 1.47 1.50 1.53 1.59 1.63 1.62 1.77 1.76 1.88 2.01Viet Nam 0.37 0.39 0.42 0.44 0.48 0.50 0.51 0.54 0.57 0.62 0.68 0.67 0.67 0.69
GMS = Greater Mekong Subregion, Lao PDR= Lao People’s Democratic Republic, PRC= People’s Republic of China, toe = ton of oil equivalent.Total primary energy supply per capita is total primary energy supply as a ratio of total population. Source: GMS Secretariat estimates.
Table 3B 1.2: Total Final Energy Consumption per Capita (toe/person)
Item 2000 2001 2002 2003 2004 2005 2006 2007 2008 2009 2010 2011 2012 2013
GMS 0.41 0.43 0.46 0.51 0.53 0.60 0.62 0.65 0.67 0.72 0.73 0.76 0.80 0.81
Cambodia 0.24 0.24 0.27 0.28 0.22 0.22 0.21 0.21 0.21 0.31 0.32 0.33 0.34 0.35Guangxi, PRC 0.32 0.33 0.33 0.43 0.51 0.61 0.65 0.71 0.76 0.86 0.79 0.89 0.95 0.91Yunnan, PRC 0.36 0.40 0.45 0.52 0.38 0.77 0.79 0.88 0.91 1.02 0.94 1.00 1.13 1.05Lao PDR 0.34 0.33 0.35 0.34 0.36 0.36 0.36 0.36 0.36 0.37 0.36 0.37 0.36 0.37Myanmar 0.24 0.24 0.24 0.25 0.26 0.26 0.26 0.26 0.25 0.25 0.25 0.26 0.28 0.29Thailand 0.81 0.83 0.92 0.98 1.06 1.06 1.08 1.10 1.12 1.18 1.27 1.28 1.37 1.42Viet Nam 0.32 0.34 0.36 0.38 0.41 0.43 0.43 0.46 0.48 0.52 0.55 0.55 0.56 0.58
GMS = Greater Mekong Subregion, Lao PDR= Lao People’s Democratic Republic, PRC= People’s Republic of China, toe = ton of oil equivalent.Total final energy consumption per capita is total final energy consumption as a ratio of total population. Source: GMS Secretariat estimates.

57
03 | Energy
Figure 3B 1.1: GMS Total Primary Energy Supply and Total Final Energy Consumption per Capita (toe/person)
GMS = Greater Mekong Subregion, toe = ton of oil equivalent.Source: GMS Secretariat estimates.
toe
per p
erso
n
1.00
1.25
0.25
0.50
0.75
0.00
Total Final Energy Consumption Per CapitaTotal Primary Energy Supply Per Capita
2000 2001 2002 2003 2004 2005 2006 2007 2008 2009 2010 2011 2012 2013
0.53 0.55 0.590.64 0.68
0.530.60
0.77 0.80
0.62
0.85
0.65
0.89
0.67
0.94
0.72
0.95
0.73
0.99
0.76
1.05
0.80
1.05
0.81
0.510.460.430.41

58
STATISTICS ON
GRO
WTH
, ENERG
Y, AN
D BILATERA
L TRAD
E IN TH
E GREATER M
EKON
G SU
BREGIO
N
Table 3B 1.3: Total Primary Energy Supply/GDP (toe/2005 PPP international dollar, million)
Item 2000 2001 2002 2003 2004 2005 2006 2007 2008 2009 2010 2011 2012 2013
GMS 227 226 230 234 231 246 240 239 239 244 230 226 223 215
Cambodia 265 246 269 255 191 171 154 141 133 193 190 186 181 174Guangxi, PRC 254 244 225 243 308 298 300 296 281 280 232 239 236 210Yunnan, PRC 289 315 330 352 232 428 420 415 426 441 371 348 332 280Lao PDR 258 244 246 230 230 219 203 193 183 177 164 154 145 138Myanmar 478 419 387 369 343 303 272 252 220 188 168 163 166 162Thailand 197 196 204 206 210 207 201 199 201 202 205 203 203 213Viet Nam 207 208 213 209 216 213 204 205 207 214 224 211 203 199
GDP = gross domestic product, GMS = Greater Mekong Subregion, Lao PDR= Lao People’s Democratic Republic, PPP = purchasing power parity, PRC= People’s Republic of China, toe = ton of oil equivalent. Total primary energy supply/GDP is total primary energy supply as a ratio of GDP in 2005 PPP international dollar.Source: GMS Secretariat estimates.
Table 3B 1.4: Total Primary Energy Consumption/GDP (toe/2005 PPP international dollar, million)
Item 2000 2001 2002 2003 2004 2005 2006 2007 2008 2009 2010 2011 2012 2013
GMS 177 177 180 187 179 194 186 182 180 189 177 174 172 165
Cambodia 229 213 233 220 161 143 128 119 113 166 164 160 157 152Guangxi, PRC 213 211 193 229 241 258 245 237 228 234 190 189 188 167Yunnan, PRC 222 239 254 275 183 341 320 321 302 314 265 250 240 209Lao PDR 251 238 240 224 224 213 197 188 178 172 159 150 141 133Myanmar 427 379 345 326 293 265 233 212 182 167 156 152 153 149Thailand 138 138 146 148 151 146 143 138 138 147 148 148 148 150Viet Nam 181 181 182 183 185 181 172 173 175 180 183 174 168 166
GDP = gross domestic product, GMS = Greater Mekong Subregion, Lao PDR= Lao People’s Democratic Republic, PPP = purchasing power parity, PRC= People’s Republic of China, toe = ton of oil equivalent. Total primary energy consumption/GDP is total primary energy consumption as a ratio of GDP in 2005 PPP international dollar.Source: GMS Secretariat estimates.

59
03 | Energy
Figure 3B 1.2: GMS Total Primary Energy Supply/GDP and Total Final Energy Consumption/GDP (toe/2005 PPP international dollar, million)
GDP = gross domestic product, GMS = Greater Mekong Subregion, PPP = purchasing power parity, toe = ton of oil equivalent.Source: GMS Secretariat estimates.
toe
/200
5 PP
P in
tern
atio
nal d
olla
r, m
illion
250
300
50
100
200
150
0
Total Final Energy Consumption/GDPTotal Primary Energy Supply/GDP
2000 2001 2002 2003 2004 2005 2006 2007 2008 2009 2010 2011 2012 2013
227 226
177 177
230
180
234
187
231
179
246
194
240
186
239
182
239
180
244
189
230
177
226
174
223
172
215
165

60
STATISTICS ON
GRO
WTH
, ENERG
Y, AN
D BILATERA
L TRAD
E IN TH
E GREATER M
EKON
G SU
BREGIO
N
Table 3B 1.5: Total Primary Energy Supply/GDP (toe/2005 $, million)
Item 2000 2001 2002 2003 2004 2005 2006 2007 2008 2009 2010 2011 2012 2013
GMS 609 607 619 630 621 664 648 643 644 658 620 609 599 576
Cambodia 847 788 861 817 610 546 492 453 426 619 610 596 579 556Guangxi, PRC 603 581 535 578 731 709 713 704 669 666 552 569 560 499Yunnan, PRC 686 748 783 836 551 1,017 997 987 1,013 1,049 881 827 790 665Lao PDR 919 872 877 822 821 781 723 689 653 632 583 551 518 491Myanmar 1,962 1,722 1,589 1,514 1,406 1,243 1,115 1,033 903 774 691 669 681 666Thailand 498 495 516 521 530 523 508 502 507 509 518 513 513 537Viet Nam 696 699 717 705 727 716 686 689 697 721 753 710 684 669
GDP = gross domestic product, GMS = Greater Mekong Subregion, Lao PDR= Lao People’s Democratic Republic, PRC= People’s Republic of China, toe = ton of oil equivalent. Total primary energy supply/GDP is total primary energy supply as a ratio of GDP at 2005 market prices dollar.Source: GMS Secretariat estimates.
Table 3B 1.6: Total Primary Energy Consumption/GDP (toe/2005 $, million)
Item 2000 2001 2002 2003 2004 2005 2006 2007 2008 2009 2010 2011 2012 2013
GMS 474 475 485 502 482 521 500 491 484 510 476 468 461 442
Cambodia 734 682 745 705 516 456 410 382 363 533 525 513 503 486Guangxi, PRC 506 501 459 545 573 613 583 563 542 555 452 450 447 396Yunnan, PRC 527 569 603 655 434 811 761 763 718 746 630 594 571 498Lao PDR 896 849 855 800 799 760 703 670 635 615 567 535 503 475Myanmar 1,754 1,557 1,417 1,338 1,204 1,088 956 869 747 684 640 622 630 613Thailand 348 349 368 373 381 369 360 348 349 371 373 374 373 380Viet Nam 608 609 614 616 624 610 578 581 590 607 616 586 564 560
GDP = gross domestic product, GMS = Greater Mekong Subregion, Lao PDR= Lao People’s Democratic Republic, PRC= People’s Republic of China, toe = ton of oil equivalent. Total primary energy consumption/GDP is total primary energy consumption as a ratio of GDP at 2005 market prices dollar.Source: GMS Secretariat estimates.

61
03 | Energy
Figure 3B 1.3: GMS Total Primary Energy Supply/GDP and Total Final Energy Consumption/GDP (toe/2005 $, million)
GDP = gross domestic product, GMS = Greater Mekong Subregion, toe = ton of oil equivalent.Source: GMS Secretariat estimates.
toe/
2005
$, m
illion
800
200
400
600
0
Total Final Energy Consumption/GDPTotal Primary Energy Supply/GDP
2000 2001 2002 2003 2004 2005 2006 2007 2008 2009 2010 2011 2012 2013
609
474
607
475
619
485
630
502
621
482
664
521
648
500
643
491
644
484
658
510
620
476
609
468
599
461
576
442

62
STATISTICS ON
GRO
WTH
, ENERG
Y, AN
D BILATERA
L TRAD
E IN TH
E GREATER M
EKON
G SU
BREGIO
N
Table 3B 1.7: Electricity Consumption per Capita (kWh/person)
Item 2000 2001 2002 2003 2004 2005 2006 2007 2008 2009 2010 2011 2012 2013
GMS 587 619 676 729 751 873 956 1,054 1,127 1,197 1,339 1,445 1,560 1,601
Cambodia 31 35 48 50 54 64 78 96 112 126 142 162 205 219Guangxi, PRC 621 639 684 787 864 958 1,082 1,270 1,414 1,582 1,806 2,008 2,068 2,188Yunnan, PRC 688 751 833 851 660 1,136 1,294 1,510 1,679 1,807 2,026 2,396 2,695 2,528Lao PDR 120 131 139 158 160 176 191 219 261 309 356 377 444 514Myanmar 69 61 72 78 79 73 87 88 92 97 122 148 157 181Thailand 1,403 1,455 1,562 1,650 1,759 1,841 1,931 2,007 2,038 2,032 2,239 2,223 2,408 2,436Viet Nam 289 327 378 433 486 572 646 728 797 894 1,000 1,078 1,187 1,294
GMS = Greater Mekong Subregion, kWh= kilowatt-hour, Lao PDR= Lao People’s Democratic Republic, PRC= People’s Republic of China.Electricity consumption per capita is total final electricity consumption as a ratio of total population. Source: GMS Secretariat estimates.
GMS = Greater Mekong Subregion, kWh= kilowatt-hour, Lao PDR= Lao People’s Democratic Republic, PRC= People’s Republic of China.Source: GMS Secretariat estimates.
Figure 3B 1.4: GMS Electricity Consumption per Capita (kWh/person)
kWh
per p
erso
n
1,750
1,500
1,250
1,000
250
500
750
02000
587 619 676 729 751873
9561,054
1,1271,197
1,3391,445
1,560 1,601
2001 2002 2003 2004 2005 2006 2007 2008 2009 2010 2011 2012 2013

63
03 | Energy
Table 3B 1.8A: Oil Import Dependency Ratio by Total Imports (%)
Item 2000 2001 2002 2003 2004 2005 2006 2007 2008 2009 2010 2011 2012 2013
GMS 93.7 93.3 88.8 85.6 90.1 84.4 83.2 79.5 83.0 79.4 69.6 67.3 68.7 69.7
Cambodia 102.0 101.9 101.3 101.7 102.1 101.8 101.9 103.5 103.0 102.1 102.4 102.8 103.3 103.9 Guangxi, PRC 4.2 4.1 0.5 0 0 0.4 0.6 0 3.6 3.5 0 0 8.3 12.3Yunnan, PRC 0 0.1 0 0 0 0 0 0 0 0 0 0.4 0.4 0.6Lao PDR 100.0 100.0 100.0 100.0 100.0 100.0 100.0 100.0 100.0 100.0 100.0 100.0 100.0 100.0 Myanmar 73.3 71.6 53.3 47.6 49.7 56.8 55.5 55.1 40.8 34.2 18.6 20.6 66.9 78.5 Thailand 103.1 108.1 103.4 99.4 103.5 100.2 100.0 95.4 102.9 102.2 99.6 92.9 96.9 92.6 Viet Nam 113.8 108.2 105.1 104.5 101.4 106.5 108.7 109.1 110.8 93.9 67.0 78.0 72.8 66.4
GMS = Greater Mekong Subregion, Lao PDR= Lao People’s Democratic Republic, PRC = People’s Republic of China.Oil import dependency ratio by total imports is the ratio of total oil imports and total supply of oil estimated by the equation (M/TS) x 100 where M is total imports and TS is total supply of oil and oil products.Oil import dependency attempts to measure the proportion of domestic consumption that cannot be met by domestic production and may be indicated by using either total imports or net imports. Source: GMS Secretariat estimates.
Table 3B 1.8B: Oil Import Dependency Ratio by Net Imports (%)
Item 2000 2001 2002 2003 2004 2005 2006 2007 2008 2009 2010 2011 2012 2013
GMS 80.2 76.5 68.7 66.1 71.6 61.6 57.3 48.7 45.5 43.7 36.8 36.1 40.5 42.8
Cambodia 102.0 101.9 101.3 101.7 102.1 101.8 101.9 103.5 103.0 102.1 102.4 102.8 103.3 103.9 Guangxi, PRC 4.2 4.1 0.5 0 0 0.4 0.6 0 3.6 6.3 0 0 8.3 12.3Yunnan, PRC 0 0.1 0 0 0 0 0 0 0.2 0.1 0.3 0.5 0.4 0.6Lao PDR 100.0 100.0 100.0 100.0 100.0 100.0 100.0 100.0 100.0 100.0 100.0 100.0 100.0 100.0 Myanmar 68.5 61.4 38.1 46.1 49.7 38.1 48.9 46.4 38.0 30.9 18.6 20.6 60.4 73.3 Thailand 86.3 84.5 80.6 79.5 84.3 79.6 76.1 73.8 72.5 70.4 71.2 68.3 68.2 66.4 Viet Nam 101.8 100.7 76.7 65.7 69.1 51.9 42.9 11.7 3.1 4.9 14.8 15.7 2.5 4.4
GMS = Greater Mekong Subregion, Lao PDR = Lao People’s Democratic Republic, PRC = People’s Republic of China.Oil import dependency ratio by net imports is the ratio of the absolute value of net imports and total supply of oil estimated by this equation: |M-X|/TS x 100 where M and X are imports and exports of oil and oil products, respectively and TS is total supply of oil and oil products. Oil import dependency attempts to measure the proportion of domestic consumption that cannot be met by domestic production and may be indicated by using either total imports or net imports. Source: GMS Secretariat estimates.

64
STATISTICS ON
GRO
WTH
, ENERG
Y, AN
D BILATERA
L TRAD
E IN TH
E GREATER M
EKON
G SU
BREGIO
N
GMS = Greater Mekong Subregion.Source: GMS Secretariat estimates.
Figure 3B 1.5: GMS Comparative Oil Dependency Ratios (%)
Perc
ent
80
20
40
60
100
02000 2001 2002 2003 2004 2005 2006 2007 2008 2009 2010 2011 2012 2013
80.2
93.3
76.5
88.8
68.7
85.6
66.1
90.1
71.6
84.4
61.6
83.2
57.3
79.5
48.7
83.0
45.5
79.4
43.7
69.6
36.8
67.3
36.1
68.7
40.5
69.7
42.8
Oil Import Dependency Ratio by Total ImportsOil Import Dependency Ratio by Net Imports
93.7
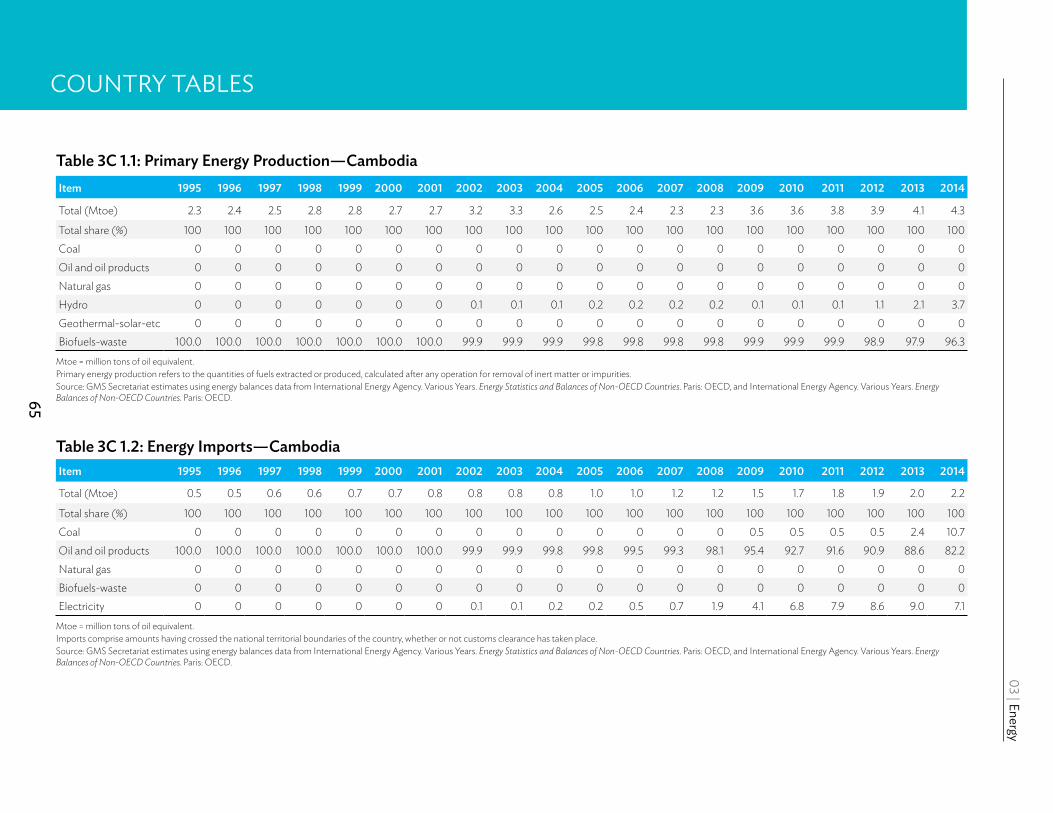
65
03 | Energy
COUNTRY TABLES
Table 3C 1.1: Primary Energy Production—Cambodia Item 1995 1996 1997 1998 1999 2000 2001 2002 2003 2004 2005 2006 2007 2008 2009 2010 2011 2012 2013 2014
Total (Mtoe) 2.3 2.4 2.5 2.8 2.8 2.7 2.7 3.2 3.3 2.6 2.5 2.4 2.3 2.3 3.6 3.6 3.8 3.9 4.1 4.3
Total share (%) 100 100 100 100 100 100 100 100 100 100 100 100 100 100 100 100 100 100 100 100Coal 0 0 0 0 0 0 0 0 0 0 0 0 0 0 0 0 0 0 0 0Oil and oil products 0 0 0 0 0 0 0 0 0 0 0 0 0 0 0 0 0 0 0 0Natural gas 0 0 0 0 0 0 0 0 0 0 0 0 0 0 0 0 0 0 0 0Hydro 0 0 0 0 0 0 0 0.1 0.1 0.1 0.2 0.2 0.2 0.2 0.1 0.1 0.1 1.1 2.1 3.7Geothermal-solar-etc 0 0 0 0 0 0 0 0 0 0 0 0 0 0 0 0 0 0 0 0Biofuels-waste 100.0 100.0 100.0 100.0 100.0 100.0 100.0 99.9 99.9 99.9 99.8 99.8 99.8 99.8 99.9 99.9 99.9 98.9 97.9 96.3
Mtoe = million tons of oil equivalent. Primary energy production refers to the quantities of fuels extracted or produced, calculated after any operation for removal of inert matter or impurities. Source: GMS Secretariat estimates using energy balances data from International Energy Agency. Various Years. Energy Statistics and Balances of Non-OECD Countries. Paris: OECD, and International Energy Agency. Various Years. Energy Balances of Non-OECD Countries. Paris: OECD.
Table 3C 1.2: Energy Imports—Cambodia Item 1995 1996 1997 1998 1999 2000 2001 2002 2003 2004 2005 2006 2007 2008 2009 2010 2011 2012 2013 2014
Total (Mtoe) 0.5 0.5 0.6 0.6 0.7 0.7 0.8 0.8 0.8 0.8 1.0 1.0 1.2 1.2 1.5 1.7 1.8 1.9 2.0 2.2
Total share (%) 100 100 100 100 100 100 100 100 100 100 100 100 100 100 100 100 100 100 100 100Coal 0 0 0 0 0 0 0 0 0 0 0 0 0 0 0.5 0.5 0.5 0.5 2.4 10.7Oil and oil products 100.0 100.0 100.0 100.0 100.0 100.0 100.0 99.9 99.9 99.8 99.8 99.5 99.3 98.1 95.4 92.7 91.6 90.9 88.6 82.2Natural gas 0 0 0 0 0 0 0 0 0 0 0 0 0 0 0 0 0 0 0 0Biofuels-waste 0 0 0 0 0 0 0 0 0 0 0 0 0 0 0 0 0 0 0 0Electricity 0 0 0 0 0 0 0 0.1 0.1 0.2 0.2 0.5 0.7 1.9 4.1 6.8 7.9 8.6 9.0 7.1
Mtoe = million tons of oil equivalent. Imports comprise amounts having crossed the national territorial boundaries of the country, whether or not customs clearance has taken place.Source: GMS Secretariat estimates using energy balances data from International Energy Agency. Various Years. Energy Statistics and Balances of Non-OECD Countries. Paris: OECD, and International Energy Agency. Various Years. Energy Balances of Non-OECD Countries. Paris: OECD.
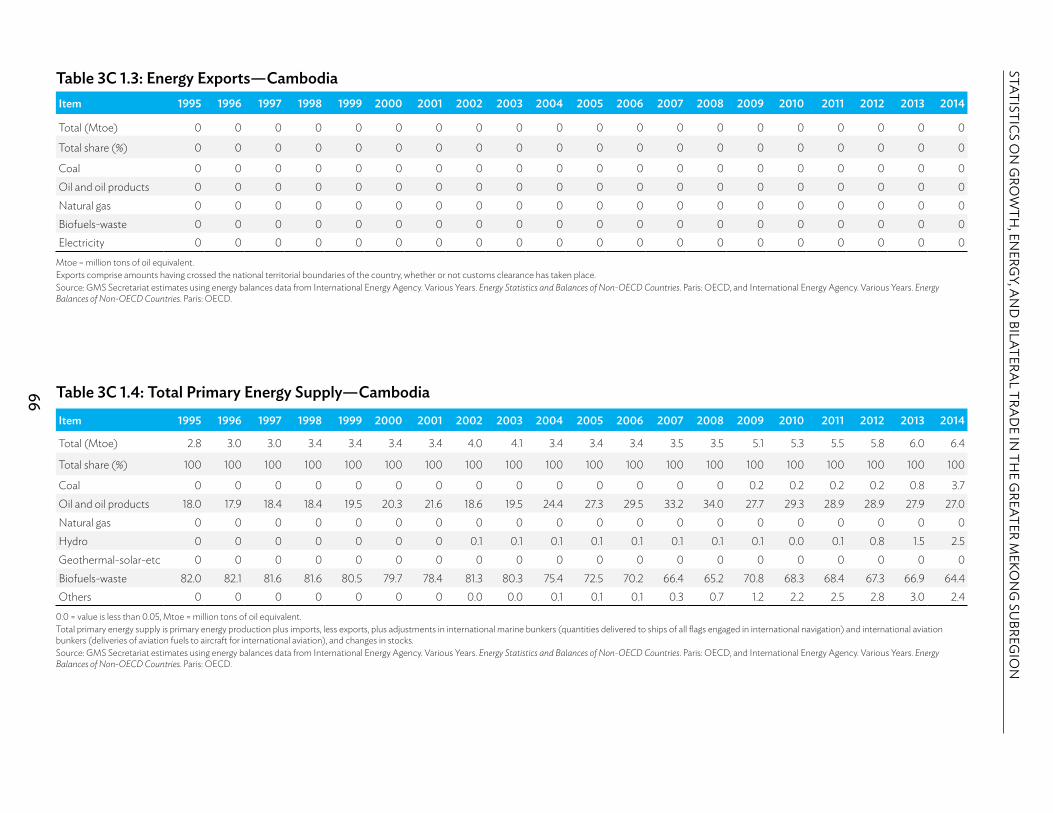
66
STATISTICS ON
GRO
WTH
, ENERG
Y, AN
D BILATERA
L TRAD
E IN TH
E GREATER M
EKON
G SU
BREGIO
N
Table 3C 1.4: Total Primary Energy Supply—Cambodia Item 1995 1996 1997 1998 1999 2000 2001 2002 2003 2004 2005 2006 2007 2008 2009 2010 2011 2012 2013 2014
Total (Mtoe) 2.8 3.0 3.0 3.4 3.4 3.4 3.4 4.0 4.1 3.4 3.4 3.4 3.5 3.5 5.1 5.3 5.5 5.8 6.0 6.4
Total share (%) 100 100 100 100 100 100 100 100 100 100 100 100 100 100 100 100 100 100 100 100
Coal 0 0 0 0 0 0 0 0 0 0 0 0 0 0 0.2 0.2 0.2 0.2 0.8 3.7Oil and oil products 18.0 17.9 18.4 18.4 19.5 20.3 21.6 18.6 19.5 24.4 27.3 29.5 33.2 34.0 27.7 29.3 28.9 28.9 27.9 27.0Natural gas 0 0 0 0 0 0 0 0 0 0 0 0 0 0 0 0 0 0 0 0Hydro 0 0 0 0 0 0 0 0.1 0.1 0.1 0.1 0.1 0.1 0.1 0.1 0.0 0.1 0.8 1.5 2.5Geothermal-solar-etc 0 0 0 0 0 0 0 0 0 0 0 0 0 0 0 0 0 0 0 0Biofuels-waste 82.0 82.1 81.6 81.6 80.5 79.7 78.4 81.3 80.3 75.4 72.5 70.2 66.4 65.2 70.8 68.3 68.4 67.3 66.9 64.4Others 0 0 0 0 0 0 0 0.0 0.0 0.1 0.1 0.1 0.3 0.7 1.2 2.2 2.5 2.8 3.0 2.4
0.0 = value is less than 0.05, Mtoe = million tons of oil equivalent. Total primary energy supply is primary energy production plus imports, less exports, plus adjustments in international marine bunkers (quantities delivered to ships of all flags engaged in international navigation) and international aviation bunkers (deliveries of aviation fuels to aircraft for international aviation), and changes in stocks. Source: GMS Secretariat estimates using energy balances data from International Energy Agency. Various Years. Energy Statistics and Balances of Non-OECD Countries. Paris: OECD, and International Energy Agency. Various Years. Energy Balances of Non-OECD Countries. Paris: OECD.
Table 3C 1.3: Energy Exports—CambodiaItem 1995 1996 1997 1998 1999 2000 2001 2002 2003 2004 2005 2006 2007 2008 2009 2010 2011 2012 2013 2014
Total (Mtoe) 0 0 0 0 0 0 0 0 0 0 0 0 0 0 0 0 0 0 0 0
Total share (%) 0 0 0 0 0 0 0 0 0 0 0 0 0 0 0 0 0 0 0 0
Coal 0 0 0 0 0 0 0 0 0 0 0 0 0 0 0 0 0 0 0 0Oil and oil products 0 0 0 0 0 0 0 0 0 0 0 0 0 0 0 0 0 0 0 0Natural gas 0 0 0 0 0 0 0 0 0 0 0 0 0 0 0 0 0 0 0 0Biofuels-waste 0 0 0 0 0 0 0 0 0 0 0 0 0 0 0 0 0 0 0 0Electricity 0 0 0 0 0 0 0 0 0 0 0 0 0 0 0 0 0 0 0 0
Mtoe = million tons of oil equivalent. Exports comprise amounts having crossed the national territorial boundaries of the country, whether or not customs clearance has taken place.Source: GMS Secretariat estimates using energy balances data from International Energy Agency. Various Years. Energy Statistics and Balances of Non-OECD Countries. Paris: OECD, and International Energy Agency. Various Years. Energy Balances of Non-OECD Countries. Paris: OECD.

67
03 | Energy
Figure 3C 1.1: Primary Energy Supply—Cambodia
Source: GMS Secretariat estimates using energy balances data from International Energy Agency. Various Years. Energy Statistics and Balances of Non-OECD Countries. Paris: OECD, and International Energy Agency. Various Years. Energy Balances of Non-OECD Countries. Paris: OECD.
Perc
ent 60
80
100
20
0
40
200019991998199719961995 2001 2002 2003 2004 2005 2006 2007 2008 2009 2010 2011 2012 2013 2014
Biofuels—waste Hydro Oil and Oil Products
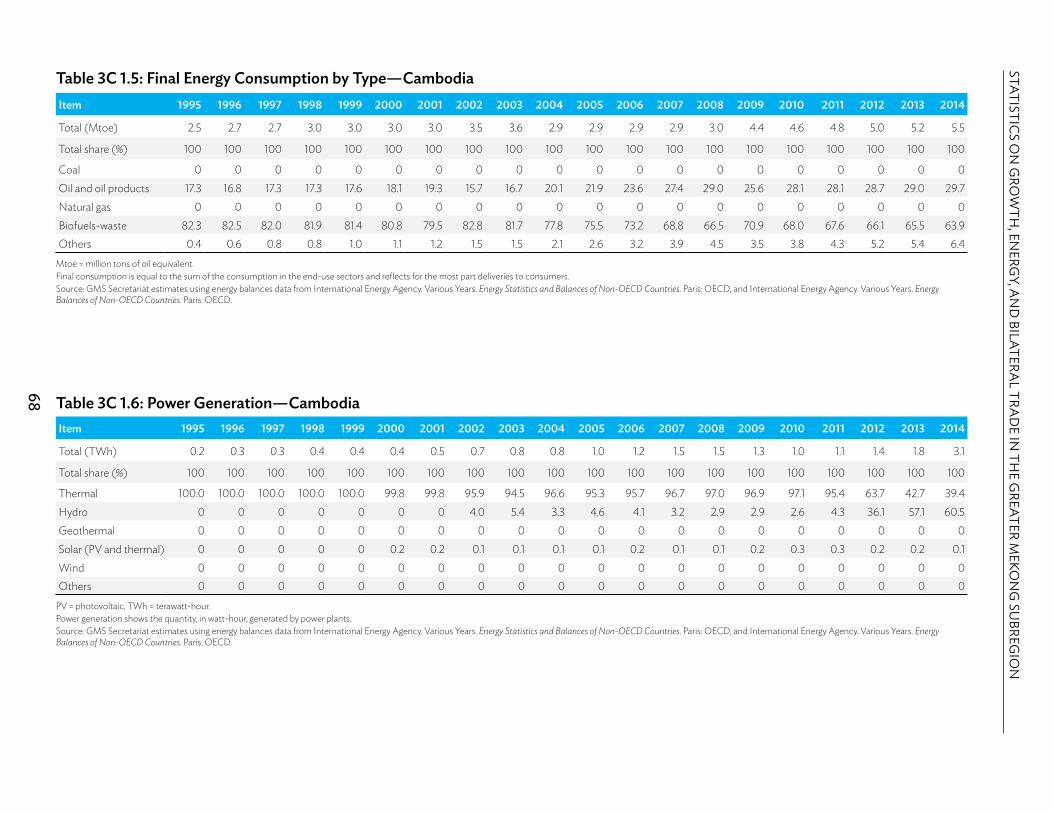
68
STATISTICS ON
GRO
WTH
, ENERG
Y, AN
D BILATERA
L TRAD
E IN TH
E GREATER M
EKON
G SU
BREGIO
N
Table 3C 1.6: Power Generation—Cambodia Item 1995 1996 1997 1998 1999 2000 2001 2002 2003 2004 2005 2006 2007 2008 2009 2010 2011 2012 2013 2014
Total (TWh) 0.2 0.3 0.3 0.4 0.4 0.4 0.5 0.7 0.8 0.8 1.0 1.2 1.5 1.5 1.3 1.0 1.1 1.4 1.8 3.1
Total share (%) 100 100 100 100 100 100 100 100 100 100 100 100 100 100 100 100 100 100 100 100
Thermal 100.0 100.0 100.0 100.0 100.0 99.8 99.8 95.9 94.5 96.6 95.3 95.7 96.7 97.0 96.9 97.1 95.4 63.7 42.7 39.4Hydro 0 0 0 0 0 0 0 4.0 5.4 3.3 4.6 4.1 3.2 2.9 2.9 2.6 4.3 36.1 57.1 60.5Geothermal 0 0 0 0 0 0 0 0 0 0 0 0 0 0 0 0 0 0 0 0Solar (PV and thermal) 0 0 0 0 0 0.2 0.2 0.1 0.1 0.1 0.1 0.2 0.1 0.1 0.2 0.3 0.3 0.2 0.2 0.1Wind 0 0 0 0 0 0 0 0 0 0 0 0 0 0 0 0 0 0 0 0Others 0 0 0 0 0 0 0 0 0 0 0 0 0 0 0 0 0 0 0 0
PV = photovoltaic, TWh = terawatt-hour. Power generation shows the quantity, in watt-hour, generated by power plants.Source: GMS Secretariat estimates using energy balances data from International Energy Agency. Various Years. Energy Statistics and Balances of Non-OECD Countries. Paris: OECD, and International Energy Agency. Various Years. Energy Balances of Non-OECD Countries. Paris: OECD.
Table 3C 1.5: Final Energy Consumption by Type—Cambodia Item 1995 1996 1997 1998 1999 2000 2001 2002 2003 2004 2005 2006 2007 2008 2009 2010 2011 2012 2013 2014
Total (Mtoe) 2.5 2.7 2.7 3.0 3.0 3.0 3.0 3.5 3.6 2.9 2.9 2.9 2.9 3.0 4.4 4.6 4.8 5.0 5.2 5.5
Total share (%) 100 100 100 100 100 100 100 100 100 100 100 100 100 100 100 100 100 100 100 100
Coal 0 0 0 0 0 0 0 0 0 0 0 0 0 0 0 0 0 0 0 0Oil and oil products 17.3 16.8 17.3 17.3 17.6 18.1 19.3 15.7 16.7 20.1 21.9 23.6 27.4 29.0 25.6 28.1 28.1 28.7 29.0 29.7Natural gas 0 0 0 0 0 0 0 0 0 0 0 0 0 0 0 0 0 0 0 0Biofuels-waste 82.3 82.5 82.0 81.9 81.4 80.8 79.5 82.8 81.7 77.8 75.5 73.2 68.8 66.5 70.9 68.0 67.6 66.1 65.5 63.9Others 0.4 0.6 0.8 0.8 1.0 1.1 1.2 1.5 1.5 2.1 2.6 3.2 3.9 4.5 3.5 3.8 4.3 5.2 5.4 6.4
Mtoe = million tons of oil equivalent. Final consumption is equal to the sum of the consumption in the end-use sectors and reflects for the most part deliveries to consumers.Source: GMS Secretariat estimates using energy balances data from International Energy Agency. Various Years. Energy Statistics and Balances of Non-OECD Countries. Paris: OECD, and International Energy Agency. Various Years. Energy Balances of Non-OECD Countries. Paris: OECD.

69
03 | Energy
Figure 3C 1.2: Power Generation—Cambodia
Source: GMS Secretariat estimates using energy balances data from International Energy Agency. Various Years. Energy Statistics and Balances of Non-OECD Countries. Paris: OECD, and International Energy Agency. Various Years. Energy Balances of Non-OECD Countries. Paris: OECD.
Perc
ent 75
100
125
25
0
50
200019991998199719961995 2001 2002 2003 2004 2005 2006 2007 2008 2009 2010 2011 2012 2013 2014Hydro Thermal
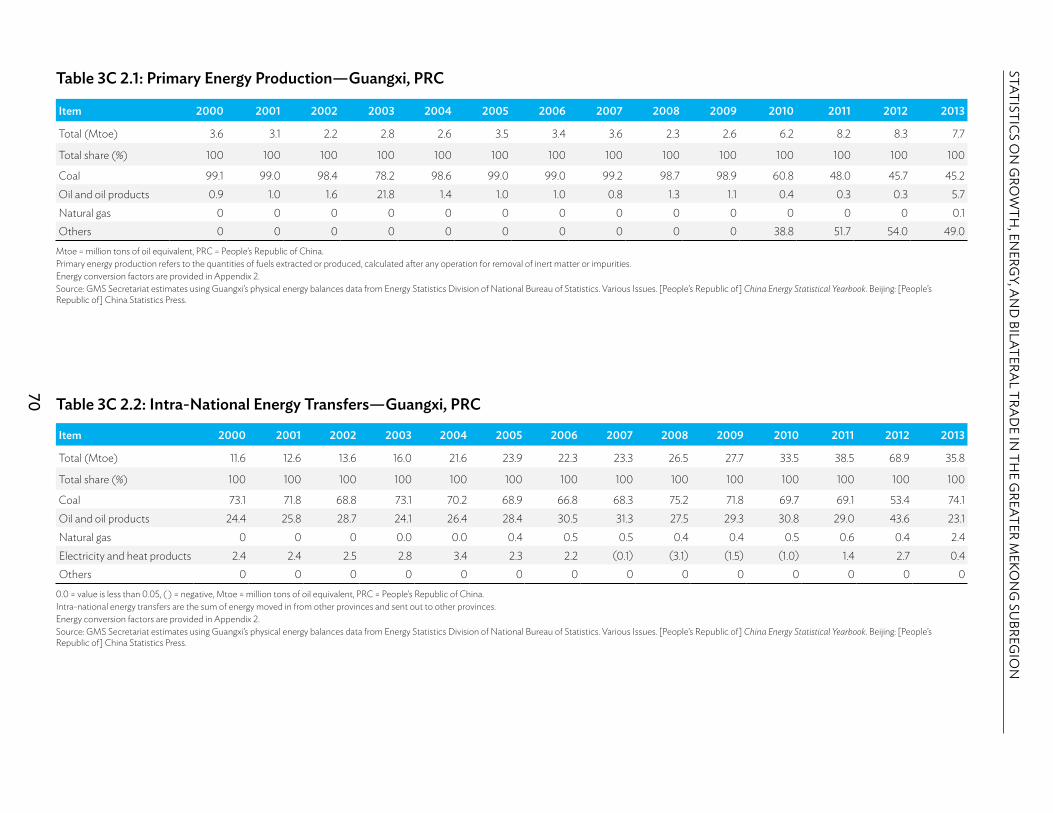
70
STATISTICS ON
GRO
WTH
, ENERG
Y, AN
D BILATERA
L TRAD
E IN TH
E GREATER M
EKON
G SU
BREGIO
N
Table 3C 2.1: Primary Energy Production—Guangxi, PRC
Item 2000 2001 2002 2003 2004 2005 2006 2007 2008 2009 2010 2011 2012 2013
Total (Mtoe) 3.6 3.1 2.2 2.8 2.6 3.5 3.4 3.6 2.3 2.6 6.2 8.2 8.3 7.7
Total share (%) 100 100 100 100 100 100 100 100 100 100 100 100 100 100
Coal 99.1 99.0 98.4 78.2 98.6 99.0 99.0 99.2 98.7 98.9 60.8 48.0 45.7 45.2Oil and oil products 0.9 1.0 1.6 21.8 1.4 1.0 1.0 0.8 1.3 1.1 0.4 0.3 0.3 5.7Natural gas 0 0 0 0 0 0 0 0 0 0 0 0 0 0.1Others 0 0 0 0 0 0 0 0 0 0 38.8 51.7 54.0 49.0
Mtoe = million tons of oil equivalent, PRC = People’s Republic of China.Primary energy production refers to the quantities of fuels extracted or produced, calculated after any operation for removal of inert matter or impurities.Energy conversion factors are provided in Appendix 2. Source: GMS Secretariat estimates using Guangxi’s physical energy balances data from Energy Statistics Division of National Bureau of Statistics. Various Issues. [People’s Republic of] China Energy Statistical Yearbook. Beijing: [People’s Republic of] China Statistics Press.
Table 3C 2.2: Intra-National Energy Transfers—Guangxi, PRC
Item 2000 2001 2002 2003 2004 2005 2006 2007 2008 2009 2010 2011 2012 2013
Total (Mtoe) 11.6 12.6 13.6 16.0 21.6 23.9 22.3 23.3 26.5 27.7 33.5 38.5 68.9 35.8
Total share (%) 100 100 100 100 100 100 100 100 100 100 100 100 100 100
Coal 73.1 71.8 68.8 73.1 70.2 68.9 66.8 68.3 75.2 71.8 69.7 69.1 53.4 74.1 Oil and oil products 24.4 25.8 28.7 24.1 26.4 28.4 30.5 31.3 27.5 29.3 30.8 29.0 43.6 23.1 Natural gas 0 0 0 0.0 0.0 0.4 0.5 0.5 0.4 0.4 0.5 0.6 0.4 2.4 Electricity and heat products 2.4 2.4 2.5 2.8 3.4 2.3 2.2 (0.1) (3.1) (1.5) (1.0) 1.4 2.7 0.4 Others 0 0 0 0 0 0 0 0 0 0 0 0 0 0
0.0 = value is less than 0.05, ( ) = negative, Mtoe = million tons of oil equivalent, PRC = People’s Republic of China.Intra-national energy transfers are the sum of energy moved in from other provinces and sent out to other provinces. Energy conversion factors are provided in Appendix 2. Source: GMS Secretariat estimates using Guangxi’s physical energy balances data from Energy Statistics Division of National Bureau of Statistics. Various Issues. [People’s Republic of] China Energy Statistical Yearbook. Beijing: [People’s Republic of] China Statistics Press.

71
03 | Energy
Table 3C 2.3: Energy Imports—Guangxi, PRC
Item 2000 2001 2002 2003 2004 2005 2006 2007 2008 2009 2010 2011 2012 2013
Total (Mtoe) 0.1 0.1 0.0 0 0.8 1.4 4.5 6.8 4.8 6.0 7.1 8.0 8.1 11.8
Total share (%) 100 100 100 0 100 100 100 100 100 100 100 100 100 100
Coal 0.0 0.0 0.0 0 100.0 97.9 99.1 100.0 94.3 95.2 100.0 100.0 86.3 88.8Oil and oil products 100.0 100.0 100.0 0 0.0 2.1 0.9 0.0 5.7 4.8 0.0 0.0 13.7 11.2Natural gas 0 0 0 0 0 0 0 0 0 0 0 0 0 0Electricity and heat products 0 0 0 0 0 0 0 0 0 0 0 0 0 0Others 0 0 0 0 0 0 0 0 0 0 0 0 0 0
0.0 = value is less than 0.05, ( ) = negative, Mtoe = million tons of oil equivalent, PRC = People’s Republic of China.Imports comprise amounts having crossed the national territorial boundaries of the country, whether or not customs clearance has taken place.Energy conversion factors are provided in Appendix 2. Source: GMS Secretariat estimates using Guangxi’s physical energy balances data from Energy Statistics Division of National Bureau of Statistics. Various Issues. [People’s Republic of] China Energy Statistical Yearbook. Beijing: [People’s Republic of] China Statistics Press.
Table 3C 2.4: Energy Exports—Guangxi, PRC
Item 2000 2001 2002 2003 2004 2005 2006 2007 2008 2009 2010 2011 2012 2013
Total (Mtoe) 0 0 (0.0) 0.0 0.0 (0.5) 0 0 0 (0.2) 0 0 0 0
Total share (%) 0 0 100 0 0 100 0 0 0 100 0 0 0 0
Coal 0 0 100 0 0 100 0 0 0 0 0 0 0 0Oil and oil products 0 0 0 0 0 0 0 0 0 100 0 0 0 0Natural gas 0 0 0 0 0 0 0 0 0 0 0 0 0 0Electricity and heat products 0 0 0 0 0 0 0 0 0 0 0 0 0 0Others 0 0 0 0 0 0 0 0 0 0 0 0 0 0
( ) = negative, Mtoe = million tons of oil equivalent, PRC = People’s Republic of China.Exports comprise amounts having crossed the national territorial boundaries of the country, whether or not customs clearance has taken place.Energy conversion factors are provided in Appendix 2. Source: GMS Secretariat estimates using Guangxi’s physical energy balances data from Energy Statistics Division of National Bureau of Statistics. Various Issues. [People’s Republic of] China Energy Statistical Yearbook. Beijing: [People’s Republic of] China Statistics Press.

72
STATISTICS ON
GRO
WTH
, ENERG
Y, AN
D BILATERA
L TRAD
E IN TH
E GREATER M
EKON
G SU
BREGIO
N
Table 3C 2.5: Total Primary Energy Supply—Guangxi, PRC
Item 2000 2001 2002 2003 2004 2005 2006 2007 2008 2009 2010 2011 2012 2013
Total (Mtoe) 17.9 18.5 18.8 22.1 31.8 34.5 39.8 44.7 47.4 52.3 49.9 58.3 62.4 60.3
Total share (%) 100 100 100 100 100 100 100 100 100 100 100 100 100 100
Coal 68.9 65.9 61.2 62.5 70.3 71.5 71.5 71.8 70.6 72.2 67.4 65.5 63.5 67.3Oil and oil products 15.7 18.5 21.4 20.5 17.2 18.7 17.2 16.7 15.9 15.6 19.6 19.5 21.5 17.8Natural gas 0 0 0 0 0.0 0.3 0.3 0.3 0.2 0.2 0.3 0.4 0.4 0.7Electricity and heat products 9.7 9.8 10.4 9.5 7.0 6.8 6.8 6.5 7.8 7.3 7.8 7.4 7.4 7.9Others 5.7 5.8 7.0 7.5 5.6 2.7 4.2 4.7 5.5 4.7 4.8 7.2 7.2 6.3
0.0 = value is less than 0.05, Mtoe = million tons of oil equivalent, PRC = People’s Republic of China.Total primary energy supply is primary energy production plus imports, less exports, plus adjustments in international marine bunkers (quantities delivered to ships of all flags engaged in international navigation) and international aviation bunkers (deliveries of aviation fuels to aircraft for international aviation), and changes in stocks. For Guangxi, total supply includes net intra-national transfers.Energy conversion factors are provided in Appendix 2. Source: GMS Secretariat estimates using Guangxi’s physical energy balances data from Energy Statistics Division of National Bureau of Statistics. Various Issues. [People’s Republic of] China Energy Statistical Yearbook. Beijing: [People’s Republic of] China Statistics Press.
Table 3C 2.6: Total Final Energy Consumption by Type—Guangxi, PRC
Item 2000 2001 2002 2003 2004 2005 2006 2007 2008 2009 2010 2011 2012 2013
Total (Mtoe) 15.0 16.0 16.1 20.8 24.9 29.8 32.5 35.7 38.4 43.6 40.9 46.1 49.7 47.9
Total share (%) 100 100 100 100 100 100 100 100 100 100 100 100 100 100
Coal 57.3 54.9 49.1 56.1 56.3 63.9 62.8 58.3 58.0 61.3 51.3 49.9 50.0 50.2 Oil and oil products 18.2 21.0 24.3 19.7 21.5 20.7 20.4 20.1 18.6 17.8 21.5 21.0 21.4 18.9 Natural gas 0 0 0 0 0.0 0.3 0.3 0.4 0.2 0.3 0.2 0.5 0.6 0.8Electricity and heat products 17.7 17.3 18.4 16.3 15.0 15.1 15.4 17.1 18.2 16.8 22.5 22.4 21.9 24.2 Others 6.8 6.7 8.2 8.0 7.1 0 1.0 4.1 5.0 3.9 4.3 6.3 6.1 5.9
0.0 = value is less than 0.05, Mtoe = million tons of oil equivalent, PRC = People’s Republic of China.Final consumption is equal to the sum of the consumption in the end-use sectors and reflects for the most part deliveries to consumers.Energy conversion factors are provided in Appendix 2. Source: GMS Secretariat estimates using Guangxi’s physical energy balances data from Energy Statistics Division of National Bureau of Statistics. Various Issues. [People’s Republic of] China Energy Statistical Yearbook. Beijing: [People’s Republic of] China Statistics Press.

73
03 | Energy
Figure 3C 1.3: Primary Energy Supply—Guangxi, PRC
PRC = People’s Republic of China.Source: GMS Secretariat estimates using Guangxi’s physical energy balances data from Energy Statistics Division of National Bureau of Statistics. Various Issues. [People’s Republic of] China Energy Statistical Yearbook. Beijing: [People’s Republic of] China Statistics Press.
Perc
ent
60
80
20
0
40
2000 2001 2002 2003 2004 2005 2006 2007 2008 2009 2010 2011 2012 2013
Oil and oil products OthersCoal Electricity and heat products
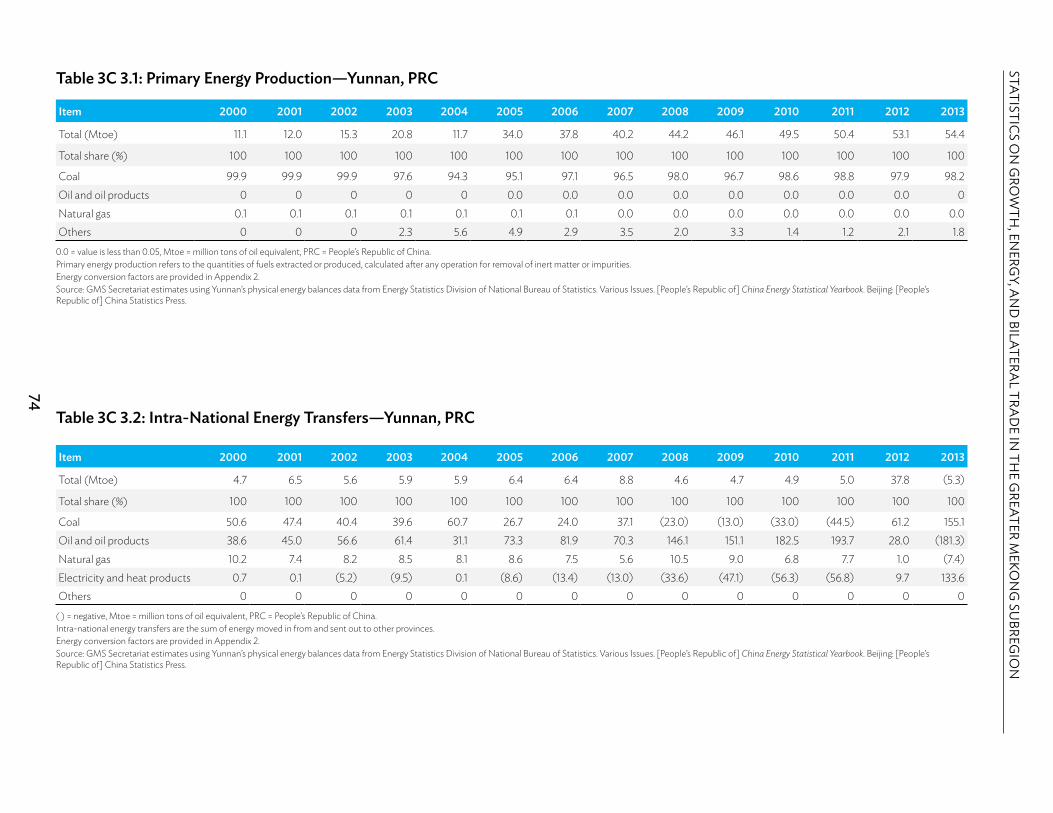
74
STATISTICS ON
GRO
WTH
, ENERG
Y, AN
D BILATERA
L TRAD
E IN TH
E GREATER M
EKON
G SU
BREGIO
N
Table 3C 3.1: Primary Energy Production—Yunnan, PRC
Item 2000 2001 2002 2003 2004 2005 2006 2007 2008 2009 2010 2011 2012 2013
Total (Mtoe) 11.1 12.0 15.3 20.8 11.7 34.0 37.8 40.2 44.2 46.1 49.5 50.4 53.1 54.4
Total share (%) 100 100 100 100 100 100 100 100 100 100 100 100 100 100
Coal 99.9 99.9 99.9 97.6 94.3 95.1 97.1 96.5 98.0 96.7 98.6 98.8 97.9 98.2Oil and oil products 0 0 0 0 0 0.0 0.0 0.0 0.0 0.0 0.0 0.0 0.0 0Natural gas 0.1 0.1 0.1 0.1 0.1 0.1 0.1 0.0 0.0 0.0 0.0 0.0 0.0 0.0Others 0 0 0 2.3 5.6 4.9 2.9 3.5 2.0 3.3 1.4 1.2 2.1 1.8
0.0 = value is less than 0.05, Mtoe = million tons of oil equivalent, PRC = People’s Republic of China.Primary energy production refers to the quantities of fuels extracted or produced, calculated after any operation for removal of inert matter or impurities.Energy conversion factors are provided in Appendix 2. Source: GMS Secretariat estimates using Yunnan’s physical energy balances data from Energy Statistics Division of National Bureau of Statistics. Various Issues. [People’s Republic of] China Energy Statistical Yearbook. Beijing: [People’s Republic of] China Statistics Press.
Table 3C 3.2: Intra-National Energy Transfers—Yunnan, PRC
Item 2000 2001 2002 2003 2004 2005 2006 2007 2008 2009 2010 2011 2012 2013
Total (Mtoe) 4.7 6.5 5.6 5.9 5.9 6.4 6.4 8.8 4.6 4.7 4.9 5.0 37.8 (5.3)
Total share (%) 100 100 100 100 100 100 100 100 100 100 100 100 100 100
Coal 50.6 47.4 40.4 39.6 60.7 26.7 24.0 37.1 (23.0) (13.0) (33.0) (44.5) 61.2 155.1 Oil and oil products 38.6 45.0 56.6 61.4 31.1 73.3 81.9 70.3 146.1 151.1 182.5 193.7 28.0 (181.3)Natural gas 10.2 7.4 8.2 8.5 8.1 8.6 7.5 5.6 10.5 9.0 6.8 7.7 1.0 (7.4)Electricity and heat products 0.7 0.1 (5.2) (9.5) 0.1 (8.6) (13.4) (13.0) (33.6) (47.1) (56.3) (56.8) 9.7 133.6 Others 0 0 0 0 0 0 0 0 0 0 0 0 0 0
( ) = negative, Mtoe = million tons of oil equivalent, PRC = People’s Republic of China.Intra-national energy transfers are the sum of energy moved in from and sent out to other provinces. Energy conversion factors are provided in Appendix 2. Source: GMS Secretariat estimates using Yunnan’s physical energy balances data from Energy Statistics Division of National Bureau of Statistics. Various Issues. [People’s Republic of] China Energy Statistical Yearbook. Beijing: [People’s Republic of] China Statistics Press.

75
03 | Energy
Table 3C 3.3: Energy Imports—Yunnan, PRC
Item 2000 2001 2002 2003 2004 2005 2006 2007 2008 2009 2010 2011 2012 2013
Total (Mtoe) 0.0 0.0 0 0 0 0 0 0 0 0.1 0.1 0.3 0.2 0.2
Total share (%) 100 100 0 0 0 0 0 0 0 100 100 100 100 100
Coal 0 0 0 0 0 0 0 0 0 0 0 0 0 0Oil and oil products 0.0 100.0 0 0 0 0 0 0 0 0 0 14.9 19.8 27.5Natural gas 23.3 0 0 0 0 0 0 0 0 0 0 0 0 0Electricity and heat products 76.7 0 0 0 0 0 0 0 0 100.0 100.0 85.1 80.2 72.5Others 0 0 0 0 0 0 0 0 0 0 0 0 0 0
0.0 = value is less than 0.05, Mtoe = million tons of oil equivalent, PRC = People’s Republic of China.Imports comprise amounts having crossed the national territorial boundaries of the country, whether or not customs clearance has taken place.Energy conversion factors are provided in Appendix 2. Source: GMS Secretariat estimates using Yunnan’s physical energy balances data from Energy Statistics Division of National Bureau of Statistics. Various Issues. [People’s Republic of] China Energy Statistical Yearbook. Beijing: [People’s Republic of] China Statistics Press.
Table 3C 3.4: Energy Exports—Yunnan, PRC
Item 2000 2001 2002 2003 2004 2005 2006 2007 2008 2009 2010 2011 2012 2013
Total (Mtoe) 0 0 0 0 0 0.0 (0.1) (0.2) (0.3) (0.4) (0.5) (0.4) 0.2 (0.3)
Total share (%) 0 0 0 0 0 100 100 100 100 100 100 100 100 100
Coal 0 0 0 0 0 0.0 0.0 0.0 0.0 0.0 0.0 0.0 0.0 0.0Oil and oil products 0 0 0 0 0 0 0 0 3.7 2.4 4.4 2.8 0 0Natural gas 0 0 0 0 0 0.0 0.0 0.0 0.0 0.0 0.0 0.0 0.0 0.0Electricity and heat products 0 0 0 0 0 100.0 100.0 100.0 96.3 97.6 95.6 97.2 100.0 100.0Others 0 0 0 0 0 0 0 0 0 0 0 0 0 0
( ) = negative, Mtoe = million tons of oil equivalent, PRC = People’s Republic of China.Exports comprise amounts having crossed the national territorial boundaries of the country, whether or not customs clearance has taken place.Energy conversion factors are provided in Appendix 2. Source: GMS Secretariat estimates using Yunnan’s physical energy balances data from Energy Statistics Division of National Bureau of Statistics. Various Issues. [People’s Republic of] China Energy Statistical Yearbook. Beijing: [People’s Republic of] China Statistics Press.

76
STATISTICS ON
GRO
WTH
, ENERG
Y, AN
D BILATERA
L TRAD
E IN TH
E GREATER M
EKON
G SU
BREGIO
N
Table 3C 3.5: Total Primary Energy Supply—Yunnan, PRC
Item 2000 2001 2002 2003 2004 2005 2006 2007 2008 2009 2010 2011 2012 2013
Total (Mtoe) 19.7 22.4 25.2 29.0 21.5 43.0 46.7 51.3 58.3 65.5 60.2 64.3 69.5 65.8
Total share (%) 100 100 100 100 100 100 100 100 100 100 100 100 100 100
Coal 78.9 77.7 77.8 77.9 77.6 78.4 80.7 79.8 80.1 81.7 76.7 74.6 72.3 72.3Oil and oil products 9.2 12.3 12.5 12.3 8.4 10.8 11.3 11.9 11.4 10.8 14.8 15.0 15.2 14.8Natural gas 2.4 2.2 1.9 1.8 2.2 1.3 1.1 1.0 0.8 0.6 0.6 0.6 0.6 0.6Electricity and heat products 9.5 7.8 7.8 6.4 8.7 5.6 4.6 4.6 6.1 4.5 6.7 8.9 10.3 10.8Others 0 0 0 1.6 3.1 3.8 2.3 2.7 1.5 2.3 1.2 0.9 1.6 1.5
0.0 = value is less than 0.05, Mtoe = million tons of oil equivalent, PRC = People’s Republic of China.Total primary energy supply is primary energy production plus imports, less exports, plus adjustments in international marine bunkers (quantities delivered to ships of all flags engaged in international navigation) and international aviation bunkers (deliveries of aviation fuels to aircraft for international aviation), and changes in stocks. For Yunnan, total supply includes net intranational transfers.Energy conversion factors are provided in Appendix 2. Source: GMS Secretariat estimates using Yunnan’s physical energy balances data from Energy Statistics Division of National Bureau of Statistics. Various Issues. [People’s Republic of] China Energy Statistical Yearbook. Beijing: [People’s Republic of] China Statistics Press.
Table 3C 3.6: Total Final Energy Consumption by Type—Yunnan, PRC
Item 2000 2001 2002 2003 2004 2005 2006 2007 2008 2009 2010 2011 2012 2013
Total (Mtoe) 15.1 17.0 19.4 22.7 17.0 34.3 35.6 39.7 41.3 46.6 43.0 46.2 50.3 49.2
Total share (%) 100 100 100 100 100 100 100 100 100 100 100 100 100 100
Coal 67.3 63.8 65.3 66.5 66.9 68.2 67.1 65.4 65.2 66.0 58.4 56.1 55.4 57.0Oil and oil products 12.0 16.1 16.3 15.7 10.7 13.5 14.7 15.4 16.1 15.2 20.8 20.9 21.0 19.7Natural gas 3.2 2.9 2.5 2.3 2.8 1.7 1.4 1.3 1.2 0.9 0.8 0.8 0.8 0.8Electricity and heat products 17.6 17.2 16.0 14.1 15.7 13.0 14.1 15.3 16.1 15.4 18.9 21.3 21.2 21.0Others 0 0 0 1.4 3.9 3.6 2.6 2.6 1.4 2.5 1.2 0.9 1.6 1.4
Mtoe = million tons of oil equivalent, PRC = People’s Republic of China.Final consumption is equal to the sum of the consumption in the end-use sectors and reflects for the most part deliveries to consumers.Energy conversion factors are provided in Appendix 2. Source: GMS Secretariat estimates using Yunnan’s physical energy balances data from Energy Statistics Division of National Bureau of Statistics. Various Issues. [People’s Republic of] China Energy Statistical Yearbook. Beijing: [People’s Republic of] China Statistics Press.
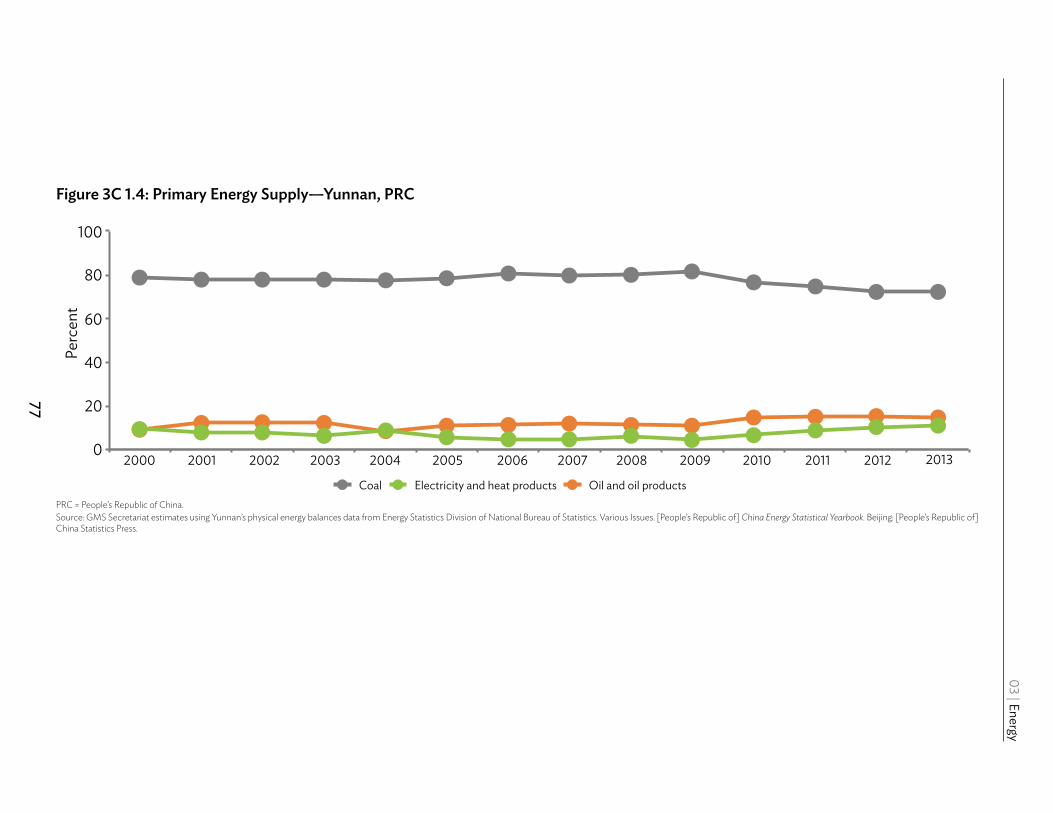
77
03 | Energy
Figure 3C 1.4: Primary Energy Supply—Yunnan, PRC
PRC = People’s Republic of China.Source: GMS Secretariat estimates using Yunnan’s physical energy balances data from Energy Statistics Division of National Bureau of Statistics. Various Issues. [People’s Republic of] China Energy Statistical Yearbook. Beijing: [People’s Republic of] China Statistics Press.
Perc
ent
60
100
80
20
0
40
2000 2001 2002 2003 2004 2005 2006 2007 2008 2009 2010 2011 2012 2013
Oil and oil productsCoal Electricity and heat products

78
STATISTICS ON
GRO
WTH
, ENERG
Y, AN
D BILATERA
L TRAD
E IN TH
E GREATER M
EKON
G SU
BREGIO
N
Table 3C 4.1: Primary Energy Production—Lao PDR
Item 1990 1991 1992 1993 1994 1995 1996 1997 1998 1999 2000 2001 2002 2003 2004 2005 2006 2007 2008 2009 2010 2011 2012 2013 2014 2015
Total (Mtoe) 1.4 1.4 1.4 1.4 1.4 1.4 1.5 1.5 1.6 1.7 1.9 1.8 1.8 1.8 1.9 1.9 1.9 1.9 1.9 2.0 2.0 2.0 2.1 2.0 2.0 2.0
Total share (%) 100 100 100 100 100 100 100 100 100 100 100 100 100 100 100 100 100 100 100 100 100 100 100 100 100 100
Coal 0.1 0.1 1.9 1.9 0.2 1.1 3.0 4.8 6.3 8.0 10.5 7.6 9.6 9.1 10.6 11.1 11.1 12.3 12.8 15.5 16.6 16.9 15.9 16.6 16.5 16.5
Oil and oil products 0 0 0 0 0 0 0 0 0 0 0 0 0 0 0 0 0 0 0 0 0 0 0 0 0 0
Natural gas 0 0 0 0 0 0 0 0 0 0 0 0 0 0 0 0 0 0 0 0 0 0 0 0 0 0
Hydro 5.1 5.1 4.5 5.4 7.1 6.4 7.2 6.9 11.3 13.8 16.8 17.2 16.1 15.1 15.4 15.9 16.3 15.2 16.2 14.7 14.1 14.2 19.1 15.7 16.4 16.4
Biomass 94.8 94.8 93.6 92.6 92.7 92.5 89.8 88.3 82.4 78.2 72.7 75.2 74.2 75.8 74.0 73.0 72.6 72.5 70.9 69.8 69.3 68.9 65.0 67.7 67.2 67.1
Lao PDR = Lao People’s Democratic Republic, Mtoe = million tons of oil equivalent.Primary energy production refers to the quantities of fuels extracted or produced, calculated after any operation for removal of inert matter or impurities.Source: GMS Secretariat estimates using energy balances data from Enerdata. www.enerdata.net (accessed April 2017).
Table 3C 4.2: Energy Imports—Lao PDR
Item 1990 1991 1992 1993 1994 1995 1996 1997 1998 1999 2000 2001 2002 2003 2004 2005 2006 2007 2008 2009 2010 2011 2012 2013 2014 2015
Total (Mtoe) 0.1 0.2 0.2 0.2 0.2 0.2 0.2 0.3 0.3 0.3 0.2 0.3 0.4 0.4 0.4 0.5 0.5 0.5 0.5 0.5 0.5 0.5 0.5 0.6 0.6 0.6
Total share (%) 100 100 100 100 100 100 100 100 100 100 100 100 100 100 100 100 100 100 100 100 100 100 100 100 100 100
Coal 0 0 0 0 0 0 0 0 0 0 0 0 0 0 0 0 0 0 0 0 0 0 0 0 0 0
Oil and oil products 98.3 98.0 97.7 97.4 97.0 96.2 96.8 97.1 96.0 95.8 94.3 94.7 95.4 94.5 94.7 93.9 93.8 91.7 91.3 86.9 82.9 87.3 82.0 81.6 78.2 78.5
Natural gas 0 0 0 0 0 0 0 0 0 0 0 0 0 0 0 0 0 0 0 0 0 0 0 0 0 0
Hydro 0 0 0 0 0 0 0 0 0 0 0 0 0 0 0 0 0 0 0 0 0 0 0 0 0 0
Biomass 0 0 0 0 0 0 0 0 0 0 0 0 0 0 0 0 0 0 0 0 0 0 0 0 0 0
Electricity 1.7 2.0 2.3 2.6 3.0 3.8 3.2 2.9 4.0 4.2 5.7 5.3 4.6 5.5 5.3 6.1 6.2 8.3 8.7 13.1 17.1 12.7 18.0 18.4 21.8 21.5
Lao PDR = Lao People’s Democratic Republic, Mtoe = million tons of oil equivalent.Imports comprise amounts having crossed the national territorial boundaries of the country, whether or not customs clearance has taken place.Source: GMS Secretariat estimates using energy balances data from Enerdata. www.enerdata.net (accessed April 2017).

79
03 | Energy
Table 3C 4.3: Energy Exports—Lao PDR
Item 1990 1991 1992 1993 1994 1995 1996 1997 1998 1999 2000 2001 2002 2003 2004 2005 2006 2007 2008 2009 2010 2011 2012 2013 2014 2015
Total (Mtoe) 0.1 0.1 0.0 0.1 0.1 0.1 0.1 0.1 0.1 0.2 0.3 0.3 0.2 0.2 0.2 0.2 0.2 0.2 0.2 0.2 0.2 0.1 0.2 0.1 0.1 0.1
Total share (%) 100 100 100 100 100 100 100 100 100 100 100 100 100 100 100 100 100 100 100 100 100 100 100 100 100 100
Coal 0 0 0 0 0 0 0 0 0 0 0 0 0 0 0 0 0 0 0 0 0 0 0 0 0 0
Oil and oil products 0 0 0 0 0 0 0 0 0 0 0 0 0 0 0 0 0 0 0 0 0 0 0 0 0 0
Natural gas 0 0 0 0 0 0 0 0 0 0 0 0 0 0 0 0 0 0 0 0 0 0 0 0 0 0
Hydro 0 0 0 0 0 0 0 0 0 0 0 0 0 0 0 0 0 0 0 0 0 0 0 0 0 0
Biomass 0 0 0 0 0 0 0 0 0 0 0 0 0 0 0 0 0 0 0 0 0 0 0 0 0 0
Electricity 100 100 100 100 100 100 100 100 100 100 100 100 100 100 100 100 100 100 100 100 100 100 100 100 100 100
Lao PDR = Lao People’s Democratic Republic, Mtoe = million tons of oil equivalent.Exports comprise amounts having crossed the national territorial boundaries of the country, whether or not customs clearance has taken place.All electricity exports of Lao PDR are generated from hydro power.Source: GMS Secretariat estimates using energy balances data from Enerdata. www.enerdata.net (accessed April 2017).
Table 3C 4.4: Primary Energy Supply—Lao PDR
Item 1990 1991 1992 1993 1994 1995 1996 1997 1998 1999 2000 2001 2002 2003 2004 2005 2006 2007 2008 2009 2010 2011 2012 2013 2014 2015
Total (Mtoe) 1.5 1.5 1.5 1.5 1.5 1.6 1.7 1.8 1.8 1.9 1.9 1.9 2.0 2.0 2.1 2.1 2.1 2.2 2.3 2.3 2.3 2.4 2.4 2.5 2.5 2.5
Total share (%) 100 100 100 100 100 100 100 100 100 100 100 100 100 100 100 100 100 100 100 100 100 100 100 100 100 100
Coal 0.1 0.1 1.7 1.8 0.2 1.0 2.7 4.2 5.7 7.3 10.7 7.4 9.0 8.4 9.4 9.9 9.8 10.6 11.1 13.1 14.1 14.1 13.8 13.5 13.2 13.2
Oil and oil products 9.3 9.9 9.9 9.8 10.6 10.7 13.7 16.4 16.1 17.7 12.2 15.1 17.8 17.3 20.2 20.3 20.4 20.6 20.5 19.9 17.7 18.5 18.2 18.4 18.0 18.3
Natural gas 0 0 0 0 0 0 0 0 0 0 0 0 0 0 0 0 0 0 0 0 0 0 0 0 0 0
Hydro 4.8 4.7 4.2 5.1 6.7 6.0 6.5 6.0 10.3 12.7 17.0 16.8 15.0 13.9 13.7 14.1 14.4 13.1 14.1 12.4 12.0 11.9 16.7 12.7 13.1 13.1
Biomass 89.1 88.5 86.7 86.7 87.2 85.9 81.0 76.7 75.1 71.8 73.5 73.5 69.1 69.7 65.8 64.7 64.4 62.8 61.4 59.1 59.0 57.7 56.7 55.0 54.0 53.7
Electricity (3.3) (3.2) (2.6) (3.4) (4.6) (3.5) (3.9) (3.2) (7.3) (9.5) (13.4) (12.8) (10.9) (9.2) (9.1) (9.0) (9.0) (7.2) (7.1) (4.5) (2.8) (2.3) (5.3) 0.5 1.6 1.6
( ) = negative, Lao PDR = Lao People’s Democratic Republic, Mtoe = million tons of oil equivalent. Total primary energy supply is primary energy production plus imports, less exports, plus adjustments in international marine bunkers (quantities delivered to ships of all flags engaged in international navigation) and international aviation bunkers (deliveries of aviation fuels to aircraft for international aviation), and changes in stocks. Lao PDR is a net exporter of electricity generated from hydro power; the effect is a decrease in domestic energy supply, hence, the negative sign.Source: GMS Secretariat estimates using energy balances data from Enerdata. www.enerdata.net (accessed April 2017).

80
STATISTICS ON
GRO
WTH
, ENERG
Y, AN
D BILATERA
L TRAD
E IN TH
E GREATER M
EKON
G SU
BREGIO
N
Figure 3C 1.5: Primary Energy Supply—Lao PDR
Lao PDR = Lao People’s Democratic Republic.Source: GMS Secretariat estimates using energy balances data from Enerdata. www.enerdata.net (accessed April 2017).
20001999199819971996199519941993199219911990 2001 2002 2003 2004 2005 2006 2007 2008 2009 2010 2011 2012 2013 2014 2015CoalBiomass Hydro Oil and Oil Products
Perc
ent
60
100
80
20
0
40

81
03 | Energy
Table 3C 4.5: Final Energy Consumption by Type—Lao PDR
Item 1990 1991 1992 1993 1994 1995 1996 1997 1998 1999 2000 2001 2002 2003 2004 2005 2006 2007 2008 2009 2010 2011 2012 2013 2014 2015
Total (Mtoe) 1.4 1.5 1.5 1.5 1.5 1.5 1.6 1.7 1.8 1.8 1.8 1.8 1.9 1.9 2.0 2.1 2.1 2.1 2.2 2.3 2.3 2.3 2.4 2.4 2.4 2.5
Total share (%) 100 100 100 100 100 100 100 100 100 100 100 100 100 100 100 100 100 100 100 100 100 100 100 100 100 100
Coal 0.1 0.1 1.8 1.8 0.2 1.0 2.8 4.3 5.9 7.5 10.9 7.6 9.2 8.6 9.7 10.2 10.1 10.9 11.4 13.5 14.5 14.5 14.3 13.9 13.8 13.7
Oil and oil products 9.2 9.8 9.9 9.8 10.6 10.8 14.0 16.8 16.5 18.1 12.5 15.5 18.3 17.7 20.8 20.9 21.0 21.2 21.0 20.5 18.2 19.1 18.7 19.0 18.7 19.1
Natural gas 0 0 0 0 0 0 0 0 0 0 0 0 0 0 0 0 0 0 0 0 0 0 0 0 0 0
Hydro 0 0 0 0 0 0 0 0 0 0 0 0 0 0 0 0 0 0 0 0 0 0 0 0 0 0
Biomass 89.6 88.7 86.9 86.9 87.6 86.3 81.2 76.8 75.1 71.8 73.6 73.5 69.1 69.7 65.7 64.7 64.4 62.7 61.3 58.9 58.8 57.5 56.5 55.0 54.2 53.9
Electricity 1.1 1.3 1.5 1.5 1.6 1.9 2.0 2.2 2.5 2.6 3.0 3.4 3.4 4.0 3.8 4.2 4.6 5.2 6.2 7.2 8.4 8.9 10.5 12.0 13.3 13.3
Lao PDR = Lao People’s Democratic Republic, Mtoe = million tons of oil equivalent.Final consumption is equal to the sum of the consumption in the end-use sectors and reflects for the most part deliveries to consumers. Source: GMS Secretariat estimates using energy balances data from Enerdata. www.enerdata.net (accessed April 2017).
Table 3C 4.6: Power Generation—Lao PDR
Item 1990 1991 1992 1993 1994 1995 1996 1997 1998 1999 2000 2001 2002 2003 2004 2005 2006 2007 2008 2009 2010 2011 2012 2013 2014 2015
Total (TWh) 0.8 0.8 0.8 0.9 1.2 1.1 1.2 1.2 2.2 2.8 3.7 3.6 3.5 3.2 3.3 3.5 3.6 3.4 3.7 3.4 3.3 3.3 4.7 3.7 3.9 3.9
Total share (%) 100 100 100 100 100 100 100 100 100 100 100 100 100 100 100 100 100 100 100 100 100 100 100 100 100 100
Thermal 1.4 1.4 1.6 1.3 1.0 0.9 0.1 0.1 0.0 0.0 0.0 0.0 0 0 0 0 0 0 0 0 0 0 0 0 0 0
Hydro 98.6 98.6 98.4 98.7 99.0 99.1 99.9 99.9 100.0 100.0 100.0 100.0 100.0 100.0 100.0 100.0 100.0 100.0 100.0 100.0 100.0 100.0 100.0 100.0 100.0 100.0
Wind 0 0 0 0 0 0 0 0 0 0 0 0 0 0 0 0 0 0 0 0 0 0 0 0 0 0
Solar 0 0 0 0 0 0 0 0 0 0 0 0 0 0 0 0 0 0 0 0 0 0 0 0 0 0
Lao PDR = Lao People’s Democratic Republic, TWh = terawatt-hour.Power generation shows the quantity, in watt-hour, generated by power plants.Source: GMS Secretariat estimates using energy balances data from Enerdata. www.enerdata.net (accessed April 2017).
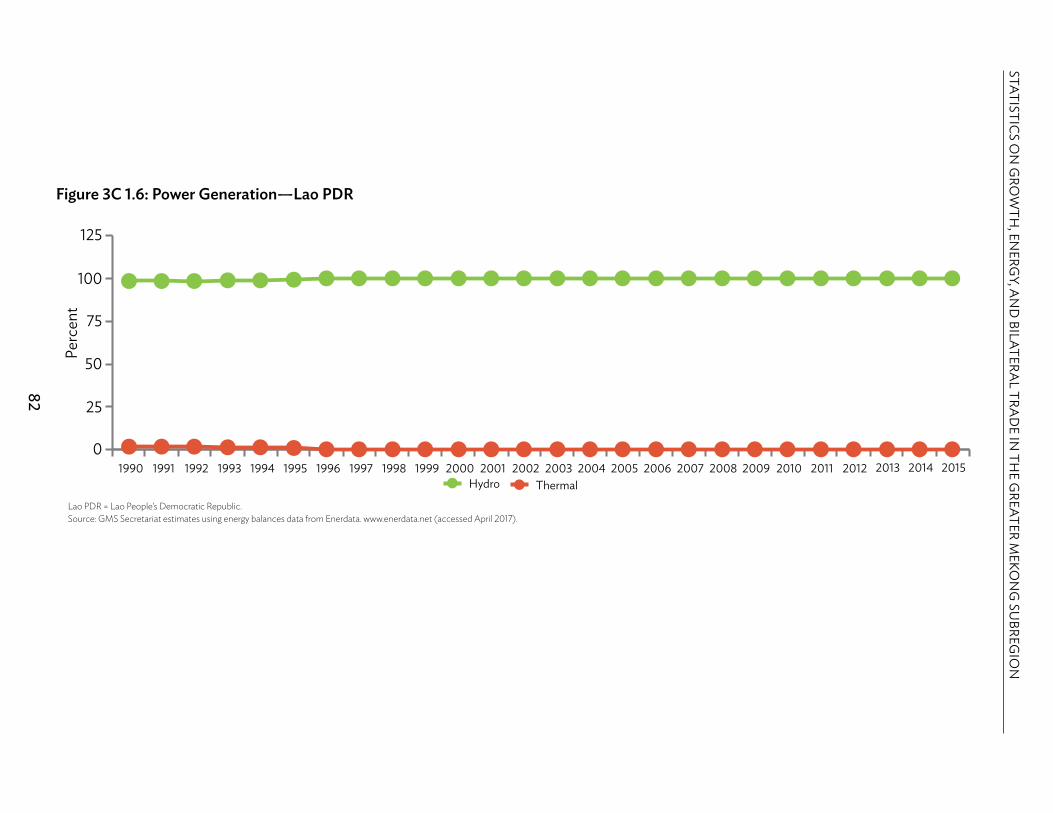
82
STATISTICS ON
GRO
WTH
, ENERG
Y, AN
D BILATERA
L TRAD
E IN TH
E GREATER M
EKON
G SU
BREGIO
N
Figure 3C 1.6: Power Generation—Lao PDR
Lao PDR = Lao People’s Democratic Republic.Source: GMS Secretariat estimates using energy balances data from Enerdata. www.enerdata.net (accessed April 2017).
20001999199819971996199519941993199219911990 2001 2002 2003 2004 2005 2006 2007 2008 2009 2010 2011 2012 2013 2014 2015Hydro Thermal
Perc
ent
75
125
100
25
0
50

83
03 | Energy
Table 3C 5.1: Primary Energy Production—Myanmar
Item 1990 1991 1992 1993 1994 1995 1996 1997 1998 1999 2000 2001 2002 2003 2004 2005 2006 2007 2008 2009 2010 2011 2012 2013 2014
Total (Mtoe) 10.7 10.5 10.8 10.4 11.0 11.0 10.9 11.2 12.2 13.7 15.4 15.9 16.5 18.3 20.3 22.3 22.7 23.6 22.7 22.0 22.6 22.7 22.9 23.2 25.7
Total share (%) 100 100 100 100 100 100 100 100 100 100 100 100 100 100 100 100 100 100 100 100 100 100 100 100 100Coal 0.3 0.4 0.3 0.1 0.3 0.1 0.1 0.1 0.1 0.6 2.1 2.3 1.8 2.8 1.3 1.5 1.9 1.9 1.7 1.6 1.8 1.8 2.2 1.5 1.6Oil and oil products 6.9 7.4 6.8 6.7 6.4 4.4 3.8 3.6 3.2 3.5 3.7 4.2 5.3 5.4 4.9 5.1 4.7 4.5 4.5 4.4 4.1 3.8 3.7 3.7 3.0Natural gas 7.1 6.8 6.5 8.4 9.9 11.1 12.1 12.8 19.2 28.5 33.6 33.1 33.0 35.9 42.5 46.2 46.8 48.3 46.2 44.2 45.1 44.3 44.2 44.8 49.8Hydro 1.0 1.0 1.2 1.4 1.3 1.3 1.3 1.3 0.7 0.7 1.1 1.0 1.1 1.0 1.0 1.2 1.3 1.3 1.5 2.1 1.9 2.9 2.9 3.3 3.0Geothermal-solar-etc 0 0 0 0 0 0 0 0 0 0 0 0 0 0 0 0 0 0 0 0 0 0 0 0 0Biofuels-waste 84.7 84.4 85.1 83.4 82.2 83.1 82.7 82.2 76.8 66.7 59.6 59.4 58.8 54.9 50.2 46.0 45.4 44.0 46.1 47.8 47.0 47.1 47.0 46.8 42.7
Mtoe = million tons of oil equivalent.Primary energy production refers to the quantities of fuels extracted or produced, calculated after any operation for removal of inert matter or impurities.Source: GMS Secretariat estimates using energy balances data from International Energy Agency. Various Years. Energy Statistics and Balances of Non-OECD Countries. Paris: OECD and International Energy Agency. Various Years. Energy Balances of Non-OECD Countries. Paris: OECD.
Table 3C 5.2: Energy Imports—Myanmar
Item 1990 1991 1992 1993 1994 1995 1996 1997 1998 1999 2000 2001 2002 2003 2004 2005 2006 2007 2008 2009 2010 2011 2012 2013 2014
Total (Mtoe) 0.0 0.1 0.2 0.3 0.4 0.7 0.7 1.0 1.2 1.5 1.4 1.2 1.0 0.9 1.0 1.0 0.9 1.0 0.6 0.4 0.2 0.2 1.5 2.2 3.6
Total share (%) 100 100 100 100 100 100 100 100 100 100 100 100 100 100 100 100 100 100 100 100 100 100 100 100 100Coal 100.0 29.8 3.6 2.3 2.2 0.3 0 0.1 0.1 0 0 0 0 0 0 0 0 0 0 0 0 0 0.3 1.3 0Oil and oil products 0 70.2 96.4 97.7 97.8 99.7 100.0 99.9 99.9 100.0 100.0 100.0 100.0 100.0 100.0 100.0 100.0 100.0 100.0 100.0 100.0 100.0 99.7 98.7 100.0Natural gas 0 0 0 0 0 0 0 0 0 0 0 0 0 0 0 0 0 0 0 0 0 0 0 0 0Biofuels-waste 0 0 0 0 0 0 0 0 0 0 0 0 0 0 0 0 0 0 0 0 0 0 0 0 0Electricity 0 0 0 0 0 0 0 0 0 0 0 0 0 0 0 0 0 0 0 0 0 0 0 0 0
0.0 = value is less than 0.05, Mtoe = million tons of oil equivalent. Imports comprise amounts having crossed the national territorial boundaries of the country, whether or not customs clearance has taken place.Source: GMS Secretariat estimates using energy balances data from International Energy Agency. Various Years. Energy Statistics and Balances of Non-OECD Countries. Paris: OECD and International Energy Agency. Various Years. Energy Balances of Non-OECD Countries. Paris: OECD.

84
STATISTICS ON
GRO
WTH
, ENERG
Y, AN
D BILATERA
L TRAD
E IN TH
E GREATER M
EKON
G SU
BREGIO
N
Table 3C 5.3: Energy Exports—Myanmar
Item 1990 1991 1992 1993 1994 1995 1996 1997 1998 1999 2000 2001 2002 2003 2004 2005 2006 2007 2008 2009 2010 2011 2012 2013 2014
Total (Mtoe) 0.0 0.0 0.0 0.0 0.0 0.0 0.0 0.0 1.0 2.6 4.1 4.4 4.7 5.3 6.3 8.3 8.4 8.8 8.1 8.1 8.9 8.6 8.7 8.7 10.8
Total share (%) 100 100 100 100 100 100 100 100 100 100 100 100 100 100 100 100 100 100 100 100 100 100 100 100 100Coal 0 0 0 0 62.5 0 0 0 0 0 0 0 0 0 0 0 0 0 0 0 0 0 0.2 0 0Oil and oil products 100.0 100.0 100.0 100.0 37.5 100.0 100.0 100.0 0.8 0.8 2.3 3.7 5.9 0.6 0 3.9 1.3 1.7 0.5 0.5 0 0 1.6 1.7 1.4Natural gas 0 0 0 0 0 0 0 0 99.2 99.2 97.7 96.3 94.1 99.4 100.0 96.1 98.6 98.3 99.5 99.5 100.0 100.0 98.1 98.3 98.6Biofuels-waste 0 0 0 0 0 0 0 0 0 0 0 0 0 0 0 0 0.1 0 0 0 0 0 0 0 0Electricity 0 0 0 0 0 0 0 0 0 0 0 0 0 0 0 0 0 0 0 0 0 0 0 0 0
0.0 = value is less than 0.05, Mtoe = million tons of oil equivalent. Exports comprise amounts having crossed the national territorial boundaries of the country, whether or not customs clearance has taken place.Source: GMS Secretariat estimates using energy balances data from International Energy Agency. Various Years. Energy Statistics and Balances of Non-OECD Countries. Paris: OECD and International Energy Agency. Various Years. Energy Balances of Non-OECD Countries. Paris: OECD.
Table 3C 5.4: Total Primary Energy Supply—Myanmar
Item 1990 1991 1992 1993 1994 1995 1996 1997 1998 1999 2000 2001 2002 2003 2004 2005 2006 2007 2008 2009 2010 2011 2012 2013 2014
Total (Mtoe) 10.7 10.5 10.8 10.7 11.4 11.8 11.8 12.1 12.4 12.5 12.8 12.5 13.0 14.1 14.8 14.9 15.1 15.7 15.1 14.3 14.0 14.3 15.7 16.6 19.3
Total share (%) 100 100 100 100 100 100 100 100 100 100 100 100 100 100 100 100 100 100 100 100 100 100 100 100 100Coal 0.6 0.7 0.3 0.2 0.1 0.1 0.1 0.1 0.1 0.7 2.5 2.9 2.2 3.6 1.8 2.3 2.8 2.8 2.5 2.5 2.9 2.9 3.1 2.2 2.1Oil and oil products 6.8 7.3 7.0 9.6 10.3 11.0 11.3 10.9 12.8 14.9 15.4 13.0 14.1 14.0 12.9 11.8 11.2 11.1 9.8 9.1 9.1 8.1 13.9 16.8 26.3Natural gas 7.1 6.8 6.5 8.1 9.5 10.3 11.2 11.8 11.1 10.4 9.3 7.7 7.7 9.5 15.3 15.3 15.8 17.8 16.1 11.7 9.2 9.9 10.0 11.0 10.9Hydro 1.0 1.0 1.2 1.4 1.2 1.2 1.2 1.2 0.7 0.7 1.3 1.3 1.4 1.3 1.4 1.7 1.9 2.0 2.3 3.2 3.1 4.5 4.3 4.6 3.9Geothermal-solar-etc 0 0 0 0 0 0 0 0 0 0 0 0 0 0 0 0 0 0 0 0 0 0 0 0 0Biofuels-waste 84.5 84.2 85.0 80.8 78.8 77.4 76.3 76.0 75.3 73.3 71.5 75.1 74.5 71.6 68.5 68.8 68.3 66.3 69.2 73.6 75.6 74.6 68.8 65.4 56.7Others 0 0 0 0 0 0 0 0 0 0 0 0 0 0 0 0 0 0 0 0 0 0 0 0 0
Mtoe = million tons of oil equivalent. Total primary energy supply is primary energy production plus imports, less exports, plus adjustments in international marine bunkers (quantities delivered to ships of all flags engaged in international navigation) and international aviation bunkers (deliveries of aviation fuels to aircraft for international aviation), and changes in stocks. Source: GMS Secretariat estimates using energy balances data from International Energy Agency. Various Years. Energy Statistics and Balances of Non-OECD Countries. Paris: OECD and International Energy Agency. Various Years. Energy Balances of Non-OECD Countries. Paris: OECD.

85
03 | Energy
Figure 3C 1.7: Primary Energy Supply—Myanmar
Source: GMS Secretariat estimates using energy balances data from International Energy Agency. Various Years. Energy Statistics and Balances of Non-OECD Countries. Paris: OECD and International Energy Agency. Various Years. Energy Balances of Non-OECD Countries. Paris: OECD.
20001999199819971996199519941993199219911990 2001 2002 2003 2004 2005 2006 2007 2008 2009 2010 2011 2012 2013 2014
Biofuels—waste Natural gas Oil and Oil Products
Perc
ent
60
100
80
20
0
40

86
STATISTICS ON
GRO
WTH
, ENERG
Y, AN
D BILATERA
L TRAD
E IN TH
E GREATER M
EKON
G SU
BREGIO
N
Table 3C 5.5: Final Energy Consumption by Type—Myanmar
Item 1990 1991 1992 1993 1994 1995 1996 1997 1998 1999 2000 2001 2002 2003 2004 2005 2006 2007 2008 2009 2010 2011 2012 2013 2014
Total (Mtoe) 9.4 9.2 9.5 9.5 10.1 10.5 10.5 10.6 11.0 11.1 11.5 11.3 11.6 12.4 12.7 13.0 13.0 13.2 12.5 12.7 13.0 13.3 14.5 15.3 17.0
Total share (%) 100 100 100 100 100 100 100 100 100 100 100 100 100 100 100 100 100 100 100 100 100 100 100 100 100Coal 0.5 0.6 0.4 0.1 0.1 0.2 0.1 0.1 0.1 0.9 2.8 3.2 1.1 2.7 1.3 1.4 1.7 1.6 1.8 1.8 1.8 1.7 2.1 1.5 2.0Oil and oil products 6.2 6.1 6.7 8.1 8.8 11.5 12.1 10.9 12.7 13.3 13.3 11.4 12.8 13.5 14.3 15.0 12.8 13.4 7.8 8.0 8.0 8.2 14.2 17.7 24.5Natural gas 2.4 2.0 1.9 2.4 2.8 2.7 2.7 3.1 2.8 2.8 2.8 1.8 2.0 3.1 3.2 3.3 3.5 3.6 4.0 4.0 4.6 5.1 4.7 4.5 4.1Biofuels-waste 89.2 89.9 89.4 87.5 86.4 83.7 83.1 83.7 82.2 80.7 78.6 81.3 81.6 78.1 78.6 77.9 79.2 78.4 83.2 82.8 81.4 79.9 74.1 70.9 64.3Others 1.6 1.5 1.7 1.8 1.9 1.9 1.9 2.2 2.1 2.3 2.4 2.2 2.6 2.7 2.6 2.4 2.9 2.9 3.2 3.4 4.2 5.0 4.9 5.4 5.1
Mtoe = million tons of oil equivalent.Final consumption is equal to the sum of the consumption in the end-use sectors and reflects for the most part deliveries to consumers.Source: GMS Secretariat estimates using energy balances data from International Energy Agency. Various Years. Energy Statistics and Balances of Non-OECD Countries. Paris: OECD and International Energy Agency. Various Years. Energy Balances of Non-OECD Countries. Paris: OECD.
Table 3C 5.6: Power Generation—Myanmar
Item 1990 1991 1992 1993 1994 1995 1996 1997 1998 1999 2000 2001 2002 2003 2004 2005 2006 2007 2008 2009 2010 2011 2012 2013 2014
Total (TWh) 2.5 2.7 3.0 3.4 3.6 4.1 3.9 4.4 4.1 4.6 5.1 4.7 5.1 5.4 5.6 6.0 6.2 6.4 6.6 7.0 7.5 9.9 10.7 12.2 14.2
Total share (%) 100 100 100 100 100 100 100 100 100 100 100 100 100 100 100 100 100 100 100 100 100 100 100 100 100Thermal 51.9 53.7 49.3 49.6 55.1 60.0 58.1 62.1 77.1 77.6 63.0 61.1 58.3 61.8 57.1 50.2 46.1 43.4 38.5 24.5 32.3 23.8 27.6 28.0 37.6Hydro 48.1 46.3 50.7 50.4 44.9 40.0 41.9 37.9 22.9 22.4 37.0 38.9 41.7 38.2 42.9 49.8 53.9 56.6 61.5 75.5 67.7 76.2 72.4 72.0 62.4Geothermal 0 0 0 0 0 0 0 0 0 0 0 0 0 0 0 0 0 0 0 0 0 0 0 0 0Solar (PV and thermal) 0 0 0 0 0 0 0 0 0 0 0 0 0 0 0 0 0 0 0 0 0 0 0 0 0Wind 0 0 0 0 0 0 0 0 0 0 0 0 0 0 0 0 0 0 0 0 0 0 0 0 0Others 0 0 0 0 0 0 0 0 0 0 0 0 0 0 0 0 0 0 0 0 0 0 0 0 0
PV = photovoltaic, TWh = terawatt-hour.Power generation shows the quantity, in watt-hour, generated by power plants.Source: GMS Secretariat estimates using energy balances data from International Energy Agency. Various Years. Energy Statistics and Balances of Non-OECD Countries. Paris: OECD and International Energy Agency. Various Years. Energy Balances of Non-OECD Countries. Paris: OECD.

87
03 | Energy
Figure 3C 1.8: Power Generation—Myanmar
Source: GMS Secretariat estimates using energy balances data from International Energy Agency. Various Years. Energy Statistics and Balances of Non-OECD Countries. Paris: OECD and International Energy Agency. Various Years. Energy Balances of Non-OECD Countries. Paris: OECD.
20001999199819971996199519941993199219911990 2001 2002 2003 2004 2005 2006 2007 2008 2009 2010 2011 2012 2013 2014
Perc
ent 60
70
90
80
2030
10
40
50
Hydro Thermal

88
STATISTICS ON
GRO
WTH
, ENERG
Y, AN
D BILATERA
L TRAD
E IN TH
E GREATER M
EKON
G SU
BREGIO
N
Table 3C 6.1: Primary Energy Production—Thailand
Item 1990 1991 1992 1993 1994 1995 1996 1997 1998 1999 2000 2001 2002 2003 2004 2005 2006 2007 2008 2009 2010 2011 2012 2013 2014
Total (Mtoe) 26.6 29.6 30.9 30.2 31.7 33.2 37.2 40.0 39.7 41.5 43.9 43.1 46.0 49.3 51.3 55.2 57.3 60.5 65.5 64.6 70.6 68.7 75.4 78.1 78.7
Total share (%) 100 100 100 100 100 100 100 100 100 100 100 100 100 100 100 100 100 100 100 100 100 100 100 100 100Coal 13.6 14.4 14.5 14.9 15.7 16.1 16.8 16.9 14.7 12.8 11.7 13.2 12.4 11.1 11.3 11.0 9.6 8.7 8.0 8.0 7.5 9.0 6.9 6.5 5.9Oil and oil products 10.8 11.2 12.1 12.7 14.1 13.0 14.6 14.7 15.5 15.7 18.4 19.7 20.8 22.5 21.3 23.5 25.4 25.4 25.1 25.9 24.8 26.2 26.1 24.8 24.0Natural gas 18.8 20.9 21.5 24.6 26.1 26.2 27.5 31.2 34.4 35.7 35.6 35.2 35.0 34.4 34.2 33.5 33.2 33.6 35.2 33.2 35.0 32.0 34.7 36.3 36.8Hydro 1.6 1.3 1.2 1.1 1.2 1.7 1.7 1.5 1.1 0.7 1.2 1.3 1.4 1.3 1.0 0.9 1.2 1.2 0.9 1.0 0.7 1.0 1.0 0.6 0.6Geothermal-solar-etc. 0.0 0.0 0.0 0.0 0.0 0.0 0.0 0.0 0.0 0.0 0.0 0.0 0.0 0.0 0.0 0.0 0.0 0.0 0.0 0.0 0.0 0.0 0.1 0.2 0.2Biofuels-waste 55.3 52.2 50.8 46.7 43.0 42.9 39.4 35.6 34.3 35.1 33.2 30.6 30.4 30.8 32.1 31.1 30.5 31.1 30.9 32.0 32.0 31.7 31.2 31.5 32.5
0.0 = value is less than 0.05, Mtoe = million tons of oil equivalent. Primary energy production refers to the quantities of fuels extracted or produced, calculated after any operation for removal of inert matter or impurities.Source: GMS Secretariat estimates using energy balances data from International Energy Agency. Various Years. Energy Statistics and Balances of Non-OECD Countries. Paris: OECD and International Energy Agency. Various Years. Energy Balances of Non-OECD Countries. Paris: OECD.
Table 3C 6.2: Energy Imports—Thailand
Item 1990 1991 1992 1993 1994 1995 1996 1997 1998 1999 2000 2001 2002 2003 2004 2005 2006 2007 2008 2009 2010 2011 2012 2013 2014
Total (Mtoe) 18.7 19.2 22.0 25.7 29.4 33.3 41.1 40.6 35.3 38.2 37.4 42.2 47.1 50.9 57.4 56.9 58.3 58.3 60.2 61.8 64.4 64.2 69.7 72.9 72.4
Total share (%) 100 100 100 100 100 100 100 100 100 100 100 100 100 100 100 100 100 100 100 100 100 100 100 100 100Coal 1.1 1.7 1.6 2.6 3.3 4.5 6.1 5.1 2.9 5.0 6.9 7.2 7.5 8.7 8.3 9.5 12.1 15.1 16.8 17.2 16.6 16.3 16.8 16.2 18.5Oil and oil products 98.5 97.9 98.2 97.2 96.4 95.2 93.7 94.7 96.6 94.4 87.8 80.1 79.6 78.4 79.2 76.8 74.0 70.4 69.6 70.3 69.5 68.4 68.8 69.1 67.6Natural gas 0 0 0 0 0 0 0 0 0 0.1 4.6 12.0 12.4 12.4 12.0 13.0 13.1 13.7 13.2 12.1 12.8 13.7 12.9 13.0 12.2Biofuels-waste 0.1 0.1 0.1 0.0 0.1 0.0 0.0 0.0 0.0 0.0 0.0 0.0 0.0 0.0 0.0 0.0 0.0 0.0 0.1 0.1 0.1 0.1 0.1 0.2 0.2Electricity 0.3 0.3 0.2 0.2 0.3 0.2 0.2 0.2 0.4 0.5 0.7 0.6 0.5 0.4 0.5 0.7 0.8 0.7 0.4 0.3 1.0 1.4 1.3 1.5 1.5
0.0 = value is less than 0.05, Mtoe = million tons of oil equivalent. Imports comprise amounts having crossed the national territorial boundaries of the country, whether or not customs clearance has taken place.Source: GMS Secretariat estimates using energy balances data from International Energy Agency. Various Years. Energy Statistics and Balances of Non-OECD Countries. Paris: OECD and International Energy Agency. Various Years. Energy Balances of Non-OECD Countries. Paris: OECD.
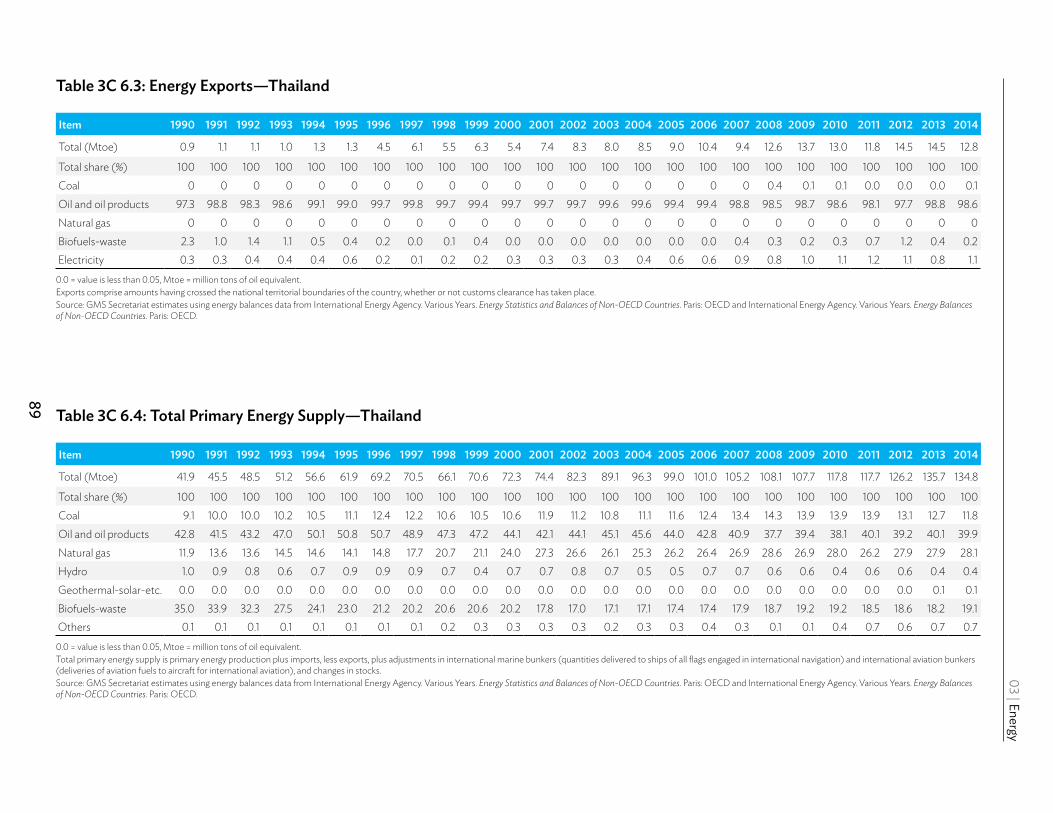
89
03 | Energy
Table 3C 6.3: Energy Exports—Thailand
Item 1990 1991 1992 1993 1994 1995 1996 1997 1998 1999 2000 2001 2002 2003 2004 2005 2006 2007 2008 2009 2010 2011 2012 2013 2014
Total (Mtoe) 0.9 1.1 1.1 1.0 1.3 1.3 4.5 6.1 5.5 6.3 5.4 7.4 8.3 8.0 8.5 9.0 10.4 9.4 12.6 13.7 13.0 11.8 14.5 14.5 12.8
Total share (%) 100 100 100 100 100 100 100 100 100 100 100 100 100 100 100 100 100 100 100 100 100 100 100 100 100Coal 0 0 0 0 0 0 0 0 0 0 0 0 0 0 0 0 0 0 0.4 0.1 0.1 0.0 0.0 0.0 0.1Oil and oil products 97.3 98.8 98.3 98.6 99.1 99.0 99.7 99.8 99.7 99.4 99.7 99.7 99.7 99.6 99.6 99.4 99.4 98.8 98.5 98.7 98.6 98.1 97.7 98.8 98.6Natural gas 0 0 0 0 0 0 0 0 0 0 0 0 0 0 0 0 0 0 0 0 0 0 0 0 0Biofuels-waste 2.3 1.0 1.4 1.1 0.5 0.4 0.2 0.0 0.1 0.4 0.0 0.0 0.0 0.0 0.0 0.0 0.0 0.4 0.3 0.2 0.3 0.7 1.2 0.4 0.2Electricity 0.3 0.3 0.4 0.4 0.4 0.6 0.2 0.1 0.2 0.2 0.3 0.3 0.3 0.3 0.4 0.6 0.6 0.9 0.8 1.0 1.1 1.2 1.1 0.8 1.1
0.0 = value is less than 0.05, Mtoe = million tons of oil equivalent. Exports comprise amounts having crossed the national territorial boundaries of the country, whether or not customs clearance has taken place.Source: GMS Secretariat estimates using energy balances data from International Energy Agency. Various Years. Energy Statistics and Balances of Non-OECD Countries. Paris: OECD and International Energy Agency. Various Years. Energy Balances of Non-OECD Countries. Paris: OECD.
Table 3C 6.4: Total Primary Energy Supply—Thailand
Item 1990 1991 1992 1993 1994 1995 1996 1997 1998 1999 2000 2001 2002 2003 2004 2005 2006 2007 2008 2009 2010 2011 2012 2013 2014
Total (Mtoe) 41.9 45.5 48.5 51.2 56.6 61.9 69.2 70.5 66.1 70.6 72.3 74.4 82.3 89.1 96.3 99.0 101.0 105.2 108.1 107.7 117.8 117.7 126.2 135.7 134.8
Total share (%) 100 100 100 100 100 100 100 100 100 100 100 100 100 100 100 100 100 100 100 100 100 100 100 100 100Coal 9.1 10.0 10.0 10.2 10.5 11.1 12.4 12.2 10.6 10.5 10.6 11.9 11.2 10.8 11.1 11.6 12.4 13.4 14.3 13.9 13.9 13.9 13.1 12.7 11.8Oil and oil products 42.8 41.5 43.2 47.0 50.1 50.8 50.7 48.9 47.3 47.2 44.1 42.1 44.1 45.1 45.6 44.0 42.8 40.9 37.7 39.4 38.1 40.1 39.2 40.1 39.9Natural gas 11.9 13.6 13.6 14.5 14.6 14.1 14.8 17.7 20.7 21.1 24.0 27.3 26.6 26.1 25.3 26.2 26.4 26.9 28.6 26.9 28.0 26.2 27.9 27.9 28.1Hydro 1.0 0.9 0.8 0.6 0.7 0.9 0.9 0.9 0.7 0.4 0.7 0.7 0.8 0.7 0.5 0.5 0.7 0.7 0.6 0.6 0.4 0.6 0.6 0.4 0.4Geothermal-solar-etc. 0.0 0.0 0.0 0.0 0.0 0.0 0.0 0.0 0.0 0.0 0.0 0.0 0.0 0.0 0.0 0.0 0.0 0.0 0.0 0.0 0.0 0.0 0.0 0.1 0.1Biofuels-waste 35.0 33.9 32.3 27.5 24.1 23.0 21.2 20.2 20.6 20.6 20.2 17.8 17.0 17.1 17.1 17.4 17.4 17.9 18.7 19.2 19.2 18.5 18.6 18.2 19.1Others 0.1 0.1 0.1 0.1 0.1 0.1 0.1 0.1 0.2 0.3 0.3 0.3 0.3 0.2 0.3 0.3 0.4 0.3 0.1 0.1 0.4 0.7 0.6 0.7 0.7
0.0 = value is less than 0.05, Mtoe = million tons of oil equivalent. Total primary energy supply is primary energy production plus imports, less exports, plus adjustments in international marine bunkers (quantities delivered to ships of all flags engaged in international navigation) and international aviation bunkers (deliveries of aviation fuels to aircraft for international aviation), and changes in stocks. Source: GMS Secretariat estimates using energy balances data from International Energy Agency. Various Years. Energy Statistics and Balances of Non-OECD Countries. Paris: OECD and International Energy Agency. Various Years. Energy Balances of Non-OECD Countries. Paris: OECD.

90
STATISTICS ON
GRO
WTH
, ENERG
Y, AN
D BILATERA
L TRAD
E IN TH
E GREATER M
EKON
G SU
BREGIO
N
Figure 3C 1.9: Primary Energy Supply—Thailand
Source: GMS Secretariat estimates using energy balances data from International Energy Agency. Various Years. Energy Statistics and Balances of Non-OECD Countries. Paris: OECD and International Energy Agency. Various Years. Energy Balances of Non-OECD Countries. Paris: OECD.
20001999199819971996199519941993199219911990 2001 2002 2003 2004 2005 2006 2007 2008 2009 2010 2011 2012 2013 2014
Perc
ent
60
20
30
0
10
40
50
Natural gasCoalBiofuels—waste Oil and Oil Products

91
03 | Energy
Table 3C 6.5: Final Energy Consumption by Type—Thailand
Item 1990 1991 1992 1993 1994 1995 1996 1997 1998 1999 2000 2001 2002 2003 2004 2005 2006 2007 2008 2009 2010 2011 2012 2013 2014
Total (Mtoe) 28.9 30.6 33.3 36.0 40.0 44.4 49.4 50.1 45.6 49.3 50.6 52.4 58.7 63.8 69.1 69.9 71.6 72.8 74.3 78.5 84.9 85.7 91.8 95.9 95.9
Total share (%) 100 100 100 100 100 100 100 100 100 100 100 100 100 100 100 100 100 100 100 100 100 100 100 100 100Coal 4.5 5.0 5.1 7.0 7.7 8.2 8.9 7.9 7.0 7.7 7.0 8.2 8.3 7.6 8.4 9.7 10.5 8.9 10.5 10.0 10.8 8.7 8.5 7.6 6.7Oil and oil products 51.7 50.8 51.1 54 56.2 56.2 57.6 57.8 57.3 57.9 57.3 57.7 58.4 59 58.6 56.8 55.5 55.6 52.4 52.5 51.6 53 52.6 54.1 53.9Natural gas 0.5 0.6 0.8 0.9 1.1 1.3 1.4 1.5 1.5 1.8 2.2 2.4 2.7 3.3 3.1 2.7 2.9 3.3 3.9 5.5 5.4 6.8 6.6 7.4 7.8Biofuels-waste 31.9 31.4 30.3 24.8 21.6 20.6 18.5 18.7 19 18.5 18.5 16.6 15.8 15.7 15.6 15.9 15.8 16.6 17.6 17.1 17 16.5 17.1 16.2 16.5Others 11.4 12.2 12.7 13.4 13.4 13.8 13.5 14.2 15.2 14.2 15 15.2 14.7 14.4 14.3 14.9 15.4 15.7 15.7 14.8 15.1 14.9 15.1 14.7 15.1
0.0 = value is less than 0.05, Mtoe = million tons of oil equivalent. Final consumption is equal to the sum of the consumption in the end-use sectors and reflects for the most part deliveries to consumers.Source: GMS Secretariat estimates using energy balances data from International Energy Agency. Various Years. Energy Statistics and Balances of Non-OECD Countries. Paris: OECD and International Energy Agency. Various Years. Energy Balances of Non-OECD Countries. Paris: OECD.
Table 3C 6.6: Power Generation—Thailand
Item 1990 1991 1992 1993 1994 1995 1996 1997 1998 1999 2000 2001 2002 2003 2004 2005 2006 2007 2008 2009 2010 2011 2012 2013 2014
Total (TWh) 44.2 50.2 57.1 63.4 71.2 80.1 89.8 93.2 90.1 90.0 96.0 102.4 109.0 117.0 125.7 132.2 138.7 143.4 147.4 148.4 159.5 156.0 166.8 170.4 173.6
Total share (%) 100 100 100 100 100 100 100 100 100 100 100 100 100 100 100 100 100 100 100 100 100 100 100 100 100Thermal 88.7 90.9 92.6 94.2 93.7 91.6 91.8 92.3 94.2 96.1 93.7 93.8 93.1 93.8 95.2 95.6 94.1 94.3 95.2 95.2 96.5 94.7 94.4 95.8 95.8Hydro 11.3 9.1 7.4 5.8 6.3 8.4 8.2 7.7 5.7 3.9 6.3 6.2 6.9 6.2 4.8 4.4 5.9 5.7 4.8 4.8 3.5 5.2 5.2 3.4 3.2Geothermal 0.0 0.0 0.0 0.0 0.0 0.0 0.0 0.0 0.0 0.0 0.0 0.0 0.0 0.0 0.0 0.0 0.0 0.0 0.0 0.0 0.0 0.00. 0.0 0.0 0.0Solar ( PV and thermal) 0 0 0 0 0 0 0 0 0 0 0 0 0 0 0 0 0.0 0.0 0.0 0.0 0.0 0.1 0.3 0.6 0.8Wind 0 0 0 0 0 0 0 0 0 0 0 0 0 0 0 0 0 0 0 0.0 0.0 0.0 0.1 0.2 0.2Others 0 0 0 0 0 0 0 0 0 0 0 0 0 0 0 0 0 0 0 0 0 0.0 0.0 0.0 0.0
0.0 = value less than 0.05, PV = photovoltaic, TWh = terawatt-hour. Power generation shows the quantity, in watt-hour, generated by power plants. Source: GMS Secretariat estimates using energy balances data from International Energy Agency. Various Years. Energy Statistics and Balances of Non-OECD Countries. Paris: OECD and International Energy Agency. Various Years. Energy Balances of Non-OECD Countries. Paris: OECD.

92
STATISTICS ON
GRO
WTH
, ENERG
Y, AN
D BILATERA
L TRAD
E IN TH
E GREATER M
EKON
G SU
BREGIO
N
Figure 3C 1.10: Power Generation—Thailand
Source: GMS Secretariat estimates using energy balances data from International Energy Agency. Various Years. Energy Statistics and Balances of Non-OECD Countries. Paris: OECD and International Energy Agency. Various Years. Energy Balances of Non-OECD Countries. Paris: OECD.
20001999199819971996199519941993199219911990 2001 2002 2003 2004 2005 2006 2007 2008 2009 2010 2011 2012 2013 2014
Perc
ent
125
50
0
25
75
100
Hydro Thermal

93
03 | Energy
Table 3C 7.1: Primary Energy Production—Viet Nam
Item 1990 1991 1992 1993 1994 1995 1996 1997 1998 1999 2000 2001 2002 2003 2004 2005 2006 2007 2008 2009 2010 2011 2012 2013 2014
Total (Mtoe) 18.3 20.2 22.0 24.0 24.1 26.4 28.7 31.5 34.8 37.2 39.9 41.8 44.6 45.8 57.6 60.8 61.9 63.2 61.5 66.5 66.4 68.3 69.4 69.0 71.2
Total share (%) 100 100 100 100 100 100 100 100 100 100 100 100 100 100 100 100 100 100 100 100 100 100 100 100 100Coal 14.2 14.1 12.7 13.8 13.3 17.7 19.2 20.3 18.8 14.5 16.3 17.4 20.0 20.4 26.6 31.3 34.8 37.4 36.0 37.1 37.8 38.2 34.2 33.3 32.8Oil and oil products 15.0 20.2 25.4 26.7 30.0 29.5 31.2 32.6 36.6 42.3 42.2 41.7 39.0 38.0 36.3 32.1 28.7 26.7 25.8 26.1 24.2 23.8 25.7 25.8 26.1Natural gas 0.0 0.1 0.1 0.1 0.1 0.7 1.0 1.6 2.4 2.5 2.8 2.7 5.2 5.9 8.8 9.9 9.8 9.4 10.7 10.7 12.2 11.1 11.9 12.4 12.5Hydro 2.5 2.7 2.8 2.9 3.3 3.4 3.6 3.2 2.7 3.2 3.1 3.7 3.5 3.6 2.7 2.4 2.8 3.1 3.6 3.9 3.6 5.2 6.5 6.5 7.1Geothermal-solar-etc 0 0 0 0 0 0 0 0 0 0 0 0 0 0 0 0 0 0 0 0.0 0.0 0.0 0.0 0.0 0.0Biofuels-waste 68.2 62.9 58.9 56.6 53.3 48.7 45.1 42.3 39.5 37.5 35.5 34.5 32.3 32.1 25.6 24.3 23.8 23.3 23.9 22.1 22.2 21.8 21.7 22.0 21.5
0.0 = value is less than 0.05, Mtoe = million tons of oil equivalent. Primary energy production refers to the quantities of fuels extracted or produced, calculated after any operation for removal of inert matter or impurities.Source: GMS Secretariat estimates using energy balances data from International Energy Agency. Various Years. Energy Statistics and Balances of Non-OECD Countries. Paris: OECD and International Energy Agency. Various Years. Energy Balances of Non-OECD Countries. Paris: OECD.
Table 3C 7.2: Energy Imports—Viet Nam
Item 1990 1991 1992 1993 1994 1995 1996 1997 1998 1999 2000 2001 2002 2003 2004 2005 2006 2007 2008 2009 2010 2011 2012 2013 2014
Total (Mtoe) 3.0 2.7 3.2 4.2 4.6 5.1 6.0 6.1 7.0 7.5 8.9 9.2 10.1 10.7 11.9 13.2 13.2 15.5 15.5 15.6 13.6 14.7 13.0 12.4 14.4
Total share (%) 100 100 100 100 100 100 100 100 100 100 100 100 100 100 100 100 100 100 100 100 100 100 100 100 100Coal 0.3 0.3 0.3 0.3 0.2 0.2 0 0 0 0 0 0 0 0 0 2.6 3.3 2.9 3.0 3.1 4.4 5.9 8.0 11.0 12.3Oil and oil products 99.7 99.7 99.7 99.7 99.8 99.8 100.0 100.0 100.0 100.0 100.0 100.0 100.0 100.0 100.0 97.2 96.1 95.6 95.2 94.7 92.1 91.2 90.2 86.4 85.2Natural gas 0 0 0 0 0 0 0 0 0 0 0 0 0 0 0 0 0 0 0 0 0 0 0 0 0Biofuels-waste 0 0 0 0 0 0 0 0 0 0 0 0 0 0 0 0 0 0 0 0 0 0 0 0 0Electricity 0 0 0 0 0 0 0 0 0 0 0 0 0 0 0 0.3 0.6 1.5 1.8 2.3 3.6 2.9 1.8 2.5 2.5
Mtoe = million tons of oil equivalent. Imports comprise amounts having crossed the national territorial boundaries of the country, whether or not customs clearance has taken place.Source: GMS Secretariat estimates using energy balances data from International Energy Agency. Various Years. Energy Statistics and Balances of Non-OECD Countries. Paris: OECD and International Energy Agency. Various Years. Energy Balances of Non-OECD Countries. Paris: OECD.

94
STATISTICS ON
GRO
WTH
, ENERG
Y, AN
D BILATERA
L TRAD
E IN TH
E GREATER M
EKON
G SU
BREGIO
N
Table 3C 7.3: Energy Exports—Viet Nam
Item 1990 1991 1992 1993 1994 1995 1996 1997 1998 1999 2000 2001 2002 2003 2004 2005 2006 2007 2008 2009 2010 2011 2012 2013 2014
Total (Mtoe) 3.1 4.7 6.5 7.1 8.2 9.8 11.5 12.2 14.8 17.6 18.7 20.2 20.9 21.0 27.9 30.4 35.1 34.8 26.2 29.6 21.0 20.5 20.1 17.4 17.1
Total share (%) 100 100 100 100 100 100 100 100 100 100 100 100 100 100 100 100 100 100 100 100 100 100 100 100 100Coal 14.1 14.1 14.1 11.4 14.1 16.1 17.8 15.8 12.0 10.4 9.8 11.9 16.2 16.8 23.3 33.1 46.8 51.6 41.4 47.3 53.1 47.4 42.9 41.9 34.7Oil and oil products 85.9 85.9 85.9 88.6 85.9 83.9 82.2 84.2 88.0 89.6 90.2 88.1 83.8 83.2 71.5 62.6 50.4 47.0 57.8 52.6 46.5 52.2 56.5 57.5 64.5Natural gas 0 0 0 0 0 0 0 0 0 0 0 0 0 0 5.1 4.3 2.8 1.4 0.8 0 0 0 0 0 0Biofuels-waste 0 0 0 0 0 0 0 0 0 0 0 0 0 0 0 0 0 0 0 0 0 0 0 0 0Electricity 0 0 0 0 0 0 0 0 0 0 0 0 0 0 0 0 0 0 0 0.1 0.4 0.5 0.5 0.7 0.8
0.0 = value is less than 0.05, Mtoe = million tons of oil equivalent. Exports comprise amounts having crossed the national territorial boundaries of the country, whether or not customs clearance has taken place.Source: GMS Secretariat estimates using energy balances data from International Energy Agency. Various Years. Energy Statistics and Balances of Non-OECD Countries. Paris: OECD and International Energy Agency. Various Years. Energy Balances of Non-OECD Countries. Paris: OECD.
Table 3C 7.4: Total Primary Energy Supply—Viet Nam
Item 1990 1991 1992 1993 1994 1995 1996 1997 1998 1999 2000 2001 2002 2003 2004 2005 2006 2007 2008 2009 2010 2011 2012 2013 2014
Total (Mtoe) 17.9 18.1 18.9 20.5 20.5 21.9 23.1 24.9 26.5 27.3 28.7 30.6 33.4 35.1 39.0 41.3 42.3 45.5 48.6 53.1 58.9 59.1 59.8 61.7 66.6
Total share (%) 100 100 100 100 100 100 100 100 100 100 100 100 100 100 100 100 100 100 100 100 100 100 100 100 100Coal 12.4 11.9 11.4 10.2 11.2 15.2 15.5 18.2 17.2 15.5 15.2 16.4 16.5 16.6 18.8 20.0 21.0 20.9 24.1 23.8 24.9 26.4 26.3 27.9 28.8Oil and oil products 15.2 14.8 16.6 20.1 22.3 21.0 22.9 22.2 24.3 25.5 27.2 27.9 28.9 29.2 30.1 29.1 27.6 29.8 27.4 29.6 31.7 29.1 27.0 26.1 26.9Natural gas 0.0 0.1 0.1 0.1 0.1 0.8 1.2 2.0 3.1 3.5 3.9 3.7 6.9 7.7 9.4 11.4 12.1 12.0 13.1 13.4 13.8 12.8 13.8 13.8 13.4Hydro 2.6 3.0 3.3 3.3 3.9 4.2 4.5 4.0 3.6 4.3 4.4 5.1 4.7 4.7 3.9 3.5 4.2 4.4 4.6 4.9 4.0 6.0 7.6 7.2 7.6Geothermal-solar-etc 0 0 0 0 0 0 0 0 0 0 0 0 0 0 0 0 0 0 0 0.0 0.0 0.0 0.0 0.0 0.0Biofuels-waste 69.8 70.2 68.6 66.3 62.5 58.8 55.9 53.5 51.7 51.2 49.4 47.0 43.0 41.8 37.8 35.9 34.9 32.4 30.3 27.7 25.0 25.2 25.1 24.6 23.0Others 0 0 0 0 0 0 0 0 0 0 0 0 0 0 0 0.1 0.2 0.5 0.6 0.6 0.7 0.6 0.2 0.3 0.3
0.0 = value is less than 0.05, Mtoe = million tons of oil equivalent. Total primary energy supply is primary energy production plus imports, less exports, plus adjustments in international marine bunkers (quantities delivered to ships of all flags engaged in international navigation) and international aviation bunkers (deliveries of aviation fuels to aircraft for international aviation), and changes in stocks. Source: GMS Secretariat estimates using energy balances data from International Energy Agency. Various Years. Energy Statistics and Balances of Non-OECD Countries. Paris: OECD and International Energy Agency. Various Years. Energy Balances of Non-OECD Countries. Paris: OECD.

95
03 | Energy
Figure 3C 1.11: Primary Energy Supply—Viet Nam
Source: GMS Secretariat estimates using energy balances data from International Energy Agency. Various Years. Energy Statistics and Balances of Non-OECD Countries. Paris: OECD and International Energy Agency. Various Years. Energy Balances of Non-OECD Countries. Paris: OECD.
20001999199819971996199519941993199219911990 2001 2002 2003 2004 2005 2006 2007 2008 2009 2010 2011 2012 2013 2014
Perc
ent
80
4050
0
2030
10
6070
Natural gasCoalBiofuels—waste Hydro Oil and Oil Products

96
STATISTICS ON
GRO
WTH
, ENERG
Y, AN
D BILATERA
L TRAD
E IN TH
E GREATER M
EKON
G SU
BREGIO
N
Table 3C 7.5: Final Energy Consumption by Type—Viet Nam
Item 1990 1991 1992 1993 1994 1995 1996 1997 1998 1999 2000 2001 2002 2003 2004 2005 2006 2007 2008 2009 2010 2011 2012 2013 2014
Total (Mtoe) 16.1 16.5 17.4 19.1 18.8 20.0 20.9 22.1 23.2 24.1 25.1 26.7 28.6 30.7 33.5 35.1 35.6 38.4 41.2 44.7 48.2 48.7 49.4 51.7 55.5
Total share (%) 100 100 100 100 100 100 100 100 100 100 100 100 100 100 100 100 100 100 100 100 100 100 100 100 100Coal 8.3 9.7 10.2 9.4 9.7 13.1 12.9 15.0 14.2 13.1 12.8 14.0 14.0 13.4 14.5 15.0 15.2 15.4 19.7 20.0 20.3 20.7 19.6 20.4 21.0Oil and oil products 14.5 13.6 15.4 19.0 21.3 21.2 23.3 22.2 23.3 25.0 26.0 26.7 29.4 31.0 32.9 32.2 31.4 33.2 30.8 32.8 34.5 32.2 30.6 29.9 31.0Natural gas 0 0.1 0.1 0.1 0.1 0.1 0.1 0.1 0.1 0.1 0.1 0.1 0.1 0.1 0.8 1.5 1.4 1.4 1.6 1.4 1.0 1.7 2.9 2.8 1.8Biofuels-waste 73.9 73.2 70.9 68.0 64.7 60.8 58.3 56.8 55.8 54.8 53.4 50.9 47.5 45.8 41.6 39.7 39.0 36.2 33.6 31.0 28.7 28.7 28.6 27.6 26.0Others 3.3 3.4 3.4 3.5 4.2 4.8 5.5 5.9 6.6 7.0 7.7 8.3 9.0 9.8 10.2 11.5 13.0 13.7 14.2 14.8 15.5 16.7 18.4 19.3 20.3
0.0 = value is less than 0.05, Mtoe = million tons of oil equivalent. Final consumption is equal to the sum of the consumption in the end-use sectors and reflects for the most part deliveries to consumers.Source: GMS Secretariat estimates using energy balances data from International Energy Agency. Various Years. Energy Statistics and Balances of Non-OECD Countries. Paris: OECD and International Energy Agency. Various Years. Energy Balances of Non-OECD Countries. Paris: OECD.
Table 3C 7.6: Power Generation—Viet Nam
Item 1990 1991 1992 1993 1994 1995 1996 1997 1998 1999 2000 2001 2002 2003 2004 2005 2006 2007 2008 2009 2010 2011 2012 2013 2014
Total (TWh) 8.7 9.2 9.7 10.7 12.5 14.6 16.9 19.1 21.7 23.6 26.6 30.6 35.8 40.9 46.2 53.7 60.5 67.0 73.4 83.2 94.9 104.1 117.6 125.1 140.9
Total share (%) 100 100 100 100 100 100 100 100 100 100 100 100 100 100 100 100 100 100 100 100 100 100 100 100 100Thermal 38.2 31.4 25.5 25.3 24.4 27.8 29.1 39.1 48.8 41.5 45.2 40.5 49.2 53.6 61.4 68.4 66.3 65.6 64.6 63.9 70.9 60.6 55.0 58.4 58.4Hydro 61.8 68.6 74.5 74.7 75.6 72.2 70.9 60.9 51.2 58.5 54.8 59.5 50.8 46.4 38.6 31.6 33.7 34.4 35.4 36.0 29.0 39.3 44.9 41.5 41.5Geothermal 0 0 0 0 0 0 0 0 0 0 0 0 0 0 0 0 0 0 0 0 0 0 0 0 0Solar (PV and thermal) 0 0 0 0 0 0 0 0 0 0 0 0 0 0 0 0 0 0 0 0 0 0 0 0 0Wind 0 0 0 0 0 0 0 0 0 0 0 0 0 0 0 0 0 0 0.0 0.0 0.1 0.1 0.1 0.1 0.1Others 0 0 0 0 0 0 0 0 0 0 0 0 0 0 0 0 0 0 0 0 0 0 0 0 0
0.0 = value is less than 0.05, PV = photovoltaic, TWh = terawatt-hour. Power generation shows the quantity, in watt-hour, generated by power plants. Source: GMS Secretariat estimates using energy balances data from International Energy Agency. Various Years. Energy Statistics and Balances of Non-OECD Countries. Paris: OECD and International Energy Agency. Various Years. Energy Balances of Non-OECD Countries. Paris: OECD.

97
03 | Energy
Figure 3C 1.12: Power Generation—Viet Nam
Source: GMS Secretariat estimates using energy balances data from International Energy Agency. Various Years. Energy Statistics and Balances of Non-OECD Countries. Paris: OECD and International Energy Agency. Various Years. Energy Balances of Non-OECD Countries. Paris: OECD.
20001999199819971996199519941993199219911990 2001 2002 2003 2004 2005 2006 2007 2008 2009 2010 2011 2012 2013 2014
Perc
ent
80
50
40
20
30
60
70
Hydro Thermal


04Bilateral Trade with Greater Mekong Subregion

100
STATISTICS ON
GRO
WTH
, ENERG
Y, AN
D BILATERA
L TRAD
E IN TH
E GREATER M
EKON
G SU
BREGIO
N
Table 4A 1.1: Trade with GMS—Cambodia
Item 1995 1996 1997 1998 1999 2000 2001 2002 2003 2004 2005 2006 2007 2008 2009 2010 2011 2012 2013 2014 2015
Intra-GMS trade ($ million) 551 481 503 487 528 756 889 1,047 1,388 1,746 2,226 2,969 3,587 4,984 3,955 5,838 8,529 10,428 11,822 12,181 13,297
Total Exports to GMS ($ million) 166 55 117 73 70 105 70 101 133 188 219 239 305 343 301 585 790 1,007 1,223 1,695 2,251
Total Imports from GMS ($ million) 386 426 386 414 457 652 819 946 1,255 1,558 2,007 2,730 3,282 4,641 3,654 5,253 7,739 9,420 10,600 10,486 11,047
Intra-GMS trade share (%) 33.9 30.1 26.0 23.5 20.0 21.2 22.7 23.7 27.2 27.9 31.0 32.4 33.9 39.6 35.1 36.8 43.0 44.3 44.5 41.9 42.4
Exports to GMS (%) 51.3 19.6 20.5 9.2 6.0 6.7 3.8 4.9 5.5 6.3 6.7 5.9 6.6 6.8 6.2 10.0 9.9 10.6 11.1 12.9 15.3
Imports from GMS (%) 29.6 32.4 28.3 32.2 31.3 32.7 39.4 40.5 46.8 47.7 51.5 53.6 55.3 61.4 57.4 52.7 65.3 66.9 68.1 65.6 66.5
GMS = Greater Mekong Subregion. Intraregional trade share = (Tii/Ti) x 100 where Tii is intraregional trade, i.e., exports of region i to region i plus imports of region i from region i; and Ti =total exports of region i to the world plus total imports of region i from the world. Intra-GMS trade is Tii. Exports to GMS (%)=Total exports to GMS/Total exports to the world. Imports from GMS (%)=Total imports from GMS/Total imports from the world. Source: GMS Secretariat estimates using data from UNCOMTRADE. https://comtrade.un.org (accessed May 2017).
GMS = Greater Mekong Subregion.Source: GMS Secretariat estimates using data from UNCOMTRADE. https://comtrade.un.org (accessed May 2017).
Figure 4.1: Intra-GMS Trade—Cambodia
$ bi
llion
15.0
10.0
12.5
2.5
5.0
7.5
0.0
Intra-GMS trade ($ billion) Trade share (%)
0.6 0.5 0.5 0.5 0.5 0.8 0.9 1.0 1.4 1.7 2.23.0
3.65.0
4.0
5.8
8.5
10.4
12.213.3
1995 1996 1997 1998 1999 2000 2001 2002 2003 2004 2005 2006 2007 2008 2009 2010 2011 2012 2013 2014 2015
% sh
are
50
40
45
20
25
30
35
15
11.8

04 | Bilateral Trade with G
reater Mekong Subregion
101
Perc
ent
80
6050
70
102030
40
0
Exports to GMS Imports from GMS
1995 1996 1997 1998 1999 2000 2001 2002 2003 2004 2005 2006 2007 2008 2009 2010 2011 2012 2013 2014 2015
Figure 4.2: Trade with GMS—Cambodia
GMS = Greater Mekong Subregion.Exports to GMS (%)=Total exports to GMS/Total exports to the world. Imports from GMS (%)=Total imports from GMS/Total imports from the world.Source: GMS Secretariat estimates using data from UNCOMTRADE. https://comtrade.un.org (accessed May 2017).

102
STATISTICS ON
GRO
WTH
, ENERG
Y, AN
D BILATERA
L TRAD
E IN TH
E GREATER M
EKON
G SU
BREGIO
N
Table 4A 1.2: Trade with GMS—PRC
Item 1995 1996 1997 1998 1999 2000 2001 2002 2003 2004 2005 2006 2007 2008 2009 2010 2011 2012 2013 2014 2015
Intra-GMS trade ($ million) 5,294 5,060 5,745 5,682 6,234 9,976 10,793 13,023 18,804 25,825 31,909 40,087 53,097 64,914 63,847 89,988 115,247 131,810 153,420 188,591 188,736
Total Exports to GMS ($ million) 3,189 2,708 3,249 2,932 2,932 4,475 4,892 6,136 8,314 11,553 15,037 19,301 26,690 34,100 33,153 48,149 62,399 74,728 93,775 112,507 119,104
Total Imports from GMS ($ million) 2,104 2,352 2,495 2,749 3,302 5,501 5,901 6,887 10,490 14,272 16,872 20,786 26,407 30,814 30,694 41,839 52,848 57,082 59,645 76,084 69,633
Intra-GMS trade share (%) 1.9 1.7 1.8 1.7 1.7 2.1 2.1 2.1 2.2 2.2 2.2 2.3 2.4 2.5 2.9 3.0 3.1 3.4 3.6 4.3 4.7
Exports to GMS (%) 2.1 1.8 1.8 1.6 1.5 1.8 1.8 1.9 1.9 1.9 2.0 2.0 2.2 2.4 2.8 3.1 3.3 3.6 4.2 4.8 5.2
Imports from GMS (%) 1.6 1.7 1.7 1.9 2.0 2.4 2.4 2.3 2.5 2.5 2.5 2.6 2.7 2.6 3.0 2.9 2.9 3.0 3.0 3.7 4.0
GMS = Greater Mekong Subregion. Intraregional trade share = (Tii/Ti) x 100 where Tii is intraregional trade, i.e., exports of region i to region i plus imports of region i from region i; and Ti =total exports of region i to the world plus total imports of region i from the world. Intra-GMS trade is Tii. Exports to GMS (%)=Total exports to GMS/Total exports to the world. Imports from GMS (%)=Total imports from GMS/Total imports from the world. Source: GMS Secretariat estimates using data from UNCOMTRADE. https://comtrade.un.org (accessed May 2017).
GMS = Greater Mekong Subregion, PRC = People’s Republic of China.Source: GMS Secretariat estimates using data from UNCOMTRADE. https://comtrade.un.org (accessed May 2017).
Figure 4.3: Intra-GMS Trade—PRC
$ bi
llion
200
150
50
100
0
% sh
are
5.0
4.0
4.5
2.0
2.5
3.0
3.5
1.5
Intra-GMS trade ($ billion)
1995 1996 1997 1998 1999 2000 2001 2002 2003 2004 2005 2006 2007 2008 2009 2010 2011 2012 2013 2014 2015
Trade share (%)
5.3 5.75.1 5.7 6.2 10.0 10.8 13.0 18.8 25.8 31.9 40.153.1
64.9 63.8
115.2
90.0
131.8
153.4
188.6 188.7

04 | Bilateral Trade with G
reater Mekong Subregion
103
Figure 4.4: Trade with GMS—PRC
GMS = Greater Mekong Subregion, PRC = People’s Republic of China.Exports to GMS (%)=Total exports to GMS/Total exports to the world. Imports from GMS (%)=Total imports from GMS/Total imports from the world. Source: GMS Secretariat estimates using data from UNCOMTRADE. https://comtrade.un.org (accessed May 2017).
Perc
ent
6
4
5
1
2
3
0
Exports to GMS Imports from GMS
1995 1996 1997 1998 1999 2000 2001 2002 2003 2004 2005 2006 2007 2008 2009 2010 2011 2012 2013 2014 2015

104
STATISTICS ON
GRO
WTH
, ENERG
Y, AN
D BILATERA
L TRAD
E IN TH
E GREATER M
EKON
G SU
BREGIO
N
Table 4A 1.3: Trade with GMS—Lao PDR
Item 1995 1996 1997 1998 1999 2000 2001 2002 2003 2004 2005 2006 2007 2008 2009 2010 2011 2012 2013 2014 2015
Intra-GMS trade ($ million) 478 466 469 427 499 676 695 685 784 952 1,292 2,003 2,370 3,211 3,271 4,465 5,972 7,463 8,949 10,350 9,297
Total Exports to GMS ($ million) 76 77 62 39 66 187 165 166 176 202 350 717 768 1,027 1,079 1,644 2,418 2,482 3,044 3,994 3,388
Total Imports from GMS ($ million) 402 390 407 388 433 489 530 520 608 751 942 1,286 1,602 2,184 2,192 2,820 3,554 4,981 5,905 6,356 5,909
Intra-GMS trade share (%) 59.3 55.6 58.4 60.5 62.5 69.6 70.7 69.9 71.8 67.2 74.0 78.1 77.6 81.4 81.0 83.7 82.2 82.5 84.3 86.8 87.6
Exports to GMS (%) 31.2 27.6 23.8 19.3 28.1 51.3 49.4 48.9 47.7 45.7 57.4 66.0 65.9 72.8 75.8 79.3 80.0 76.6 77.5 85.6 83.7
Imports from GMS (%) 71.4 69.5 75.1 77.2 76.9 80.6 81.6 80.9 84.2 77.0 83.0 87.0 84.9 86.3 83.8 86.4 83.7 85.7 88.4 87.6 89.9
GMS = Greater Mekong Subregion, Lao PDR = Lao People’s Democratic Republic. Intraregional trade share = (Tii/Ti) x 100 where Tii is intraregional trade, i.e., exports of region i to region i plus imports of region i from region i; and Ti =total exports of region i to the world plus total imports of region i from the world. Intra-GMS trade is Tii. Exports to GMS (%)=Total exports to GMS/Total exports to the world. Imports from GMS (%)=Total imports from GMS/Total imports from the world. Source: GMS Secretariat estimates using data from UNCOMTRADE. https://comtrade.un.org (accessed May 2017).
GMS = Greater Mekong Subregion, Lao PDR = Lao People’s Democratic Republic.Source: GMS Secretariat estimates using data from UNCOMTRADE. https://comtrade.un.org (accessed May 2017).
Figure 4.5: Intra-GMS Trade—Lao PDR
$ bi
llion
12.5
7.5
10.0
2.5
5.0
0.0
% sh
are
90
80
85
5560
657075
50
Intra-GMS trade ($ billion)
1995 1996 1997 1998 1999 2000 2001 2002 2003 2004 2005 2006 2007 2008 2009 2010 2011 2012 2013 2014 2015
Trade share (%)
0.5 0.50.5 0.4 0.5 0.7 0.7 0.7 0.8 1.0 1.32.0 2.4
3.2 3.3
6.0
4.5
7.5
8.9
10.49.3

04 | Bilateral Trade with G
reater Mekong Subregion
105
Figure 4.6: Trade with GMS—Lao PDR
GMS = Greater Mekong Subregion, Lao PDR = Lao People’s Democratic Republic.Exports to GMS (%)=Total exports to GMS/Total exports to the world. Imports from GMS (%)=Total imports from GMS/Total imports from the world. Source: GMS Secretariat estimates using data from UNCOMTRADE. https://comtrade.un.org (accessed May 2017).
Perc
ent
100
60
80
20
40
0
Exports to GMS Imports from GMS
1995 1996 1997 1998 1999 2000 2001 2002 2003 2004 2005 2006 2007 2008 2009 2010 2011 2012 2013 2014 2015

106
STATISTICS ON
GRO
WTH
, ENERG
Y, AN
D BILATERA
L TRAD
E IN TH
E GREATER M
EKON
G SU
BREGIO
N
Table 4A 1.4: Trade with GMS—Myanmar
Item 1995 1996 1997 1998 1999 2000 2001 2002 2003 2004 2005 2006 2007 2008 2009 2010 2011 2012 2013 2014 2015
Intra-GMS trade ($ million) 1,336 1,107 1,131 981 1,014 1,394 1,801 2,106 2,450 3,138 3,760 4,644 5,439 7,429 7,333 9,481 12,783 14,001 18,371 33,607 22,832
Total Exports to GMS ($ million) 371 267 156 125 214 388 944 1,050 1,087 1,581 2,108 2,659 2,755 4,100 3,493 3,883 5,033 5,082 7,014 19,654 8,917
Total Imports from GMS ($ million) 965 840 976 857 800 1,005 857 1,057 1,362 1,557 1,652 1,986 2,684 3,329 3,840 5,598 7,750 8,919 11,358 13,952 13,915
Intra-GMS trade share (%) 35.7 28.2 27.5 28.0 28.4 29.3 33.8 38.0 42.8 49.3 53.7 56.9 54.5 57.8 58.8 60.3 60.7 57.9 61.5 72.1 64.1
Exports to GMS (%) 28.7 21.8 13.6 11.6 16.5 19.2 32.8 36.5 38.7 48.3 55.6 57.1 55.7 62.5 57.5 58.5 59.2 59.1 63.8 81.2 67.0
Imports from GMS (%) 39.4 31.1 32.8 35.1 35.2 36.7 35.1 39.7 46.8 50.2 51.4 56.7 53.4 52.8 60.0 61.5 61.8 57.2 60.2 62.3 62.3
GMS = Greater Mekong Subregion. Intraregional trade share = (Tii/Ti) x 100 where Tii is intraregional trade, i.e., exports of region i to region i plus imports of region i from region i; and Ti =total exports of region i to the world plus total imports of region i from the world. Intra-GMS trade is Tii. Exports to GMS (%)=Total exports to GMS/Total exports to the world. Imports from GMS (%)=Total imports from GMS/Total imports from the world. Source: GMS Secretariat estimates using data from UNCOMTRADE. https://comtrade.un.org (accessed May 2017).
GMS = Greater Mekong Subregion.Source: GMS Secretariat estimates using data from UNCOMTRADE. https://comtrade.un.org (accessed May 2017).
Figure 4.7: Intra-GMS Trade—Myanmar
$ bi
llion
40
25
3035
105
1520
0
% sh
are
80
70
30
40
60
50
20
Intra-GMS trade ($ billion)
1995 1996 1997 1998 1999 2000 2001 2002 2003 2004 2005 2006 2007 2008 2009 2010 2011 2012 2013 2014 2015
Trade share (%)
1.3 1.11.1 1.0 1.0 1.4 1.8 2.1 2.5 3.1 3.8 4.6 5.47.4 7.3
12.89.5
14.0
18.4
22.8
33.6

04 | Bilateral Trade with G
reater Mekong Subregion
107
Figure 4.8: Trade with GMS—Myanmar
GMS = Greater Mekong Subregion.Exports to GMS (%)=Total exports to GMS/Total exports to the world. Imports from GMS (%)=Total imports from GMS/Total imports from the world. Source: GMS Secretariat estimates using data from UNCOMTRADE. https://comtrade.un.org (accessed May 2017).
Perc
ent
100
60
80
20
40
0
Exports to GMS Imports from GMS
1995 1996 1997 1998 1999 2000 2001 2002 2003 2004 2005 2006 2007 2008 2009 2010 2011 2012 2013 2014 2015

108
STATISTICS ON
GRO
WTH
, ENERG
Y, AN
D BILATERA
L TRAD
E IN TH
E GREATER M
EKON
G SU
BREGIO
N
Table 4A 1.5: Trade with GMS—Thailand
Item 1995 1996 1997 1998 1999 2000 2001 2002 2003 2004 2005 2006 2007 2008 2009 2010 2011 2012 2013 2014 2015
Intra-GMS trade ($ million) 5,732 5,757 6,091 5,534 6,498 8,932 9,842 11,923 15,973 21,002 27,977 35,301 43,379 51,614 47,306 63,284 80,185 89,211 92,968 94,123 95,847
Total Exports to GMS ($ million) 3,144 3,492 3,440 3,370 3,591 4,890 4,893 5,739 8,556 10,879 13,880 17,902 22,465 26,046 25,570 33,870 43,002 44,107 46,224 45,770 45,234
Total Imports from GMS ($ million) 2,589 2,265 2,651 2,164 2,908 4,043 4,950 6,184 7,417 10,123 14,097 17,399 20,913 25,568 21,736 29,414 37,182 45,105 46,744 48,353 50,613
Intra-GMS trade share (%) 4.5 4.5 5.0 5.8 6.0 6.8 7.8 9.0 10.2 11.0 12.3 13.6 14.6 14.6 16.5 16.8 17.5 18.7 19.4 20.7 23.2
Exports to GMS (%) 5.6 6.3 5.9 6.3 6.1 7.1 7.5 8.4 10.7 11.3 12.6 13.7 14.6 14.8 16.8 17.3 18.8 19.2 20.2 20.1 21.4
Imports from GMS (%) 3.7 3.1 4.2 5.1 5.8 6.5 8.0 9.6 9.8 10.7 11.9 13.5 14.5 14.3 16.2 16.1 16.3 18.2 18.6 21.2 25.1
GMS = Greater Mekong Subregion.Intraregional trade share = (Tii/Ti) x 100 where Tii is intraregional trade, i.e., exports of region i to region i plus imports of region i from region i; and Ti =total exports of region i to the world plus total imports of region i from the world. Intra-GMS trade is Tii. Exports to GMS (%)=Total exports to GMS/Total exports to the world. Imports from GMS (%)=Total imports from GMS/Total imports from the world. Source: GMS Secretariat estimates using data from UNCOMTRADE. https://comtrade.un.org (accessed May 2017).
GMS = Greater Mekong Subregion.Source: GMS Secretariat estimates using data from UNCOMTRADE. https://comtrade.un.org (accessed May 2017).
Figure 4.9: Intra-GMS Trade—Thailand
$ bi
llion
120
80
100
20
40
60
0
% sh
are
25
20
5
10
15
0
Intra-GMS trade ($ billion)
1995 1996 1997 1998 1999 2000 2001 2002 2003 2004 2005 2006 2007 2008 2009 2010 2011 2012 2013 2014 2015
Trade share (%)
5.7 5.8 6.1 6.55.5 8.9 9.8 11.9 16.021.0
28.035.3
43.451.6 47.3
63.3
95.8
80.289.2 93.0 94.1

04 | Bilateral Trade with G
reater Mekong Subregion
109
Figure 4.10: Trade with GMS—Thailand
GMS = Greater Mekong Subregion.Exports to GMS (%)=Total exports to GMS/Total exports to the world. Imports from GMS (%)=Total imports from GMS/Total imports from the world. Source: GMS Secretariat estimates using data from UNCOMTRADE. https://comtrade.un.org (accessed May 2017).
Perc
ent
30
20
25
5
10
15
0
Exports to GMS Imports from GMS
1995 1996 1997 1998 1999 2000 2001 2002 2003 2004 2005 2006 2007 2008 2009 2010 2011 2012 2013 2014 2015

110
STATISTICS ON
GRO
WTH
, ENERG
Y, AN
D BILATERA
L TRAD
E IN TH
E GREATER M
EKON
G SU
BREGIO
N
Table 4A 1.6: Trade with GMS—Viet Nam
Item 1995 1996 1997 1998 1999 2000 2001 2002 2003 2004 2005 2006 2007 2008 2009 2010 2011 2012 2013 2014 2015
Intra-GMS trade ($ million) 1,435 1,457 1,877 2,174 2,596 4,415 4,385 5,179 7,093 10,493 13,236 15,797 22,685 29,151 28,310 37,016 48,378 54,646 63,877 73,693 82,461
Total Exports to GMS ($ million) 558 547 818 811 1,149 2,056 1,892 1,931 2,498 3,815 4,659 4,970 5,739 7,703 7,918 10,539 16,153 18,716 19,411 21,432 23,084
Total Imports from GMS ($ million) 877 910 1,058 1,363 1,446 2,359 2,493 3,248 4,595 6,678 8,577 10,826 16,946 21,448 20,393 26,477 32,224 35,930 44,466 52,261 59,376
Intra-GMS trade share (%) 10.5 7.9 9.0 10.4 11.1 14.7 14.0 14.2 15.6 18.0 19.1 18.6 20.4 20.3 22.3 23.6 23.8 23.9 24.2 24.7 25.2
Exports to GMS (%) 10.2 7.5 8.9 8.7 10.0 14.2 12.6 11.6 12.4 14.4 14.4 12.5 11.8 12.3 13.9 14.6 16.7 16.3 14.7 14.3 14.2
Imports from GMS (%) 10.8 8.2 9.1 11.9 12.3 15.1 15.4 16.4 18.2 20.9 23.3 24.1 27.0 26.6 29.2 31.2 30.2 31.6 33.7 35.3 35.9
GMS = Greater Mekong Subregion.Intraregional trade share = (Tii/Ti) x 100 where Tii is intraregional trade, i.e., exports of region i to region i plus imports of region i from region i; and Ti =total exports of region i to the world plus total imports of region i from the world. Intra-GMS trade is Tii. Exports to GMS (%)=Total exports to GMS/Total exports to the world. Imports from GMS (%)=Total imports from GMS/Total imports from the world. Source: GMS Secretariat estimates using data from UNCOMTRADE. https://comtrade.un.org (accessed May 2017).
GMS = Greater Mekong Subregion.Source: GMS Secretariat estimates using data from UNCOMTRADE. https://comtrade.un.org (accessed May 2017).
Figure 4.11: Intra-GMS Trade—Viet Nam
$ bi
llion
100
60
80
20
40
0
% sh
are
30
25
10
15
20
5
Intra-GMS trade ($ billion)
1995 1996 1997 1998 1999 2000 2001 2002 2003 2004 2005 2006 2007 2008 2009 2010 2011 2012 2013 2014 2015
Trade share (%)
1.4 1.91.5 2.2 2.6 4.4 4.4 5.2 7.1 10.5 13.2 15.822.7
29.2 28.3
48.4
37.0
54.663.9
82.573.7

04 | Bilateral Trade with G
reater Mekong Subregion
111
Figure 4.12: Trade with GMS—Viet Nam
GMS = Greater Mekong Subregion.Exports to GMS (%)=Total exports to GMS/Total exports to the world. Imports from GMS (%)=Total imports from GMS/Total imports from the world. Source: GMS Secretariat estimates using data from UNCOMTRADE. https://comtrade.un.org (accessed May 2017).
Perc
ent
40
20
30
10
0
Exports to GMS Imports from GMS
1995 1996 1997 1998 1999 2000 2001 2002 2003 2004 2005 2006 2007 2008 2009 2010 2011 2012 2013 2014 2015


05Logistics and Trade Facilitation
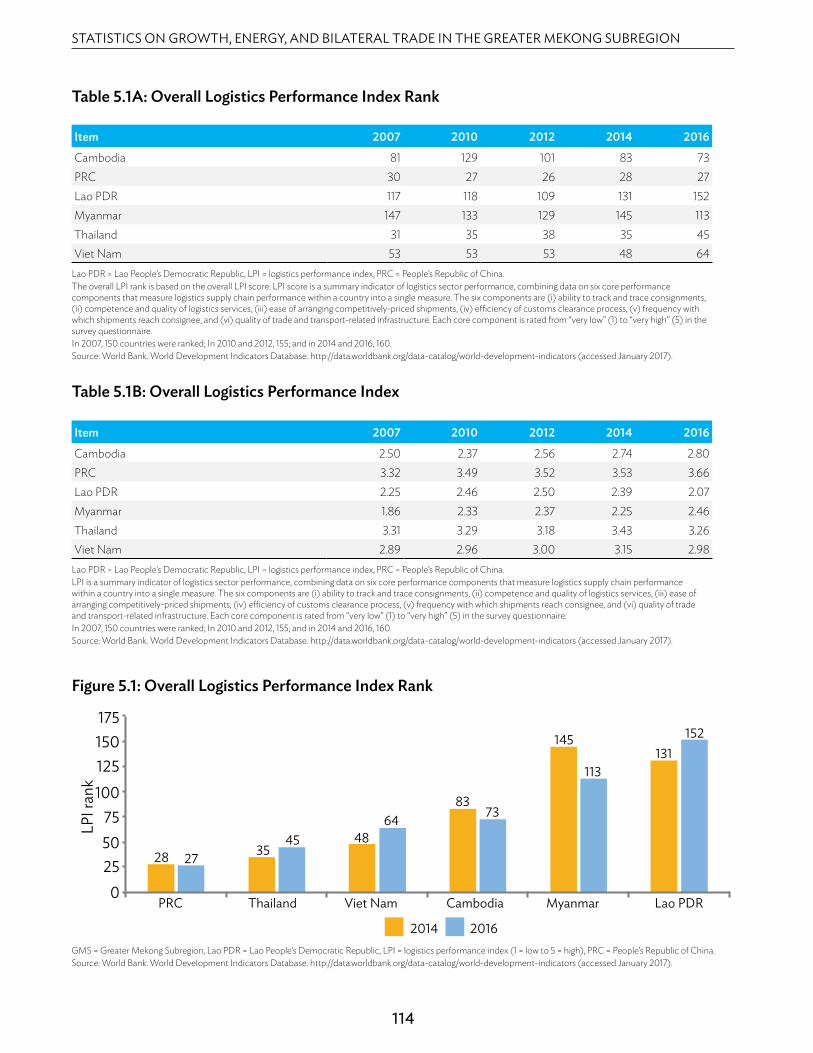
STATISTICS ON GROWTH, ENERGY, AND BILATERAL TRADE IN THE GREATER MEKONG SUBREGION
114
Table 5.1A: Overall Logistics Performance Index Rank
Table 5.1B: Overall Logistics Performance Index
Item 2007 2010 2012 2014 2016
Cambodia 81 129 101 83 73PRC 30 27 26 28 27Lao PDR 117 118 109 131 152Myanmar 147 133 129 145 113Thailand 31 35 38 35 45Viet Nam 53 53 53 48 64
Lao PDR = Lao People’s Democratic Republic, LPI = logistics performance index, PRC = People’s Republic of China.The overall LPI rank is based on the overall LPI score. LPI score is a summary indicator of logistics sector performance, combining data on six core performance components that measure logistics supply chain performance within a country into a single measure. The six components are (i) ability to track and trace consignments, (ii) competence and quality of logistics services, (iii) ease of arranging competitively-priced shipments, (iv) efficiency of customs clearance process, (v) frequency with which shipments reach consignee, and (vi) quality of trade and transport-related infrastructure. Each core component is rated from “very low” (1) to “very high” (5) in the survey questionnaire. In 2007, 150 countries were ranked; In 2010 and 2012, 155; and in 2014 and 2016, 160.Source: World Bank. World Development Indicators Database. http://data.worldbank.org/data-catalog/world-development-indicators (accessed January 2017).
Item 2007 2010 2012 2014 2016
Cambodia 2.50 2.37 2.56 2.74 2.80PRC 3.32 3.49 3.52 3.53 3.66Lao PDR 2.25 2.46 2.50 2.39 2.07Myanmar 1.86 2.33 2.37 2.25 2.46Thailand 3.31 3.29 3.18 3.43 3.26Viet Nam 2.89 2.96 3.00 3.15 2.98
Lao PDR = Lao People’s Democratic Republic, LPI = logistics performance index, PRC = People’s Republic of China.LPI is a summary indicator of logistics sector performance, combining data on six core performance components that measure logistics supply chain performance within a country into a single measure. The six components are (i) ability to track and trace consignments, (ii) competence and quality of logistics services, (iii) ease of arranging competitively-priced shipments, (iv) efficiency of customs clearance process, (v) frequency with which shipments reach consignee, and (vi) quality of trade and transport-related infrastructure. Each core component is rated from “very low” (1) to “very high” (5) in the survey questionnaire.In 2007, 150 countries were ranked; In 2010 and 2012, 155; and in 2014 and 2016, 160.Source: World Bank. World Development Indicators Database. http://data.worldbank.org/data-catalog/world-development-indicators (accessed January 2017).
LPI r
ank
175150125
75100
2550
0Viet Nam MyanmarPRC
28 27 3545 48
6483
73
145
113131
152
Thailand Cambodia Lao PDR
2014 2016GMS = Greater Mekong Subregion, Lao PDR = Lao People’s Democratic Republic, LPI = logistics performance index (1 = low to 5 = high), PRC = People’s Republic of China.Source: World Bank. World Development Indicators Database. http://data.worldbank.org/data-catalog/world-development-indicators (accessed January 2017).
Figure 5.1: Overall Logistics Performance Index Rank
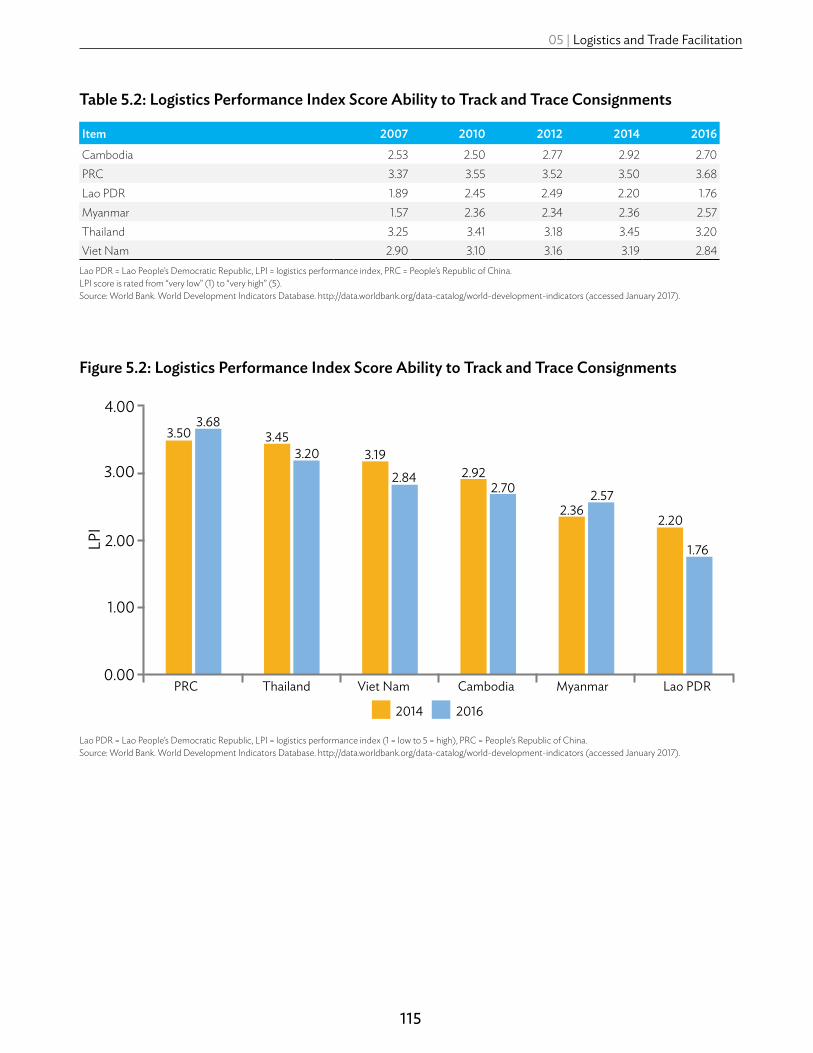
05 | Logistics and Trade Facilitation
115
Table 5.2: Logistics Performance Index Score Ability to Track and Trace Consignments
Item 2007 2010 2012 2014 2016
Cambodia 2.53 2.50 2.77 2.92 2.70PRC 3.37 3.55 3.52 3.50 3.68Lao PDR 1.89 2.45 2.49 2.20 1.76Myanmar 1.57 2.36 2.34 2.36 2.57Thailand 3.25 3.41 3.18 3.45 3.20Viet Nam 2.90 3.10 3.16 3.19 2.84
Lao PDR = Lao People’s Democratic Republic, LPI = logistics performance index, PRC = People’s Republic of China.LPI score is rated from “very low” (1) to “very high” (5). Source: World Bank. World Development Indicators Database. http://data.worldbank.org/data-catalog/world-development-indicators (accessed January 2017).
Lao PDR = Lao People’s Democratic Republic, LPI = logistics performance index (1 = low to 5 = high), PRC = People’s Republic of China.Source: World Bank. World Development Indicators Database. http://data.worldbank.org/data-catalog/world-development-indicators (accessed January 2017).
Figure 5.2: Logistics Performance Index Score Ability to Track and Trace Consignments
LPI
4.00
3.00
1.00
2.00
0.00Viet Nam MyanmarPRC
3.503.68
3.453.20 3.19
2.84 2.922.70
2.362.57
1.76
2.20
Thailand Cambodia Lao PDR
2014 2016

STATISTICS ON GROWTH, ENERGY, AND BILATERAL TRADE IN THE GREATER MEKONG SUBREGION
116
Table 5.3: Logistics Performance Index Score Competence and Quality of Logistics Services
Item 2007 2010 2012 2014 2016
Cambodia 2.47 2.29 2.50 2.67 2.60PRC 3.40 3.49 3.47 3.46 3.62Lao PDR 2.29 2.14 2.49 2.31 2.10Myanmar 2.00 2.01 2.42 2.07 2.36Thailand 3.31 3.16 2.98 3.29 3.14Viet Nam 2.80 2.89 2.68 3.09 2.88
Lao PDR = Lao People’s Democratic Republic, LPI = logistics performance index, PRC = People’s Republic of China.LPI score is rated from “very low” (1) to “very high” (5). Source: World Bank. World Development Indicators Database. http://data.worldbank.org/data-catalog/world-development-indicators (accessed January 2017).
Lao PDR = Lao People’s Democratic Republic, LPI = logistics performance index (1 = low to 5 = high), PRC = People’s Republic of China.Source: World Bank. World Development Indicators Database. http://data.worldbank.org/data-catalog/world-development-indicators (accessed January 2017).
Figure 5.3: Logistics Performance Index Score Competence and Quality of Logistics Services
LPI
4.00
3.00
1.00
2.00
0.00Viet Nam MyanmarPRC
3.463.62
3.293.14 3.09
2.882.67 2.60
2.072.36
2.102.31
Thailand Cambodia Lao PDR
2014 2016

05 | Logistics and Trade Facilitation
117
Table 5.4: Logistics Performance Index Score Ease of Arranging Competitively-Priced Shipments
Item 2007 2010 2012 2014 2016
Cambodia 2.47 2.19 2.61 2.83 3.11PRC 3.31 3.31 3.46 3.50 3.70Lao PDR 2.40 2.70 2.40 2.50 2.18Myanmar 1.73 2.37 2.47 2.14 2.23Thailand 3.24 3.27 3.21 3.30 3.37Viet Nam 3.00 3.04 3.14 3.22 3.12
Lao PDR = Lao People’s Democratic Republic, LPI = logistics performance index, PRC = People’s Republic of China.LPI score is rated from “very low” (1) to “very high” (5). Source: World Bank. World Development Indicators Database. http://data.worldbank.org/data-catalog/world-development-indicators (accessed January 2017).
Lao PDR = Lao People’s Democratic Republic, LPI = logistics performance index (1 = low to 5 = high), PRC = People’s Republic of China.Source: World Bank. World Development Indicators Database. http://data.worldbank.org/data-catalog/world-development-indicators (accessed January 2017).
Figure 5.4: Logistics Performance Index Score Ease of Arranging Competitively-Priced Shipments
LPI
4.00
3.00
1.00
2.00
0.00 Viet Nam MyanmarPRC
3.503.70
3.30 3.373.22 3.12
2.833.11
2.502.18 2.232.14
Thailand Cambodia Lao PDR
2014 2016

STATISTICS ON GROWTH, ENERGY, AND BILATERAL TRADE IN THE GREATER MEKONG SUBREGION
118
Table 5.5: Logistics Performance Index Score Efficiency of Customs Clearance Process
Item 2007 2010 2012 2014 2016
Cambodia 2.19 2.28 2.30 2.67 2.62PRC 2.99 3.16 3.25 3.21 3.32Lao PDR 2.08 2.17 2.38 2.45 1.85Myanmar 2.07 1.94 2.24 1.97 2.43Thailand 3.03 3.02 2.96 3.21 3.11Viet Nam 2.89 2.68 2.65 2.81 2.75
Lao PDR = Lao People’s Democratic Republic, LPI = logistics performance index, PRC = People’s Republic of China.LPI score is rated from “very low” (1) to “very high” (5). Source: World Bank. World Development Indicators Database. http://data.worldbank.org/data-catalog/world-development-indicators (accessed January 2017).
Lao PDR = Lao People’s Democratic Republic, LPI = logistics performance index (1 = low to 5 = high), PRC = People’s Republic of China.Source: World Bank. World Development Indicators Database. http://data.worldbank.org/data-catalog/world-development-indicators (accessed January 2017).
Figure 5.5: Logistics Performance Index Score Efficiency of Customs Clearance Process
LPI
4.00
3.00
1.00
2.00
0.00 Viet Nam MyanmarPRC
3.21 3.32 3.21 3.112.81 2.75 2.67 2.62
2.45
1.85
2.43
1.97
Thailand Cambodia Lao PDR
2014 2016

05 | Logistics and Trade Facilitation
119
Table 5.6: Logistics Performance Index Score Frequency with which Shipments Reach Consignee
Item 2007 2010 2012 2014 2016
Cambodia 3.05 2.84 2.95 2.75 3.30PRC 3.68 3.91 3.80 3.87 3.90Lao PDR 2.83 3.23 2.82 2.65 2.68Myanmar 2.08 3.29 2.59 2.83 2.85Thailand 3.91 3.73 3.63 3.96 3.56Viet Nam 3.22 3.44 3.64 3.49 3.50
Lao PDR = Lao People’s Democratic Republic, LPI = logistics performance index, PRC = People’s Republic of China.LPI score is rated from “very low” (1) to “very high” (5). Source: World Bank. World Development Indicators Database. http://data.worldbank.org/data-catalog/world-development-indicators (accessed January 2017).
Lao PDR = Lao People’s Democratic Republic, LPI = logistics performance index (1 = low to 5 = high), PRC = People’s Republic of China.Source: World Bank. World Development Indicators Database. http://data.worldbank.org/data-catalog/world-development-indicators (accessed January 2017).
Figure 5.6: Logistics Performance Index Score Frequency with which Shipments Reach Consignee
LPI
5.00
4.00
3.00
1.00
2.00
0.00Viet Nam MyanmarPRC
3.963.56
3.87 3.903.49 3.50
2.75
3.30
2.83 2.85 2.682.65
Thailand Cambodia Lao PDR
2014 2016

STATISTICS ON GROWTH, ENERGY, AND BILATERAL TRADE IN THE GREATER MEKONG SUBREGION
120
Table 5.7: Logistics Performance Index Score Quality of Trade and Transport-Related Infrastructure
Item 2007 2010 2012 2014 2016
Cambodia 2.30 2.12 2.20 2.58 2.36PRC 3.20 3.54 3.61 3.67 3.75Lao PDR 2.00 1.95 2.40 2.21 1.76Myanmar 1.69 1.92 2.10 2.14 2.33Thailand 3.16 3.16 3.08 3.40 3.12Viet Nam 2.50 2.56 2.68 3.11 2.70
Lao PDR = Lao People’s Democratic Republic, LPI = logistics performance index, PRC = People’s Republic of China.LPI score is rated from “very low” (1) to “very high” (5). Source: World Bank. World Development Indicators Database. http://data.worldbank.org/data-catalog/world-development-indicators (accessed January 2017).
Lao PDR = Lao People’s Democratic Republic, LPI = logistics performance index (1 = low to 5 = high), PRC = People’s Republic of China.Source: World Bank. World Development Indicators Database. http://data.worldbank.org/data-catalog/world-development-indicators (accessed January 2017).
Figure 5.7: Logistics Performance Index Score Quality of Trade and Transport-Related Infrastructure
LPI
4.00
3.00
1.00
2.00
0.00Viet Nam MyanmarPRC
3.67 3.75
3.403.12 3.11
2.70 2.582.36
2.142.33
1.76
2.21
Thailand Cambodia Lao PDR
2014 2016
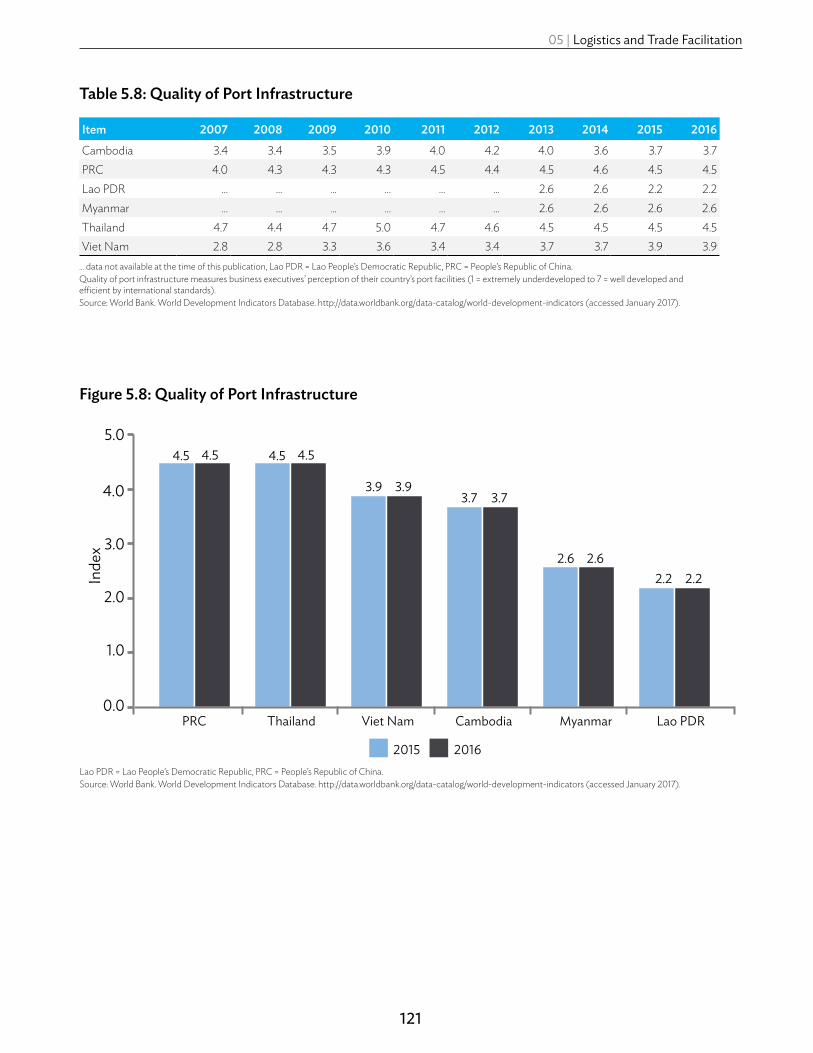
05 | Logistics and Trade Facilitation
121
Table 5.8: Quality of Port Infrastructure
Item 2007 2008 2009 2010 2011 2012 2013 2014 2015 2016
Cambodia 3.4 3.4 3.5 3.9 4.0 4.2 4.0 3.6 3.7 3.7PRC 4.0 4.3 4.3 4.3 4.5 4.4 4.5 4.6 4.5 4.5Lao PDR … … … … … … 2.6 2.6 2.2 2.2Myanmar … … … … … … 2.6 2.6 2.6 2.6Thailand 4.7 4.4 4.7 5.0 4.7 4.6 4.5 4.5 4.5 4.5Viet Nam 2.8 2.8 3.3 3.6 3.4 3.4 3.7 3.7 3.9 3.9
… data not available at the time of this publication, Lao PDR = Lao People’s Democratic Republic, PRC = People’s Republic of China.Quality of port infrastructure measures business executives’ perception of their country’s port facilities (1 = extremely underdeveloped to 7 = well developed and efficient by international standards).Source: World Bank. World Development Indicators Database. http://data.worldbank.org/data-catalog/world-development-indicators (accessed January 2017).
Lao PDR = Lao People’s Democratic Republic, PRC = People’s Republic of China.Source: World Bank. World Development Indicators Database. http://data.worldbank.org/data-catalog/world-development-indicators (accessed January 2017).
Figure 5.8: Quality of Port Infrastructure
Inde
x
5.0
4.0
1.0
2.0
3.0
0.0Viet Nam MyanmarPRC
4.5 4.5 4.5 4.5
3.9 3.93.7 3.7
2.6 2.62.2 2.2
Thailand Cambodia Lao PDR
2015 2016
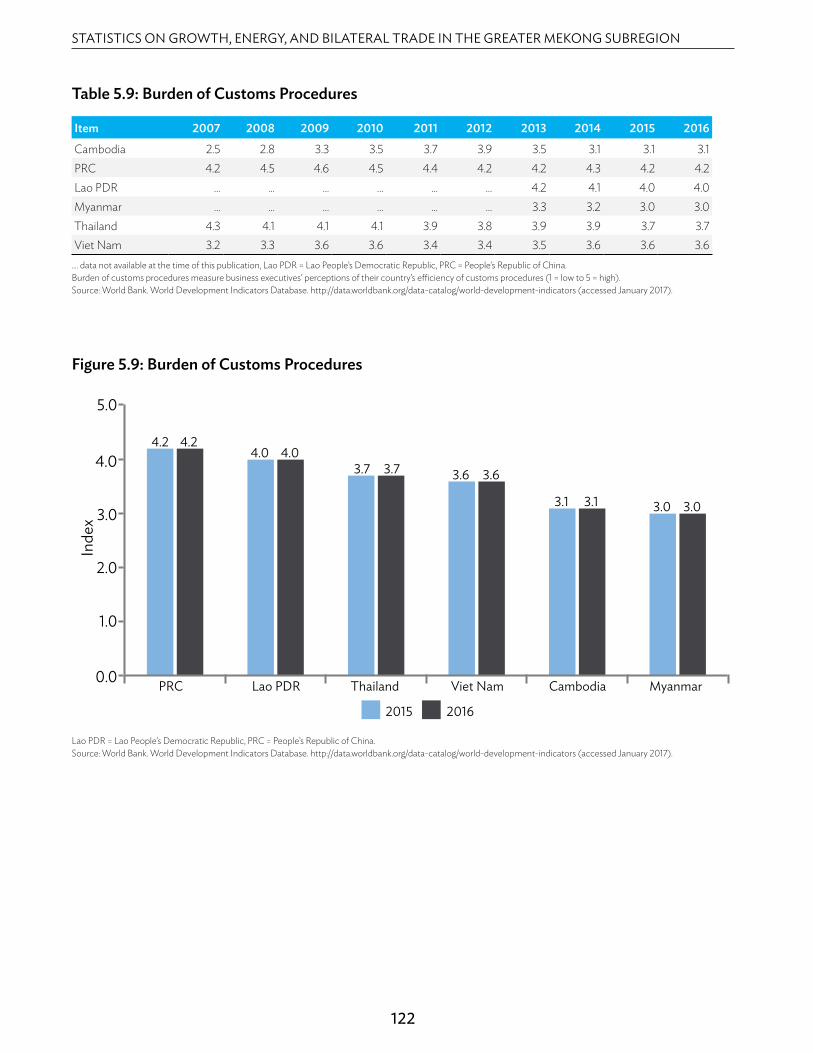
STATISTICS ON GROWTH, ENERGY, AND BILATERAL TRADE IN THE GREATER MEKONG SUBREGION
122
Table 5.9: Burden of Customs Procedures
Item 2007 2008 2009 2010 2011 2012 2013 2014 2015 2016
Cambodia 2.5 2.8 3.3 3.5 3.7 3.9 3.5 3.1 3.1 3.1PRC 4.2 4.5 4.6 4.5 4.4 4.2 4.2 4.3 4.2 4.2Lao PDR … … … … … … 4.2 4.1 4.0 4.0Myanmar … … … … … … 3.3 3.2 3.0 3.0Thailand 4.3 4.1 4.1 4.1 3.9 3.8 3.9 3.9 3.7 3.7Viet Nam 3.2 3.3 3.6 3.6 3.4 3.4 3.5 3.6 3.6 3.6
.... data not available at the time of this publication, Lao PDR = Lao People’s Democratic Republic, PRC = People’s Republic of China.Burden of customs procedures measure business executives’ perceptions of their country’s efficiency of customs procedures (1 = low to 5 = high).Source: World Bank. World Development Indicators Database. http://data.worldbank.org/data-catalog/world-development-indicators (accessed January 2017).
Lao PDR = Lao People’s Democratic Republic, PRC = People’s Republic of China.Source: World Bank. World Development Indicators Database. http://data.worldbank.org/data-catalog/world-development-indicators (accessed January 2017).
Figure 5.9: Burden of Customs Procedures
Inde
x
5.0
4.0
1.0
2.0
3.0
0.0 Viet Nam MyanmarPRC
4.2 4.24.0 4.0
3.7 3.7 3.6 3.6
3.1 3.1 3.0 3.0
Thailand CambodiaLao PDR
2015 2016

05 | Logistics and Trade Facilitation
123
Table 5.10: OECD Trade Facilitation Indicators
Cambodia PRC Lao PDR Myanmar Thailand Viet Nam
Item 2012 2015 2012 2015 2015 2015 2012 2015 2012 2015
Advance Rulings a 0.00 1.29 1.50 1.43 0.00 0.00 1.29 1.29 0.33 1.57Appeal Procedures b 0.86 0.50 1.71 1.13 0.63 0.50 1.88 1.75 1.71 1.75Cooperation (External) c … … … 1.00 1.50 1.00 1.67 1.75 … 0.75Cooperation (Internal) d 0.50 1.00 1.00 1.00 1.00 1.50 1.50 2.00 0.50 1.33Fee and Charges e 1.00 1.00 2.00 1.75 0.00 0.50 1.25 1.25 0.00 1.00Formalities (Automation) f 0.75 0.75 1.25 1.75 0.25 0.25 1.50 1.75 0.75 1.25Formalities (Documents) g 0.60 0.33 1.17 0.83 0.40 0.40 1.67 1.33 1.17 1.00Formalities (Procedures) h 1.08 1.13 1.29 1.50 1.13 0.88 1.67 1.67 0.54 1.31Governance and Impartiality i 1.33 0.86 1.86 1.57 1.29 1.00 1.86 1.57 1.83 1.63Information Availability j 1.50 1.40 1.86 1.80 1.00 1.20 1.90 1.90 1.50 1.80Involvement of the Trade Community k 0.50 1.00 1.50 1.75 0.25 0.50 2.00 1.50 2.00 1.00
.... data not available at the time of this publication, Lao PDR = Lao People’s Democratic Republic, OECD = Organisation for Economic Co-operation and Development, PRC = People’s Republic of China. The OECD trade facilitation indicators cover the full spectrum of border procedures, from advance rulings to transit guarantees, for 163 countries across income levels, geographical regions, and developing stages. The trade facilitation indicators take values from 0 to 2, where 2 represents the best performance that can be achieved.
a Advance rulings - prior statements by the administration to requesting traders concerning the classification, origin, valuation method, etc., applied to specific goods at the time of importation, and the rules and process applied to such statements.
b Appeal Procedures - the possibility and modalities to appeal administrative decisions by border agencies. c Cooperation (External) - cooperation with neighboring and third countries. d Cooperation (Internal) - cooperation between various border agencies of the country, control delegation to customs authorities. e Fees and charges disciplines on the fees and charges imposed on imports and exports. f Formalities (Automation) - electronic exchange of data, automated border procedures, use of risk management.g Formalities (Documents) - simplification of trade documents, harmonization in accordance with international standards, acceptance of copies.h Formalities (Procedures) - streamlining of border controls, single submission points for all required documentation (single windows), post-clearance audits,
authorized economic operators.i Governance and impartiality - customs structures and functions, accountability, ethics policy. j Information availability - publication of trade information, including on internet, inquiry points. k Involvement of the trade community - consultations with traders.
Source: Organisation for Economic Co-operation and Development.

STATISTICS ON GROWTH, ENERGY, AND BILATERAL TRADE IN THE GREATER MEKONG SUBREGION
124
2 01 2 2 01 5
Governanceand
ImpartialityInformationAvailability
Involvement ofthe TradeCommunity
AdvanceRuling s
AppealProcedures
Fee andCharg es
Formalities(Documents )
Formalities(Automation)
Formalities(Procedures )
Cooperation(Internal)
Cooperation(Ex ternal)
0
1
2
2 01 2 2 01 5
Governanceand
ImpartialityInformationAvailability
Involvement ofthe TradeCommunity
AdvanceRulings
AppealProcedures
Fee andCharg es
Formalities(Documents )
Formalities(Automation)
Formalities(Procedures )
Cooperation(Internal)
Cooperation(Ex ternal)
0
1
2
2 0 15
Governanceand
ImpartialityInformationAvailability
Involvement ofthe TradeCommunity
AdvanceRulings
AppealProcedures
Fee andCharges
Formalities(Documents )
Formalities(Automation)
Formalities(Procedures )
Cooperation(Internal)
Cooperation(Ex ternal)
0
1
2
2 0 15
Governanceand
ImpartialityInformationAvailability
Involvement ofthe TradeCommunity
AdvanceRulings
AppealProcedures
Fee andCharges
Formalities(Documents )
Formalities(Automation)
Formalities(Procedures )
Cooperation(Internal)
Cooperation(Ex ternal)
0
1
2
Figure 5.10A: OECD Trade Facilitation Indicators—Cambodia
Figure 5.10C: OECD Trade Facilitation Indicators—Lao PDR
Figure 5.10B: OECD Trade Facilitation Indicators—PRC
Figure 5.10D: OECD Trade Facilitation Indicators—Myanmar

05 | Logistics and Trade Facilitation
125
Figure 5.10E: OECD Trade Facilitation Indicators—Thailand
Figure 5.10F: OECD Trade Facilitation Indicators—Viet Nam
Lao PDR = Lao People’s Democratic Republic, OECD = Organisation for Economic Co-operation, PRC = People’s Republic of China.Source: Organisation for Economic Co-operation and Development.
20 12 2 0 15
Governanceand
ImpartialityInformationAvailability
Involvement ofthe TradeCommunity
AdvanceRulings
AppealProcedures
Fee andCharges
Formalities(Documents )
Formalities(Automation)
Formalities(Procedures )
Cooperation(Internal)
Cooperation(Ex ternal)
0
1
2
2 0 12 2 0 15
Governanceand
ImpartialityInformationAvailability
Involvement ofthe TradeCommunity
AdvanceRulings
AppealProcedures
Fee andCharges
Formalities(Documents )
Formalities(Automation)
Formalities(Procedures )
Cooperation(Internal)
Cooperation(Ex ternal)
0
1
2


06Doing Business

STATISTICS ON GROWTH, ENERGY, AND BILATERAL TRADE IN THE GREATER MEKONG SUBREGION
128
Table 6.1: Ease of Doing Business Rank
Item 2015 2016
Cambodia 128 131People's Republic of China 80 78Lao People's Democratic Republic 136 139Myanmar 171 170Thailand 46 46Viet Nam 91 82
Ease of doing business ranks economies from 1 to 190, with first place being the best. A high ranking (a low numerical rank) means that the regulatory environment is conducive to business operation. The index averages the country’s percentile rankings on 10 topics covered in the World Bank’s Doing Business. The ranking on each topic is the simple average of the percentile rankings on its component indicators.The ease of doing business rank is identical with the ease of doing business index. Rankings are calculated for the 2 most recent years. Year to year changes in the number of economies covered, number of indicators and methodology affect the comparability of prior years. Source: World Bank. World Development Indicators Database. http://data.worldbank.org/data-catalog/world-development-indicators (accessed January 2017).
Lao PDR = Lao People’s Democratic Republic, PRC = People’s Republic of China.Source: World Bank. World Development Indicators Database. http://data.worldbank.org/data-catalog/world-development-indicators (accessed January 2017).
Figure 6.1: Ease of Doing Business Rank
Rank
200
150
50
100
0Viet Nam MyanmarPRC
46 46
80 7891
82
128 131 136 139
171 170
Thailand Cambodia Lao PDR
2015 2016

06 | Doing Business
129
Table 6.2: Time Required to Start a Business (Days)
Item 2003 2004 2005 2006 2007 2008 2009 2010 2011 2012 2013 2014 2015 2016
Cambodia 95 95 87 86 86 102 102 102 102 102 101 101 87 99PRC 48 48 48 35 35 41 38 38 38 33 34 31 31 29Lao PDR 131 131 131 115 85 85 85 85 77 87 87 87 87 67Myanmar … … … … … … … … … 76 76 76 15 13Thailand 34 34 34 34 34 34 33 33 30 29 28 28 28 26Viet Nam 61 47 41 46 37 37 37 36 36 32 34 34 20 24
.... data not available at the time of this publication, Lao PDR = Lao People’s Democratic Republic, PRC = People’s Republic of China.Time required to start a business is the number of calendar days needed to complete the procedures to legally operate a business. If a procedure can be speeded up at additional cost, the fastest procedure, independent of cost, is chosen.Source: World Bank. World Development Indicators Database. http://data.worldbank.org/data-catalog/world-development-indicators (accessed January 2017).
Lao PDR = Lao People’s Democratic Republic, PRC = People’s Republic of China.Source: World Bank. World Development Indicators Database. http://data.worldbank.org/data-catalog/world-development-indicators (accessed January 2017).
Figure 6.2: Time Required to Start a Business (Days)
Day
s
100
125
25
50
75
0
2015 2016
8799
29
87
67
15 13
28 2620 24
31
Viet NamMyanmarPRC ThailandCambodia Lao PDR

130
STATISTICS ON
GRO
WTH
, ENERG
Y, AN
D BILATERA
L TRAD
E IN TH
E GREATER M
EKON
G SU
BREGIO
N
Table 6.3: Start-Up Procedures to Register a Business (Number)
Item 2003 2004 2005 2006 2007 2008 2009 2010 2011 2012 2013 2014 2015 2016
Cambodia 11 11 10 10 10 11 11 11 11 11 12 12 8 9PRC 13 13 13 13 13 14 14 14 14 13 13 11 11 9Lao PDR 9 9 9 10 10 10 10 10 9 8 8 8 8 8Myanmar … … … … … … … … … 14 14 14 13 11Thailand 9 9 9 9 9 9 8 8 7 6 6 6 6 5Viet Nam 11 10 10 10 10 10 10 9 9 9 9 9 9 9
.... data not available at the time of this publication, Lao PDR = Lao People’s Democratic Republic, PRC = People’s Republic of China.Start-up procedures are those required to start a business, including interactions to obtain necessary permits and licenses and to complete all inscriptions, verifications, and notifications to start operations. Data are for businesses with specific characteristics of ownership, size, and type of production.Source: World Bank. World Development Indicators Database. http://data.worldbank.org/data-catalog/world-development-indicators (accessed January 2017).
Lao PDR = Lao People’s Democratic Republic, PRC = People’s Republic of China.Source: World Bank. World Development Indicators Database. http://data.worldbank.org/data-catalog/world-development-indicators (accessed January 2017).
Figure 6.3: Start-Up Procedures to Register a Business (Number)
9 9
8
11
5
9
Num
ber
12.5
15
2.5
7.5
5
10
0
8
11
98 8
13
11
65
9 99
2015 2016
Viet NamMyanmarPRC ThailandCambodia Lao PDR

06 | Doing Business
131
Table 6.4: Time Required to Get Electricity (Days)Item 2009 2010 2011 2012 2013 2014 2015 2016
Cambodia 194 194 194 194 179 179 179 179PRC 145 145 145 145 143 143 143 143Lao PDR 134 134 134 134 134 134 134 134Myanmar .... .... .... 98 98 98 77 77Thailand 37 37 37 37 37 37 37 37Viet Nam 115 115 115 115 115 115 49 46
.... data not available at the time of this publication, Lao PDR = Lao People’s Democratic Republic, PRC = People’s Republic of China.Time required to get electricity is the number of days to obtain a permanent electricity connection. The measure captures the median duration that the electricity utility and experts indicate is necessary in practice, rather than required by law, to complete a procedure. Source: World Bank. World Development Indicators Database. http://data.worldbank.org/data-catalog/world-development-indicators (accessed January 2017).
Lao PDR = Lao People’s Democratic Republic, PRC = People’s Republic of China.Source: World Bank. World Development Indicators Database. http://data.worldbank.org/data-catalog/world-development-indicators (accessed January 2017).
Figure 6.4: Time Required to Get Electricity (Days)
Day
s
200
150
50
100
0Viet NamMyanmarPRC
179
143134
77
3746
ThailandCambodia Lao PDR
2016
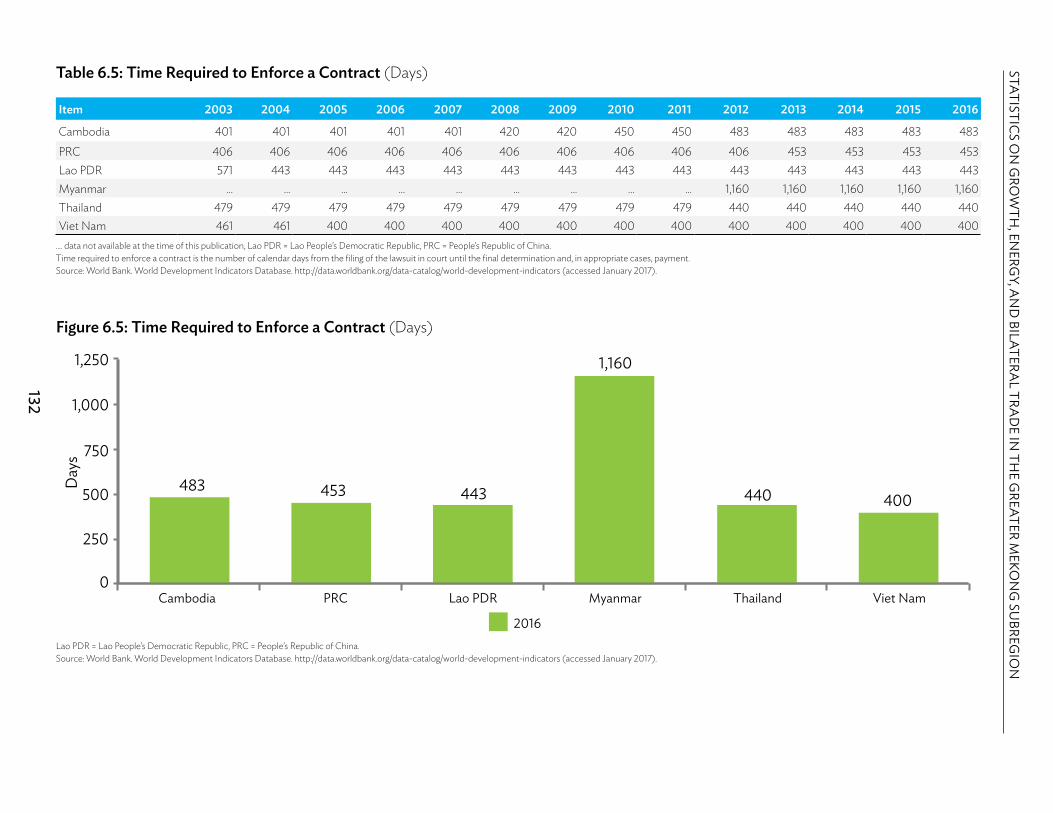
132
STATISTICS ON
GRO
WTH
, ENERG
Y, AN
D BILATERA
L TRAD
E IN TH
E GREATER M
EKON
G SU
BREGIO
N
Table 6.5: Time Required to Enforce a Contract (Days)
Item 2003 2004 2005 2006 2007 2008 2009 2010 2011 2012 2013 2014 2015 2016
Cambodia 401 401 401 401 401 420 420 450 450 483 483 483 483 483PRC 406 406 406 406 406 406 406 406 406 406 453 453 453 453Lao PDR 571 443 443 443 443 443 443 443 443 443 443 443 443 443Myanmar … … … … … … … … … 1,160 1,160 1,160 1,160 1,160Thailand 479 479 479 479 479 479 479 479 479 440 440 440 440 440Viet Nam 461 461 400 400 400 400 400 400 400 400 400 400 400 400
.... data not available at the time of this publication, Lao PDR = Lao People’s Democratic Republic, PRC = People’s Republic of China.Time required to enforce a contract is the number of calendar days from the filing of the lawsuit in court until the final determination and, in appropriate cases, payment. Source: World Bank. World Development Indicators Database. http://data.worldbank.org/data-catalog/world-development-indicators (accessed January 2017).
Lao PDR = Lao People’s Democratic Republic, PRC = People’s Republic of China.Source: World Bank. World Development Indicators Database. http://data.worldbank.org/data-catalog/world-development-indicators (accessed January 2017).
Figure 6.5: Time Required to Enforce a Contract (Days)
Day
s
1,000
1,250
250
750
500
0
483 453 443
1,160
440 400
2016
Viet NamMyanmarPRC ThailandCambodia Lao PDR

06 | Doing Business
133
Table 6.6: Documents Required for Export (Number)
Item 2005 2006 2007 2008 2009 2010 2011 2012 2013 2014
Cambodia 6.0 9.0 9.0 9.0 9.0 8.0 8.0 8.0 8.0 8.0PRC 4.4 4.4 4.4 4.4 4.4 4.4 4.4 4.4 4.4 4.4Lao PDR 12.0 12.0 10.0 10.0 10.0 10.0 10.0 10.0 10.0 10.0Myanmar … … … … … … … … … …Thailand 9.0 9.0 7.0 5.0 5.0 5.0 5.0 5.0 5.0 5.0Viet Nam 5.0 5.0 5.0 5.0 5.0 5.0 5.0 5.0 5.0 5.0
.... data not available at the time of this publication, Lao PDR = Lao People’s Democratic Republic, PRC = People’s Republic of China.All documents required per shipment to export goods are recorded. Documents required for clearance by government ministries, customs authorities, port and container terminal authorities, health and technical control agencies and banks are taken into account. It is assumed that the contract has already been agreed upon and signed by both parties. Payment documents required by bank in issuing letter of credit are included but documents renewed annually that do not required renewal shipments are not included. Source: World Bank. World Development Indicators Database. http://data.worldbank.org/data-catalog/world-development-indicators (accessed January 2017).
Table 6.7: Documents Required to Import (Number)
Item 2005 2006 2007 2008 2009 2010 2011 2012 2013 2014
Cambodia 11.0 10.0 10.0 10.0 10.0 9.0 9.0 9.0 9.0 9.0PRC 3.3 3.3 3.3 3.3 2.8 2.8 2.8 2.8 2.8 2.8Lao PDR 15.0 15.0 10.0 10.0 10.0 10.0 10.0 10.0 10.0 10.0Myanmar ... ... ... ... ... ... ... ... ... ...Thailand 12.0 12.0 9.0 5.0 5.0 5.0 5.0 5.0 5.0 5.0Viet Nam 8.0 8.0 8.0 8.0 8.0 8.0 8.0 8.0 8.0 8.0
.... data not available at the time of this publication, Lao PDR = Lao People’s Democratic Republic, PRC = People’s Republic of China.All documents required per shipment to import goods are recorded. Documents required for clearance by government ministries, customs authorities, port and container terminal authorities, health and technical control agencies, and banks are taken into account. It is assumed that the contract has already been agreed upon and signed by both parties. Payment documents required by bank in issuing letter of credit are included but documents renewed annually that do not required renewal shipments are not included. Source: World Bank. World Development Indicators Database. http://data.worldbank.org/data-catalog/world-development-indicators (accessed January 2017).
Lao PDR = Lao People’s Democratic Republic, PRC = People’s Republic of China.Source: World Bank. World Development Indicators Database. http://data.worldbank.org/data-catalog/world-development-indicators (accessed January 2017).
Figure 6.6: Documents Required for Export and Import, 2014 (Number)
8.0
4.4
Cambodia
PRC
Lao PDR
Viet Nam
Thailand
2.8
5.0
10.010.0
8.0
5.0
5.0
9.0
0.0 1.0 2.0 3.0 4.0 5.0 6.0 7.0 8.0 9.0 10.0 11.0
Documents Required for Export Documents Required to Import
Number

STATISTICS ON GROWTH, ENERGY, AND BILATERAL TRADE IN THE GREATER MEKONG SUBREGION
134
Table 6.8: Time to Export (Days)
Item 2005 2006 2007 2008 2009 2010 2011 2012 2013 2014
Cambodia 43 37 37 22 22 22 22 22 22 22PRC 13 12 12 12 12 12 12 12 21 21Lao PDR 55 55 39 38 38 36 32 25 23 23Myanmar ... ... ... ... ... ... ... 25 25 20Thailand 24 24 17 14 14 14 14 14 14 14Viet Nam 24 24 24 24 22 22 22 21 21 21
.... data not available at the time of this publication, Lao PDR = Lao People’s Democratic Republic, PRC= People’s Republic of China.Time to export, in calendar days, is the time necessary to comply with all procedures required to export goods. The time calculation for a procedure starts from the moment it is initiated and runs until it is completed. If a procedure can be accelerated for an additional cost, the fastest legal procedure is chosen. It is assumed that neither the exporter nor the importer wastes time and that each commits to completing each remaining procedure without delay. Procedures that can be completed in parallel are measured as simultaneous. The waiting time between procedures - for example, during unloading of the cargo - is included in the measure.Source: World Bank. World Development Indicators Database. http://data.worldbank.org/data-catalog/world-development-indicators (accessed January 2017).
Table 6.9: Time to Import (Days)
Item 2005 2006 2007 2008 2009 2010 2011 2012 2013 2014
Cambodia 54 45 45 29 29 26 26 26 24 24PRC 14 13 13 13 13 13 13 13 24 24Lao PDR 65 65 37 37 37 37 33 26 26 26Myanmar … … … … … … … 27 27 22Thailand 22 22 14 13 13 13 13 13 13 13Viet Nam 23 23 23 23 21 21 21 21 21 21
.... data not available at the time of this publication, Lao PDR = Lao People’s Democratic Republic, PRC = People’s Republic of China.Time to import, in calendar days, is the time necessary to comply with all procedures required to import goods. The time calculation for a procedure starts from the moment it is initiated and runs until it is completed. If a procedure can be accelerated for an additional cost, the fastest legal procedure is chosen. It is assumed that neither the exporter nor the importer wastes time and that each commits to completing each remaining procedure without delay. Procedures that can be completed in parallel are measured as simultaneous. The waiting time between procedures—for example, during unloading of the cargo—is included in the measure.Source: World Bank. World Development Indicators Database. http://data.worldbank.org/data-catalog/world-development-indicators (accessed January 2017).
Lao PDR = Lao People’s Democratic Republic, PRC = People’s Republic of China.Source: World Bank. World Development Indicators Database. http://data.worldbank.org/data-catalog/world-development-indicators (accessed January 2017).
Figure 6.7: Time to Export and Import, 2014 (Days)
Cambodia
PRC
Lao PDR
Myanmar
Viet Nam
Thailand
2224
2423
26
2220
14
2121
13
21
0 2 4 6 8 10 12 14 16 18 20 22 24 26 28
Time to Export Time to Import
Days

06 | Doing Business
135
Table 6.10: Cost to Export ($ per container)
Item 2005 2006 2007 2008 2009 2010 2011 2012 2013 2014
Cambodia 736 722 722 732 732 732 732 755 795 795PRC 215 215 215 253 275 275 275 319 823 823Lao PDR 1,420 1,420 1,750 1,860 1,860 1,860 1,880 2,140 1,950 1,950Myanmar … … … … … … … 670 670 620Thailand 848 848 615 625 625 625 625 585 595 595Viet Nam 468 468 468 533 555 555 580 610 610 610
.... data not available at the time of this publication, Lao PDR = Lao People’s Democratic Republic, PRC = People’s Republic of China.Cost to export measures the fees levied on a 20-foot container in US dollars. All the fees associated with completing the procedures to export the goods are included. These include costs for documents, administrative fees for customs clearance and technical control, customs broker fees, terminal handling charges, and inland transport. The cost measure does not include tariffs or trade taxes. Only official costs are recorded. Source: World Bank. World Development Indicators Database. http://data.worldbank.org/data-catalog/world-development-indicators (accessed January 2017).
Table 6.11: Cost to Import ($ per container)
Item 2005 2006 2007 2008 2009 2010 2011 2012 2013 2014
Cambodia 816 852 852 872 872 872 872 900 930 930PRC 237 237 237 300 300 300 300 338 800 800Lao PDR 1,690 1,690 1,930 2,040 2,040 2,040 2,035 2,125 1,910 1,910Myanmar ... ... ... ... ... ... ... 660 660 610Thailand 1,042 1,042 786 795 795 795 750 750 760 760Viet Nam 586 586 586 606 645 645 670 600 600 600
.... data not available at the time of this publication, Lao PDR = Lao People’s Democratic Republic, PRC = People’s Republic of China.Cost to import measures the fees levied on a 20-foot container in US dollars. All the fees associated with completing the procedures to import the goods are included. These include costs for documents, administrative fees for customs clearance and technical control, customs broker fees, terminal handling charges, and inland transport. The cost measure does not include tariffs or trade taxes. Only official costs are recorded. Source: World Bank. World Development Indicators Database. http://data.worldbank.org/data-catalog/world-development-indicators (accessed January 2017).
Lao PDR = Lao People’s Democratic Republic, PRC = People’s Republic of China.Source: World Bank. World Development Indicators Database. http://data.worldbank.org/data-catalog/world-development-indicators (accessed January 2017).
Figure 6.8: Cost to Export and Import, 2014 ($ per container)
Cambodia
PRC
Lao PDR
Myanmar
Viet Nam
Thailand
795930
823800
620610
595760
610600
1,9501,910
0 200 400 600 800 1,000 1,200 1,400 1,600 1,800 2,000 2,200
Cost to Export Cost to Import
$ per container

136
STATISTICS ON
GRO
WTH
, ENERG
Y, AN
D BILATERA
L TRAD
E IN TH
E GREATER M
EKON
G SU
BREGIO
N
Table 6.12: Time to Resolve Insolvency (Years)
Item 2003 2004 2005 2006 2007 2008 2009 2010 2011 2012 2013 2014 2015 2016
Cambodia 6.0 6.0 6.0 6.0 6.0 6.0 6.0 6.0 6.0 6.0 6.0 6.0 6.0 6.0PRC 2.4 2.4 2.4 2.4 1.7 1.7 1.7 1.7 1.7 1.7 1.7 1.7 1.7 1.7Myanmar .... .... .... .... .... .... .... .... .... 5.0 5.0 5.0 5.0 5.0Thailand 2.7 2.7 2.7 2.7 2.7 2.7 2.7 2.7 2.7 2.7 2.7 2.7 1.5 1.5Viet Nam 5.0 5.0 5.0 5.0 5.0 5.0 5.0 5.0 5.0 5.0 5.0 5.0 5.0 5.0
.... data not available at the time of this publication, PRC = People’s Republic of China.Time to resolve insolvency is the number of years from the filing for insolvency in court until the resolution of distressed assets. Source: World Bank. World Development Indicators Database. http://data.worldbank.org/data-catalog/world-development-indicators (accessed January 2017).
PRC = People’s Republic of China.Source: World Bank. World Development Indicators Database. http://data.worldbank.org/data-catalog/world-development-indicators (accessed January 2017).
Figure 6.9: Time to Resolve Insolvency (Years)
Year
s
6.0
7.0
1.0
5.0
4.0
3.0
2.0
0.0
6.0
1.7
5.0
1.5
5.0
2016
Viet NamMyanmarPRC ThailandCambodia

06 | Doing Business
137
Table 6.13A: Bilateral Trade Cost—Cambodia, Tariff and Nontariff (%)
Trading Partner 2000 2001 2002 2003 2004 2005 2006 2007 2008 2009 2010 2011 2012 2013 2014 2015
PRC 169 174 183 191 172 174 174 189 194 188 156 137 138 128 … …Lao PDR 290 309 271 258 255 305 251 261 313 283 242 244 218 228 264 156Thailand 108 121 121 115 109 113 113 117 121 113 83 78 88 76 94 66Viet Nam 107 108 98 93 86 86 79 80 87 82 66 56 60 52 … …
.... data not available at the time of this publication, Lao PDR = Lao People’s Democratic Republic, PRC = People’s Republic of China.Bilateral trade cost is a comprehensive measure of costs associated with both importing and exporting goods between two countries. The estimated trade cost is comprehensive: it includes all costs involved in trading goods internationally with another partner (i.e., bilaterally) relative to those involved in trading goods domestically (i.e., intranationally). It captures trade costs including not only tariffs and international transport costs, but also other trade cost components such as direct and indirect costs associated with differences in languages, currencies, as well as cumbersome import or export procedures. Trade cost is the ad valorem equivalent of measured trade cost in percent. The indicator can be used to find out the lowest trade cost partner of a given country. Source: ESCAP-World Bank Trade Cost Database. http://artnet.unescap.org/databases.html#first (accessed July 2017).
Table 6.13B: Bilateral Trade Cost—Cambodia, Nontariff (%)
Trading Partner 2000 2001 2002 2003 2004 2005 2006 2007 2008 2009 2010 2011 2012 2013 2014 2015
PRC … 130 145 153 137 143 146 159 163 158 140 123 124 124 … …Lao PDR … 220 215 179 195 273 226 233 276 248 204 206 181 204 254 149Thailand … 88 89 98 82 98 98 92 96 89 59 55 65 59 91 61Viet Nam … 76 71 66 66 71 64 70 77 73 53 45 50 48 … …
.... data not available at the time of this publication, Lao PDR = Lao People’s Democratic Republic, PRC = People’s Republic of China.Bilateral trade cost, nontariff includes all additional costs other than tariffs involved in trading goods bilaterally rather than domestically. Trade cost is the ad valorem equivalent of measured trade cost in percent. It is the most appropriate indicator to use when trade facilitation and logistics costs are the focus of analysis. Source: ESCAP-World Bank Trade Cost Database. http://artnet.unescap.org/databases.html#first (accessed July 2017).

138
STATISTICS ON
GRO
WTH
, ENERG
Y, AN
D BILATERA
L TRAD
E IN TH
E GREATER M
EKON
G SU
BREGIO
N
Lao PDR = Lao People’s Democratic Republic, PRC = People’s Republic of China.Source: ESCAP-World Bank Trade Cost Database. http://artnet.unescap.org/databases.html#first (accessed July 2017).
Figure 6.10: Bilateral Trade Cost—Cambodia, Tariff and Nontariff (%)
Perc
ent
350
300
200
250
50
100
150
0 2004 2005 20062000 2001 2002 2003 2007 2008 2009 2010 2011 2012 2013 20152014
PRC, tari and nontariPRC, nontari
Lao PDR, tari and nontariLao PDR, nontari
Thailand, tari and nontariThailand, nontari
Viet Nam, tari and nontariViet Nam, nontari

06 | Doing Business
139
Table 6.14A: Bilateral Trade Cost—PRC, Tariff and Nontariff (%)Trading Partner 1995 1996 1997 1998 1999 2000 2001 2002 2003 2004 2005 2006 2007 2008 2009 2010 2011 2012 2013
Cambodia … … … … … 169 174 183 191 172 174 174 189 194 188 156 137 138 128Lao PDR 206 220 231 223 219 213 201 197 187 192 181 163 164 163 155 143 137 129 114Thailand 111 120 114 111 113 102 99 97 91 85 82 80 81 83 84 79 74 75 76Viet Nam … … … … … 108 105 107 102 96 92 88 85 87 85 65 59 56 44
.... data not available at the time of this publication, Lao PDR = Lao People’s Democratic Republic, PRC = People’s Republic of China.Bilateral trade cost is a comprehensive measure of costs associated with both importing and exporting goods between two countries. The estimated trade cost is comprehensive: it includes all costs involved in trading goods internationally with another partner (i.e., bilaterally) relative to those involved in trading goods domestically (i.e., intranationally). It captures trade costs including not only tariffs and international transport costs, but also other trade cost components such as direct and indirect costs associated with differences in languages, currencies, as well as cumbersome import or export procedures. Trade cost is the ad valorem equivalent of measured trade cost in percent. The indicator can be used to find out the lowest trade cost partner of a given country. Source: ESCAP-World Bank Trade Cost Database. http://artnet.unescap.org/databases.html#first (accessed July 2017).
Table 6.14B: Bilateral Trade Cost—PRC, Nontariff (%)
Trading Partner 1996 1997 1998 1999 2000 2001 2002 2003 2004 2005 2006 2007 2008 2009 2010 2011 2012 2013
Cambodia … … … … … 130 145 153 137 143 146 159 163 158 140 123 124 124Lao PDR … … … … 177 161 168 162 163 157 142 145 145 137 130 125 117 103Thailand 78 78 76 65 71 70 71 68 67 64 63 66 69 72 70 65 67 67Viet Nam … … … … 79 76 81 77 73 71 67 68 72 73 58 53 51 41
.... data not available at the time of this publication, Lao PDR = Lao People’s Democratic Republic, PRC = People’s Republic of China.Bilateral trade cost, nontariff includes all additional costs other than tariffs involved in trading goods bilaterally rather than domestically. Trade cost is the ad valorem equivalent of measured trade cost in percent. It is the most appropriate indicator to use when trade facilitation and logistics costs are the focus of analysis. Source: ESCAP-World Bank Trade Cost Database. http://artnet.unescap.org/databases.html#first (accessed July 2017).

140
STATISTICS ON
GRO
WTH
, ENERG
Y, AN
D BILATERA
L TRAD
E IN TH
E GREATER M
EKON
G SU
BREGIO
N
Lao PDR = Lao People’s Democratic Republic, PRC = People’s Republic of China.Source: ESCAP-World Bank Trade Cost Database. http://artnet.unescap.org/databases.html#first (accessed July 2017).
Figure 6.11: Bilateral Trade Cost—PRC, Tariff and Nontariff (%)
Perc
ent
200
250
50
100
150
0 2004 2005 20062000 2001 2002 2003 2007 2008 2009 2010 2011 2012 201319961995 199919981997
Cambodia, tari� and nontari�Cambodia, nontari�
Lao PDR, tari� and nontari�Lao PDR, nontari�
Thailand, tari� and nontari�Thailand, nontari�
Viet Nam, tari� and nontari�Viet Nam, nontari�

06 | Doing Business
141
Table 6.15A: Bilateral Trade Cost—Lao PDR, Tariff and Nontariff (%)
Trading Partner 1995 1996 1997 1998 1999 2000 2001 2002 2003 2004 2005 2006 2007 2008 2009 2010 2011 2012 2013 2014 2015
Cambodia … … … … … 290 309 271 258 255 305 251 261 313 283 242 244 218 228 264 156PRC 206 220 231 223 219 213 201 197 187 192 181 163 164 163 155 143 137 129 114 … …Thailand 95 99 96 96 91 81 77 79 80 78 74 64 65 64 68 64 56 55 55 52 52Viet Nam … … … … … 83 91 92 99 94 95 85 86 86 86 72 61 58 46 … …
.... data not available at the time of this publication, Lao PDR = Lao People’s Democratic Republic, PRC = People’s Republic of China.Bilateral trade cost is a comprehensive measure of costs associated with both importing and exporting goods between two countries. The estimated trade cost is comprehensive: it includes all costs involved in trading goods internationally with another partner (i.e., bilaterally) relative to those involved in trading goods domestically (i.e., intranationally). It captures trade costs including not only tariffs and international transport costs, but also other trade cost components such as direct and indirect costs associated with differences in languages, currencies, as well as cumbersome import or export procedures. Trade cost is the ad valorem equivalent of measured trade cost in percent. The indicator can be used to find out the lowest trade cost partner of a given country. Source: ESCAP-World Bank Trade Cost Database. http://artnet.unescap.org/databases.html#first (accessed July 2017).
Table 6.15B: Bilateral Trade Cost—Lao PDR, Nontariff (%)
Trading Partner 2000 2001 2002 2003 2004 2005 2006 2007 2008 2009 2010 2011 2012 2013 2014 2015
Cambodia … 220 215 179 195 273 226 233 276 248 204 206 181 204 254 149PRC 177 161 168 162 163 157 142 145 145 137 130 125 117 103 … …Thailand 57 53 55 70 58 67 58 51 47 50 47 39 38 38 51 50Viet Nam 59 67 67 73 80 85 75 79 74 75 62 52 50 39 … …
.... data not available at the time of this publication, Lao PDR = Lao People’s Democratic Republic, PRC = People’s Republic of China.Bilateral trade cost, nontariff includes all additional costs other than tariffs involved in trading goods bilaterally rather than domestically. Trade cost is the ad valorem equivalent of measured trade cost in percent. It is the most appropriate indicator to use when trade facilitation and logistics costs are the focus of analysis. Source: ESCAP-World Bank Trade Cost Database. http://artnet.unescap.org/databases.html#first (accessed July 2017).
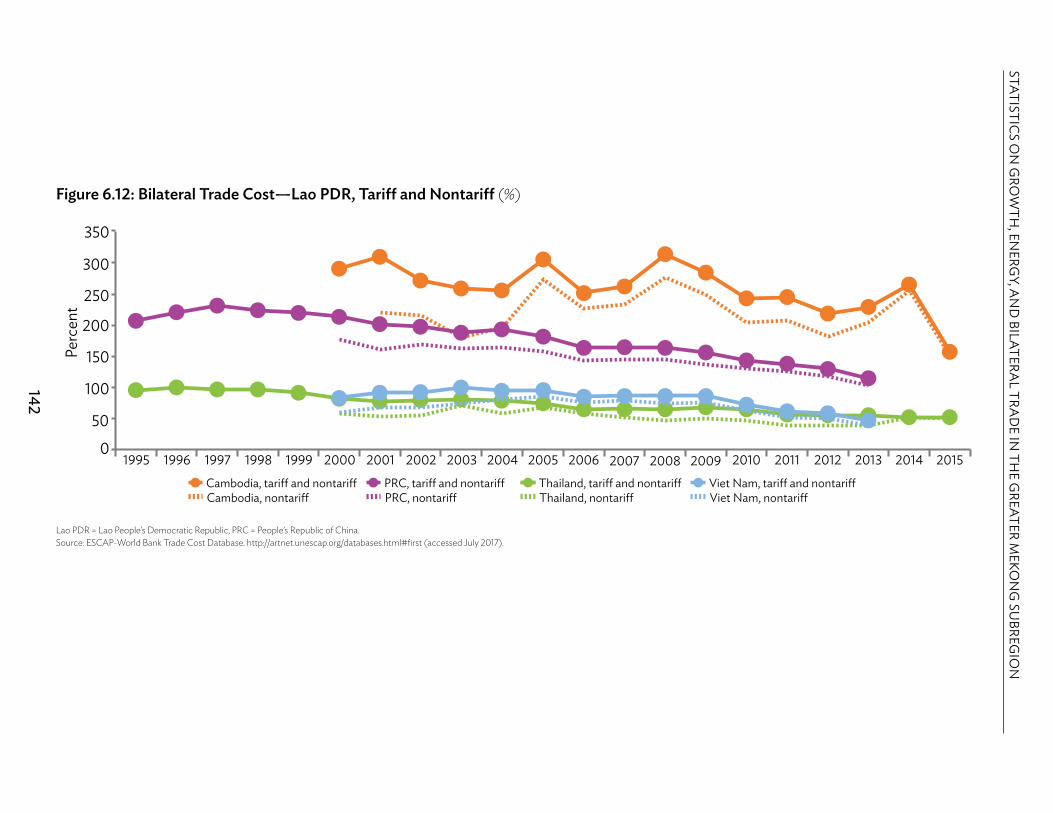
142
STATISTICS ON
GRO
WTH
, ENERG
Y, AN
D BILATERA
L TRAD
E IN TH
E GREATER M
EKON
G SU
BREGIO
N
Lao PDR = Lao People’s Democratic Republic, PRC = People’s Republic of China.Source: ESCAP-World Bank Trade Cost Database. http://artnet.unescap.org/databases.html#first (accessed July 2017).
Figure 6.12: Bilateral Trade Cost—Lao PDR, Tariff and Nontariff (%)
Perc
ent
200
300
350
50
100
150
250
0
Cambodia, tari� and nontari�Cambodia, nontari�
PRC, tari� and nontari�PRC, nontari�
Thailand, tari� and nontari�Thailand, nontari�
Viet Nam, tari� and nontari�Viet Nam, nontari�
2004 2005 20062000 2001 2002 2003 2007 2008 2009 2010 2011 2012 2013 2014 201519961995 199919981997

06 | Doing Business
143
Table 6.16A: Bilateral Trade Cost—Thailand, Tariff and Nontariff (%)
Trading Partner 1995 1996 1997 1998 1999 2000 2001 2002 2003 2004 2005 2006 2007 2008 2009 2010 2011 2012 2013 2014 2015
Cambodia … … … … … 108 121 121 115 109 113 113 117 121 113 83 78 88 76 94 66PRC 111 120 114 111 113 102 99 97 91 85 82 80 81 83 84 79 74 75 76 … …Lao PDR 95 99 96 96 91 81 77 79 80 78 74 64 65 64 68 64 56 55 55 52 52Viet Nam … … … … … 89 89 96 92 83 78 76 75 74 76 62 54 52 41 … …
.... data not available at the time of this publication, Lao PDR = Lao People’s Democratic Republic, PRC = People’s Republic of China.Bilateral trade cost is a comprehensive measure of costs associated with both importing and exporting goods between two countries. The estimated trade cost is comprehensive: it includes all costs involved in trading goods internationally with another partner (i.e., bilaterally) relative to those involved in trading goods domestically (i.e., intranationally). It captures trade costs including not only tariffs and international transport costs, but also other trade cost components such as direct and indirect costs associated with differences in languages, currencies, as well as cumbersome import or export procedures. Trade cost is the ad valorem equivalent of measured trade cost in percent. The indicator can be used to find out the lowest trade cost partner of a given country. Source: ESCAP-World Bank Trade Cost Database. http://artnet.unescap.org/databases.html#first (accessed July 2017).
Table 6.16B: Bilateral Trade Cost—Thailand, Nontariff (%)Trading Partner 1995 1996 1997 1998 1999 2000 2001 2002 2003 2004 2005 2006 2007 2008 2009 2010 2011 2012 2013 2014 2015
Cambodia … … … … … … 88 89 98 82 98 98 92 96 89 59 55 65 59 91 61PRC .. 78 78 76 65 71 70 71 68 67 64 63 66 69 72 70 65 67 67 … …Lao PDR … … … … … 57 53 55 70 58 67 58 51 47 50 47 39 38 38 51 50Viet Nam … … … … … 60 71 81 80 65 72 69 62 61 63 51 43 42 32 … …
.... data not available at the time of this publication, Lao PDR = Lao People’s Democratic Republic, PRC = People’s Republic of China.Bilateral trade cost, nontariff includes all additional costs other than tariffs involved in trading goods bilaterally rather than domestically. Trade cost is the ad valorem equivalent of measured trade cost in percent. It is the most appropriate indicator to use when trade facilitation and logistics costs are the focus of analysis. Source: ESCAP-World Bank Trade Cost Database. http://artnet.unescap.org/databases.html#first (accessed July 2017).

144
STATISTICS ON
GRO
WTH
, ENERG
Y, AN
D BILATERA
L TRAD
E IN TH
E GREATER M
EKON
G SU
BREGIO
N
Lao PDR = Lao People’s Democratic Republic, PRC = People’s Republic of China.Source: ESCAP-World Bank Trade Cost Database. http://artnet.unescap.org/databases.html#first (accessed July 2017).
Figure 6.13: Bilateral Trade Cost—Thailand, Tariff and Nontariff (%)
Perc
ent
120
140
40
60
80
100
20
Cambodia, tari and nontariCambodia, nontari
PRC, tari and nontariPRC, nontari
Lao PDR, tari and nontariLao PDR, nontari
Viet Nam, tari and nontariViet Nam, nontari
2004 2005 20062000 2001 2002 2003 2007 2008 2009 2010 2011 2012 2013 2014 201519961995 199919981997
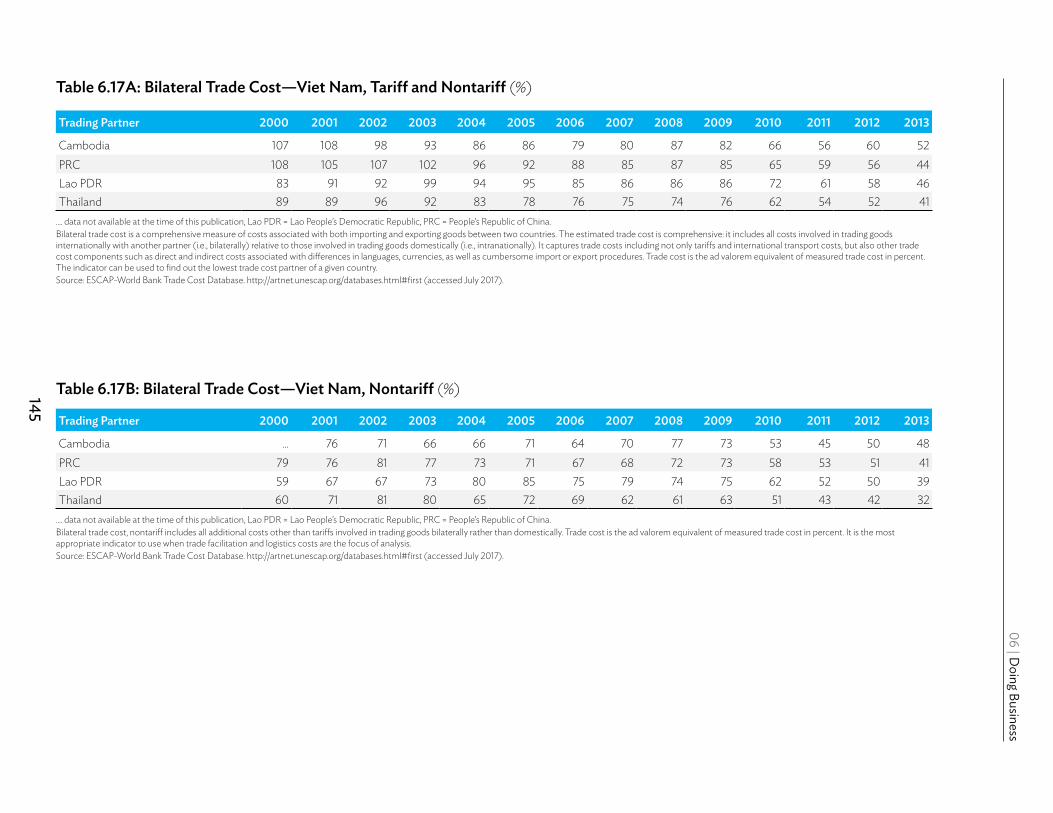
06 | Doing Business
145
Table 6.17A: Bilateral Trade Cost—Viet Nam, Tariff and Nontariff (%)
Trading Partner 2000 2001 2002 2003 2004 2005 2006 2007 2008 2009 2010 2011 2012 2013
Cambodia 107 108 98 93 86 86 79 80 87 82 66 56 60 52PRC 108 105 107 102 96 92 88 85 87 85 65 59 56 44Lao PDR 83 91 92 99 94 95 85 86 86 86 72 61 58 46Thailand 89 89 96 92 83 78 76 75 74 76 62 54 52 41
.... data not available at the time of this publication, Lao PDR = Lao People’s Democratic Republic, PRC = People’s Republic of China.Bilateral trade cost is a comprehensive measure of costs associated with both importing and exporting goods between two countries. The estimated trade cost is comprehensive: it includes all costs involved in trading goods internationally with another partner (i.e., bilaterally) relative to those involved in trading goods domestically (i.e., intranationally). It captures trade costs including not only tariffs and international transport costs, but also other trade cost components such as direct and indirect costs associated with differences in languages, currencies, as well as cumbersome import or export procedures. Trade cost is the ad valorem equivalent of measured trade cost in percent. The indicator can be used to find out the lowest trade cost partner of a given country. Source: ESCAP-World Bank Trade Cost Database. http://artnet.unescap.org/databases.html#first (accessed July 2017).
Table 6.17B: Bilateral Trade Cost—Viet Nam, Nontariff (%)
Trading Partner 2000 2001 2002 2003 2004 2005 2006 2007 2008 2009 2010 2011 2012 2013
Cambodia … 76 71 66 66 71 64 70 77 73 53 45 50 48PRC 79 76 81 77 73 71 67 68 72 73 58 53 51 41Lao PDR 59 67 67 73 80 85 75 79 74 75 62 52 50 39Thailand 60 71 81 80 65 72 69 62 61 63 51 43 42 32
.... data not available at the time of this publication, Lao PDR = Lao People’s Democratic Republic, PRC = People’s Republic of China.Bilateral trade cost, nontariff includes all additional costs other than tariffs involved in trading goods bilaterally rather than domestically. Trade cost is the ad valorem equivalent of measured trade cost in percent. It is the most appropriate indicator to use when trade facilitation and logistics costs are the focus of analysis. Source: ESCAP-World Bank Trade Cost Database. http://artnet.unescap.org/databases.html#first (accessed July 2017).

146
STATISTICS ON
GRO
WTH
, ENERG
Y, AN
D BILATERA
L TRAD
E IN TH
E GREATER M
EKON
G SU
BREGIO
N
Lao PDR = Lao People’s Democratic Republic, PRC = People’s Republic of China.Source: ESCAP-World Bank Trade Cost Database. http://artnet.unescap.org/databases.html#first (accessed July 2017).
Figure 6.14: Bilateral Trade Cost—Viet Nam, Tariff and Nontariff (%)
Perc
ent
120
20
40
60
80
100
Cambodia, tari and nontariCambodia, nontari
PRC, tari and nontariPRC, nontari
Lao PDR, tari and nontariLao PDR, nontari
Thailand, tari and nontariThailand, nontari
2004 2005 20062000 2001 2002 2003 2007 2008 2009 2010 2011 2012 2013

147
Appendix 1
Appendixes
Appendix 1: Constant GDP and GDP growth rate estimation
A country’s gross domestic product (GDP) growth rate may be computed using constant GDP in (i) local currency units, (ii) purchasing power parity in international dollars, and (iii) market prices in US dollars. Ideally, the computed growth rates should be identical. To achieve this, the estimates follow the suggestion given by the World Bank (https://datahelpdesk.worldbank.org/knowledgebase/articles/114943-what-is-your -constant-u-s-dollar-methodology). However there may be differences in the empirical results.
Given the growth rate of each country, the weighted GDP growth rate of Greater Mekong Subregion is estimated using equation (1).
(1)
where Gr is the weighted average growth rate of region r’s GDPgi = is the real growth rate of member i based on constant local currency unitsGDPi = GDP at purchasing power parity (current international dollars)/market prices (current $) GDPr = total GDP of region r at purchasing power parity (current international dollars)/market prices (current $)
= ∑ * x 100%

STATISTICS ON GROWTH, ENERGY, AND BILATERAL TRADE IN THE GREATER MEKONG SUBREGION
148
Appendix 2: Physical Energy Conversion Factors
Energy Conversion Factor
Raw coal 0.7143 kgce/kg
Cleaned coal 0.9 kgce/kg
Other washed coal
Middlings 0.2857 kgce/kg
Slimes 0.2857-0.4286 kgce/kg
Coke 0.9714 kgce/kg
Crude oil 1.4286 kgce/kg
Fuel oil 1.4286 kgce/kg
Gasoline 1.4714 kgce/kg
Kerosene 1.4714 kgce/kg
Diesel 1.4571 kgce/kg
Liquefied petroleum gas 1.7143 kgce/kg
Refinery gas 1.5714 kgce/kg
Natural gas 1.33 kgce/kg
Coke oven gas 0.5714 -0.6144 kgce/kg
By gas furnace 0.1786 kgce/m3
By heavy oil catalytic cracking 0.6571 kgce/m3
By heavy oil thermal cracking 1.2143 kgce/m3
Coke gas 0.5571 kgce/m3
By pressure gasification 0.5143 kgce/m3
Water coal gas 0.3571 kgce/m3
Coal tar 1.1429 kgce/kg
Benzene 1.4286 kgce/kg
Heat (in calorific value) 0.03412 kgce/mjoule
Electricity (in coal equivalent) 0.1229 kgce/kWh
0.7 TOE/ 1 TCE
kg = kilogram, kWh = kilowatt-hour, ce = coal equivalent, mjoule = mega joule, m3 = cubic meter, tce = ton of coal equivalent, toe = ton of oil equivalent.Source: Energy Statistics Division of National Bureau of Statistics. Various Issues. [People’s Republic of] China Energy Statistical Yearbook. Beijing: [People’s Republic of] China Statistics Press.

149
ReferencesASEANstats. https://data.aseanstats.org/
Asian Development Bank. Asian Regional Integration Center Integration Database. http://aric.adb.org
———. 2005. Key Indicators for Asia and the Pacific. Manila.
———. 2016. Key Indicators for Asia and the Pacific. Manila.
———. ADB Statistical Database System. https://sdbs.adb.org
Energy Statistics Division of National Bureau of Statistics. Various Issues. China Energy Statistical Yearbook. Beijing: [People’s Republic of] China Statistics Press.
Enerdata. https://www.enerdata.net/
ESCAP and World Bank. ESCAP–World Bank Trade Cost Database. http://artnet.unescap.org/databases.html#first
Guangxi Statistical Bureau. 2016. Guangxi Statistical Yearbook. Beijing: [People’s Republic of] China Statistics Press.
Government of Cambodia. Various Issues. Cambodia Statistical Yearbook. Phnom Penh: National Institute of Statistics.
Government of the Lao People’s Democratic Republic. Lao Statistical Yearbook. Various Issues. Vientiane: Statistics Bureau.
Government of Myanmar. Myanmar Statistical Yearbook. Various Issues. Nay Pyi Taw: Central Statistical Organization.
Government of Thailand. Thailand Statistical Yearbook. Various Issues. Bangkok: National Statistical Office.
Government of Viet Nam. General Statistics Office. http://www.gso.gov.vn/default_en.aspx?tabid=515&ItemID=12576
Greater Mekong Subregion Secretariat. 2015. Statistics on Growth, Connectivity, and Sustainable Development. 20th Ministerial Conference. Nay Pyi Taw, Myanmar. 10 September.
Greater Mekong Subregion Secretariat. 2016. Statistics on Growth, Infrastructure, and Trade. 8th Economic Corridors Forum. Phnom Penh, Cambodia. 3–4 August.
International Energy Agency. Energy Balances of Non-OECD Countries. https://www.iea.org/statistics/relateddatabases/energybalancesofnon-oecdcountries/
———. 1994. Energy Statistics and Balances of Non-OECD Countries. Paris. IEA.
International Monetary Fund. 2015. World Economic Outlook Database. http://www.imf.org
Statistical Bureau of Yunnan Province. 2016. Yunnan Statistical Yearbook. Beijing: [People’s Republic of] China Statistics Press.
UNCTAD STAT Database. www.unctadstat.unctad.org
United Nations COMTRADE. International Trade Statistics Database. http://comtrade.un.org
UN Service Trade Database. http://unctadstat.unctad.org
World Bank. World Development Indicators Database. http://data.worldbank.org


Statistics on Growth, Energy, and Bilateral Trade in the Greater Mekong Subregion
This third edition of the Greater Mekong Subregion (GMS) statistics booklet builds on information from the first and second editions. In addition to updated data, this third edition has been substantially enhanced with data and indicators on the energy sector and bilateral trade among GMS countries. All statistics in this third edition can be accessed at http://www.greatermekong.org/statistics/
About the Greater Mekong Subregion Economic Cooperation Program
The GMS is made up of Cambodia, the People’s Republic of China (specifically Yunnan Province and Guangxi Zhuang Autonomous Region), the Lao People’s Democratic Republic, Myanmar, Thailand, and Viet Nam. In 1992, with assistance from the Asian Development Bank and building on their shared histories and cultures, the six countries of the GMS launched a program of subregional economic cooperation—the GMS Program—to enhance their economic relations, initially covering the nine priority sectors: agriculture, energy, environment, human resource development, investment, telecommunications, tourism, transport infrastructure, and transport and trade facilitation.
About the Asian Development Bank
ADB’s vision is an Asia and Pacific region free of poverty. Its mission is to help its developing member countries reduce poverty and improve the quality of life of their people. Despite the region’s many successes, it remains home to a large share of the world’s poor. ADB is committed to reducing poverty through inclusive economic growth, environmentally sustainable growth, and regional integration.
Based in Manila, ADB is owned by 67 members, including 48 from the region. Its main instruments for helping its developing member countries are policy dialogue, loans, equity investments, guarantees, grants, and technical assistance.