status assessment of laysan and black-footed albatrosses ... · status assessment of laysan and...
TRANSCRIPT

Status Assessment of Laysan and Black-Footed Albatrosses, North Pacific Ocean, 1923–2005
Scientific Investigations Report 2009-5131
U.S. Department of the InteriorU.S. Geological Survey

Cover: Photograph of Laysan and black-footed albatrosses. Photograph taken by Eric VanderWerf, Pacific Rim Conservation.

Status Assessment of Laysan and Black-Footed Albatrosses, North Pacific Ocean, 1923–2005
By Javier A. Arata, University of Massachusetts-Amherst, Paul R. Sievert, U.S. Geological Survey, and Maura B. Naughton, U.S. Fish and Wildlife Service
Scientific Investigations Report 2009-5131
U.S. Department of the InteriorU.S. Geological Survey

U.S. Department of the InteriorKEN SALAZAR, Secretary
U.S. Geological SurveySuzette M. Kimball, Acting Director
U.S. Geological Survey, Reston, Virginia: 2009
For more information on the USGS—the Federal source for science about the Earth, its natural and living resources, natural hazards, and the environment, visit http://www.usgs.gov or call 1-888-ASK-USGS
For an overview of USGS information products, including maps, imagery, and publications, visit http://www.usgs.gov/pubprod
To order this and other USGS information products, visit http://store.usgs.gov
Any use of trade, product, or firm names is for descriptive purposes only and does not imply endorsement by the U.S. Government.
Although this report is in the public domain, permission must be secured from the individual copyright owners to reproduce any copyrighted materials contained within this report.
Suggested citation:Arata, J.A., Sievert, P.R., and Naughton, M.B., 2009, Status assessment of Laysan and black-footed albatrosses, North Pacific Ocean, 1923–2005: U.S. Geological Survey Scientific Investigations Report 2009-5131, 80 p.

iii
Contents
Executive Summary .......................................................................................................................................1Introduction.....................................................................................................................................................2Taxonomy ........................................................................................................................................................4Legal and Conservation Status ....................................................................................................................4Species’ Descriptions ...................................................................................................................................5Geographic Distribution ................................................................................................................................5
Breeding Colonies.................................................................................................................................5At-Sea Distribution ..............................................................................................................................5
At Sea: Breeding Albatrosses ...................................................................................................6At Sea: Non-Breeding Albatrosses ..........................................................................................7
Natural History ...............................................................................................................................................8Laysan Albatross...................................................................................................................................8
Breeding Cycle .............................................................................................................................8Nests and Nest Spacing .............................................................................................................8Breeding Site and Mate Fidelity ................................................................................................8Demography and Limiting Factors ............................................................................................8Predators .......................................................................................................................................9Diet and Foraging Behavior .....................................................................................................10
Black-Footed Albatross .....................................................................................................................10Breeding Cycle ...........................................................................................................................10Nests and Nest Spacing ...........................................................................................................10Breeding Site and Mate Fidelity ..............................................................................................11Demography and Limiting Factors ..........................................................................................11Predators .....................................................................................................................................11Diet and Foraging Behavior .....................................................................................................11
Habitat Requirements..................................................................................................................................12Threats ...........................................................................................................................................................12
Fishery Bycatch...................................................................................................................................12Description of the Fisheries .....................................................................................................12Bycatch Estimation ....................................................................................................................14
Predation ..............................................................................................................................................16Introduced Species ............................................................................................................................16Habitat Loss and Degradation ..........................................................................................................16
Invasive Plants ...........................................................................................................................16Urban and Military Development ............................................................................................16
Conflicts with Military Activities ......................................................................................................17

iv
Threats—ContinuedPesticides and Other Contaminants ................................................................................................18
Metals .........................................................................................................................................18Organochlorine Contaminants .................................................................................................18
Plastics .................................................................................................................................................20Disease .................................................................................................................................................20Population Size and Isolation ...........................................................................................................20Climate Change ...................................................................................................................................21
Monitoring and Management Activities ..................................................................................................21Monitoring ...........................................................................................................................................21
Breeding Surveys.......................................................................................................................21Bycatch Monitoring ...................................................................................................................22
Management Activities ......................................................................................................................22Protection of Nesting Islands ..................................................................................................22Habitat and Vegetation Management ....................................................................................22Predator Management ..............................................................................................................23Fishery Management ................................................................................................................23Migratory Bird Treaty Act .........................................................................................................23
Population Status and Trends ...................................................................................................................23Population Analysis Methods ...........................................................................................................24Results for Laysan Albatross ............................................................................................................24
Population Estimates – A Historical Review .........................................................................24Regression Analysis of Count Data ........................................................................................29Population Viability Analyses (PVA) of Count Data ..............................................................29Matrix Model Analyses .............................................................................................................32
Results for Black-Footed Albatross .................................................................................................35Population Estimates – A Historical Review .........................................................................35Regression Analysis of Count Data ........................................................................................39Population Viability Analyses (PVA) of Count Data ..............................................................39Matrix Model Analyses .............................................................................................................46
Discussion: Laysan and Black-Footed Albatrosses Population Analyses ................................49Population Viability Analyses ...................................................................................................49Incidental Mortality of Albatrosses ........................................................................................50
Conclusions...................................................................................................................................................51Acknowledgments .......................................................................................................................................51References Cited..........................................................................................................................................52Appendix A: Bycatch Estimation................................................................................................................61Appendix B. Descriptions and History of the Northwestern Hawaiian Islands.................................73Appendix C. Detailed Methods for Analysis of Population Trends and Bycatch Impacts...............77
Contents—Continued

v
Figures Figure 1. Map showing breeding distribution of Laysan and black-footed albatrosses,
North Pacific Ocean ……………………………………………………………… 3 Figure 2. Maps showing kernel density distribution for breeding and non-breeding
black-footed and Laysan albatrosses from satellite (PTT) and geolocator (GLS) tracking data ……………………………………………………………………… 6
Figure 3. Graph showing total estimated number of Laysan albatrosses killed by commercial fisheries in the North Pacific Ocean, 1951–2005 …………………… 15
Figure 4. Graph showing total estimated number of black-footed albatrosses killed by commercial fisheries in the North Pacific Ocean, 1951–2005 …………………… 15
Figure 5. Graphs showing number of Laysan albatross breeding pairs at colonies from the 1920s until 2005 ……………………………………………………………… 24
Figure 6. Graphs showing number of breeding pairs of Laysan albatross on Midway Atoll, Laysan Island, and French Frigate Shoals, 1958–2005 ……………………… 27
Figure 7. Graphs showing observed growth rate distribution (Robs) for the Laysanalbatross breeding population, Laysan Island …………………………………… 29
Figure 8. Graphs showing population projection (A, n = 30) and cumulative probability(B) that a given rate of population change is reached over 60 years using theexponential model and re-analysis of transect data for Laysan albatross, Laysan Island ……………………………………………………………………… 31
Figure 9. Graphs showing observed growth rate distribution (Robs) for the Laysanalbatross breeding population, French Frigate Shoals …………………………… 31
Figure 10. Graphs showing projection (A, n = 30) and cumulative probability (B) that agiven rate of population change is reached over 60 years using the exponential model for Laysan albatross, French Frigate Shoals ………………… 33
Figure 11. Graph showing World Laysan albatross breeding population trend as derived from estimates for each island …………………………………………………… 33
Figure 12. Graphs showing potential growth rate (A) and net growth (B) for the Laysanalbatross ………………………………………………………………………… 35
Figure 13. Graphs showing number of black-footed albatross breeding pairs at colonies from the 1920s until 2005 ………………………………………………………… 37
Figure 14. Graphs showing number of breeding pairs of black-footed albatross on Midway, Laysan, and French Frigate Shoals from the 1950s to 2005. …………… 38
Figure 15. Graphs showing observed growth rate distribution (Robs) for the black-footedalbatross breeding population, Midway Atoll …………………………………… 40
Figure 16. Graphs showing population projection (A, n = 30) and cumulative probability(B) that a given rate of population change is reached over 60 years using theexponential model for black-footed albatross, Midway Atoll …………………… 40
Figure 17. Graph showing population estimates for black-footed albatross, Laysan Island. … 41 Figure 18. Graphs showing observed growth rate distribution (Robs) for the black-footed
albatross breeding population, Laysan Island …………………………………… 44 Figure 19. Graphs showing population projection (A, n = 30) and cumulative probability
(B) that a given rate of population change is reached over 60 years using theexponential model and re-analyzed transect data for black-footed albatross, Laysan Island ……………………………………………………………………… 44

vi
Figure 20. Graphs showing observed growth rated distribution (Robs) for the black-footed albatross breeding population on all of French Frigate Shoals (Robs-FFS) and Tern Island (Robs-Tern) only ……………………………… 45
Figure 21. Graphs showing population projection (A, n = 30) and cumulative probability (B) that a given rate of population change is reached over 60 years using the exponential model for black-footed albatross, French Frigate Shoals …………………………………………………………… 45
Figure 22. Graph showing World black-footed albatross breeding population trend, as derived from estimations at each island ……………………………… 46
Figure 23. Graph showing Potential Biological Removal estimate using R/4, R/2, and R, and initial population sizes of black-footed albatross as obtained from each estimated trend for 2004 ……………………………………………… 48
Figure 24. Graph showing species and islands comparison of the population growth rate, â, and the environmental variance, envσ , estimated with the exponential model (mean and 95-percent CI) ………………………………………………… 49
Figures—Continued
Tables Table 1. Data sources used in bycatch estimations for Laysan (LAAL) and black-footed
(BFAL) albatrosses ……………………………………………………………… 14 Table 2. Estimated number of Laysan (LAAL) and black-footed (BFAL) albatrosses
killed on Midway Atoll in control programs, experiments, and collisions with antennas, and aircraft and road collisions, 1956–67 ……………………………… 17
Table 3. Mean and range of organochlorine concentrations in the subcutaneous fat of adult Laysan albatrosses and whole eggs, Midway Atoll ………………………… 19
Table 4. Mean and range of organochlorine concentrations in subcutaneous fat of adult black-footed albatrosses and whole eggs, Midway Atoll …………………… 19
Table 5. Estimates of the number of Laysan albatross breeding pairs by colony and hatch year at all extant colonies ………………………………………………… 26
Table 6. Results of linear regression analyses of trends in Laysan and black-footed albatross populations at French Frigate Shoals, Laysan Island, and Midway Atoll combined …………………………………………………………………… 29
Table 7. Parameter estimation for exponential and logistic R-function models fitted toLaysan albatross Robs data, Laysan Island ……………………………………… 30
Table 8. Parameter estimation for exponential and logistic R-function models fitted toLaysan albatross Robs data after re-analysis of transect data, Laysan Island …… 30
Table 9. Parameter estimation for exponential and logistic R-function models fitted toLaysan albatross Robs data, French Frigate Shoals ……………………………… 32
Table 10. Parameter estimates [median (95-percent CI)] for the Laysan albatross population-projection matrix under different model structures …………………… 34
Table 11. Demographic parameter estimates [mean ± 1 SD (range)] available for the Laysan albatross ………………………………………………………………… 36
Table 12. Estimates of the number of black-footed albatross breeding pairs by colony and hatch year …………………………………………………………………… 37
Table 13. Parameter estimation for exponential and logistic R-function models fitted toblack-footed albatross Robs data, Midway Atoll ………………………………… 42

vii
Multiply By To obtain
Length
centimeter (cm) 0.3937 inch (in.)millimeter (mm) 0.03937 inch (in.)meter (m) 3.281 foot (ft) kilometer (km) 0.6214 mile (mi)kilometer (km) 0.5400 mile, nautical (nmi) meter (m) 1.094 yard (yd)
Area
square meter (m2) 0.0002471 acre hectare (ha) 2.471 acresquare kilometer (km2) 247.1 acresquare centimeter (cm2) 0.001076 square foot (ft2)square meter (m2) 10.76 square foot (ft2) square centimeter (cm2) 0.1550 square inch (ft2) square kilometer (km2) 0.3861 square mile (mi2)
Volumecubic meter (m3) 6.290 barrel (petroleum, 1 barrel = 42 gal)cubic meter (m3) 264.2 gallon (gal) cubic centimeter (cm3) 0.06102 cubic inch (in3) cubic decimeter (dm3) 61.02 cubic inch (in3) cubic meter (m3) 35.31 cubic foot (ft3)cubic meter (m3) 1.308 cubic yard (yd3) cubic kilometer (km3) 0.2399 cubic mile (mi3)
Massgram (g) 0.03527 ounce (oz)kilogram (g) 2.20462 pound (lb)
Conversion Factors and Datums
Conversion Factors
Table 14. Parameter estimation for exponential and logistic R-function models fitted to black-footed albatross Robs data after re-analysis of transect samples, Laysan Island …………………………………………………………… 42
Table 15. Parameter estimation for exponential and logistic R-function models fitted to black-footed albatross Robs data derived from direct nest counts, Laysan Island ……………………………………………………………………… 43
Table 16. Parameter estimation for exponential and logistic R-function models fittedto black-footed albatross Robs data, French Frigate Shoals ……………………… 43
Table 17. Demographic parameter estimates [mean ± 1 SD (range)] available for the black–footed albatross ………………………………………………………… 47
Table 18. Parameter estimates [median (95-percent CI)] for the black–footed albatross population–projection matrix …………………………………………… 48
Tables—Continued

viii
Conversion Factors and Datums—ContinuedTemperature in degrees Celsius (°C) may be converted to degrees Fahrenheit (°F) as follows:
°F=(1.8×°C)+32.
Temperature in degrees Fahrenheit (°F) may be converted to degrees Celsius (°C) as follows:
°C=(°F-32)/1.8.
Datums
Vertical coordinate information is referenced to the North American Vertical Datum of 1988 (NAVD 88).
Horizontal coordinate information is referenced to the North American Datum of 1983 (NAD 83).
Altitude, as used in this report, refers to distance above the vertical datum.
Abbreviations and Acronyms ACAP Agreement on the Conservation of Albatrosses and PetrelsAICc Akaike’s Information Criterion correctedAOU American Ornithologist’s Unionasl above sea levelBCME British Columbia Ministry of EnvironmentBPUE Birds per Unit EffortBFAL Black-Footed AlbatrossBSAI Bering Sea and Aleutian IslandsCI Confidence IntervalCITES Convention on International Trade in Endangered Species COSEWIC Committee on the Status of Endangered Wildlife in CanadaCPD Cumulative Probability DistributionCV Coefficient of VariationDDE 1,1-dichloro-2,2’-bis-p-chlorophenyl-ethyleneDDT DichlorodiphenyltrichloroethanesEEZ Exclusive Economic ZoneESA Endangered Species ActFFS French Frigate ShoalsGLEMEDS Great Lakes Embryo Mortality Edema and Deformities SyndromeGOA Gulf of AlaskaHI Hazard IndexHI Hawai`iICEG Island Conservation and Ecology GroupIPHC International Pacific Halibut CommissionIUCN World Conservation UnionJPLM Japanese Large-Mesh FisheryJPLS Japanese Land-based Salmon FisheryJPMS Japanese Mothership Salmon Fishery

ix
JPSQ Japanese Squid FisheryKOSQ Korean Squid FisheryLAAL Laysan AlbatrossLORAN Long Range Aids to Navigation LRT and LR Likelihood Ratio TestMBTA Migratory Bird Treaty ActMMPA Marine Mammal Protection ActNMFS National Marine Fisheries ServiceNPAWG North Pacific Albatross Working GroupNOAEL No Observable Adverse Effect LevelNOM Norma Oficial MexicanaNWHI Northwestern Hawaiian IslandsNWR National Wildlife RefugeOFP Ocean Fisheries ProgramPBR Potential Biological RemovalPCB Polychlorinated biphenylsPCDD Polychlorinated dibenzodioxinsPVA Population Viability AnalysisRFMO Regional Fishery Management OrganizationSD Standard DeviationSEMARNAT Secretaría de Medio Ambiente y Recursos NaturalesSWR Southwest RegionTCDD Tetrachlorodibenzo-piodoxinTEQ Toxic equivalentTWDF Taiwanese Squid FisheryUN United NationsU.S. United StatesUSFWS United States Fish and Wildlife ServiceUSGS United States Geological SurveyWWII World War II
Abbreviations and Acronyms—Continued

x
This page left intentionally blank

Status Assessment of Laysan and Black-Footed Albatrosses, North Pacific Ocean, 1923–2005
By Javier A. Arata1, Paul R. Sievert2, and Maura B. Naughton3
Executive SummaryOver the past century, Laysan (Phoebastria immutabilis)
and black-footed (Phoebastria nigripes) albatrosses have been subjected to high rates of mortality and disturbance at the breeding colonies and at sea. Populations were greatly reduced and many colonies were extirpated around the turn of the 20th century as a result of feather hunting. Populations were recovering when military occupation of several breeding islands during World War II led to new population declines at these islands and additional colony extirpations. At sea, thousands of Laysan and black-footed albatrosses were killed each year in high-seas driftnet fisheries, especially from 1978 until the fisheries were banned in 1992. Through the 1990s, there was a growing awareness of the large numbers of albatrosses that were being killed in longline fisheries. During the 1990s, other anthropogenic factors, such as predation by non-native mammals and exposure to contaminants, also were documented to reduce productivity or increase mortality.
In response to the growing concerns over the impacts of these threats on albatross populations, the U.S. Fish and Wildlife Service contracted with the U.S. Geological Survey to conduct an assessment of Laysan and black-footed albatross populations. This assessment includes a review of the taxonomy, legal status, geographic distribution, natural history, habitat requirements, threats, and monitoring and management activities for these two species. The second part of the assessment is an analysis of population status and trends from 1923 to 2005.
Laysan and black-footed albatrosses forage throughout the North Pacific Ocean and nest on tropical and sub-tropical oceanic islands from Mexico to Japan. As of 2005, 21 islands support breeding colonies of one or both species. The core breeding range is the Hawaiian Islands, where greater than 99 percent of the World’s Laysan albatrosses and greater than 95 percent of the black-footed albatrosses nest on the small islands and atolls of the Northwestern Hawaiian Islands. These islands are all protected as part of the Papahānaumokuākea Marine National Monument.
Albatrosses are long-lived seabirds with deferred maturity, low fecundity, and high rates of adult survival. Their life history characteristics make populations especially vulnerable, to small increases in adult mortality. The primary threats to Laysan and black-footed albatrosses include interactions with commercial fisheries, predation by introduced mammals, reduced reproductive output due to contaminants, nesting habitat loss and degradation due to human development and invasive plant species, and potential loss and degradation of habitat due to climate change and sea-level rise. Incidental mortality (bycatch) in commercial fisheries is the greatest anthropogenic source of mortality (post-fledging) for both species. We found that longline fishing effort prior to the 1980s was greater than previously estimated and a very significant source of mortality.
Regulations to minimize and monitor albatross mortality have been enacted in most U.S. and Canadian longline fisheries, but monitoring of bycatch rates and regulations to minimize seabird mortality are extremely limited in the much larger multinational longline fleets. Management to address threats at the breeding colonies is ongoing and includes eradication or control of non-native species, habitat management, and abatement programs to reduce impacts of contaminants. Effective long-term conservation and management of the Laysan and black-footed albatrosses require management and monitoring at the breeding colonies and at sea and continued assessment of population status and trends.
1 University of Massachusetts, Department of Natural Resources Conservation, Amherst, MA.
2U.S. Geological Survey, Massachusetts Cooperative Fish and Wildlife Research Unit, University of Massachusetts, Amherst, MA.
3U.S. Fish and Wildlife Service, Migratory Birds and Habitat Programs, Portland, OR.

2 Status Assessment of Laysan and Black-Footed Albatrosses, North Pacific Ocean, 1923–2005
We evaluated the status and trends of Laysan and black-footed albatross populations using linear regression, population viability analysis (PVA), and age-structured matrix models. Analyses were predominantly based on nest-count data gathered at French Frigate Shoals, Laysan Island, and Midway Atoll. At these three colonies, nest counts were greater than 75 percent of the World’s population of black-footed albatrosses and greater than 90 percent of the World’s population of Laysan albatrosses. The first quantitative estimates for most colonies were made in 1923, after the era of feather hunting, when populations were at their lowest levels. Another comprehensive survey of Hawaiian colonies was conducted between 1956 and 1958, after which colony counts were irregular until the U.S. Fish and Wildlife Service (USFWS) began standardized surveys of French Frigate Shoals in 1980, and Laysan Island and Midway Atoll in 1992. Regression analysis was used to evaluate linear trends in populations from 1923 to 2005, 1957 to 2005, and 1992 to 2005. PVA was conducted by fitting stochastic, discrete-time, logistic, and exponential models to observed data and then making population projections 60 years (about three generations) into the future. Age-structured population models, based on a matrix modeling framework, were used to evaluate the effect of fishery bycatch on populations. Estimates of albatross bycatch were either obtained by projecting measured rates for U.S. fisheries to International fleets or by using published values.
The Laysan albatross population increased from an estimated 18,000 pairs in 1923 to 590,000 pairs in 2005. The large population increase during the past 83 years is likely a response to the end of persecution by feather hunters, decrease in conflicts with military activities, and an increase in nesting areas at some colonies. Analysis of linear trends in the population showed a positive change over 1923 to 2005 and 1957 to 2005 and a stable size from 1992 to 2005. PVA results for the Laysan albatross colony on French Frigate Shoals indicate that this colony is currently stable, but there is a 28-percent probability of the population decreasing by 24 percent over the next 60 years. PVA results for the Laysan Island colony indicate that the colony is most likely to increase in size over the next 60 years, but there also is a 45-percent probability of the colony decreasing in size. PVA was not conducted for Midway Atoll due to the small sample size. Matrix modeling results indicate that the Laysan albatross population, summed across all three colonies (Midway Atoll, Laysan Island, and French Frigate Shoals), increased 6.7 percent per year from 1992 to 2005, and the estimated bycatch of 2,500 birds per year is less than the estimated Potential Biological Removal (PBR—the maximum number of mortalities, not including natural deaths, while maintaining an optimum sustainable population).
The black-footed albatross population increased from an estimated 18,000 pairs in 1923 to 61,000 pairs in 2005. As with Laysan albatrosses, the increase in the black-footed albatross population over the past 83 years probably is in response to the end of persecution at nesting colonies. Analysis of linear trends in population size showed a positive change from 1923 to 2005, no change from 1957 to 2005, and no change from 1998 to 2005. PVA results for the black-footed albatross colony on French Frigate Shoals indicate that this colony has a 50-percent probability of increasing by 74 percent in the next 60 years, but it also has a 35-percent probability of significantly decreasing. PVA results for the Laysan Island colony indicate that the population is most likely to increase by 54.7 percent over the next 60 years, but also has a 35-percent probability of significantly decreasing. PVA results for the Midway Atoll colony indicate that it is most likely to increase by 36 percent over the next 60 years, and has a 23-percent probability of decreasing. Matrix modeling results indicate that the black-footed albatross population, summed across all three colonies, is stable, or slightly increasing, with a population growth rate of 0.3 percent per year. The 2005 estimate of bycatch is 5,228 birds per year, but if this value is doubled, a safeguard for underestimating bycatch, it approaches the PBR of 11,980 birds per year, although the upper 95-percent confidence limit (17,486) exceeds the PBR.
Our knowledge of interactions of Laysan and black-footed albatrosses with fishing operations is imperfect, partly because of the difficulty of obtaining reliable bycatch data from all fleets. Results from the matrix modeling indicate that fishery bycatch is not significantly affecting the size of the Laysan albatross population, but may be causing a decrease in black-footed albatross populations.
IntroductionLaysan and black-footed albatrosses breed on oceanic
islands in the subtropical and tropical Pacific Ocean, between 14ºN and 31ºN latitude, from Mexico to the East China Sea (Harrison, 1990; Whittow, 1993a and 1993b, fig. 1). The majority of birds nest on the low islands and atolls of the Northwestern Hawaiian Islands, and their foraging habitat includes most of the North Pacific Ocean (Rice and Kenyon, 1962a; Tickell, 2000). During the last century, these species have been subject to high rates of mortality and disturbance at both the breeding colonies and foraging grounds (Cousins and Cooper, 2000; Tickell, 2000; Lewison and Crowder, 2003). Populations were greatly reduced, and Laysan and black-footed albatrosses were extirpated from many breeding islands by feather hunters during the late 19th and early 20th centuries (Rice and Kenyon, 1962a; Spennemann, 1998; Tickell, 2000).

Introduction 3
tac_
08_9
354_
0255
_Alb
atro
sses
_Fig
01
See
inse
t bel
ow
156°
W16
0°W
164°
W16
8°W
172°
W17
6°W
180°
28°N
26°N
24°N
22°N
20°N
010
020
030
0 M
ILES
010
020
030
040
050
0 KI
LOM
ETER
S
Mid
way
Pear
l &H
erm
es R
eef
Lisi
ansk
i
Lays
an
Fren
ch F
riga
te
S
hoal
s Nec
ker
Nih
oa
Kaul
a
Ni`i
hau
Ni`i
hauLe
hua
Kaua
`iO
`ahu
Kure
No
r th
we
s te
r n
Is l
an
ds
Ma i n
Is l a
n d s
Haw
aiia
n Is
land
sH
awai
ian
Isla
nds
Haw
ai`i
Mau
iKa
ho`o
law
eLā
na`i
Mol
oka`
i
Gar
dner
Pinn
acle
sM
aro
Reef
Wak
eA
toll
Min
ami
Tori
shim
aKa
zan
Retto
Tori
shim
a
Isla
de
Gua
dalu
pe
Clar
ion
San
Ben
edic
to
Izu Shoto
Alij
os R
ocks
RU
SS
IA
CH
IN
A
CA
NA
DA
AU
ST
RA
LI
A
IN
DO
NE
SI
A
ME X
I CO
N K
ORE
A
S KO
REA
Equa
tor
Equa
tor
TAIW
AN
UN
IT
ED
ST
AT
ES
P H I L I P P I N E S
PAPU
AN
EW G
UIN
EAPA
PUA
NEW
GU
INEA
Ha
wa
i ia
n I
s la
nd
s
JA
P
AN
Ogasawara (Bonin Is.)Se
nkak
uRe
tto
Mariana Is.
Marshall Islands
John
ston
Ato
ll
Isla
sRe
villa
gige
do
PA
CI
FI
CO
CE
AN
PA
CI
FI
CO
CE
AN
(Pho
ebas
tria
imm
utab
ilis
and
Phoe
bast
ria n
igrip
es)
EX
PLA
NA
TIO
N
Bre
edin
g
Extir
pate
d
Lay
san:
Bre
edin
g
Extir
pate
d
Bla
ck-f
oote
d:B
reed
ing
Extir
pate
d
Bot
h:
Bre
edin
g D
istr
ibut
ion
ofLa
ysan
and
Bla
ck-F
oote
d A
lbat
ross
120°
E
50°N
30°N
10°N
10°S
140°
E16
0°E
180°
160°
W14
0°W
120°
W10
0°W
120°
E14
0°E
160°
E18
0°16
0°W
140°
W
0°
50°N
100°
W
30°N
10°N
10°S
0°
120°
W
02,
000
MIL
ES
01,
000
1,00
0
2,00
0 KI
LOM
ETER
S
Map
from
U.S
. Fis
h an
d W
ildlif
e Se
rvic
e, P
acifi
c Re
gion
, ES/
GIS,
Se
ptem
ber 2
008.
Pro
ject
ion:
Wor
d Ro
bins
on, w
ith a
cen
tral
med
ian
of 1
80 d
egre
es. D
atum
is W
ord
Geod
etic
Sys
tem
, 198
4Ph
oto
cred
it: M
aura
Nau
ghto
n
Figu
re 1
. Br
eedi
ng d
istri
butio
n of
Lay
san
and
blac
k-fo
oted
alb
atro
sses
, Nor
th P
acifi
c Oc
ean.

4 Status Assessment of Laysan and Black-Footed Albatrosses, North Pacific Ocean, 1923–2005
Designation of the Hawaiian Islands Bird Reservation (later renamed the Hawaiian Islands National Wildlife Refuge) in 1909 provided protection to breeding colonies in the core breeding range. Human occupation and military activities at several breeding islands, during and subsequent to World War II, degraded nesting habitat and reduced the breeding populations at these islands, including the extirpation of some colonies (Fisher and Baldwin, 1946; Rice and Kenyon, 1962a). Introduced mammalian predators have been removed from all the larger colony sites in the Northwestern Hawaiian Islands, but they remain a threat to smaller colonies and may be an impediment to recolonization of historical nesting sites. At sea, albatrosses have been subjected to mortality by commercial fisheries (Johnson and others, 1993; Cousins, 2001; Lewison and Crowder, 2003) and exposure to contaminants (Ludwig and others, 1998; Guruge and others, 2001a and 2001b; Finkelstein and others, 2006).
The U.S. Fish and Wildlife Service contracted with the U.S. Geological Survey to conduct a status assessment of Laysan and black-footed albatrosses due to concerns over the status of the populations and the impacts of threats. The assessment includes a review of the taxonomy, legal status, natural history, and population status and trends of these two species. Population trends were based on data collected at French Frigate Shoals, Laysan Island, and Midway Atoll; sites where 75 percent of the World’s population of black-footed albatross and 90 percent of the World’s Laysan albatrosses nest. Population changes were analyzed using linear regression, population viability analysis (PVA) and age-structured population models.
TaxonomyMolecular analyses based on the mitochondrial
cytochrome-b gene identified a strong phylogenetic relationship among all North Pacific albatrosses, supporting the former designation of Phoebastria (Reichenbach, 1852) for this group (Nunn and others, 1996; Robertson and Nunn, 1998), a classification that has been adopted by the American Ornithologists’ Union (1997).
The current taxonomy for the Laysan albatross is Phoebastria immutabilis, Order Procellariiformes, Family Diomedeidae (American Ornithologists’ Union, 1998). No subspecies are recognized (Robertson and Nunn, 1998; BirdLife International, 2004a).
The current taxonomy for the black-footed albatross is Phoebastria nigripes, Order Procellariiformes, Family Diomedeidae (American Ornithologists’ Union, 1998). There are no recognized subspecies (Robertson and Nunn, 1998; BirdLife International, 2004b), although a recent study based on the mitochondrial cytochrome-b gene identified significant genetic differentiation between Hawaiian and Japanese populations of black-footed albatrosses (Walsh and Edwards, 2005).
Legal and Conservation StatusIn the United States, Canada, Japan, Russia, and China,
migratory birds, including albatrosses, are protected by domestic legislation that implements migratory bird treaties (summarized in Harrison and others, 1992) including the Migratory Bird Treaty Act (United States), Migratory Bird Convention Act (Canada), Wildlife Protection and Hunting Law (Japan), On the Protection and Use of Wild Animals (Russia), and Wildlife Protection Law (China).
Additional protective designations include:
United States
• A petition to list black-footed albatross under the Endangered Species Act (ESA) was submitted to the USFWS by Earth Justice and is currently under review to determine if listing is warranted. Black-footed albatross is listed as a Bird of Conservation Concern at national and regional levels and in Bird Conservation Regions 5, 32, 67, and 68 (U.S. Fish and Wildlife Service, 2002). Laysan albatross is listed in Bird Conservation Regions 5, 67, and 68 (U.S. Fish and Wildlife Service, 2002). Black-footed albatross is listed as threatened by the State of Hawai`i (Mitchell and others, 2005).
Mexico
• Both species are listed as ‘Amenazada’ (Threatened) under the List of Species at Risk, Annex 2, of the Norma Oficial Mexicana NOM-059-ECOL-2001 (March 6, 2002; http://www.ine.gob.mx/ueajei/publicaciones/normas/rec_nat/no_059.html).
Canada
• Black-footed albatross was assessed nationally as a species of Special Concern by the Committee on the Status of Endangered Wildlife in Canada (2007). The Federal government is evaluating whether the species should receive legal listing under the Species at Risk Act.
• Provincially, black-footed albatross is considered secure and at no risk of extinction in British Columbia (that is, on BC’s Yellow-list), and Laysan albatrosses are considered of Special Concern (that is, on BC’s Blue-list; British Columbia Ministry of Environment, 2007).

Geographic Distribution 5
International
• The International Union for the Conservation of Nature and Natural Resources (IUCN) listed black-footed albatross as Endangered in 2003 (International Union for the Conservation of Nature and Natural Resources, 2004) based on a projected decrease of greater than 60 percent over the next three generations (56 years). The stated reason for this projected decrease was rate of incidental mortality in longline fisheries in North Pacific Ocean (International Union for the Conservation of Nature and Natural Resources, 2004; based on Lewison and Crowder, 2003).
• The IUCN listed Laysan albatross as Vulnerable in 2003 (International Union for the Conservation of Nature and Natural Resources, 2004) based on a projected decrease of greater than 30 percent over three generations (84 years). The stated reason for this projected decrease also was attributed to effects of longline fishing in the North Pacific Ocean, a threat that is ongoing (International Union for the Conservation of Nature and Natural Resources, 2004).
• Both species are listed in Appendix II of the Convention on Migratory Species (the Bonn Convention). Appendix II species “have an unfavourable conservation status or would benefit significantly from International co-operation organized by tailored agreements.”
Species’ DescriptionsThe Laysan albatross is a medium-sized albatross,
weighing approximately 3.2 kg, with males weighing about 10 percent more than females. They are 79–81 cm in length with a 195–203 cm wingspan (Harrison, 1985). The bill is pinkish-orange with a grey tip, and the feet are flesh to pink in color. The upper wings, mantle, back, upper rump, and tail are dark sooty brown. The head, lower rump, and underparts are white. The eyes have black shading and a dark iris. The sides of the head are washed with grey. The black-and-white underwing pattern varies among individuals, with wing margins having a narrow, black band and underwing coverts varying in amount of black. Juveniles have a similar appearance to adults, but have a greyer bill and less grey on the face.
The black-footed albatross is a medium-sized, dark-brown albatross, 68–74 cm in length, with a wingspan of 193–213 cm (Harrison, 1985). All ages have a blackish bill, legs, and feet. Adults are dusky brown, with white under the eye, a white band of feathers encircling the base of the bill, and white feathers over the base of the tail and undertail-coverts. Fledglings are uniformly dark brown and acquire the white ring at the base of the bill and around the tail with age (Hyrenbach, 2002).
Geographic Distribution
Breeding Colonies
The Laysan and black-footed albatrosses are open-ocean species, coming to land exclusively to breed. The core breeding range, supporting more than 99 and 95 percent of the breeding populations of Laysan and black-footed albatrosses, respectively, are the low, sandy islands of the Northwestern Hawaiian Islands (NWHI, fig. 1). The NWHI are the small islands and atolls located northwest of the islands of the main Hawaiian Islands. These include Kure and Midway atolls, Pearl and Hermes Reef, Lisianski, Laysan, Gardner Pinnacles, French Frigate Shoals, Necker, and Nihoa Islands. On the main Hawaiian Islands, black-footed albatrosses nest on the westernmost islands of Ka`ula and Lehua (VanderWerf and others, 2007). Laysan albatrosses nest more extensively on the main Hawaiian Islands on Ka`ula, Lehua, Ni`ihau, Kaua`i, and O`ahu (Harrison, 1990; VanderWerf and others, 2007). A few pairs of each species recently recolonized Wake Island, a U.S. territory in the central Pacific, but only Laysan albatrosses have successfully fledged a chick from this location (Rauzon and others, 2008).
Laysan albatrosses also breed on Mukojima in Japan (Ogasawara Islands or Bonin Islands; Hasegawa, 1984) and islands off Mexico on Guadalupe Island, Revillagigedo Islands (Clarión and San Benedicto islands), and Alijos Rocks (Pitman, 1985; Pitman and others, 2004). In Japan, black-footed albatrosses breed on Torishima of the Izu Islands; several islands in the Mukojima and Hahajima rettos of the Ogasawara Islands; and on Kita-kojima and Minami-kojima in the Senkaku Retto (Hasegawa, 1984; Tickell, 2000; T. Deguchi, Yamashina Institute for Ornithology, written commun., 2006; N. Nakamura, Yamashina Institute for Ornithology, written commun., 2008). Individual pairs of black-footed albatrosses successfully nested on Guadalupe Island in 1998 and San Benedicto in 2000 (Pitman and Ballance, 2002).
Whereas the breeding range has expanded with these new colonies in Mexico (Dunlop, 1988; Pitman and others, 2004), several historically large colonies extirpated by feather hunters in the central and western Pacific have not reestablished (Rice and Kenyon, 1962a; Tickell, 2000).
At-Sea Distribution
The foraging range for albatrosses changes with the phase of the breeding cycle. Foraging distribution has been studied using band recoveries, shipboard surveys and, more recently, satellite telemetry and geolocational loggers. BirdLife International provided maps from their Tracking Ocean Wanderers Database to illustrate the breeding and non-breeding distribution of these two species (fig. 2).

6 Status Assessment of Laysan and Black-Footed Albatrosses, North Pacific Ocean, 1923–2005
A detailed description of the methods and maps can be found in BirdLife International (2004c). The utilization distributions shown in these maps represent areas used by tracked birds; areas of low or no density do not imply an absence of birds. Areas close to deployment locations, particularly at-sea deployments where bird density does not approach that of the colonies, could show a higher use bias because the tracks are not independent samples.
At Sea: Breeding AlbatrossesLaysan Albatross.—Foraging trips of breeding Laysan
albatrosses tagged at French Frigate Shoals occur in tropical waters (greater than 20°C), as well as colder subarctic and
tac_08_9354_0255_Albatrosses_Fig02
120°E 140°E 160°E 180° 160°W 140°W 120°W
50°N
70°N
30°N
10°N
120°E 140°E 160°E 180° 160°W 140°W 120°W
50°N
70°N
30°N
10°N
140°E 160°E 180° 160°W 140°W 120°W
50°N
70°N
30°N
10°N
140°E 160°E 180° 160°W 140°W 120°W
50°N
70°N
30°N
10°N
EXPLANATION
At-sea deploymentBreeding sitesTrackedUnknown
Distribution, in percent50
75
95
Range
0
0
3,000 MILES
5,000 KILOMETERS
Projection: Plate Caree, GeographicCoordinate System. Datum: WorldGeodetic System, 1984
A. Black-footed albatross breeding B. Black-footed albatross nonbreeding
C. Laysan albatross breeding D. Laysan albatross nonbreeding
(Source: Maps produced by BirdLife International, the BirdLife Global Procellariiform Tracking Database using data from Scott A. Shaffer, Michelle Kappes, Yann Tremblay, Dan P. Costa, Bill Henry, and Don A. Croll (University of California, Santa Cruz); Dave J. Anderson and Jill Awkerman (Wake Forest University); Michelle Hester and David Hyrenbach (Oikonos – Ecosystem Knowledge and Duke University); Rob Suryan and Karen Fischer (Oregon State University); and Greg Balogh (U.S. Fish and Wildlife Service).
Figure 2. Kernel density distribution for breeding and non-breeding black-footed and Laysan albatrosses from satellite (PTT) and geolocator (GLS) tracking data.
North Pacific Transition Domain waters north of the Hawaiian breeding colonies (Hyrenbach and others, 2002; BirdLife International, 2004c). Adult foraging trips ranged from 10 to 32 days during incubation to 1–3 days during chick brooding (BirdLife International, 2004c). Hyrenbach and others (2002) reported adults brooding chicks made short trips to tropical and subtropical waters (greater than 18°C) north of the colony, with trips having a median duration of 3 days and a maximum distance of 510 km. During the post-guard period, breeding adults increased the median duration and maximum range of their trips (14.5 days; 2,675 km), mixing short (1–4 days) with long (12–29 days) trips north of the colony, over transitional (12°–15°C) and subarctic waters (less than 10°C) of the Gulf of Alaska and the Aleutian Islands (Hyrenbach and others,

Geographic Distribution 7
2002). Gender differences were not observed. During 1999, a year with high breeding failure, adults that lost chicks flew to the Kuroshio-Oyashio Current (30°–45°N and 140°–160°E) east of Japan (Fernández and others, 2001). Laysan albatrosses generally travel farther north to cool waters along the northern edge of the transition zone and farther west of the colony than black-footed albatrosses (Gould and others, 1998; S. Shaffer, University of California, Santa Cruz, written commun., 2006).
Tracking data of Laysan albatrosses breeding on Guadalupe Island, Mexico, show distinctly different foraging distributions from birds breeding in Hawai`i (BirdLife International, 2004c). Mexican birds primarily remained within the California Current System south of 45°N, showing little overlap with the at-sea distribution of Laysan albatrosses from French Frigate Shoals (BirdLife International, 2004c).
Black-Footed Albatross.—Breeding adults from Tern Island, French Frigate Shoals made both short and long trips. During incubation, foraging trips ranged from 10 to 32 days (BirdLife International, 2004c). Short trips, having a median duration of 2 days and a maximum distance of 303 km, were made into tropical waters (greater than 20°C) north of Tern Island during brooding and the post-guard periods (Hyrenbach and others, 2002, 2006). Long trips, having a median length of 9 days and a maximum range of 1,174 km, were interspersed with short trips during the post-guard period. Long trips extended northeast of the colony to the continental shelf off western North America from British Columbia to California. Roundtrips were a minimum of 9,000 km and lasted at least 15 days. During a year of low breeding success (1998–99), foraging trips during brooding were longer and primarily directed to waters distant from North America (Fernández and others, 2001).
At Sea: Non-Breeding AlbatrossesLaysan Albatross.—The western portion of the North
Pacific Ocean is used to a greater extent by Laysan than black-footed albatrosses (fig. 2). Band recovery data indicate that young Laysan albatrosses (less than 2 years old) primarily are observed off eastern Japan, along the convergence of the Kuroshio-Oyashio currents. As they get older, birds gradually shift their range east-northeast (Fisher and Fisher, 1972; Robbins and Rice, 1974). During summer (non-breeding season), adult Laysan albatrosses primarily are observed around the Aleutian Islands and the western Gulf of Alaska (Robbins and Rice, 1974; McDermond and Morgan, 1993; Melvin and others, 2004). Despite the high survey effort, few Laysan albatrosses have been observed in the California Current System (Miller, 1940; Thompson, 1951; Fisher and Fisher, 1972; Briggs and others, 1987; Briggs and others, 1992). Sightings off southern California since the mid-1980s are likely due to northern movement of Guadalupe birds (Hyrenbach, 2001). Laysan albatrosses generally are observed
over, and seaward of, the continental slope over areas of strong, persistent upwelling, and along the boundaries of different water masses (McDermond and Morgan, 1993), such as the North Pacific Subtropical Convergence (Wahl and others, 1989). During post-breeding dispersal, Laysan albatrosses from Hawai`i move into the northern and western Pacific, whereas birds from the Mexican colonies remain in the eastern Pacific (S. Shaffer, University of California, Santa Cruz, written commun., 2006).
Black-Footed Albatross.—Densities of black-footed albatrosses are higher in the eastern North Pacific Ocean than Laysan albatrosses (fig. 2). One-year-old black-footed albatrosses have been observed in the Kuroshio-Oyashio Current and along the North Pacific Subtropical Convergence (Robbins and Rice, 1974). With increasing age, individual birds shift their range farther east, toward the west coast of North America. During the summer, adults are primarily observed offshore in the North Pacific, northeast of Japan and off North America (Robbins and Rice, 1974).
Black-footed albatrosses have long been known to occupy waters off the west coast of North America. Documented observations from ships indicate that from late winter (February) to fall (November), black-footed albatrosses were the primary albatross species observed between San Francisco and Honolulu (Fisher, 1945; Yocom, 1947; Thompson, 1951). High densities of this species typically are observed offshore, over the cold waters of the California Current, as far south as Point Conception and the Channel Islands (Miller, 1936, 1940). Abundance of black-footed albatrosses is markedly reduced outside the influence of the California Current (Miller, 1940; Thompson, 1951), and compared to Laysan albatrosses, black-footed albatrosses tend to remain in warmer waters along the southern edge of the transition zone (S. Shaffer, University of California, Santa Cruz, written commun., 2006; fig. 2). In the northern part of their range, black-footed albatrosses reach the Gulf of Alaska and the Aleutian Islands in summer, where their range overlaps with Laysan albatrosses. Black-footed albatrosses are most abundant over shelf breaks and along the boundaries of water masses (Wahl and others, 1989; McDermond and Morgan, 1993).
At a “meso-scale,” distances as far as 12 km, the distribution of black-footed albatrosses is correlated with the presence of fishing vessels (Wahl and Heinemann, 1979). Black-footed albatrosses actively feed on fishing offal and discards, and their abundance is significantly affected by the presence of fishing boats (Hyrenbach, 2001).
Satellite tracking of black-footed albatrosses from the California Current System during summer indicates that they either remain in the area where they were captured (Hyrenbach and Dotson, 2003) or make long trips to the central and western Pacific Ocean in association with waters of the Transition Domain (Hyrenbach and others, 2005).

8 Status Assessment of Laysan and Black-Footed Albatrosses, North Pacific Ocean, 1923–2005
Natural History
Laysan Albatross
Breeding CycleLaysan albatrosses have a well-defined breeding cycle
with little annual or inter-island variation. Males arrive first at the nesting colonies in late October to early November. Most breeding birds return to the colony by the end of November, about 10–14 days later than black-footed albatrosses (Frings and Frings, 1961). The first eggs are laid November 15–20, and most eggs are laid by mid-December (Rice and Kenyon, 1962b; Fisher, 1969; U.S. Fish and Wildlife Service, unpub. data, 1980–2005). The incubation period averages 65 days (Rice and Kenyon, 1962b; Fisher, 1971b) and is longer than expected for an egg of its size, similar to other Procellarids and tropical seabirds (Whittow, 1984). The first eggs hatch in mid- to late January and most hatch by mid-February (Rice and Kenyon, 1962b; Fisher, 1971b; U.S. Fish and Wildlife Service, unpub. data, 1980–2005). Adults brood chicks for several days and continue to attend the chick for about 1 month (guard phase), after which the adults spend most of their time at sea, returning to land only to feed the chick. The chick rearing period averages 165 days (Rice and Kenyon, 1962b; Fisher and Fisher, 1969; U.S. Fish and Wildlife Service, unpub. data, 1980–2005), with the earliest chicks fledging in mid-June. Most fledging occurs in July, with a few individuals remaining as late as August. By the last week of July, adults are seldom seen at the colonies (Rice and Kenyon, 1962b; Fisher, 1969).
Nests and Nest SpacingLaysan albatrosses are colonial breeders that typically
nest near the center of the island on sheltered, flat areas surrounded by vegetation (Frings and Frings, 1961; Howell and Bartholomew, 1961; Rice and Kenyon, 1962b). Before egg laying, the female forms a shallow depression in the vegetation or substrate, although most of the nest construction is done by the male during the first incubation shift (Fisher, 1971b). The rim of the nest is built by gathering soil, sand, vegetation, and other material from around the nest. The completed nest, including the depression surrounding the nest, is 85–100 cm in diameter and about 15–20 cm high (Rice and Kenyon, 1962b; Fisher, 1971b).
Nest densities vary with habitat. In 1958, the highest densities at Midway Atoll (0.0845 nests/m2) were observed on Eastern Island in open, grassy areas with scattered trees (Frings and Frings; 1961). By 2005, the Laysan albatross
population had substantially increased at Midway Atoll. The highest nest densities were in the southwestern sectors of Eastern Island (0.193–0.240 nests/m2) and on Sand Island in the open, grassy areas that had been managed as parade grounds and antennae fields by the U.S. Navy (0.166–0.214 nests/m2; U.S. Fish and Wildlife Service, unpub. data, 1980–2005). The highest nest densities on Sand Island were in areas dominated by introduced turf grasses that were regularly mowed. In contrast, nest densities were lowest in open, sandy areas and areas of dense, tall vegetation such as the native beach naupaka, Scaevola taccada (U.S. Fish and Wildlife Service, unpub. data, 1980–2005). At Laysan Island, most birds nest in association with the native bunch grass (Eragrostis variabilis), the dominant vegetation of the island interior, but the highest densities are in the low, flat areas surrounding the lagoon and the guano hardpan created by past mining operations (Ely and Clapp, 1973).
Breeding Site and Mate FidelityLaysan albatrosses are monogamous with long-term pair
bonds commonly retained until death or disappearance of a mate (Whittow, 1993a). Rice and Kenyon (1962b) observed only a few occasions (2.1 percent) where both birds returned with new mates in subsequent breeding attempts.
Laysan albatrosses exhibit high fidelity to their natal islands and nesting sites (Fisher, 1971a) with limited dispersal to other islands. In a study of banded birds at Midway Atoll, Fisher and Fisher (1969) concluded that Laysan albatrosses rarely visited islands other than their natal or breeding island. Most birds that did visit other islands were subadults. First-time breeders commonly build their first nests close to their hatch site with males (median = 12.3 m, range = 2.4–49.8 m) nesting closer to their hatching location than females (median=24 m, range = 2.4–42 m; Fisher, 1971a). Established pairs return to almost the same exact location to breed. At Midway Atoll, returning pairs nested within 1–6 m of where they nested in previous years (Rice and Kenyon, 1962b; Fisher, 1971a).
Demography and Limiting FactorsBreeding Age.—Laysan albatrosses can breed as early
as 5 years of age (Fisher and Fisher, 1969). The mean age of first breeding is 8 to 9 years with males starting a year earlier than females (Fisher, 1975b). Nearly all birds begin breeding by age 12, with only a small percentage starting as late as 16 years (Van Ryzen and Fisher, 1976).
Fecundity.—Females lay only one egg per season, and they do not relay if the egg is lost (Fisher, 1968). Although physiologically capable of producing an egg every year (Whittow, 1993a), most females periodically skip a breeding season. Fisher (1976) conducted a study at Midway Atoll

Natural History 9
(1960 to 1973) and found that breeding frequency was affected by food availability, characteristics of the pair bond, breeding experience, previous season’s breeding success, and possibly gender. For birds in which the pair bond was maintained over the 10–13 year study, the mean breeding frequency per pair per year ranged from 0.82 to 0.86. Mean breeding frequency decreased to 0.71, 0.64, and 0.57 for albatrosses with two, three, and four different mates, respectively. Albatrosses that lose a mate, through widowing or other reasons, lost on average 1.4 (males) and 1.9 (females) breeding seasons before resuming breeding with a different mate (Fisher, 1976). Inexperienced breeding birds had lower breeding frequencies than experienced birds (mean = 0.59 during the first 5 years), and more than one-half of young pairs did not breed in the year following their first attempt (Fisher, 1976). Albatrosses that successfully raised a chick had a higher probability of skipping the next breeding season than those that lost their egg or chick (Rice and Kenyon, 1962b).
Breeding Success.—Reproductive success at French Frigate Shoals (mean = 0.64, SD = 0.19, n = 25 years; U.S. Fish and Wildlife Service, unpub. data, 1980–2005) from 1980 to 2004 was comparable to that of Midway Atoll from 1961 to 1972 (mean = 0.63, SD = 0.1, n = 4 years; Fisher, 1975a), but more recent data (1992–2001) indicate a lower success rate at French Frigate Shoals (mean = 0.50, SD = 0.20, n = 8 years; U.S. Fish and Wildlife Service, unpub. data, 1980–2005). The lowest success rates were calculated for Laysan Island (mean = 0.24, SD = 0.05, n = 4 years) from 1992 to 1995 (U.S. Fish and Wildlife Service, unpub. data, 1980–2005). The primary cause of nest failure was desertion by one parent, but other sources include flooding, oceanographic anomalies, rat predation, and strong storms (Fisher, 1971b, 1975a; Woodward, 1972; U.S. Fish and Wildlife Service, unpub. data, 1980–2005). Storms with high waves that completely wash over small islets may cause higher nest loss than nest desertion at some sites. These storms have little effect on adult survival (Fisher, 1975a, 1976).
Fledglings are susceptible to many sources of mortality. After leaving the nest area, young albatrosses congregate along the beaches for several days before leaving the island, and many die of starvation during this period (Rice and Kenyon, 1962b; Fisher and Fisher, 1969). During their first flights to sea, young albatrosses are susceptible to predation by tiger sharks (Galeocerdo cuvieri) or may become water-logged and drown. Fisher (1975a) estimated that 3.5–10 percent of chicks fledged from the nest did not reach the open ocean.
The breeding period is a time of high-energy demand. Breeding adults lose as much as 26 percent of their body mass between when they arrive at the colony site and when their chicks reach peak mass (Fisher, 1967). Albatrosses may need to reach a minimum body weight to attempt breeding (Fisher, 1967), and birds that skip breeding most likely did not reach this threshold. Fisher (1967) found that non-breeding
birds had body masses that were 8–11 percent lower than those of breeding birds. If adults with low body weights initiate breeding, they may be more susceptible to deserting the nest due to depletion of energy reserves. Therefore, food availability during non-breeding and breeding seasons is likely to affect breeding attempts and their success.
Juvenile and Adult Survival.—A few subadults return to the colony when they are 2 years old, but most wait until they are 4 years of age (Fisher, 1969). USFWS initiated monitoring to estimate adult survival rates in 2005 but currently, the only available information is from Fisher’s work conducted at Midway Atoll from 1961 to 1973 (Fisher, 1975a). Annual survival rates of 0.91 were estimated for juveniles (fledging to 4 years old). Annual survival rates were 0.982 for individuals between 4 and 8 years old, when Laysan albatrosses begin breeding. Once adults start breeding their survival rates decrease, probably due to the high energetic costs associated with egg-laying and chick-rearing. However, Fisher (1975a, 1975b) found first-time breeders had higher annual survival than experienced breeders (0.960 versus 0.946, respectively), perhaps because they had lower breeding frequencies and success.
PredatorsThe only known predators of Laysan albatrosses are tiger
sharks and introduced mammals, including rats, mongooses, dogs, cats, and pigs. Tiger sharks prey on fledglings when first learning to fly. Shark numbers vary from year to year (Rice, 1959), but are present during fledging at all NWHI that support large albatross colonies.
Polynesian rats (Rattus exulans) killed nesting adults and chicks on Green Island, Kure Atoll (Kepler, 1967; Woodward, 1972), until rats were eradicated in 1995 (C. Vanderlip and A. Marie, Hawai`i Department of Land and Natural Resources, unpub. data, 2004). Rat predation varied annually with almost no predation in some years and close to 100 percent chick mortality in other years (Woodward, 1972). At Midway Atoll, black rats (Rattus rattus) preyed on chicks and abandoned eggs, but they did not appear to attack healthy chicks or incubating adults (Fisher, 1971b). Rats were eradicated from Midway Atoll in 1996 (U.S. Fish and Wildlife Service, 2005). On the main Hawaiian Islands, feral and domestic dogs and cats kill albatross adults and chicks, and predator control programs are needed to protect nesting colonies (Mitchell and others, 2005; U.S. Fish and Wildlife Service, 2005). Mongooses are suspected egg predators. In addition, cats and dogs are important predators on the Mexican islands. The smaller offshore islets that are free of predators and human disturbance provide refuge for these colonies (Pitman and others, 2004). Feral pigs threatened the albatross colony on Clarion Island until they were eradicated in 2001 (Island Conservation and Ecology Group, 2001).

10 Status Assessment of Laysan and Black-Footed Albatrosses, North Pacific Ocean, 1923–2005
Diet and Foraging BehaviorLaysan albatrosses eat squid, fish, and other invertebrates
and will scavenge on fisheries offal (fish scraps and guts) when available (Whittow, 1993a). Based on their diet and high rhodopsin (a visual pigment that enhances nocturnal vision) levels in their eyes, Laysan albatross were believed to feed at night on vertically migrating squid, when squid are near the surface (Harrison and others, 1983). Pitman and others (2004) found deep-water squid species in stomach samples of Laysan albatrosses from Guadalupe Island, Mexico, and suggested that Laysan albatrosses fed during the day by scavenging on squid that died after mating and floated to the surface.
During the breeding season, Hawaiian albatrosses fed their chicks primarily squid (65 percent), fish (9 percent), crustaceans (9 percent), and coelenterates (4 percent by volume; Harrison and others, 1983). Less than 6 percent of the squid were identified, and flying squid (Ommastrephidae) dominated those that were identified (Harrison and others, 1983). Pitman and others (2004) identified more than 97 percent of the cephalopod beaks in the samples from Mexico. Many families were represented (including Cranchiidae, 32 percent; Histioteuthidae, 27 percent; and Gonatidae, 20 percent), but not Ommastrephidae. The reason for this discrepancy is unknown, but the small percentage of squid identified in the Hawaiian study could be a factor. Pitman and others (2004) suggest that either the Hawaiian samples reflected the diets of birds scavenging from the North Pacific driftnet fishery, or they fed in a different region than birds from Mexican colonies.
Laysan albatrosses extensively scavenged on North Pacific driftnet fisheries while this fishery was active from 1978 to 1992 (Gould and others, 1997). The main prey species scavenged from the nets were neon flying squid (Ommastrephes bartrami) and Pacific pomfret (Brama japonica), which accounted for 68 and 14 percent by mass, respectively, of stomach samples from collected birds killed as bycatch. Among the prey items that were highly digested, and thus thought to be caught away from the nets, were myctophid fish (Electrona risso, Symbolophorus californiense, Lampanyctus jordani) and Pacific saury (Cololabis saira), all occurring in greater than 5 percent of the stomach samples (Gould and others, 1997).
Pacific saury is a pelagic, fast-growing fish with high commercial value found in the North Pacific Ocean from Japan to the Gulf of Alaska and southward to Mexico (Eschmeyer and others, 1983). Pacific saury was documented by Harrison and others (1983) as occurring in Midway Atoll samples during the winter, but not from other islands. This prey species also was found in diet samples from Laysan albatrosses but not black-footed albatrosses. These results suggest that small, schooling fish are important prey for Laysan albatrosses foraging in the western Pacific Transitional Zone and these results agree with the higher densities of Laysan albatrosses documented in this zone during June–September by Gould and others (1998).
Stable isotope analysis (δ13C and δ15N) of the birds killed in driftnet fisheries indicated that adult Laysan albatrosses fed at a lower trophic level than juveniles (Gould and others, 1997), suggesting that juveniles may have had a higher association with the driftnet fisheries. This agrees with the high proportion of juveniles salvaged from this fishery.
Black-Footed Albatross
Breeding CycleBlack-footed albatrosses also have a well-defined
breeding cycle with little annual or inter-island variation. Birds arrive at the islands in mid- to late October. The first eggs are laid November 8–18 and most eggs are laid by early to mid-December, although a few eggs are laid through the end of the month (Rice and Kenyon, 1962b; Woodward, 1972; U.S. Fish and Wildlife Service, unpub. data, 1980–2005). The incubation period averages 66 days (Rice and Kenyon, 1962b) and, similar to other Procellarids and tropical seabirds, is longer than expected for an egg of this size (Whittow, 1984). The first eggs hatch in mid-January and most hatch by early February (Rice and Kenyon, 1962b; Woodward, 1972; U.S. Fish and Wildlife Service, unpub. data, 1980–2005). A few eggs hatch as late as February 20–22 (U.S. Fish and Wildlife Service, unpub. data, 1980–2005). Adults brood the chicks for several days and continue to attend the chick for about 1 month (guard phase), after which the adults spend most of their time at sea, returning to the island only to feed the chick. The chick-rearing period averages 150 days (Rice and Kenyon, 1962b; Woodward, 1972) with the earliest fledging of chicks in early June. Most fledging occurs from mid-June to mid-July with a few individuals remaining as late as August. Adults are seldom seen at the colonies after early June (Rice and Kenyon, 1962b; Woodward, 1972; Whittow, 1993b).
Nests and Nest SpacingBlack-footed albatrosses are colonial nesters. Their nests
consist of a shallow depression in loose, sandy substrate, surrounded by a rim of packed sand a few centimeters high. Nests are most common along wind-swept, sandy shores, or along the periphery of vegetation (Frings and Frings, 1961; Howell and Bartholomew, 1961; Rice and Kenyon, 1962b). At Midway Atoll and French Frigate Shoals, the birds also nest in areas of low-growing vegetation. Fisher (1972) suggested that black-footed albatrosses nesting far from the beach in Midway Atoll’s vegetated habitats had initially nested in more typical sandy, shoreline habitat but that the vegetation and distance to sea had changed as a result of human manipulations. The highest nest densities at Midway Atoll in 1960 and 2005 were comparable at 0.024 nest/m2 (Robbins, 1966) and 0.025 nest/m2 (U.S. Fish and Wildlife Service, unpub. data, 1980–2005), respectively.

Natural History 11
Breeding Site and Mate FidelityAlbatrosses are monogamous with pair bonds typically
retained until death or disappearance of one mate (Whittow, 1993b). Of 42 black-footed albatross pairs banded at French Frigate Shoals, 9.5 percent of females and 19 percent of males changed mates at least once during a 4-year study (U.S. Fish and Wildlife Service, unpub. data, 1980–2005). The other member of the pair did not return to the island prior to the mate change (U.S. Fish and Wildlife Service, unpub. data, 1980–2005).
Most young birds return to their natal islands to breed with limited dispersal to other islands. Chicks banded at French Frigate Shoals, Pearl and Hermes Reef, and Midway Atoll were recaptured at Kure Atoll from 1963 to 1969, and 32 of the 158 chicks from other islands subsequently nested at Kure Atoll (Woodward, 1972). Most (86 percent) of the albatrosses that were banded on other islands and recaptured at Kure Atoll had been banded as chicks (Woodward, 1972). Established pairs return to the same island and almost the same location to breed. Returning pairs nest on average within 4.5–5.8 m of where they nested the previous year (Rice and Kenyon, 1962b; Robbins, 1966).
Demography and Limiting FactorsBreeding Age.—The earliest breeding age for black-
footed albatrosses is 5 years. The average age is 7 years (Viggiano, 2001).
Fecundity.—Females lay one egg per season and do not relay if the egg is lost (Rice and Kenyon, 1962b). Although females are physiologically able to breed every year, most do not. At Midway Atoll, most individuals (63 percent) nest in 2 consecutive years, but only 42 percent nest in 3 consecutive years (Robbins, 1966). At French Frigate Shoals, 69 percent of the females and 72 percent of the males nested in any given year, and 41 percent of the females and 38 percent of the males nested in 4 consecutive years, 1991–94 (U.S. Fish and Wildlife Service, unpub. data, 1980–2005). Viggiano (2001) found the probability of breeding in a given year was related to molt and breeding success in the previous year. On average, 75 percent of black-footed albatrosses that successfully fledged a chick bred the next year, while 83 percent of those that failed to fledge a chick bred the next year (Viggiano, 2001).
Breeding Success.—Breeding success of black-footed albatrosses from egg to fledging was 0.42 (SD = 0.04, n = 4 years) at Kure Atoll during the 1960s (Woodward, 1972). More recent studies at Midway Atoll (1992–2001) and French Frigate Shoals (1980–2004) indicate higher reproductive success, averaging 0.55 (SD = 0.16, n = 8 years) and 0.69 (SD = 0.11, n = 25 years), respectively (U.S. Fish and Wildlife Service, unpub. data, 1980–2005). The lowest success rates in recent years were measured at Laysan Island (1992–1995;
mean = 0.40, SD = 0.02, n = 4 years; U.S. Fish and Wildlife Service, unpub. data, 1980–2005), a value similar to estimates from Kure Atoll during the era when rats were present (Woodward, 1972).
The primary factors contributing to breeding failure at Kure Atoll from 1963 to 1968 were adult desertion, winter storms, and rat predation (Woodward, 1972). Rats have been eradicated from all NWHI (U.S. Fish and Wildlife Service, 2005). Because black-footed albatrosses nest closer to the ocean, they are more affected by winter storms than Laysan albatrosses. High waves destroy near-shore nests, and strong winds bury nests in sand, including the chick or in some cases the incubating adult (Fisher, 1971b; McDermond and Morgan, 1993).
Juvenile and Adult Survival.—Juveniles return to the colony at the age of 3-4 years (Rice and Kenyon, 1962b). Annual survival rates from fledging to 5 years were estimated to be 0.75 at Kure Atoll (1960–68; Woodward, 1972). Viggiano (2001) estimated the annual survival rate of juveniles 0–5 years old to be 0.79, 2–4 years old to be 0.89, and breeding adults to be 0.89 from French Frigate Shoals.
PredatorsTiger sharks prey upon fledglings of black-footed
albatross during their first flights to sea (U.S. Fish and Wildlife Service, unpub. data, 1980–2005). On Kure Atoll, chicks were killed by Polynesian rats (Woodward, 1972). However, this is no longer a problem in the NWHI because rats have been eradicated from Midway and Kure Atolls (U.S. Fish and Wildlife Service, 2005).
Diet and Foraging BehaviorBlack-footed albatrosses feed at the surface by surface-
seizing, contact dipping, and scavenging (Gould and others, 1998). They eat squid, fish, and other invertebrates and scavenge fisheries offal when available (Whittow, 1993b).
Most diet information is derived from two sources: Harrison and others (1983) and Gould and others (1997). Harrison and others (1983) collected regurgitated samples throughout the chick-feeding stage from birds in the Hawaiian colonies (1978–80), and Gould and others (1997) collected stomach samples from birds killed in the driftnet fisheries. During chick rearing, black-footed albatrosses in Hawai`i fed their chicks 50 percent fish, 32 percent squid, and 5 percent crustaceans on a volume basis, although these data may be biased due to the highly digested condition of the stomach contents. Main prey items identified were flyingfish ova, Family Exocoetidae (frequency of occurrence = 80.2 percent, volume = 44.2 percent); and squid, Family Ommastrephidae (frequency of occurrence = 11.7 percent, volume = 3.4 percent; Harrison and others, 1983).

12 Status Assessment of Laysan and Black-Footed Albatrosses, North Pacific Ocean, 1923–2005
Squid and large-mesh driftnet fisheries operated from 1978 to 1992, primarily in the Transitional Zone (35°–46°N and 145°W–145°E; Ito and others, 1993). Black-footed albatrosses scavenged extensively from nets, primarily on neon flying squid (Ommastrephes bartrami) and Pacific pomfret (Brama japonica), which accounted for 67 and 18 percent mass, respectively (Gould and others, 1997). Highly digested items, thought to be consumed before the birds were entangled in the net, were primarily squids from the families Gonatidae (Gonatopsis, Berryteuthis, Gonatus), Cranchiidae (Leachia, Taonius, Galiteuthis), Onychoteuthidae (Onychoteuthis borealijaponicus), and Octopoteuthidae (Octopoteuthis deletron). All species represented greater than 5 percent frequency of occurrence (Gould and others, 1997). These studies indicate that Laysan and black-footed albatrosses take similar prey items but in different proportions, which may reflect their different distributions at sea.
Habitat RequirementsOne basic life-history characteristic of albatross species
is the separation of nesting and foraging areas. Nesting of Laysan and black-footed albatrosses is restricted to oceanic islands. Laysan albatrosses prefer to nest on level areas in the interior of islands, typically in association with grass and other low vegetation, although dense vegetation precludes nesting (Frings and Frings, 1961; Howell and Bartholomew, 1961; Woodward, 1972). By contrast, black-footed albatrosses primarily nest on sandy areas near the shore (Frings and Frings, 1961). At sea, both species widely range over the North Pacific (see section, “Geographic Distribution”).
ThreatsLaysan and black-footed albatrosses face a wide range
of threats at sea and on the breeding islands. Interactions with commercial fishing operations (bycatch), contaminants, and plastics threaten birds at sea, while invasive species (predators, plants, and invertebrates), contaminants, habitat degradation, and human disturbance threaten birds at nesting colonies. Changes associated with global climate change potentially threaten both species at sea and on breeding grounds.
Fishery Bycatch
Mortality due to fisheries is the primary factor threatening Laysan and black-footed albatross populations (Croxall and Gales, 1998; Gales, 1998; Cousins and Cooper, 2000; Lewison and Crowder, 2003). To assess its effect on both species, we conducted a detailed analysis of all fisheries
for which bycatch of Laysan and black-footed albatrosses has been documented. Bycatch refers to non-target species unintentionally caught in fishing gear. The three main fisheries for which bycatch data are available are high seas driftnet, Alaskan and Canadian demersal longline, and U.S. pelagic longline. Bycatch information for other longline fisheries, such as the U.S. West Coast groundfish fishery and foreign longline fleets, were not available at the time of these analyses.
Description of the FisheriesHigh Seas Driftnet Fisheries.—Three general types of
driftnet fisheries operated in the high seas of the North Pacific until 1992: (1) salmon driftnet fishery (Japan), (2) large-mesh driftnet fishery for billfish and tuna (Japan and Taiwan), and (3) squid driftnet fishery (Japan, the Republic of Korea, and Taiwan) (DeGange and others, 1993; Ogi and others, 1993). These fisheries used large nets, usually 15 to 60 km long, vertically suspended in the water, from the surface to 6 to 8 m deep (DeGange and Day, 1991; Gong and others, 1993; Nakano and others, 1993). Due to the high rate of incidental mortality to seabirds, marine mammals, sea turtles, and non-target fish by this fishing gear, a global moratorium on high-seas pelagic driftnet fishing was adopted in December 1991 (to be fully implemented by December 1992) by the United Nations (UN) General Assembly Resolution 46-215. However, a few vessels continue to illegally fish with driftnets in the North Pacific high-seas (National Marine Fisheries Service, 2005).
The Japanese high-seas salmon driftnet fishery operated from 1952 to1991 and was divided into mothership and land-based salmon fisheries (DeGange and Day, 1991; Ogi and others, 1993). The mothership salmon fishery operated primarily southeast of the westernmost Aleutian Islands, inside the U.S. exclusive economic zone (EEZ) (DeGange and others, 1993). This fishery peaked in 1959 and subsequently decreased until its closure in 1991. The land-based salmon fishery operated primarily off eastern Japan (DeGange and Day, 1991). This fishery reached its highest effort from 1955 to 1976, then declined until being closed in 1991 (DeGange and Day, 1991; Ogi and others, 1993). During peak years, hundreds of thousands of kilometers of net were set each season. Albatross bycatch was not known to occur in the mothership fishery, but Laysan albatrosses were killed in the land-based salmon fishery (DeGange and Day, 1991; DeGange and others, 1993; Ogi and others, 1993).
The Japanese large-mesh driftnet fishery targeted striped marlin, broadbill swordfish, tuna, and albacore, whereas the Taiwanese fleet fished mostly for tuna (DeGange and others, 1993; Ogi and others, 1993). The fishing grounds established by the Japanese government were between 10°–46°N and from 145°W to Japan, excepting the U.S. EEZ around Hawai`i (Nagao and others, 1993), but fishing effort was concentrated

Threats 13
between 20°–40°N and 150°W–140°E (Nakano and others, 1993). The Taiwanese fleet began fishing in 1980 and operated in most of the North Pacific. Laysan and black-footed albatrosses were killed in both the Japanese and Taiwanese fleets (Johnson and others, 1993; Ogi and others, 1993) prior to closure of the fishery in 1992 due to the UN ban.
The squid driftnet fishery was composed of fleets from Japan, Korea, and Taiwan. This fishery started in 1978, increased until 1985, and decreased until closing in 1992 (DeGange and others, 1993). The targeted species was the neon flying squid. The fishery was concentrated in the Subtropical Convergence between 34°–46°N, with most of the fishing effort occurring in the western Pacific Ocean (Gong and others, 1993; Yatsu and others, 1993; Yeh and Tung, 1993). A distributional analysis of seabird bycatch by the Korean fleet indicates two areas with high bycatch rates; one north of the Hawaiian Islands (165°–175°W) and the other off of Japan (142°–162°E, Gong and others, 1993). Large numbers of albatrosses were killed in these fisheries (Johnson and others, 1993; Ogi and others, 1993).
The UN moratorium only applied to high seas fisheries, therefore driftnet fisheries still exist in the Exclusive Economic Zones (EEZ) of some countries. Laysan albatrosses are killed in the Japanese salmon driftnet fishery in Russia’s EEZ (Artyukhin and Burkanov, 2000). In the U.S., large mesh gillnets are fished within the EEZ off California and Oregon, but no albatross bycatch has been recorded (Julian and Beeson, 1998).
Longline Fishing.—Longline fishing is a commercial technique that deploys hundreds or thousands of baited hooks set on the seabed (demersal longlining) or in the water column (pelagic longlining). In this way, longlines can be used to target a variety of fishes from bottom-dwelling species, such as halibut, to tunas of the open seas (Brothers and others, 1999). As surface-scavengers, albatrosses are drawn to fishing vessels to supplement their food with discards or by stealing baits from hooks.
Demersal (bottom) longline fisheries primarily target halibut and other groundfish species. In the northern and northeastern Pacific Ocean, the primary species targeted are (from National Marine Fisheries Service, 2006; Fisheries and Ocean Canada, accessed January 24, 2009, at http://www.pac.dfo-mpo.gc.ca/ops/fm/Groundfish/default_e.htm) halibut (Hippoglossus stenolepis), Pacific cod (Gadus macrocephalus), Greenland turbot (Reinhardtius hippoglossoides), sablefish (Anoplopoma fimbria), rockfish species (family Scorpaenidae), lingcod (Ophiodon elongatus), and spiny dogfish (Squalus acanthias). Except for halibut, these fish are collectively referred to as groundfish, and the demersal longline fisheries for groundfish off of Alaska, Washington, Oregon, and California are managed by the National Marine Fisheries Service (NMFS). The halibut
fishery is managed by the International Halibut Commission (IPHC). China, Taiwan, Japan, Korea, and Russia all operate demersal longline fisheries in the northwestern Pacific Ocean (Brothers and others, 1999).
Pelagic longline fisheries are the main fisheries currently operating in the central North Pacific Ocean and are considered the greatest threat to the black-footed albatross (Cousins and Cooper, 2000; Lewison and Crowder, 2003). The IUCN listed the black-footed albatross as Endangered and the Laysan albatross as Vulnerable in 2003 in response to the threat posed by this fishery (International Union for the Conservation of Nature and Natural Resources, 2004).
The Hawaii-based pelagic longline fleet operates from the Equator to 50°N, between 135°W and 170°E, with the highest fishing effort near the Hawaiian Archipelago (U.S. Fish and Wildlife Service, 2004b). However, the highest incidence of interactions with albatrosses occurs between 25°–35°N and 140°W–175°E (U.S. Fish and Wildlife Service, 2004b). The number of vessels fishing from Hawai`i increased in the late 1980s and peaked at 141 in 1991. The high bycatch rate of protected species (sea turtles, cetaceans, and seabirds) associated with the pelagic longline fisheries for broadbill swordfish (Xiphias gladius) led to the implementation of gear modifications and area closures. Due to the continued high bycatch of sea turtles (Kinan, 2003a, 2003b), the Hawaii-based longline fishery for swordfish was closed by a Federal court order in April 2001 (emergency rule 66 FR 31561) and ratified in 2002 (C.M. 67FR40232, June 12, 2002). In 2002, only 100 vessels were still active, all targeting tuna (U.S. Fish and Wildlife Service, 2004b). The primary species of tuna targeted are bigeye tuna (Thunnus obesus), albacore tuna (Thunnus alalunga), and yellow fin tuna (Thunnus albacares). The swordfish-directed sector of the fishery was reopened in Hawai`i on April 2, 2004 (69 FR 17329) under new mitigation requirements to reduce sea turtle bycatch (National Marine Fisheries Service, 2005, p. 138).
Swordfish and tuna landings in California began in 1991. By 1994, 31 vessels were fishing in the same general region as Hawaii-based longliners, but landing their catches in southern California. All fishing was conducted outside California’s EEZ (U.S. Fish and Wildlife Service, 2004a). From 1995 to 2001, most of the landings in California were from fishing grounds around 135°–150°W during fall and winter, and moved west, north of Hawai`i during spring-summer. As a consequence of the area closures and increased regulation in the Hawaiian swordfish fishery, part of the Hawaiian fleet moved their base port to California (about 35 vessels in 2001), where gear and setting regulations were not in place. A voluntary observer program was initiated in October 2001 that became mandatory in August 2002 (U.S. Fish and Wildlife Service, 2004a). The West Coast longline swordfish fishery was closed in 2004 (69 FR 11540, March 11, 2004; U.S. Fish and Wildlife Service, 2004a).

14 Status Assessment of Laysan and Black-Footed Albatrosses, North Pacific Ocean, 1923–2005
There also are pelagic longline fleets from Japan, Korea, and Taiwan fishing for tuna and billfish in the North Pacific Ocean (Kinan, 2003a). Korean fleets fish south of 20°N (Lewison and Crowder, 2003) and thus, are not considered here. Information on fishing effort by these fisheries is available through the public domain database maintained by the Ocean Fisheries Program (OFP) for pelagic fisheries (primarily tuna) in the North Pacific Ocean. This database includes fishing effort from all fleets combined, including the U.S. (OFP-Public Domain Catch and Effort Data). However, no estimates of seabird bycatch or information on the use of mitigation measures to reduce seabird bycatch are available for International fleets.
Bycatch EstimationThe many fisheries operating in the North Pacific incur
varying levels of albatross bycatch. Data sources for bycatch estimates are summarized in table 1, and detailed analyses and results for each fishery are presented in appendix A.
From 1950 to 1977, we estimated bycatch of Laysan albatrosses to be less than 6,000 albatrosses per year, but during the period of driftnet fishing, 1978 to 1992, bycatch increased to an estimated 27,800 albatrosses per year (fig. 3). For black-footed albatrosses, the bycatch estimates showed a bimodal distribution with a peak of 15,290 birds in 1961 and a second peak of 16,215 birds in 1988 (fig. 4). The 1988
Type of data Fishery Species Source Year
Driftnet Japanese land-based salmon LAAL DeGange and Day, 1991 1977–1987Driftnet Japanese land-based salmon LAAL Ogi and others, 1993 1990Driftnet Japanese large-mesh driftnet LAAL/BFAL Johnson and others, 1993; Ogi and others, 1993 1990Driftnet Taiwanese driftnet: large mesh and squid LAAL/BFAL Johnson and others, 1993; Ogi and others, 1993 1990Driftnet Japanese squid driftnet LAAL/BFAL Johnson and others, 1993; Ogi and others, 1993 1990Driftnet Korean squid driftnet LAAL/BFAL Johnson and others, 1993; Ogi and others, 1993 1990Driftnet Japanese total fishing effort LAAL/BFAL Yatsu and others, 1993 1982–1990Demersal Longline Alaskan longline groundfish LAAL/BFAL Boldt, 2004; National Marine Fisheries Service,
2005b
Demersal Longline Washington & British Columbia longlines LAAL/BFAL Smith and Morgan, 2005 Demersal Longline Halibut fishery effort IPHC web page—http://www.iphc.washington.
edu/halcom/research/sa/sa.data/sa.data.htmlDemersal Longline Halibut fishery effort for British Columbia Smith and Morgan, 2005 2000–2002Demersal Longline Halibut, Gulf of Alaska and Aleutians LAAL/BFAL Geernaert and others, 2001 1998–1999Demersal Longline Halibut fishery for British Columbia LAAL/BFAL Smith and Morgan, 2005 1999–2002Pelagic Longline International pelagic longline fisheries effort Ocean Fisheries Program (OFP)—http://www.
spc.int/oceanfish/
Pelagic Longline Hawai`i fishing effort for tuna and swordfish Kinan, 2003a, 2003b, 2004; National Marine Fisheries Service, 2005a
Pelagic Longline Scientific observer program data National Oceanic and Atmospheric Administration Fisheries, Hawai`i
1994–2004
Table 1. Data sources used in bycatch estimations for Laysan (LAAL) and black-footed (BFAL) albatrosses.
peak was due to the combined effect of high-seas driftnet and longline fisheries. The estimated bycatch in demersal fisheries off Alaska represents only a small fraction of the 2005 estimate of total bycatch (figs. 3 and 4), and, at the time of these analyses, the bycatch rate is unknown for either albatross species in the demersal longline fisheries off California, Oregon, and Washington.
Overall, the high-seas driftnet and longline fisheries have been the most important causes of mortality for Laysan and black-footed albatrosses over the past 50 years, but effects differ between species. Pelagic longlines have killed a large number of albatrosses each year since the fishery started in 1951. The driftnet fishery, primarily active from 1978 to 1992, killed a disproportionately large number of black-footed albatrosses, and a significant number of Laysan albatrosses, in addition to other seabirds, marine mammals, sea turtles, and fish. Closure of the fishery in 1992 by a United Nations Resolution (National Marine Fisheries Service, 2005) significantly reduced the total number of albatrosses killed each year.
In contrast, albatross mortality in pelagic longline fisheries continues. This is especially worrisome because, while most U.S. and Canadian fisheries require use of mitigation measures and observer programs, there is no scientific observer program on the International pelagic longline fleet, thus preventing accurate estimates of total bycatch and hampering establishment of mitigation programs.

Threats 15
Figure 3. Total estimated number of Laysan albatrosses killed by commercial fisheries in the North Pacific Ocean, 1951–2005.
Figure 4. Total estimated number of black-footed albatrosses killed by commercial fisheries in the North Pacific Ocean, 1951–2005.
tac_08_9354_0255_Albatrosses_Fig03
0
5,000
10,000
15,000
20,000
25,000
30,000
35,000
40,000
1950 1955 1960 1965 1970 1975 1980 1985 1990 1995 2000 2005
ESTI
MA
TED
MO
RTA
LITY
Total
Pelagic longlineDriftnets
Demersal longlineAlaska trawl
Estimated Number of Laysan Albatrosses Killed solid line = mean dashed line = 95-percent confidence interval
tac_08_9354_0255_Albatrosses_Fig04
0
5,000
10,000
15,000
20,000
25,000
1950 1955 1960 1965 1970 1975 1980 1985 1990 1995 2000 2005
ESTI
MA
TED
MO
RTA
LITY
Total
Pelagic longlineDriftnet
Demersal longline
Estimated Number of Black-Footed Albatrosses Killed solid line = mean dashed line = 95-percent confidence interval

16 Status Assessment of Laysan and Black-Footed Albatrosses, North Pacific Ocean, 1923–2005
Predation
Prior to human influence, albatrosses were threatened by few, if any, predators on their remote nesting islands. Tiger sharks are the only native predators in the NWHI. All introduced mammals have been removed from the NWHI, with the exception of the house mouse (Mus musculus) on Midway Atoll (U.S. Fish and Wildlife Service, 2005). Although currently not a threat, the house mouse has been identified as an important predator of Tristan albatross (Diomedea dabbenena) chicks on Gough Island, and they potentially pose a threat on Midway Atoll in the future (Angel and Cooper, 2006; Wanless and others, 2007).
Dogs nearly extirpated several albatross colonies along Kaua`i’s north shore until fences were installed at Kilauea Point National Wildlife Refuge (NWR) and predator control programs were instituted (U.S. Fish and Wildlife Service, 2005). Dogs, cats, rats, and mongooses are an on-going problem at the Ka`ena Point Natural Area Reserve colony on O`ahu where the Hawai`i Department of Land and Natural Resources oversees control programs.
In Mexico, the Clarion raven (Corvus corax clarionensis) and the Clarion racer (Masticophis anthonyi) are the only native predators that may take albatross chicks or eggs on Clarion Island. Observations are limited and the impact of this predation is unknown (B. Keitt, University of California Santa Cruz, written. commun., 2008). Predation by introduced cats at Guadalupe Island limits the growth of populations at this site. If not controlled, cat predation could eventually cause extirpation of the colonies on the main island. Nearby islets provide secure nesting habitat because the islets are predator-free and undisturbed by humans (Pitman and others, 2004). Predator control programs by Grupo de Ecologia y Conservación de Islas and the Mexican Natural Resource agency SEMARNAT have been effective in limiting predation on Guadalupe Island (Keitt and others, 2006). Dogs have been eradicated from Guadalupe Island and introduced pigs have been eradicated from Clarion Island (Aguirre-Munoz and others, 2008).
Presence of introduced predators on former breeding islands in the Marshalls, Marianas, and Japan could be a factor precluding albatrosses from reoccupying some of these sites.
Introduced Species
In addition to the mammalian predators (see section, “Predation”), introduced herbivores, invertebrates, and plants also have had major impacts on albatross populations and their nesting habitats. Rabbits were introduced to Laysan and Lisianski Islands in 1903 (Tickell, 2000) and to Pearl and Hermes Reef probably during the era of feather poaching (Amerson and others, 1974). Rabbits almost completely denuded these islands of vegetation before the animals died of starvation or were eradicated from 1915 to 1928 (Ely and
Clapp, 1973; Amerson and others, 1974; Clapp and Wirtz, 1975). In Mexico, rabbits continue to degrade habitat on Clarion Island, but sheep have been eradicated from Clarion Island and goats have been eradicated from Guadalupe Island (Aguirre-Munoz and others, 2008).
Mosquitoes, a vector for avian pox, were introduced to the main Hawaiian Islands in 1826 (Warner, 1968) and also occur on Midway Atoll. The effect of introduced ants at colonies in Hawai`i and Mexico is unknown.
Many exotic plant species have been introduced to the islands. Some of these plants have enhanced albatross nesting habitat although others have seriously degraded it (see section, “Threats – Habitat Loss and Degradation”).
Habitat Loss and Degradation
The Northwestern Hawaiian Islands (NWHI) have undergone a series of physical changes during the past century as a result of human occupation. A detailed account for each breeding island is presented in appendix B.
Invasive PlantsOver the past century, many non-native plant species
have been introduced to the NWHI. Of these, ironwood trees (Casuarina equisetifolia) and golden crown-beard (Verbesina encelioides) probably have had the greatest negative impact on albatross populations. Ironwood trees are particularly abundant at Sand Island (Midway Atoll), where they present an obstacle for flight (U.S. Fish and Wildlife Service, 2005). Laysan albatross will nest under the closed-canopy ironwood forest, but densities in this habitat are lower than in habitats with low vegetation. Ironwood trees were eradicated from Eastern Island (Midway Atoll) during the past decade. The ironwood trees on Sand Island also support the largest colonies of white terns (Gygis alba) and black noddies (Anous minutus) in the Hawaiian Islands (U.S. Fish and Wildlife Service, 2005). Therefore, complete removal of ironwood trees would negatively affect these bird species. Golden crown-beard is an aggressive, woody herb that forms tall, dense stands that can reduce ground access for surface-nesting species, such as albatrosses. This plant is well established at Kure Atoll, Midway Atoll, and Pearl and Hermes Reef. Golden crown-beard also provides habitat for introduced mosquitoes that spread avian pox (U.S. Fish and Wildlife Service, 2005).
Urban and Military DevelopmentIn the past, loss and degradation of habitat due to military
activities were a major issue (see section, “Threats – Conflicts with Military Activities”). The closure of military bases at Midway Atoll, Kure Atoll, and French Frigate Shoals, and the removal of many of the associated structures (buildings,

Threats 17
antennas, fuel tanks, streetlights, etc.) has improved habitat quality, reduced collision-associated mortality, and led to increases in the size of albatross populations on these islands. However, issues such as lead and organochlorine contamination remain at these former bases (see section, “Threats – Pesticides and Other Contaminants”). Currently (2005), loss of habitat to urban development is not a major threat to the small Laysan albatross colonies on the main Hawaiian Islands, but this could become a factor in the future.
Conflicts with Military Activities
There is a long history of military occupation on islands that support albatross colonies. These occupations have had positive and negative effects on albatrosses. Kure Atoll, Midway Atoll, French Frigate Shoals, Johnston Atoll, Minami Torishima, and Iwo Jima all supported military bases in the past, and active installations still exist at Wake Atoll and in the main Hawaiian Islands of Kaua`i at the Pacific Missile Range Facility and O`ahu at the Marine Corps Base Hawaii. Many of these bases were established during WWII.
Albatrosses have been affected directly and indirectly by military activities. An estimated 58,000 Laysan and almost 3,000 black-footed albatross adults were killed at Midway Atoll from 1957 to 1964 (table 2) in control programs intended to reduce albatross interference with aircraft operations (Kenyon and others, 1958; Rice, 1959; Robbins, 1966). Fisher (1966b) estimated an additional 3,000 breeding albatrosses were indirectly killed each year by antenna collisions and other activities, such as construction and vehicle collisions. Loss of habitat to roads, buildings, runways, and other development associated with military bases severely restricted nesting space. Aircraft use of runways on Eastern Island, Midway Atoll, was discontinued after WWII, and although the runways are badly degraded, they continue to be a major feature of Eastern Island. Thousands of albatrosses nest on old runways, and some albatross have swollen feet and leg joints that may be related to landing and nesting on the hard surface. Adult albatrosses are no longer intentionally killed at U.S. military bases, but in the main Hawaiian Islands, albatrosses are discouraged from nesting at the Pacific Missile Range Facility (Kaua`i), Dillingham Airfield, and the Marine Corps Base Hawaii (O`ahu) to minimize the chance of aircraft collisions (Whittow, 1993a). Nests are destroyed, adults are harassed, and adults and eggs are relocated to areas off base.
Throughout the Pacific, military transports have introduced exotic species (plants and animals) that degrade habitat or prey on native species. Invasive species, habitat degradation, and toxic chemicals continue to affect albatross survival long after the end of military occupation (see section, “Threats—Pesticides and Other Contaminants”).
Date and species
Estimated number of albatrosses killed on Midway Atoll
Eastern Island Sand Island
AntennasAircraft
and road collisions
Experiments and
bulldozing
Control programs
1956: LAAL 2,900 BFAL 51957: LAAL 2,900 4,339 4,000c + 415ad 4,688 BFAL 5 328 800c + 25ad 1001958: LAAL 2,900 4,668 29,764 BFAL 5 352 2771959: LAAL 2,900 2,662 BFAL 5 2001960: LAAL 2,900 2,662 1,204 9,908 BFAL 5 200 1,430 921961: LAAL 2,900 2,662 BFAL 5 2001962: LAAL 2,900 2,662 BFAL 5 2001963: LAAL 2,900 2,662 928 BFAL 5 200 2941964: LAAL 2,900 2,662 13,810 BFAL 5 201 2,4201965: LAAL 2,900 2,662 BFAL 5 2001966: LAAL 2,900 BFAL 51967: LAAL 2,900 BFAL 5
Total: LAAL 34,800 27,641 6,547 58,170Total: BFAL 60 2,081 2,549 2,889
Table 2. Estimated number of Laysan (LAAL) and black-footed (BFAL) albatrosses killed on Midway Atoll in control programs, experiments, and collisions with antennas, and aircraft and road collisions, 1956–67.
[Antennas: Estimates from Fisher (1966c) made during 1965 breeding season. Aircraft and road collisions: Number of aircraft landings/take-offs from Kenyon and others (1958), Rice (1959), and Robbins (1966). Number of birds killed in road collisions were only recorded by Kenyon and others (1958). The number of birds killed by aircraft collisions and road accidents were assumed to be related and followed the relation: LAAL= 2.511 and BFAL= 0.190 birds killed per landing/take-off (from Kenyon and others, 1958). Relation between Walkers: Breeding birds is LAAL= 0.42:0.58 and BFAL= 0.45:0.55, with ‘Walkers’ including juveniles and non-nesting adults (Robbins, 1966). Experiments and bulldozing: Includes birds killed (Kenyon and others, 1958) in experimental plots and during bulldozing operations to flatten plots around runways (c=chicks, ad=adults), plus the number of breeding adults precluded from nesting due to the previous year’s black-topping of zone-9 (1960) and zone-8 (1963) (census data are from Robbins, 1966). Control programs: Includes birds documented in Kenyon and others (1958), Rice (1959), Robbins (1966), and Fisher (1966a). Breeding seasons refer to the year of chick hatching/fledging]

18 Status Assessment of Laysan and Black-Footed Albatrosses, North Pacific Ocean, 1923–2005
Some aspects of military occupation appear to have benefited albatrosses. Occupation of Midway Atoll early in the 20th century probably kept feather hunters from depleting the albatross colonies, as they did on other Northwestern Hawaiian Islands (Tickell, 2000). Activities on remote islands commonly included augmentation of land area through dredging and spoil deposition. Small, sandy islets, typical of atolls, were stabilized with exotic plants, especially grasses, and installation of seawalls or other reinforcements. Although significantly degrading the native ecological communities, these activities increased the land area and enhanced albatross nesting habitat on some islands. In 2005, the largest Laysan and black-footed albatross colonies in the World are located at Midway Atoll.
Pesticides and Other Contaminants
MetalsLead poisoning has been documented in Laysan albatross
chicks on Sand Island, Midway Atoll, in the immediate vicinity of former military and cable company buildings (Sileo and Fefer, 1987; Sileo and others, 1990a). Metal exposure is through ingestion of lead-based paint chips from deteriorating buildings (chips: 84,316 ± 16,183 ppm lead and 39.9 ± 5.8 ppm mercury; Finkelstein and others, 2003). Lead concentrations in the livers of poisoned chicks range from 6 to 245 ppm. These chicks exhibit symptoms such as drooping wings and yellow, watery bile (Sileo and Fefer, 1987; Sileo and others, 1990a). Lead poisoning is rare in black-footed albatross chicks, which typically do not occur near buildings, and it has not been observed in adults of either species (Sileo and Fefer, 1987).
In 2005, areas around contaminated buildings were covered to dissuade albatrosses from nesting nearby. Although successful in minimizing the number of nests in those areas, once mobile, chicks wandered into contaminated areas and succumbed to lead poisoning. It is estimated that as many as 10,000 chicks per year, are potentially exposed to lethal levels of lead from ingestion of lead-based paint (approximately 2–3 percent of the chicks hatched; M. Finkelstein, University of California, Santa Cruz, written commun., 2006) and perhaps more importantly, birds not exhibiting overt symptoms could still have immunological and neurological toxic effects that could decrease fitness and survival (Finkelstein and others, 2003).
Concentrations of mercury (Hg) and cadmium (Cd) also are high in Laysan and black-footed albatrosses, but no negative effect has been reported. In 1969, high concentrations of Hg (mean = 104 ppm, range: 0–250 ppm Laysan albatross; mean = 75 ppm, range: 50–120 ppm black-footed albatross) were found in the subcutaneous fat of adults, but no sign of poisoning was detected (Fisher, 1973). In 1985, liver
concentrations of Hg and Cd in Laysan albatross were 11.4 and 15.1 ppm wet weight, respectively (Honda and others, 1990). Liver concentrations of Hg in black-footed albatross were 95.4 ppm (Honda and others, 1990) and 279 ppm (Kim and others, 1998), and Cd concentrations were 22.0 ppm (Honda and others, 1990) and 70.6 ppm (Kim and others, 1998) wet weight. Honda and others (1990) suggested that these concentrations may be the result of natural background levels and low elimination rates in albatrosses because there was no visible sign of poisoning.
Organochlorine ContaminantsLaysan and black-footed albatrosses from the Hawaiian
Islands exhibit high concentrations of organochlorine contaminants, but black-footed albatrosses have significantly greater accumulations (Fisher, 1973; Jones and others, 1996; Auman and others, 1997; Guruge and others, 2001a). Organochlorine compounds, such as PCBs and DDE (main breakdown product of DDT), are known to reduce avian fecundity through embryo mortality, teratogenic development, and eggshell thinning; effects known as the Great Lakes Embryo Mortality, Edema, and Deformities Syndrome (GLEMEDS; Gilbertson and others, 1991). Contaminant levels in Laysan albatross eggs were lower than threshold levels expected for eggshell thinning or other dioxin-like effects (table 3), and thus no direct GLEMEDS risk is believed to be present (Jones and others, 1996; Auman and others, 1997; Guruge and others, 2001b). Contrary to this finding, Guruge and others (2001b) estimated a Hazard Index4 greater than 20, which is within the range where population-level effects are expected. Field studies have found no measurable effect (Auman and others, 1997; Ludwig and others, 1998). Concentrations of PCBs and DDE in Laysan and black-footed albatrosses have increased 130 to 360 percent in the last decade (Finkelstein and others, 2006).
Black-footed albatrosses from Hawai`i contain high concentrations of organochlorine contaminants that may cause dioxin-like effects. Black-footed albatross eggs contain toxic equivalents of PCB, DDE, and TCDD (table 4), known to cause GLEMEDS effects in fish-eating birds (Auman and others, 1997; Guruge and others, 2001b). Hazard Indices for black-footed albatross eggs were 1.7–9.7 for PCBs, 0.51 for DDE, and 12–86 for TCDD (Jones and others, 1996; Auman and others, 1997; Guruge and others, 2001b). The latter value suggests that population-level effects could exist. This is of even greater concern because concentrations of PCBs and DDE in adult black-footed albatrosses have increased over the past decade (Finkelstein and others, 2006).
4Hazard Index (HI) is the Toxic equivalent (TEQ) divided by the No Observable Adverse Effect Level (NOAEL). At HI=1 NOAEL has been reached, at HI=10 the first signs of adverse effects appear, and at HI=20 population-level effects are observed (Auman and others, 1997).

Threats 19
Compound
Organochlorine concentration, in nanogram per gram, wet weight
December 19691
November/ December
19932,3
1997–984,5
Subcutaneous Fat
DDD 500 (60–940)
54 5(16–33)
DDT 940 (440–1,960)
6,700 5(3,200–9,500)
DDE 3,600 (1,800–4,800)
6,100 5(2,800–8,000)
PCBs 8,200 (940–16,700)
22,110 21,000 5(9,800–33,000)
PCB-TEQs 20.333 Total TEQs 20.531 2.7
4(2.1–3.5)
Whole Egg
DDE 3300 PCBs 2199 (177–220)
31,000PCB-TEQs 0.031
2,3(0.0302–0.0312)Total TEQs 0.051
2,3(0.0484–0.0517)0.27
4(0.21–0.35)
1 Fisher (1973): from Midway (n = 22). 2 Jones and others (1996): from Midway (Adults fat tissue, n = 5; eggs,
n = 2 groups of 10 eggs each).3 Auman and others (1997): from Midway (n = 2 groups of 10 eggs each).4 Guruge and others (2001a): from fisheries nearby Midway (n = 7).5 Guruge and others (2001b): same samples as Guruge and others (2001a).
Table 3. Mean and range of organochlorine concentrations in the subcutaneous fat of adult Laysan albatrosses and whole eggs, Midway Atoll.
[Compound: DDE = 1,1-dichloro-2,2’-bis-chlorophenyl-ethylene; DDT = dichloro-diphenyl-trichloroethane; DDD = dichloro-diphenyl-dichloroethane; PCBs = polychlorinated biphenyls; TEQs = 2,3,7,8-TCDD toxic equivalents; TCDD = 2,3,7,8-tetrachlorodibenzo-p-dioxin]
Compound
Organochlorine concentration, in nanogram per gram, wet weight
December 19691
November/ December
19932,3
1997–984,5
Subcutaneous Fat
DDD 950 (680–1,160)
190 5(73–610)
DDT 3,500 (970–7,580)
33,000 5(15,000–76,000)
PCBs 22,300 (15,000–34,400)
92,000 5(36,000–180,000)
DDE 15,300 (5,100–22,700)
30,200 5(13,000–73,000)
TEQs 6.0 4(2.9–9.9)
Whole Egg
DDE 31,800PCBs 2688, 33,800PCB-TEQs 2,30.087Total TEQs 2,30.124 0.60
4(0.29–0.99)
1 Fisher (1973): from Midway (n = 7).2 Jones and others (1996): from Midway (n = 1 group of 10 eggs).3 Auman and others (1997): from Midway (n = 1 group of 10 eggs).4 Guruge and others (2001a): from fisheries nearby Midway (n = 16).5 Guruge and others (2001b): same samples as Guruge and others (2001a).
Table 4. Mean and range of organochlorine concentrations in subcutaneous fat of adult black-footed albatrosses and whole eggs, Midway Atoll.
[Compound: DDD = dichloro-diphenyl-dichloroethane; DDT = dichloro-diphenyl-trichloroethane; PCBs = polychlorinated biphenyls; DDE = 1,1-dichloro-2,2’-bis-chlorophenyl-ethylene; TEQs = 2,3,7,8-TCDD toxic equivalents; TCDD = 2,3,7,8-tetrachlorodibenzo-p-dioxin]
Egg shells of black-footed albatrosses collected in 1995 were 3–4 percent thinner than eggs collected before WWII (Ludwig and others, 1998). Fisher (1973) also reported that eggshells thinned between 1959 and 1969. Although the average concentration of DDE in eggs is below the threshold for eggshell thinning, variation is high and Ludwig and others (1998) estimated that 2–3 percent of the female population contain concentrations of DDE that produce eggshell thinning, and therefore loss by crushing. The percentage of black-footed albatross eggs lost due to shell breakage during the first week of incubation in 1994 was 3.34–4.02 percent compared to
1.54–1.65 percent for Laysan albatrosses (Ludwig and others, 1998). Broken eggs were crushed at the pointed end and broken egg shells were 40 percent thinner than intact eggs.
The higher concentration of organochlorines in black-footed albatrosses, relative to Laysan albatrosses, is thought to reflect geographic differences in foraging areas, rather than dietary differences (Finkelstein and others, 2006). Black-footed albatrosses consume more flying fish eggs than Laysan albatrosses, a food that adsorbs lipophilic contaminants from the sea surface (Ludwig and others, 1998). However, dietary preferences are not different enough to explain why organochlorine concentrations are about 400 percent higher in black-footed albatrosses than Laysan albatrosses. This may be the result of different foraging ranges of adults during the breeding season (Fernández and others, 2001), exposing each species to different risk levels (Finkelstein and others, 2006).
20 Status Assessment of Laysan and Black-Footed Albatrosses, North Pacific Ocean, 1923–2005
Black-footed albatrosses frequent the northeastern Pacific, an area known to have high concentrations of organochlorine contaminants in contrast to Laysan albatrosses that typically feed farther west in the North Pacific Ocean, a region having lower contaminant concentrations (Guruge and others, 2001a, 2001b).
Organochlorine concentrations in both species are likely having subtle effects on individual birds and increases could potentially have population-level effects (Auman and others, 1997). The primary source of DDT in the North Pacific Ocean may be agriculture application in Southeast Asia (Ludwig and others, 1998), whereas PCBs are derived from industrial practices (Finkelstein and others, 2006).
Plastics
Laysan albatrosses at Midway Atoll have a higher prevalence, diversity, and volume of plastic in their stomachs than other Hawaiian seabirds (Kenyon and Kridler, 1969; Sileo and others, 1990b). Adults ingest the plastic at sea and then feed it to their chicks (Kenyon and Kridler, 1969; Pettit and others, 1981). Plastic and other indigestible items (such as squid beaks) are accumulated in the upper stomach, or proventriculus, during chick rearing, but usually are regurgitated by the chick prior to fledging (Pettit and others, 1981; Sievert and Sileo, 1993). Although the incidence and total amount of plastic are higher in chicks that die prior to fledging, the overall effect of plastic ingestion is uncertain (Fry and others, 1987; Auman and others, 1998). A direct relation between chick death and plastic ingestion occurs only when large amounts of plastic (greater than 150 g) appear to cause impaction (Fry and others, 1987). Sievert and Sileo (1993) concluded that mortality directly attributable to ingested plastic was not a significant cause of death in albatross chicks.
Plastic ingestion could reduce a chick’s ability to swallow full-size meals, resulting in under-nourishment and possibly dehydration. Laysan albatross chicks with ‘large’ volumes (greater than 22 cm3) of plastic in their proventriculus attained significantly lower asymptotic fledging weights than chicks with small amounts (less than 22 cm3) of plastic (Sievert and Sileo, 1993; Auman and others, 1998). Sub-lethal, ‘large’ volumes of plastic were found in 27 percent of Laysan and 16 percent of black-footed albatross chicks, but no effects on growth were detected for black-footed albatrosses (Sievert and Sileo, 1993). Dehydration was the most common cause of death in older Laysan albatross chicks at Midway Atoll, coincident with higher temperatures in May to July (Sileo and others, 1990a; Sievert and Sileo, 1993). Because this effect occurs near the end of chick rearing and only one in four chicks contain high plastic levels, the overall effect of plastic ingestion may be to reduce chick survival to fledging by 0.0–5.7 percent (Sievert and Sileo, 1993) or 0.2–1.0 percent (Sileo and others, 1990a) in some years.
Black-footed albatross chicks also had a high incidence and diversity of plastic in their proventriculus (Sileo and others, 1990b). Although the incidence and abundance of plastics were usually lower than in Laysan albatrosses (Sievert and Sileo, 1993; Gould and others, 1997), black-footed albatrosses contained higher amounts of plastic fiber, probably derived from fishing gear (Sileo and others, 1990b; Gould and others, 1997).
Plastic ingestion also may increase the absorption of organochlorine compounds (Fry and others, 1987), as these are positively adsorbed on plastic surfaces (Carpenter and others, 1972). However, the amount of organochlorines, as PCBs, accounted for by plastic particles seems to be small relative to trophic accumulation (Ryan and others, 1988).
Disease
Avian pox is a viral disease, transmitted by mosquitoes, that affects albatross chicks on Midway Atoll and the main Hawaiian Islands. Mosquitoes are not native to Hawai`i and pox has not been observed at the other NWHI colonies, where mosquitoes have not been introduced. Although pox was once thought to be a serious threat to Laysan albatrosses at Midway Atoll, and epizootics with extensive chick mortality have occurred irregularly in the past (Sileo and others, 1990a), it is now known that most of the infected chicks survive (Young and VanderWerf, 2008). Pox rarely affects black-footed albatross chicks; possibly because they nest in more open areas where mosquito numbers are lower. The vulnerability of albatrosses to West Nile Virus and avian influenza is unknown.
Mild infections of chiggers (Womersia midwayensis) and some associated mortality were documented in Laysan albatross chicks at Midway Atoll in 1987, and an outbreak of mites apparently resulted in increased mortality of black-footed albatross chicks at Kure Atoll in 2002 and 2003 (C. Vanderlip and A. Marie, Hawai`i Department of Land and Natural Resources, unpub. data, 2004).
Dehydration was the most prevalent cause of death in older Laysan albatross chicks during a study at Midway Island in 1987 and was suspected to be one of the important causes of recurrent fledgling epizootics at Midway and Laysan Islands (Sileo and others, 1990a). This result was further supported in 1993–95, when, as a result of dehydration, many Laysan albatross chicks on Midway Island died from necrotizing enteritis (Work and others, 1998).
Population Size and Isolation
The current population size of black-footed albatross is in the hundreds of thousands and Laysan albatross number in the millions, thus, no demographic problems due to environmental stochasticity or genetic drift are expected. Genetic diversity of Hawaiian black-footed albatrosses is in correspondence

Monitoring and Management Activities 21
with its population size (Walsh and Edwards, 2005). The overwhelming majority of both species nest on six low atolls/islands in the Hawaiian archipelago. This concentration of birds at a small number of locations may make the populations vulnerable to catastrophic events.
Climate Change
Predicted sea-level rise associated with global climate change poses a significant threat to the low-lying islands of the NWHI and the central Pacific (Baker and others, 2006). Black-footed albatrosses may be affected sooner than Laysan albatrosses, because they nest on open, sandy beaches around the periphery of these islands, and strong storms and associated storm surges can cause significant nest loss (Fisher, 1971b; McDermond and Morgan, 1993). However, loss of habitat to erosion will affect both species. When sea levels rose in the past, it was assumed that species moved to higher islands as the low islands disappeared, but current human occupation and introduced predators on the main Hawaiian Islands limit options for new, viable colony sites (Baker and others, 2006). As sea levels rise over the next century, secure habitat on higher islands throughout the range will become increasingly important.
Increased sea surface temperatures could result in changes in the location and intensity of typhoons in the central Pacific, causing them to form farther east and affecting islands and atolls that are usually unaffected (Spennemann, 1998). It is difficult to predict the effects that large-scale changes in the marine ecosystem (for example, disruption of currents, acidification, changes to food webs and food distribution) will have on albatrosses.
Monitoring and Management Activities
Monitoring
Breeding SurveysCounts and estimates of active nests have been conducted
using standardized techniques at French Frigate Shoals, Laysan Island, and Midway Atoll since 1980, 1992, and 1992, respectively (Flint, 2005). Surveys of both species have been conducted annually at French Frigate Shoals and Laysan Island. At Midway Atoll, black-footed albatrosses have been surveyed annually since 1992 and six censuses of Laysan albatrosses have been conducted between 1992 and 2005; counts of Laysan albatrosses have not been conducted annually at Midway Atoll because of the high cost of counting this large colony.
Standardized surveys are conducted early during the incubation period after most eggs have been laid and prior to any significant nest failure. Counts typically are initiated mid-December and completed by the first week of January. At Laysan Island, the number of Laysan albatross nests is estimated from counts of plots along transect lines rather than direct counts of all nests. From 1992 to 2005, black-footed albatross nests at Laysan Island were estimated from the same standardized transects, but the sampling variance associated with these estimates was quite large, and direct counts have been conducted since 1998. There are earlier population counts and estimates for all three islands, but methods varied.
Surveys at these three colonies provide an estimate of active nests for greater than 75 percent of the World’s population of black-footed albatrosses and greater than 90 percent of Laysan albatrosses. At other islands in the NWHI, where USFWS does not maintain permanent or seasonal staff during the winter, surveys are opportunistic and usually obtained during the spring or summer months. These counts are adjusted to account for egg and chick loss prior to the count. These surveys provide an estimate of the number of active nests (breeding pairs) in a given year and do not include adult birds that do not lay an egg or birds that have not yet reached breeding age.
USFWS contracted with the U.S. Geological Survey (USGS) Patuxent Wildlife Research Center to review the albatross monitoring program. USGS recommended a demographic monitoring program based on mark and recapture of banded adult birds (W.L. Kendall, U.S. Geological Survey Patuxent Wildlife Research Center, written commun., 2005). This program was implemented at Midway Atoll, French Frigate Shoals, and Kilauea Point, Kaua`i during the 2005–06 breeding season and at Laysan Island in 2006–07. This new program will provide information on adult survival, probability of a breeder skipping a breeding season, and reproductive success. It will be evaluated and documented over a 3-year period, and if successful, it will be implemented as the long-term population monitoring program for these two species in the Hawaiian Islands. Counts of active nests at Midway Atoll, Laysan Island, and French Frigate Shoals will continue, but the frequency of these counts may change.
As part of this collaboration, USGS compiled all existing albatross banding and recapture data from the past 50 years into a database that is administered by the USGS Bird Banding Lab (Doherty and others, 2006). Preliminary evaluations of survival and recruitment rates for black-footed and Laysan albatrosses were conducted, but overall data quality was not sufficient to support rigorous analysis (W.L. Kendall, U.S. Geological Survey Patuxent Wildlife Research Center, written commun., 2005).

22 Status Assessment of Laysan and Black-Footed Albatrosses, North Pacific Ocean, 1923–2005
Bycatch MonitoringNumerous analyses indicate that fishing bycatch is the
most important source of human-induced mortality for both albatross species. In recent years, the U.S. and Canada have implemented scientific observer programs to monitor bycatch (including seabird bycatch) of some fisheries that operate out of Hawai`i and along the west coast of North America (Alaska to California). But not all fleets are monitored and most International pelagic longline fleets (Japan, Korea, Russia, and China) are not monitored (Cousins and Cooper, 2000). Many of the fleets that are monitored use mitigation measures to minimize the bycatch of seabirds; the unmonitored fleets generally are not required to use mitigation measures, so estimation of bycatch is even more difficult. Collection and analysis of albatross carcasses salvaged from fisheries provide important information on age or sex biases in bycatch mortality, but few fisheries salvage dead birds.
Management Activities
Protection of Nesting IslandsUnited States.—The NWHI support greater than
99 percent of the World’s nesting Laysan albatrosses and greater than 95 percent of the World’s black-footed albatrosses. The first legal protection of these islands came in 1903 when President Theodore Roosevelt issued Executive Order 199A placing Midway Atoll under the control of the U.S. Navy in response to recurring reports of squatters and poachers killing large numbers of birds. The rest of the NWHI, including the marine habitat surrounding the islands from Nihoa to Kure (excluding Midway), gained legal protection in 1909, when Roosevelt established the Hawaiian Islands Bird Reservation (Executive Order 1019). The name was changed to the Hawaiian Islands National Wildlife Refuge in 1940. Although plume hunters and others continued to exploit albatross in the NWHI after designation of the Reservation, this protection spared these colonies from total extirpation, which was the fate of other colonies throughout the range. Midway Atoll was designated a National Wildlife Refuge in 1988, while still under U.S. Navy administration. In 1996, Midway Naval Air Station was closed and administration of the atoll and surrounding reefs was transferred to the USFWS (Executive Order 13022). Kure Atoll, originally part of the Hawaiian Islands Bird Reservation, was commissioned a LORAN Station in 1961 and was administered by the U.S. Coast Guard until 1992 when it was transferred to the State of Hawai`i, to be managed by the Hawai`i Department of Land and Natural Resources as a State Seabird Sanctuary. All other islands of the NWHI are managed by the USFWS as National Wildlife Refuges (U.S. Fish and Wildlife Service, 2005). In
2006, approximately 139,793 mi2 of emergent and submerged lands and waters of the NWHI, including the National Wildlife Refuges and State Seabird Sanctuary, were included in the Papahānaumokuākea Marine National Monument (Presidential Proclamation 8031).
Japan.—The Izu and Ogasawara Islands are in Japan’s National Park system. Albatross breeding islands in the Ogasawara (Bonin) Islands and Torishima in the Izu Islands are designated as Special Protection Areas in which wildlife capture is prohibited. The Senkaku Retto, a breeding site of disputed national ownership (Japan, China, and Taiwan), has no legal protection.
Mexico.—Guadalupe Island and the Revillagigedos Islands are Biosphere Reserves, administered by the Comisión Nacional de Áreas Naturales Protegidas (CONANP).
Habitat and Vegetation ManagementHabitat restoration at former military bases is ongoing at
French Frigate Shoals, and Midway, Kure, and Johnston atolls. The Department of Defense worked with the State of Hawai`i (Kure Atoll) and USFWS to restore habitat when the bases were decommissioned and transferred to the wildlife agencies. USFWS and the State of Hawai`i have continued habitat management efforts at these atolls, which includes removal and modification of remaining structures that negatively affect albatrosses (for example, removal of light poles and excess buildings, control and removal of invasive vegetation, and rat eradication).
Lead poisoning of albatross chicks remains a problem at Midway Atoll, where chicks eat lead-based paint chips peeling from old buildings. USFWS attempted to reduce this problem by covering areas around the most highly contaminated buildings with ground cloth, but this has not proven successful. Other means of addressing the problem need to be devised and implemented.
Control programs for the invasive weed, golden crown-beard, have been implemented at Kure and Midway Atolls, but they are very costly, labor intensive, and of limited success. New methods to eradicate or control this invasive plant are needed. USFWS also has a rigorous program to preclude the transfer of exotic plants or insects from highly contaminated islands, such as Midway Atoll, to the rest of the NWHI. Restrictions regarding the treatment of food, clothing, camping gear, and other equipment are strictly enforced when moving between islands.
At Midway Atoll, several of the highest density nesting areas are dominated by introduced grasses that must be mowed annually to keep the vegetation low. If left unmanaged, the vegetation grows too high, and albatross nest densities decrease. Recent introduction of endangered Laysan ducks and recovery of Bonin petrel populations at Midway Atoll may complicate management of these areas in the future.

Population Status and Trends 23
Predator ManagementIntroduced terrestrial predators are no longer an issue
at colonies in the NWHI, as all non-native predators have been removed. Predator control actions are necessary at the main Hawaiian Island colonies, and coordinated efforts are ongoing by Hawai`i Division of Forestry and Wildlife, U.S. Department of Agriculture–Wildlife Services, and USFWS. Likewise, control programs have been implemented at some of the Mexican colonies by Grupo de Ecologia y Conservacion de Islas, Island Conservation, and SEMARNAT. A cat eradication program was recently completed at Wake Atoll, and a follow-up evaluation is scheduled. Rats remain an issue at this site.
Fishery ManagementManagement to reduce albatross bycatch in North
Pacific fisheries is complicated because many different nations participate in these fisheries. Regulations to reduce the incidental take of seabirds, specifically albatrosses, in commercial fishing operations have been promulgated for several fisheries that operate out of Hawai`i, Alaska, Washington, Oregon, and California. However, three different Fisheries Management Councils function in the Pacific and in some instances, the regulations for comparable fisheries, operating in the same general area, are not consistent (for example, the shallow-set pelagic longline fisheries for swordfish that operated out of California versus Hawai`i from 2001 to 2005). This is most often an issue with U.S. pelagic fisheries that operate on the high seas. Other nations that operate pelagic longline fisheries in the North Pacific typically do not require the use of mitigation measures to reduce the bycatch of seabirds and do not have observers to monitor the magnitude and composition of the seabird bycatch.
International pelagic longline fleets, targeting swordfish and tuna in the North Pacific, currently pose the greatest known threat. The fleets fishing in the area of overlap with Laysan and black-footed albatrosses primarily are vessels from Japan, Taiwan, Russia, and the U.S., although vessels from China and Korea may overlap with the southern portion of the albatrosses’ range. The U.S. Hawaii-based fleet has required the use of seabird mitigation measures since 2000, and this has resulted in a significant reduction in the bycatch of albatrosses by this fleet. Use of mitigation measures was not required in the U.S. West Coast-based tuna and swordfish fleet (fishing west of 150º W longitude) prior to closure of the swordfish fishery in 2004. Seabird mitigation measures are now required for all vessels fishing with longline gear off the U.S. West Coast under the Highly Migratory Species Fishery Management Plan.
Albatross bycatch also occurs in demersal longline fisheries in the North Pacific. The U.S. has required the use of mitigation measures by most of the vessels in Alaska’s demersal longline fisheries since 1997, and albatross bycatch
has been greatly reduced. Canada has required the use of seabird avoidance measures since 2002, as a condition of licensing in the longline fisheries off British Columbia. Seabird mitigation measures are not required in the demersal longline fisheries that operate off California, Oregon, and Washington. Russia and Japan also have demersal longline fleets in the North Pacific. U.S. scientists are collaborating with Russian scientists to assist in the development of mitigation measures for Russian longline fisheries.
The U.S. has had some level of scientific observer coverage and regulations to mitigate seabird bycatch in its pelagic longline fishery since 1993. Despite the relatively high level of albatross bycatch in pelagic longline fisheries, only the total fishing effort and fish catch are known for the other International fleets operating in the North Pacific. As of 2005, data from the U.S. observer programs were the only detailed information available for this fishery.
Migratory Bird Treaty ActThe Migratory Bird Treaty Act (MBTA) is the U.S.
domestic law that implements four International conventions (with Canada, Mexico, Japan and Russia) for the protection of shared migratory bird resources. Under the MBTA, it is unlawful to take, capture, kill, or possess any migratory bird, including albatrosses, unless permitted by regulation. The MBTA is not enforced beyond 3 nautical miles from the U.S. coastline. However, many activities that incidentally kill albatross, such as fishery bycatch, occur beyond the 3-mile limit.
Population Status and Trends Understanding population trends for long-lived species is
often complicated by delayed age at first breeding, propensity to skip breeding in a given year, environmental variability, lack of information on juveniles, limited understanding of albatross autecology, and lack of continuous population data. As a consequence, population projections from models based on the best available data are the primary means of assessing a species’ conservation status.
Assessing the conservation status of a species is based on at least two components: (1) describing the population trend by fitting a model to the data, and (2) projecting population changes over a specified time interval given an initial population size (population viability analyses, or PVA).
An assessment of both albatross species was conducted by applying three different analyses to the breeding population estimates: (1) regression analysis, using the combined counts from Midway Atoll, Laysan Island, and French Frigate Shoals; (2) population viability analysis, using the counts from each of these three colonies since 1980; and (3) age-structured matrix modeling, based on a long-term breeding population data set.

24 Status Assessment of Laysan and Black-Footed Albatrosses, North Pacific Ocean, 1923–2005
Population Analysis Methods
All analyses were based on estimates or counts of active nests at French Frigate Shoals, Laysan Island, and Midway Atoll. Regression analysis was used to evaluate linear trends in populations over 1923–2005, 1957–2005, and 1992–2005. Population viability analyses were conducted by fitting stochastic, discrete-time, logistic, and exponential models to observed data, and then making population projections 60 years into the future. Age-structured population models, based on a matrix modeling framework, were used to evaluate the effect of fishery bycatch on populations, and estimates were made of the maximum number of mortalities, not including natural deaths, that could occur while maintaining an optimum sustainable population (Potential Biological Removal, or PBR). Estimates of albatross bycatch were obtained either by projecting measured rates for U.S. fisheries to unmonitored fleets, including International fleets, or from published values. Detailed descriptions of analytical methods are provided in appendix C.
Results for Laysan Albatross
Population Estimates – A Historical ReviewAlbatross populations were exploited in the late 1800s
and early 1900s for feathers, eggs, and guano extraction, resulting in significant decreases in population and the extirpation of numerous colonies (Rice and Kenyon, 1962a; Spennemann, 1998). Records prior to feather hunting are sparse, and reports of colony size for the large colonies are often disputed, but estimates for Laysan Island alone were as high as 2 million birds (Schlemmer in Nutting, 1904). The population increased following the cessation of feather hunting. From the 1920s to 2005, the total number of nesting pairs increased from an estimated 17,930 to 600,000 (table 5). Some islands may now support colonies that are larger than pre-feather hunting levels (Midway and Kure Atolls) although other islands likely support smaller colonies (Laysan and Wake Islands). Colonies on several islands in the central and western Pacific never reestablished following extirpation (Johnston Atoll, Minami Torishima, and Torishima in the Izu Islands). Population growth generally has been highly variable between colonies (table 5, fig. 5). Below, we present a summary of Laysan albatross population changes at each colony, beginning with the northernmost colony in the NWHI.
Figure 5. Number of Laysan albatross breeding pairs at colonies from the 1920s until 2005. Values are shown in table 5.
tac_08_9354_0255_Albatrosses_Fig05
0
50,000
100,000
150,000
200,000
250,000
300,000
350,000
400,000
450,000
Kure
Ato
ll
Mid
way
Ato
ll
Pear
l and
He
rmes
Ree
fLi
sian
ski I
slan
d
Lays
an Is
land
Gard
ner
Pi
nnac
les
Fren
ch F
rigat
eSh
oals
N
ecke
r Isl
and
Nih
oa Is
land
Ni`i
hau
Isla
nd
Ka’
ula
Isla
nd
Kaua
`i Is
land
O`a
hu Is
land
JAPA
N
MEX
ICO
NUM
BER
OF B
REED
ING
PAIR
S
0
5,000
10,000
15,000
20,000
25,000
30,000
A. Breeding pair estimates from each island.
B. Breeding pair estimates at all islands except Midway Atoll and Laysan Island.
Kure
Ato
ll
Mid
way
Ato
ll
Pear
l and
He
rmes
Ree
fLi
sian
ski I
slan
d
Lays
an Is
land
Gard
ner
Pi
nnac
les
Fren
ch F
rigat
eSh
oals
N
ecke
r Isl
and
Nih
oa Is
land
Ni`i
hau
Isla
nd
Ka’u
la Is
land
Kau
a`i I
slan
d
O`ah
u Is
land
JAPA
N
MEX
ICO
1920s1957–582002–05
1920s1957–582002–05

Population Status and Trends 25
Laysan albatross colony on Laysan Island in the 1890s. Photograph courtesy of Bishop Museum, Honolulu, Hawai`i (http://www.bishopmuseum.org)

26 Status Assessment of Laysan and Black-Footed Albatrosses, North Pacific Ocean, 1923–2005
Colony
Estimated number of albatross breeding pairs
Hatch years
19231* 1957–58 1981–2005
U.S.A
Kure Atoll 75 2350 3*3,900 (2000)Midway Atoll 3,800 2100,055 3408,130 (2005)Pearl and Hermes Reef 830 217,750 3*6,910 (2003)Lisianski Island 1,270 4*<6,000 (1960s) 326,500 (1982)Laysan Island 10,800 2130,000 3140,860 (2005)
Gardner Pinnacles 3 22 515 (?)French Frigate Shoals 200 2584 33,230 (2005)Necker Island 950 22,500 3*500 (1995)Nihoa 3 6*<50
(1960s)
30 (1995)
Ni`ihau 2500 3190 (2002)Ka`ula 0 20 360 (1981)Kaua`i 71 (1945) 3160 (2005)O`ahu 20 853 (2005)
Japan
Ogasawara Gunto (Bonin Island)
920 (2005)
Mexico
Guadalupe Island 10337 (2005)Revillagigedo Island 11, 1263 (2003)Alijos Rocks 113 (2003)
Total (rounded) 17,930 257,800 600,000
1Wetmore in Rice and Kenyon (1962a).2Rice and Kenyon (1962a).3Flint (2005).4Clapp and Wirtz (1975).5Gales (1998).6Clapp and others (1977).7Munro (1945) in Tickell (2000).8Young and others (in press).9Chiba and others (2007).10R.W. Henry, University of California, Santa Cruz, written commun., 2008.11Pitman and others, 2004.12R. Wanless, BirdLife South Africa, written commun., 2009. *spring/summer estimates were adjusted for nest loss.
Table 5. Estimates of the number of Laysan albatross breeding pairs by colony and hatch year at all extant colonies.
[Hatch year of census is shown in parentheses]
Kure Atoll.—Wetmore reported 50 pairs of Laysan albatrosses in the spring of 1923 (Olson, 1996). By 1958, the nesting population had increased to 350 pairs (Rice and Kenyon, 1962a). As a result of habitat modifications, Laysan albatross numbers increased to 1,450 pairs in 1963 (Rice and Kenyon, 1962a; Robbins, 1966). Following closure of the LORAN Station, the population increased to 3,900 pairs in 2000 (Hawai`i Department of Land and Natural Resources, unpub. data, 2000).
Midway Atoll.—Before human occupation, Midway Atoll probably supported several thousand nesting pairs of Laysan albatrosses (Munro, 1942, in Rice and Kenyon, 1962a). Habitat modifications by the Pacific Cable Company led to a rapid population increase (Rice and Kenyon, 1962a). Wetmore (1923) reported more than 1,500 pairs on Eastern Island and 1,000 pairs on Sand Island “all with well grown young” (Wetmore in Olson, 1996). Military activities during WWII (1941–45), and albatross “control programs” (1955–65), resulted in population decreases during these periods. The breeding population continued to decrease from approximately 100,000 pairs in 1956 to 72,000 pairs in 1962 (Robbins, 1966). After discontinuation of the Distant Early Warning Line radar base in 1965, a second period of rapid population growth began, and 408,000 active nests were counted in December 2005 (figs. 5 and 6). Over the period from 1923 to 1958, the population growth rate (λ) averaged 1.105, and decreased to 1.031 from 1958 to 2005. During the past 15 years, breeding pairs of Laysan albatrosses appear to have remained relatively stable, although annual variation in counts has been considerable (fig. 6).
Pearl and Hermes Reef.—There are no quantitative estimates of albatross populations at this atoll prior to feather hunting. From the 1920s to 1958, the Laysan albatross population increased from an estimated 830 to 17,750 pairs, probably a result of rabbit eradication in 1928 and the ending of feather hunting (Amerson and others, 1974). An estimate of 12,840 young in late March 1968 (Amerson and others, 1974) indicated that the population remained relatively high at least through the 1960s, before decreasing to approximately 6,900 pairs in 2003 (table 5). Vegetation on Southeast Island, where most albatrosses nest, changed from grasses and forbs in 1958 (Rice and Kenyon, 1962a) to a community currently dominated by the invasive, golden crown-beard.

Population Status and Trends 27
tac_08_9354_0255_Albatrosses_Fig06
Total
Tern
East
TrigWhale-Skate
GinLt.Gin
NU
MB
ER O
F B
REED
ING
PA
IRS
0
0
50,000
100,000
150,000
200,000
250,000
500
1,000
1,500
2,000
2,500
3,000
3,500
0
100,000
200,000
300,000
400,000
500,000
450,000
350,000
250,000
150,000
50,000
1955 1960 1965 1970 1975 1980 1985 1990 1995 2000 2005
Laysan Island
French Frigate Shoals
Midway Atoll
Figure 6. Number of breeding pairs of Laysan albatross on Midway Atoll, Laysan Island, and French Frigate Shoals, 1958–2005. The colony and the source of data for the 1950s and 1960s were: Midway—Rice and Kenyon (1962a), Robbins (1966), Ludwig and others (1979, in Tickell, 2000); Laysan—Rice and Kenyon (1962a), Ely and Clapp (1973); French Frigate Shoals—Rice and Kenyon (1962a), Amerson (1971). Data for 1979–2005 were collected by U.S. Fish and Wildlife Service personnel.

28 Status Assessment of Laysan and Black-Footed Albatrosses, North Pacific Ocean, 1923–2005
Lisianski Island.—In 1891, Laysan albatrosses were considered abundant on the island but no quantitative estimates of the breeding population were made (Munro, 1942, in Rice and Kenyon, 1962a). Following feather raids and loss of vegetation to rabbits, there were no more than 800 pairs by late season 1923 (Wetmore in Olson, 1996). Rice and Kenyon (1962a) estimated 30,000 pairs in 1958, but Clapp and Wirtz (1975) felt this estimate was high and estimated that the breeding population pairs in the 1960s were usually 4,000 to 5,000 pairs. By 1982, the population increased to an estimated 26,500 pairs (U.S. Fish and Wildlife Service, unpub. data, 1980–2005). The population growth rate (λ) was 1.048 from 1923 to the 1960s and 1.034 from the 1960s to 1982.
Laysan Island.—Historically, Laysan Island supported the largest colony of Laysan albatrosses. Estimates of colony size prior to feather hunting are disputed, but the earliest report, circa 1900, was 2 million birds (probably includes breeding and non-breeding birds) by the manager of the guano company (Nutting, 1904). Shortly after this, feather hunters killed hundreds of thousands of birds, primarily albatrosses, from 1909 to 1915 (Dill and Bryan, 1912; Ely and Clapp, 1973). When Dill (1916) visited Laysan Island in April 1911, he estimated only one-sixth of the original albatross colony remained, numbering approximately 180,000 birds. Bailey (1952) considered this estimate high because he counted only 12,300 nests the following season. However, recent surveys indicate that the number of breeding pairs can vary greatly between years, so this variation may be explainable. The lowest estimate of Laysan albatrosses, 6,800 pairs, was in the spring of 1923 when rabbits had reduced the island to a desert-like appearance (Wetmore in Ely and Clapp, 1973). From 1923 to 1958, the albatross population rebounded, increasing from 10,800 to 130,000 pairs, a growth rate of 1.078 (fig. 5). Since 1958, the population appears to have remained relatively stable, although exhibiting high annual variation (fig. 6). Given the imprecise, early estimates, whether or not the colony at Laysan Island has fully recovered is difficult to assess.
Gardner Pinnacles.—Approximately 10 Laysan albatross pairs nest on these rock stacks, which have never supported a large breeding colony (table 5).
French Frigate Shoals.—There are no quantitative estimates of colony size before Wetmore’s estimate of 130 pairs in 1923 (Rice and Kenyon, 1962a). The number of nesting pairs remained low through WWII and the U.S. Coast Guard occupation, but increased after the Coast Guard LORAN Station moved from East Island to Tern Island in 1952 (Amerson, 1971). On Tern Island, the number of breeding pairs remained low until the LORAN Station closed in 1979 and management of the island transferred to the USFWS. From 1958 to 1980, the number of Laysan albatrosses nesting on French Frigate Shoals increased from 584 to 973 pairs, and to 3,226 pairs in 2005 (fig. 6). Both expansion of the land area at Tern Island and cessation of military activities likely contributed to this increase.
Necker Island.—An estimate of the Laysan albatross colony size prior to arrival of feather hunters was 1,000 to 2,000 birds, or less than 1,000 breeding pairs (in Rice and Kenyon, 1962a). The colony increased in size to 2,500 pairs in 1958, but then decreased to 500 pairs in 1995 (table 5).
Nihoa Island.—This island has never supported more than a small colony of Laysan albatross (maximum 20 pairs), and in some years, no albatross have nested here (Clapp and others, 1977).
Main Hawaiian Islands.—Small colonies are present on Ka`ula, Lehua, and Ni`ihau Islands. On Kaua`i, colonies are present at the Pacific Missile Range Facility on the west coast and various locations along the north shore from Kilauea Point NWR to Princeville. Colonies also are found on O`ahu at Ka`ena Point Natural Area Reserve, Kuaokala Game Management Area, and the Marine Corps Base Hawaii (Kaneohe Bay).
Central Pacific Islands.— Historically, Laysan albatrosses nested at Johnston and Wake Atolls but these colonies were extirpated by feather hunters in the early 20th century (Rice and Kenyon, 1962a). A few pairs survived at Wake Atoll until the 1940s when eaten by starving soldiers (Spennemann, 1998). Laysan albatrosses have recently shown signs of recolonizing these sites. On Johnston Atoll, birds have been observed prospecting for nest sites (U.S. Fish and Wildlife Service, unpub. data, 1980–2005), and on Wake Atoll, a pair fledged a chick in 2002, the first Laysan albatross chick to fledge in more than 50 years (Rauzon and others, 2008).
Japanese Islands.—Prior to feather hunting at the turn of the 20th century, Laysan albatrosses nested on Minami Torishima (Marcus Island), in the Ogasawara (Bonin) Islands, and on Torishima in the Izu Islands (Bryan, 1903; Kurata, 1978). Of these, recolonization has only occurred in the Ogasawara Islands (table 5) where approximately 10–20 pairs nest (Chiba and others, 2007). Quantitative estimates of historical colony sizes are not available, but Bryan (1903), during a 1902 survey of Minami Torishima, was told by feather hunters that Laysan albatrosses “had been so exceedingly abundant in former years that a man could kill three hundred birds in a day.” Although this island historically supported a large colony of both species, the estimate in Rice and Kenyon (1962a) of at least 1 million Laysan and black-footed albatrosses nesting on this island probably is high (Tickell, 2000).
Mexican Islands.—The first observed breeding attempts of Laysan albatrosses on Mexican Islands were from Guadalupe Island in 1983, Clarion Island in 1987, San Benedicto Island in 1990, and Alijos Rocks in 2003 (Howell and Webb, 1992; Gallo-Reynoso and Figueroa-Carranza, 1996; Pitman and Ballance, 2002; Pitman and others, 2004). Populations on these islands are growing, but numbers are still relatively small (approximately 400 total breeding pairs; R.W. Henry, University of California, Santa Cruz, written commun., 2008).

Population Status and Trends 29
Regression Analysis of Count DataWe used linear regression to fit lines to log-transformed
counts of breeding pairs of Laysan albatross from Midway Atoll, Laysan Island, and French Frigate Shoals combined for 1923–2005, 1957–2005, and 1992–2005 (table 6). Wetmore’s counts (Rice and Kenyon, 1962a; Olson, 1996) from the spring and summer of 1923 were adjusted for nest loss to generate estimates of the number of breeding pairs at each colony. Counts were available from all three island groups for 8 years (1923, 1957, 1992, 1997, 2001, 2002, 2004, and 2005). Analyses in which the P-value was less than or equal to 0.05 was taken as significant (that is, evidence that the population had either increased or decreased over that time interval, table 6). Thus, over the long (83 years) and moderate (48 years) time intervals, the population was increasing, but has remained stable during the recent time period (13 years).
Population Viability Analyses (PVA) of Count Data
PVA were conducted for the Laysan Island and French Frigate Shoals populations, but insufficient data were available for Midway Atoll. Due to differences in demographic parameters for Laysan Island and French Frigate Shoals, a pooled PVA was not conducted.
Laysan Island.—Population estimates for Laysan albatrosses on Laysan Island (1992–2005) were obtained by re-analyzing the original transect data collected by the USFWS (appendix C). Results from the re-analysis produced lower population estimates for most years, although the population trend is the same as the original estimates. The observed growth rate distribution, Robs (fig. 7), shows no significant temporal trend (slope = 0.0058, t = 0.157, p = 0.878, USFWS original estimates), but a strong negative
YearsStatistical
significanceCoefficient of determination
Slope
Laysan Albatross
1923–2005 P = 0.001 R2 = 0.85 positive1957–2005 P = 0.032 R2 = 0.64 positive1992–2005 P = 0.596 R2 = 0.08 none
Black-Footed Albatross
1923–2005 P < 0.002 R2 = 0.74 positive1957–2005 P = 0.785 R2 = 0.01 none1998–2005 P = 0.609 R2 = 0.05 none
Table 6. Results of linear regression analyses of trends in Laysan and black-footed albatross populations at French Frigate Shoals, Laysan Island, and Midway Atoll combined.
tac_08_9354_0255_Albatrosses_Fig07
1991 1993 1995 1997 1999 2001 2003 2005
-1.0
-0.8
-0.6
-0.4
-0.2
0.0
0.2
0.4
0.6
0.8
1.0
1.2
OBSERVED GROWTH RATE DISTRIBUTION
OBSE
RVED
GRO
WTH
RAT
E DI
STRI
BUTI
ON (R
OBS)
0 50,000 100,000 150,000 200,000 250,000-1.2
-1.0
-0.8
-0.6
-0.4
-0.2
0.0
0.2
0.4
0.6
0.8
1.0
1.2
BREEDING POPULATION SIZE (TIME: T-1)
FREQ
UEN
CY
−1.0−1.5 −0.5 0.0 0.5 1.0 1.5
0.5
1.0
1.5
2.0
-1.2
0.0
A. Frequency distribution of Robs from U.S. Fish and Wildlife Service estimates.
B. Inter-annual variability of Robs.
C. Relation between Robs and breeding population size for U.S. Fish and Wildlife Service and re-analyzed data estimates.
Transects, FWSTransects, correctedTrendline
y = 0.0058x – 11.681
y = -7E-06x + 1.0166
R 2 = 0.0022
R 2 = 0.3513
Figure 7. Observed growth rate distribution (Robs) for the Laysan albatross breeding population, Laysan Island.

30 Status Assessment of Laysan and Black-Footed Albatrosses, North Pacific Ocean, 1923–2005
Data: 1992–2005
[N(Robs)=13]
Parameters fitted [mean and (95-percent confidence interval)]
logL(φ) AICc
Including sampling error + environmental stochasticity
Exponential model
ˆ = - 0.00266 (- 0.01986; 0.01469)= 0.49684 (0.41614; 0.58242)= 0.47975= 0.12919
tot
env
s error
a
−
σσ
σ
-8.883 22.867
Logistic model -6 -6 -6
ˆ = 1.01202 (0.78488; 1.26352)ˆ = 7.2621×10 (5.5818×10 ; 9.1356×10 )ˆ = 139,357
0.41401 (0.35122; 0.47791)= 0.39334= 0.12919
tot
env
s error
ab
Kσσ
σ −
−
=
-5.892 20.451
Table 7. Parameter estimation for exponential and logistic R-function models fitted to Laysan albatross Robs data, Laysan Island.
[Laysan albatross Robs data from U.S. Fish and Wildlife Service, unpub. data, 1980–2005; Flint, 2005. Robs, observed growth rate distribution; a , population growth rate; totσ , total variation; envσ , environmental stochasticity; s error−σ , sampling error; – b , density-dependent parameter; K, carrying capacity]
relation with its own population size (slope = -7×10⁻⁶, t = -2.441, p = 0.033, USFWS original estimates). This is a characteristic of populations close to their carrying capacity and having significant first-order negative feedback with respect to their size (Royama, 1992; Berryman and others, 2002). Support for the logistic model was indicated by a lower corrected Akaike’s Information Criterion (AICc), relative to the exponential model (table 7), and the distribution of the residuals. However, the logistic model did not fit the data significantly better than the exponential model (Likelihood Ratio Test, LRT = 1.49, p = 0.176), so the latter was used for population forecasts.
When sampling error is included in the exponential model, the population growth rate ( a ) does not differ from zero. This is true even after re-estimating population sizes (table 8), indicating the population is stable and primarily affected by environmental stochasticity ( envσ ). Analysis of the residuals indicates strong deviations from the general trend in 1999, 2000, and 2002. In 1999, a strong, negative Robs value was observed, which reflects the low breeding population in 2000. The positive Robs values for 2000 and 2002 are the result of low breeding population sizes in the preceding years.
Growth rates overlap between those calculated using the original USFWS population estimates, and our re-estimates. Projections using USFWS estimates with the sampling error removed, indicate a 0.50 probability that the population will decrease by 7 percent (95-percent confidence interval [CI]: -36.2–42.6) in 60 years (fig. 8). Moreover, the low slope in the cumulative probability distribution (CPD) near the median imposes a high variance on this value. However, the CPD for
Data: 1992–2005
[N(Robs)=13]
Parameters fitted [mean and (95-percent confidence limit)]
logL(φ) AICc
Including sampling error + environmental stochasticity
Exponential model
ˆ = 0.00245 (-0.02305; 0.02876)= 0.43078 (0.34702; 0.51384)= 0.41410= 0.11871
tot
env
s error
aσσ
σ −
-5.820 17.140
Logistic model -6 -6 -6
ˆ = 0.95874 (0.71461; 1.24625)ˆ = 7.8404×10 (5.7933×10 ; 10.2415×10 )ˆ = 122,282
0.36263 (0.30147; 0.42585)= 0.34265= 0.11871
tot
env
s error
ab
Kσσ
σ −
−
=
-3.346 16.121
Table 8. Parameter estimation for exponential and logistic R-function models fitted to Laysan albatross Robs data after re-analysis of transect data, Laysan Island.
[Laysan albatross Robs data from U.S. Fish and Wildlife Service, unpub.data, 1980–2005; Flint, 2005. Robs, observed growth rate distribution; a , population growth rate; totσ , total variation; envσ , environmental stochasticity;
s error−σ , sampling error; – b , density-dependent parameter; K, carrying capacity]
higher rates of population decline have high probabilities, as for example, the potential reduction of greater than 68 percent (CI: -78.9 – -53.3) has a 0.45 probability (fig. 8).

Population Status and Trends 31
tac_08_9354_0255_Albatrosses_Fig08
A.
B.
0
0.1
0.2
0.3
0.4
0.6
0.5
-1.0 -0.5 0.0 0.5 1.0RATE OF CHANGE
CUM
ULAT
IVE
PROB
ABIL
ITY
0
500,000
1,000,000
1,500,000
2,000,000
TIME (YEARS)
NUM
BER
OF B
REED
ING
PAIR
S
2010 2020 2030 2040 2050 2060
tac_08_9354_0255_Albatrosses_Fig09
-0.80
-0.60
-0.40
-0.20
0.00
0.20
0.40
0.60
0.80
1980 1985 1990 1995 2000 2005
-0.80
-0.60
-0.40
-0.20
0.00
0.20
0.40
0.60
0.80
500 1,000 1,500 2,000 2,500 3,000NUMBER OF BREEDING PAIRS
OBSE
RVED
GRO
WTH
RAT
E DI
STRI
BUTI
ON (R
OBS)
FFS trendlineTern
FFS
Tern trendline
First-order, low noise
y = -0.0013x + 2.6897R 2 = 0.0009
y = -0.0002x + 0.336R2 = 0.1286
y = -0.0003x + 0.7356R 2 = 0.2915
Strong perturbations
A. Inter-annual variability of Robs.
B. Relation between Robs and the breeding population size (time: t-1). Figure 8. Population projection (A, n = 30) and cumulative probability (B) that a given rate of population change is reached over 60 years using the exponential model and re-analysis of transect data for Laysan albatross, Laysan Island.
Figure 9. Observed growth rate distribution (Robs) for the Laysan albatross breeding population, French Frigate Shoals.
The population projection using the corrected transect estimates of population size predicts a slightly better trend. After 60 years, the median population size would increase by 15.7 percent (CI: -20 – 63.6). But as with the previous analysis, there is a high probability that the population would decrease by greater than 50 percent (0.45 probability, mean: -56.6 percent, CI: -70 – -37.7, fig. 8).
French Frigate Shoals.—The population time-series for French Frigate Shoals is the best available for Laysan albatrosses (fig. 9). The temporal trend of Robs at French Frigate Shoals shows no significant deviation from zero (slope = -0.0013, t = -0.139, p = 0.891), but a series of small and large vertical perturbations, characteristic of
environmental stochasticity, affected the R-function (Royama, 1992). As on Laysan Island, there is a significant first-order negative feedback with its own population size (time = t-1; slope = -0.0003, t = -2.939, p = 0.008). Both factors together suggest that this population is affected by density-dependent processes and is near its carrying capacity. This conclusion also is supported by the logistic model having a lower AICc value than the exponential model (table 9, fig. 10).
The exponential model suggests that the population has a significant positive growth rate, a = 0.03837 (CI: 0.03718 – 0.03960, after including sampling error). Analysis of the residuals indicates two periods of strong environmental perturbations. The first one occurred from 1985 to 1988,

32 Status Assessment of Laysan and Black-Footed Albatrosses, North Pacific Ocean, 1923–2005
Data: 1982–2005
[N(Robs)=23]
Parameters fitted [mean and (95-percent confidence interval)]
logL(φ) AICc
Including sampling error + environmental stochasticity
Exponential model
ˆ = 0.03837 (0.03718; 0.03960)= 0.29825 (0.29125; 0.30513)= 0.29790= 0.01448
tot
env
s error
aσσ
σ −
-4.298 13.197
Logistic model -4 -4 -4
ˆ = 0.73607 (0.70660; 0.76474)ˆ = 3.1363×10 (3.0034×10 ; 3.2665×10 )ˆ = 2,347
0.25686 (0.25195; 0.26184)= 0.25645= 0.01448
tot
env
s error
ab
Kσσ
σ −
−
=
-0.328 7.919
Table 9. Parameter estimation for exponential and logistic R-function models fitted to Laysan albatross Robs data, French Frigate Shoals.
[Laysan albatross Robs data from U.S. Fish and Wildlife Service, unpub.data, 1980–2005; Flint, 2005. Robs, observed growth rate distribution; a, population growth rate; totσ , total variation; envσ , environmental stochasticity; s error−σ , sampling error; – b , density-dependent parameter; K, carrying capacity]
when lower than usual Robs values occurred in 1985 and 1987 (fig. 9), followed by an increase in Robs as the population returned to a more typical number of breeding pairs in 1987 and 1989 (fig. 6). The second, and stronger perturbation, occurred from 1999 to 2000 when the number of breeding pairs was one-half that of the preceding and following year (fig. 6).
Population projections based on the exponential model suggest that in 60 years the population has a 0.50 probability of increasing by 8.36 times (CI: 6.53 – 10.74), although there is a 0.275 probability that the population would decrease by 0.24 times (CI: -0.41 – -0.04) in 60 years (fig. 10).
For this island, the logistic model presents a significant improvement in fitting Robs over the exponential model (LR test, LR = 13.54, p = 0.012). The logistic model indicates a carrying capacity of 2,347 Laysan albatross pairs for the entire atoll (table B-1), although the observed trend suggests this is an underestimate (fig. 6).
Matrix Model AnalysesTrend over the Past Century.—The Laysan albatross
population grew rapidly following the end of feather hunting, increasing from ca. 18,000 breeding pairs in 1923 to ca. 590,000 breeding pairs in 2005 (fig. 11). Population trends for individual colonies were not necessarily consistent with this overall pattern, and showed significant annual variation in number of breeding pairs. Breeding colonies on islands that received little human disturbance after 1923 (Pearl and Hermes Reef, Lisianski, Laysan, and Necker Islands) showed a high population growth rate until the 1950s, followed by stationary, although annually variable, colony sizes. In contrast, colonies at Midway Atoll and French Frigate Shoals, which were occupied by the U.S. military during and after WWII, exhibited a low growth rate until the 1960s. The end of WWII and associated military activities (for example, runway and base construction, habitat modification), the cessation of albatross control programs, and finally the decommissioning of military bases in the NWHI, all contributed to the high population growth observed at these two colonies since the 1960s. On Kure Atoll, military occupation did not have an
initial negative effect on the Laysan albatross colony, rather clearing of dense vegetation was followed by rapid growth of the colony (Woodward, 1972). The leveling off of colony sizes in the 1950s on islands that were not occupied by the military and colony growth on islands where humans increased nesting habitat support a hypothesis that nest sites may be limiting for Laysan albatrosses at some sites at the colony level. Further support for this hypothesis may be the recent colonizations of Mexican Islands (Howell and Webb, 1989; Pitman and Ballance, 2002), increasing numbers of birds breeding on the Main Hawaiian Islands, and the repopulation of Wake (Rauzon and others, 2008) and the Ogasawara Islands (Hasegawa, 1984). However, historical estimates of colony size on Laysan Island far exceed current estimates, indicating that nest site limitation is not the only factor.
We calculated the Potential Biological Removal level, PBR (Wade, 1998), as a comparison for the effects of fisheries bycatch. In this analysis, the maximum population growth rate was estimated by modeling historical data on breeding population size using a matrix-projection model, randomly selected demographic parameters, and several estimates of the fishery bycatch rate. Demographic parameters derived using this approach are independent of those derived from capture-recapture analyses, and thus provide an additional approach to understanding population processes.

Population Status and Trends 33
Figure 11. World Laysan albatross breeding population trend as derived from estimates for each island. World population size estimation with 95-percent CI. Nest site carrying capacity, K1, as the sum of the maximum estimated breeding pairs at each island. Fit_mean indicates a logistic model fitted to the estimated breeding population trend.
tac_08_9354_0255_Albatrosses_Fig11
100,000
0
200,000
300,000
400,000
500,000
600,000
700,000
800,000
1920 1930 1940 1950 1960 1970 1980 1990 2000
BREE
DIN
G PO
PULA
TION
SIZ
E EST-mean ± 1 SD
K1
Fit_mean
World population with 95-percent CI
tac_08_9354_0255_Albatrosses_Fig10
-1.0 -0.5 0.0 0.5 1.0 1.5 2.00
0.1
0.2
0.3
0.4
0.5
RATE OF CHANGE
CUM
ULAT
IVE
PROB
ABIL
ITY
0
5,000
10,000
15,000
20,000
TIME (YEARS)
NUM
BER
OF B
REED
ING
PAIR
S
2010 2020 2030 2040 2050 2060
A.
B.
Figure 10. Projection (A, n = 30) and cumulative probability (B) that a given rate of population change is reached over 60 years using the exponential model for Laysan albatross, French Frigate Shoals.
Parameter Estimation.—The logistic function provided a good fit to the growth of the Laysan albatross population, suggesting a strong influence of density-dependent processes (fig. 11). Estimated parameters from the logistic function were population growth rate a = 0.0673 ± 0.0031 and carrying capacity K = 779,144 ± 63,770 nesting pairs for the currently occupied islands (fig. 11). The maximum growth rate we estimated (7.0–7.8 percent annual) is higher than previous estimates for all albatross species other than the short-tailed albatross (6.5–8.0 percent, U.S. Fish and Wildlife Service, 2005). Our modeling approach indicated that simple, density-independent models (1) do not fit the data, and (2) significantly underestimate the growth rate of the population (table 10). Density-independent matrix models commonly
are used in the assessment of long-lived species, despite their limitations for species having K-selected life-history traits (Bjorndal and others, 2000; Lewison and Crowder, 2003). Our results argue against the use of density-independent models when forecasting the growth of albatross populations. Furthermore, analysis of the population growth potential indicates that current low rates of growth may be primarily due to density-dependent processes, and secondarily to fisheries bycatch (fig. 12). These estimates, applicable to the current colonies, may change if historical colonies are re-established.
Adult and juvenile survival estimates derived from capture-recapture data differed from the estimates we obtained using a matrix modeling approach. Survival estimates from capture-recapture analyses, especially for juveniles, vary widely between studies indicating uncertainty in the estimates. Our estimates of adult survival were similar to the weighted adult survival estimated for 1963 to 1982 (table 11), but estimates for other periods differed widely from the mean value we obtained using our modeling approach. Capture-recapture estimates of juvenile survival were lower than our estimates during the period of intense military occupation at Midway Atoll and Tern Island (French Frigate Shoals), and much higher than ours afterwards (table 11). Low estimated juvenile survival during military occupancy, as estimated by capture-recapture techniques, may have resulted from the harassment of birds and the restriction of their nesting space, thus biasing the recapture rate downward. Because our modeling approach did not use recapture rates, it was unaffected by this potential bias.

34 Status Assessment of Laysan and Black-Footed Albatrosses, North Pacific Ocean, 1923–2005Ta
ble
10.
Para
met
er e
stim
ates
[med
ian
(95-
perc
ent C
I)] fo
r the
Lay
san
alba
tross
pop
ulat
ion-
proj
ectio
n m
atrix
und
er d
iffer
ent m
odel
stru
ctur
es.
[Des
crip
tions
of p
aram
eter
s and
mod
els a
re sh
own
in a
ppen
dix
C. b
, con
stan
t mea
surin
g th
e st
reng
th o
f den
sity
-dep
ende
nce.
Lam
bda
(λ) m
ax, m
axim
um g
row
th ra
te o
f the
pop
ulat
ion.
NA
, not
app
licab
le]
Para
met
ers
Mod
el: E
xp-A
Mod
el: E
xp-B
Mod
el: L
og-2
A
Mod
el: L
og-2
B
Mod
el: L
og-2
C
Mod
el: L
og-2
D
Expo
nent
ial:
Low
byc
atch
(m
ean
for H
1)Ex
pone
ntia
l: H
igh
byca
tch
(mea
n fo
r H2)
Logi
stic
: Low
byc
atch
(m
ean
for H
1)Lo
gist
ic: H
igh
byca
tch
(m
ean
for H
2)Lo
gist
ic: H
igh
byca
tch
(9
7.5
perc
entil
e fo
r H2)
Logi
stic
; Hig
h by
catc
h
(2.5
per
cent
ile fo
r H2)
Bre
edin
g fr
eque
ncy
0.76
(0.7
0–0.
84)
0.
77(0
.70–
0.85
)
0.77
(0.7
0–0.
84)
0.
80(0
.71–
0.85
)
0.78
(0.7
3–0.
84)
0.
79(0
.71–
0.85
)
Bre
edin
g su
cces
s0.
62(0
.55–
0.69
)0.
62(0
.56–
0.69
)0.
64(0
.55–
0.70
)0.
66(0
.57–
0.70
)0.
68(0
.62–
0.70
)0.
63(0
.56–
0.69
)
Surv
ival
fled
glin
gs0.
775
(0.7
00–0
.890
)0.
800
(0.7
10–0
.895
)0.
810
(0.7
00–0
.900
)0.
830
(0.7
20–0
.900
)0.
880
(0.8
01–0
.900
)0.
830
(0.7
15–0
.890
)Su
rviv
al ju
veni
les
0.95
5(0
.942
–0.9
85)
0.96
5(0
.940
–0.9
85)
0.97
5(0
.945
–0.9
90)
0.98
0(0
.960
–0.9
90)
0.98
5(0
.973
–0.9
90)
0.98
0(0
.950
–0.9
90)
Surv
ival
adu
lts0.
955
(0.9
42–0
.985
)0.
972
(0.9
55–0
.990
)0.
980
(0.9
57–0
.990
)0.
980
(0.9
60–0
.990
)0.
985
(0.9
73–0
.990
)0.
982
(0.9
57–0
.990
)
bN
AN
A1.
50×1
0–8
(1.0
0×10
–8 –
2.15
×10–8
)1.
60×1
0–8
(1.0
5×10
–8 –
2.05
×10–8
)1.
60×1
0–8
(1.1
6×10
–8 –
2.03
×10–8
)1.
70×1
0–8
(9.4
7×10
–9 –
2.30
×10–8
)La
mbd
a (λ
) max
1.05
4
(1.0
52–1
.056
)1.
064
(1.0
62–1
.066
)1.
070
(1.0
64–1
.082
)1.
078
(1.0
72–1
.088
)1.
088
(1.0
84–1
.096
)1.
075
(1.0
66–1
.087
)N
100
100
100
100
1 24
100
1 Iter
atio
n pr
oces
s sto
pped
afte
r 21
hour
s.

Population Status and Trends 35
Fishery Impact.—Our 2005 estimate of fishery bycatch is approximately 2,500 birds per year, a value less than the estimated Potential Biological Removal level for Laysan albatrosses. Most of the fishery bycatch probably is accounted for by the International pelagic longline fleet (fig. 3), for which no official estimate is available. However, our model of population growth suggests that the long-term bycatch for the pelagic longline fleet was no higher than 0.187 birds/1,000 hooks (H2 – Hypothesis 2; appendix C) Given the current size and growth rate for the Laysan albatross population, this mortality level falls below the net growth exhibited for the species (fig. 12), and currently does not appear to be threatening the long-term viability of the species.
Results for Black-Footed Albatross
Population Estimates – A Historical ReviewQuantitative estimates of black-footed albatross
colony sizes prior to feather hunting are even more limited than estimates for Laysan albatrosses. Populations had already been decimated by the 1920s when an estimated 17,800 pairs nested in Hawai`i and another 200 pairs nested in Japan (approximately 18,000 pairs total; table 12). By 1958, the nesting population had increased to almost 55,000 pairs (Rice and Kenyon, 1962a), a growth rate of λ = 1.026. From 1958 to 2005, the population increased slowly to 61,700 pairs. Population changes on each island have varied widely (fig. 13), primarily reflecting the different histories of human occupation. The number of nesting pairs on Laysan Island and Pearl and Hermes Reef have decreased since 1958, but this loss has been compensated by increases at Kure and Midway Atolls, and French Frigate Shoals, where the numbers of nesting birds have increased since military activities ended. Below, we present a summary of black-footed albatross population changes at the current breeding sites.
Kure Atoll.—From 1923 to 1958, the colony size at Kure decreased from 365 to 70 breeding pairs (table 12), but the 1958 count by Rice and Kenyon (1962a) may have been abnormally low, since Woodward (1972) documented 200–350 pairs breeding annually in the 1960s (table 12). From 1958 to 2000, the colony increased to an estimated 2,020 pairs, a change that was likely due to removal of dense vegetation in 1961 (Rice and Kenyon, 1962a; Woodward, 1972) and closure of the station in 1992.
tac_08_9354_0255_Albatrosses_Fig12
A.
B.
0.00
0.01
0.02
0.03
0.04
0.05
0.06
0.07GR
OWTH
RAT
E (R
) / F
ISHI
NG
MOR
TALI
TY R
ATE
1950 1960 1970 1980 1990 2000 2010
1950 1960 1970 1980 1990 2000 20100
20,000
40,000
60,000
80,000
100,000
NUM
BER
OF A
DULT
S AN
D JU
VEN
ILES
Growth rate as r/2
EXPLANATION
Growth rate as r/4
Remaining growth potential estimate from breeding population size
Model log2a
Model log2d
Fishery bycatch is H1-mean
Fishery bycatch is H2-low
Fishery bycatch is H2-mean
Navy removals
Figure 12. Potential growth rate (A) and net growth (B) for the Laysan albatross.

36 Status Assessment of Laysan and Black-Footed Albatrosses, North Pacific Ocean, 1923–2005
Table 11. Demographic parameter estimates [mean ± 1 SD (range)] available for the Laysan albatross.
[Overall estimates of the survival rates were calculated using W.L. Kendall estimates (U.S. Geological Survey Patuxent Wildlife Research Center, written commun., 2005) and the proportion of birds breeding at Midway Atoll and elsewhere, as derived from the historical breeding population reconstruction]
Parameter Kure Atoll Midway Atoll Tern Island Overall
Breeding frequency
11960–720.84 ± 0.09 (0.62–1.00)
Breeding success
21964–19690.58 ± 0.09 (0.47–0.68)
31962–650.63 ± 0.14 (0.49–0.78)
41980–20030.64 ± 0.19(0.09–0.89)
41992–2001 0.50 ± 0.20 (0.22–0.76)
Juvenile survival rate
31962–720.982, 4–8 yr
51963–820.48 ± 0.04
51963–820.78 ± 0.17
51963–820.756
51983–931.00
51983–930.99 ± 0.001
51983–930.996
51994–20021.00
51994–20020.98 ± 0.004
51994–20020.993
Adult survival rate
31962–720.982, 4–8 yr
51963–820.48 ± 0.04
51963–820.78 ± 0.17
51963–820.756
51983–931.00
51983–930.99 ± 0.001
51983–930.996
51994–20021.00
51994–20020.98 ± 0.004
51994–20020.993
1Fisher (1976).2Woodward (1972).3Fisher (1975a).4U.S. Fish and Wildlife Service, unpub. data, 1980–2005.5W.L. Kendall (U.S. Geological Survey Patuxent Wildlife Research Center, written commun., 2005).
Midway Atoll.—There are no reports of colony size prior to feather hunting, but during a visit to Midway Atoll in 1902, Bryan (1906) noted
“Everywhere on Eastern Island great heaps, waist high, of dead albatrosses were found. Thousands upon thousands of both species had been killed.”
Based on the number of carcasses, Bryan (1906) estimated that black-footed albatrosses were three times more abundant than Laysan albatrosses. The colony size increased rapidly from 2,000 pairs in the 1920s to a peak of nearly 20,000 pairs in the early 1940s (Fisher and Baldwin, 1946; Rice and Kenyon, 1962a). Fisher and Baldwin (1946) reported the black-footed albatrosses were not affected as much as Laysan albatrosses by the military activities associated with WWII, but after the war, the size of the colony decreased to 8,700 pairs in 1957 (Rice and Kenyon, 1962a) and 4,700 pairs in 1963 (Robbins, 1966). This decrease probably was due to the combined effects of human activities that included: military control programs and activities, introduced vegetation, physical alteration of the shoreline nesting habitat, and possibly fisheries bycatch (Rice and Kenyon, 1962a; McDermond and Morgan, 1993). There were no complete counts of breeding black-footed albatrosses between 1963 and 1992. In 1992, 19,757 nests were counted and by 2005, the number of nests had increased to 21,830. From 1999 to 2005, the number of nesting pairs has increased each year, but over the last 14-year period, there has been no detectable population trend (fig. 14).

Population Status and Trends 37
Colony
Estimated number of black-footed albatross breeding pairs
1923–32 1957–58 1994–2005
U.S.A.
Kure Atoll 1*365 (1923) 270 3*2,020 (2000)Midway Atoll 1*2,430 (1923) 28,700 321,829 (2005)Pearl and Hermes Reef 1*3,650 (1923) 27,103 3*6,646 (2002)Lisianski Island 1*1,810 (1923) 22,700 3*3,737 (2002)Laysan Island 1*8,510 (1923) 233,523 321,006 (2005)French Frigate Shoals 1*730 (1923) 21,499 34,259 (2005)Necker Island 1*180 (1923) 2368 3*112 (1995)Nihoa Island 1*110 (1923) 250 3*31 (1994)Ni`ihau (Lehua Island) 3*10 (2002)Ka`ula 2100 30 (1998)
Japan
Ogasawara Gunto 3405 (2003)Izu Shoto 2200 (1932) 3*1,560 (2003)Senkaku Retto
(Kita-kojima only)3*56 (2002)
Total (rounded) 18,000 54,200 61,700
1 Wetmore in Rice and Kenyon (1962a).2 Rice and Kenyon (1962a). 3 Flint (2005). * Spring/summer estimates were adjusted for nest loss.
Table 12. Estimates of the number of black-footed albatross breeding pairs by colony and hatch year.
[The hatch year of census is shown in parentheses]
tac_08_9354_0255_Albatrosses_Fig13
NUM
BER
OF B
REED
ING
PAIR
S
1920s1957–582002–05
1920s1957–582002–05
0
5,000
10,000
15,000
20,000
25,000
30,000
35,000
JAPA
N
0
1,000
2,000
3,000
4,000
5,000
6,000
7,000
8,000
Kure
Ato
ll
Mid
way
Atol
l
Pear
l and
Herm
esRe
ef
Lisi
ansk
iIs
land
Lays
anIs
land
Fren
chFr
igat
eSh
oals
Nec
ker
Isla
nd
Nih
oaIs
land
Ni`i
hau
Isla
nd
Ka’u
laIs
land
A. Breeding pair estimates from each island.
B. Breeding pair estimates at all islands except Midway Atoll and Laysan Island.
JAPA
N
Kure
Ato
ll
Mid
way
Atol
l
Pear
l and
Herm
esRe
ef
Lisi
ansk
iIs
land
Lays
anIs
land
Fren
chFr
igat
eSh
oals
Nec
ker
Isla
nd
Nih
oaIs
land
Ni`i
hau
Isla
nd
Ka’u
laIs
land
Figure 13. Number of black-footed albatross breeding pairs at colonies from the 1920s until 2005. Values are shown in table 5.
Pearl and Hermes Reef.—The colony increased from 3,650 to 7,103 pairs from 1923 to 1958, but then decreased to an estimated 6,646 pairs in 2003 (table 12).
Lisianski Island.—The black-footed albatross colony grew from 1,810 pairs in 1923, to 2,700 pairs in 1957, and to 3,737 pairs in 2002 (fig. 13). Nest sites may be limiting because dense vegetation covers most of the island (Clapp and Wirtz, 1975). In addition, black-footed and Laysan albatrosses may compete for nest sites as indicated by both species nesting in open areas of the island (Clapp and Wirtz, 1975).
Laysan Island.—The earliest reports for Laysan Island are from Dill and Bryan (1912) who estimated 42,500 pairs in 1911, 1 year after the first feather raids. However, Bailey (1952) doubted this high figure based on his count of 7,722 nests 2 years later. From the 1920s to 1957, estimates of
the black-footed albatross colony increased from 4,700 to 33,523 pairs (fig. 13; table 12). From 1992 to 2005, estimates of the number of nesting birds at Laysan Island were derived from transect samples. However, the variances associated with these estimates were so large that direct nest counts have been conducted since 1998. Direct counts indicate low interannual variation, and the count of 21,006 nests in 2005 is 37 percent less than the 1958 estimate (fig. 14).

38 Status Assessment of Laysan and Black-Footed Albatrosses, North Pacific Ocean, 1923–2005
tac_08_9354_0255_Albatrosses_Fig14
Total
Tern
East
Transects
Total
Census
TrigWhale-Skate
GinLt.Gin
NU
MB
ER O
F B
REED
ING
PA
IRS
1955 1960 1965 1970 1975 1980 1985 1990 1995 2000 2005
Laysan Island
French Frigate Shoals
Midway Atoll
0
10,000
20,000
30,000
40,000
50,000
0
5,000
10,000
15,000
20,000
25,000
0
1,000
2,000
3,000
4,000
5,000
6,000
Figure 14. Number of breeding pairs of black-footed albatross on Midway, Laysan, and French Frigate Shoals from the 1950s to 2005. The colony and the source of data for the 1950s and 1960s were Midway — Rice and Kenyon (1962a), Robbins (1966); Laysan — Rice and Kenyon (1962a), Ely and Clapp (1973); French Frigate Shoals — Rice and Kenyon (1962a), Amerson (1971). Data for 1979 to 2005 were collected by USFWS personnel.

Population Status and Trends 39
French Frigate Shoals.—The number of breeding pairs of black-footed albatrosses has increased from 405 pairs in 1923 to 4,259 pairs in 2005 (fig. 13). The overall increase primarily is due to increases in the number of breeding birds on East and Tern Islands where wash-over events due to storm surges are rare (Amerson, 1971). During military occupation of these islands, the number of breeding black-footed albatrosses was low. After the U.S. Coast Guard left East Island in 1952, the colony increased from 200 pairs in 1954 to 2,500 pairs in 1980 (fig. 14). Likewise, after the Tern Island LORAN Station closed in 1979 and administration of the atoll was transferred to the USFWS, the number of breeding pairs on Tern Island increased from 82 in 1980, to 1,721 pairs in 2003 (fig. 14). The loss of Whale-Skate Island to erosion in 1997 (U.S. Fish and Wildlife Service, unpub. data, 1980–2005) was a significant loss of nesting habitat at French Frigate Shoals. From 1980 to 1990, about one-third of the atoll’s black-footed albatross pairs nested on this islet. Only East Island supported a larger number of nests.
Necker and Nihoa Islands.—Only a small number of black-footed albatrosses nest on these small volcanic islands. During the past century, estimates for Necker Island fluctuated between 39 and 368 pairs and between 25 and 65 pairs at Nihoa Island. This variation may be due to annual differences in the proportion of pairs attempting to nest, timing of censuses, or true changes in the size of breeding colonies.
Japanese Islands.—Historically, black-footed albatross nested in the Izu Islands, Ogasawara Islands (Bonin Islands), Kazan Retto (Volcano Islands), Senkaku Retto, and Minami Torishima (Marcus Island; Tickell, 2000). Many colonies were extirpated by feather hunters by the early 1900s. Natural re-establishment of colonies occurred in the Izu Islands (Torishima), the Senkaku Retto, and the Ogasawara Islands (table 12; Hasegawa, 1984; Chiba and others, 2007). No quantitative estimates exist for the Japanese colonies prior to feather hunting, but black-footed albatrosses were reported to nest in large numbers on these islands. The current overall size of the Japanese colonies is estimated to be 2,220–2,350 pairs.
Mariana Islands.—A colony of black-footed albatrosses nested on Agrihan Island in the Commonwealth of the Northern Marianas into the late 19th century, but was then extirpated and recolonization has not occurred (Jouanin, 1959 in Rice and Kenyon, 1963; Reichel, 1991). Based on bones found in an archeological excavation, black-footed albatrosses also may have nested on Pagan Island (Tickell, 2000).
Central Pacific Islands.—Black-footed albatross were extirpated from Wake and Johnston atolls by feather hunters (Rice and Kenyon, 1962a). From 1996 to 2003, a few black-footed albatrosses laid eggs on Wake Island, but no young fledged and nesting did not occur in 2004 or 2005 (Rauzon and others, 2008).
Mexican Islands.— The first pair of black-footed albatrosses nesting outside of their historic range, nested on Guadalupe Island in 1998, and another pair nested at San Benedicto Island in 2000 (Pitman and Ballance, 2002). Although black-footed albatrosses have visited these sites during subsequent breeding seasons, there have been no further records of nesting at either island (R.W. Henry, University of California, Santa Cruz, written commun., 2008).
Regression Analysis of Count DataWe used linear regression to fit lines to log-transformed
counts of breeding pairs of black-footed albatross from Midway Atoll, Laysan Island, and French Frigate Shoals combined, for 1923–2005, 1957–2005, and 1998–2005. Counts were available from all three island groups for 11 years (1923, 1957, 1992, and 1998–2005). Analyses in which the P-value was less than or equal to 0.05 were taken as evidence that the population had either increased or decreased over the time interval (table 6). Thus over the longest time interval (83 years) the population increased, over the intermediate time interval (48 years), the population was stable, and there was no change over the shortest (13 years) and most recent time interval.
Population Viability Analyses (PVA) of Count Data
Midway Atoll.—The temporal trend in Robs was not significantly different from zero (slope = 0.0024, t = 0.386, p = 0.709), with most values within 0–0.05 (fig. 15). However, there was high inter-annual variation in the number of breeding pairs attending the atoll, which is reflected in the Robs values. The relation between Robs and colony size with time (t-1) is negative but not significant (slope = -2.9 × 10⁻⁵, t = -1.647, p = 0.134). The LRT indicates no significant improvement in using the logistic over the exponential model for explaining the Robs data (LR = 0.91, p = 0.617).
The exponential model indicates a positive growth rate of â = 0.015 (95 percent [CI]: 0.011 – 0.019), with the environmental stochasticity having a strong influence on Robs (table 13). After sampling error was included, the logistic model presented a poorer fit (higher AICc value) than the exponential model. In both cases, there are positive and negative deviations from the general trend in 1996 and 1999, respectively. A positive trend in the residuals also is observed in 2003–04.
Population projections based on the exponential model suggest in 60 years the population has a 50 percent chance of increasing 1.36 times (CI: 1.23– 1.49). The probability of decreasing 49 percent (CI: -53 – -45 percent) in this period is 0.10, and there is only a 0.225 probability of decreasing at all (fig. 16).

40 Status Assessment of Laysan and Black-Footed Albatrosses, North Pacific Ocean, 1923–2005
tac_08_9354_0255_Albatrosses_Fig16
-1.0 -0.5 0.0 0.5 1.0 1.5 2.00
0.1
0.2
0.3
0.4
0.6
0.5
RATE OF CHANGE
CUM
ULAT
IVE
PROB
ABIL
ITY
0
50,000
100,000
150,000
TIME (YEARS)
NUM
BER
OF B
REED
ING
PAIR
S
2010 2020 2030 2040 2050 2060
A.
B.
tac_08_9354_0255_Albatrosses_Fig15
17,000 18,000 19,000 20,000 21,000 22,000NUMBER OF BREEDING PAIRS
1991 1993 1995 1997 1999 2001 2003 2005
OBSERVED GROWTH RATE DISTRIBUTION
OBSE
RVED
GRO
WTH
RAT
E DI
STRI
BUTI
ON (R
OBS)
FREQ
UEN
CY
−1.0−0.2 0.0 0.1 0.2
-0.25
-0.2
-0.15
-0.1
-0.05
0
0.05
0.1
0.15
0.2
-0.2
-0.15
-0.1
-0.05
0
0.05
0.1
0.15
0
1
2
3
4
5
6
A. Frequency distribution of Robs.
SandEastern
Midway
Trendline y = 0.0024x - 4.6915
y = -3E-05x + 0.5828R 2 = 0.2317
R 2 = 0.0163
B. Inter-annual variability of Robs.
C. Relation between Robs and the breeding population size (time: t-1).
Figure 15. Observed growth rate distribution (Robs) for the black-footed albatross breeding population, Midway Atoll.
Figure 16. Population projection (A, n = 30) and cumulative probability (B) that a given rate of population change is reached over 60 years using the exponential model for black-footed albatross, Midway Atoll.

Population Status and Trends 41
Laysan Island.—Colony size estimates were derived from transects (1992–2005) and direct counts (1998–2005). Direct counts of colony size have considerably lower variance than transect estimates (see methods, appendix C). However, the available time-series data for direct counts is shorter, thus it may only indicate transient trends in the breeding population (fig. 17). Estimates from a re-analysis of transect samples using a negative binomial distribution represent a better estimate of the colony size, as samples were highly skewed (see methods, appendix C). Graphical examination also indicates that the re-estimations of the population size are closer to the direct counts than the original transect estimations, which failed to represent the relation between Robs and population size (fig. 17). The new estimates appear to under-estimate population size in most years, but this pattern is consistent throughout the series. Accordingly, only re-estimations from transect samples and direct counts were used to estimate population trends.
The colony growth rate derived from transects samples was positive, but not significantly different from zero (exponential model: â = 0.007, 95 percent CI [CI]: -0.045– 0.061) (table 14; fig. 18). Population projections using this estimate indicate a median rate of population increase over the next 60 years of 54.7 percent (CI: 34.1 – 80.1). This appears to be overly optimistic given the 0.425 probability that the population would decrease by 12.3 percent (CI: -23.8 – 0.6) and the 0.35 probability that it would decrease by greater than 50 percent (median: -51.3 percent, CI: -57.5 – -44.0; fig. 19). In addition, analysis using direct counts suggests a negative population growth rate, â = -0.013 (CI: -0.017 – -0.009; exponential model; table 15).
tac_08_9354_0255_Albatrosses_Fig17
NUM
BER
OF B
REED
ING
PAIR
S
0
10,000
20,000
30,000
40,000
50,000
60,000
1990 1992 1994 1996 1998 2000 2002 2004 2006
Transects, correctedTransects, FWS 95-percent confidence limits
Direct counts
Figure 17. Population estimates for black-footed albatross, Laysan Island.
French Frigate Shoals.—The trend in Robs for the entire atoll is not statistically different from zero (slope = 0.0007, t = 0.121, p = 0.905), whereas the relation of Robs to colony size is significant and negative (slope = -0.0002, t = -3.499, p = 0.002; fig. 20), characteristic of populations with strong first-order negative feedback on population size, and close to their carrying capacity (Royama, 1992; Berryman and others, 2002). The LR test, using the T12
2 version (Dennis and Taper, 1994), also indicates that the logistic model fits the data better than the exponential model (T12
2 = 10.41, p = 0.031).As with both islands described earlier, Robs values
are strongly affected by environmental stochasticity, as â < envσ (exponential model; table 16). Analysis of residuals indicates that in 1984–85, there was a negative deviation from the general trend, followed by a corresponding positive deviation in Robs values. These deviations appear to be the result of changes in the number of breeding pairs on Whale-Skate, as neither Tern nor East Islands showed significant changes in their colony sizes during 1984–87 (fig. 14). The logistic model indicates another unusual deviation from the deterministic model in 1995, which again is related to changes in the breeding population on Whale-Skate (fig. 14). In 1997, Whale-Skate disappeared due to erosion.
The growth rate estimated with the exponential model indicates an increase in colony size, with â = 0.010 (95-percent CI [CI]: 0.008 – 0.012) (table 16). Accordingly, population projections based on the exponential model suggest that in 60 years the population will increase by 74.2 percent (CI: 49.9 – 100.6; p = 0.50), although there is a 0.40 probability that the population would decrease greater than 10.9 percent (CI: -23.4 – 2.9) and a 0.325 probability that this decrease would be greater than 47 percent (CI: -55 – -39; fig. 21).

42 Status Assessment of Laysan and Black-Footed Albatrosses, North Pacific Ocean, 1923–2005
Data: 1992–2005
[N(Robs)=11]
Parameters fitted (mean ± 1 SE)
logL(φ) AICc
Including sampling error + environmental stochasticity
Exponential model
ˆ = 0.01501 (0.01148; 0.01853)= 0.06879 (0.06022; 0.07816)= 0.06720= 0.01469
tot
env
s error
a
−
σσ
σ
14.359 -23.219
Logistic model -5 -5 -5
ˆ = 0.59316 (0.47154; 0.72880)ˆ = 2.9649×10 (2.3368×10 ;3.6561×10 )ˆ = 20,006
0.06618 (0.05904; 0.07315)= 0.06453= 0.01469
tot
env
s error
ab
Kσσ
σ −
−
=
13.967 -18.505
Table 13. Parameter estimation for exponential and logistic R-function models fitted to black-footed albatross Robs data, Midway Atoll.
[Black-footed albatross Robs data from U.S. Fish and Wildlife Service, unpub.data, 1980–2005; Flint, 2005. Robs, observed growth rate distribution; SE, standard error. a, population growth rate; totσ , total variation; envσ , environmental stochasticity; s error−σ , sampling error; – b , density-dependent parameter; K, carrying capacity]
Data: 1992–2005
[N(Robs)=13]
Parameters fitted [mean and (95-percent confidence limit)]
logL(φ) AICc
Including sampling error + environmental stochasticity
Exponential model
ˆ = 0.00746 (-0.04549; 0.06144)= 0.28828 (0.16834; 0.43672)= 0.16155= 0.23876
tot
env
s error
a
−
σσ
σ
-1.402 8.304
Logistic model -5 -5 -5
1
ˆ = 1.01612 (0.56609; 1.54077)ˆ = 4.8934×10 (2.7274×10 ; 7.6219×10 )ˆ = 20,765
0.20709 (0.12383; 0.31868)= 0= 0.23876
tot
env
s error
ab
Kσσ
σ −
−
=
2.816 3.797
1Estimation was negative.
Table 14. Parameter estimation for exponential and logistic R-function models fitted to black-footed albatross Robs data after re-analysis of transect samples, Laysan Island.
[Black-footed albatross Robs data from U.S. Fish and Wildlife Service, unpub.data, 1980–2005; Flint, 2005. Robs, observed growth rate distribution; a , population growth rate; totσ , total variation; envσ , environmental stochasticity;
s error−σ , sampling error; – b , density-dependent parameter; K, carrying capacity]

Population Status and Trends 43
Data: 1998–2005
[N(Robs)=7]
Parameters fitted [mean and (95-percent confidence limit)]
logL(φ) AICc
Including sampling error + environmental stochasticity
Exponential model
ˆ = -0.01278 (-0.01669; -0.00872)= 0.09083 (0.07766; 0.10390)= 0.08882= 0.01900
tot
env
s error
a
−
σσ
σ
7.398 -7.796
Logistic model -5 -5 -5
ˆ = 0.80856 (0.68629; 0.92837)ˆ = 3.8693×10 (3.2973×10 ; 4.4298×10 )
0.07200 (0.06277; 0.08100)= 0.06945= 0. 01900
tot
env
s error
ab
−
−=
σσ
σ
9.662 -5.324
Table 15. Parameter estimation for exponential and logistic R-function models fitted to black-footed albatross Robs data derived from direct nest counts, Laysan Island.
[Black-footed albatross Robs data from U.S. Fish and Wildlife Service, unpub.data, 1980–2005; Flint, 2005. Robs, observed growth rate distribution; a , population growth rate; totσ , total variation; envσ , environmental stochasticity;
s error−σ , sampling error; – b , density-dependent parameter]
Data: 1982–2005
[N(Robs)=23]
Parameters fitted [mean and (95-percent confidence interval)]
logL(φ) AICc
Including sampling error + environmental stochasticity
Exponential model
ˆ = 0.01044 (0.00834; 0.01241)= 0.18967 (0.18307; 0.19617)= 0.18912= 0.01441
tot
env
s error
a
−
σσ
σ
6.109 -7.618
Logistic model -4 -4 -4
ˆ = 0.76052 (0.72957; 0.79302)ˆ = 1.9421×10 (1.8613×10 ; 2.0251×10 )ˆ = 3,916
0.15617 (0.15141; 0.16069)= 0.15550= 0.01441
tot
env
s error
ab
Kσσ
σ −
−
=
11.118 -14.973
Table 16. Parameter estimation for exponential and logistic R-function models fitted to black-footed albatross Robs data, French Frigate Shoals.
[Black-footed albatross Robs data from U.S. Fish and Wildlife Service, unpub.data, 1980–2005; Flint, 2005 Robs, observed growth rate distribution; a , population growth rate; totσ , total variation; envσ , environmental stochasticity;
s error−σ , sampling error; – b , density-dependent parameter; K, carrying capacity]

44 Status Assessment of Laysan and Black-Footed Albatrosses, North Pacific Ocean, 1923–2005
tac_08_9354_0255_Albatrosses_Fig18
OBSERVED GROWTH RATE DISTRIBUTION
FREQ
UEN
CY
0
1
2
3
4
NUMBER OF BREEDING PAIRS
-0.60
-0.40
-0.20
0.00
0.20
0.40
0.60
-0.60
-0.40
-0.20
0.00
0.20
0.40
0.60
15,000 20,000 25,000 30,000 35,000 40,000
−0.3 −0.2 −0.1 0.0 0.1 0.2 0.3
1991 1993 1995 1997 1999 2001 2003 2005
A. Frequency distribution of Robs after re-analysis of transect samples.
B. Inter-annual variability of Robs.
C. Relation between Robs and the breeding population size (time: t-1).
OBSE
RVED
GRO
WTH
RAT
E DI
STRI
BUTI
ON (R
OBS)
Transects, correctedDirect counts
Transects, FWS
tac_08_9354_0255_Albatrosses_Fig19
-1.0 -0.5 0.0 0.5 1.00
0.1
0.2
0.3
0.4
0.6
0.5
RATE OF CHANGE
CUM
ULAT
IVE
PROB
ABIL
ITY
0
50,000
100,000
150,000
200,000
TIME (YEARS)
NUM
BER
OF B
REED
ING
PAIR
S
2010 2020 2030 2040 2050 2060
A.
B.
Figure 18. Observed growth rate distribution (Robs) for the black-footed albatross breeding population, Laysan Island.
Figure 19. Population projection (A, n = 30) and cumulative probability (B) that a given rate of population change is reached over 60 years using the exponential model and re-analyzed transect data for black-footed albatross, Laysan Island.
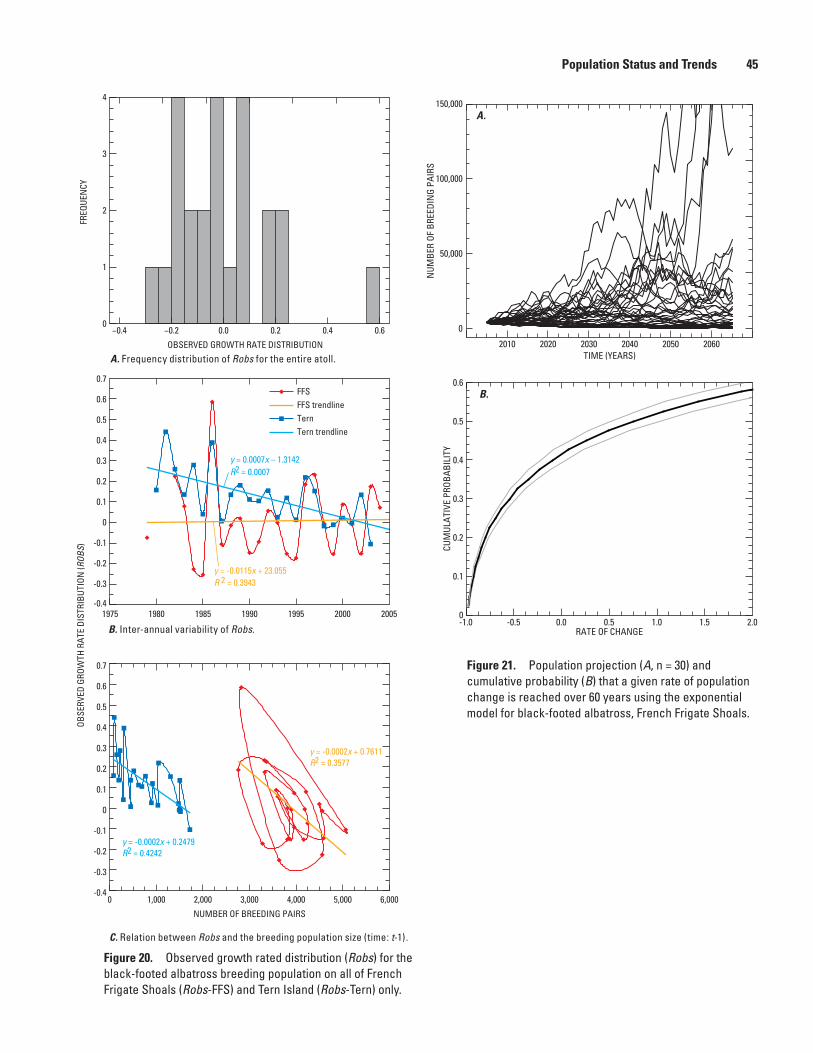
Population Status and Trends 45
tac_08_9354_0255_Albatrosses_Fig20
y = 0.0007x – 1.3142
y = -0.0115x + 23.055
y = -0.0002x + 0.7611
y = -0.0002x + 0.2479
R2 = 0.0007
R 2 = 0.3943
R2 = 0.3577
R2 = 0.4242
OBSERVED GROWTH RATE DISTRIBUTION
FREQ
UEN
CY
NUMBER OF BREEDING PAIRS
-0.4
-0.3
-0.2
-0.1
0
0.1
0.2
0.3
0.4
0.5
0.6
0.7
1975 1980 1985 1990 1995 2000 2005
-0.4
-0.3
-0.2
-0.1
0
0.1
0.2
0.3
0.4
0.5
0.6
0.7
0 1,000 2,000 3,000 4,000 5,000 6,000
−0.4 −0.2 0.0 0.2 0.4 0.6
4
3
2
1
0
A. Frequency distribution of Robs for the entire atoll.
B. Inter-annual variability of Robs.
C. Relation between Robs and the breeding population size (time: t-1).
OBSE
RVED
GRO
WTH
RAT
E DI
STRI
BUTI
ON (R
OBS)
FFS trendlineTern
FFS
Tern trendline
tac_08_9354_0255_Albatrosses_Fig21
-1.0 -0.5 0.0 0.5 1.0 1.5 2.00
0.1
0.2
0.3
0.4
0.6
0.5
RATE OF CHANGE
CUM
ULAT
IVE
PROB
ABIL
ITY
0
50,000
100,000
150,000
TIME (YEARS)
NUM
BER
OF B
REED
ING
PAIR
S
2010 2020 2030 2040 2050 2060
A.
B.
Figure 20. Observed growth rated distribution (Robs) for the black-footed albatross breeding population on all of French Frigate Shoals (Robs-FFS) and Tern Island (Robs-Tern) only.
Figure 21. Population projection (A, n = 30) and cumulative probability (B) that a given rate of population change is reached over 60 years using the exponential model for black-footed albatross, French Frigate Shoals.

46 Status Assessment of Laysan and Black-Footed Albatrosses, North Pacific Ocean, 1923–2005
Matrix Model AnalysesTrend over the Past Century.—The size of the black-
footed albatross population prior to feather hunting is unknown, but it is believed that harvesting greatly reduced the population, and several colonies were known to have been extirpated (Rice and Kenyon, 1962a; Spennemann, 1998). Following this era, the black-footed albatross population increased from ca. 18,000 breeding pairs in 1923 to ca. 61,000 breeding pairs in 2005 (fig. 22). Population growth has occurred despite major human disturbance of breeding colonies, primarily at Midway Atoll and French Frigate Shoals (fig. 13), and intense fishing mortality. The joint effect of these two factors led to a significant reduction of the observed population growth rate relative to the growth rate prior to the 1940s. The median population growth rate for 1955–2003 was 1.003 compared to the natural growth rate estimate of λ = 1.035 (log2A model; table 18), implying a 3.2 percent decrease in population growth due to fishery mortality.
In reconstructing the historic population trend for black-footed albatrosses, we did not find support for the population estimate of Fisher and Baldwin (1946), but we did for the estimates of Rice and Kenyon (1962a). Our findings are based on the assumption that the data on control programs presented in table 2 are accurate. Observations by Fisher and Baldwin (1946) suggest that the total number of black-footed albatrosses killed or prevented from nesting, as presented in table 2, may be greatly underestimated.
Parameter Estimation.—The model we used for estimating demographic parameters and the population growth rate was a density-independent, age-structured, matrix model similar to that used by Cousins and Cooper (2000) and Lewison and Crowder (2003), thus differences in our results are not due to model structure. In all scenarios, the current breeding population size was below the maximum nesting capacity estimated by K1 (68,000 pairs; fig. 22). Demographic estimates presented are within the range of reported values for each parameter (table 13) and represent values necessary to maintain the measured population growth rate given the documented Navy activities during 1950 to 2005 and the estimated fisheries bycatch. Thus, these values are not maximum values for the species, and calculated population growth rates (λ = 1.031-1.036) are below previous estimates for the species (λ = 1.04, Cousins and Cooper, 2000; λ = 1.059, Niel and Lebreton, 2005). This suggests the influence of additional factors affecting the population growth rate, such as fishery bycatch, density-dependence, interisland variation in breeding success, recruitment compensation, or space limitation.
The 2005 fishery bycatch (fig. 23) is within the mortality level that can be sustained by the black-footed albatross population without causing a decrease. However, this should be interpreted with caution given the uncertainty of bycatch estimates (as indicated by the overlap of the bycatch confidence interval with the sustainable mortality level for black-footed albatrosses). Our analyses support the lower bycatch hypothesis for the International pelagic longline fishery, as estimated for the Hawaiian-based fleet during 1997–2000 (see appendix A for details of bycatch hypotheses). Finally, the assumption of zero bycatch prior to 1970, as assumed by previous analyses (Cousins and Cooper, 2000; Lewison and Crowder, 2003), is not supported by our model.
Fishery Impact.— All model scenarios indicate that the overall bycatch level for the period when pelagic longline and high seas driftnet fisheries were both active, was greater than the potential growth capacity for the species. Consequently, the closure of the high seas pelagic driftnet fishery was critical to preventing further population decline. Nevertheless, estimated bycatch from the longline fleet was greater than for the driftnet fleet estimates (fig. 4), and remains as of 2005 as the most important source of mortality for black-footed albatrosses.
During the 1980s, co-occurrence of driftnet and pelagic longline fisheries caused a reduction in adult survival, as indicated by our results and those from capture-recapture data (table 18). Weighted averages of estimates by Kendall (U.S. Geological Survey Patuxent Wildlife Research Center, written commun., 2005) provided a better fit to survival estimates than our model, indicating that island-specific factors affect these parameters. This is further supported by the lack of fit of our model to the breeding population trend during the 1950s and 1960s, indicating that albatross numbers killed by humans during this period may have been significantly underestimated.
tac_08_9354_0255_Albatrosses_Fig22
0
20,000
40,000
60,000
80,000
100,000
1920 1930 1940 1950 1960 1970 1980 1990 2000 2010
BREE
DIN
G PO
PULA
TION
SIZ
E
H2-meanK1H1-meanK2World
Figure 22. World black-footed albatross breeding population trend, as derived from estimations at each island.
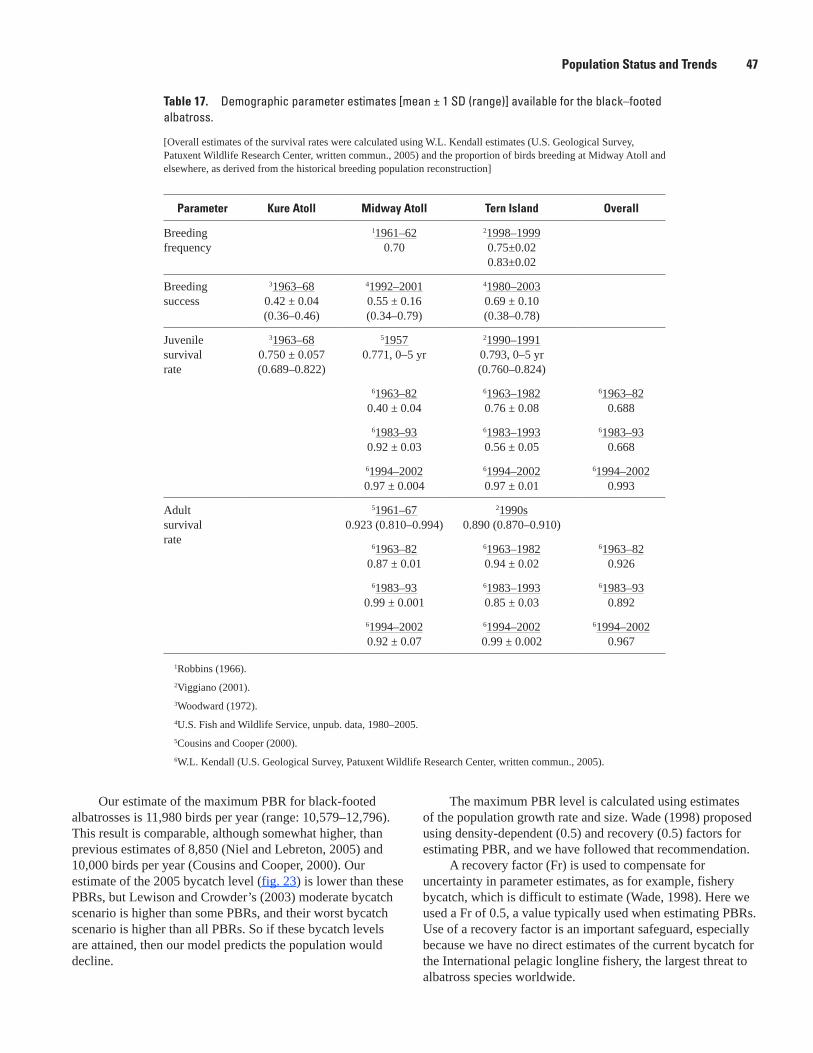
Population Status and Trends 47
Our estimate of the maximum PBR for black-footed albatrosses is 11,980 birds per year (range: 10,579–12,796). This result is comparable, although somewhat higher, than previous estimates of 8,850 (Niel and Lebreton, 2005) and 10,000 birds per year (Cousins and Cooper, 2000). Our estimate of the 2005 bycatch level (fig. 23) is lower than these PBRs, but Lewison and Crowder’s (2003) moderate bycatch scenario is higher than some PBRs, and their worst bycatch scenario is higher than all PBRs. So if these bycatch levels are attained, then our model predicts the population would decline.
The maximum PBR level is calculated using estimates of the population growth rate and size. Wade (1998) proposed using density-dependent (0.5) and recovery (0.5) factors for estimating PBR, and we have followed that recommendation.
A recovery factor (Fr) is used to compensate for uncertainty in parameter estimates, as for example, fishery bycatch, which is difficult to estimate (Wade, 1998). Here we used a Fr of 0.5, a value typically used when estimating PBRs. Use of a recovery factor is an important safeguard, especially because we have no direct estimates of the current bycatch for the International pelagic longline fishery, the largest threat to albatross species worldwide.
Table 17. Demographic parameter estimates [mean ± 1 SD (range)] available for the black–footed albatross.
[Overall estimates of the survival rates were calculated using W.L. Kendall estimates (U.S. Geological Survey, Patuxent Wildlife Research Center, written commun., 2005) and the proportion of birds breeding at Midway Atoll and elsewhere, as derived from the historical breeding population reconstruction]
Parameter Kure Atoll Midway Atoll Tern Island Overall
Breeding frequency
11961–620.70
21998–19990.75±0.020.83±0.02
Breeding success
31963–680.42 ± 0.04(0.36–0.46)
41992–20010.55 ± 0.16(0.34–0.79)
41980–20030.69 ± 0.10(0.38–0.78)
Juvenile survival rate
31963–680.750 ± 0.057(0.689–0.822)
519570.771, 0–5 yr
21990–19910.793, 0–5 yr (0.760–0.824)
61963–820.40 ± 0.04
61963–19820.76 ± 0.08
61963–820.688
61983–930.92 ± 0.03
61983–19930.56 ± 0.05
61983–930.668
61994–20020.97 ± 0.004
61994–20020.97 ± 0.01
61994–20020.993
Adult survival rate
51961–670.923 (0.810–0.994)
21990s0.890 (0.870–0.910)
61963–820.87 ± 0.01
61963–19820.94 ± 0.02
61963–820.926
61983–930.99 ± 0.001
61983–19930.85 ± 0.03
61983–930.892
61994–20020.92 ± 0.07
61994–20020.99 ± 0.002
61994–20020.967
1Robbins (1966).2Viggiano (2001).3Woodward (1972). 4U.S. Fish and Wildlife Service, unpub. data, 1980–2005. 5Cousins and Cooper (2000).6W.L. Kendall (U.S. Geological Survey, Patuxent Wildlife Research Center, written commun., 2005).

48 Status Assessment of Laysan and Black-Footed Albatrosses, North Pacific Ocean, 1923–2005
Figure 23. Potential Biological Removal estimate using R/4, R/2, and R, and initial population sizes of black-footed albatross as obtained from each estimated trend for 2004.
Table 18. Parameter estimates [median (95-percent CI)] for the black–footed albatross population–projection matrix.
[Descriptions of parameters and models are shown in appendix C. b, constant measuring the strength of density-dependence. Lambda (λ) max, maximum growth rate of the population. NA, not applicable]
Parameters
Model: Exp-A Model: Log-2A Model: Log-2G Model: Log-2H
Exponential; Low bycatch (mean for H1)
Logistic; Low bycatch (mean for H1)
Logistic; Low bycatch
(2.5 percentile for H1)
Logistic; Low bycatch
(mean × 1.14 for H1)
Breeding frequency 0.67(0.65–0.74)
0.67(0.65–0.72)
0.71(0.65–0.80)
0.67(0.65–0.68)
Breeding success 0.63(0.51–0.71)
0.61(0.51–0.70)
0.57(0.50–0.67)
0.66(0.63–0.71)
Survival fledglings 0.810(0.710–0.890)
0.820(0.720–0.890)
0.78(0.70–0.89)
0.835(0.755–0.877)
Survival juveniles 0.940(0.920–0.985)
0.950(0.930–0.980)
0.94(0.93–0.97)
0.940(0.930–0.950)
Survival adults 0.945(0.940–0.965)
0.945(0.940–0.960)
0.95(0.94–0.96)
0.945(0.941–0.950)
b NA 5.14×10⁻¹⁰
(4.43×10⁻¹¹ – 9.63×10⁻¹⁰)4.63×10⁻¹⁰
(1.39×10⁻¹¹ – 9.58×10⁻¹⁰)2.82×10⁻¹⁰
(2.33×10⁻¹¹ – 9.31×10⁻¹⁰)Lambda (λ) max 1.035
(1.034–1.036)1.035
(1.034–1.036)1.032
(1.031–1.033)1.036
(1.036–1.036)N 100 100 100 112
1Iteration process stopped after 21 hours.
tac_08_9354_0255_Albatrosses_Fig23
1950 1960 1970 1980 1990 2000 20100
5,000
10,000
15,000
20,000
NUM
BER
OF A
DULT
S AN
D JU
VEN
ILES
Log2A
EXPLANATION
Log2G
Log2H
Navy removals
Potential biological removal estimate using R/4
Log2A
Log2G
Log2H
Potential biological removal estimate using R/2
Log2A
Log2G
Log2H
Potential biological removal estimate using R
H1-mean
H1-low
H1-mean*1.14
Fishery bycatch levels

Population Status and Trends 49
Discussion: Laysan and Black-Footed Albatrosses Population Analyses
Population Viability AnalysesPVA results indicate that colonies at Midway Atoll
(black-footed albatrosses only) and French Frigate Shoals (Laysan and black-footed albatrosses) will have a positive growth rate over the next 60 years and they have a 0.5 probability of increasing 0.74–8.36 times their present population sizes. At Laysan Island, PVA results for Laysan and black-footed albatrosses are less optimistic. After re-analyzing the transect data, projections for both albatross species suggest a positive population change over the next 60 years (BFAL: median = 0.55; LAAL: median = 0.16), but there is a high probability that their populations will decrease greater than 50 percent in 60 years (figs. 8 and 19). An analysis of direct counts for black-footed albatrosses indicates a negative trend over time (â = -0.013, table 15).
Population projections are determined by population growth rate â and the environmental stochasticity, envσ , with sampling variance removed. Growth rate determines the general trend in the population over time, with negative values indicating a decline. However, environmental stochasticity plays an important role in determining PVA results, as this
parameter significantly affects the effective population growth in a given year, with higher envσ values producing more pessimistic PVA results (Morris and Doak, 2002).
For all islands and species analyzed, â << envσ (fig. 24), and consequently, environmental stochasticity has a profound effect on the PVA results. For example, even when the â values estimated for the black-footed albatross colonies at Midway Atoll and French Frigate Shoals are similar, the higher environmental variance in the French Frigate Shoals population (fig. 24) implies larger probabilities of decreasing greater than 50 percent (figs. 16 and 21).
Another important factor affecting results is the accuracy of the parameter estimates. The analyses with parameter estimates developed from conducting direct nest counts are more accurate than analyses based on transect sampling (fig. 24). PVA analyses conducted for black-footed albatross on Laysan Island, where population estimates are derived from transect sampling, indicated a population increase but also had the highest probabilities of population decreases over the next 60 years. Parameter estimation based on direct counts of all black-footed albatross nests present a negative trend with narrower confidence intervals, but the short time series of data may produce misleading conclusions. However, application of this negative growth rate, derived from direct counts, to the best historical estimates (Rice and Kenyon, 1962a) during the 1956 and 1957 breeding seasons accurately projects the current breeding population.
tac_08_9354_0255_Albatrosses_Fig24
00
0.1
0.2
0.3
0.4
0.50.5
0.6
-0.05 -0.04 -0.03 -0.02 -0.01 0.00 0.01 0.02 0.03 0.04 0.05 0.06 0.07
BF-Laysan1
BF-Laysan2
BF-Midway
BF-FFS
LA-Laysan1
LA-Laysan2
LA-FFS
â
σ-EN
V
Figure 24. Species and islands comparison of the population growth rate, â, and the environmental variance, envσ , estimated with the exponential model (mean and 95-percent CI).

50 Status Assessment of Laysan and Black-Footed Albatrosses, North Pacific Ocean, 1923–2005
For most bird species, census variability reflects true changes in the total number of individuals (that is, Laysan finch; see Dennis and others, 1991), but for breeding albatrosses, censuses of nesting birds also are affected by the fraction of mature birds attempting to nest that year. Accordingly, envσ should be primarily interpreted as an environmental variable that affects the attendance pattern of breeding birds in the colony. This does not preclude use of breeding pair censuses to estimate albatross population trends, because substantial decreases in population size have been detected using these types of data (that is, Wandering albatrosses, Weimerskirch and others, 1997a; Wandering, Grey-headed, and Black-browed albatrosses, Croxall and others, 1998), but longer time-series data are needed. In this context, only time-series data from French Frigate Shoals are long enough to show a potential change over time. Analysis from this atoll indicates that both albatross species have positive population growth rates, and their median trend is for growth over the next 60 years. However, this conclusion should be viewed with caution since French Frigate Shoals was occupied by the military until 1979, the atoll population represents only a small fraction of the species population, and important local factors may differ among islands.
The PVA analyses for black-footed albatrosses indicate that under conditions present in 2005, the overall population is not at risk of a substantial decrease over the next 60 years, but for Laysan Island, there is great uncertainty in the parameter estimates. Colony size at Laysan Island should be carefully monitored and abundance estimates improved. Results from French Frigate Shoals, for which the longest time series data exists, indicate that the number of breeding pairs of both albatross species increased, even during the period of high fishing mortality in the 1980s. If fishing mortality is homogeneously distributed among all NWHI colonies, this suggests that another factor in addition to fishing mortality, perhaps nest site availability, may be reducing the observed population growth rates at other islands. The closure of the military station at French Frigate Shoals in 1980 also may explain the population growth at this site, as birds displaced by military activities returned to breed. Colonies at French Frigate Shoals and Midway Atoll grew faster after ‘control’ programs were stopped (see section, “Conflicts with Military Activities;” Gould and Hobbs, 1993), perhaps indicating that space was a limiting factor or that breeders were precluded from nesting. By contrast, the breeding population size of Laysan albatrosses appears stable on Laysan Island, although the black-footed albatross population has decreased (figs. 5 and 13; Gould and Hobbs, 1993).
Incidental Mortality of AlbatrossesIncidental mortality during fishing operations is believed
to be a major threat to the long-term viability of black-footed albatrosses (Cousins and Cooper, 2000; Lewison and Crowder, 2003; Niel and Lebreton, 2005). The projected population decrease due to this cause motivated the IUCN to list black-footed albatrosses as Endangered in 2003 (International Union for the Conservation of Nature and Natural Resources, 2004). The population growth rate (λ) potential and fishery bycatch levels used in these analyses differed from ours because they used different estimates of adult and juvenile survival rates, both of which have a large impact on λ (Cousins and Cooper, 2000), and fishery bycatch estimates.
Maximum Potential Biological Removal (PBR) for black-footed albatrosses has been estimated to be 8,850 to 10,000 birds/year (Niel and Lebreton, 2005; Cousins and Cooper, 2000, respectively). The 95-percent confidence interval for black-footed albatross bycatch falls within this range (fig. 23), and therefore requires careful examination, especially because the PBR estimate does not consider other sources of mortality.
The analysis of Lewison and Crowder (2003) assumed an initial condition in which λ~1 (stability), and added estimates of fishery bycatch for the International pelagic longline fleet in the North Pacific Ocean. Predictions from this modeling indicated that the black-footed albatross population was likely to decline rapidly over the next 60 years. This steep decline appears to be the result of assuming that there was no fishery bycatch during the 1960s to 1970s, the time period over which demographic parameters were estimated. Fishery effort data from the Ocean Fisheries Program indicates that bycatch probably was significant during this era (fig. 4). Thus, when bycatch was added to the model, the influence of fisheries was approximately doubled, leading to a prediction of rapid population decreases.
We analyzed the fishery bycatch data from the North Pacific Ocean since 1950 and found that the International pelagic longline fleet maintained a similar fishing effort from the 1960s to the present, with perhaps a slight decrease in effort during recent years (fig. 4). Because we have no evidence to suggest that the bycatch rate for this fishery changed over this period, an era with no mitigation measures in place, we feel that past analyses likely doubled the bycatch rate.

Acknowledgments 51
ConclusionsThe Laysan albatross breeding population increased
from an estimated 18,000 pairs in 1923 to 590,000 pairs in 2005, and currently does not appear to be at risk of decline due to fishery bycatch. The large increase in population size during the past 83 years, is likely a response to cessation of persecution by feather hunters and the military, and an increase in nesting area at some colonies. Analysis of linear trends in the population showed a positive change over 1923–2005 and 1957–2005, and a stable size during 1992–2005. PVA results for French Frigate Shoals indicate that the population is currently stable and has a 50-percent probability of increasing 8.36 times in the next 60 years, but it also has a 28-percent probability of decreasing 0.24 times. For Laysan Island, the PVA predicts that the median population size will increase by 15.7 percent in the next 60 years, but there is a 45-percent probability that the population will decrease by greater than 50 percent. PVA analysis was not conducted for Midway Atoll due to the paucity of data. Matrix modeling results indicate that the Laysan albatross population, summed across all three colonies, is increasing at 6.7 percent a year, and that the estimated bycatch of 2500 birds/year is below the PBR.
The black-footed albatross breeding population increased from an estimated 18,000 pairs in 1923 to 61,000 pairs in 2005, and currently may be at risk of decline due to fishery bycatch. As with Laysan albatross, the increase in population size over the past 83 years probably is in response to the end of persecution at the nesting colonies. Analysis of linear trends in the population showed a positive change over 1923 to 2005, no change from 1957 to 2005, and no change from 1998 to 2005. PVA results for French Frigate Shoals indicate that the population is increasing at 1 percent a year and has a 50-percent probability of increasing by 74 percent in the next 60 years, but it also has a 35-percent probability of decreasing by greater than 47 percent. For Laysan Island, the population is stable, and the PVA predicts the median population growth rate will increase by 54.7 percent. However, this should be taken with caution because there is a 35-percent probability that the population would decrease by greater than 50 percent. For Midway Atoll, the population is increasing annually by 1.5 percent, and the PVA predicts a 50-percent probability of a 1.36 times increase in the population size and a 22.5-percent probability of the population decreasing by any amount. Matrix modeling results indicate that the black-footed albatross population, summed across all three colonies, is stable, or slightly increasing, with a population growth rate of 0.3 percent per year. The 2005 estimate of bycatch is 5,228 birds per year, but if this value is doubled, a safeguard for underestimating bycatch, it approaches the PBR of 11,980 birds per year, although the upper 95-percent confidence limit (17,486) exceeds the PBR.
Our knowledge of interactions of Laysan and black-footed albatrosses with fishing operations is imperfect, partly because of the difficulty of obtaining reliable bycatch data. Results from the matrix modeling indicate that fishery bycatch is not significantly affecting the size of the Laysan albatross population, but may be causing a decrease in black-footed albatross populations.
AcknowledgmentsSpecial thanks to S. Fitzgerald, K. Rivera, J. Bisson,
B. Miyamoto, C. Tokita, J. D. Kelly (NOAA Fisheries) and G. Williams (International Pacific Halibut Commission) for providing data and insights on the U.S. fisheries and observer programs. J. Smith (University of Washington) and K. Morgan (Environment Canada) provided valuable insights from the Canadian observer program. Thanks to E. Flint, B. Zaun, L. Young, J. Klavitter (U.S. Fish and Wildlife Service), and M. Rauzon (Marine Endeavors) for providing data on the U.S. colonies; R.W. Henry (University of California at Santa Cruz), B. Keitt (Island Conservation, University of California at Santa Cruz), and R. Wanless (BirdLife Global Seabird Programme) for data on the Mexican colonies; and, T. Deguchi and N. Nakamura (Yamashina Institute for Ornithology) and H. Hasegawa (Toho University, Japan,) for the Japanese colonies. Thanks to R. Young (U.S. Fish and Wildlife Service) for producing the breeding distribution map (fig. 1), C. Small and F. Taylor (BirdLife International, Global Seabird Programme) for producing the at-sea distribution maps (fig. 2), M. Morin for analyses of reproductive success, S. Thomsen for summarizing the contaminant literature.
We thank the following for providing reviews of an earlier draft: J. Bisson, L. Blight, B. Bortner, J. Croxall, T. Deguchi, K. Dietrich, M. Finkelstein, S. Fitzgerald, H. Freifeld, T. Good, D. Goodman, C. Harrison, R. Henry, S. Hoyle, D. Hyrenbach, A. Katekaru, B. Keitt, W. L. Kendall, J. Klavitter, K. Kuletz, J.D. Lebreton, R. Lewison, J. Ludwig, E. Melvin, K. Morgan, K. Rivera, F. Rivera-Milán, C.S. Robbins, M. Romano, S. Shaffer, J. Smith, J.L. Trapp, U. Varanasi, S. Veran, G. Williams, B. Zaun. A special thanks to T. Zimmerman (U.S. Fish and Wildlife Service) for continued support throughout this project. We also would like to acknowledge the editing assistance of J. Erickson and R. Jacobs (USGS, Forest and Rangeland Ecosystem Science Center).
Funding for this assessment was provided by the U.S. Fish and Wildlife Service, Division of Migratory Birds and Habitat Programs, Pacific Region.

52 Status Assessment of Laysan and Black-Footed Albatrosses, North Pacific Ocean, 1923–2005
References Cited
Aguirre-Munoz, A., Croll, D.A., Donlan, C.J., Henry III, R.W., Hermosillo, M.A., Howald, G.R., Keitt, B.S., Luna-Mendoza, L., Rodrıguez-Malagon, M., Salas-Flores, L.M., Samaniego-Herrera, A., Sanchez-Pacheco, J.A., Sheppard, J., Tershy, B.R., Toro-Benito, J., Wolf, S., and Wood, B., 2008, High-impact conservation: invasive mammal eradications from the Islands of Western Mexico: AMBIO, v. 37, p.101–107.
Amerson, A.B., 1971, The natural history of French Frigate Shoals, Northwestern Hawaiian Islands: Atoll Research Bulletin 150, p.1-306.
Amerson, A.B., Clapp, R.B., and Wirtz, W.O., 1974, The natural history of Pearl and Hermes Reef, Northwestern Hawaiian Islands: Atoll Research Bulletin 174, p. 306.
American Ornithologists’ Union, 1997, Forty-first supplement to the American Ornithologists’ Union check-list of North American birds: Auk, v. 114, p. 542–552.
American Ornithologists’ Union, 1998, The American Ornithologists’ Union Check-list of North American birds, 7th edition: Washington, D.C., American Ornithological Union.
Angel, A., and Cooper, J., 2006, A review of the impacts of introduced rodents on the island of Triston and Gough: Sandy, UK, Royal Society for the Protection of Birds, RSPB Research Report No. 17.
Artyukhin, Y.B., and Burkanov, V.N., 2000, Incidental mortality of seabirds in the drift net salmon fishery by Japanese vessels in the Russian Exclusive Economic Zone, 1993–1997, in Kondratyev, A.K., Litvinenko, N.M., and Kaiser, G.W., eds., Seabirds of the Russian Far East: Ottawa, Canada, Canadian Wildlife Service, p. 105–116.
Auman, H.J., Ludwig, J.P., Giesy, J.P., and Colborn, T., 1998, Plastic ingestion by Laysan albatross chicks on Sand Island, Midway Atoll, in 1994 and 1995, in Robertson, G., and Gales, R., eds., Albatross biology and conservation: Chipping Norton, Australia, Surrey Beatty & Sons, p. 239–244.
Auman, H.J., Ludwig, J.P., Summer, C.L., Verbrugge, D.A., Froese, K.L., Colborn, T., and Giesy, J.P., 1997, PCBs, DDE, DDT, and TCDD-EQ in two species of albatross on Sand Island, Midway Atoll: North Pacific Ocean: Environmental Toxicology and Chemistry, v. 16, p. 498–504.
Bailey, A.M., 1952, Laysan and black-footed albatrosses: Museum Pictorial, no. 6, p. 1–78.
Baker, J.D., Littnan, C.L., and Johnston, D.W., 2006, Potential effects of sea level rise on the terrestrial habitats of endangered and endemic megafauna in the Northwestern Hawaiian Islands: Endangered Species Research, v. 4, p. 1–10.
Bates, D., and Maechler, M., 2005, Matrix: A Matrix Package for R. R-package version 0.95-5.
British Columbia Ministry of Environment, 2007, Endangered Species and Ecosystems Resources, accessed December 21, 2007, at http://www.env.gov.bc.ca/atrisk/
Berryman, A.A., 2003, On principles, laws, and theory in population ecology: Oikos, v. 103, p. 695–701.
Berryman, A.A., Lima, M., and Hawkins, B.A., 2002, Population regulation, emergent properties, and a requiem for density dependence: Oikos, v. 99, p. 600–606.
BirdLife International, 2004a, Phoebastria immutabilis, in IUCN, Red List of Threatened Species, accessed March 23, 2005, at http://www.iucnredlist.org/
BirdLife International, 2004b, Phoebastria nigripes, in IUCN, Red List of Threatened Species, accessed March 23, 2005, at http://www.iucnredlist.org/
BirdLife International, 2004c, Tracking ocean wanderers: the global distribution of albatrosses and petrels: results from the Global Procellariiform Tracking Workshop, 15 September, 2003, Gordon’s Bay, South Africa: Cambridge, UK, Birdlife International.
Bjorndal, K.A., Bolten, A.B., and Chaloupka, M.Y., 2000, Green turtle somatic growth model: evidence for density-dependence: Ecological Applications, v. 10, p. 269–282.
Boldt, J., ed, 2004, Ecosystem considerations for 2005: appendix C in North Pacific Fishery Management Council Groundfish Plan Team Document: Seattle, Washington, Groundfish stock assessment and fisheries evaluation report.
Briggs, K.T., Tyler, W.B., Lewis, D.B., and Carlson, D.R., 1987, Bird communities at sea off California, 1975 to 1983: Studies in Avian Biology, v. 11, p. 74.
Briggs, K.T., Varoujean, D.H., Williams, W.W., Ford, R.G., Bonnell, M.L., and Casey, J.L., 1992, Seabirds of the Oregon and Washington OCS, 1989–1990, Chapter III, in Brueggeman, J.J., ed., Oregon and Washington Marine Mammal and Seabird Surveys: Los Angeles, California, U.S. Department of the Interior, Minerals Management Service, MMS 91-0093.
References Cited 53
Brothers, N.P., Cooper, J., and Løkkeborg, S., 1999, The incidental catch of seabirds by longline fisheries: worldwide review and technical guidelines for mitigation: FAO Fisheries Circular No. 937.
Broughton, J.M., 1994, Size of the bursa of fabricius in relation to gonad size and age in Laysan and black-footed albatrosses: Condor, v. 96, p. 203–207.
Bryan, W.A., 1903, A monograph of Marcus Island: Bishop Museum Occasional Papers, v. 2, no. 1, p. 77–126.
Bryan, W.A., 1906, Report of a visit to Midway Island: Bishop Museum Occasional Papers, v. 2, no. 4, p. 37–45.
Carpenter, E.J., Anderson, S.J., Harvey, G.R., Miklas, H.P., and Peck, B.B., 1972, Polystyrene spherules in coastal waters: Science, v. 178, p. 749–750.
Carpenter, S.R., Cottingham, K.L., and Stow, C.A., 1994, Fitting predator-prey models to time series with observation errors: Ecology, v. 75, p. 1254–1264.
Caswell, H., 1997, Matrix methods for population analysis, in Tuljapurkar, S., and Caswell, H., eds., Structured-population models in marine, terrestrial, and freshwater systems: New York, Chapman & Hall, p. 19–58.
Caswell, H., Brault, S., Read, A.J., and Smith, T.D., 1998, Harbor porpoise and fisheries: an uncertainty analysis of incidental mortality: Ecological Applications, v. 8, p. 1226–1238.
Chiba, H. , Kawakami, K. , Suzuki, H. , and Horikoshi, K ., 2007, The distribution of seabirds in the Bonin Islands, southern Japan: Journal Yamashina Institute for Ornithology, v. 39, p. 1–17.
Clapp, R.B., and Kridler, E., 1977, The natural history of Necker Island, Northwestern Hawaiian Islands: Atoll Research Bulletin 206.
Clapp, R.B., Kridler, E., and Fleet, R.R., 1977, The natural history of Nihoa Island, Northwestern Hawaiian Islands: Atoll Research Bulletin 207.
Clapp, R.B., and Wirtz, W.O., 1975, The natural history of Lisianski Island, Northwestern Hawaiian Islands: Atoll Research Bulletin 186.
Committee on the Status of Endangered Wildlife in Canada, 2007, COSEWIC assessment and status report on the black-footed albatross Phoebastria nigripes in Canada: Ottawa, Canada, Committee on the Status of Endangered Wildlife in Canada, 59 p.
Cousins, K.L., 2001, The black-footed albatross population biology workshop: a step to understanding the impacts of longline fishing on seabird populations, in Melvin, E.F., and Parrish, J., eds., Proceedings – Seabird bycatch: trends, roadblocks, and solutions: University of Alaska Sea Grant, AK-SG-01-01, p. 95–114.
Cousins, K.L., and Cooper, J., eds., 2000, The population biology of the black-footed albatross in relation to mortality caused by longline fishing: Honolulu, Hawaii, Western Pacific Regional Fishery Management Council.
Croxall J.P., and Gales, R., 1998, An assessment of the conservation status of albatrosses, in Robertson, G., and Gales, R., eds., Albatross biology and conservation: Chipping Norton,Surrey Beatty & Sons, Australia, p. 46–65.
Croxall, J.P., Prince, P.A., Rothery, P., and Wood, A.G., 1998, Population changes in albatrosses at South Georgia, in Robertson, G., and Gales, R., eds., Albatross biology and conservation: Chipping Norton, Australia, Surrey Beatty & Sons, p. 69–83.
DeGange, A.R., and Day, R.H., 1991, Mortality of seabirds in the Japanese land-based gillnet fishery for salmon: Condor, v. 93, p. 251–258.
DeGange, A.R., Day, R.H., Takekawa, J.E., and Mendenhall, V.M., 1993, Losses of seabirds in gill nets in the North Pacific, in Vermeer, K., Briggs, K.T., Morgan, K.H., and Siegel-Causey, D., eds., The status, ecology, and conservation of marine birds of the North Pacific: Ottawa, Canada, Canadian Wildlife Service Special Publication, p. 204–211.
Dennis, B., Munholland, P.L., and Scott, J.M., 1991, Estimation of growth and extinction parameters for endangered species: Ecological Monographs, v. 61, p. 115–143.
Dennis, B., and Otten, M.R.M., 2000, Joint effect of density dependence and rainfall on abundance of San Joaquin kit fox: Journal of Wildlife Management, v. 64, p. 388–400.
Dennis, B., and Taper, M.L., 1994, Density dependence in time series observations of natural populations: estimation and testing: Ecological Monographs, v. 64, p. 205–224.
Dill, H.R., 1916, The albatross of Laysan: Wilson Bulletin, v. 28, p. 172–175.
Dill, H.R., and Bryan, W.A., 1912, Report of an expedition to Laysan Island in 1911: U.S. Department of Agriculture, Biological Survey Bulletin 42, p. 1–30.

54 Status Assessment of Laysan and Black-Footed Albatrosses, North Pacific Ocean, 1923–2005
Doherty, P.F., Jr., Kendall, W.L., Sillett, T.S., Gustafson, M., Flint, E., Naughton, M.B., Robbins, C.S., and Pyle, P., 2006, Development of a banding database for North Pacific albatross: implications for future data collection: Atoll Research Bulletin 543, p. 173–179.
Dunlop, E., 1988, Laysan albatross nesting on Guadalupe Island, Mexico: American Birds, v. 42, p. 180–181.
Ely, C.A., and Clapp, R.B., 1973, The natural history of Laysan Island, Northwestern Hawaiian Islands: Atoll Research Bulletin 171, p. 1–361.
Eschmeyer, W.N., Herald, E.S., and Hammann, H., 1983, A field guide to Pacific coast fishes of North America: Boston, Massachusetts, Houghton Mifflin Company.
Fernández, P., Anderson, D.J., Sievert, P.R., and Huyvaert, K.P., 2001, Foraging destinations of three low-latitude albatross (Phoebastria) species: Journal of Zoology, v. 254, p. 391–404.
Finkelstein, M., Gwiazda, R., and Smith, D.R., 2003, Lead poisoning of seabirds: environmental risks from leaded paint at a decommissioned military base: Environmental Science and Technology, v. 37, p. 3256–3260.
Finkelstein, M., Keitt, B.S., Croll, D.A., Tershy, B., Jarman, W.M., Rodriguez-Pastor, S., Anderson, D.J., Sievert, P.R., and Smith, D.R., 2006, Albatross species demonstrate regional differences in North Pacific marine contamination: Ecological Applications, v. 16, p. 678–686.
Fisher, H.I., 1945, Black-footed albatrosses eating flying fish: Condor, v. 47, p. 128–129.
Fisher, H.I., 1949, Populations of birds on Midway and the man-made factors affecting them: Pacific Science, v. 3, p. 103–110.
Fisher, H.I., 1966a, Aerial census of Laysan Albatrosses breeding on Midway Atoll in December, 1962: Auk, v. 83, p. 670–673.
Fisher, H.I., 1966b, Airplane-albatross collisions on Midway Atoll: Condor, v. 68, p. 229–242.
Fisher, H.I., 1966c, Midway’s deadly antennas: Audubon (July-August), p. 220–223.
Fisher, H.I., 1967, Body weights in Laysan albatrosses, Diomedea immutabilis: Ibis, v. 109, p. 373–382.
Fisher, H.I., 1968, The “two-egg” clutch in the Laysan albatross: Auk, v. 85, p. 134–136.
Fisher, H.I., 1969, Eggs and egg-laying in the Laysan albatross, Diomedea immutabilis: Condor, v. 71, p. 102–112.
Fisher, H.I., 1971a, Experiments on homing in Laysan albatrosses, Diomedea immutabilis: Condor, v. 73, p. 389–400.
Fisher, H.I., 1971b, The Laysan albatross: its incubation, hatching, and associated behaviors: Living Bird, v. 10, p. 19–78.
Fisher, H.I., 1972, Sympatry of Laysan and black-footed albatrosses, Auk, v. 89, p. 381–402.
Fisher, H.I., 1973, Pollutants in North Pacific albatrosses: Pacific Science, v. 27, p. 220–225.
Fisher, H.I., 1975a, Mortality and survival in the Laysan albatross, Diomedea immutabilis: Pacific Science, v. 29, p. 279–300.
Fisher, H.I., 1975b, The relationship between deferred breeding and mortality in the Laysan albatross: Auk, v. 92, p. 433–441.
Fisher, H.I., 1976, Some dynamics of a breeding colony of Laysan albatrosses: Wilson Bulletin, v. 88, p. 121–142.
Fisher, H.I., and Baldwin, P.H., 1946, War and the birds of Midway Atoll: Condor, v. 48, p. 3–15.
Fisher, H.I., and Fisher, M.L., 1969, The visits of Laysan albatrosses to the breeding colony: Micronesia, v. 5, p. 173–221.
Fisher, H.I., and Fisher, J.R., 1972, The oceanic distribution of the Laysan albatross, Diomedea immutabilis: Wilson Bulletin, v. 84, p. 7–27.
Fitzgerald, S.M., McElderry, H., Hatanaka, H., Watanabe, Y., Park, J.S., Gong, Y., and Yeh, S.Y., 1993, 1990–1991 North Pacific high seas driftnet scientific observer programs: International North Pacific Fisheries Commission Bulletin 53, p. 77–90.
Flint, E., 2005, Hawaiian Islands National Wildlife Refuge and Midway Atoll National Wildlife Refuge – annual nest counts through hatch year 2005: Honolulu, Hawaii, U.S. Fish and Wildlife Service, p. 20.
Frings, H., and Frings, M., 1961, Some biometric studies on the albatrosses of Midway Atoll: Condor, v. 63, p. 304–312.
Froese, R., and Pauly, D., eds., 2005, FishBase: accessed October 26, 2005, at http://www.fishbase.org/
Fry, D.M., Fefer, S.I., and Sileo, L., 1987, Ingestion of plastic debris by Laysan albatrosses and Wedge-tailed Shearwaters in the Hawaiian Islands: Marine Pollution Bulletin 18, p. 339–343.

References Cited 55
Gales, R., 1998, Albatross populations: status and threats, in Robertson, G., and Gales, R., eds., Albatross biology and conservation: Chipping Norton, Surrey Beatty & Sons, Australia, p. 20–45.
Gallo-Reynoso, J.P., and Figueroa-Carranza, A.L., 1996, The breeding colony of Laysan albatrosses on Isla de Guadalupe, Mexico: Western Birds, v. 27, p. 70–76.
Geernaert, T.O., Gilroy, H.L., Kaimmer, S.M., Williams, G.H., and Trumble, R.J., 2001, A feasibility study that investigates options for monitoring bycatch of the short-tailed albatross in the Pacific halibut fishery off Alaska: Seattle, Washington, International Pacific Halibut Commission Science Report, Contract Number 40HANF000046.
Gilbertson, M., Kubiak, T., Ludwig, J.P., and Fox, G., 1991, Great Lakes embryo mortality, edema, and deformities syndrome (GLEMEDS) in colonial fish-eating birds: similarity to chick-edema disease: Journal of Toxicology and Environmental Health, v. 33, p. 455–520.
Gilman, E., Brothers, N., and Kobayashi, D., 2005, Principles and approaches to abate seabird by-catch in longline fisheries: Fish and Fisheries, v. 6, p. 35–49.
Gong, Y., Kim, Y.S, and Hwang, S.J., 1993, Outline of the Korean squid gillnet fishery in the North Pacific: International North Pacific Fisheries Commission Bulletin 53, p. 45–69.
Gould, P.J., and Hobbs, R., 1993, Population dynamics of the Laysan and other albatrosses in the North Pacific: International North Pacific Fisheries Commission Bulletin 53, p. 485–497.
Gould, P.J., Ostrom, P., and Walker, W., 1997, Trophic relationships of albatrosses associated with squid and large-mesh drift-net fisheries on the North Pacific Ocean: Canadian Journal of Zoology, v. 75, p. 549–562.
Gould, P.J., Ostrom, P., Walker, W., and Pilichowski, K., 1998, Laysan and black-footed albatrosses: trophic relationships and driftnet fisheries associations of non-breeding birds, in Robertson, G., and Gales, R., eds., Albatross biology and conservation: Chipping Norton, Australia, Surrey Beatty & Sons, p. 199-207.
Guruge, K.S., Watanabe, M., Tanaka, H., and Tanabe, S., 2001a, Accumulation status of persistent organochlorines in albatrosses from the North Pacific and the Southern Ocean: Environmental Pollution, v. 114, p. 389–398.
Guruge, K.S., Tanaka, H., and Tanabe, S., 2001b, Concentration and toxic potential of polychlorinated biphenyl congeners in migratory oceanic birds from the North Pacific and the Southern Ocean: Marine Environmental Research, v. 52, p. 271–288.
Harrison, C.S., 1990, Seabirds of Hawaii: natural history and conservation: New York, Cornell University Press.
Harrison, C.S., Fen-Qi, H., Choe, K.S., and Shibaev, Y.V., 1992, The laws and treaties of North Pacific Rim nations that protect seabirds on land and at sea: Colonial Waterbirds, v. 15, p. 264–277.
Harrison, C.S., Hida, T.S., and Seki, M.P., 1983, Hawaiian seabird feeding ecology: Wildlife Monograph 85.
Harrison, P., 1985, Seabirds: an identification guide, Revised edition: London, England, Christopher Helm Ltd.
Hasegawa, H., 1984, Status and conservation of seabirds in Japan, with special attention to the short-tailed albatross Diomedea albatrus at Torishima, in Croxall, J.P., Evans, P.G., and Schreiber, R.W., eds., Status and conservation of the world’s seabirds: Cambridge, England, International Council for Bird Preservation (ICBP), Technical Publication No. 2, p. 487–500.
Hilborn, R., and Mangel, M., 1997, The ecological detective: confronting models with data: New Jersey, Princeton University Press.
Honda, K., Marcovecchio, J.E., Kan, S., Tatsukawa, R., and Ogi, H., 1990, Metal concentration in pelagic seabirds from the North Pacific Ocean: Archives of Environmental Contamination and Toxicology, v. 19, p. 704–711.
Howell, T.R., and Bartholomew, G.A., 1961, Temperature regulation in Laysan and black-footed albatrosses: Condor, v. 63, p. 185–197.
Howell, S.N., and Webb, S., 1989, Additional notes from Isla Clarion, Mexico: Condor, v. 91, p. 1007–1008.
Howell, S.N., and Webb, S., 1992, The seabirds of Las Islas Revillagigedos: Wilson Bulletin, v. 102, p. 140–146.
Hyrenbach, K.D., 2001, Albatross response to survey vessels: implications for studies of the distribution, abundance, and prey consumption of seabird populations: Marine Ecology Progress Series, v. 212, p. 283–295.
Hyrenbach, K.D., 2002, Plumage-based ageing criteria for the black-footed albatross Phoebastria nigripes: Marine Ornithology, v. 30, p. 85–93.
Hyrenbach, K.D., and Dotson, R.C., 2003, Assessing the susceptibility of female black-browed albatross (Phoebastria nigripes) to longline fisheries during their post-breeding dispersal: an integrated approach: Biological Conservation, v. 112, p. 391–404.
56 Status Assessment of Laysan and Black-Footed Albatrosses, North Pacific Ocean, 1923–2005
Hyrenbach, K.D., Fernández, P., and Anderson, D.J., 2002, Oceanographic habitats of two sympatric North Pacific albatrosses during the breeding season: Marine Ecology Progress Series 233, p. 283–301.
Hyrenbach, K.D., Hester, M., Keiper C., Nevins, H., Baduini, C., and Adams, J., 2005, Post-breeding movements of black-footed Albatross 2004 and 2005. Unpublished report, National Fish and Wildlife Foundation, accessed November 22, 2005, at http://www.oikonos.org/projects/albatross.htm
Hyrenbach, K.D., Keiper, C., Allen, S.G., Ainley, D.G., and Anderson, D.J., 2006, Use of marine sanctuaries by far-ranging predators: commuting flights to the California Current System by breeding Hawaiian albatrosses: Fisheries Oceanography, v. 15, p. 95–103.
International Union for the Conservation of Nature and Natural Resources (IUCN), 2004, Red List of Threatened Species, accessed February 10, 2005, at http://www.redlist.org
Island Conservation and Ecology Group, 2001, Annual Report: Island Conservation, University of California at Santa Cruz, California.
Ito, J., Shaw, W., and Burgner, R.L., eds., 1993, Driftnet fisheries of the North Pacific Ocean, Volume I: International North Pacific Fisheries Commission Bulletin 53(I).
Jouanin, C., 1959, Une colonie meconnue d’Albatros a pieds noirs, Diomedea nigripes, dans les iles Mariannes: Bulletin Muséum National d’Histoire Naturelle de Paris, v. 31, p. 477–480.
Johnson, D.H., Shaffer, T.L., and Gould, P.J., 1993, Incidental catch of marine birds in the North Pacific high seas driftnet fisheries in 1990: International North Pacific Fisheries Commission Bulletin, v. 53, p. 473–483.
Jones, P.D., Hannah, D.J., Buckland, S.J., Day, P.J., Leathem, S.V., Porter, L.J., Auman, H.J., Sanderson, J.T., Summer, C., Ludwig, J.P., Colborn, T.L., and Giesy, J.P., 1996, Persistent synthetic chlorinated hydrocarborns in albatross tissue samples from Midway Atoll: Environmental Toxicology and Chemistry, v. 15, p. 1793–1800.
Julian, F., and Beeson, M., 1998, Estimates of marine mammal, turtle, and seabird mortality for two California gillnet fisheries: 1990–1995: Fisheries Bulletin, v. 96, p. 271–284.
Keitt, B.S., Henry, R.W., Aquirre, A., Garcia, C., Mendoza, L.L., Hermosillo, M.A., Tershy, B., and Croll, D., 2006, Impacts of introduced cats (Felis catus) on the Guadalupe Island ecosystem, in del Prado, K.S., and Peters, E., eds., Isla Guadalupe Restauración y Conservación. Instituto Nacional de Ecología, Mexico, p. 219–229.
Kenyon, K.W., Rice, D.W., Robbins, C.S., and Aldrich, J.W., 1958, Birds and aircraft on Midway Islands, November 1956–June 1957 investigations: Special Scientific Report – Wildlife No. 38.
Kenyon, K.W., and Kridler, E., 1969, Laysan albatrosses swallow indigestible matter: Auk, v. 86, p. 339–343.
Kepler, C.B, 1967, Polynesian rat predation on nesting Laysan albatrosses and other Pacific seabirds: Auk, v. 84, p. 426–430.
Kim, E.Y., Goto, R., Tanabe, S., Tanaka, H., and Tatsukawa, R., 1998, Distribution of 14 elements in tissues and organs of oceanic seabirds: Archives of Environmental Contamination and Toxicology, v. 35, p. 638–645.
Kinan, I., 2003a, Annual report on seabird interactions and mitigation efforts in the Hawaii-based longline fishery for calendar years 2000 and 2001: National Marine Fisheries Service Technical Report.
Kinan, I., 2003b, Annual report on seabird interactions and mitigation efforts in the Hawaii-based longline fishery for calendar year 2002: National Marine Fisheries Service Technical Report AR-PIR-03-03.
Kinan, I., 2004, Annual report on seabird interactions and mitigation efforts in the Hawaii-based longline fishery for calendar year 2003: National Marine Fisheries Service Technical Report AR-PIR-09-04.
Kurata, Y., 1978, Breeding record of the Laysan albatross Diomedea immutabilis on the Ogasawara Islands (a preliminary report): Miscellaneous Reports of the Yamashina Institute for Ornithology, v. 10, p. 185-189.
Langston, N.E., and Rohwer, S., 1995, Unusual patterns of incomplete primary molt in Laysan and black-footed albatrosses: Condor, v. 97, p. 1–19.
Lewison, R.L., and Crowder, L.B., 2003, Estimating fishery bycatch and effects on a vulnerable seabird population: Ecological Applications, v. 13, p. 743–753.
Ludwig, J.P., Summer, C.L., Auman, H.J., Gauger, V., Bromley, D., Giesy, J.P., Rolland, R., and Colborn, T., 1998, The roles of organochlorine contaminants and fisheries bycatch in recent population changes of black-footed and Laysan albatrosses in the North Pacific Ocean, in Robertson, G., and Gales, R., eds., Albatross biology and conservation: Chipping Norton, Australia, Surrey Beatty & Sons, p. 225–238.

References Cited 57
McDermond, D.K., and Morgan, K.H., 1993, Status and conservation of North Pacific albatrosses, in Vermeer, K., Briggs, K.T., Morgan, K.H., and Siegel-Causey, D., eds., The status, ecology, and conservation of marine birds of the North Pacific: Ottawa, Canada, Canadian Wildlife Service Special Publication, p. 70–81.
Melvin, E.F., Dietrich, K., Van Wormer, K., and Geernaert, T., 2004, The distribution of seabirds on Alaskan longline fishing grounds: 2002 data report: Seattle, Washington, Washington Sea Grant Program, WSG-TA 04-02:1–20.
Miller, L., 1936, Some maritime birds observed off San Diego, California: Condor, v. 38, p. 9–16.
Miller, L., 1940, Observations on the black-footed albatross: Condor, v. 42, p. 229–238.
Mitchell, C., Ogura, C., Meadows, D.W., Kane, A., Strommer, L., Fretz, S., Leonard, D., and McClung, A., 2005, Hawaii’s Comprehensive Wildlife Conservation Strategy: Honolulu, Hawai`i, Hawai`i Department of Land and Natural Resources, p. 734.
Morris, W.F., and Doak, D.F., 2002, Quantitative conservation biology, theory and practice of population viability analysis: Sunderland, Massachusetts, Sinauer Associates Inc., p. 480.
Munro, G.C., 1945, The small birds of Midway: Elepaio, v. 6, p. 13–14.
Nagao, K., Ota, S., and Hirono, J., 1993, Regulation of the Japanese high seas driftnet fisheries: International North Pacific Fisheries Commission Bulletin, v. 53, p. 39–44.
Nakano, H., Okada, K., Watanabe, Y., and Uosaki, K., 1993, Outline of the large-mesh driftnet fishery of Japan: International North Pacific Fisheries Commission Bulletin, v. 53, p. 25–37.
National Marine Fisheries Service, 2005, Final environmental impact statement: seabird interaction avoidance methods and pelagic squid fishery management (April 2005): National Marine Fisheries Service, Pacific Islands Regional Office, Honolulu, Hawaii.
National Marine Fisheries Service, 2006, Summary of seabird bycatch in Alaskan groundfish fisheries, 1993 through 2004. Updated April 13, 2006, accessed June 23, 2009, at http://www.afsc.noaa.gov/refm/reem/doc/Seabird%20bycatch%20tables%201993-2004_13April2006.pdf
Niel, C., and Lebreton, J.D., 2005, Using demographic invariants to detect overharvested bird populations from incomplete data: Conservation Biology, v. 19, p. 826–835.
Nunn, G.B., Cooper, J., Jouventin, P., Robertson, C.J.R., and Robertson, G.G., 1996, Evolutionary relationships among extant albatrosses (Procellariiformes: Diomedeidae) established from complete cytochrome-b gene sequences: Auk, v. 113, p. 784–801.
Nutting, C.C., 1904, The bird rookeries on the island of Laysan: Popular Science Monthly, v. 63, p. 321–332.
Ogi, H., Yatsu, A., Hatanaka, H., and Nitta, A., 1993, The mortality of seabirds by driftnet fisheries in the North Pacific: International North Pacific Fisheries Commission Bulletin, v. 53, p. 499–518.
Olson, S.L., 1996, History and ornithological journals of the Tanager expedition of 1923 to the Northwestern Hawaiian Islands, Johnston and Wake Islands: Atoll Research Bulletin No. 433.
Pettit, T.N., Grant, G.S., and Whittow, G.C., 1981, Ingestion of plastics by Laysan albatross: Auk, v. 98, p. 839–841.
Pitman, R.L., 1985, The marine birds of Alijos Rocks, Mexico: Western Birds, v. 16, p. 81–92.
Pitman, R.L., and Ballance, L.T., 2002, The changing status of marine birds breeding at San Benedicto Island, Mexico: Wilson Bulletin, v. 114, p. 11–19.
Pitman, R.L., Walker, W.A., Everett, W.T., and Gallo-Reynoso, J.P., 2004, Population status, foods and foraging of Laysan albatrosses Phoebastria immutabilis nesting on Guadalupe Island, Mexico: Marine Ornithology, v. 32, p. 159–165.
Polovina, J.J., Howell, E., Kobayashi, D.R., and Seki, M.P., 2001, The transitional zone chlorophyll front, a dynamic global feature defining migration and forage habitat for marine resources: Progress in Oceanography, v. 49, p. 469–483.
Rauzon, M.J., Boyle, D.P., Everett, W.T., and Gilardi, J., 2008, The status of birds of Wake Atoll: Atoll Research Bulletin 561, p. 1–41.
Reichel, J.D., 1991, Status and conservation of seabirds in the Mariana Islands in Croxall, J.P., ed., Seabird status and conservation: a supplement: Cambridge, England, ICBP Technical Publication No.11, p. 249–262.
Reichenbach, L., 1852, Avium Systema Naturale: Leipzig, Germany.
Rice, D.W., 1959, Birds and aircraft on Midway Islands: 1957–58 investigations: Special Scientific Report – Wildlife No. 44.
Rice, D.W., and Kenyon, K.W., 1962a, Breeding distribution, history, and populations of North Pacific albatrosses: Auk, v. 79, p. 365–386.

58 Status Assessment of Laysan and Black-Footed Albatrosses, North Pacific Ocean, 1923–2005
Rice, D.W., and Kenyon, K.W., 1962b, Breeding cycles and behavior of Laysan and black-footed albatrosses: Auk, v. 79, p. 517–567.
Rice, D.W., and Kenyon, K.W., 1963, Correspondence: Auk, v. 80, p. 110.
Robbins, C.S., 1966, Birds and aircraft on Midway Islands: 1959–63 investigations: Special Scientific Report – Wildlife No. 85.
Robbins, C.S., and Rice, D.W., 1974, Recoveries of banded Laysan albatrosses (Diomedea immutabilis) and black-footed albatrosses (D. nigripes) in King, W.B., ed., Pelagic studies of seabirds in the Central and Eastern Pacific Ocean: Washington D.C., Smithsonian Institution, p. 232–277.
Robertson, C.J.R., and Nunn, G.B., 1998, Towards a new taxonomy for albatrosses in Robertson, G., and Gales, R., eds., Albatross biology and conservation: Chipping Norton, Australia, Surrey Beatty & Sons, p. 13–19.
Royama, T., 1992, Analytical population dynamics: London, England, Chapman & Hall., p. 371.
Ryan, P.G., Connell, A.D., and Gardner, B.D., 1988, Plastic ingestion and PCBs in seabirds: is there a relationship?: Marine Pollution Bulletin, v. 19, p. 174–176.
Saito, H., and Yokawa, K., 2000, Brief review of the Japanese swordfish catch in the Pacific Ocean from 1971 to 1998: Working Paper 13, Secretariat of the Pacific Community, Standing Committee on Tuna and Billfish.
Seki, M.P., Polovina, J.J., Kobayashi, D.R., Bidigare, R.R., and Mitchum, G.T., 2002, An oceanographic characterization of swordfish (Xiphias gladius) longline fishing grounds in the springtime subtropical North Pacific: Fisheries Oceanography, v. 11, p. 251–266.
Sievert, P.R., and Sileo, L., 1993, The effects of ingested plastic on growth and survival of albatross chicks in Vermeer, K., Briggs, K.T., Morgan, K.H., and Siegal-Causey, D., eds., The status, ecology, and conservation of marine birds of the North Pacific: Ottawa, Canada, Canadian Wildlife Service Special Publication, p. 212–217.
Sileo, L., and Fefer, S.I., 1987, Paint chip poisoning of Laysan albatross at Midway Atoll: Journal of Wildlife Diseases, v. 23, p. 432–437.
Sileo, L., Sievert, P.R., and Samuel, M.D., 1990a, Causes of mortality of albatross chicks at Midway Atoll: Journal of Wildlife Diseases, v. 26, p. 329–338.
Sileo, L., Sievert, P.R., Samuel, M.D., and Fefer, S.I., 1990b, Prevalence and characteristics of plastic ingested by Hawaiian seabirds in Shomura, R.S., and Godfrey, M.L., eds., Proceedings of the Second International Conference on Marine Debris, April 2–7, 1989, Honolulu, Hawaii, NOAA-TM-NMFS-SWFSC-154, p. 665–681.
Smith, J.L., and Morgan, K.H., 2005, An assessment of seabird bycatch in longline and net fisheries in British Columbia: Technical Report Series No. 401: Canadian Wildlife Service, Pacific and Yukon Region, British Columbia, Canada.
Smith, J.L., Wiese, F., Morgan, K.H., and Milko, B., 2005, Black-footed albatross bycatch: quantifying mortality in Canada, and the population level effects: Poster presentation, 32nd Annual Meeting of the Pacific Seabird Group, January. 19-23, 2005, Portland, Oregon.
Spennemann, D.H.R., 1998, Excessive exploitation of Central Pacific seabird populations at the turn of the 20th Century: Marine Ornithology, v. 26, p. 49–57.
Staples, D.F., Taper, M.L., and Dennis, B., 2004, Estimating population trend and process variation for PVA in the presence of sampling error: Ecology, v. 85, p. 923-929.
Thompson, D.Q., 1951, Notes on distribution of North Pacific albatrosses: Auk, v. 68, p. 227–235.
Tickell, W.L.N., 2000, Albatrosses: New Haven, Connecticut, Yale University Press.
U.S. Fish and Wildlife Service, 2002, Birds of conservation concern 2002: Arlington, Virginia, Division of Migratory Bird Management.
U.S. Fish and Wildlife Service, 2004a, Biological opinion on the effect of U.S. West Coast Fisheries on Highly Migratory Species: Portland, Oregon, U.S. Fish and Wildlife Service Document AFWO 1-14-2003-F-l479.1.
U.S. Fish and Wildlife Service, 2004b, Biological opinion on the effects of the reopened shallow-set sector of the Hawaii-based longline fishery on the Short-tailed Albatross (Phoebastria albatrus): Formal Consultation Log Number 1-2-1999-F-02.2.
U.S. Fish and Wildlife Service, 2005, Seabird Conservation Plan, Pacific Region: Portland, Oregon, U.S. Fish and Wildlife Service, Migratory Birds and Habitat Programs, Pacific Region.
VanderWerf, E.A., Wood, K.R., Swenson, C., LeGrande, M., Eijzenga, H., and Walker, R.L., 2007, Avifauna of Lehua Islet, Hawaii: conservation value and management needs: Pacific Science, v. 61, p. 39–52.

References Cited 59
Van Ryzin, M.T., and Fisher, H.I., 1976, The age of Laysan albatrosses, Diomedea immutabilis, at first breeding: Condor, v. 78, p. 1–9.
Viggiano, A., 2001, Investigating demographic and life history characteristics of the black-footed albatross: M.Sc. Seattle, Washington, University of Washington.
Wade, P.R., 1998, Calculating limits to the human-caused mortality of cetaceans and pinnipeds: Marine Mammal Science, v. 14, p. 1–37.
Wahl, T.R., and Heinemann, D., 1979, Seabirds and fishing vessels: co-occurrence and attraction: Condor, v. 81, p. 390–396.
Wahl, T.R., Ainley, D.G., Banadict, A.H., and DeGange, A.R., 1989, Associations between seabirds and water-masses in the northern Pacific Ocean in summer: Marine Biology, v. 103, p. 1–11.
Walsh, H.E., and Edwards, S.V., 2005, Conservation genetics and Pacific fisheries bycatch: mitochondrial differentiation and population assignment in black-footed albatrosses (Phoebastria nigripes): Conservation Genetics, v. 6, p. 289–295.
Wanless, R.M., Angel A., Cuthbert R.J., Hilton, G.M., and Ryan, P.G., 2007, Can predation by invasive mice drive seabird extinctions?: Biology Letters, v. 3, p. 241–244.
Warner, R.E., 1968, The role of introduced diseases in the extinction of the endemic Hawaiian avifauna: Condor, no. 70, p. 101–120.
Weimerskirch, H., Brothers, N., and Jouventin, P., 1997a, Population dynamics of Wandering Albatross Diomedea exulans and Amsterdam Albatross D. amsterdamensis in the Indian Ocean and their relationships with long-line fisheries: conservation implications: Biological Conservation, no. 79, p. 257–270.
Whittow, G.C., 1984, Physiological ecology of incubation in tropical seabirds: Avian Biology, v. 8, p. 47–72.
Whittow, G.C., 1993a, Laysan albatross (Diomedea immutabilis) in Poole, A., and Gill, F., eds., The birds of North America, No. 66: Philadelphia, Pennsylvania, Academy of Natural Sciences, and Washington, D.C., American Ornithologists’ Union.
Whittow, G.C., 1993b. Black-footed albatross (Diomedea nigripes) in Poole, A., and Gill, F., eds., The birds of North America, No. 65: Philadelphia, Pennsylvania, Academy of Natural Sciences, and Washington, D.C., American Ornithologists’ Union.
Woodward, P.W., 1972, The natural history of Kure Atoll, Northwestern Hawaiian Islands: Atoll Research Bulletin 164, p. 1–318.
Work, T.M., Smith, M.R., and Duncan, R., 1998, Necrotizing enteritis as a cause of mortality in Laysan Albatross, Diomedea immutabilis, chicks on Midway Atoll, Hawaii: Avian Diseases, v. 42, p. 1–5.
Yatsu, A., Hiramatsu, K., and Hayase, S., 1993, Outline of the Japanese squid driftnet fishery with notes on the by-catch: International North Pacific Fisheries Commission Bulletin 53, p. 5–24.
Yeh, S-Y., and Tung, I-H., 1993, Review of Taiwanese pelagic squid fisheries in the North Pacific: International North Pacific Fisheries Commission Bulletin 53, p. 71–76.
Yocom, C., 1947, Notes on behavior and abundance of the black-footed albatrosses in the Pacific waters off the continental North American shores: Auk, v. 64, p. 507–523.
Young, L.C. and VanderWerf, E.A., 2008, Prevalence of avian pox virus and effect on the fledging success of Laysan Albatross: Journal of Field Ornithology, v.79, p. 93–98.
Young, L.C., VanderWerf, E.A., Smith, D.G., Polhemus, J., Swenson, N., Swenson, C., Liesemeyer, R.R., Gagne, B.H., and Conant, S., in press, Demography and natural history of Laysan albatross on O`ahu, Hawaii: The Wilson Bulletin, v. 121.

60 Status Assessment of Laysan and Black-Footed Albatrosses, North Pacific Ocean, 1923–2005
This page left intentionally blank

Appendix A 61
Appendix A: Bycatch Estimation
Driftnet FisheriesThree types of large-scale pelagic driftnet fisheries
operated in the North Pacific: salmon driftnet fishery by Japan; squid driftnet fishery by Japan, Republic of Korea and Taiwan; and large-mesh driftnet fishery by Japan and Taiwan (Ogi and others, 1993). United Nations General Assembly Resolution 46-215 (adopted December 1991), called for a global moratorium on all large-scale pelagic driftnet fishing by December 31, 1992.
No albatrosses are known to have been captured in the mothership salmon fishery (DeGange and others, 1993; Ogi and others, 1993). For the land-based salmon fishery, there are two estimates of albatross bycatch, both indicating that only Laysan albatrosses were caught (table A1). The highest bycatch estimates for the Japanese land-based salmon fishery before 1977 were between 1,750–2,360 Laysan albatross per year (fig. A1). Fishing effort declined after 1977 and stopped in 1991 (fig. A2).
Fishing effort for the land-based salmon fishery was obtained from DeGange and Day (1991; fig. A2). Fishing effort was standardized into kilometers of net deployed (km-net) using the linear relation: km of net = 12,762 + 14.053•Vessel-days (DeGange and Day, 1991). The last 4 years of the fishery’s operation (1988–91) were extrapolated under the assumption of a linear reduction in fishing effort from 1,156,224 tans (1 tan = 30–50 linear m of net) in 1987 to 536,674 tans in 1990, which is equivalent to 34,686–57,811 km of net in 1987 to 16,100–26,833 km of net in 1990 (DeGange and Day, 1991; Ogi and others, 1993). The overall fishing effort is presented in figure A2.
Albatross bycatch rate estimates for the Japanese large-mesh fishery are available only for 1990 (table A2). Likewise, fishing effort is only available for 1990 (Johnson and others, 1993). Fishing effort for other years was estimated using an equivalence for 1990 (Number of Tans: Tunas caught) and the historical catch of tunas (albacore, skipjack, and other tunas) presented by Nakano and others (1993). Albatross bycatch by this fishery increased in 1981 as fishing effort increased (fig. A2). The estimated number of birds killed annually ranged from 1,300 to 2,500 for Laysan and 490–940 for black-footed albatrosses from 1981 to 1990 (fig. A1).
tac_08_9354_0255_Albatrosses_FigA1
10,000
15,000
0
5,000
20,000
25,000
30,000
NUM
BER
OF B
IRDS
CAU
GHT
0
1,000
2,000
3,000
4,000
5,000
6,000
7,000
1970 1973 1976 1979 1982 1985 1988 1991 1994
Laysan albatross
Black-footed albatross
TWDFKOSQ
TotalJPSQ
JPLSJPLM
TWDFKOSQ
TotalJPSQ
JPLSJPLM
Figure A1. Albatross bycatch estimates (± 1 SD) for the high-seas North Pacific driftnet fisheries: Japanese squid fishery (JPSQ), Japanese large-mesh fishery (JPLM), Japanese land-based salmon fishery (JPLS), Japanese mothership salmon fishery (JPMS), Korean squid fishery (KOSQ), and Taiwanese squid and tuna fishery (TWDF). See text for details.
Year sampledLaysan albatross (birds/km of net)
Source
1977–87 Min = 0.00546Max = 0.0071SD = 0.0058
DeGange and Day (1991)1
1990 0.0121 Ogi and others (1993)
Overall mean Mean = 0.0082 SD = 0.0068
1Estimated using Laysan albatross fraction (0.6 percent) of the total bycatch.
Table A1. Laysan albatross bycatch rate estimates for the Japanese land-based salmon fishery.
[km, kilometer; Min, minimum; Max, maximum; SD, standard deviation]

62 Status Assessment of Laysan and Black-Footed Albatrosses, North Pacific Ocean, 1923–2005
Albatross bycatch rate estimates for the Taiwanese driftnet fishery (includes both large-mesh gear for tuna and squid gear) for 1990 are presented in table A3. Estimates of total fishing effort (Number of Vessel-days) per year were based on the number of active vessels using the following equation: No. Vessel-days = 3,375.8•e0.0089•(no. vessels) (r2 = 0.784; data from Yeh and Tung, 1993). Fishing effort of the Taiwanese fleet increased rapidly from 1980 to 1989, and decreased prior to the 1991 UN ban (fig. A2). Accordingly, the number of Laysan and black-footed albatrosses killed per year increased from 452 and 94 in 1980, respectively, to a maximum of 2,119 Laysan and 438 black-footed albatrosses in 1989 (fig. A1).
Bycatch estimates for the Japanese squid fleet are only available for 1990 (table A4). Total fishing effort from 1982 to 1990 is presented by Yatsu and others (1993). Fishing effort from 1978 to 1981 was estimated using data from 1982 to 1983 (Yatsu and others, 1993) and using the following relations between catch and effort: No. tans = 10,000,000 + 57.806•catch (tons). The Japanese fishing effort from 1978 to 1986 increased significantly from 516,652 km of net to 1,491,059 km of net (fig. A2). Accordingly, estimated bycatch of albatrosses peaked in 1986 with an estimated 13,840 Laysan and 3,108 black-footed albatrosses being killed (fig. A1).
Bycatch estimates for the Korean squid fleet are presented by Johnson and others (1993) and Ogi and others (1993) for 1990 only (table A5). Total fishing effort for 1983–90 is presented by Gong and others (1993). Fishing effort for 1981–82 was estimated using the following relations between catch and effort: No. tans = -1,000,000 + 229.12•catch (tons), r2 = 0.747 (data from Gong and others, 1993, 1983–85 only). The Korean fishing effort began in 1981 and quickly increased to a maximum of 1,239,016 km of net per year in 1989 (fig. A2). Albatross bycatch is assumed to correspond to this increase in effort, reaching an estimated maximum of 4,840–5,000 Laysan and 1,160–1,200 black-footed albatrosses killed per year from 1988 to 1992 (fig. A1).
Overall, these driftnet fisheries killed an estimated 219,228 ± 32,116 Laysan and 50,311 ± 6,772 black-footed albatrosses (mean ± 1 SD) from 1978 to 1992, when it was closed by the UN ban (fig. A1). A disproportionately high number of juvenile albatrosses, primarily less than 2 years old, were caught in the squid and large-mesh driftnet fisheries (table A6).
Figure A2. Fishing effort (km-net) for the main pelagic North Pacific driftnet fisheries that operated between 1970 and 1992: Japanese squid fishery (JPSQ), Japanese large-mesh fishery (JPLM), Korean squid fishery (KOSQ), Japanese land-based salmon fishery (JPLS), and Taiwanese driftnet fishery (TWDF).
Year sampled
Laysan albatross
(birds/km of net)
Black–footed albatross
(birds/km of net)Source
1990 0.0074–0.0185(0.0004–0.0009)
0.0029–0.0073(0.0002–0.0004)
Johnson and others (1993)
1990 0.0049–0.0122 0.0017–0.0042 Ogi and others (1993)
Overall mean
0.0061–0.0154(0.0003–0.0008)
0.0023–0.0057(0.0001–0.0003)
Table A2. Albatross bycatch rate estimates [mean (SD)] for the Japanese large-mesh driftnet fishery.
[birds/km of net: 1 tan = 20–50 meters horizontal net length (Fitzgerald and others, 1993). km, kilometer]
tac_08_9354_0255_Albatrosses_FigA2
0
400,000
800,000
1,200,000
1,600,000
1970 1973 1976 1979 1982 1985 1988 1991 1994
FISH
ING
EFF
ORT
, KM
-NET TWDF
KOSQ
JPSQ
JPLSJPLM

Appendix A 63
Year sampled
Laysan albatross
(birds/km of net)
Black–footed albatross
(birds/km of net)Source
1990 0.0030–0.0060(0.0006–0.0012)
0.0006–0.0012(0.0002–0.0004)
Johnson and others (1993)
1990 0.0020–0.0040 0.0004–0.0009 Ogi and others (1993)
Overall mean
0.0025–0.0050(0.0005–0.0010)
0.0005–0.0010(0.0002–0.0004)
Table A3. Albatross bycatch rate estimates [mean (SD)] for the Taiwanese driftnet fishery (large mesh and squid driftnet combined).
[(birds/km of net): assuming 1 vessel-day about 800–1,200 tans (Ogi and others, 1993), and 1 tan about 30–40 meters (Fitzgerald and others, 1993). km, kilometer]
Year sampled
Laysan albatross
(birds/km of net)
Black–footed albatross
(birds/km of net)Source
1990 0.0080–0.0138(0.0003–0.0006)
0.0018–0.0031(0.0001–0.0002)
Johnson and others (1993)
1990 0.0067–0.0116(0.0008–0.0014)
0.0015–0.0026(0.0002–0.0004)
Ogi and others (1993)
Overall mean
0.0073–0.0127(0.0009–0.0016)
0.0016–0.0028(0.0002–0.0004)
Table A4. Albatross bycatch rate estimates [mean (SD)] for the Japanese squid driftnet fishery.
[(birds/km of net): 1 tan = 30–52 meters horizontal net length (Fitzgerald and others, 1993). km, kilometer]
Year sampled
Laysan albatross
(birds/km of net)
Black-footed albatross
(birds/km of net)Source
1990 0.0039(0.0003)
0.0009(0.0001)
Johnson and others (1993)
1990 0.0042 0.0010 Ogi and others (1993)
Overall mean
0.0040(0.0003)
0.0010(0.0001)
Table A5. Albatross bycatch rate estimates [mean (SD)] for the Korean squid driftnet fishery.
[(birds/km of net): 1 tan = 50 meters horizontal net length (Fitzgerald and others, 1993). km, kilometer]
Table A6. Sex and age distribution of Laysan and black-footed albatross carcasses salvaged from driftnet fisheries.
[<, less than; ♀, female; ♂, male; >, greater than]
Age Broughton (1994) Langston and Rohwer (1995)1
Laysan albatross
<2 years n = 8 (6 ♀, 2 ♂) n = 103 (52 ♀, 51 ♂)
2–6 years n = 1 (1 ♂) n = 34 (18 ♀, 16 ♂)>6 years n = 1 (1 ♂) n = 54 (43 ♀, 11 ♂)
Black-footed albatross
<2 years n= 3 (1 ♀, 2 ♂) n = 65 (38 ♀, 27 ♂)2–6 years n= 2 (1 ♀, 1 ♂) n = 16 ( 9 ♀, 7 ♂)>6 years n= 3 (3 ♀) n = 36 (25 ♀, 11 ♂)
191 percent of birds were caught between June–October.

64 Status Assessment of Laysan and Black-Footed Albatrosses, North Pacific Ocean, 1923–2005
tac_08_9354_0255_Albatrosses_FigA3
Area 2A Washington – CaliforniaArea 2B British ColumbiaArea 2C SE AlaskaArea 3A Gulf of AlaskaArea 3B Alaska PeninsulaArea 4 Aleutian Islands
Total
FISH
ING
EFFO
RT, I
N 1
,000
HOO
KS
1970 1975 1980 1985 1990 1995 2000 20050
5,000
10,000
15,000
20,000
25,000
30,000
35,000
40,000
45,000
50,000
55,000
tac_08_9354_0255_Albatrosses_FigA4
Survey
Interview
Laysan albatross Black-footed albatross
Survey
Interview
1970 1975 1980 1985 1990 1995 2000 20050
100
200
300
400
500
600
700
800
900
1,000
NUM
BER
OF B
IRDS
KIL
LED
Figure A4. Estimated albatross bycatch for the halibut fishery off the U.S. and Canada, based on fishery surveys and fishermen interviews (solid lines = means; dotted lines = 95-percent confidence interval for surveys).
Figure A3. Fishing effort for the halibut fishery off the U.S. and Canada (Source: IPHC).
Demersal Longline FisheriesA scientific observer program has monitored the Alaskan
groundfish fisheries since 1993, and an assessment of seabird bycatch was recently published (National Marine Fisheries Service, 2006). Canada has a domestic longline fishery, mostly for rockfish, for which fishing effort and albatross bycatch is available from 1999 to 2002 (Smith and others, 2005; Smith and Morgan, 2005).
Bycatch estimates for Laysan albatrosses are higher for longline fisheries operating in the Bering Sea and Aleutian Islands, and black-footed albatross bycatch rates are higher
in the Gulf of Alaska (Boldt, 2004; National Marine Fisheries Service, 2006). These results are in agreement with the observed density of both species following fishing vessels in these regions (Melvin and others, 2004). When bycatch data did not affirm the albatross species caught, we followed Melvin and others (2004) and assumed that 62 percent of albatrosses caught in the Gulf of Alaska were black-footed albatrosses and 96 percent of albatrosses caught in the Bering Sea and Aleutian Islands were Laysan albatrosses (National Marine Fisheries Service, 2006). All bycatch off Washington and British Columbia were considered to be black-footed albatrosses (Smith and others, 2005).

Appendix A 65
Figure A5. Fishing effort and BPUE (birds per unit effort = bird/1,000 hooks) for the groundfish fishery conducted at the Bering Sea and Aleutian Islands (BSAI, A), the Gulf of Alaska (GOA, B), and the rockfish fishery off British Columbia (Rockfish, C). Confidence intervals (95 percent) are shown for the BPUE estimates.
tac_08_9354_0255_Albatrosses_FigA5
A
B
C
0
50,000
100,000
150,000
200,000
250,000
300,000
0.000
0.002
0.004
0.006
0.008
0.010
0.012
0
10,000
20,000
30,000
40,000
50,000
60,000
1992 1994 1996 1998 2000 2002 2004
0.000
0.005
0.010
0.015
0.020
0.025
0.030
0
1,000
2,000
3,000
4,000
5,000
6,000
0.000
0.020
0.040
0.060
0.080
0.100
0.120
0.140
0.160
FISH
ING
EFFO
RT, I
N 1
,000
HOO
KS
BIR
DS
PER
UN
IT E
FFO
RT (B
IRD
S/1,
000
HO
OKS
)Laysan albatrossBlack-footed albatross
Effort
Black-footed albatross,stratified
Black-footed albatross,traditional
Effort
Laysanalbatross
Black-footedalbatross
Effort
The halibut fishery is managed by the International Pacific Halibut Commission (IPHC). Fishing effort for this fishery was obtained from the IPHC web page (http://www.iphc.washington.edu/halcom/research/sa/sa.data/sa.data.html), except for British Columbia from 2000 to 2002, in which data were obtained from Smith and others (2005), and presented in figure A3. Albatross bycatch estimates are available only for 1998 and 1999 for the Gulf of Alaska and Aleutians (Geernaert and others, 2001) and for 1999 to 2002 for British Columbia (Smith and others, 2005; Smith and Morgan, 2005). Given the lack of bycatch information, we used the mean of all estimates (table A7). The estimated number of albatrosses killed by U.S. and Canadian halibut fisheries has remained relatively low, with a maximum annual bycatch of 188 Laysan and 517 black-footed albatrosses (fig. A4).
The fishing effort at each fishing area, species bycatch rates, and estimates of total number of albatrosses killed are presented in figures A5 and A6. A former fishery off of British Columbia, which killed an estimated 7 and 4 black-footed albatrosses in 1999 and 2000 respectively, is included in figure A6. Data were not available at the time of this analysis to estimate bycatch of Laysan or black-footed albatrosses in demersal fisheries operating in the western Pacific.
Bycatch estimates for the Laysan albatross indicate a peak of 1,664 albatrosses killed in 1998, but significant decrease after this time, decreasing to 179 in 2003 (fig. A6). Likewise, a maximum estimate of 683 black-footed albatrosses were killed in 1996, but bycatch levels decreased to 176 in 2003 (fig. A6). This decrease is likely due to mitigation measures initiated in 1997 (see below) that kept bycatch low despite an increase in fishing effort (fig. A5).
In the Alaska region, new seabird avoidance regulations have been in force since February 2004, although regional initiatives for reducing seabird bycatch began in 1997 (National Marine Fisheries Service-Alaska, www.fakr.noaa.gov/protectedresources/seabirds/bycatchinfo.htm#tra). The bycatch rate significantly decreased following implementation of these measures (fig. A5). Canada started an observer program in January 2000, and since 2002, there have been mandatory mitigation measures for halibut and rockfish fisheries in British Columbia along with the requirement to have scientific observers onboard when requested (J. Smith, University of Washington, written commun., 2005). Accordingly, albatross bycatch rates are expected to be further reduced.

66 Status Assessment of Laysan and Black-Footed Albatrosses, North Pacific Ocean, 1923–2005
tac_08_9354_0255_Albatrosses_FigA6
0
500
1,000
1,500
2,000
2,500
1992 1994 1996 1998 2000 2002 2004
NUM
BER
OF B
IRDS
KIL
LED
BSAI
Total
Total
GOA
BSAI
GOA
Black-footed albatross
Rockfish
Laysan albatross
Figure A6. Overall number of albatrosses killed in the groundfish fisheries operating at the Bering Sea and Aleutian Islands (BSAI), Gulf of Alaska (GOA), and British Columbia (Rockfish). Confidence intervals (95 percent) are shown for totals only.
Bycatch estimates Surveys InterviewNumber of
years sampled
Area 2A Washington - California & 2B British Columbia 1 0.0327 ± 0.0299 2 0.0049 ± 0.0021 2 5Area 2C SE Alaska 0.0031 ± 0.0043 0 2Area 3A Gulf of Alaska 0.0009 ± 0.0013 0.0006 ± 0.0008 2Area 3B Alaska Peninsula 0.0032 ± 0.0045 0.0004 ± 0.0001 2Area 4 Aleutian Islands 0.0323 ± 0.0456 0 2
1 Bycatch has not been estimated off of Washington so it was assumed to be the same rate as reported for British Columbia (BC); 2‘surveys’ in Area 2B (BC) are data from fishery observers onboard vessels, and ‘interview’ corresponds to a stratified estimation of bycatch rates considering the distribution of fishing effort and of the albatrosses being caught (Smith and others, 2005).
2 Data obtained from fisher’s master information at landing.
Table A7. Albatross (Laysan and black-footed combined) bycatch estimates (birds/1,000 hooks) for the halibut fishery off the U.S. and Canada (mean ± 1 SD), based on observer surveys or fishermen logbooks (interview).
[From Geernaert and others (2001). Surveys: Data obtained from scientific observers from survey fishing trips. Interview: Data obtained from fisher’s master information at landing]

Appendix A 67
tac_08_9354_0255_Albatrosses_FigA8
0.00
0.10
0.20
0.30
0.40
0.50
0.60
0.70
0.80
0.90
1.00
1950 1960 1970 1980 1990 2000 20051955 1965 1975 1985 1995
PROP
ORTI
ON OFP-TunaOFP-SwordfishHI-TunaHI-Swordfish
Figure A8. Proportion of total catch that was tunas (OFP-Tuna) or swordfish (OFP-Swordfish) as reported to the OFP, and the proportion of fishing effort allocated by the Hawai`i-based fleet for tuna (HI-Tuna) or swordfish (HI-Swordfish) exclusively (mixed trips excluded). (Sources: Kinan 2003a, 2003b, 2004; National Marine Fisheries Service, 2005).
Figure A7. Total fishing effort of pelagic longline fisheries in the North Pacific Ocean (north of 20°N) reported to the OFP.
tac_08_9354_0255_Albatrosses_FigA7
0
50,000
100,000
150,000
1950 1960 1970 1985 1990 20001955 1965 1975 1980 1995 2005
FISH
ING
EFFO
RT, I
N 1
,000
HOO
KS
Pelagic Longline FisheriesBycatch estimates were calculated using the annual
bycatch rate estimated for the Hawaiian-based pelagic longline fishery (1994–2000) and the total, pooled fishing effort reported by the Ocean Fisheries Program (OFP (as Lewison and Crowder, 2003). We included only fishing effort north of 20°N (as Hyrenbach and Dotson, 2003) because most albatross interactions occurred north of 20°N (U.S. Fish and Wildlife Service, 2004b) and telemetry studies indicate that breeding adults do not travel south of 20°N (Fernández and others, 2001).
The International fishing effort reported by the OFP (fig. A7) is not divided into swordfish and tunas, which have significantly different albatross bycatch rates. However, they do report total catch of swordfish and tunas, which we used as an index for the relative fishing effort allocated to each (fig. A8). The analysis of the Hawaiian pelagic longline fleet suggests two alternative bycatch rate scenarios differing in bycatch level. Here we follow the lower bycatch rate scenario (Hypothesis 1 or H1), and consider the catch reports for tuna and swordfish from the OFP relative to the Hawaiian fleet during the late 1990s (fig. A8). In addition, we used a higher bycatch rate scenario (Hypothesis 2 or H2) in our population models. The estimated bycatch rates are presented in table A8. Results from our matrix models supported the lower bycatch rate scenario. Lewison and Crowder (2003) provide the only other bycatch rate estimate for this fishery. They used a ratio of 80:20 for tuna:swordfish fishing effort, which produced an overall bycatch rate for black-footed albatrosses of 0.088, similar to our combined H1 estimate of about 0.073 (0.050–0.116) for the late 1990s.
The fishing effort reached peaks of 147 and 149 million hooks per year in 1960 and 1967, respectively. This effort decreased during the 1970s and increased again in 1981 to 121 million hooks per year. Since 1981, there has been a decreasing trend in number of hooks deployed (fig. A7). Accordingly, the estimated bycatch for Laysan albatrosses has fluctuated from 5,600 albatrosses in 1961 to 1,290 in 2005, under the assumptions of H1 (fig. A9). Similarly, the estimated mortality of black-footed albatrosses peaked with 15,290 in 1961 and again in the early 1980s with 10,200 albatrosses. The estimated bycatch has decreased since then to 4,800 albatrosses per year in accordance with H1 (fig. A9).

68 Status Assessment of Laysan and Black-Footed Albatrosses, North Pacific Ocean, 1923–2005
Unlike other studies, we did not stratify the data by sectors or seasons because: (1) fishing vessels and seabirds both use highly productive waters, such as frontal zones (that is, Polovina and others, 2001; Seki and others, 2002) and thus, the distributions of vessels and birds are likely associated (as suggested from band recoveries; Fisher and Fisher, 1972); (2) even when a portion of the population is breeding and at the colony, the remainder of the population is widely dispersed; (3) and albatrosses are prone to approach fishing vessels, particularly in regions of low productivity.
Catch and fishing effort data reported to the OFP is incomplete. According to the OFP, available data north of 20°N include Japan (since 1950), Taiwan (since 1967), and the U.S. (since 1991). Gilman and others (2005) mentioned that China also has a pelagic longline fleet in the North Pacific Ocean, although it is unclear if they fish north of 20°N.
tac_08_9354_0255_Albatrosses_FigA9
Black-footed, H1Black-footed, H2Laysan, H1 Laysan, H2
Estimated albatrosses killed—solid lines = means; dashed lines = 95-percent confidence interval
0
10,000
20,000
30,000
40,000
50,000
60,000
70,000
NU
MB
ER O
F B
IRD
S KI
LLED
1950 1955 1960 1965 1970 1975 1980 1985 1990 1995 2000 2005
Figure A9. Estimates of the total number of Laysan and black-footed albatross killed by the International North Pacific pelagic longline fishery under two bycatch rate hypotheses.
Species HypothesisSwordfish
Tuna
Overall
Mean 95% CI N (sets) Mean 95% CI N (sets) Mean 95% CI
BFAL H1 0.329 0.241 – 0.463 612 0.046 0.028 – 0.082 901 0.073 0.050 – 0.116H2 0.388 0.301 – 0.511 931 0.197 0.121 – 0.352 579 0.208 0.131 – 0.361
LAAL H1 0.156 0.098 – 0.266 612 0.006 0.003 – 0.013 901 0.027 0.019 – 0.042H2 0.270 0.199 – 0.377 931 0.190 0.099 – 0.430 579 0.187 0.099 – 0.417
Table A8. A comparison of bycatch rates (birds/1000 hooks) for black-footed (BFAL) and Laysan (LAAL) albatrosses under two alternative hypotheses.
[H1 = low rate, H2 = high rate; %, percent; Cl, confidence interval]
Here we describe our assessment of the bycatch rate of the Hawaiian pelagic longline fleet targeting swordfish and tuna, and how we used it to estimate overall mortality due to the International pelagic longline fleet in the North Pacific Ocean. Results from the Hawaiian scientific observer program indicate that fishing gear targeting swordfish (shallow sets; about 40 m; Kinan, 2003a) and tuna (deep sets; about 100–400 m; Kinan, 2003a) differ significantly in seabird bycatch rates, with shallow swordfish sets catching more albatrosses (Lewison and Crowder, 2003). This is likely a function of shallower sets taking longer to sink, making baited hooks available to scavenging birds for a longer period of time. Although some sets for tuna also are shallow, classifying these is not straightforward, especially for the early years of the scientific observer program. As the OFP only provides overall catches of swordfish and tuna, only these two categories were considered.

Appendix A 69
Data collected by the Hawaiian scientific observer program, 1994–2004, were provided through the NOAA Fisheries Department, Honolulu, Hawai`i. Only sets deployed north of 20ºN were used because this represents the area with most of the albatross-fisheries interactions (U.S. Fish and Wildlife Service, 2004b), as supported by telemetry studies (fig. 2; Fernández and others, 2001; BirdLife International, 2004c). Bycatch per unit effort (BPUE, birds per 1,000 hooks) estimates were made by fitting a negative binomial distribution to the BPUE data using set-by-set estimates. This probability distribution proved to have the best fit to the data, which is highly skewed and has many zero-values. Dead and injured birds hauled onboard were used for estimating the BPUE. Injured birds were included in estimates because they probably would be seriously injured on vessels without observers. Including these birds may compensate for birds caught during setting but lost before hauling (Gilman and others, 2005). Spatial and temporal patterns in the BPUE were analyzed using the level of detail associated with the data (month, latitude [x 5º] and longitude [x 5º]). Data were pooled into 2-month intervals, as well as latitudinal and longitudinal classes, to increase sample sizes for analysis. BPUE was not estimated for sample sizes less than 10 sets.
The temporal pattern and magnitude of bycatch, stratified by target species, were similar for black-footed and Laysan albatrosses. Results indicated that different bycatch rates for sets targeting swordfish compared to other species, generically called tunas (fig. A10). Sets targeting tunas had markedly lower bycatch across the years considered, whereas bycatch rate for sets targeting swordfish were high from 1994 to 2001, when this fishery was closed in Hawai`i (April 2001, emergency rule 66 FR 31561, ratified in June 2002 through the C.M. 67FR40232).
For black-footed albatrosses, the proportion of birds recorded as ‘injured’ remained similar between years, mean = 20.9 percent, SD = 2.2 percent (1994–97). This estimate is lower than the 28 to 34 percent of birds caught during setting but lost before hauling (in Gilman and others, 2005). Even if these birds were included, the calculated bycatch is still probably an underestimate of the actual bycatch.
The temporal and spatial patterns in black-footed albatross bycatch rate for sets targeting swordfish and tunas were examined from 1994 to 1996. Data from these years were pooled due to low sample sizes. Bycatch rate estimates were higher for the area north of the Hawaiian Islands, within 25º–29ºN and 165º–174ºW. No other temporal or spatial patterns were detected (fig. A11). This area is only used by U.S. fleets. The U.S. fleet does not fish in the western North Pacific, where a significant amount of fishing for swordfish occurs (Saito and Yokawa, 2000), and black-footed albatrosses forage (Robbins and Rice, 1974; Hyrenbach and others, 2005). The overall bycatch rate was estimated assuming no geographic variation.
tac_08_9354_0255_Albatrosses_FigA10
Black-footed albatross
0.0
0.1
0.2
0.3
0.4
0.5
0.6
0.7
0.8
0.9
1.0
1.1
1.2
1.3
0.0
0.1
0.2
0.3
0.4
0.5
0.6
0.7
0.8
0.9
1.0
1.1
1.2
1.3
0
200
400
600
800
1,000
1,200
1,400
0
200
400
600
800
1,000
1,200
1,400
PELA
GIC
LON
GLIN
E FI
SHER
Y IN
NUM
BER
OF S
ETS
OBSE
RVED
Laysan albatross
1993 1994 1995 1996 1997 1998 1999 2000 2001 2002 2003 2004 2005
BYC
ATC
H E
STIM
ATE
, IN
BIR
DS
PER
UN
IT E
FFO
RT (B
IRD
S/1,
000
HO
OKS
)
Swordfish
Swordfish
Total
Tunas
Tunas
Pelagic longline fishery
EXPLANATIONBycatch estimates
A.
B.
Figure A10. Black-footed (A) and Laysan albatross (B) bycatch estimates (BPUE, birds per 1,000 hooks; mean and 95-percent confidence interval) and sample sizes (number of sets observed; solid lines) for the pelagic longline fishery based in Hawai`i. Data are from the scientific observer program.

70 Status Assessment of Laysan and Black-Footed Albatrosses, North Pacific Ocean, 1923–2005
tac_08_9354_0255_Albatrosses_FigA11
NUM
BER
OF S
ETS
BIRD
S PE
R UN
IT E
FFOR
T (B
IRDS
/1,0
00 H
OOKS
)
NU
MB
ER O
F SE
TS
NU
MB
ER O
F SE
TS
NU
MB
ER O
F SE
TS
NU
MB
ER O
F SE
TS
0.0
0.5
1.0
1.5
2.0
2.5
3.0
0
50
100
150
200
250
300
JAN-FEB MAR-APR MAY-JUNE JULY-AUG SEPT-OCT NOV-DEC
NUM
BER
OF S
ETS
BIRD
S PE
R UN
IT E
FFOR
T (B
IRDS
/1,0
00 H
OOKS
)
0.0
0.5
1.0
1.5
2.0
2.5
3.0
BIRD
S PE
R UN
IT E
FFOR
T (B
IRDS
/1,0
00 H
OOKS
)
0.0
0.5
1.0
1.5
2.0
2.5
3.0
BIRD
S PE
R UN
IT E
FFOR
T (B
IRDS
/1,0
00 H
OOKS
)
0.0
0.5
1.0
1.5
2.0
2.5
3.0
BIRD
S PE
R UN
IT E
FFOR
T (B
IRDS
/1,0
00 H
OOKS
)
0.0
0.5
1.0
1.5
2.0
2.5
3.0
BIRD
S PE
R UN
IT E
FFOR
T (B
IRDS
/1,0
00 H
OOKS
)
0.0
0.5
1.0
1.5
2.0
2.5
3.0
0
50
100
150
200
250
300
JAN-FEB MAR-APR MAY-JUNE JULY-AUG SEPT-OCT NOV-DEC
20N 25N 30N 35N 40N0
50
100
150
200
250
300
350
400
450
20N 25N 30N 35N 40N0
50
100
150
200
250
300
350
400
450
170W 165W 160W 155W 150W 145W0
50
100
150
200
250
175W-170E
125W-140W
170W 165W 160W 155W 150W 145W0
50
100
150
200
250
175W-170E
125W-140W
Swordfish
Swordfish
Tunas
Species other thanswordfish
Sets targeting:
Bycatch estimates
Figure A11. Black-footed albatross (BFAL, left) and Laysan albatross (LAAL, right) bycatch rate estimates (BPUE, birds per 1000 hooks; mean and 95-percent confidence interval) and sample sizes (number of sets observed; solid line) for the pelagic longline fishery based in Hawai`i from 1994 to1996 (data pooled). Estimates are grouped by month (top), latitude (middle), and longitude (bottom). Data are from the scientific observer program.

Appendix A 71
There was a significantly lower black-footed albatross bycatch rate for sets targeting tuna from 1997 to 2000 compared to 1994 to 1996 (fig. A10). This difference probably is the result of a better classification of swordfish and tuna sets after 1996, because bycatch in sets targeting swordfish were similar over this period, and no official mitigation measures were implemented until 2000. We considered the bycatch rate for 1994–96 and 1997–2000 as alternative hypotheses (H1 and H2, respectively) for the bycatch rate of the International fleet. Although fishing effort directed at swordfish or tunas is unknown for the International fleet, we used the reported number of swordfish and tunas caught as an index of the fishing effort expended for each target species. H1 may occur if fishing effort oriented to swordfish or shallow sets is under-reported, whereas H2 may occur if the International fleet has a similar proportion of fishing effort for tuna and swordfish compared to the Hawaiian fleet during 1997–2000 (fig. A8, table A8).
Finally, we used the proportion of tuna to swordfish caught each year (fig. A8) to estimate the mean bycatch rate for the fleet. As a reference, this proportion over the last 10 years was 92:8, yielding overall bycatch rates of H1: 0.073 and H2: 0.208 (table A8). The overall bycatch rate estimated using H2 is similar to that estimated by Lewison and Crowder (2003), the only other estimate available for the fleet.
The proportion of Laysan albatrosses recorded as ‘injured’ remained similar between years (1994–97), with a mean of 25.5 percent (SD = 8.3) and is lower than the 28 to 34 percent loss rate estimated by Gilman and others (2005). Thus, inclusion of these birds is not likely to inflate our bycatch rate estimates.
The temporal and spatial patterns in bycatch rates for sets targeting swordfish and tunas were examined for 1994–96. Data from these years were pooled due to the small sample sizes. Bycatch rate estimates were higher for the area north of the Hawaiian Islands, within 25º–29ºN and 165º–174ºW, and during March–June (fig. A11). This suggests an important
temporal-spatial effect that corresponds to the chick-rearing period in the NWHI. This area is only used by U.S. fleets. The U.S. fleet does not fish in the western North Pacific, an area important to albatrosses, especially young Laysan albatrosses (fig. 2; Fisher and Fisher, 1972; Robbins and Rice, 1974), but the International fleet does, and the bycatch rate is unknown.
There was a significant decline in the Laysan albatross bycatch rate for sets targeting tuna between 1994–96 and 1997–2000 (fig. A10). This may be the result of a better classification of swordfish and tuna sets after 1996, because the bycatch rate for sets targeting swordfish remained relatively constant over the entire period. Because fishing effort directed toward swordfish and tunas is unknown for the International fleet, we considered two alternative hypotheses regarding the bycatch rate for the International fleet: H1, the rate for 1994–96 and; H2, the rate for 1997–2000 (table A8). We used the proportion of tunas to swordfish caught each year (fig. A8) to obtain a weighted mean of the bycatch rate for the fleet. As a reference, this proportion over the last 10 years has been 92:8, yielding an overall bycatch rate of H1 = 0.027 and H2 = 0.187 (table A8).
Trawl FisheriesAlbatross bycatch has been recorded in the Alaskan trawl
fisheries, but monitoring trawl bycatch is limited to birds captured in the nets. Birds killed or injured upon striking the cables (warps) or the sensor wire (3rd wire) are not recorded unless they fall into the water and are captured in the net. However, cable strike information began to be collected in 2004. As of 2005, no albatrosses have been reported as being killed by cables or sensor wires. Canada and the U.S. have trawl fisheries off British Columbia, Washington, Oregon, and California, but no albatross bycatch data are available from these fisheries.

72 Status Assessment of Laysan and Black-Footed Albatrosses, North Pacific Ocean, 1923–2005
This page left intentionally blank

Appendix B 73
Appendix B. Descriptions and History of the Northwestern Hawaiian Islands
The Northwestern Hawaiian Islands have undergone a series of physical changes during the past century as a result of human occupation. To understand the effect of these changes
Island Parameter estimation
Kure (1923-1956): â = 0.0811; = 500; SD = 14(1957-2005): â = 0.1713; K = 4,493; SD = 447
Midway1â = 0.1084; K = 446,779; SD = 53,542
Pearl & Hermes North Island:Mean = 787; SD = 140 (just 3 censuses in 1963-1967)Southeast Island: â = 0.1118; K = 13,926; SD = 4,691Grass Island: EST1: â = 0.072; K = 1,799; SD = 520EST2: â = 0.12; K = 875; SD = 440Kittery Island: Mean = 25; SD = 28 (just 5 censuses in 1963-1969)Seal Island: â = 0.0953; K = 206; SD = 150Total K= 15,819
Lisianski â = 0.0661; K = 31,074; SD = 9,574
Laysan â = 0.0607; K = 198,926; SD = 53,669
Gardner Pinnacles â = 0.06; K = 8; SD = 6
French Frigate Shoals Tern Island (1954–2005): â = 0.1282; K = 2,048; SD = 260East Island (1950–2005): â = 0.1373; K = 733; SD = 168Other islands: (1923–1990): â = 0.1; K = 228; SD = 85(1991–2005): â = 0.1; K = 41; SD = 45
Necker â = -0.0076; K = NA (exponential model); SD = 752
Nihoa â = 0.0401; K = 300; SD= 221
Ni`ihau Mean = 338; SD = 230 (just 2 censuses)
Kaua`i â = 0.0968; K = 225; SD = 41
O`ahu â = 0.0968; K = 10; SD = 5
Mexico Guadalupe Island:â = 0.1693; K = NA (exponential model); SD= 11San Benedicto Island:â = 0.0747; K = 10; SD = 2
1 Includes known Navy reduction of Laysan albatross breeding pairs (table 2).
Table B1. Parameter estimation for Laysan albatross breeding population size at each island.
[Logistic model fitted: (1 )+1= ta -N / K
t tN N e , where Nt = number of breeding pairs at time t, Nt+1 = number of breeding pairs at time t+1, a = population growth rate, K = carrying capacity, and e = 2.718, the base of the natural logarithm]
K
on the population size of both albatross species (tables B1 and B2), we present a detailed account for each breeding island below.

74 Status Assessment of Laysan and Black-Footed Albatrosses, North Pacific Ocean, 1923–2005
Island Parameter estimation
Kure (1923-1957): â = -0.0544; K = NA (exponential model); SD = 8 (1957-2005): â = 0.0869; K = 3,994; SD = 228
Midway1Midway-H1: (1923-1955) â = 0.0473; K = 28,023; SD = 0 (CV5% used) (1955-1964): â = -0.0810; K = NA (exp. model); SD = 1,520 (1964-2005): â = 0.0992; K = 21,943; SD = 1,373 Midway-H2: (1923-1945) â = 0.1201; K = 27,920; SD = 0 (CV5% used) (1945-1964): â = -0.0678; K = NA (exp. model); SD = 1,348 (1964-2005): â = 0.0992; K = 21,943; SD = 1,373
Pearl & Hermes North Island: EST1: â = 0.072; K = 1,851; SD = 504 EST2: â = 0.0416; K = 3,000; SD = 457 Southeast Island: â = 0.0953; K = 3,425; SD = 1,131 Grass Island: â = 0.0538; K = 1,933; SD = 466 Kittery Island: Mean = 335; SD = 127 (just 6 censuses in 1957-1968) Seal Island: EST1: â = -0.0319; K = NA (exp. model); SD = 146 EST2: â = 0.0397; K = 279; SD = 142 Total K = 7,823 or 8,972.
Lisianski â = 0.0953; K = 2,866; SD = 732
Laysan EST1 (1923-2005): â = 0.0905; K = 39,030; SD = 462 EST2 (1958-2005): â = 0.0953; K = 18,095; SD = 4,630 EST3 (1923-2005): â = 0.0549; K = 21,681; SD = 2,655
French Frigate Shoals Tern Island: (1923-1942): â = 0.0953; K = NA (exp. model); SD = NA
(1943-1979): â = 0.0953; K = NA (exponential model); SD = 14 (1979-2005): â = 0.2479; K = 1,585; SD = 97 East Island: (1954-2005): â = 0.1825; K = 2,009; SD = 228 Other islands: (1923-1990): â = 0.0953; K = 1,512; SD = 451 (1990-2005): â = 0.0953; K = 288; SD = 237
Necker â = 0.0953; K = 214; SD = 101
Nihoa â = -0.0166; K = NA (exponential model); SD = 23
JAPAN Izu Shoto: (1957-2005): â = 0.1307; K = 2,009; SD = 79 Senkaku Retto: (1973-2005): â = 0.1199; K = NA (exp. model); SD = 8 Ogasawara Gunto: (1950-2005): â = 0.0953; K = NA (exp. model); SD = NA
1 Includes known Navy reduction of black-footed albatross breeding pairs (table 2).
Table B2. Parameter estimation for black-footed albatross breeding population size at each island.
[Logistic model fitted: (1 )+1= ta -N / K
t tN N e , where Nt = number of breeding pairs at time t, Nt+1 = number of breeding pairs at time t+1, a = population growth rate, K = carrying capacity, and e = 2.718, the base of the natural logarithm. %, percent]

Appendix B 75
Kure AtollKure (28°25′N, 178°10′W) is a low, coral atoll containing
Green Island (100 ha), the only permanent land in the atoll. Low (less than 7.5 m) dunes are present on the northern shore of the island, and high waves during winter storms may wash beaches up to the vegetation border, thus destroying black-footed albatross nests. Dense vegetation, primarily Scaevola taccada, covers most of the island, except near beaches and areas cleared for the LORAN Station. This dense vegetation greatly reduces potential albatross nesting habitat. In 1960, the U.S. Coast Guard built a 1,200-m runway and a 188-m high LORAN tower on the central plain of the island (Woodward, 1972). In 1992, the U.S. Coast Guard left the island and removed all equipment. Since 1992 the island has been managed by the State of Hawai`i as a seabird sanctuary.
Midway AtollThis low, coral atoll (28°14′N, 177°22′W) contains
two large islands, Sand (435 ha) and Eastern (135 ha), and two small islands, the Spit islands. The islands have been greatly modified by humans since the early 1900s, first by the Commercial Pacific Cable Company (1903), then by Pan American Airways (1935), the U.S. Navy (1941), and finally the U.S. Fish and Wildlife Service (1997). The greatest change has been the increase in land area, especially on Sand Island. The cable company transported barge loads of topsoil to the atoll from the main Hawaiian Islands, and the military deposited dredge spoils from the lagoon. The introduction of non-native grasses and trees soon after occupation in 1903 greatly improved nesting habitat for the Laysan albatross (Rice and Kenyon, 1962a). During WW II, the U.S. Navy used Midway Atoll as an air station, building runways on both Sand and Eastern Islands. A considerable fraction of nesting habitat was usurped for buildings and runways (Fisher, 1949). In 1993, the Midway Naval Air Station was operationally closed and environmental clean-up began. The last Navy personnel left in 1997 soon after jurisdiction of the atoll was transferred to USFWS. Since 1996, the USFWS has overseen the removal of many of the former buildings and restoration of extensive areas once covered with asphalt (Tickell, 2000). Golden crown-beard, an invasive woody herb, is widespread and degrades seabird nesting habitat.
Pearl and Hermes ReefThis atoll (27°44′–27°57′N, 175°43′–175°59′W) consists
of seven persistent, small, sand islands, totaling approximately 34 ha of emergent land. The five largest islets, Southeast Grass, Seal-Kittery, North, and Little North support a limited flora, and the two smallest islets (Sand and Bird) are sand bars without vegetation (Baker and others, 2006). Rabbits were first documented on Southeast Island in 1916 and eradicated in 1928 (Amerson and others, 1974). Native bunch grass vegetation has been replaced in many areas by herbaceous creeping vegetation and the invasive weed, golden crown-beard, that limits albatross nesting habitat.
Lisianski IslandThis is a 180-ha coral island (26°02′N, 174°00′W) with
only a small area of sandy beaches. The east coast has exposed reef rock, and elsewhere the beaches are relatively narrow, except for the southern end where black-footed albatrosses commonly nest (Clapp and Wirtz, 1975). Dunes along the shorelines are 3–6 m as above sea level, and their edges are covered with dense patches of Scaevola sp. The primary plant species of the island interior are bunchgrass (Eragrostis sp.), scattered ironwood and coconut trees, and a small grove of devils-claw (Pisonia grandis). Birds on the island were harvested by feather hunters in 1904 and 1909. Rabbits were introduced early in the 20th century and died of starvation in 1915 after consuming all edible vegetation on the island. In the absence of rabbits, the vegetation has recovered (Clapp and Wirtz, 1975).
Laysan IslandThis is a large, roughly rectangular, sand island (291 ha;
25°42′N, 171°44′W) with a hypersaline lake at its center. The island has a maximum height of 12 m above sea level, with coastal dunes rising abruptly from the sea to 4.5–5.4 m. Except for the shoreline, most of the island is covered by vegetation: Scaevola sp. on dune borders and scattered bunch-grass (Eragrostis sp.) in the interior. Laysan Island has wide, sandy beaches (225–360 m in width), except along the west side (22.5–45.0 m in width). Guano was mined from 1891 to 1903 and the “guano hardpan”, the primary excavation site at the south end of the island, is still a prominent feature. Rabbits were introduced about 1903 and destroyed most of the vegetation before being eradicated in 1923 (Ely and Clapp, 1973). Birds on the island were killed by feather hunters from 1908 to 1910, and again in 1915.

76 Status Assessment of Laysan and Black-Footed Albatrosses, North Pacific Ocean, 1923–2005
Gardner Pinnacles The Gardner Pinnacles (25°00′N, 167°55′W) consists of
two small volcanic rocks, 58 m high and 30 m high, totaling 1.2 ha in area. The islets have steep sides and no sand beaches (Harrison, 1990).
French Frigate ShoalsThe atoll (23°37′–23°52′N, 166°03′–166°20′W) consists
of 12 low, sandy islands with sparse vegetation, and a pair of volcanic rock islands (36.6 and 2.7 m high) known as La Perouse Pinnacle. In total, the islands consist of 45 ha of land, and only East, Tern, and Trig Islands support vegetation and are not regularly washed over by storm waves. Most of the islands are 2.4–3.6 m above sea level and have changed shape and size in recent history (Amerson, 1971). Tern Island, formerly a small, sandy island (4.4 ha), was transformed into a runway by the U.S. Navy in 1942 and now has an area of 22.7 ha. From 1952 to 1979, a U.S. Coast Guard LORAN Station operated on Tern Island. East Island is sandy, 4.5 ha in size, and has one-half of its area covered by vegetation. U.S. military personnel first occupied East Island in 1935, living in a tent camp. In 1944, the U.S. Coast Guard established a LORAN Station on East Island, which remained in operation until it moved to Tern Island in 1952. Whale-Skate originally consisted of two islands (6.7 ha) that later connected by a sand isthmus. During the 1990s, Whale-Skate slowly eroded until it completely disappeared in 1997. Trig Island is 4.0 ha in size and half-covered with vegetation. Little Gin Island is 2.0 ha in size and lacks vegetation.
Necker IslandThis high, rocky island (23°35′N, 164°42′W) is 16.4 ha
in size, with steep sides rising 46.8–82.8 m above sea level. The limited vegetation on the island is composed primarily of Chenopodium sp. and Portulaca sp. Albatrosses nest on the hill tops and higher slopes (Clapp and Kridler, 1977).
NihoaThis high, rocky island (23°06′N, 161°58′W) is 62.4 ha
in size, with high peaks (107–267 m above sea level), well-developed valleys, steep cliffs, and a single sand beach. Nihoa is well-vegetated by grasses (Eragrostis sp.) and shrubs (Sida fallax, Chenopodium oahuensis, Sesbania tomentosa; Clapp and others, 1977). An introduced grasshopper (Schistocerca nitens) was first reported in the 1980s and during periodic population outbreaks the grasshoppers consume much of the island’s vegetation.

Appendix C 77
Appendix C. Detailed Methods for Analysis of Population Trends and Bycatch Impacts
Regression AnalysesWe used linear regression to fit log-transformed counts of
breeding pairs from Midway Atoll, Laysan Island, and French Frigate Shoals combined from 1923 to 2005, 1957 to 2005, and 1992 to 2005. Laysan albatross counts were available from the three island groups for 8 years (1923, 1957, 1992, 1997, 2001, 2002, 2004, and 2005). Black-footed albatross counts were available from the three island groups for 11 years (1923, 1957, 1992, and 1998–2005). Analyses in which the p-value was less than or equal to 0.05 were taken as significant and evidence that the population had either increased or decreased over the time interval.
Population Viability Analyses (PVA)Logistic and exponential models were fit to the nest pair
data, and these models were used to project population change 60 years (about three generations) into the future to assess population viability.
Breeding population trajectories were analyzed using the following stochastic, discrete-time, logistic model (Dennis and Taper, 1994):
1 ,where:
is defined as ln( ), is defined as growth rate, is defined as density-dependent parameter, is defined as standard deviation of the
process stochasticity, and ~
tXt t tX X a be Z
X Nab
Z
σ
σ
+ = + + +
(0,1). normal
(1)
As Xt+1 – Xt = Rt , the former equation becomes a non-linear autoregressive model of the R-function (Berryman, 2003) with mean E(RT) = a + beXt and environmental stochasticity given by σZt , considering demographic stochasticity is absent given the large population sizes (figs. 6 and 14). This model allows the testing of nested hypotheses regarding the nature of the population dynamics: Hypothesis 1 (H1): a≠0, b=0 and; Hypothesis 2 (H2): a≠0, b<0. H1 describes an exponential growth model with environmental stochasticity, and H2 describes a stochastic Ricker model with first-order negative feedback on population size (Dennis and Taper, 1994). For all purposes, nest counts were assumed to be representative of the breeding female population, from which Robst = ln(Nt+1 / Nt), the observed growth rate, was obtained.
Parameter estimation was conducted by maximizing the negative log-likelihood function L(â, b , 2σ ). Although the estimations of â, b , 2σ are unbiased, Dennis and Taper (1994) recommend using parametric bootstrapping for estimating confidence intervals given they are not statistically independent from each other. Accordingly, 2,000 population projections with the same length and initial population size as the original data were generated using eq. 1 and the original L(â, b, 2σ ) values. For each generated series, new L(âi*, ib *, 2ˆiσ *) were estimated and used to obtain confidence intervals for each parameter (2.5 and 97.5 percent sampling percentiles).
For the exponential model, simple linear methods were used for confidence interval estimation (Dennis and others, 1991). Accordingly, the confidence interval for â was estimated using (â – tα,q–1•SE, â + tα,q–1•SE), with α = 0.05, q = no. of Robs points, and the confidence interval for 2σestimated as ((q–1)σ2/ x2
0.025, q–1 , (q-1)σ2 / x20.975, q–1) , after
correcting 2σ for small sample sizes by using σ2 = q 2σ /df, with df = degree of freedom, being 1 for the exponential and 2 for the logistic model (Dennis and others, 1991).
The process variability, estimated by σ2, represents both environmental stochasticity, σ2env , and variance due to sampling error, σ2s-error. Although sampling error does not significantly affect â, it produces a strong bias in σ2, which if not removed produces overly pessimistic PVAs (Morris and Doak, 2002). Accordingly, sampling error was removed from σ2 as follows: (1) the variance in Robs accounted for by sampling error was estimated as
12 2
1
var( ) var( )var( ) ,t t
tt t
C CRobs
C C+
+
= + (2)
where Ct is the mean population size estimated for year t; (2) the variance due to sampling error, after correcting for small samples, was estimated as the average variance of all var(Robst) obtained before; and (3) the environmental variance was then estimated as σ2env = σ2tot – σ2s–error , with σ2tot = σ2 , estimated during model fitting (Morris and Doak, 2002, p. 163).
Variance of population estimates, var(Ct), was estimated from a log-normal distribution, Ct • e
εZt , with εZt being normally distributed (Carpenter and others, 1994; Staples and others, 2004). This distribution has the property that the standard deviation ε equals the coefficient of variation (CV) of the census data (Carpenter and others, 1994) . Finally, var(Ct) was estimated from 2,000 bootstraps of Ct • e
εZt . The CV values used were estimated as follows: (1) a CV of approximately 1 percent (ε = 0.01) was included for direct nest censuses conducted at Midway Atoll, French Frigate

78 Status Assessment of Laysan and Black-Footed Albatrosses, North Pacific Ocean, 1923–2005
Shoals, and Laysan Island (only black-footed albatrosses since 1998), as derived from field studies conducted at Midway Atoll (Flint, 2005), and (2) the USFWS provided population estimates and 95-percent confidence intervals derived from the assumption of normality in the distribution of nests per quadrant (1 quadrant = 100 m × 5 m strip transect) for population estimations derived from transect samples conducted at Laysan Island for both species since 1992. In both species, but particularly for black-footed albatross, there were a high proportion of quadrants having no black-footed albatross nests, thus causing the sampling distribution to significantly depart from normal. Data exploration indicated that a negative binomial (NegBin) distribution fit the data better than other models tested (that is BFAL 2003: lognormal: SSE=0.331; Poisson: SSE=0.038; NegBin: SSE=0.002). Accordingly, the mean number of nests per quadrant and its confidence interval were estimated for each species using the NegBin distribution and the likelihood profile of the mean (Hilborn and Mangel, 1997). Total population estimates were obtained by multiplying these estimates by the number of quadrants on the island. The CV was estimated from the estimated standard error (SE) of the mean, as (mean - 2.5%CI)/1.96, and divided by the mean estimated, CV~SE/mean.
Including sampling error when estimating parameters improves both model selection and parameter estimation (Carpenter and others, 1994). Sampling error was included by fitting eq. 1 to 3,000 generated data sets, each one created by adding sampling error to the actual census data series by using Ct • e
εZt. The distribution of each parameter was then described by the median, 2.5 and 97.5 percent sampling percentiles of the 3,000 L(âi*, ib *, 2ˆiσ *) so obtained, and sampling variance was removed from the total variance estimated as indicated above.
Model selection was conducted using the corrected Akaike Information Criterion,
221
pqAICc MLEq p
= − +− −
, (3)
with maximum log-likelihood estimate (MLE, Morris and Doak, 2002). Differences between the exponential and logistic model were analyzed using the LR test proposed by Dennis and Taper (1994). LR = logL(ø1)/logL(ø2), where 1 is the exponential and 2 is the logistic model, was estimated and compared with an empiric distribution of LR obtained from adjusting both models to 5,000 generated datasets from the original exponential model’s parameters, L(â, 2σ ), and obtaining LRi, where i = 1, 2, …5,000. The null hypothesis, H0: exponential model, is rejected if the original LR is greater than the 95 percent sampling percentile of LRi.
Population forecasting was conducted using the exponential model. Although the logistic model fit the Robs data better for some islands and species, it tended to over-compensate for population declines (Morris and Doak, 2002). The exponential model is a better representation of the current trend of the breeding population and as such, provides a
better evaluation of the potential effect of present threats. A weakness of the exponential model is that it provides no clues about the factors underlying the population trend and can be strongly affected by environmental stochasticity.
Population trends were estimated for the 60 years following the last census data available, and the rate of population change was calculated as the difference between the final (Nf) and initial (Ni) population sizes divided by the initial population size, ΔN = (Nf – Ni )/Ni . To facilitate comparisons of population trends between species, and with the Lewison and Crowder (2003) analysis, population projections were conducted for both species over 60 years. This time interval met IUCN guidelines of using three generations, which for these species varies between 18–28 years (International Union for Conservation of Nature and Natural Resources, 2004), while also keeping the time horizon low, thus reducing the multiplying effects of parameter error and process uncertainty (Morris and Doak, 2002). Projection of the errors of parameter estimation was accomplished with parametric bootstrapping (Dennis and Otten, 2000). Using the parameters estimated with the exponential model, â and σ2env , 1,000 data sets of the same length and starting population size as the original data were generated using eq. 1. For each simulated dataset, the MLEs of a and σ2 were found and denoted L(âi*, 2ˆiσ
*), where i = 1, 2,…1,000. Each i set of parameters was then used to generate 1,000 projections 60 years into the future. For each jth projection (j = 1, 2,…1,000) with the ith set of parameters, the rate of change ΔNj,i was computed and the median rate of change ΔNi , plus characteristic sampling percentiles, were estimated. Together, these 1,000 ΔNi estimates constitute an estimate of the sampling distribution of ΔN , from which adequate descriptors, such as the 2.5 and 97.5 percent percentiles can be readily calculated. In both models, if the population size declined to a single individual, the population was considered extinct.
Age Structured Population Modeling
Historical Breeding Population Trajectory
Predictions of the historical size of breeding populations were determined by fitting a logistic curve to point estimates of the breeding population on each island where Laysan and black-footed albatrosses nest (figs. 6 and 14). The black-footed albatross population estimate of Fisher and Baldwin (1946) was the sum of the chicks and their parents, which we divided by three to determine the number of breeding pairs. Population surveys described in the above studies were carried out during different phases of the breeding cycle, so we estimated the number of pairs laying eggs based on mean demographic parameters for Laysan and black-footed albatrosses, respectively, estimated using data from Midway Atoll from 1992 to 2001 (U.S. Fish and Wildlife

Appendix C 79
Service, unpub. data, 2005): hatching success = 0.804 and 0.69 and breeding success = 0.495 and 0.55. In all cases, except recently colonized islands (Japan and Mexico), the logistic model was a better fit to the data than the exponential model. In each case the residuals’ standard deviation was estimated and added to obtain an interval for the expected past population size. The world population size was then estimated by summing up the mean ± 1 SD estimates from each island. Additional information obtained was an estimation of the nesting carrying capacity for each island and for the whole species.
Model Structure
The population trajectory estimated above was modeled using an age-structured, deterministic matrix model implemented in R-software. The basic model includes 10 age classes, with eggs in age 0, juveniles from age 1 to 7, and adults from age 8 and above. Individuals were considered to start breeding at age 8 (as in Cousins and Cooper, 2000). Reproduction was considered to occur in one pulse on 1 January, which corresponds closely to breeding censuses dates conducted by the USFWS. Breeding frequency and breeding success were kept constant. Juveniles of age 1 were estimated as the number of eggs laid multiplied by breeding success and fledgling survival rate, S1.
A density-dependent version of the model was also implemented. Under natural conditions, survival rate probably decreases as per capita food availability decreases. Here we considered a contest model of competition, with all individuals having the same chance of obtaining food. Accordingly, survival of fledglings, juveniles, and adults were modeled using a single function as follows (Caswell, 1997): S • e–b·Nt , with S = survival rate value when Nt~0, Nt = total population size, b = constant that measures the strength of the density-dependence.
Parameter Estimation
Parameter values were estimated by fitting a random combination of values to the expected breeding population trend that included fishery bycatch. There is great uncertainty in demographic parameter values, mostly due to inconsistent and fragmented banding and recovery efforts (see Cousins and Cooper, 2000; Lewison and Crowder, 2003), and the non-independence of these estimates with fishery bycatch levels. The pelagic fishery started in 1952 (fig. A7), which is before the earliest banding program. Consequently, all survival estimates may be affected by fishery mortality. This factor had not been identified in previous assessments and may significantly influence results. To avoid this problem, we had the model choose the parameter value after adding different levels of fishery bycatch (see below). Parameter values were
not correlated. Finally, the chosen set of parameters in each iteration was saved only if the model outcome from 1923 to 2005 satisfied the following requirements:1. The breeding population size estimated for 2005 must
be within N2005•e(±0.05*1.96) corresponding to the breeding
population size estimated for 2005 and a 95-percent CI assuming a log-normal error distribution with a CV = 5 percent, which is about the CV for USFWS censuses.
2. The breeding population size projections for all years must be within ± 1 SD of the historical population size estimate.Initial parameter values for each projection were selected
at random from uniform distributions containing the most plausible range of natural values for each parameter (table 10). The ranges used for each parameter were:
• Breeding frequency, BF={0.65, 0.66,…, 0.85}
• Breeding success, BS={0.50, 0.51,…, 0.70}
• Survival of fledglings, S1={0.70, 0.71,…, 0.90}
• Survival of juveniles, Sjuv={0.930, 0.935,…, 0.990}
• Survival of adults, Sad={0.940, 0.945,…, 0.990}
• Density-dependent parameter: for the Laysan albatross, b={1•10-9, 2•10-9,…,1•10-6}, estimated after several runs; for the black-footed albatross, b={1•10-13, 2•10-13,…,1•10-9}; estimated after several runs.
Using values from these parameter ranges, 100 parameter combinations were obtained for each fishery bycatch scenario. Confidence intervals for each parameter, without the effect of fishing mortality, were obtained. Finally, the maximum growth rate of the population, λmax, was calculated using the dominant eigenvalue of the population-projection matrix (Caswell 1997), with the function Schur of the Matrix package for R (Bates and Maechler, 2005).
Fishery Bycatch Impact
Fishery bycatch levels used are those presented in section, “Threats” and summarized in figures 3 and 4. These estimates represent two mortality hypotheses regarding the bycatch rate used to estimate the total International pelagic longline fleet mortality (table A8). For the Laysan albatross, Hypothesis 1 (H1) uses a lower estimate, ca. 0.027 birds per 1,000 hooks and Hypothesis 2 (H2) uses a higher estimate, ca. 0.187 birds per 1,000 hooks. For the black-footed albatross, H1 = 0.073 birds per 1,000 hooks and H2 = 0.208 birds per 1,000 hooks (appendix A). Results include estimates of adult and juvenile survival and the observed population growth rate (λ) after adding fishing mortality.

80 Status Assessment of Laysan and Black-Footed Albatrosses, North Pacific Ocean, 1923–2005
The effect of current fishery bycatch on the population trend was evaluated by incorporating different bycatch scenarios into the modeling process and by estimating the Potential Biological Removal (PBR) level for the species (Wade, 1998).
Fishery mortality was included in the matrix model by removing juvenile and adult individuals from the population between censuses, thus affecting only juvenile and adult survival rates. The number of individuals killed was extracted in a single event, just before reproduction (or census). The individuals killed were discounted from the population, assuming that juveniles and adults have the same chance of getting caught, thus mortality depends only on the relative abundance of each age-class. The world population was modeled as a whole; therefore albatrosses from all islands had the same probability of being killed by fishing operations. Accordingly, the number of albatrosses of each age-class killed by fisheries, or surviving to the next year, was estimated as:
, 1 , ,( ) ,where
is defined as {1,…, 8, +8}
a t a t a t aN N F S
a
+ = − (4)
,,
,
,
,
,
where is defined as number of individuals in the age-
class during year , is defined as number of individuals in the age-
class killed by fisheries during year ,
a ta t t
y t
a t
a t
NF F
N
N at
F at
=
,
is defined as yearly survival rate of age-class , andis defined as total number of juveniles and adults
(age-classes 1 to +8) in year .
a
y t
S aN
t
(5)
In addition, albatross mortality at Midway Atoll due to ‘control programs’ (see table 2) was considered to affect only breeding albatrosses and was subtracted from age-class +8 at the same time as those dying as a result of bycatch.
The impact of fishery bycatch on population viability was determined by estimating the PBR level. PBR depends on the maximum population growth rate (λmax ; there is no human-induced mortality), the population size, a density-dependent factor, and a ‘recovery factor’ (Wade, 1998). For this analysis we used a density-dependent factor of 0.5 (Wade, 1998) and a recovery factor of 0.5, following the U.S. Marine Mammal Protection Act guideline when the actual population size is used (Caswell and others, 1998). The PBR was then estimated as R= (λmax–1)•0.5•0.5 (the density-dependent and correction factors). The impact that fishery bycatch had on the population was estimated in two ways: (1) as a rate, using R and F/Nt and (2) the absolute number of albatrosses removed, R•Nt and F (where F = number of albatrosses killed by fisheries, Nt = total number of albatrosses). The mortality rate due to military activities was estimated in the same way.
Additionally, for the black-footed albatross, we evaluated the probability that a given fishery bycatch scenario would exceed the PBR estimation as follows (after Caswell and others, 1998):
P(0.5•0.5•Ri – Mj)≤0, probability that the fishery mortality rate Mj exceeds Ri,
Ri = (λi – 1), maximum population increase rate using λi,Mj = Fj/Nti, fishery mortality, as the quotient between
Fj, the total number of birds killed by fisheries under the scenario j, and Nti, the population size in year t = 2005 using the λi population estimate.
The probability of exceeding Ri was estimated using λi and Nti, with i = 1,…, 100 (estimated previously, see section, “Parameter Estimation”), against increasing fishery bycatch levels for 2005. For this analysis, the population size Nt was estimated as the sum of juveniles and adults (age-classes 1 to +8) for the estimated population size in 2005.

Publishing support provided by the U.S. Geological Survey Publishing Network, Tacoma Publishing Service Center
For more information concerning the research in this report, contact the U. S. Geological Survey Massachusetts Cooperative Fish and Wildlife Research Unit Department of Natural Resources Conservation 160 Holdsworth Way University of Massachusetts Amherst Amherst, MA 01003-9285 [email protected]

Arata and others—Status Assessm
ent of Laysan and Black-Footed Albatrosses, North Pacific Ocean, 1923–2005—
Scientific Investigations Report 2009-5131