step final report - nist
TRANSCRIPT
Planning Report 02-5
Economic Impact A
ssessm
ent
of the In
ternational S
tandard
for the Exc
hange of Product
Model Data (S
TEP) in Transp
ortatio
n
Equipment Industr
ies
Prepared by:
RTI Internatio
nalfor
National In
stitute of
Standards & Tech
nology
Program Office
Strategic
Planning and
Economic
Analysis
Group
December 2
002
U.S Department of CommerceTechnology Administration
December 2002
Economic Impact Assessment of the International Standard for
the Exchange of Product Model Data (STEP) in
Transportation Equipment Industries
Final Report
Prepared for
National Institute of Standards and Technology 100 Bureau Drive
Gaithersburg, MD 20899
Prepared by
Michael P. Gallaher, Ph.D. Alan C. O’Connor, B.A.
RTI Health, Social, and Economics Research
Research Triangle Park, NC 27709
and
Thomas Phelps, Ph.D. Altarum
Ann Arbor, MI
RTI Project Number 07007.016

iii
Contents
Executive Summary ES-1
1. Introduction 1-1
1.1 The Role of Standards in the Exchange of Product Data...... 1-2
1.2 The STEP Development Process......................................... 1-5
1.3 NIST’s Role in the STEP Development and Adoption Process ............................................................................. 1-7
1.3.1 NIST’s Contributions as Infratechnologies............... 1-8
1.4 Industry Scope ................................................................ 1-10
1.4.1 Industries Included in this Study........................... 1-10
1.4.2 Other Industries Using STEP................................. 1-12
1.5 Report Organization........................................................ 1-12
2. Technical History of STEP 2-1
2.1 Introduction to Product Data Exchange and Interoperability.................................................................. 2-1
2.1.1 Overview of Product Data Exchange ...................... 2-2
2.1.2 CAx Interoperability Problems................................ 2-3
2.1.3 Potential Methods for Improving CAx Interoperability ...................................................... 2-5
2.2 Technical History of STEP and NIST’s Role ........................ 2-9
2.2.1 NIST’s Role in the STEP Development Process...... 2-10
3. Current STEP Development and Implementation 3-1
3.1 Current Trends in the Development and Implementation of STEP..................................................... 3-1
3.1.1 Most Widely Implemented STEP APs...................... 3-1
3.1.2 Approved STEP APs ............................................... 3-4
iv
3.1.3 STEP APs Under Development ............................... 3-4
3.1.4 Infrastructure Tools to Support STEP Development and Adoption................................... 3-5
3.2 Barriers to Development and Adoption of STEP.................. 3-6
3.2.1 Evolving Structure of CAx Markets.......................... 3-7
3.2.2 Shift in STEP’s Support Structure............................. 3-8
3.2.3 Implementation by Software Developers .............. 3-10
3.2.4 Adoption and Use of STEP by End Users .............. 3-13
4. STEP End Users 4-1
4.1 The Automotive Industry ................................................... 4-1
4.1.1 The Automotive Design and Development Process.................................................................. 4-2
4.1.2 The U.S. Automotive Supply Chain ........................ 4-6
4.2 Aerospace Industry.......................................................... 4-11
4.2.1 Aerospace Design and Development.................... 4-12
4.2.2 The Role of CAx Systems in the Aerospace Industry ............................................................... 4-15
4.2.3 The Aerospace Industry Supply Chain .................. 4-16
4.3 Shipbuilding Industry ...................................................... 4-22
4.3.1 The Shipbuilding Design and Development Process................................................................ 4-24
4.3.2 CAx Systems in the Shipbuilding Design and Development Process .......................................... 4-27
4.3.3 Organization of the Shipbuilding Supply Chain .... 4-28
5. Analysis Methodology 5-1
5.1 Conceptual Approach for Estimating Economic Impacts ............................................................................. 5-1
5.1.1 Net Benefits from STEP .......................................... 5-1
5.1.2 NIST’s Contributions.............................................. 5-4
5.2 Technical and Economic Impact Metrics............................ 5-6
5.2.1 Metrics for Measuring the Benefits and Costs of STEP...................................................................... 5-7
5.2.2 Metrics for Estimating NIST’s Impacts ................... 5-11
5.3 Calculating Measures of Social Return ............................. 5-14
v
6. Primary Data Collection 6-1
6.1 End-User Interviews .......................................................... 6-1
6.1.1 Case Study and Survey Topics................................ 6-3
6.1.2 Case Study and Survey Respondents....................... 6-4
6.2 Software Developer Interviews .......................................... 6-4
6.2.1 Software Developer Survey Topics ......................... 6-5
6.2.2 Software Developer Respondents ........................... 6-7
7. Current Use and Future Directions for STEP 7-1
7.1 STEP’s Current Use............................................................ 7-1
7.1.1 Automotive Industry .............................................. 7-1
7.1.2 Aerospace Industry ................................................ 7-3
7.1.3 Shipbuilding Industry............................................. 7-4
7.1.4 Small-Company Issues ........................................... 7-5
7.2 STEP’s Potential Use.......................................................... 7-5
7.2.1 Automotive Industry .............................................. 7-6
7.2.2 Aerospace Industry ................................................ 7-8
7.2.3 Shipbuilding Industry............................................. 7-9
7.2.4 Small-Company Issues ........................................... 7-9
7.3 Future Product Data Exchange Needs .............................. 7-10
7.3.1 Automotive Industry ............................................ 7-10
7.3.2 Aerospace Industry .............................................. 7-11
7.3.3 Shipbuilding Industry........................................... 7-11
8. The Potential and Current Economic Impact of STEP 8-1
8.1 Industry Employment and Wages....................................... 8-1
8.1.1 Industry Employment ............................................. 8-1
8.1.2 Industry Wage Estimates ........................................ 8-4
8.2 End-User CAx Interoperability Benefits .............................. 8-6
8.2.1 End-User Avoidance Benefits ................................. 8-6
8.2.2 End-User Mitigation Costs .................................... 8-15
8.2.3 End-User Delay Costs .......................................... 8-26
8.3 Social Costs of STEP ........................................................ 8-26
8.3.1 Categories of Social Costs .................................... 8-27
8.3.2 Software Developer Expenditures......................... 8-28

vi
8.3.3 Transportation Equipment Industry Expenditures........................................................ 8-29
8.3.4 Public Sector Expenditures................................... 8-30
8.4 Measures of Economic Return from STEP ......................... 8-31
8.5 Return to NIST Contributions........................................... 8-35
8.5.1 Estimating NIST’s Impact...................................... 8-37
8.6 Summary of Impacts........................................................ 8-38
References R-1
Appendixes
A Telephone Survey..............................................................A-1
B Software Developer Survey................................................ B-1
vii
Figures
Figure 1-1 Alternative Data Exchange Scenarios.......................................... 1-4
Figure 1-2 Infratechnologies’ Impacts on Economic Activity ........................ 1-9
Figure 2-1 Multiple CAx Systems Used in the Automobile Supply Chain...... 2-3
Figure 4-1 The Automobile Design and Development Process..................... 4-4
Figure 4-2 U.S. Automotive Supply Chain ................................................... 4-8
Figure 4-3 Aerospace Design and Manufacturing Schedule ....................... 4-13
Figure 4-4 Ship Types ............................................................................... 4-24
Figure 4-5 Ship Design Spiral.................................................................... 4-26
Figure 5-1 Flow of Costs and Benefits ......................................................... 5-4
Figure 5-2 Impact of NIST’s Contribution to STEP........................................ 5-5
Figure 6-1 STEP Estimation Methodology .................................................... 6-2
Figure 8-1 Growth in Major CAx Software Packages with STEP Functionality............................................................................ 8-28
Figure 8-2 Estimated Accrual of Potential Benefits (1994 though 2010)...... 8-34

viii
Tables
Table 1-1 Comparison of Data Exchange Scenarios.................................... 1-5
Table 3-1 Status of STEP Application Protocols as of November 2002......... 3-2
Table 4-1 Employment in the Automotive Industry, 2001 ........................... 4-6
Table 4-2 Major OEMs Operating in the U.S. ............................................. 4-9
Table 4-3 Characteristics of a Sample of Automotive First-Tier Suppliers.................................................................................. 4-11
Table 4-4 Aerospace Product Categories .................................................. 4-12
Table 4-5 Aerospace Original Equipment Manufacturers (OEMs).............. 4-18
Table 4-6 Sampling of Aerospace Industry Suppliers................................. 4-20
Table 4-7 U.S. Shipbuilding Companies................................................... 4-29
Table 4-8 Sampling of the U.S. Shipbuilding Subcontractors..................... 4-32
Table 5-1 Impact Metrics for Users ............................................................ 5-9
Table 5-2 The Components of STEP’s Social Cost ..................................... 5-10
Table 5-3 Summary of NIST’s Contributions to STEP................................. 5-13
Table 5-4 NIST’s Impact .......................................................................... 5-14
Table 6-1 Summary of Survey Respondents................................................ 6-5
Table 6-2 NIST Impact Categories Included in the Survey Instrument.......... 6-6
Table 8-1 Industry Employment and Survey Coverage Ratios ...................... 8-3
Table 8-2 Loaded Hourly Wage for Designers and Associated Support Staffers....................................................................................... 8-5
Table 8-3 Summary of Potential Avoidance Benefits, 2001......................... 8-7
Table 8-4 Potential Redundant CAx Systems Benefits, 2001........................ 8-8
ix
Table 8-5 Potential Benefits from Avoided Productivity Loss on Redundant CAx Systems, 2001................................................. 8-12
Table 8-6 Potential Benefits on Redundant CAx Training, 2001 ................ 8-13
Table 8-7 Sample Change in IT Staffing Associated with Redundant Systems, 2001.......................................................................... 8-14
Table 8-8 Potential Redundant CAx IT Support Staff Benefits, 2001 .......... 8-16
Table 8-9 Summary of Potential Mitigation Benefits, 2001........................ 8-18
Table 8-10 Estimated Annual Number of Manual Reentry Jobs, 2001 ......... 8-19
Table 8-11 Potential Labor Savings from Less Manual Reentry, 2001 .......... 8-20
Table 8-12 Estimated Volume of Neutral Format File Transfers, 2001 ......... 8-23
Table 8-13 Potential Benefits from Employing STEP for Neutral-Format File Transfer, 2001 ................................................................... 8-25
Table 8-14 Time Series of Software Developers Expenditures (1987 through 2001).......................................................................... 8-30
Table 8-15 Time Series of Industry Expenditures (1987 through 2001) ........ 8-31
Table 8-16 Time Series of Public Sector Expenditures (1987 through 2001)....................................................................................... 8-32
Table 8-17 Time Series of STEP Benefits and Social Costs, Assuming 75 Percent STEP Penetration Rate in 2010 ..................................... 8-35
Table 8-18 Software Developers’ Impressions ............................................ 8-37
Table 8-19 Time Series of NIST Expenditures and Acceleration Benefits...... 8-39
Table 8-20 Potential Annual Benefits of STEP for CAx Applications (millions 2001$)....................................................................... 8-40
Table 8-21 Measures of Economic Return .................................................. 8-40
x
List of Acronyms
AIAG Automotive Industry Action Group
ANSI American National Standards Institute
AP Application Protocol
ARM Application Reference Model
ASA American Shipbuilding Association
BLS Bureau of Labor Statistics
CAD Computer-aided design
CAE Computer-aided engineering
CAM Computer-aided manufacturing
CAx A collective term that refers to CAD, CAM, CAE, and PDM
CV Computervision
DoD U.S. Departments of Defense
ERIM Environmental Research Institute of Michigan
EXPRESS An object-flavored information modeling language that has been standardized as an ISO language
GPDM Generic Product Data Model
IGES Initial Graphics Exchange Specification
IPIM Integrated Product Information Model
ISE Integrated Shipbuilding Environment
ISO International Organization for Standards
IT Information technology
MEL Mechanical Engineering Lab
MFG Manufacturing Feasibility Group

xi
NASA National Aeronautics and Space Administration
NIST National Institute of Standards and Technology
NPV Net present value
NVH Noise-vibration-harshness
OEM Original equipment manufacturer
OMB Office of Management and Budget
PDES Product Data Exchange Specification
PDM Product data management
RTI Research Triangle Institute
STEP Standard for Exchange of Product model data
TDP Technical data package
U.S. Pro U.S. Product Data Association
UG Unigraphics


ES-1
Executive Summary
The Standard for Exchange of Product model data (STEP) is an international standard designed to address interoperability problems encountered in the exchange of digital product information. STEP is a suite of standards enabling manufacturing companies to exchange digital representations of engineering and manufacturing data. The first 12 parts of STEP were formally approved as international standards in January 1995. Since then, an additional 18 parts have become international standards. Over 20 more are nearing international standard status, with many more in earlier development stages.
The National Institute of Standards and Technology (NIST) has made significant contributions to STEP, beginning in the mid 1980s and continuing today. NIST has contributed to the development of the STEP standard, the integration of STEP functionality into applications, and the adoption of STEP functionality by end users. NIST also participated in several public-private partnerships involving demonstrations and development projects with software developers, industry, and other federal agencies. Many of these initiatives were designed to demonstrate STEP’s economic advantages relative to defender technologies and promote its deployment.
The objective of this study is to conduct an economic impact assessment of STEP’s use by transportation equipment industries, namely the automotive, aerospace, shipbuilding, and specialty tool and die industries. Both the full potential and current realized benefits are quantified. In addition, the study investigates the impact of NIST’s administrative and technical contributions to STEP.
STEP has the potential to save $928 million (2001$) per year by reducing interoperability problems in the automotive, aerospace, and shipbuilding industries alone. Many other industries could achieve similar savings.
Economic Impact Assessment of the International Standard for the Exchange of Product Model Data (STEP) in Transportation Equipment Industries
ES-2
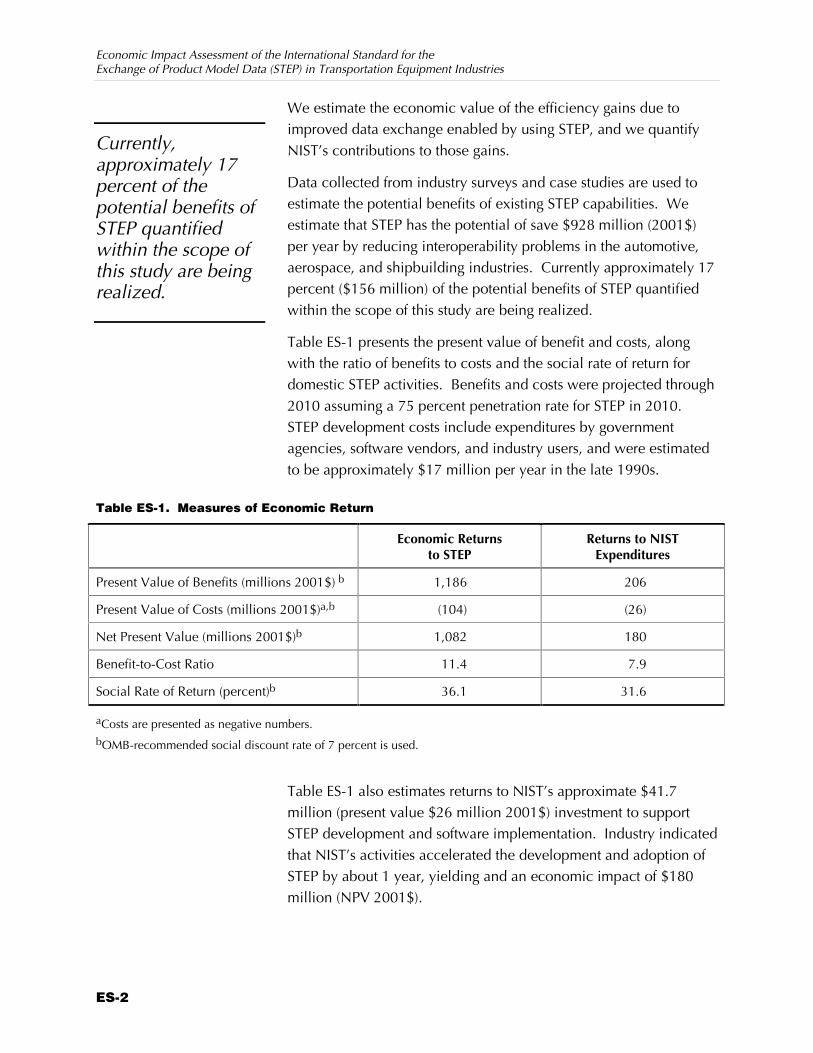
We estimate the economic value of the efficiency gains due to improved data exchange enabled by using STEP, and we quantify NIST’s contributions to those gains.
Data collected from industry surveys and case studies are used to estimate the potential benefits of existing STEP capabilities. We estimate that STEP has the potential of save $928 million (2001$) per year by reducing interoperability problems in the automotive, aerospace, and shipbuilding industries. Currently approximately 17 percent ($156 million) of the potential benefits of STEP quantified within the scope of this study are being realized.
Table ES-1 presents the present value of benefit and costs, along with the ratio of benefits to costs and the social rate of return for domestic STEP activities. Benefits and costs were projected through 2010 assuming a 75 percent penetration rate for STEP in 2010. STEP development costs include expenditures by government agencies, software vendors, and industry users, and were estimated to be approximately $17 million per year in the late 1990s.
Table ES-1. Measures of Economic Return
Economic Returns
to STEP Returns to NIST
Expenditures
Present Value of Benefits (millions 2001$) b 1,186 206
Present Value of Costs (millions 2001$)a,b (104) (26)
Net Present Value (millions 2001$)b 1,082 180
Benefit-to-Cost Ratio 11.4 7.9
Social Rate of Return (percent)b 36.1 31.6
aCosts are presented as negative numbers. bOMB-recommended social discount rate of 7 percent is used.
Table ES-1 also estimates returns to NIST’s approximate $41.7 million (present value $26 million 2001$) investment to support STEP development and software implementation. Industry indicated that NIST’s activities accelerated the development and adoption of STEP by about 1 year, yielding and an economic impact of $180 million (NPV 2001$).
Currently, approximately 17 percent of the potential benefits of STEP quantified within the scope of this study are being realized.

Executive Summary
ES-3
ES.1 BENEFITS FROM STEP Benefits accrue to end users through increased interoperability of computer-aided design, engineering, and manufacturing and product data management systems (collectively referred to as CAx in this study) used in the product design supply chain. These benefits can be generally categorized as
Z decreased avoidance costs,
Z decreased mitigation costs, and
Z decreased delay costs (RTI, 1999).
The primary economic benefits are realized by end users of these systems in the automotive, aerospace, and shipbuilding industries. However, for these benefits to be realized by end users, resources must be invested to make STEP functionality available. These resource investments include
Z government sector involvement in the standards development process and demonstration of STEP;
Z software developers’ costs associated with the standards development and demonstration (referred to as R&D); and expenditures to integrate STEP functionality into commercial products; and
Z end users’ costs associated with the standards development, demonstration, and implementation of STEP.
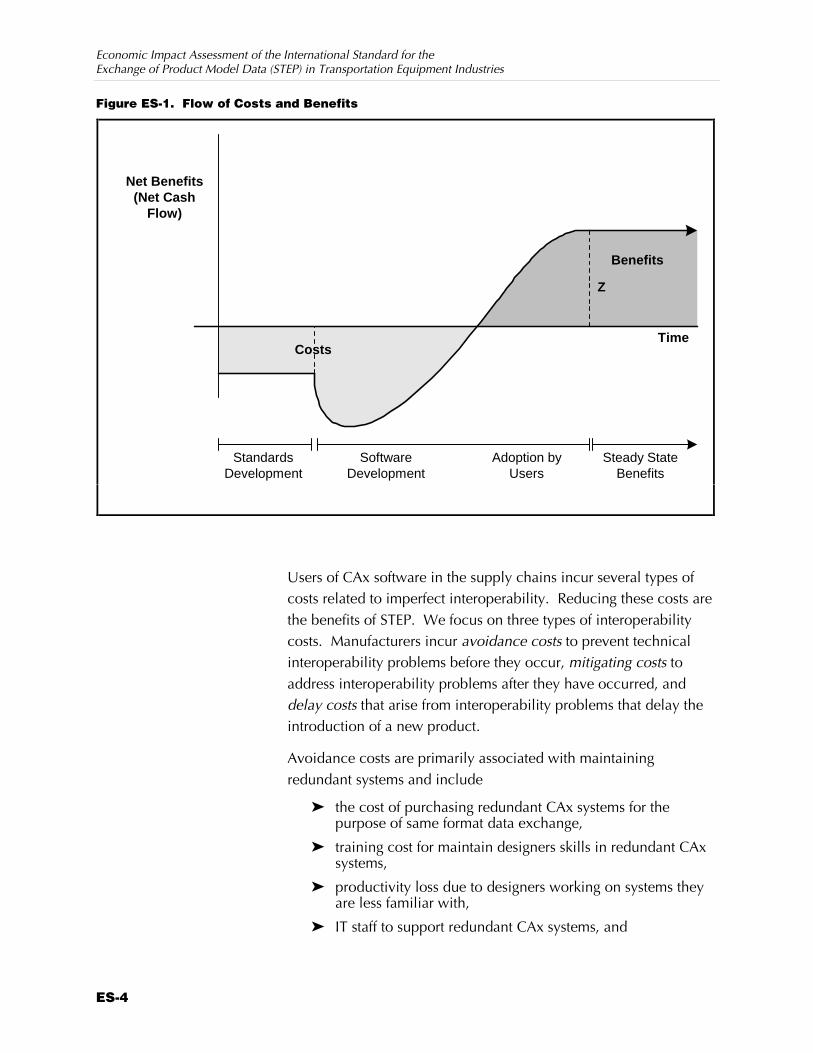
Benefits and costs actually occur as flows over time. Figure ES-1 illustrates the net benefits (benefits less costs) over time. The curve in Figure ES-1 represents the total change in economic welfare for all entities over the life-cycle a particular STEP functionality or application protocol. The costs of standards development, infrastructure tools, and software development are shown occurring early in the life-cycle of STEP functionality. Once commercial products are available with STEP functionality, aggregate manufacturers’ benefits increase as adoption occurs until the CAx markets are saturated.1 “Steady state” benefits (Z) continue to accrue until the STEP functionality incorporated with the software becomes obsolete.
1In our context, net benefits to manufacturers include decreased interoperability
expenditures less employee training costs. The cost of software purchases are not included because they have been netted out of the economic welfare by increased revenue for software developers.
Economic Impact Assessment of the International Standard for the Exchange of Product Model Data (STEP) in Transportation Equipment Industries
ES-4
Figure ES-1. Flow of Costs and Benefits
Time
StandardsDevelopment
Z
SoftwareDevelopment
Steady StateBenefits
Net Benefits(Net Cash
Flow)
Benefits
Costs
Adoption byUsers
Users of CAx software in the supply chains incur several types of costs related to imperfect interoperability. Reducing these costs are the benefits of STEP. We focus on three types of interoperability costs. Manufacturers incur avoidance costs to prevent technical interoperability problems before they occur, mitigating costs to address interoperability problems after they have occurred, and delay costs that arise from interoperability problems that delay the introduction of a new product.
Avoidance costs are primarily associated with maintaining redundant systems and include
Z the cost of purchasing redundant CAx systems for the purpose of same format data exchange,
Z training cost for maintain designers skills in redundant CAx systems,
Z productivity loss due to designers working on systems they are less familiar with,
Z IT staff to support redundant CAx systems, and
Executive Summary
ES-5
Z outsourcing costs incurred when outside companies are hired to provide data exchange services.
Mitigating costs include
Z the cost of reworking models are part of the transfer process, and
Z the cost of manually reentering data when methods of data exchange are unavailable or unsatisfactory.
Delay costs include
Z profits lost due to decline in market share caused by delays, and
Z profits lost due to delay of revenues (discounts on the value of future profits).
Interoperability problems in manufacturing industries affect society’s economic welfare in two ways: by increasing the cost of designing and producing final products and by delaying the introduction of new improved final products. An increase in the cost of designing and producing a new automobile or aircraft may lead to an increase in the equilibrium price of their respective markets. However, for the purpose of this study we measure all benefits of STEP at the manufacturers’ level of the supply chain in terms of decreased production costs and accelerated new product entry. We do not attempt to partition these impacts into producer and consumer surplus.
ES.2 SOCIAL COSTS OF STEP Participants throughout the supply chain contributed to the development, demonstration, and implementation of STEP. The social costs are mostly the staff time contributed to standards development, software development, and adoption by end users. These costs include labor hours, overhead, and dues and fees paid into industry standards bodies. From 1987 to 2001, society has incurred $198.4 million (2001$) in expenditures in STEP development.
Public Sector Expenditures are segmented into NIST expenditures and non-NIST public expenditures, including defense-related funding. Using information supplied by NIST, we explicitly quantify all NIST expenditures on STEP-related activities. These include contributions to the standards development process, software tools, and testing services ($62.6 million).
Economic Impact Assessment of the International Standard for the Exchange of Product Model Data (STEP) in Transportation Equipment Industries
ES-6
Software developers’ expenditures related to STEP include expenditures on the three standards and tools development categories, plus expenditures for implementing STEP functionality into their CAx products. During the telephone interviews with software developers, we asked them to estimate the resources they invested in the standards development process, as well as their expenditures for integrating STEP into their products ($54.3 million).
Users of CAx software have also been integrally involved in the STEP development process. For example, many manufacturers have participated in standards development and demonstration pilot programs ($81.5 million).
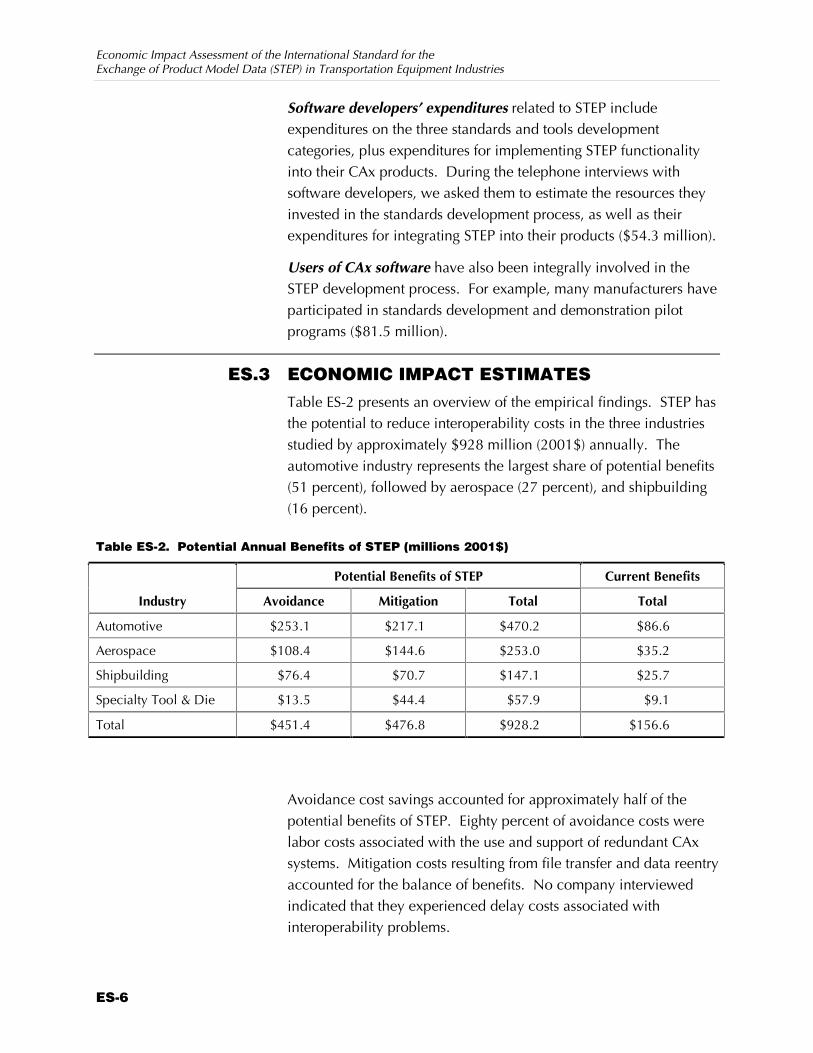
ES.3 ECONOMIC IMPACT ESTIMATES Table ES-2 presents an overview of the empirical findings. STEP has the potential to reduce interoperability costs in the three industries studied by approximately $928 million (2001$) annually. The automotive industry represents the largest share of potential benefits (51 percent), followed by aerospace (27 percent), and shipbuilding (16 percent).
Table ES-2. Potential Annual Benefits of STEP (millions 2001$)
Potential Benefits of STEP Current Benefits
Industry Avoidance Mitigation Total Total
Automotive $253.1 $217.1 $470.2 $86.6
Aerospace $108.4 $144.6 $253.0 $35.2
Shipbuilding $76.4 $70.7 $147.1 $25.7
Specialty Tool & Die $13.5 $44.4 $57.9 $9.1
Total $451.4 $476.8 $928.2 $156.6
Avoidance cost savings accounted for approximately half of the potential benefits of STEP. Eighty percent of avoidance costs were labor costs associated with the use and support of redundant CAx systems. Mitigation costs resulting from file transfer and data reentry accounted for the balance of benefits. No company interviewed indicated that they experienced delay costs associated with interoperability problems.
Executive Summary
ES-7
The current benefits resulting from STEP use in 2001 are estimated to be approximately $156 million. Realized benefits represent approximately 17 percent of STEP’s estimated potential, with most current benefits again realized by the automotive industry.
Although this analysis estimates that the potential annual benefit, based on 2001 data, of STEP is $928 million for these industries, it is unlikely that STEP will experience full adoption within a short time frame.
To calculate measures of return, which are presented in Section 8, the STEP penetration rate is assumed to be 75 percent in 2010. This yields a projected annual benefit of STEP of about 697 million (2001$) in 2010. STEP penetration therefore moves from 0 percent in 1994 to 17 percent in 2001 to 75 percent in 2010. Forecasting STEP’s rate of diffusion is difficult because it is in the early stages of adoption. Its diffusion is a function of the number of current adopters, the number of potential adopters, and the rate at which information and knowledge pass from one agent to another. Anecdotal evidence collected during the surveys and case studies indicates that a 75 percent penetration rate is a reasonable expectation for 2010.
STEP has the potential to reduce CAx interoperability costs in the three industries studied by approximately $928 million (2001$) annually. STEP development costs, were estimated to be approximately $17 million per year during the mid to late 1990s.


1-1
1 Introduction
Interoperability problems in the exchange of electronic product data represent a significant impediment to data exchange, as well as a source of economic inefficiency. For example, RTI (1999) estimated that interoperability problems in the product development stage alone cost the U.S. automotive industry approximately $1 billion annually. These costs are primarily due to supporting multiple computer-aided design (CAD)/computer-aided manufacturing (CAM) systems and correcting errors in product data exchange. The Environmental Research Institute of Michigan (ERIM, now called Altarum) (1997) found that by reducing the number of redundant CAD/CAM systems, design costs could be reduced by approximately $500,000 per year in each of the automotive companies studied. This reduction represented annual savings of approximately $52,000 per employee in the companies’ design and engineering departments. (Together, CAD, CAM, computer-aided engineering [CAE], and Product Data Management [PDM] systems are referred to as “CAx.”)
The Standard for Exchange of Product model data (STEP) is an international standard designed to address interoperability problems encountered in the exchange of digital information. STEP is a suite of standards enabling manufacturing companies to exchange digital representations of engineering and manufacturing data. Such representations are known as product models, and the digital information they are composed of is known as product model data. Each CAx system—and there are many—has its own format for storing and writing data, making it nearly impossible for organizations using different systems to communicate product model data without translation. STEP is a robust neutral file format

Economic Impact Assessment of the International Standard for the Exchange of Product Model Data (STEP) in Transportation Equipment Industries
1-2
that has been developed by a global consortium of standards bodies, governments, and private firms. The first 12 parts of STEP were formally approved as international standards in January 1995. Since then, approximately 18 additional parts have become international standards. Over 20 additional parts are nearing international standard status, with many more in earlier development stages. Each part of STEP corresponds to a specific capability, such as sheet metal design or ship molded forms.
The National Institute of Standards and Technology (NIST) has made significant contributions to STEP beginning in 1984 and continuing today. NIST has contributed to the development of the STEP standard, the integration of STEP functionality into applications, and the adoption of STEP functionality by end users.
The objective of this study is to conduct an economic impact assessment of STEP in the automotive, aerospace, and shipbuilding industries. In addition, we also estimate the economic impact STEP has on the specialty tool and die industry that supplies them. Both the full potential and current realized benefits are quantified. In addition, the study investigates the impact of NIST’s administrative and technical contributions to STEP. We estimate the economic value of the efficiency gains due to data exchange enabled by using STEP, and we quantify NIST’s contributions to those gains. This analysis scope is limited to STEP’s potential for the automotive, aerospace, and shipbuilding industries because the majority of currently existing STEP APs were developed in response to needs in these industries. However, STEP has the potential to reduce interoperability costs in a wide range of industries.
This introduction provides background on the general role of standards in the exchange of electronic product data and describes how STEP fits into this typology. We then describe NIST’s contributions to STEP in terms of infratechnologies in the economy. We conclude the section by providing an overview of the industry scope included in the analysis and organization of the report.
1.1 THE ROLE OF STANDARDS IN THE EXCHANGE OF PRODUCT DATA Standards in the information economy have become increasingly important as more complex information is electronically transferred

Section 1 — Introduction
1-3
between users. The desire by organizations to increase the interoperability, scalability, and extensibility of their operations has highlighted the need to develop standards that will support the quality and flexibility of interorganization and intraorganization transactions.
Standards frequently enable features or functionalities of individual products that they support. For example, STEP is a standard that supports the information exchange of three-dimensional solids and a variety of other technical information in CAx software. In this way, standards can be considered separately from the products they support. In addition, it is often useful to refer to a group of standards as a single technology or feature, even though a specific functionality is commonly represented as a suite of interrelated standards.
In the discrete parts manufacturing industry, organizations need standards mainly because suppliers and demanders continually exchange electronic product data as part of the design and manufacturing processes. To facilitate the exchange of information, a common format is extremely efficient. Common formats increase the efficiency and flexibility of data exchange and data management activities.
Standards are often defined with respect to their origin. They can emerge from any one of three standard setting groups within society:
Z Competition standards emerge naturally from a market when leading suppliers or demanders are able to dictate the protocols used in electronic data transfer.
Z Committee standards emerge from national or international organizations (e.g., trade associations, consortia, or the ISO), which provide the dimensions for the product. Committee standards emerge from discussions within the group setting the standard.
Z Government standards are set by decree. However, they typically, if not always, incorporate advice and information from interested parties including industry groups.
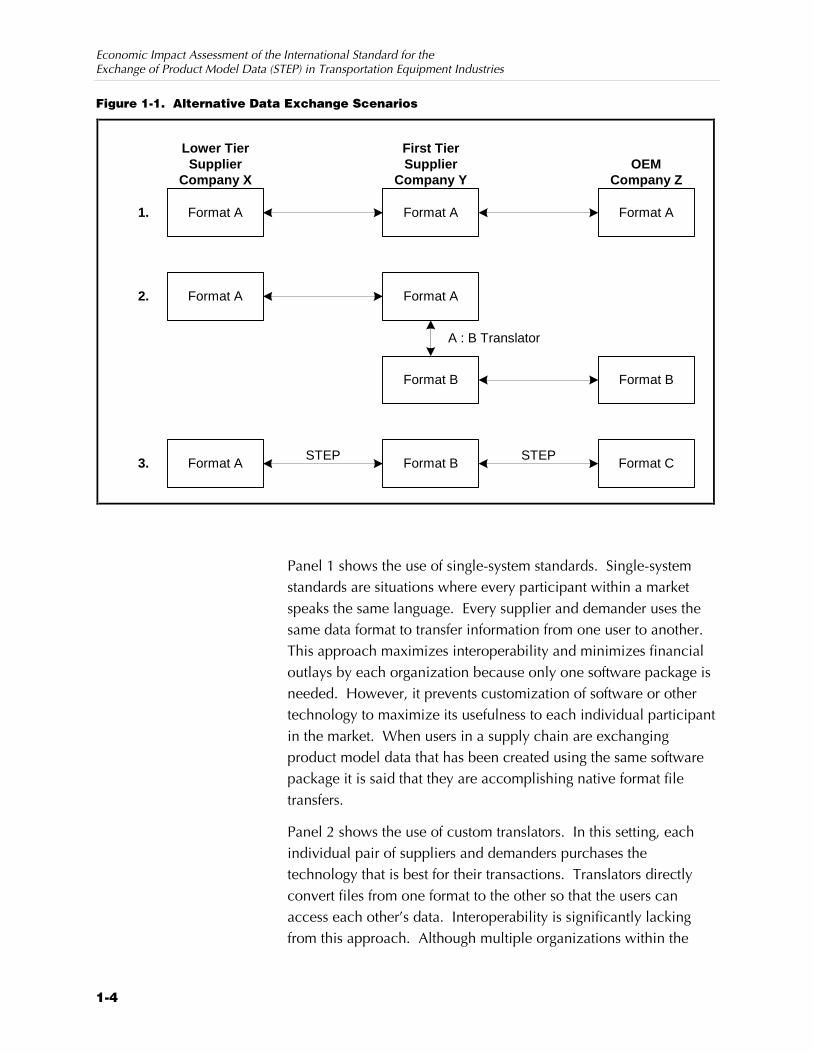
Standards for electronic data used to manage and control the flow of information generated in computer-aided manufacturing can be grouped into three categories. Figure 1-1 presents these data exchange scenarios.
Economic Impact Assessment of the International Standard for the Exchange of Product Model Data (STEP) in Transportation Equipment Industries
1-4
Figure 1-1. Alternative Data Exchange Scenarios
Format A Format A Format A
Format A Format A
Format B Format B
Format A Format B Format C
1.
2.
3.
Lower TierSupplier
Company X
First TierSupplier
Company YOEM
Company Z
STEP STEP
A : B Translator
Panel 1 shows the use of single-system standards. Single-system standards are situations where every participant within a market speaks the same language. Every supplier and demander uses the same data format to transfer information from one user to another. This approach maximizes interoperability and minimizes financial outlays by each organization because only one software package is needed. However, it prevents customization of software or other technology to maximize its usefulness to each individual participant in the market. When users in a supply chain are exchanging product model data that has been created using the same software package it is said that they are accomplishing native format file transfers.
Panel 2 shows the use of custom translators. In this setting, each individual pair of suppliers and demanders purchases the technology that is best for their transactions. Translators directly convert files from one format to the other so that the users can access each other’s data. Interoperability is significantly lacking from this approach. Although multiple organizations within the

Section 1 — Introduction
1-5
same industry may use the same software, there is no reason to expect that all will. In addition, each organization may customize their software based on their particular production function. If a supplier wants to interact with more than one customer, it must buy and install a completely different CAx package.
The third approach to transferring data, Panel 3, is the use of neutral format exchange. This is the basis of STEP. Each organization can pick the software that most efficiently manages and controls the intraorganization or intradivision flow of information. When the organization conducts an interorganization or interdivision exchange, it first translates the data into a neutral format that is accessible to all software applications. This approach maximizes interoperability across and within organizations. However, the software development costs increase because a translating package is added to or incorporated into the software. Table 1-1 summarizes the tradeoff between the three schemes in terms of interoperability, capital investment, and flexibility.
Table 1-1. Comparison of Data Exchange Scenarios
Interoperability Financial Outlays Flexibility
Single System High Low Low
Custom Translators High High Low
Neutral Format Exchange Medium Low High
1.2 THE STEP DEVELOPMENT PROCESS Development of the suite of STEP standards began in 1983. STEP was developed as the next generation standard to replace the Initial Graphics Exchange Specification (IGES), which was the dominant neutral format translator of the time. A major shortcoming of IGES was that it was conceived as a mechanism for conveying two-dimensional engineering information and therefore was limited in its ability to transmit data for three-dimensional solids. In addition, because of ambiguities in IGES definitions, many software vendors introduced different embodiments of IGES, creating interoperability problems.

Economic Impact Assessment of the International Standard for the Exchange of Product Model Data (STEP) in Transportation Equipment Industries
1-6
The purpose of STEP is to allow for clear exchange of software engineering data among the wide variety of software systems in existence and to broaden the scope of the types of engineering data that can be translated. STEP offers the following advantages:
Z neutral data exchange between dissimilar systems, both in-house and with suppliers and customers;
Z long-term archiving (due to STEP’s system-independent architecture);
Z flexible migration policies;
Z paperless product definition;
Z enterprise integration via neutral product database;
Z life-cycle maintenance support;
Z concurrent or collaborative engineering; and
Z worldwide networking communication of product data in open systems (Industry Canada, 2000).
STEP is a suite of standards enabling manufacturing companies to exchange digital representations of engineering and manufacturing data. The International Organization for Standardization (ISO) has approved as international standards a number of STEP Application Protocols (APs). APs are the formal definition of the capabilities to be implemented by software developers in their systems for data exchange purposes. Each AP defines the specific content and how that content should be structured to fit the underlying STEP structure. Because they define exchangeable content, APs are the primary parts of STEP that both the software developer and the end user care about. The following is a sample of APs relevant to transportation equipment manufacturing that have been approved as international standards and are fully available for use by software system implementers. This list is not exhaustive; a comprehensive list of STEP APs can be found in Table 3-1. (Note: the last three digits of the ISO number are the AP numbers):
Z ISO 10303-201: Explicit draughting1
Z ISO 10303-202: Associative draughting
Z ISO 10303-203: Configuration controlled design
Z ISO 10303-207: Sheet metal die planning and design
1ISO standards use the traditional English spelling for all terms rather than the U.S.
English spelling (e.g., draughting rather than drafting).

Section 1 — Introduction
1-7
Z ISO 10303-210: Electronic assembly, interconnection, and packaging design
Z ISO 10303-212: Electrotechnical design and installation
Z ISO 10303-224: Mechanical parts definition for production planning using machining features
Z ISO 10303-225: Building elements using explicit shape representation
To benefit from STEP functionality, users of CAx systems must have software capable of translating files in their proprietary formats into the neutral format created by STEP and out of that format into their unique system formats. Leading manufacturers of CAx systems are adapting their products to work with STEP. A wide variety of STEP software tools and translators are now available for commercial use.
STEP has application in a broad range of industries, including, shipbuilding, electronics, process plants, construction, and software. However, the aerospace and automobile industries have been affected most significantly due to Application Protocol 203 (AP203) of the STEP standard. This standard allows for the translation of three-dimensional design data for mechanical parts and assemblies. In addition, the U.S. government plays a major role by using STEP within Department of Defense weaponry and NASA engineering.
1.3 NIST’S ROLE IN THE STEP DEVELOPMENT AND ADOPTION PROCESS NIST has been involved in the development of STEP since 1984. NIST’s contributions fall into four general categories:
Z administrative support of TC184/SC4,
Z technical contributions to the development and testing of STEP standards,
Z development of STEP-specific software tools, and
Z implementation of a STEP testing service.
NIST’s Manufacturing Systems Integration Division served as the home of the secretariat for ISO SC4 until 1999. NIST’s administrative role was primarily to set up standard meetings, distribute standard documents for review, administer official ballots, and facilitate industry and government interactions. NIST also maintained the SC4 On-Line Information Service (SOLIS), an electronic library of all SC4 working documents and standards.
NIST’s technical contributions focused on development of experimental STEP applications used in establishing initial STEP standards.

Economic Impact Assessment of the International Standard for the Exchange of Product Model Data (STEP) in Transportation Equipment Industries
1-8
In addition to NIST’s coordination role, its technical staff also served as regular members of STEP technical working groups. NIST’s technical contributions focused on developing STEP applications used in establishing initial STEP standards. NIST staff also served on PDES, Inc., where they worked full time on developing STEP standards.
Software supporting STEP was not widely available until the mid-1990s. NIST helped develop the EXPRESS language to meet the specifications of processing formal information models. NIST was one of the first organizations to undertake the development of software that could process EXPRESS-based information models. More significantly, the code NIST furnished was placed in the public domain, thus allowing companies to modify the code to their specific needs. NIST added several modules to its original EXPRESS tools to deliver a suite of tools that many companies adopted for various purposes. Other software contributions included EXPRESS tools and the STEP Data Probe.
NIST staff members also made significant contributions to testing services to support STEP implementations. These efforts include developing methods to validate that the standards cover the desired range of engineering data requirements, developing the test suites associated with STEP parts, analyzing the characteristics of pilot implementations, and facilitating STEP certification services. More information on NIST’s involvement in STEP is presented in Section 2 of this report.
1.3.1 NIST’s Contributions as Infratechnologies
NIST’s contributions to the standards development process and tools, such as its contributions to STEP, can be viewed in a broader perspective: the contribution to the development and promulgation of infratechnologies. Infratechnologies are technical tools, including scientific and engineering data, measurement and test methods, and practices and techniques that are widely used in industry (Tassey, 1997). STEP and supporting software and testing tools can be called infratechnologies because they represent a technique that has broad application in a number of industries. Figure 1-2 illustrates STEP functionalities as an infratechnology and demonstrates the important role that infratechnologies play in several stages of the economy:

Section 1 — Introduction
1-9
Figure 1-2. Infratechnologies’ Impacts on Economic Activity Infratechnologies can improve the efficiency of each stage of production.
Technical StandardsContributions
Software Tools Testing Tools
R&D Production Marketing
Infratechnologies
Source: Adapted from Tassey (1997), p. 158.
Z Infratechnologies improve the efficiency of R&D. The use of STEP functionalities can reduce interoperability costs of discrete parts manufacturers and reduce product design time, thus accelerating the time to market.
Z Infratechnologies support the production process and can enhance product characteristics. The use of STEP functionalities in the design process can generate higher quality products and lower production costs by decreasing design errors and using concurrent engineering more efficiently.
Z Infratechnologies promote technology adoption and reduce marketing costs. The recognition of STEP as an international standard and the development of testing tools accelerate the use of STEP functionalities throughout the industry supply chain.
To varying degrees, infratechnologies have the characteristics of a public good. Such goods, unlike private goods, are characterized by consumption nonrivalry and by high costs of exclusion. Rationing such goods is undesirable because the consumption of a public good does not impose costs on society; it does not reduce the amount of the good available to others. Further, the costs of excluding those who do not pay for the infratechnologies are likely to be high because they are typically embodied in products and processes (techniques), rather than in products that can be sold. As a result of these characteristics, public goods are typically
Economic Impact Assessment of the International Standard for the Exchange of Product Model Data (STEP) in Transportation Equipment Industries
1-10
underprovided by private markets as compared to their socially optimal levels of provision (Stiglitz, 1988). The private sector might also underinvest in infratechnologies because their technology base is different from the core technology that industry draws on to develop its product or processes (Tassey, 1997).
NIST responds to market failures in the provision of infratechnologies by investing public funds in infratechnologies when private funding is inadequate to meet important strategic technical goals. The NIST Manufacturing Engineering Laboratory’s (MEL’s) development of publicly available software tools to support the implementation of STEP functionality is an example of a group of technologies/tools that private-sector software developers were underproviding. Testing tools to objectively demonstrate the correct implementation of the STEP standard is also a good example of infratechnologies. In many instances, software developers have disincentives to provide these tools.
1.4 INDUSTRY SCOPE Product data exchange is common in almost all discrete parts manufacturing industries. But as the complexity of the design stages, production processes, and final products increase within integrated supply chains, the potential for interoperability problems increases as well. The three largest transportation equipment industries—automotive, aerospace, and shipbuilding—are among those most significantly affected by interoperability problems of product data exchange. Consequently, these mature industries have been particularly active in the development of STEP APs that address particular data exchange issues.
1.4.1 Industries Included in this Study
Our scope is limited to the automotive, aerospace, and shipbuilding industries because these industries have the most widespread use of STEP technologies and consequently may reap the greatest benefits. We also estimate the impact for specialty tool and die firms that supply these three industries.
Automotive Industry. The design and production of an automobile require interaction and coordination among many functions and industry participants; STEP facilitates these activities by providing a neutral format through which information is shared. An automobile
Section 1 — Introduction
1-11
consists of a large number of components, parts, and accessories (cars and light trucks typically have roughly 8,000 to 12,000 individual parts) that must function together as an integrated unit. Consequently, the design and development process is also complex, requiring a number of iterations among the design steps for different vehicle components. To further complicate the process, many companies that are part of a complex supply chain typically design and manufacture these components. These companies must coordinate their activities to ensure that the components they design and manufacture are compatible with other components. The diversity of companies in the supply chain is matched by the diversity of CAx systems in use, the STEP neutral format standard helps alleviate interoperability issues that may arise between users of different systems.
Aerospace Industry. Similar to the automotive industry, the aerospace industry is under pressure from clients to produce more reliable and higher quality products at lower cost. Recently, European consortia have gained market share, becoming a sizable force in commercial and scientific aerospace markets that were traditionally American-dominated. Aerospace firms rely on CAx technologies to reduce design and development costs, which in turn makes the industry’s output more price-competitive. As in other transportation equipment industries, suppliers, original equipment manufacturers (OEMs), and tooling suppliers frequently exchange complicated dimensional and structural data that may have been produced via competing CAx technologies. Consequently, the aerospace industry has been very active in developing and implementing STEP.2
Shipbuilding Industry. The final industry included in our analysis is the shipbuilding industry. The U.S. shipbuilding industry has leveraged new federal programs and advanced technologies to rebuild its commercial competitiveness in an era of fewer U.S. Navy contracts for warships. One way for the industry to remain competitive is to increase the range of ship types produced and to reduce the person-hours needed to produce these ships (Hays and McNatt, 1994). CAx systems have cut lead times for design and development, as well as the amount of time and number of
2Note that the aerospace industry has become dominated by one CAD system—
CATIA, which is not exclusive, but dominant.
Economic Impact Assessment of the International Standard for the Exchange of Product Model Data (STEP) in Transportation Equipment Industries
1-12
iterations needed to arrive at a working solution for the design of a new ship. But as in the automotive and aerospace industries, shipbuilding requires neutral format standards to reduce the occurrence of bottlenecks attributable to interoperability complications.
1.4.2 Other Industries Using STEP
Although this analysis quantitatively examines the benefits of STEP for the three largest transportation industries, this industry list itself is by no means comprehensive. Any industry where parts and processes are designed using multiple CAx systems is a potential beneficiary of STEP technologies. STEP application protocols either exist and/or are being developed for the electronics industry and for plant engineering and design. The functionality STEP offers these industries is essentially the same as in the transportation industries: The ability to collaborate on a design in an extended enterprise with multiple technical disciplines. In the case of the electronics industry, product designs include those for semiconductors, subassemblies, packaging, and structures. For plant engineering, STEP can be used to help design physical layout for refineries, manufacturing plants, utilities, and other heavy industrial and commercial manufacturing facilities.
1.5 REPORT ORGANIZATION Section 2 provides a technical discussion of STEP’s capabilities and a history of its development. Current applications and barriers to the implementation and adoption of STEP are presented in Section 3. Industry profiles for the automotive, aerospace, and shipbuilding industries are provided in Section 5. The analysis methodology and data collection plan are presented in Section 6 and Section 7, respectively. Impact estimates and measures of economic return are presented in Section 8.
2-1
Technical History 2 of STEP
CAx interoperability and electronic data exchange complications are felt throughout industries’ supply chains. This section describes existing interoperability and data exchange issues and presents several of the corrective actions that have been undertaken at the firm and industry level. This information provides the background for modeling the economic impact of STEP and for evaluating NIST’s contributions to the development and adoption of this emerging neutral format.1
2.1 INTRODUCTION TO PRODUCT DATA EXCHANGE AND INTEROPERABILITY Prior to the 1800s, product description was typically achieved via tangible physical models. The invention of engineering drawings in the 1800s generated the need for sharing product information within and between companies. Mechanical drawings greatly increased the precision of product descriptions, enabled specialization, and eventually led to outsourcing and modern manufacturing assembly processes.
The development of CAD tools further increased the precision of product description data and enabled manufacturing instructions to be derived directly from CAD drawings. CAD drawings also presented advantages over paper drawings in terms of the ease with which they could be revised and archived. However, along with the sizable productivity benefits CAD systems offered came
1A portion of this section was previously included in Interoperability Cost Analysis
of the U.S. Automotive Supply Chain, prepared for NIST in 1999 by RTI’s Sheila Martin and Smita Brunnermeier.
Suppliers within a supply chain are typically categorized in a tier system. First-tier suppliers supply OEMs directly, second-tier suppliers supply the first tier, and so on. Second- and lower-tier suppliers are often referred to as “subtier suppliers.”
Economic Impact Assessment of the International Standard for the Exchange of Product Model Data (STEP) in Transportation Equipment Industries
2-2
interoperability problems that led to system inefficiencies and limited the potential supply chain savings. This section presents an overview of product data exchange and discusses the concept of interoperability and potential solutions.
2.1.1 Overview of Product Data Exchange
Data from CAx systems are routinely exchanged within and among original equipment manufacturers (OEMs), first-tier suppliers, subtier suppliers, and tooling suppliers. One automotive OEM estimates that as many as 453,000 product data exchanges (PDEs) occur each year within the company and among the company and its suppliers. A second automotive OEM estimates that electronic exchange of CAx data alone occurs at least 7,000 times per month and may be as high as 16,000 transfers per month. This last estimate does not include transfers that take place using physical media such as tape and CD-ROM, nor does it include transfers of data besides CAx data.
Concurrent engineering and design outsourcing are major factors driving the demand for data exchange. The responsibilities for the design of a major automobile, aircraft, or ship are typically distributed among many companies; thus, product data must be shared among a large number of people and organizations, both concurrently and sequentially. This demand implies that CAx interoperability the ability to communicate data between different software systems is essential to the productivity and competitiveness of supplier networks and industry as a whole.
Many different computerized engineering, design and analysis, and manufacturing software and hardware systems are currently used throughout the discrete parts manufacturing supply chain. Not only do these systems differ among companies, but they can also differ among divisions within a company. Frequently, each system has its own proprietary data representation. Consequently, product data are created and stored in multiple, often incompatible formats. As a result, interoperability problems exist, whether files are being transferred between firms or within a firm.
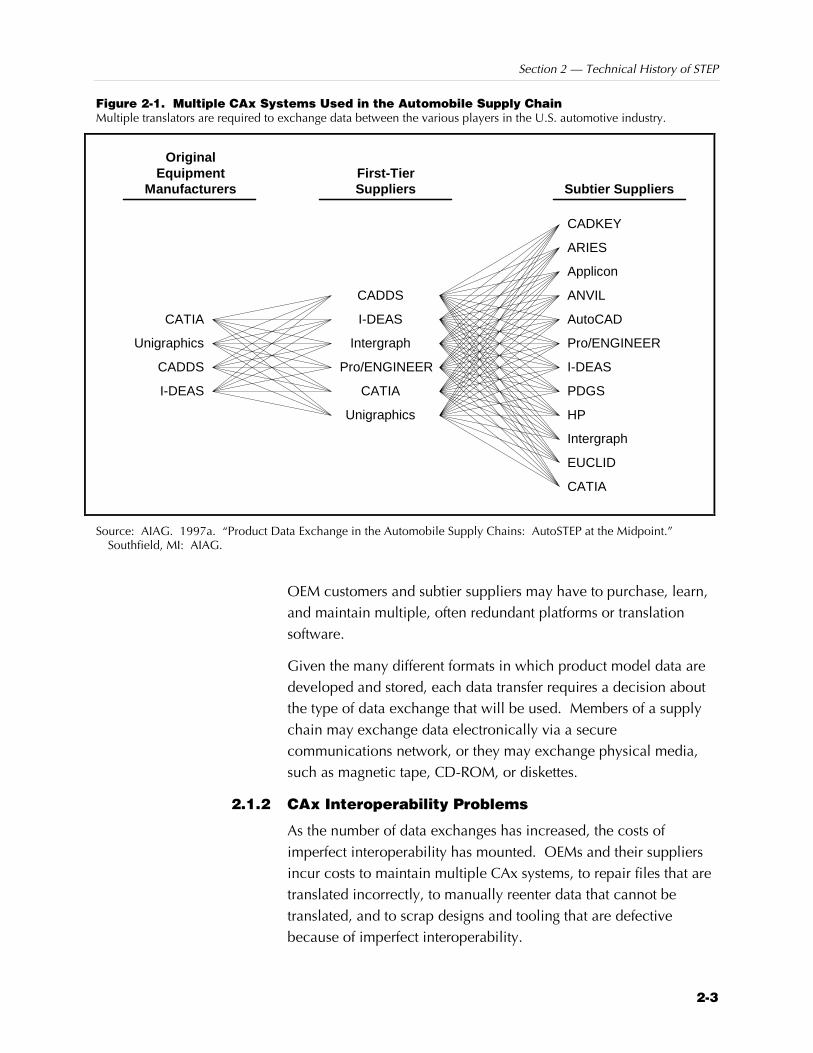
Figure 2-1, based on information from the Automotive Industry Action Group (AIAG) (1997a), identifies some of the different CAx platforms currently used by members of the U.S. automobile supply chain. The figure demonstrates that a first-tier supplier with several
CAx interoperability is the ability to communicate data from one software system to another.
Section 2 — Technical History of STEP
2-3
Figure 2-1. Multiple CAx Systems Used in the Automobile Supply Chain Multiple translators are required to exchange data between the various players in the U.S. automotive industry.
CADKEY
ARIES
Applicon
ANVIL
AutoCAD
Pro/ENGINEER
I-DEAS
PDGS
CATIA
HP
Intergraph
EUCLID
CADDS
I-DEAS
Intergraph
Pro/ENGINEER
CATIA
Unigraphics
I-DEAS
Unigraphics
CATIA
CADDS
Subtier Suppliers
OriginalEquipment
ManufacturersFirst-TierSuppliers
Source: AIAG. 1997a. “Product Data Exchange in the Automobile Supply Chains: AutoSTEP at the Midpoint.” Southfield, MI: AIAG.
OEM customers and subtier suppliers may have to purchase, learn, and maintain multiple, often redundant platforms or translation software.
Given the many different formats in which product model data are developed and stored, each data transfer requires a decision about the type of data exchange that will be used. Members of a supply chain may exchange data electronically via a secure communications network, or they may exchange physical media, such as magnetic tape, CD-ROM, or diskettes.
2.1.2 CAx Interoperability Problems
As the number of data exchanges has increased, the costs of imperfect interoperability has mounted. OEMs and their suppliers incur costs to maintain multiple CAx systems, to repair files that are translated incorrectly, to manually reenter data that cannot be translated, and to scrap designs and tooling that are defective because of imperfect interoperability.
Economic Impact Assessment of the International Standard for the Exchange of Product Model Data (STEP) in Transportation Equipment Industries
2-4
CAx interoperability problems generally fall into two categories—data exchange problems and data quality problems. Some of these problems are sufficiently serious to require repeating the data exchange or recreating the model. Other problems can be repaired more simply. Some of the more common problems that require repeating the transfer of a solid model or recreating the data include models that arrive with missing, collapsed, or inverted faces; models that do not form closed solids (surfaces and edges do not connect); and models with incorrect feature orientation (Frechette, 1997).
Other common problems associated with the transfer of CAx data include
Z lines that do not meet at corners;
Z lines that cross at corners;
Z curves or lines drawn as many short line segments;
Z multiple occurrences of the same feature at the same location;
Z lines or surfaces coincident with other lines or surfaces;
Z surfaces that do not meet at lines;
Z some or all of the geometry not translated;
Z geometry, dimensions, and notes not correctly separated into different layers;
Z planar features drawn out of plane; and
Z geometry of features not drawn to scale (Fleischer, Phelps, and Ensing, 1991).
Fleischer, Phelps, and Ensing (1991) surveyed members of the Detroit, Mid-Michigan, and Grand Rapids chapters of the National Tooling and Machining Association (NMTA) to determine the nature and frequency of problems incurred when tool and die shops received CAx data from their customers. The survey revealed that the data had to be repaired in about 51 percent of the jobs. The job shop had to completely recreate CAD data in an additional 25 percent of the cases. In about 15 percent of all cases, these errors were not discovered until after the part tooling had already been cut. These errors were costly and caused delays because the company had to scrap and recut the parts (Fleischer, Phelps, and Ensing, 1991).
Even when data transfers are completely successful, data quality issues can lead to imperfect interoperability. A recent study by the AIAG (1997b) found that product data quality issues cause problems
OEMs and their suppliers incur costs to maintain multiple CAx systems, to repair files that are translated incorrectly, to manually reenter data that cannot be translated, and to scrap designs and tooling that are defective because of imperfect interoperability.

Section 2 — Technical History of STEP
2-5
for many members of the automotive supply chain. These issues exist even when product data are exchanged in native file formats. One OEM reported that downstream functions, such as rapid prototyping, finite element analysis, or CNC programming, spent a great deal of time as much as 50 percent working with CAD data files that were not constructed properly for use in these downstream purposes.
These problems often stem from poor model construction techniques used during CAD data entry. Examples of CAD data problems cited by the AIAG study include
Z lines that do not meet at corners as intended,
Z curves supposed to be tangent that are not,
Z duplicate entities,
Z surface patches that do not match at their joining edges, and
Z solid model faces that are incorrectly formed or have improper topology (AIAG, 1997b).
These problems sometimes occur because different computational software and different operating systems develop product models with different scale and closure tolerances. Furthermore, different organizations use different conventions to organize their drawings or documents (Sawant and Nazemetz, 1998).
While translation errors are usually obvious, many data quality problems are not easily detectable. The user may not realize that the data are of poor quality until a problem with a downstream software program occurs that leads to the discovery of the problem data. The further downstream these problems are detected, the more costly they are in terms of scrapped models, model rework, and project delay.
2.1.3 Potential Methods for Improving CAx Interoperability
Discrete parts manufacturers generally acknowledge that imperfect CAx interoperability is an important and expensive problem. However, none of the solutions widely used in the past has been successful at significantly reducing these problems. This section briefly describes several approaches to improving interoperability and their technical and economic shortcomings. The following methods are currently used to share data between systems, but they have a number of drawbacks:
Discrete parts manufacturers generally acknowledge that imperfect CAx interoperability is an important and expensive problem. However, none of the solutions widely used in the past has been successful at significantly reducing these problems.

Economic Impact Assessment of the International Standard for the Exchange of Product Model Data (STEP) in Transportation Equipment Industries
2-6
Z standardization on a single system and sharing of files in native format,
Z point-to-point translation,
Z manual reentry of data, and
Z neutral format translation (Doty, 1994).
Single-System Standardization
Standardization on a single system may appear to be the simplest way to ensure compatible data because an exchange of product data requires no translation. However, even within a single company, enforcing this standardization can be difficult because different parts of the organization have different needs, and a single system may not be capable of meeting all these needs. Furthermore, even when a single system is mandated, the use of different versions of the software may create translation problems.
Enforcing a single-system standard across the members of a supply chain can be even more difficult and costly. It restricts the company’s collaborators to users of the same technology. Alternatively, the company with greater market power can force potential collaborators to adopt its system of choice. The three major U.S. automobile manufacturers require their first-tier suppliers to maintain specific systems for the purpose of sharing product data. Many suppliers work with more than one major customer, each of whom requires a different system. In addition, many of these suppliers have customers outside the auto industry. This situation creates significant extra cost because, as documented by AIAG (1997a), maintaining these multiple systems concurrently causes
Z less than optimal use of the systems in place, because some systems are only used a small percentage of the time (e.g., used only to transmit data to a specific customer);
Z decreased proficiency of CAx users in each of the multiple systems maintained and a resulting decrease in the flexibility with which the engineering staff can be used;
Z increased cost for maintaining and administering the multiple systems;
Z increased system administration problems and system down time;
Z increased training costs because CAx users must be trained on multiple systems;
Most large OEMs in the transportation equipment center dictate which CAD formats they will accept. With few exceptions, they require native formats. For example, the following OEMs require these formats: Z Ford—IDEAS
Z DaimlerChrysler—CATIA
Z GM—Unigraphics
Z Electric Boat—CATIA

Section 2 — Technical History of STEP
2-7
Z more data transfers among multiple systems used concurrently for the same design project, along with the attendant accuracy problems and costs;
Z increased costs of PDM, which becomes increasingly expensive because changes must be tracked through multiple design systems; and
Z increased costs of maintaining quality and procedure standards for CAx data, which reduces the quality of the CAx data-entering systems.
These costs may be especially burdensome to small companies that produce small volumes because some of the costs of purchasing, maintaining, and gaining expertise in these systems are fixed rather than variable costs. Small companies cannot spread the costs of investment in these systems across a large enough volume to make use of multiple systems cost-effective (Target, 1994). Thus, these requirements can function as barriers to market entry.
Point-to-Point Translation
A second approach to sharing data among applications is to develop and use a conversion program that transforms data from the form used by one system to the form used by another system. These translators work fairly well for some well-defined data translation tasks. However, the drawbacks of this approach include
Z the need for a pair of translators for every combination of systems that require translation (Frechette, 1997),
Z the need to update each translator when either of the two systems’ software is updated, and
Z the lack of availability of translators for all software and tasks.
In addition, a high degree of vendor cooperation is necessary for the development of direct translators. Sawant and Nazemetz (1998) point out that such cooperation is limited because the development of viable translators requires the disclosure of proprietary information about the software. Vendors are understandably reluctant to share such information with competitors.
Manual Reentry
When a satisfactory method of exchanging electronic data is not available, operators may manually reenter data into each system that requires it. Aside from the obvious problems of the cost and time required to manually reenter product data, this method may
The ocean-going shipbuilding industry historically prepared its own point-to-point conversion software; however, over time, such converters became cost-prohibitive. By the time new U.S. naval contracts were awarded, the converters were outdated and new programs needed to be developed and written, tasks that added significantly to the cost of new shipbuilding programs.
Economic Impact Assessment of the International Standard for the Exchange of Product Model Data (STEP) in Transportation Equipment Industries
2-8
also result in transcription errors. Nevertheless, data reentry is commonly used in some situations (Doty, 1994).
Neutral Format Translation
Another approach to sharing data between different systems is to develop a common neutral format for exchanging the data. Implementing the neutral format requires a pair of translators (read and write) between each application and the neutral format. Such translators are often called “half translators.” With a neutral format, only two translators are required for each application, regardless of the number of other systems used to exchange data. This method simplifies the maintenance of translators as each system evolves. Vendors are also more willing to develop half translators because they do not require the disclosure of proprietary code. A vendor can build a pair of half translators for its product without interacting with the competition (Sawant and Nazemetz, 1998).
The two neutral format solutions that are of primary interest for this study are Initial Graphics Exchange Specification (IGES) and STEP. IGES, having been implemented in the 1980s, has gained acceptance as a reliable neutral format solution. However, as is discussed in the next section, it has several limitations. STEP provides superior functionality, but because of its recent availability, it is still in the process of gaining industry acceptance.
IGES is a U.S. national standard and is supported by most CAx systems. Although IGES has been very successful in some limited applications, it has a number of weaknesses. IGES is limited because it was designed mainly to communicate design data. It does not support the many other types of data that are required for manufacturing, marketing, technical and cost analysis, and configuration management. The U.S. Product Data Association (US Pro) indicates that the IGES 6.0 release will be the last IGES upgrade and that U.S. Pro will focus its development efforts on STEP (U.S. Pro, 2002).
STEP is a file format produced by each software package (McEwan, 1995). The International Organization for Standards (ISO) adopted STEP as ISO 10303 to achieve the benefits of such an exchange standard. Rather than translating data from one software system into another, STEP provides a complete computer-interpretable product data format. STEP allows users to integrate business and technical

Section 2 — Technical History of STEP
2-9
system data and covers all aspects of the business cycle, from design to analysis, manufacturing, sales, and service.
STEP goes beyond previous neutral format translators, such as IGES, in several ways. First, it includes more of the data types required to develop, analyze, manufacture, document, and support many kinds of products. Second, rather than operating only on the elements common to two systems, STEP provides a base model that incorporates a superset of existing systems and extensions to support special application needs. Furthermore, because STEP is being developed by the ISO, it will enable U.S. companies to interact with suppliers and customers abroad.
2.2 TECHNICAL HISTORY OF STEP AND NIST’S ROLE With the emergence of global markets, there is an increasing trend toward the development and implementation of open international standards. The intent is for standards to no longer be an afterthought or residual outcome of market forces. Standards are increasingly providing a critical foundation in achieving effective and efficient communications within and among companies.
The development and implementation of international standards require the integration of many research projects worldwide. Feedback from parallel implementation activities needs to be incorporated into the standard. In addition, there is a growing need for software tools to build and certify the standard and the implementations of the standard.
STEP has developed through an international effort including representatives from industry and government. The STEP standardization initiative was unique in that it did not begin with an existing commercial application (or set of existing applications). Rather, this initiative first involved advancing the state of the art in product data technology and then built a standard to meet the emerging vendor capabilities in the new technology.
The STEP initiative also contributed to standard-setting procedure by being the first ISO standard to
Z use formal information modeling techniques in its development,
Z publish a standard for an information modeling language,
Standards are increasingly providing a critical foundation in achieving effective and efficient communications within and among companies.

Economic Impact Assessment of the International Standard for the Exchange of Product Model Data (STEP) in Transportation Equipment Industries
2-10
Z include digital information in its normative form, and
Z include a specification for conformance testing.
NIST has played a significant leadership and technical role in the development of STEP. Throughout the STEP development process, NIST formed directives on how to develop and document the standards. NIST’s work on STEP infrastructure encompassed resource integration and the provision of editing directives and AP development guidelines. Further work includes the following:
Z Tool development—NIST contributed heavily to the creation of tools to support the development of the STEP standard itself, implementations of the standard in software, and EXPRESS.
Z Test system development—The support of the STEP test system developed in conjunction with ERIM (now Altarum) led to the formal conformance testing system and infrastructure. In addition, the test system’s development led to tools that support not only conformance testing, but also interoperability testing by software vendors and users.
Z Hosting and staffing the ISO committee—For many years, NIST served as the host organization for the Secretariat of the ISO subcommittee (TC184/SC4) that oversees development of STEP. NIST provided the staff to operate the Secretariat and provided the home base for the Convener (Chair) of the committee. In the early stages of STEP development, NIST also took responsibility for organizing the regular meetings of the U.S. and international STEP working groups that actually did the STEP development work.
The likely effects of NIST’s contributions include
Z lowered cost of STEP development,
Z lowered cost of STEP implementation, and
Z reduced risk of STEP adoption by end users.
2.2.1 NIST’s Role in the STEP Development Process
By assisting in the development of STEP as an industry standard, NIST reduced the uncertainty and risk associated with industry’s investment in STEP. NIST’s involvement resulted in the following positive outcomes:
Z NIST’s activities in developing conformance testing practices help to improve the quality of the STEP software, reducing the technical risk to both the software industry and software users.
Z NIST helped to demonstrate the benefits of STEP through programs such as the AutoSTEP pilot program, reducing
NIST’s activities reduced the uncertainty and risk associated with industry’s investment in STEP.
Section 2 — Technical History of STEP
2-11
industry’s perceived technical risk associated with investments in STEP.
Z NIST participated in the development of STEP’s application protocols and implementation prototypes, lending expertise and credibility to the STEP development process and improving the process of standards implementation.
Below is a chronological overview of the STEP development process, highlighting NIST’s role. Additional information on the STEP development process can be found in STEP: The Grand Experience (Kemmerer, 1999).
Initiating the Development Process
The first ISO TC 184/SC4 meeting was held at NIST on July 11, 1984. Participating countries were Canada, France, Germany, Switzerland, the United Kingdom, and the United States. The purpose of the meeting was to initiate the development of an international standard that enables the capture of information comprising a computerized product model in neutral form, without the loss of completeness and integrity, throughout the lifecycle of a product (Kemmerer, 1999). Several resolutions describing the mission, goal and objectives were passed at this meeting.
Resolution 5 established NIST as a leader in the effort as the SC4 Chair. NIST also served as the SC4 Secretariat (on behalf of ANSI). NIST served as the Secretariat for first 15 years of the STEP development process.
Initially, the new standard for external representation of product model data was to be based on existing data exchange in initiatives, including the U.S. IGES and PDDI, the French SET, the German VDA/BDM-FS, and the UK NEDO. However, consensus soon shifted toward developing a new Product Data Exchange Specification (PDES) from scratch, rather than continuing to enhance existing initiatives (such as IGES). The intent of such a philosophical shift was to use new state-of-the-art data modeling techniques. Eventually, PDES was proposed formally by the United States to the ISO to serve as the master draft of the ISO 10303.
PDES
The PDES initiation effort began in 1986 and was a “proof of concept” project begun within the IGES organization to validate the methodology by which PDES would develop into a product data

Economic Impact Assessment of the International Standard for the Exchange of Product Model Data (STEP) in Transportation Equipment Industries
2-12
exchange specification. The effort focused on information modeling to develop formal descriptive languages and a methodology for the description of product data. An important step in the process was recognizing that robust data modeling was necessary to support the complexity of STEP.2 As a result, the development of a new computation language was initiated that was to lead to the development of EXPRESS.
NIST staff participated on two levels, supporting the development of modeling languages. Some NIST staff members were involved as technical “language development” experts contributing to the development of EXPRESS, a computer language designed to communicate information concerning data. Others were technical experts in information modeling whose focus was on ensuring the ability of a formal description language to facilitate the capture of the semantics of information requirements (Kemmerer, 1999).
Information Models
The information models developed within the PDES and STEP projects were assembled into a single model, called the Integrated Product Information Model (IPIM). IPIM was basically the summation of all models regardless of their level of abstraction. The intent was that all models would be translated into EXPRESS and then combined into a single entity pool from which implementers could draw for effective data exchange. However, it soon became clear that because the models in the IPIM varied along a continuum of generalization, the integration of very specific application models with more generic models was unclear and inconsistent.
The varying degree to which models included generic concepts, rather than concepts specific to particular applications, led to the development of “application protocols” (APs). The purposes of APs are to
Z state explicitly the information needs of a particular application,
Z specify an unambiguous means by which information is to be exchanged for that application, and
Z provide a basis for standardization conformance verification.
2Programming languages such as Ada and C++ were also considered as the formal
descriptive language. However, their very nature as implementation languages conflicted with their use for creating abstractions that omit nonessential details.

Section 2 — Technical History of STEP
2-13
Each AP could potentially develop a unique way of achieving its Application Reference Model (ARM). Thus, ARMs are typically application-specific models with clearly defined scopes and functionality requirements. However, this development led to the undesirable potential that separate application protocols could be fundamentally incompatible.
A top-down approach to STEP development was applied to address the potential problem of incompatible APs.3 The result was a framework built upon the Generic Product Data Model (GPDM) Integration Architecture. The GPDM captured common elements of product data in a single coherent representation. It provided an application context-independent description of a product in terms of generic product description facts. The GPDM served as the missing piece to the use of AP methodology in the basic STEP architecture. EXPRESS was the descriptive language used for GPDM.
3This approach is in contrast to the collection of models contained within the IPIM
that represented a bottom-up approach.

3-1
Current STEP Development and 3 Implementation
This section describes the current and near future trends in the development and adoption of STEP. The past and ongoing standards development activities are discussed, and potential barriers to realizing economic benefits are identified.
3.1 CURRENT TRENDS IN THE DEVELOPMENT AND IMPLEMENTATION OF STEP STEP is still a work in progress with new parts nearing international standard status and many more in various stages of development. STEP development and implementation can be broadly grouped into three categories of STEP functionality. That is, STEP can be considered in terms of what is
Z most widely implemented,
Z approved, and
Z under development but not yet international standards.
Table 3-1 presents the status of STEP APs, as of November 2002.
3.1.1 Most Widely Implemented STEP APs
STEP has potential applications in a broad range of industries, including transportation equipment, electronics, process plants, construction, and software. To date, the aerospace and automobile industries have been affected most significantly, primarily due to Application Protocol 203 (AP203) of the STEP standard. This standard allows the translation of three-dimensional design data for mechanical parts and assemblies.
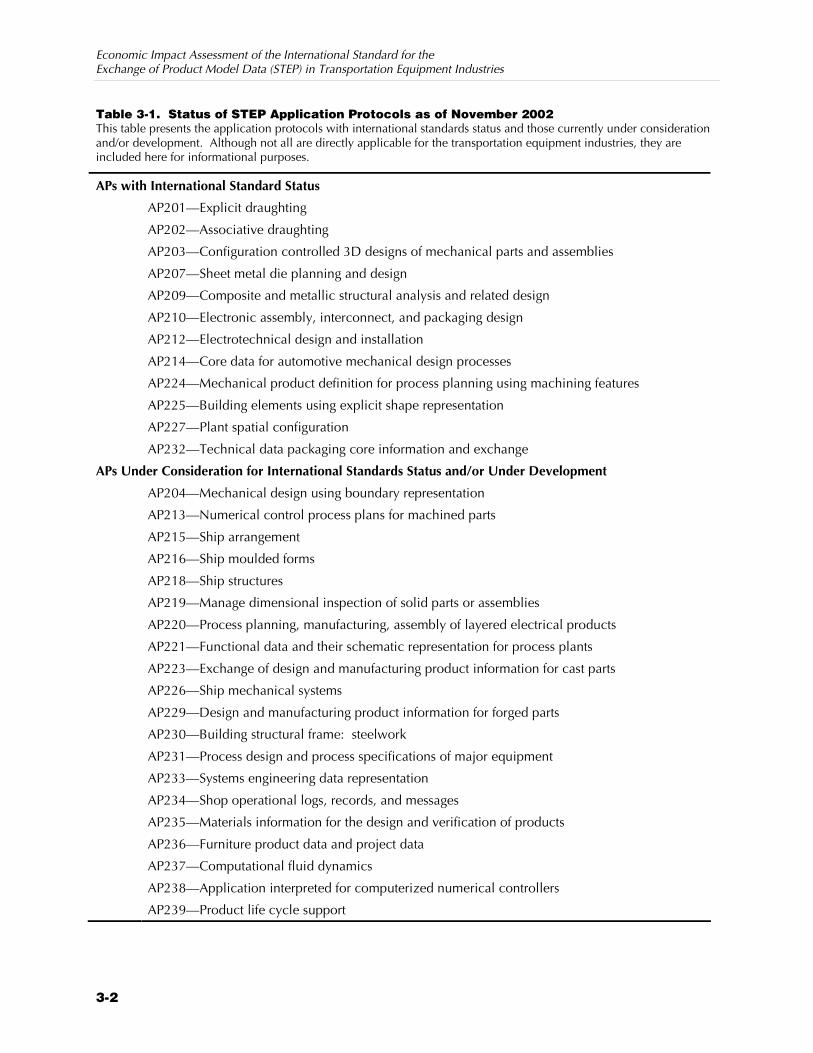
Economic Impact Assessment of the International Standard for the Exchange of Product Model Data (STEP) in Transportation Equipment Industries
3-2
Table 3-1. Status of STEP Application Protocols as of November 2002 This table presents the application protocols with international standards status and those currently under consideration and/or development. Although not all are directly applicable for the transportation equipment industries, they are included here for informational purposes.
APs with International Standard Status
AP201—Explicit draughting
AP202—Associative draughting
AP203—Configuration controlled 3D designs of mechanical parts and assemblies
AP207—Sheet metal die planning and design
AP209—Composite and metallic structural analysis and related design
AP210—Electronic assembly, interconnect, and packaging design
AP212—Electrotechnical design and installation
AP214—Core data for automotive mechanical design processes
AP224—Mechanical product definition for process planning using machining features
AP225—Building elements using explicit shape representation
AP227—Plant spatial configuration
AP232—Technical data packaging core information and exchange
APs Under Consideration for International Standards Status and/or Under Development
AP204—Mechanical design using boundary representation
AP213—Numerical control process plans for machined parts
AP215—Ship arrangement
AP216—Ship moulded forms
AP218—Ship structures
AP219—Manage dimensional inspection of solid parts or assemblies
AP220—Process planning, manufacturing, assembly of layered electrical products
AP221—Functional data and their schematic representation for process plants
AP223—Exchange of design and manufacturing product information for cast parts
AP226—Ship mechanical systems
AP229—Design and manufacturing product information for forged parts
AP230—Building structural frame: steelwork
AP231—Process design and process specifications of major equipment
AP233—Systems engineering data representation
AP234—Shop operational logs, records, and messages
AP235—Materials information for the design and verification of products
AP236—Furniture product data and project data
AP237—Computational fluid dynamics
AP238—Application interpreted for computerized numerical controllers
AP239—Product life cycle support

Section 3 — Current STEP Development and Implementation
3-3
Large shipyards are also developing and testing new translators that employ specially tailored STEP APs, which will substantially increase that sector’s use of STEP. However, current use of STEP in shipbuilding design is limited. The U.S. government has also been aggressive in integrating AP203 STEP functionality within Department of Defense weaponry and NASA engineering.
AP202 functionality is also commercially available in a very limited number of software products. AP202 supports associative draughting. However, because this standard is not perceived as providing a significant improvement over IGES, it has experienced limited implementation in software products and minimal adoption by industry.
Early efforts by CAD vendors to create STEP translators resulted in products that did not meet industry expectations. One effort targeted at addressing implementation problems was the AutoSTEP project. The AutoSTEP project helped vendors identify where improvements were needed, and the result was a clear pattern of dramatic improvement, even over the course of the project. For example, early solid primitives were translated with only partial success. By the end of the project, many solids of significant complexity were translating with significant success.
Recent examples of implementation and adoption of STEP functionality include the following (see also Table 3-1):
Z Delphi Delco Electronic Systems uses STEP internally and externally with customers.
Z Boeing Commercial Airplane Group has agreed with Pratt & Whitney, Rolls-Royce, and GE Aircraft Engines to use STEP as the production data exchange process in its design process.
Z IBM/Dassault Systems recently certified its CATIA AP203 STEP Interface product (Version 4, Release 2.2). The AP203 Conformance Class 6a certification assures that these products conform to the ISO standard for the exchange and/or sharing of boundary representation shape models with associated product identification information.
Z Lockheed Martin Aeronautics has recently initiated full production use of STEP for technical data exchange with its suppliers (AP232). STEP was implemented in a pilot program in 1996 on the F-16 program. The Company also plans to implement the standard across all new programs that use computer-aided design (F-22, F-2, T-50, JSF, etc.) and at all sites in the consolidated Lockheed Martin
Large shipyards are developing and testing new CAx translators that employ specially developed STEP APs, which will substantially increase that sector’s use of STEP. To date, however, the aerospace and automobile industries have been most significantly affected by STEP.

Economic Impact Assessment of the International Standard for the Exchange of Product Model Data (STEP) in Transportation Equipment Industries
3-4
Aeronautics Company. The company claims that in a recent major rebid of F-16 machined parts, involving about 2,300 part numbers and about 50 potential suppliers, use of STEP provided a 95 percent reduction in material costs and a 52 percent reduction in labor by the prime contractor, not counting similar savings by the suppliers.
Z NASA has approved and released NASA-STD-2817, which requires CAx systems used by NASA to have interchange tools that support STEP. Areas covered are AP203, AP209, AP210, AP225, and AP227 for exchanging data among product data management systems; mechanical and electronic CAD/CAM systems; civil and facilities CAD systems; and computer-aided engineering/analysis systems.
3.1.2 Approved STEP APs
Several other application protocols, or parts of application protocols, have been approved as international standards, but are not as widely implemented as the above mentioned parts. These application protocols include
Z AP201—explicit draughting;
Z AP207—sheet metal die planning and design;
Z AP214—core data for automotive mechanical processes;
Z AP224—mechanical parts definition for process planning using machine features;
Z AP225—structural building elements using explicit shape representations; and
Z AP232—technical data packing for core information and exchange (see also Table 3-1).
For example, AP232 (technical data packaging core information and exchange) defines the structure to package, or relates groups of product information so that configuration controlled exchanges can be achieved among PDM systems. The AP232 emphasis is on information that is typically used for representing design disclosure of an item. The purpose of this AP is to provide an information structure where product information can be electronically captured and managed from both a document-based perspective and a product-item perspective.
3.1.3 STEP APs Under Development
More than half of the APs exist in either draft or working draft form without full international standard status. For example, AP209 (composite and metallic structural analysis and related design) provides a neutral data format representation of intelligent models

Section 3 — Current STEP Development and Implementation
3-5
needed to conduct engineering analysis within an iterative design-analysis environment. In addition, several APs for the shipbuilding industry exist in draft form; these are AP226 (ship mechanical systems), AP218 (ship structures), AP216 (ship molded forms), and AP215 (ship arrangements). Once these APs are approved, the use of STEP by the shipbuilding industry should be greatly enhanced. Their approval will assist in the compliance with the Department of Defense (DoD) mandate that STEP be used in the exchange and cataloging of product model data on DoD contracts.
Enhancements are also in development for the EXPRESS language. Two primary efforts are underway (Kemmerer, 1999). The first includes implementing several minor and major improvements to EXPRESS, such as extensions to allow EXPRESS to model new kinds of technical and business process information. The second likely improvement to EXPRESS is the implementation of a mapping language. The new version, called EXPRESS-X, will specify the relationships between structures in different models of application protocols.
3.1.4 Infrastructure Tools to Support STEP Development and Adoption
A wide range of infrastructure tools support the standards development, implementation, and adoption. The availability of these tools is essential for realizing the benefits of STEP:
Z STEP data-checking tools—For people who are using or want to use STEP to exchange product data, some tools are available to help ensure that the data in a STEP data file are valid STEP data. Examples of such tools include Expresso, a tool developed by NIST, and STEPCheck™ and STEPView™, which were created by ERIM (now called Altarum) as a part of work sponsored by NIST. Other tools that provide various aspects of STEP file checking also exist. These tools are being used by software developers to check the output of their systems during development and by software users to check and diagnose problems during translation. These tools are most useful to those who already understand the workings of STEP, so their potential market is probably limited.
Z STEP standard development tools—Developing parts of the STEP standard is not a simple process; it requires substantial knowledge and effort. A few tools have been developed to facilitate this process. One example is the STEP RPG tool developed by ERIM and NIST that helps build one of the most STEP-knowledge intensive pieces of an AP, the
Nineteen APs are nearing international standard status, with 20 protocols in various earlier stages of development. Enhancements are also in development for the EXPRESS language.

Economic Impact Assessment of the International Standard for the Exchange of Product Model Data (STEP) in Transportation Equipment Industries
3-6
mapping table. Although this tool is very helpful to those who need it, there are fewer than 40 APs. In spite of its value for the development of STEP, there is no commercial market for the STEP standard development tool.
Z STEP implementation tools—Software vendors implementing STEP in their CAD or other products can take advantage of software development tools produced by NIST and commercial firms. These software tools—such as NIST’s STEP Class Library, International TechneGroup, Inc.’s, PDE/Lib, and STEPTools, Inc.’s ST-Developer—are designed to ease various aspects of the software development process associated with using STEP. Because the number of STEP software developers is somewhat limited, this area is likely to remain a small part of the overall STEP business picture.
Z STEP testing tools—There are two aspects of testing STEP implementations—conformance testing and interoperability testing. Conformance testing is the testing of implementations of STEP against a reference system. NIST and ERIM jointly developed a conformance testing system for implementations of STEP AP203. That system is operational and vendors of STEP products have submitted their products for conformance testing. A number of the systems have received certification as conforming to AP203. The conformance test system and the tools that comprise it are also available for vendors to purchase. While conformance testing is no guarantee of perfect operation of STEP implementations, it does provide a baseline of capability. While it is a useful confidence builder for potential users, conformance testing rarely earns enough to pay its own way. Software vendors are not willing to spend a large amount of time and money on conformance testing. Therefore, at least the development of the conformance testing system and support structure must be subsidized.
Z Interoperability testing is testing between two different systems, rather than against a reference system. Interoperability testing is a necessary step in the successful use of neutral standards such as STEP between a particular pair of systems. Fortunately, most of the tools appropriate for conformance testing are also useful for interoperability testing. The potential market for those tools is much larger because it includes potential regular users of the standard, not just developers.
3.2 BARRIERS TO DEVELOPMENT AND ADOPTION OF STEP Industry’s interest and level of support for the development and adoption of STEP has varied over time as market incentives have evolved. To date, industry has been slow to invest the resources needed for the implementation and adoption of STEP, despite
Section 3 — Current STEP Development and Implementation
3-7
industry-wide agreement that a neutral format holds the best potential solution to interoperability problems (McEwan, 1995). A number of issues have hampered industry’s commitment to STEP, including
Z the significant investment required to develop a solution that will benefit all members of the industry,
Z the market risk caused by competitive rivalries among the companies that develop CAx software and translators,
Z the technical risk associated with developing STEP translators and related tools, and
Z the need for an unbiased expert to negotiate, develop, and implement industry standards. (RTI, 1999).
This section explores these impediments by addressing the competitive market factors and incentives influencing the development, implementation, and adoption of STEP functionality.
3.2.1 Evolving Structure of CAx Markets
The CAD market changed substantially over the 10 years that the initial 12 parts of STEP took to develop. During the early 1980s, at the start of STEP development, most North American automotive and aerospace OEMs were using their own, in-house developed and supported CAD systems.1 Even McDonnell Douglas (now part of Boeing), which had a division that sold a commercial CAD software package, used its own (different) CAD system internally.
By the early 1990s, virtually all North American automotive and aerospace OEMs had shifted or were in the process of shifting to external, commercially supported CAD systems. With that change, the large OEMs moved from being relatively uninterested in the commercial CAD market to significant players in the development process. Given their own proprietary CAD systems and the mix of supplier systems that existed in the early days of STEP development,
1When focusing on historical issues, we look at CAD systems because most of the
initial release of STEP focused on CAD geometry. While AP203 included configuration management data, only recently has any real implementation of that kind of capability become available. Further, the development focus has shifted to the so-called “PDM Schema,” a refined data model that is being implemented by some software vendors, especially in PDM systems. In spite of any vendor claims to the contrary, the PDM schema implementations are very much experimental, as evidenced by the massive amount of effort required to put on a basic proof-of-concept PDM data exchange demonstration at the AIAG’s Auto-Tech 2000 conference and exhibition in September 2000 in Detroit, Michigan. Just as important, the current policy from the automotive OEMs is, once again, that suppliers must use the same PDM system.

Economic Impact Assessment of the International Standard for the Exchange of Product Model Data (STEP) in Transportation Equipment Industries
3-8
the OEMs were generally interested in developing a standard that would improve interoperability across their supply chains and were willing to put resources toward the development of STEP.
Interest in STEP was also motivated by the increased trend of OEMs to outsource design responsibilities for parts and systems. Outsourcing of design responsibilities led to increased use of CAD systems by suppliers and the need to transfer sophisticated product data throughout the supply chain. At the start of STEP development, many suppliers had no CAD systems at all; if they did, they often had relatively less capable systems than their customers. By the initial release of STEP, the distribution of design responsibility across the supply chain was well underway and most first-tier suppliers were using the same or equally advanced CAD systems as their customers. However, this increased use of CAD systems throughout the supply chain resulted in increased interoperability problems.
In search of interoperability solutions, OEMs required that all suppliers transfer product data in native formats. In the automotive and aerospace industries, each OEM is large enough as a customer to request specific CAD system use to their suppliers. However, the fact that Ford, GM, and DaimlerChrysler used different CAD systems placed a substantial burden on suppliers who must support multiple CAD systems if they supply more than one OEM.
By the initial release of STEP, the use of native file transfers and the increased integration of OEMs with suppliers reduced the OEMs’ necessity for neutral file transfer standards. However, the first-tier suppliers had taken over as the companies with the greatest need for interoperability standards. They needed interoperability both internally and down the supply chain. Internally, they needed to be able to move data across the multiple systems their customers required. They also needed interoperability with their own lower-tier suppliers, who often used less sophisticated CAD systems and were generally unable to support multiple systems.
3.2.2 Shift in STEP’s Support Structure
Because of this change in the CAD market over the development of STEP, many of the companies most involved in the beginning have decreased their support. The North American automotive industry has reduced its participation in STEP development since the initial
By the end of the STEP development process, virtually all North American automotive and aerospace OEMs had shifted or were in the process of shifting to external, commercially supported CAD systems. With that change, the OEMs moved from being uninterested in the commercial CAD market to dominating it from the customer side.

Section 3 — Current STEP Development and Implementation
3-9
release. However, both the aerospace industry and the shipbuilding industry have maintained their level of involvement.
Regardless of their continually increasing strength and responsibility, major automotive suppliers still tend to take the lead of their customers. Even as they continue to take greater responsibility for the design and manufacture of products, suppliers have not been able to influence OEM in addressing interoperability problems.
As discussed in Section 2, STEP standard development and implementation in vendor software continues and significant capabilities exist. While adequate for many applications, the currently available STEP APs do not support all of the capabilities of CAx systems. As such, the automotive OEMs maintain their preference of receiving native format file transfers for all applications.
Continuing STEP development has largely been driven by other industries in North America. In other discreet part industries, the OEM’s role continues to be much less significant. The OEMs are generally not large enough to dominate as they do in the automotive industry. The difference can be seen in relationships with suppliers. In the related heavy equipment industry, OEMs such as Caterpillar and Deere & Company do not have the purchasing power to require that their suppliers use a particular CAx system.
In addition, the European automotive industry has continued to be very involved in STEP development, with substantial support for the massive development effort required to create the recently completed AP214, which is a comprehensive standard focused on mechanical design needs for the automotive industry. The North American auto industry has contributed to AP214 development, but primarily in a review and comment role.
The development of STEP APs continues, but such work requires substantial effort by individuals with domain-specific knowledge. STEP AP development requires two sets of knowledge: one is the domain knowledge needed to define the information requirements for an AP; the other is the knowledge of how to build a STEP AP. Understandably, staff with this knowledge and experience are valuable resources, and it is a difficult decision for companies to

Economic Impact Assessment of the International Standard for the Exchange of Product Model Data (STEP) in Transportation Equipment Industries
3-10
remove them from other job responsibilities to focus their efforts on developing STEP APs.
3.2.3 Implementation by Software Developers
As profit-maximizing entities, software vendors will add STEP capabilities to their software products if they generate additional revenue or maintain/increase market share. Software vendors must examine certain demand considerations: Will the customer pay more for a given capability? Will the customer turn to another vendor if the capability is not provided? If not, then there is little incentive to apply significant resources to developing new STEP capabilities.
CAD Implementations
While all the major workstation-based CAD systems and many PC-based systems claim to support STEP, the level of functionality varies and does not always realize the full benefits of STEP. One issue that arises with an open approach such as STEP is that the software vendor fears that providing the capability makes it easier for a customer to change to another system. In addition, vendors benefit from the need for redundant systems. A software vendor may conclude that the increased revenues from providing STEP capabilities do not offset the risk of losing customers.
Currently in the North American market, most major workstation-based CAD systems are effectively driven by a very limited customer base. For example:
Z Ford Motor Company is by far the largest customer of SDRC’s I-DEAS CAD software.
Z General Motors is among the largest customers of Unigraphics Solutions CAD software.
Z Boeing and DaimlerChrysler are the largest customers of Dassault Systemes’ CATIA CAD software.
Vendors rely on the enormous cost of adopting new systems to maintain their customer base. The investment in stored data (“legacy data”), support systems, and user training generates significant customer lock-in effects. All three of the major North American automotive OEMs have gone through the process of changing primary CAD systems in the last decade. In all three cases, it was a massive undertaking that was costly in both time and

Section 3 — Current STEP Development and Implementation
3-11
money. Software vendors with large captive shares of the market are reluctant to introduce capabilities that lower switching costs.
Offsetting domestic barriers to the implementation of STEP in the major CAD systems is the effect of the global marketplace. Dassault Systemes is a French company that has captured the majority of the European automotive and aerospace CAD market. The European companies have shown great interest in effective data exchange between different systems using STEP. As long as vendors’ primary European customers demand that CAD systems support STEP, there is a strong business incentive to comply if they wish to compete in the European market.
PDM Implementations
PDM systems are far less established and have somewhat different characteristics from CAD systems. PDM systems are used to manage engineering information and support the product configuration and engineering process (Kemmerer, 1999). As noted above, the automotive OEMs have been putting PDM policies in place based on their CAD policies, requiring suppliers to use the same systems they do. Whether such policies are sustainable remains to be seen. Many PDM vendors appear to be working on implementing PDM data exchange using STEP.
Some examples exist of successful STEP use to exchange PDM data. The best example is the use of STEP by Lockheed Martin to exchange PDM data between two of its proprietary PDM systems. While the effort has been successful, this is not a case of commercial implementation of STEP exchanging data.
There are key fundamental differences in PDM and CAD data. Unlike CAD data, PDM data are not defined by a third party. CAD data comprise primarily mathematical representations of geometry. As such, CAD systems rely on mathematical approaches that are defined in textbooks. Therefore, different implementations of a given concept are based on the same mathematics.
PDM data have no such commonly recognized external definition. Each company has its own structure and definitions of PDM data. Thus, every implementation of a PDM system is unique, even if the vender of the system is the same. In other words, two implementations of SDRC’s Metaphase PDM system will not

Economic Impact Assessment of the International Standard for the Exchange of Product Model Data (STEP) in Transportation Equipment Industries
3-12
inherently be able to exchange data because the data structures will be different.
The OEMs are now beginning to require that suppliers use their own centralized PDM systems, not just the same brand. As with native file CAD transfers, this solves the interoperability problem from the OEM’s point of view, but still leaves the supplier with the costs of managing its own data and interfacing its PDM system with multiple customers.
The very issue that different implementations of the same PDM system are substantively different may ultimately encourage the PDM software vendors to include STEP as an exchange method. The STEP PDM schema is the most widely accepted neutral format for PDM data. Rather than develop their own intermediate format to move data between different implementations of their own system, the software vendors may choose the STEP approach as being the most cost efficient. In this case, the effectiveness of their own product may be of greater value than any risk that the user might take advantage of it to shift to another brand of software. The costs of implementing a PDM system are substantial. As with CAD systems, changing from one system to another is a costly proposition.
Other Software Implementations
In addition to CAD and PDM, STEP has the potential to affect a wide variety of other systems that work with product data. These include CAM systems, computer-aided engineering (analysis) systems, and automated inspection systems. While some STEP APs have been created in these areas and others are under development, these capabilities have not yet seen significant implementation in software.
One promising software application that is beginning to recognize STEP as a potentially useful exchange mechanism is that of CAD data viewers. In many cases, people need to look at the design information contained in a CAD or other file without any need to change it. Tools that allow someone to display the contents of a data file (usually CAD), particularly the geometry, allow the user to visualize the part. Many such tools are now on the market. Most of these tools allow the user to make notations on a view of the data, saving the combined result in a form that someone else can read

Section 3 — Current STEP Development and Implementation
3-13
with the same viewer. Some of these viewer tools accept STEP data as one of the forms of input, usually along with native formats from a variety of popular CAD systems. These systems are much simpler than CAD systems and are therefore less expensive, are able to run on less powerful computers (especially PCs), and require much less training to use. There is a large potential market for these viewers, but because most of them already accept most native data formats, the market value of STEP capability is open to question.
3.2.4 Adoption and Use of STEP by End Users
A number of elements affect whether a company uses STEP, including technical issues and market elements as described earlier. The most important technical element is whether the currently available STEP translator capability meets the user’s data exchange needs. There are two competing aspects of this element: perceived needs versus functional needs. Often, there is a perceived need for information that is not actually needed to accomplish the desired goal. A classic example is when a customer buying a sub-assembly wants to make sure the assembly fits properly into a larger assembly. All the customer needs is the envelope that marks the outside surface of the sub-assembly, yet the customer will often insist on a fully detailed model of the sub-assembly, requesting substantially more information than necessary. In the first case, STEP AP203 would be adequate for the purpose; in the second case, it is not.
Much of the potential for STEP is in the lower tiers of the supply chain, where the typical company does not have the resources to support multiple complex systems to meet the needs of different customers. Four major issues impede the use of STEP down the supply chain:
1. the lack of capable STEP translators for AP203 and other formally approved STEP parts in PC-based CAD systems,
2. the lack of STEP APs providing the capabilities needed for many applications,
3. the lack of knowledge about STEP and what it provides in such companies, and
4. customers do not necessarily advocate the use of STEP.
The last issue is important because, although they have to use their customers’ CAD systems, first-tier automotive suppliers could choose to promote STEP in much of the communication with their own suppliers.

4-1
4 STEP End Users
Product data exchange is common in almost all discrete parts manufacturing industries. However, due to the size and complexity of the final product, the automotive, aerospace, and shipbuilding industries are most significantly affected by interoperability problems of product data exchange. This section provides brief profiles of these three industries and describes their supply chain structure and product data exchange activities.
Interoperability issues in the automotive, aerospace, and shipbuilding industries are important because of the complexity of the product, the design process, and the increasing trends of outsourcing design and production. This section describes product design and development complexity and why interoperability issues have become an important factor in the competitiveness of these industries.
4.1 THE AUTOMOTIVE INDUSTRY The design and production of automobiles, trucks, buses and other on-road motor vehicles require interaction and coordination among many functions and industry participants. A motor vehicle consists of a large number of components, parts, and accessories that must function together as an integrated unit. Consequently, the design and development process is also complex, requiring a number of iterations among the design steps for different vehicle components. To further complicate the process, these components are typically designed and manufactured by many companies that are part of a complex supply chain. These companies must coordinate their

Economic Impact Assessment of the International Standard for the Exchange of Product Model Data (STEP) in Transportation Equipment Industries
4-2
activities to ensure that the components they design and manufacture are compatible with other components.1
4.1.1 The Automotive Design and Development Process
The structure of an automobile is extremely complex. A typical motor vehicle consists of anywhere from 8,000 to 12,000 parts and accessories that must be designed to be compatible. An automobile comprises several major systems, each of which contains many subsystems, components, and interfacing parts (e.g., bearings, crankshafts, filters, gears, pistons, pumps, and valve trains make up the engine, and their design must be compatible). Similarly, other systems, such as axles, suspensions, transmissions, bodies, seats, and instrument panels, consist of many parts that must work together. Designers must coordinate these systems to enable the successful final assembly of the vehicle.
Automotive design and development in the United States have changed significantly over the last few decades. These changes have contributed to design and development complexity while simultaneously shortening development timelines and improving product quality. Prior to these changes, U.S. automakers considered new product development a linear process that took 5 or more years to complete. Automakers proceeded sequentially from concept design through product design, product engineering, and component sourcing to final assembly (Womack, 1989).
U.S. automakers were compelled to rethink this linear approach to the vehicle development process in the face of stiff competition from Japanese automakers. In the 1980s, Japanese auto companies completed the automotive design process, from initial conception to 1Most motor vehicles are designed and built under the platform concept. A
platform is typically defined as the vehicle’s basic mechanical structure. Different vehicles based on the same platform commonly share several structural elements, such as the floor plan and door pillar (Automotive News, 1997). The platform concept is becoming increasingly important as automakers seek to reduce costs by designing and producing more vehicles from common platforms. The number of platforms is an important measure of the annual design and engineering effort of each company. Models built on common platforms share a large percentage of parts and production processes, and the engineering and tooling for the vehicle’s basic structure account for the majority of total product development and launch costs (Womack, 1989). Thus, the potential savings from using an existing platform for a new model are considerable. Ford estimates that when they develop a new model on an existing platform, development and engineering costs fall by 15 to 20 percent (Automotive News Europe, 1997). Other automakers estimate even higher savings.
Section 4 — STEP End Users
4-3
delivery to consumers, in 43 months, on average; their U.S. counterparts took 63 months (Womack, 1989). Thus, Japanese automakers were able to introduce novel design changes that met customer demand more quickly and cheaply, which accounted, at least in part, for their rising market share.
Concurrent engineering, which integrates design, manufacturing, and support processes to provide early manufacturing input into the design process, is a fairly recent phenomenon in the U.S. automotive industry. The design of the GMC CK pickup in the early 1970s marked the first time in the U.S. auto industry that manufacturing engineers formally worked with design engineers. This early effort at concurrent engineering was very successful and eventually led to its further acceptance in the auto industry. By the early 1980s, Chrysler had formed its Manufacturing Feasibility Group (MFG). The MFG worked under the philosophy that one-third to one-half of quality problems stemmed from poor design and that by integrating manufacturing and design engineering these problems could be reduced much more cheaply than they could if discovered later in the process. An important result of concurrent engineering was a reduction in the number of operations required to manufacture many parts. This translated into less equipment (and the required capital expenditure), fewer breakdowns, less downtime, and a shorter time to market (Dauch, 1993).
As a result of these efforts, lead times for U.S. automakers have been falling since the mid-1980s and continue to fall. Buchholz (1996) reports that Chrysler’s average lead time was 54 months in 1987 and was about 29 months in 1996. The Dodge Durango was developed in 23 months; the shorter lead time was attributable to heavy borrowing from the Dakota pickup (Brooke, 1998). The Concorde and Intrepid redesigns took about 31 months (Jost, 1998). GM has recently reported that its cycle time has fallen from 36 months in 1995 to about 24 months in 1998 (Martin, 1998).
The revised vehicle development process, as described by Whitney (1995) and illustrated in Figure 4-1, includes three phases: concept design, product design, and process or factory design. The development process is no longer linear; concurrent design and engineering require multiple iterations between phases and among
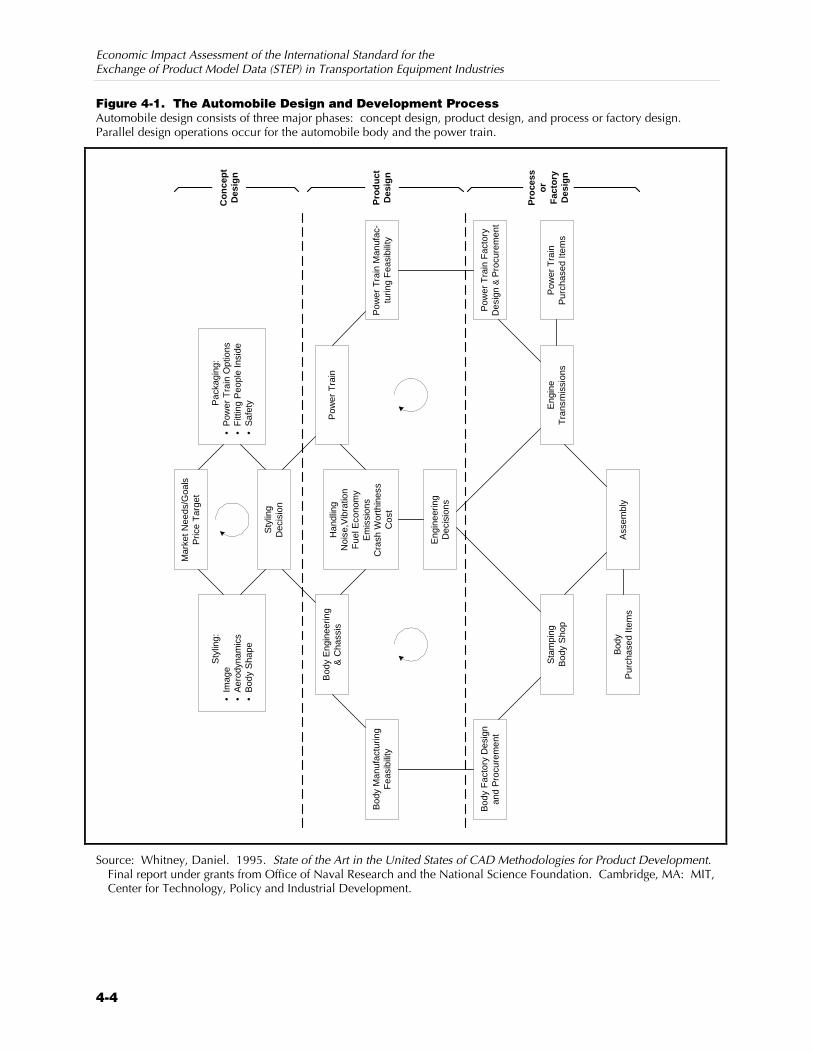
Economic Impact Assessment of the International Standard for the Exchange of Product Model Data (STEP) in Transportation Equipment Industries
4-4
Figure 4-1. The Automobile Design and Development Process Automobile design consists of three major phases: concept design, product design, and process or factory design. Parallel design operations occur for the automobile body and the power train.
Mar
ket N
eeds
/Goa
lsP
rice
Tar
get
Han
dlin
gN
oise
,Vib
ratio
nF
uel E
cono
my
Em
issi
ons
Cra
sh W
orth
ines
sC
ost
Sty
ling
Dec
isio
n
Sty
ling:
• Im
age
• A
erod
ynam
ics
• B
ody
Sha
pe
Pac
kagi
ng:
• P
ower
Tra
in O
ptio
ns•
Fitt
ing
Peo
ple
Insi
de•
Saf
ety
Bod
y E
ngin
eerin
g&
Cha
ssis
Pow
er T
rain
Eng
inee
ring
Dec
isio
ns
Bod
y M
anuf
actu
ring
Fea
sibi
lity
Bod
y F
acto
ry D
esig
nan
d P
rocu
rem
ent
Sta
mpi
ngB
ody
Sho
p
Pow
er T
rain
Man
ufac
-tu
ring
Fea
sibi
lity
Pow
er T
rain
Fac
tory
Des
ign
& P
rocu
rem
ent
Eng
ine
Tra
nsm
issi
ons
Pow
er T
rain
Pur
chas
ed It
ems
Bod
yP
urch
ased
Item
sA
ssem
bly
Pro
cess
or
Fac
tory
Des
ign
Pro
du
ctD
esig
n
Co
nce
pt
Des
ign
Source: Whitney, Daniel. 1995. State of the Art in the United States of CAD Methodologies for Product Development. Final report under grants from Office of Naval Research and the National Science Foundation. Cambridge, MA: MIT, Center for Technology, Policy and Industrial Development.

Section 4 — STEP End Users
4-5
activities within each phase. Feedback loops, which are illustrated in Figure 4-1 by the circular arrows, require an efficient exchange of information within and between phases. Interoperability problems can interrupt this process causing delays and increasing cost.
Concept Design
Before designing a new product, automakers survey the market’s needs. If the automakers identify a niche or need, they consider whether they can generate a suitable design at a competitive price that will meet the demands of the target market. They develop the concept by preparing computer or clay models. The styling process determines the body shape, image, and aerodynamics of the vehicle. Engineers analyze space claims and conduct interference checking in a simultaneous process called “packaging” to ensure that all passengers and components fit inside the vehicle’s exterior. Decisionmakers also select the power train options at this stage.
Product Design
Once company decisionmakers have approved the concept and styling, engineers begin building and testing a prototype automobile. Engineers must develop detailed part and component specifications for the vehicle’s body and its power train. Body engineers design about 20 exterior panels and 300 to 400 interior panels of various sizes. Simultaneously, power train engineers select or design the power train and determine how to arrange its components under the hood. They conduct packaging checks to ensure that there are no rival space claims and that everything fits as intended. Engineers also test the crash worthiness of the prototype and its noise-vibration-harshness (NVH) at this stage.
Process or Factory Design
As the product design progresses, the automaker proceeds with production procurement and design decisions for the body and power train parts. The degree of design activity conducted by suppliers varies along a continuum. At one extreme, suppliers simply manufacture parts based on the specifications and designs provided by the automaker. At the other extreme, the supplier is responsible for the component or system design, responding only to high-level specifications from the OEM. Efficient data exchange is very important because data transfers are routinely made along the supply chain.
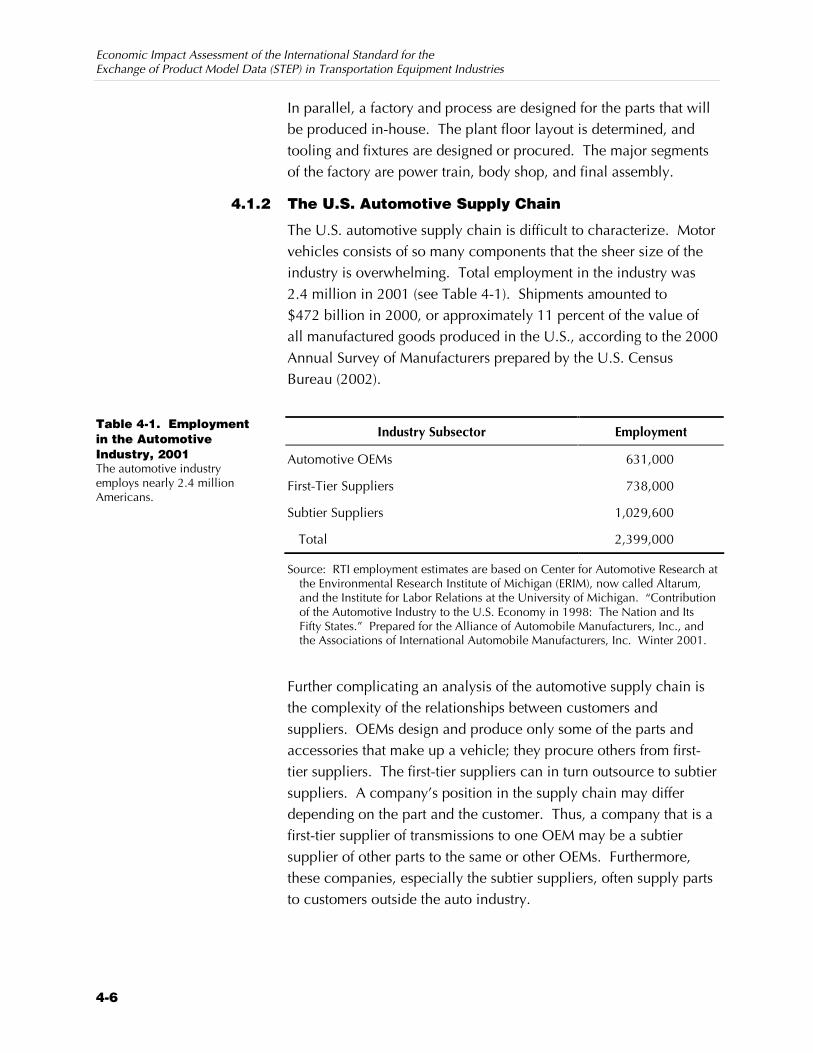
Economic Impact Assessment of the International Standard for the Exchange of Product Model Data (STEP) in Transportation Equipment Industries
4-6
In parallel, a factory and process are designed for the parts that will be produced in-house. The plant floor layout is determined, and tooling and fixtures are designed or procured. The major segments of the factory are power train, body shop, and final assembly.
4.1.2 The U.S. Automotive Supply Chain
The U.S. automotive supply chain is difficult to characterize. Motor vehicles consists of so many components that the sheer size of the industry is overwhelming. Total employment in the industry was 2.4 million in 2001 (see Table 4-1). Shipments amounted to $472 billion in 2000, or approximately 11 percent of the value of all manufactured goods produced in the U.S., according to the 2000 Annual Survey of Manufacturers prepared by the U.S. Census Bureau (2002).
Industry Subsector Employment
Automotive OEMs 631,000
First-Tier Suppliers 738,000
Subtier Suppliers 1,029,600
Total 2,399,000
Source: RTI employment estimates are based on Center for Automotive Research at the Environmental Research Institute of Michigan (ERIM), now called Altarum, and the Institute for Labor Relations at the University of Michigan. “Contribution of the Automotive Industry to the U.S. Economy in 1998: The Nation and Its Fifty States.” Prepared for the Alliance of Automobile Manufacturers, Inc., and the Associations of International Automobile Manufacturers, Inc. Winter 2001.
Further complicating an analysis of the automotive supply chain is the complexity of the relationships between customers and suppliers. OEMs design and produce only some of the parts and accessories that make up a vehicle; they procure others from first-tier suppliers. The first-tier suppliers can in turn outsource to subtier suppliers. A company’s position in the supply chain may differ depending on the part and the customer. Thus, a company that is a first-tier supplier of transmissions to one OEM may be a subtier supplier of other parts to the same or other OEMs. Furthermore, these companies, especially the subtier suppliers, often supply parts to customers outside the auto industry.
Table 4-1. Employment in the Automotive Industry, 2001 The automotive industry employs nearly 2.4 million Americans.

Section 4 — STEP End Users
4-7
Production infrastructure, such as hardware, tooling, robots, and software, is also an important part of the supply chain (Fine and Whitney, 1996). The supply chain in the automobile market, therefore, comprises a long, dynamic, and complex network that involves the OEMs, first-tier suppliers, subtier suppliers, and companies that provide infrastructure.
Finally, the relationships between the customers and suppliers are changing over time as competitive pressures force changes on the industry. In response to Japanese competition, U.S. automakers are reducing the time it takes to develop a concept into a final product by adopting the philosophies of core competence and concurrent design. The adoption of these philosophies is forcing significant changes in the relationships between the OEMs and their suppliers (Flynn et al., 1996).
All of these factors complicate the task of clearly identifying and describing the different components of the automotive supply chain. Analysts have proposed two competing characterizations of the supply chain. The first identifies a company’s position in the supply chain based on its customers. If a company directly supplies the OEMs, it is a first-tier supplier; a subtier company supplies the first tier, and so on. However, this definition is difficult to operationalize in today’s business scenario because a supplier can simultaneously serve multiple customers. As noted earlier, the same company can act as a first-tier supplier on one project and as a subtier supplier on another project.
An alternative characterization identifies a company’s position in the supply chain based on its products and its role in production. The first-tier suppliers are responsible for integrating systems, while the subtier supplies modules or subsets of systems, and the next subtier contributes components and basic material (Phelan, 1997; Flynn et al., 1996).
Despite the limitations of both characterizations, it is useful to choose one to facilitate a discussion of the industry’s structure. We use the first method for characterizing the industry. Figure 4-2 provides a simplified view of the overall industry structure. The OEM market is highly concentrated: a few large firms dominate the
The supply chain in the automobile market comprises a long, dynamic, and complex network that involves the OEMs, first-tier suppliers, subtier suppliers, and companies that provide infrastructure.

Economic Impact Assessment of the International Standard for the Exchange of Product Model Data (STEP) in Transportation Equipment Industries
4-8
Figure 4-2. U.S. Automotive Supply Chain The U.S. automotive industry is less concentrated and more competitive in downstream segments of the supply chain.
Original Equipment Manufacturers• highly concentrated• “Big Three” (Chrysler, Ford, and GM)
First Tier• hundreds of companies• some large and some small
Subtier• thousands of companies• mostly small
InfrastructureSuppliers
market. The first-tier market is more competitive. There are hundreds of first-tier suppliers, some of which are very large with sales of billions of dollars.
The subtier market is even more competitive and consists of thousands of smaller companies in addition to a few large companies. Some first-tier suppliers also operate on the subtier by either vertically integrating or by supplying parts to their rivals on the first tier. Infrastructure suppliers often supply software, hardware, tooling, and robots to all levels of the supply chain. Some of the major players at each level of the automobile supply chain are characterized below.
Original Equipment Manufacturers
Fifteen major automotive OEMs operate in the United States. The “Big Three”—DaimlerChrysler, Ford Motor Company, and General Motors Corporation (GM)—are the major U.S. automobile OEMs, but they also own subsidiaries that produce other products, such as heavy- and light-duty trucks and school buses. In addition to the Big Three, several domestic truck manufacturers and foreign automobile producers have U.S. manufacturing plants either through joint ventures with other manufacturers or as wholly owned subsidiaries. These foreign manufacturers are included in this analysis because they are supplied by, and therefore exchange product model data with, U.S. firms and most have design teams based in the U.S. Therefore, we use OEMs in the broadest sense of the term to cover all firms

Section 4 — STEP End Users
4-9
producing motor vehicles in the United States. Table 4-2 lists the major OEMs with manufacturing establishments in the U.S. This list is not comprehensive as several specialty manufacturers are not included therein, however the list gives a sense of the scope of motor vehicle production in the U.S.
Table 4-2. Major OEMs Operating in the U.S. Fifteen major OEMs operate manufacturing facilities in the United States, employing nearly 587,000 people.
OEM 2001 Number of U.S. Employees
(persons)
Auto Alliance International Inc. 3,200
BMW Manufacturing of North America, Inc. 4,000
DaimlerChrysler Corp.a 123,600
Ford Motor Company 163,200
General Motors Corporation 212,000
Honda of America Manufacturing, Inc. 13,200
Mack Trucks, Inc. 5,700
Mitsubishi Motor Manufacturing of America 4,000
Navistar International Corp. 16,000
New United Motor Manufacturing, Inc. 4,800
Nissan Motor Manufacturing Corp USA 5,900
PACCAR, Inc.b 18,000
Suburu-Isuzu Automotive, Inc. 2,300
Toyota Motor Manufacturing of USA, Inc. 7,600
Volvo Trucks North America, Inc. 3,200
aIncludes Chrysler Group, Mercedes-Benz, Freightliner, Sterling, and Western Star. bIncludes Kenworth and Peterbuilt.
Source: Individual company 10-K reports and web sites.
First-Tier Suppliers
The first tier of the supply chain consists of several hundred companies. Each supplier, depending on its size and diversity, can produce anything as minor as a part for a major system (fasteners for the brake system) or as integral as the entire axle assembly. Many of the larger companies have several divisions and sites and are responsible for producing several parts, systems, components, and

Economic Impact Assessment of the International Standard for the Exchange of Product Model Data (STEP) in Transportation Equipment Industries
4-10
accessories. Many suppliers are also increasing their input into designing and manufacturing complete modules or systems rather than just building simple component parts based on OEM specifications. Therefore, sharing data throughout the product life cycle has become an important feature of a first-tier supplier’s operations.
First-tier suppliers often work for multiple OEMs. For example, TRW conducts 23 percent of its business with Ford and 10 percent with GM. Johnson Controls earns 11 percent of its revenues from Chrysler and 10 percent from Ford (NIST, 1997). To varying degrees, each OEM requires its suppliers to use a specific CAx design system. For example, Chrysler requires all of its first-tier suppliers to use CATIA on their work for Chrysler (AIAG, 1997a). Ford has mostly shifted from Computervision (CV) to I-DEAS in power train design work and from PDGS to I-DEAS in body design work. GM uses Unigraphics (UG) but has become increasingly less stringent about “requiring” suppliers to use UG. The use of multiple CAx systems by the different OEMs forces many suppliers of multiple OEMs to purchase and maintain multiple design systems or invest in expensive translation software. Furthermore, many suppliers have customers outside the auto industry that require similar CAx data. This mixed-customer base exacerbates the data exchange problem by bringing even more CAx systems into the mix. Table 4-3 lists several of the largest members of the first tier of the automotive supply chain and their primary products.
Subtier Suppliers
The subtiers of suppliers consist of thousands of smaller companies that work with OEMs only indirectly via other suppliers. An exception would be some of the first-tier suppliers that also operate on the subtier by supplying parts to their rivals on the first tier. An example is Dana Corporation, which directly supplies Ford (18 percent of its revenue) and Chrysler (11 percent of its revenue). Dana also acts as a subtier supplier to Eaton, which, in turn, supplies Ford. The subtier companies that have no direct OEM business are relatively smaller companies that supply integral components or modules to the first tier without having much interaction with the OEMs.
The use of multiple CAx systems by the different OEMs forces many suppliers of multiple OEMs to purchase and maintain multiple design systems or invest in expensive translation software.
Business consolidation and the desire of the OEMs to reduce their direct supplier base is leading to fewer, larger first-tier suppliers. Many former first-tier suppliers are now becoming second-tier suppliers as first-tiers take on greater responsibilities for designing and producing major components.

Section 4 — STEP End Users
4-11
Table 4-3. Characteristics of a Sample of Automotive First-Tier Suppliers First-tier suppliers vary in terms of their size and the range of parts and components they produce.
Company 2001 U.S. Automotive
Employment Primary Products Delphi Automotive Systems 69,916 Brakes, steering, suspension, cockpit
components, wire harness Visteon Automotive Systems 45,000 Steering, chassis, electrical, energy and engine
management, interior, electronic components Dana Corporation 57,000 Structural, engine, chassis, sealing, brake and
fluid system products Johnson Controls, Inc. 23,550 Seats, interior trim, batteries Robert Bosch Corporation 10,900 Safety systems, break systems, fuel injection
systems, electrical and electronic equipment TRW, Inc. 32,800 Steering suspension, braking, engine
components, fasteners, occupant restraint systems, electronic safety and security
Denso International America, Inc.
10,069 HVAC, electrical and electronic components, filters, fuel management systems
Eaton Corporation 15,607 Powertrain system components, electrical and electronic controls
ThyssenKrupp Automotive AG 17,800 Body systems, chassis modules, powertrains, suspensions, steering systems, drivetrains
American Axle & Manufacturing Holding, Inc.
9,629 Chassis and driveline systems, forged products
Yazaki North America, Inc. 1,000 Electrical distribution systems, electronics, instrumentation, connectors and components
Cummins Engine Co. 15,000 Diesel engines Valeo, Inc. 11,200 Electronic/electronics, thermal systems,
transmissions
Source: Individual company 10-K reports and web sites.
4.2 AEROSPACE INDUSTRY The U.S. aerospace industry is the largest in the world. U.S. aerospace manufacturers shipped $126.6 billion in products in 2000 (U.S. Census Bureau, 2002), and employed 800,100 people, according to the Aerospace Industries Association (2001). The largest share of sales and employment is accounted for by a small number of firms that compete with Europe in the global market.
Like many global markets, the aerospace industry is under pressure from commercial and government clients to produce more effective and efficient products at a reasonable cost (see Table 4-4). Recently, European consortia have gained market share and have become a force in commercial and scientific markets that were traditionally American dominated.
The U.S. aerospace industry is the largest in the world. U.S. aerospace manufacturers shipped $126.6 billion in products in 2000, and employed 800,100 people.

Economic Impact Assessment of the International Standard for the Exchange of Product Model Data (STEP) in Transportation Equipment Industries
4-12
Table 4-4. Aerospace Product Categories In addition to commercial aviation aircraft, the U.S. aerospace industry manufactures satellites and missile systems, among other products.
Large Transports Space-Launch Vehicles
General Aviation Aircraft Satellites
Rotorcraft Missile Systems
Regional Jets Defense Aviation
Aerospace firms rely on CAx technologies to reduce design and development costs, which in turn make the industry’s output more price competitive. The aerospace industry has been very active in the development and implementation of STEP.
In this section, we discuss the types of aircraft and other aerospace products produced in the U.S. and describe the design and development process. We focus on the methods used to design commercial aircraft and the roles CAx systems play in the design process, including information on current aerospace trends, the major manufacturers, and their suppliers.
4.2.1 Aerospace Design and Development
This section provides an overview of the aerospace design and development process and the methods used in commercial aircraft design. The same basic methods are used to design most other aerospace products. Where appropriate, differences in CAx and PDM requirements among commercial aircraft, military aircraft, and other aerospace products are highlighted.
Aircraft design is a compromise among many competing factors and constraints. Designers must balance aerodynamics and geometry, propulsion, and airworthiness with fuel efficiency, end-use application, and cost. The process is labor-intensive and the design and development process requires the participation of many specialist departments. These specialty departments make their contributions and then present the designs to technical and economic evaluators, who coordinate a systematic search for the optimum configuration.
The design process itself typically begins with the identification of a “need.” This need may come from customers, market analysis, or
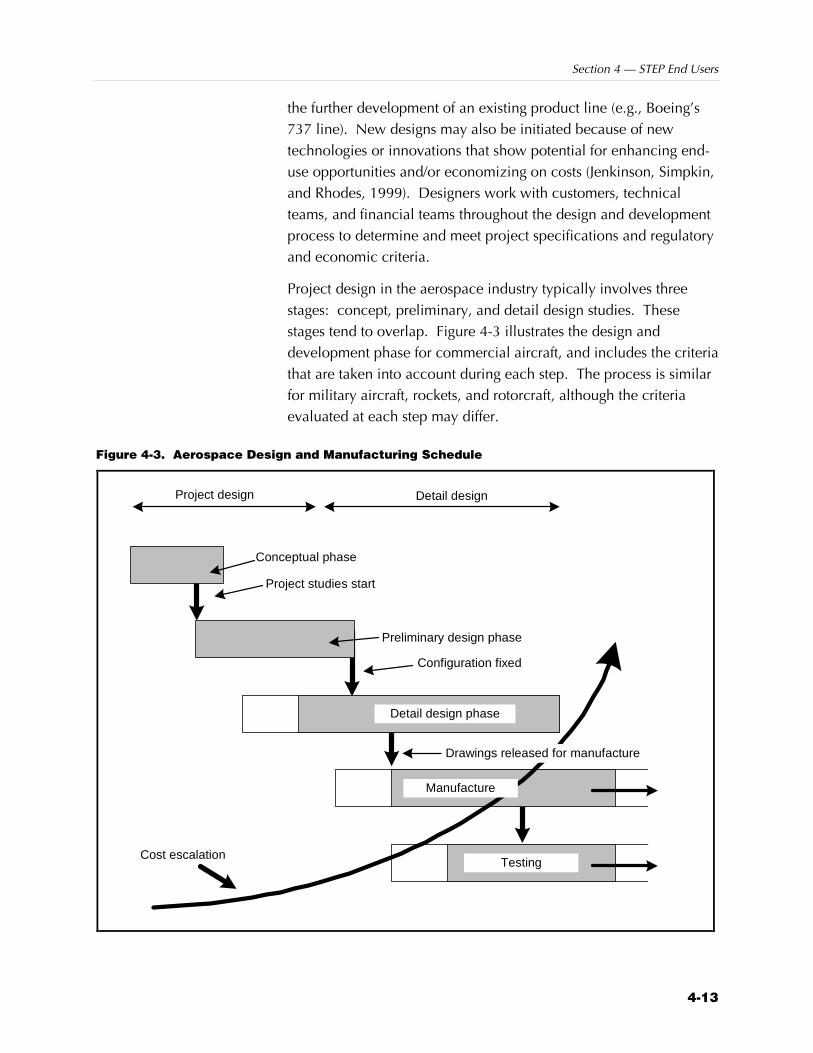
Section 4 — STEP End Users
4-13
the further development of an existing product line (e.g., Boeing’s 737 line). New designs may also be initiated because of new technologies or innovations that show potential for enhancing end-use opportunities and/or economizing on costs (Jenkinson, Simpkin, and Rhodes, 1999). Designers work with customers, technical teams, and financial teams throughout the design and development process to determine and meet project specifications and regulatory and economic criteria.
Project design in the aerospace industry typically involves three stages: concept, preliminary, and detail design studies. These stages tend to overlap. Figure 4-3 illustrates the design and development phase for commercial aircraft, and includes the criteria that are taken into account during each step. The process is similar for military aircraft, rockets, and rotorcraft, although the criteria evaluated at each step may differ.
Figure 4-3. Aerospace Design and Manufacturing Schedule
Preliminary design phase
Conceptual phase
Detail design phase
Project studies start
Configuration fixed
Testing
Project design Detail design
Drawings released for manufacture
Manufacture
Cost escalation
Economic Impact Assessment of the International Standard for the Exchange of Product Model Data (STEP) in Transportation Equipment Industries
4-14
Concept Design
Concept design studies incorporate conventional and novel configurations to determine layouts that are technically feasible and economically viable. All options and aspects are considered. During this phase, each alternative must be investigated as completely as the level of time and detail allow. The quantity of data generated on each design is relatively limited and the amount of manpower expended is small. A detailed analysis of each design at this stage is not economically feasible and may be of limited value because most of the concepts are discarded (Jenkinson, Simpkin, and Rhodes, 1999). For designs that are either redevelopments or based on conventional/historical designs, experience from previous designs provides a base of knowledge about size, layout, and operating parameters.
Preliminary Design Studies
Preliminary design studies advance concepts that were not eliminated as too risky or unfeasible. Concepts are more rigorously studied and evaluated during this stage, and all parameters remain variable. The primary objective during this stage is to determine the optimum geometry.
Designers determine a “baseline” design, and then develop several variations. At the same time, the design team also studies its competitors’ products, performs trade-off studies in detailed technical areas, and tests the sensitivity of the baseline design to changes in design constraints (Jenkinson, Simpkin, and Rhodes, 1999). Key issues to be explored during this phase include aerodynamics, propulsion, weights, and structures.
Detailed Design Studies
Detailed design studies begin at the end of the parametric analyses of the baseline design. The distinction between the preliminary and detail design phases is somewhat blurred due to the individualistic definition of detail design in the project stage. The two parts are sometimes linked and termed the “preliminary design phase.” The project design activity ends when the configuration is determined and a decision is made to proceed to the detail design phase.
Designers then determine the project’s layout in greater detail, beginning to finalize the new design. External shapes and the

Section 4 — STEP End Users
4-15
structural framework are fixed. Few radical changes to layout and geometry are made because any major changes may invalidate analyses already conducted by other departments and may return the design to earlier design stages. Detailed optimization studies are limited to the parts and systems to be incorporated into the overall design. Detailed component geometry is specified and the manufacturing processes are planned in this phase (Jenkinson, Simpkin, and Rhodes, 1999). At the end of this process, the design is released for manufacture and testing.
4.2.2 The Role of CAx Systems in the Aerospace Industry
As in the automotive industry, the aerospace industry adopted CAx technologies primarily to support concurrent engineering. Aerospace manufacturers accrue the same categories of benefits as the other two industries covered in this report. The discussion that follows explores the ways in which the aerospace industry has benefited and continues to benefit, including two examples at Boeing and Lockheed Martin.
Aerospace firms rapidly incorporate new technologies into their design and production processes to enhance their competitiveness. This is particularly true of the larger firms, whose products are becoming more expensive as they become more sophisticated. The benefits of new, cost-saving technologies help offset the research and development costs, making end-products more viable. This is particularly true during an area of reduced U.S. and foreign government defense spending and invigorated foreign competition (Beckert, 1999).
Prior to CAx adoption, aerospace firms (particularly aircraft producers) moved concepts and designs through specialist departments sequentially. Each department would conduct its analysis and make its contributions before routing the design to other departments. CAx systems today allow departments to access designs concurrently, reducing the time necessary to analyze and develop new designs. CAx technologies also allow more detailed investigations, such as dynamic flight simulation and structural finite element analysis, at earlier stages in the design process (Jenkinson, Simpkin, and Rhodes, 1999).

Economic Impact Assessment of the International Standard for the Exchange of Product Model Data (STEP) in Transportation Equipment Industries
4-16
CAx systems enable virtual prototyping, in which various design concepts are explored in a virtual environment before costly physical prototypes are built (Beckert, 1999). Engineers can optimize their designs, contributing to better quality products. Boeing’s 777 aircraft is the first completely new large transport design developed without a physical mock-up. The plane has 85,000 components and over 4 million parts.
Boeing’s goal is to achieve the same number of manufacturing hours as the 767 for an aircraft with 57 percent greater empty weight. Boeing reported a 93 percent reduction in design changes compared with earlier aircraft at similar stages of development (Kaminski, 1996).
Similarly, Lockheed Martin was able to meet its production schedule for the Atlas III rocket with significant cost savings because of these new technologies, which showed how 17,000 unique parts and assemblies would fit together in a virtual prototype (Beckert, 1999).
CAx technologies also permit supplier integration in the design and development process. Suppliers can receive electronically submitted component specifications, and begin to design components and prepare the tooling needed to manufacture them. Suppliers can then transmit data back to the OEM, informing the OEM of the component’s operating parameters, geometry, and feasibility. CAx enables a more seamless chain between suppliers and OEMs.
The design process is still iterative, however, requiring months (if not years) to develop a final production design (NRC, 1998). Delays caused by the data exchange problems from one department to another can potentially be costly, although manufacturers may hedge against the latter by uniformly adopting one CAD suite.
4.2.3 The Aerospace Industry Supply Chain
The market for aerospace products is highly competitive even though there are relatively few major players; an OEM competes against one or two other domestic firms and a handful of foreign firms for contracts. The industry is capital, intellectual, and technology intensive, and is relatively concentrated because of the resources needed to design and bring products to market.
Boeing’s 777 aircraft is the first completely new large transport design developed without a physical mock-up.
Section 4 — STEP End Users
4-17
In many respects, the relationship between OEMs, first-tier suppliers, and subtier suppliers mimics that of the automotive industry: large OEMs, such as Boeing, Pratt & Whitney, and GE Aircraft Engines, are serviced by a series of major suppliers, which to a certain extent share design and engineering responsibilities for component systems and subassemblies. But the aerospace industry also has a number of high-profile market players that manufacture highly engineered products for specific applications, such as satellites, missile systems, and rockets. Consequently, these players consequently maintain nearly all design and engineering activities in-house, and send out detailed designs for contract manufacture.
The remainder of this section discusses supply chain participants and reviews some of the industry trends affecting the health of the sector.
Original Equipment Manufacturers
The largest U.S. aerospace firms have operations in at least three of the four major market segments; aircraft, missile systems, space-launched vehicles, and satellite systems. These firms experience economies of scale as research in one segment generates opportunities and technical know-how that spills over into its other product lines. The push for greater opportunities and synergies in R&D and manufacturing techniques has recently led to a period of consolidation.
Consolidation among major aerospace and defense companies has proceeded rapidly in the United States. This trend has enhanced U.S. competitiveness as whole in this industry (Wells, 2000). Three large companies currently dominate the industry: Boeing, Lockheed Martin, and Raytheon. These firms provide the bulk of the commercial and military aircraft, space-launch vehicles, and missile systems in operation in the United States today, and are the worldwide leaders in select product markets.
Although the markets for large transports, satellites, and defense products are dominated by large companies, niche markets supported by smaller firms exist and continue to be profitable. Niche markets, such as rotorcraft and general aviation, include companies such as Textron (which owns Bell Helicopter and Cessna), Robinson Helicopter, Mooney, and New Piper Aircraft. Table 4-5 provides information about several leading OEMs.
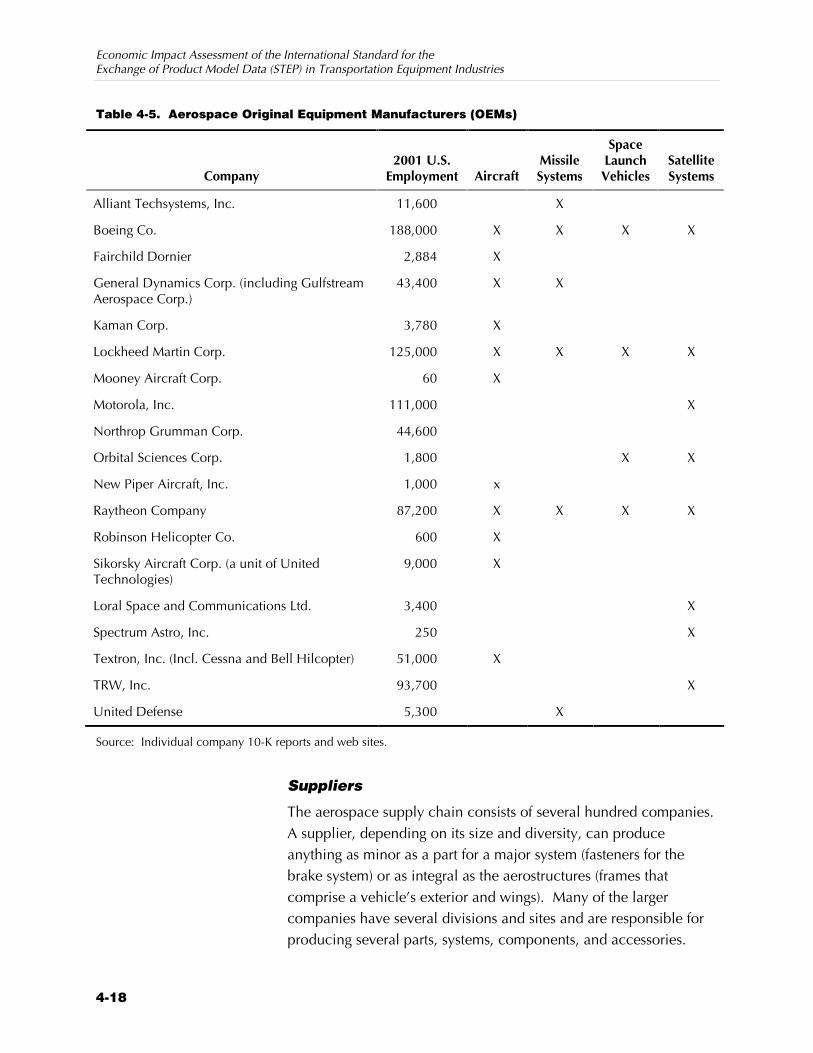
Economic Impact Assessment of the International Standard for the Exchange of Product Model Data (STEP) in Transportation Equipment Industries
4-18
Table 4-5. Aerospace Original Equipment Manufacturers (OEMs)
Company 2001 U.S.
Employment Aircraft Missile Systems
Space Launch Vehicles
Satellite Systems
Alliant Techsystems, Inc. 11,600 X
Boeing Co. 188,000 X X X X
Fairchild Dornier 2,884 X
General Dynamics Corp. (including Gulfstream Aerospace Corp.)
43,400 X X
Kaman Corp. 3,780 X
Lockheed Martin Corp. 125,000 X X X X
Mooney Aircraft Corp. 60 X
Motorola, Inc. 111,000 X
Northrop Grumman Corp. 44,600
Orbital Sciences Corp. 1,800 X X
New Piper Aircraft, Inc. 1,000 x
Raytheon Company 87,200 X X X X
Robinson Helicopter Co. 600 X
Sikorsky Aircraft Corp. (a unit of United Technologies)
9,000 X
Loral Space and Communications Ltd. 3,400 X
Spectrum Astro, Inc. 250 X
Textron, Inc. (Incl. Cessna and Bell Hilcopter) 51,000 X
TRW, Inc. 93,700 X
United Defense 5,300 X
Source: Individual company 10-K reports and web sites.
Suppliers
The aerospace supply chain consists of several hundred companies. A supplier, depending on its size and diversity, can produce anything as minor as a part for a major system (fasteners for the brake system) or as integral as the aerostructures (frames that comprise a vehicle’s exterior and wings). Many of the larger companies have several divisions and sites and are responsible for producing several parts, systems, components, and accessories.
Section 4 — STEP End Users
4-19
Many suppliers are also increasing their input into designing and manufacturing complete modules or systems rather than just building simple component parts based on OEM specifications. Therefore, sharing data throughout the product life cycle has become an important feature of a supplier’s operations.
OEMs are becoming more vertically integrated and demanding, and many suppliers are reacting by purchasing other suppliers to become more vertically integrated, to lower costs, and to enhance economies of scale. OEMs may also subcontract to one another. For example, Northrop Grumman supplies the aft fuselage of the F-18 E/F fighter to Boeing.
Table 4-6 lists a sampling of some of the largest and smallest suppliers in the aerospace industry that do not also manufacture aircraft. Many of these companies are involved in multiple lines of business; all the sales and employment listed with each company are necessarily directly associated with their aerospace products. Table 4-6 also includes the major U.S. engines suppliers, such as General Electric and United Technologies’s Pratt & Whitney. It should be noted that for certain types of aircraft, usually commercial airlines and large military transport, engines are purchased separately from the aircraft. However, for other types of aircraft, the engines are part of the original equipment.
Industry Trends
Large Transports. The market for large transports is closely tied to economic growth, with a lag of about 3 or 4 years (Wells, 2000). As economies grow, passenger travel increases, which fuels demand for these aircraft. The 2000 U.S. value of shipments for this segment is anticipated to be $26.6 billion on 480 units.
Modifications to U.S.-built large transports are expected to be based on variations of existing designs for the near future. Boeing has no plans to introduce a new aircraft, having just launched the 777. Boeing’s objectives are to enhance existing designs with the goal of building aircraft that fly faster, higher, and farther on less fuel. Both Boeing and its rival, Airbus, aim to reduce production costs, pollutants, and noise, while adding more seats.

Economic Impact Assessment of the International Standard for the Exchange of Product Model Data (STEP) in Transportation Equipment Industries
4-20
Table 4-6. Sampling of Aerospace Industry Suppliers
Company 2001
Employment Sample Business Area(s)
Aerostructures Corp. 2,800 Aerostructures
Argo-Tech Corp. 696 Fuels systems and pumps
Ball Aerospace & Technologies Corp. 2,238 Satellite and communications components
Barnes Group 5,150 Machined and fabricated components and assemblies
Goodrich Co. 19,020 Aerostructures, landing systems, maintenance, repair, and overhaul, sensors and integrated systems, mechanical systems
Crane Co. 9,600 Braking systems
Curtiss-Wright Corp. 2,625 Motion control systems
DRS Technologies, Inc. 2,780 Electronic and communications systems
EDO Corporation 1,603 Mechanical systems
Esterline Technologies Corp. 4,100 Components, lighting, cable assemblies
General Electric Co. 310,000 Engines and engine components
Harris Corp. 10,100 Communications systems and electronic components
Heico Corp. 1,102 Space and aircraft parts
Hexcel Corp. 5,376 Structural materials
Honeywell International, Inc. 115,000 Engines, flight and landing systems, avionics, lighting
LMI Aerospace, Inc. 748 Framed aluminum parts
Pacific Aerospace, Inc. 1,041 Electronics and metal components and subassemblies
Parker Hannifin Corp. 46,300 Hydraulic systems
Hamilton Sundstrand 17,200 Mechanical systems
Woodward Governor Co. 3,654 Fuel systems
Pratt & Whitney 30,000 Engines
Source: Individual company 10-K reports and web sites.
Like Boeing, Airbus intends to continue the redevelopment of existing lines, but also plans to continue its development of super carriers meant to seat 500 or more passengers on two decks. The designs of both firms will incorporate new technologies and materials, including advanced composites and alloys.
Section 4 — STEP End Users
4-21
Defense Aviation. The largest defense contractors, Boeing and Lockheed Martin have been awarded contracts amounting to over $20 billion per year in the late 1990s for the development of new fighter aircraft. These companies have various projects under development, all of which are expected to have high export potential (Wells, 2000). Current projects include the Joint Strike Fighter to replace aging F-16s, F-22 Raptors to replace F-15s, large transports to replace C-130s, and new bombers, helicopters, and refuelers. The health of this market is directly related to U.S. defense spending and is subject to political uncertainty. However, total U.S. defense spending has been increasing moderately after cuts that brought totals from $163.7 billion in 1985 to $128.8 billion in 1998. The 2000 U.S. value of shipments for the defense aviation segment is anticipated to be $15 billion for 515 units.
General Aviation and Regional Jets. New federal programs and healthier domestic and foreign economies have fueled the market for general aviation aircraft. The Advanced General Aviation Transport Experiment, a cost-sharing industry-university-government partnership, is intended to develop new and more affordable technologies and standards. The demand for pleasure aircraft, business jets, and regional jets is up because of increased business travel, increased willingness for companies to operate their own aircraft, the rapid growth of shared ownership programs, and airlines’ increased use of regional jets to connect hub airports with smaller markets (Wells, 2000). The 2000 U.S. value of shipments for this segment is anticipated to be $6.26 billion for 2,240 units.
Rotorcraft. The helicopter industry faces a number of problems, namely access to heliports, high operating costs, release of surplus military helicopters to the marketplace, and a shortage of realistic access to airspace. However, Kim Wells, an analyst at the U.S. Department of Commerce, expects the market to grow because of these crafts’ outstanding safety record, the variety of missions unique to helicopters, and new models (Wells, 2000). U.S. manufacturers are expected to ship 339 units in 2000, accounting for $197 million in sales.
Missile Systems and Space Launch Vehicles. Many standard U.S. missile systems are aging, and the U.S. government is reacting by replacing these systems to maintain its capabilities and to deter potential threats from new missile programs in emerging markets. A

Economic Impact Assessment of the International Standard for the Exchange of Product Model Data (STEP) in Transportation Equipment Industries
4-22
key trend is to improve targeting and guidance, which has translated into the incorporation of Global Positioning System technologies. U.S. manufacturers have $6.3 billion in orders in process (AIA, 2000).
The international commercial launch services market is expected to thrive over the next 5 years because providers of satellite services have been waiting to place new satellites into orbit (Wells, 2000). The world leader in this market is Europe’s Arianespace consortium, although Russia and the United States have competitive launch programs. Facing stiff foreign competition, most U.S. efforts have focused on the development of reusable launch vehicles, with varying degrees of success. U.S. manufacturers are also pursuing other avenues to enhance their competitiveness, including international government partnerships and joint ventures with European, Japanese, and Russian firms.
Recent years have proved to be disappointing for U.S. launch vehicle firms because of Europe’s continued dominance and a string of U.S. launch failures. Launch failures in 1999 alone cost U.S. taxpayers over $3 billion. The 2000 forecasted value of shipments for missile systems and space launch vehicles is $21.9 billion. Space propulsion units are expected to be worth $3.8 billion to U.S. manufacturers.
Satellite Systems. U.S. firms control 65 percent of the global satellite manufacturing industry (about $11.5 billion). The industry is under pressure from commercial and government clients to reduce the time needed to manufacture new satellites. New production efficiencies and design changes have reduced that time from 30 months to 18 to 24 months, with further reductions expected in the near future. However, overall quality has declined (Wells, 2000). The industry has recently recommitted itself to quality control and quality assurance, but it faces the dilemma of producing more complex, longer-lasting satellites in short time frames.
4.3 SHIPBUILDING INDUSTRY The U.S. shipbuilding industry is a mature industry in a state of change. The industry is enlisting new federal programs and technologies to rebuild its competitiveness in global commercial

Section 4 — STEP End Users
4-23
ship markets in an era of fewer U.S. Navy contracts for warships. The use of CAD/CAM systems in the shipbuilding industry has cut lead times for design and development, as well as the amount of time and number of iterations needed to arrive at a working solution for the design of a new ship.
The term “ship” typically refers to large ocean-going vessels intended for some purpose other than personal use or recreation. (Recreational watercraft are referred to as “boats.”) Typical shipyards are fixed facilities with drydocks and the fabrication equipment capable of building a large ship. In addition to ship construction, shipyards are engaged in many related activities, most importantly repair and maintenance of existing ships, conversion and alteration, and specialized services, such as ship scaling.
Ship types fall into one of several categories (see Figure 4-4), including
Z fishing vessels, such as trawlers and factory ships;
Z harbor and work craft, such as tugboats and cable layers;
Z dry and liquid cargo ships, such as cargo liners and oil tankers;
Z passenger ships, such as cruise ships and ferries; and
Z warships, such as aircraft carriers and submarines.
U.S. firms have the capability to produce each ship type, although the largest shipyards specialize in warships, oil tankers, and cargo liners. There are currently 11 commercial vessels and 88 naval vessels either under construction or under contract. The total value of these projects is approximately $18.6 billion (U.S. Census Bureau, 2000). The U.S. ranks 12th in terms of the gross tonnage of ships built per year, behind South Korea, Japan, Poland, Spain, and Finland, among other countries.
This section discusses the type of ships produced in the United States and the ship design and development process, focusing on the methods used to design ships and the roles played by CAD/CAM and PDM systems. The section concludes with information on current shipbuilding trends, the major shipbuilders, and their suppliers.
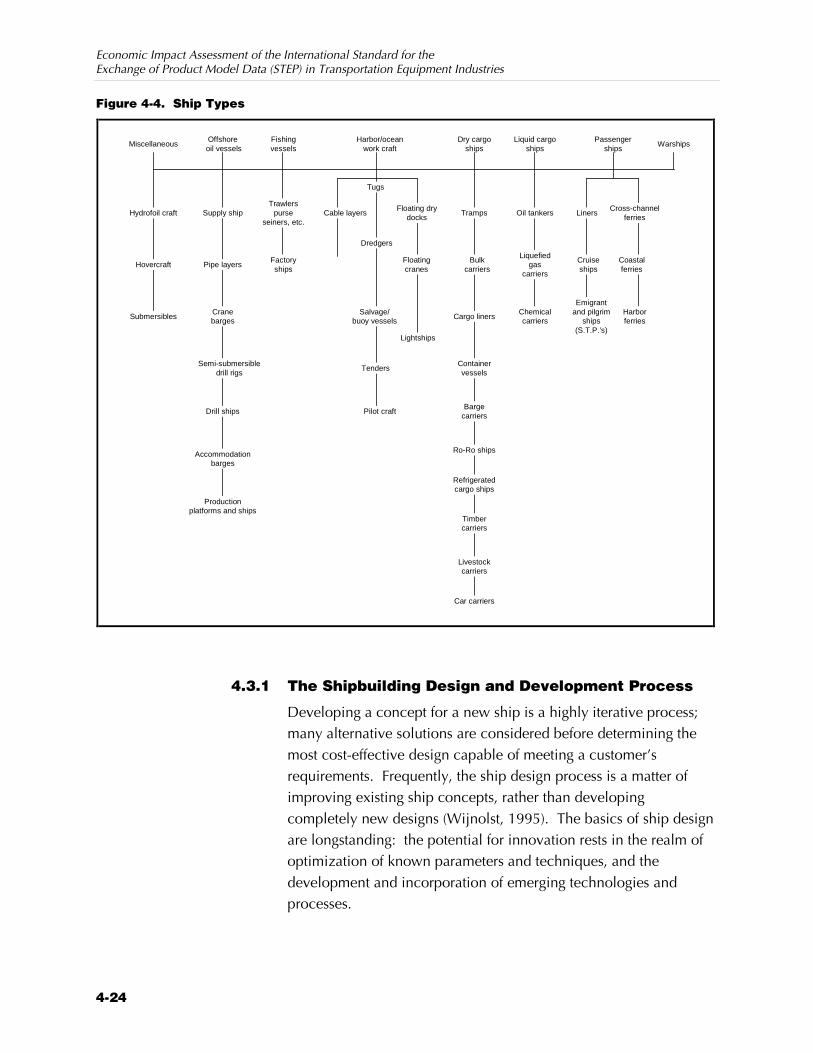
Economic Impact Assessment of the International Standard for the Exchange of Product Model Data (STEP) in Transportation Equipment Industries
4-24
Figure 4-4. Ship Types
MiscellaneousOffshore
oil vesselsFishingvessels
Harbor/oceanwork craft
Dry cargoships
Liquid cargoships
Passengerships
Warships
Hydrofoil craft Supply ship
Hovercraft Pipe layers
SubmersiblesCranebarges
Semi-submersibledrill rigs
Drill ships
Accommodationbarges
Productionplatforms and ships
Trawlerspurse
seiners, etc.
Factoryships
Cable layers
Tugs
Floating drydocks
Dredgers
Floatingcranes
Salvage/buoy vessels
Lightships
Tenders
Pilot craft
Tramps
Cruiseships
Cargo liners
Containervessels
Bargecarriers
Ro-Ro ships
Refrigeratedcargo ships
Timbercarriers
Livestockcarriers
Car carriers
Oil tankers
Coastalferries
Chemicalcarriers
LinersCross-channel
ferries
Emigrantand pilgrim
ships(S.T.P.’s)
Harborferries
Liquefiedgas
carriers
Bulkcarriers
4.3.1 The Shipbuilding Design and Development Process
Developing a concept for a new ship is a highly iterative process; many alternative solutions are considered before determining the most cost-effective design capable of meeting a customer’s requirements. Frequently, the ship design process is a matter of improving existing ship concepts, rather than developing completely new designs (Wijnolst, 1995). The basics of ship design are longstanding: the potential for innovation rests in the realm of optimization of known parameters and techniques, and the development and incorporation of emerging technologies and processes.

Section 4 — STEP End Users
4-25
Ship Design Methods
Ship design methods are divided into two general categories: comparison and iterative design. The comparison method replicates an existing design whereas the iterative method entails developing an entirely new ship design that is not based on previous designs.
A substantial number of design cycles may be included in the comparison method; however, most of the basic parameters, ratios, and production techniques are predetermined. Design cycles are used to finalize the ship design’s particulars, not to rethink the ship design as a whole.
The advantage of the comparison method is that the ship can be built relatively quickly and inexpensively, because most costs, weights, and measurements are based on an existing designs. However, this method can only be used when there is extensive information available on a preexisting ship. Shipbuilders seeking to reproduce an earlier design may use this method, but it is unlikely that a competing shipyard would have access to the specifics of that design. This method is generally used for cargo ships, ferries, and heavy-lift ships (Eyres, 1994). Furthermore, any flaws in the original design may also be incorporated in the replicated ship. Typically, once the first in a class of military ships has been designed, the follow-on ships of that class are modifications of the original. The CVN76 (Ronald Reagan) currently under construction at Newport News is basically the same design as the original ship in its class, the Nimitz, commissioned over 25 years ago. The same is true of the DDG-51 series of destroyers, of which over 25 have been produced at Ingalls and Bath, and most large commercial ships.
However, most very large commercial and military ships are designed using the iterative method because they are more likely to have unique specifications for which existing designs are not available (Wijnolst, 1995). The iterative design method develops completely new designs, incorporating new dimensions, powering, and hull structures. Designers balance the dimensions and characteristics of the ship until the best design is developed to meet customer requirements. This process is frequently depicted as a spiral, where the outer circles represent early design iterations (see Figure 4-5). As the design is reworked and its characteristics are finalized, the designer moves toward the center of the spiral. The

Economic Impact Assessment of the International Standard for the Exchange of Product Model Data (STEP) in Transportation Equipment Industries
4-26
Vesselobjectives
Ship Construction
Proportions
Lines
Hydro-statics
Freeboardand subdivision
Generalarrangements
Structure
Powering
Weightestimate
Concept design
Capacities
Stability
Costestimate
Preliminary design
Contract design
designer works toward the next solution, adjusting and balancing the interrelated parameters as he/she goes (Eyres, 1994).
There are three basic steps in the ship design and development phase: concept design, preliminary design, and contract design. Throughout the design process, designers are working with the shipowners, third-party consultants and naval architects, and subcontractors to finalize the new ship’s design (Eyres, 1994; Wijnolst, 1995).
The concept design stage is the initial part of the design phase where the shipowner’s specifications are translated into naval architectural and engineering characteristics. The objective of concept design is to define a ship in sufficient detail to
Z demonstrate that a customer’s key requirements (capacity, speed, regulatory approval, etc.) can be met;
Z identify areas of high technical or operational risk; and
Z establish a basis for the completed ship (Fuller, 1994).
At the end of the concept design phase, enough information is available to perform a basic technical and economic assessment of
Figure 4-5. Ship Design Spiral
Section 4 — STEP End Users
4-27
the new ship. If the design sufficiently meets basic contractual details, the design process progresses.
The preliminary design stage refines and analyzes the concept design. Major ship characteristics are determined that affect cost and performance, such the particulars concerning powering, structure, and proportions. This stage consists of several “loops” around the design spiral, with the goal being to optimize ship performance with respect to customer specifications. Designers ultimately arrive at a precise definition of a vessel that includes sufficient details to facilitate final contract negotiations.
The contract design stage yields a set of plans and specifications that form an integral part of the final contract (Wijnolst, 1995). During this stage, designers develop detailed working plans covering the hull form, structural detail, powering, and the spacing of the ship’s frames. These plans also describe the installation and construction instructions for welders, ship fitters, outfitters, and the various subcontractors working on the project.
4.3.2 CAx Systems in the Shipbuilding Design and Development Process
Computers have been applied in the shipbuilding industry for over 30 years, first to automate repetitive manufacturing processes and later to streamline the design and development process. In the 1960s and 1970s, computer models of hull structures were developed to connect and optimize the various “points” of the design. These models were first assembled in 2-D, but 3-D designs emerged as the technology advanced. CAD systems offered significant time and labor savings as well as a higher level of accuracy over the detailed drawing and drafting methods.
Before CAD, shipbuilders relied on visualization and physical prototyping in the design process and would spend months building scale models to make sure all the key components connected properly and fit the space available. Now, the data are generated and presented on-screen, with the most appropriate materials and shapes chosen by the software program. Alternative designs that meet the requirements can be more quickly devised, giving builders the ability choose the design that is most durable and efficient (Freedman, 1994).
Economic Impact Assessment of the International Standard for the Exchange of Product Model Data (STEP) in Transportation Equipment Industries
4-28
Currently, CAx and other IT systems help builders bring designs from concept to fabrication more quickly than before. Comprehensive information systems can be used to generate designs, share information with design contributors, order parts from subcontractors, and program machinery. It is estimated that the use of CAx systems has cut time needed to design and assemble a new ship by 30 percent (Loates, 2000).
With CAx, engineers share designs with planning groups much earlier. Designers can electronically transmit plans to other parties for review and additions (Hays and McNatt, 1994).
As in the automobile industry, production design in shipbuilding has evolved to incorporate the concept of concurrent engineering. Concurrent engineering allows the shipbuilder to advance the various aspects of a ship design and production in parallel rather than sequentially. This concept has the potential to greatly reduce lead times and production costs. The difficulty, however, lies in the need to precisely define and rapidly exchange large quantities of information among large numbers of people (Fuller, 1994).
4.3.3 Organization of the Shipbuilding Supply Chain
The U.S. shipbuilding and repair industry is a mature industry centered on a small number of large shipbuilding companies and a loosely organized chain of suppliers. Although many firms operate in this industry, six large shipyards (indicated in bold print in Table 3-7) account for the bulk of the industry’s revenues and employment. According to the American Shipbuilding Association, these six shipyards employ 90 percent of the labor force involved in ship construction (2000a). As will be discussed in the Shipbuilding Suppliers section, the supply chain is loosely organized with suppliers providing raw materials that shipbuilders engineer to suit their specific purposes. With some noted exceptions, there is very little design and engineering interaction between OEMs and suppliers.
Shipbuilders
Two companies own the six largest U.S. shipyards: General Dynamics (NASSCO, Electric Boat, Bath Iron Works); and Northrop Grumman (Avondale, Ingalls, and Newport News Shipbuilding). These companies build aircraft carriers, destroyers, and submarines, among other naval vessels, and less frequently, commercial vessels
It is estimated that the use of CAx systems has cut time needed to design and assemble a new ship by 30 percent (Loates, 2000).

Section 4 — STEP End Users
4-29
(e.g., cargo ships and oil tankers). These two companies compete between one another for domestic and, when congressionally approved, foreign defense contracts. They are vertically integrated, producing many ship components in-house, and horizontally integrated, engaging in other defense industries such as missile systems and aerospace.
The other shipyards listed in Table 4-7 engage primarily in ship repair firms (building an occasional new ship) or are niche-market producers that distinguish themselves from the larger builders. Todd Pacific Shipyard, Inc., and Alabama Shipyard, Inc., are examples of ship repair firms. Gunderson, Inc., and Halter Marine, Inc., are niche-market producers. Gunderson, Inc., specializes in producing large, ocean-going barges but has also built oil tankers. Halter Marine, Inc., produces tugboats, ferries, fishing boats, supply ships, and other mid-sized commercial ships.
Table 4-7. U.S. Shipbuilding Companies There are eleven major shipbuilding companies in the U.S. Six, indicated in bold print, dominate the industry.
Company Location Employment
General Dynamics Corp.
Bath Iron Works, Inc. Bath, ME 8,000
Electric Boat Corp. Groton, CT 9,500
National Steel and Shipbuilding, Co. (NASSCO) San Diego, CA 4,000
Alabama Shipyard, Inc., a unit of Atlantic Marine, Inc. Mobile, AL 900
Halter Marine, a unit of Friede Goldman Halter, Inc. Pascagoula, MS 9,510
Northrop Grumman
Avondale Operations Avondale, LA 5,500
Ingalls Operations Pascagoula, MS 10,000
Newport News Shipbuilding Newport News, VA 18,200
Gunderson, Inc., a unit of Greenbrier Companies, Inc. Portland, OR 1,400
Todd Pacific Shipyard, Inc. Seattle, WA 900
Sources: Dun & Bradstreet via CompaniesOnline, http://www.companiesonline.com, a service of Terra Lycos, S.A., Barcelona, Spain, as obtained on December 11, 2000.

Economic Impact Assessment of the International Standard for the Exchange of Product Model Data (STEP) in Transportation Equipment Industries
4-30
Shipbuilding Industry Trends
The U.S. shipbuilding and repair industry has declined over the past 3 decades, compelling the federal government to launch revival efforts. In 1981, 22 shipyards held ship construction contracts for the federal government, commercial customers, or both. Since that time, the number of active new construction shipyards building large ocean-going vessels has since fallen to six (ASA, 2000b). Numerous factors contributed to the industry’s decline, including
Z the end of federal subsidies for commercial shipbuilding in 1981,
Z U.S. Department of Defense budget cutbacks,
Z fierce international competition for commercial contracts, particularly from East Asia and Northern Europe, and
Z rising labor and materials expenses relative to eastern Europe and Asia.
Statistics from the 1997 Economic Census conducted by the U.S. Census Bureau (1999) indicate that the U.S. shipbuilding and repairs (NAICS 336611) 1997 revenues were $10.6 billion and industry employment was 97,385 (1999). Total employment actually engaged in ship construction was estimated to be 60,000 in 1999, a 30 percent decline from 1990’s level. By way of comparison, during World War II, shipyards employed 1.2 million Americans (ASA, 2000b).
The six remaining new-construction yards actively building ships are large production centers that survive mostly on U.S. Navy contracts. However, recent defense-spending cutbacks have compelled builders to reenter the commercial market. Because the rate of new U.S. Navy contracts has dwindled to eight ships per year, commercial contracts are quickly becoming an important source of revenue. Facilitating this return to commercial contracts are two federal programs:
Z the Federal Ship Financing Guarantee Program (Title XI), which provides federal guarantees of private sector financing and refinancing of construction or refurbishment of U.S.-flag or export vessels; and
Z the MARITECH program, which provides matching government funds to encourage the industry’s development and adoption of advanced technologies aimed at increasing competitiveness and improving the U.S. industrial base.

Section 4 — STEP End Users
4-31
Although these federal programs do not fully compensate for the commercial shipbuilding subsidies canceled under the Reagan administration, they do help the industry’s competitive position relative to foreign suppliers. In recent years, new U.S. construction has included two new cruise ships (the first in 40 years), double-hulled oil tankers, and cargo ships.
International competitiveness is a key issue among large shipbuilders. The ability to increase and maintain competitiveness rests with adopting productivity-enhancing technologies and improving relationships with suppliers. The market for large cargo, passenger, and heavy-lift ships is global. U.S. firms are competing with Asia and Europe, whose large industrial conglomerates frequently benefit from more wide-spread application of robotics, government subsidies, lower wage rates, and better supply chain management (Thurston, 1996; Fleischer, 1999).
Shipbuilding Suppliers
The shipbuilding supply chain is not as complex or structured as the automotive supply chain, although its dynamics are fundamentally the same. The primary reason why the industry’s supply chain is so “loosely” organized is the small number of producers and consumers and because shipbuilders do not outsource as much of their production as the automobile industry. The large shipbuilders keep most activities “in-house.” Large companies typically only subcontract for propulsion and powering systems, navigation systems, heating/air-conditioning and ventilation systems, and interiors, for example. However, design and engineering consultants, such as John J. McMullen Associates and Gibbs & Cox, are increasingly becoming an integral part of the design and development phase. Table 4-8 lists a sampling of the U.S. shipbuilding subcontractors.
However, DoD is increasingly promoting competition between shipbuilders and distributing contracts for ship components among several companies. These factors increase the need for interoperability of CAD/CAM data between different systems.
Accurate estimates on the total employment at shipbuilding suppliers are difficult to obtain. The industry is supplied by a diverse supplier base, many firms supply a wide variety of industries, such as piping providers. As a result, employment
Shipbuilders do not outsource as much of their production as the automotive or aerospace industry. As a result a larger share of their design activities are conducted “in-house.”

Economic Impact Assessment of the International Standard for the Exchange of Product Model Data (STEP) in Transportation Equipment Industries
4-32
Table 4-8. Sampling of the U.S. Shipbuilding Subcontractors
Organization Location Line of Business Employment
John J. McMullen Associates, Inc. Arlington, VA Naval architecture and marine engineering
700
Bird-Johnson Co., a unit of Ulstein Group (Norway)
Walpole, MA Propellers, water jets, and thrusters 353
Goodrich Charlotte, NC Components and Assemblies 27,044
BWX Technologies, a McDermott International
Arlington, VA Nuclear technologies 1,800
Dresser-Rand, a unit of Ingersoll-Rand Corp.
The Woodlands, TX
Energy conversion 669
Lockheed Martin Government Electronic Systems, a unit of Lockheed Martin Corp.
Moorestown, NJ Defense and navigation systems 149,000
Northrop Grumman Corp. Arlington, VA Information and defense systems 44,600
Sperry Marine Inc., a unit of Lockheed Martin Corp.
Charlottesville, VA
Navigation systems 750
Tribon Solutions (Sweden) Annapolis, MD Shipbuilding software NA
Fairbanks Morse, a unit of Enpro Industries
Beloit, WI Marine engines 9,000
GE Marine Engines, a unit of General Electric Corp.
Cincinnati, OH Marine engines 44,000
Gibbs & Cox, Inc. Arlington, VA Naval architecture and marine engineering
NA
Hopeman Brothers Marine Interiors, LLC
Waynesboro, VA
Marine accommodations outfitters NA
Jamestown Metal Marine Sales, Inc.
Boca Raton, FL Marine interiors outfitters NA
Triumph Controls, Inc. North Wales, PA
Remote valve operators 275
United Defense Industries, Inc., a unit of the Carlyle Group
Arlington, VA Defense Systems 6,300
Raytheon Company Lexington, MA Defense Systems; Electronic Systems 105,300
York International Corp. York, PA HVAC 25,000
Sources: Dun & Bradstreet via CompaniesOnline, http://www.companiesonline.com, a service of Terra Lycos, S.A., Barcelona, Spain, as obtained on December 11, 2000. Information Access Corporation. 2000. Business & Company ProFile [computer file]. Foster City, CA: Information Access Corporation.
estimates of the shipbuilding industry range from 150,000 (estimated by RTI) to about 880,000 employees, estimated by the American Shipbuilding Association (2001). For the purpose of extrapolating shipbuilding estimates to industry-wide in Section 8, we use the conservative estimate of 150,000 employees.
5-1
Analysis 5 Methodology
This section presents our approach to estimating the potential economic impact of STEP and the share that can be attributed to NIST’s contributions. We begin with a conceptual model for estimating economic impacts. From this model, technical and economic impact metrics are developed, along with an approach for weighting firm-level costs and benefit estimates to obtain industry-level economic impacts.
5.1 CONCEPTUAL APPROACH FOR ESTIMATING ECONOMIC IMPACTS Economic impact is defined as the net benefits over time associated with developing and adopting STEP functionality. Net benefits comprise decreased interoperability costs to industry (benefits) and less public and private resources needed to develop and implement STEP functionality (costs). A time series of benefits and costs is used to calculate the net present value (NPV) of economic impacts resulting from society’s investment in STEP.
5.1.1 Net Benefits from STEP
Benefits accrue to end users through increased interoperability of CAx systems used in the product design supply chain. These benefits can be generally categorized as
Z decreased avoidance costs,
Z decreased mitigation costs, and
Z decreased delay costs (RTI, 1999).
The primary economic benefits are realized by end users of these systems in the automotive, aerospace, and shipbuilding industries.

Economic Impact Assessment of the International Standard for the Exchange of Product Model Data (STEP) in Transportation Equipment Industries
5-2
However, for these benefits to be realized by end users, resources must be invested to make STEP functionality available. These resource investments include
Z government sector involvement in the standards development process and demonstration of STEP;
Z software developers’ costs associated with the standards development and demonstration (referred to as R&D), and expenditures to integrate STEP functionality into commercial products; and
Z end users’ costs associated with the standards development, demonstration, and implementation of STEP.
Conceptually, the change in economic welfare associated with STEP can be expressed in terms of the change in government expenditure, the change in software developer profits, and the change in manufacturers’ profits. This is referred to as “economic” welfare, as opposed to “social” welfare, because it does not include changes in the consumer surplus for purchasers of final products, due to changes in product quality or acceleration of product availability.
A time series of changes in economic welfare is obtained by summing the incremental government expenditures and the change in profits for software developers (j) and manufacturers (I) over time.
∆ economic welfaret = ∆ government expenditurest +
Σ ∆ developers’ profitsit +
Σ ∆ end users’ profitsjt.
where
∆ developers’ profitsit = ∆ software revenuesit – ∆ R&D costsit –
∆ production/support costsit
and
∆ end users’ profitsjt = ∆ interoperability benefitsjt –
∆ software expendituresjt –
∆ standards development and
implementation costsjt.

Section 5 — Analysis Methodology
5-3
But, because
a) ∆ software revenuesit =∆ software expendituresjt, and
b) ∆ software production/support costsit ≈ 0 in the software industry,
these terms drop out and STEP’s impact on economic welfare can be expressed as
∆ economic welfaret = ∆ government expenditurest +
Σ ∆ software R&D costsit +
Σ (∆ end users’ standards development
and implementation costsjt + ∆ users’
interoperability benefitsjt).
Government expenditures include NIST and other government and academic entities that participated in the standards development process and in the creation of infrastructure tools to support the development and adoption of STEP. Software developers’ costs primarily include expenditures to implement STEP functionality into their products. However, both software developers and transportation equipment manufacturers contribute resources to the standards development and demonstration process, and for this conceptual illustration these expenditures are referred to as R&D costs.
Benefits and costs actually occur as flows over time. Figure 5-1 illustrates the net benefits (benefits less costs) over time. The curve in Figure 5-1 represents the total change in economic welfare for all entities over the life-cycle of a particular STEP functionality or application protocol. The costs of standards development, infrastructure tools, and software development are shown occurring early in the life-cycle of STEP functionality. Once commercial products are available with STEP functionality, aggregate manufacturers’ benefits increase as adoption occurs until the CAx markets are saturated.1 “Steady state” benefits (Z) continue to accrue until the STEP functionality incorporated with the software becomes obsolete.
1In our context, net benefits to manufacturers include decreased interoperability
expenditures less employee training costs. The cost of software purchases are not included because they have been netted out of the economic welfare by increased revenue for software developers.

Economic Impact Assessment of the International Standard for the Exchange of Product Model Data (STEP) in Transportation Equipment Industries
5-4
Figure 5-1. Flow of Costs and Benefits
Net CashFlow
Time
StandardsDevelopment
Z
SoftwareDevelopment
Steady StateBenefits
Benefits–Expenditures
Benefits
Costs
Adoption byUsers
5.1.2 NIST’s Contributions
To model NIST’s contributions to the development and adoption of STEP, we will begin by investigating the traditional impact categories of “better-faster-cheaper.” Our preliminary hypotheses are that NIST’s contributions led to
Z quality improvements and enhanced STEP functionality available to end users (better);
Z acceleration of availability and adoption of CAX software products incorporating STEP (faster); and
Z cost reductions in the development of the STEP standard, implementation of STEP into commercial software products, and adoption/implementation by end users (cheaper).
Figure 5-2 provides a graphical representation of the impact of NIST contributions on the time series of benefits and costs. As illustrated in Figure 5-2, the core of our approach is to first develop a time profile of total net benefits associated with STEP. The total net benefits are defined as the difference in the value of net efficiency gains associated with STEP (i.e., decreased interoperability costs less

Section 5 — Analysis Methodology
5-5
Figure 5-2. Impact of NIST’s Contribution to STEP Shaded area represents the approximate benefits from NIST.
Without NIST
(b)
(c)
Without NIST
NetBenefits
Time
(a)Without NIST
standards development, software development, and adoption costs). The impact of NIST’s contributions are then evaluated relative to the total benefits of STEP. The dashed line in Figure 5-2 illustrates the counterfactual world without NIST and the shaded area represents the value of NIST’s contributions.
The shift in the time profile of net benefits represented by the dashed line reflects the change in government expenditures, software developer costs, user costs (a), and user benefits (c) resulting from NIST’s contributions. The shift also reflects the acceleration effect (b) from NIST’s contributions.
Following the better-faster-cheaper analysis, we asked industry representatives during the case studies and telephone/Internet interviews to qualitatively assess the impacts associated with specific NIST activities, investigating how NIST’s contributions influenced STEP development and adoption in terms of quality improvements, acceleration, and cost reductions. For example, the NIST STEP Class Library may have significantly lowered the cost of implementing STEP functionality into CAx software products and also moderately accelerated the implementation of certain STEP

Economic Impact Assessment of the International Standard for the Exchange of Product Model Data (STEP) in Transportation Equipment Industries
5-6
functionalities in these products. However, the STEP Class Library may have had minimal impact on the quality or efficiency of STEP functionalities available to end users.
Underlying NIST’s impact on the timing of development and adoption decisions are structural market changes resulting from NIST’s impact on market failures. Potential market hypotheses that reflect NIST’s impacts on the supply and demand of CAx systems with STEP functionality include the following:
Z NIST increased competition in the CAx software development market by lowering R&D costs of implementing STEP functionality for software developers. Lower R&D costs for software developers reduce barriers to entry and entice more developers to incorporate STEP functionality. This weakens individual vendor’s market power over “captive” customers as different systems become more compatible.
Z NIST increased demand for CAx products with STEP functionality by providing testing programs and certification services that increased end users’ acceptances and lowered uncertainty over adoption costs.
These market changes are indirectly captured in the acceleration and increased long-run market potential of STEP illustrated in Figure 5-2. In general, our conceptual approach is not to estimate shifts in supply and demand curves resulting from NIST’s contributions but to trace out changes in the diffusion of STEP functionality resulting from these shifts. However, it will be important to investigate structural changes when describing NIST’s role in mitigating market barriers to the development and adoption of STEP.
5.2 TECHNICAL AND ECONOMIC IMPACT METRICS As outlined above, investigating NIST’s contributions is a two-stage process. The first stage is to estimate the total costs and benefits associated with STEP for the different segments of the STEP supply chain (i.e., government expenditures, software developers’ expenditures, and end users’ adoption costs and resulting benefits). The second stage is to develop a counterfactual scenario describing the development and adoption of STEP in the absence of NIST’s contributions. The difference between the flow of net benefits in the realized (with NIST) and counterfactual (without NIST) scenarios will be the value of NIST’s contributions. This section presents the
Section 5 — Analysis Methodology
5-7
impact metrics that we will use to estimate the benefits and costs of STEP for each of these two stages.
Quantifying the economic impacts requires appropriate metrics that capture the most important benefits and costs. We developed two kinds of impact metrics:
Z Technical impacts describe the effects of imperfect interoperability on the accuracy and usability of exchanged product data and the resources required (including time) for data exchange and product development.
Z Economic impacts describe how technical impacts translate into changes in cost and economic activity. These measures can be either quantitative or qualitative.
The technical and economic metrics will inform the surveys and guide our data collection activities.
5.2.1 Metrics for Measuring the Benefits and Costs of STEP
In this section, we describe our approach for measuring the total benefits and costs associated with STEP. To support our data collection activities, we identify impact metrics for three distinct segments of the STEP supply chain:
Z government and academic entities,
Z software developers, and
Z CAx end users.
Economic Benefits of STEP
Users of CAx software in the supply chains incur several types of costs related to imperfect interoperability. Reducing these costs are the benefits of STEP. Thus, we begin our taxonomy of the benefits of STEP with a discussion of the costs of interoperability.
We focus on three types of interoperability costs. Manufacturers incur avoidance costs to prevent technical interoperability problems before they occur, mitigating costs to address interoperability problems after they have occurred, and delay costs that arise from interoperability problems that delay the introduction of a new product.
Avoidance costs are primarily associated with maintaining redundant systems and include
Z the cost of purchasing redundant CAx systems for the purpose of native format translation;
Z the cost of purchasing for point-to-point translation software;

Economic Impact Assessment of the International Standard for the Exchange of Product Model Data (STEP) in Transportation Equipment Industries
5-8
Z training costs for maintaining designers’ skills in redundant CAx systems;
Z productivity loss due to designers’ working on systems they are less familiar with;
Z IT staff to support redundant CAx systems; and
Z outsourcing costs incurred when outside companies are hired to provide data exchange services.
Mitigating costs include
Z the cost of reworking models that are part of the transfer process, and
Z the cost of manually reentering data when methods of data exchange are unavailable or unsatisfactory.
Delay costs include
Z profits lost due to decline in market share caused by delays, and
Z profits lost due to delay of revenues (discounts on the value of future profits).
Table 5-1 provides the technical and economic impact metrics for end users that reflect these cost categories. RTI found in its 1998 study of interoperability costs that mitigation costs were by far the largest portion of interoperability costs, accounting for approximately 85 percent of costs. Most mitigation costs resulted from incorrect or incomplete data files that had to be reworked or reentered manually. Avoidance costs, such as supporting redundant CAx systems, accounted for 5 percent and delay costs accounted for 9 percent of interoperability costs (RTI, 1999). The objective of this study is to determine the impact of STEP on these interoperability costs.
Interoperability problems in manufacturing industries affect society’s economic welfare in two ways: by increasing the cost of designing and producing final products and by delaying the introduction of new improved final products. An increase in the cost of designing and producing a new automobile or aircraft may lead to an increase in the equilibrium price of their respective markets. However, for the purpose of this study we measure all benefits of STEP at the manufacturers’ level of the supply chain in terms of decreased production costs and accelerated new product entry. We do not attempt to partition these impacts into producer and consumer surplus.
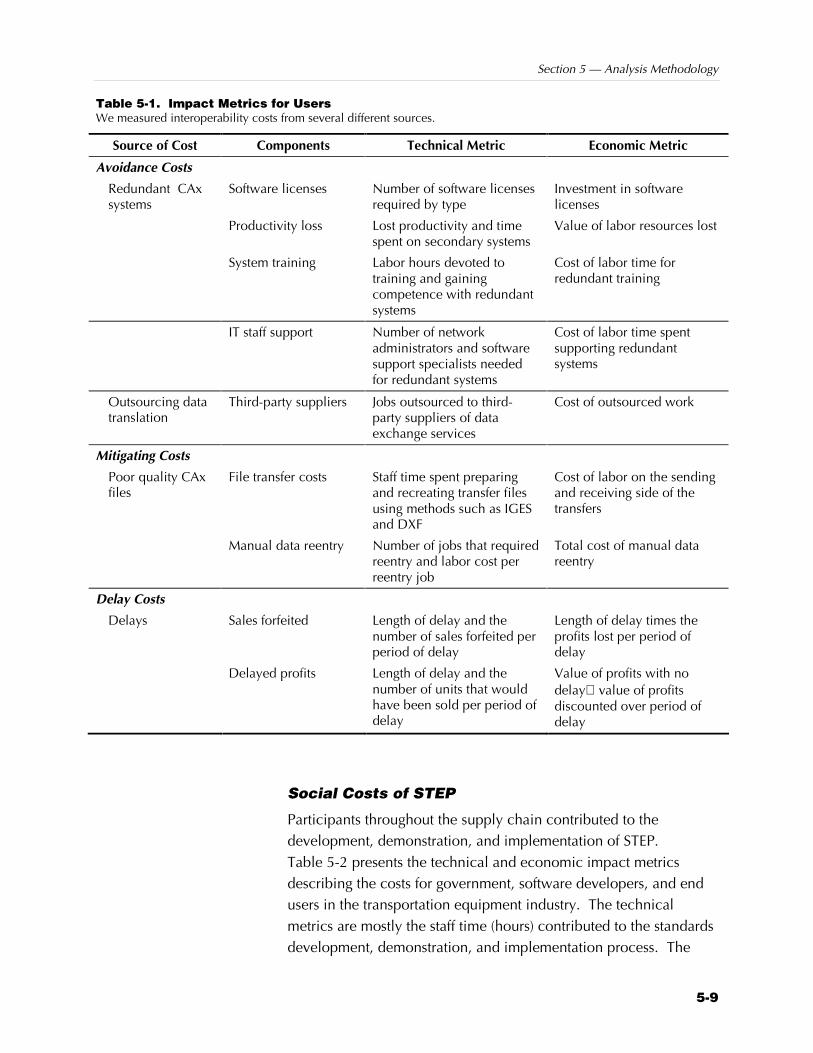
Section 5 — Analysis Methodology
5-9
Table 5-1. Impact Metrics for Users We measured interoperability costs from several different sources.
Source of Cost Components Technical Metric Economic Metric
Avoidance Costs
Redundant CAx systems
Software licenses Number of software licenses required by type
Investment in software licenses
Productivity loss Lost productivity and time spent on secondary systems
Value of labor resources lost
System training Labor hours devoted to training and gaining competence with redundant systems
Cost of labor time for redundant training
IT staff support Number of network administrators and software support specialists needed for redundant systems
Cost of labor time spent supporting redundant systems
Outsourcing data translation
Third-party suppliers Jobs outsourced to third-party suppliers of data exchange services
Cost of outsourced work
Mitigating Costs
Poor quality CAx files
File transfer costs Staff time spent preparing and recreating transfer files using methods such as IGES and DXF
Cost of labor on the sending and receiving side of the transfers
Manual data reentry Number of jobs that required reentry and labor cost per reentry job
Total cost of manual data reentry
Delay Costs
Delays Sales forfeited Length of delay and the number of sales forfeited per period of delay
Length of delay times the profits lost per period of delay
Delayed profits Length of delay and the number of units that would have been sold per period of delay
Value of profits with no delay value of profits discounted over period of delay
Social Costs of STEP
Participants throughout the supply chain contributed to the development, demonstration, and implementation of STEP. Table 5-2 presents the technical and economic impact metrics describing the costs for government, software developers, and end users in the transportation equipment industry. The technical metrics are mostly the staff time (hours) contributed to the standards development, demonstration, and implementation process. The

Economic Impact Assessment of the International Standard for the Exchange of Product Model Data (STEP) in Transportation Equipment Industries
5-10
Table 5-2. The Components of STEP’s Social Cost
Industry Groups Standards Development Technical Metric Economic Metric
Participation in STEP standards development organizations
Labor expenses associated with participation in development of STEP functionality
Annual hours times the labor rate times the number of years of STEP-related work
Software development tools and testing tools
Annual labor costs associated with developing and testing tools to support STEP’s integration into products
Annual hours times the labor rate times the number of years of STEP-related work
Software demonstration and certification services
Annual labor costs associated with participating in STEP demonstration and certification proceedings
Annual hours times the labor rate times the number of years of STEP-related work
Software Developers Costs
Expenditures to integrate STEP into products
Annual labor costs associated with incorporating STEP functionality into software releases
Annual hours times the labor rate times the number of years of STEP-related work
Participation in STEP standards development organizations
Dues and labor expenses associated with participation in STEP standards development organizations
Dues plus average annual hours times the labor rate times the number of years of STEP-related work
End-User Industry Costs
Participation in STEP demonstration services (e.g., AutoSTEP, AeroSTEP, MariSTEP)
Labor expenses and other costs associated with participation in demonstration services
Fees incurred plus average annual hours times the labor rate times the number of years of STEP-related work
NIST’s Expenses Labor hours and capital equipment
Non-NIST government participation in STEP standards development organizations
Dues and labor expenses associated with participation in STEP standards development organizations
Dues plus average annual hours times the labor rate times the number of years of STEP-related work
Public Sector Costs
Non-NIST government participation in STEP demonstration services (e.g., AutoSTEP, AeroSTEP, MariSTEP)
Labor expenses associated with participation in demonstration services
Fees incurred plus average annual hours times the labor rate times the number of years of STEP-related work

Section 5 — Analysis Methodology
5-11
economic metrics are the corresponding value of the labor efforts (wage rate times the number of labor hours) and other dues and fees paid to standards development organizations (such as PDES).
Government expenditures are segmented into NIST expenditures and non-NIST public expenditures, including defense-related funding. Using information supplied by NIST, we explicitly quantify all NIST expenditures on STEP-related activities. These activities include contributions to the standards development process, software tools, and testing services.
Expenditures by other government agencies and academic organizations are approximated based on information from PDES, Inc., and publicly available expenditure records; hence, they are estimated with less precision compared to NIST’s expenditures. As described in STEP: The Grand Experience (Kemmerer, 1999), the development (and continued development) of STEP standards represents a significant investment by a large number of government and academic entities. It is not within the scope of this project to conduct a complete cost accounting of the STEP development process.
Software developers’ costs related to STEP include expenditures on the several standards and tools development categories (described in Table 5-2), plus expenditures for implementing STEP functionality into their CAx products. During the telephone interviews with software developers, we asked them to estimate the resources they invested in the standards development process as well as their expenditures for integrating STEP into their products.
Users of CAx software have also been integrally involved in the STEP development process. For example, many manufacturers have participated in standards development and demonstration pilot programs. Table 5-2 describes the technical and economic cost metrics we will use to estimate user costs.
5.2.2 Metrics for Estimating NIST’s Impacts
Above, we described our approach for estimating the benefits and costs associated with the development and adoption of STEP. In this section, we describe how NIST influenced these benefits and costs. Estimating the impact of NIST’s contributions on the development and adoption of STEP is not as straightforward as
Economic Impact Assessment of the International Standard for the Exchange of Product Model Data (STEP) in Transportation Equipment Industries
5-12
estimating the total impact of STEP. As discussed in STEP: The Grand Experiment (Kemmerer, 1999), STEP was a collaborative effort involving a wide range of government agencies, software vendors, and discrete parts manufacturing firms.
Table 5-3 shows NIST’s contributions segmented into standards development, software development tools and testing tools, and demonstration and certification services. Our hypotheses are that NIST’s contribution improved the “quality” of STEP application protocols, accelerated the development/adoption of STEP functionality, and reduced the cost of development/adoption for software vendors/users. In each instance we consider a STEP world with NIST’s contributions and one without NIST’s contributions. For example, quality improvements capture the difference in STEP functionality and interoperability with and without NIST, and cost reductions include the difference in private and public expenditures needed to develop STEP with and without NIST.
NIST’s Impact on Government and Academic Entities
NIST’s participation in the STEP standards development process most likely reduced expenditures by other government agencies and academic institutions. At a minimum, NIST’s expenditures on administrative activities offset expenditures that would have been made by other government and academic entities.
However, we hypothesize that in the absence of NIST other government and academic entities may not have been able to replicate NIST’s contributions as efficiently. NIST’s specialized technical capabilities positioned it to lead the development of generic technologies such as EXPRESS. In addition, NIST’s industry contacts claim that its reputation as an impartial/independent entity helped enabled NIST to build consensus for standardization.
NIST’s Impact on Software Developers
Software vendors of CAx products are the most knowledgeable about how NIST’s contributions influenced the development and adoption of STEP. For example, software developers will not only be able to provide information on NIST’s impact on their own R&D expenditures and time to market, but also on how NIST’s demonstration and certification services affected users’ adoption of

Section 5 — Analysis Methodology
5-13
Standards Development
Administrative contributions
Editing directives
Resource integration
AP development guidelines
Technical contributions
EXPRESS (ISO 10303-11)
AP203 (ISO 10303-203)
Mapping Table Generator
PDM schema
Software Development Tools and Testing Tools
NIST EXPRESS Toolkit
STEP Class Library
Expresso
STEP File Checker
STEP Geometry Analyzer
Demonstration and Certification Services
AutoSTEP testing project
CAx and PDM implementor forums
STEP certification services
STEP. The technical and economic metrics to support the development of the software developer survey instruments are presented in Table 5-4.
NIST’s Impact on Users
The benefits of STEP are realized by users of CAx software. However, because users are at the end of the STEP supply chain it will be difficult to quantify the impact of many of NIST’s contributions on this population.2 The impact metrics are described in Table 5-4.
2If users were not actively involved in STEP development themselves, they may
not know the extent of NIST’s contributions in the development process.
Table 5-3. Summary of NIST’s Contributions to STEP

Economic Impact Assessment of the International Standard for the Exchange of Product Model Data (STEP) in Transportation Equipment Industries
5-14
Table 5-4. NIST’s Impact
Impact Category Hypothesis Technical Metric Economic Metric
Costs NIST’s leadership and administrative contributions improved the efficiency of the standards development process
Change in resources dedicated to the standards development process
Change in labor expenditures, travel, and other ODCs
NIST’s software tools reduced the cost of implementing STEP functionality into CAx systems
Change in R&D resources for software developers
Change in software R&D costs
Acceleration NIST’s contributions accelerated the development of STEP, its implementation by vendors, and adoption by industry
Change in time of the release of standards supporting different STEP functionality
Value to end users of accelerating the availability of different STEP functionalities
Quality NIST’s contributions resulted in “better” STEP standards
Lower cost of interoperability
Value to end users of enhanced STEP functionalities
We asked users about NIST’s demonstration and certification services and how these influenced their adoption expenditures and time table. In addition, we asked used about quality enhancements (i.e., increased STEP functionality) attributed to NIST’s activities.
5.3 CALCULATING MEASURES OF SOCIAL RETURN Based on the technical and economic metrics described above we will develop time series of benefits and costs associated with STEP. The timeline of social costs and economic benefits will be used to develop three summary measures of the potential economic impact of STEP: the benefit-cost ratio, the NPV, and the social rate of return. These measures are described below.
Benefit-to-Cost Ratio. If Bt is incremental net benefits accrued to all beneficiaries (net of any non-NIST development and adoption costs) in year t, and Ct is the cost to NIST of the program in year t, then the benefit-cost ratio for the program is given by
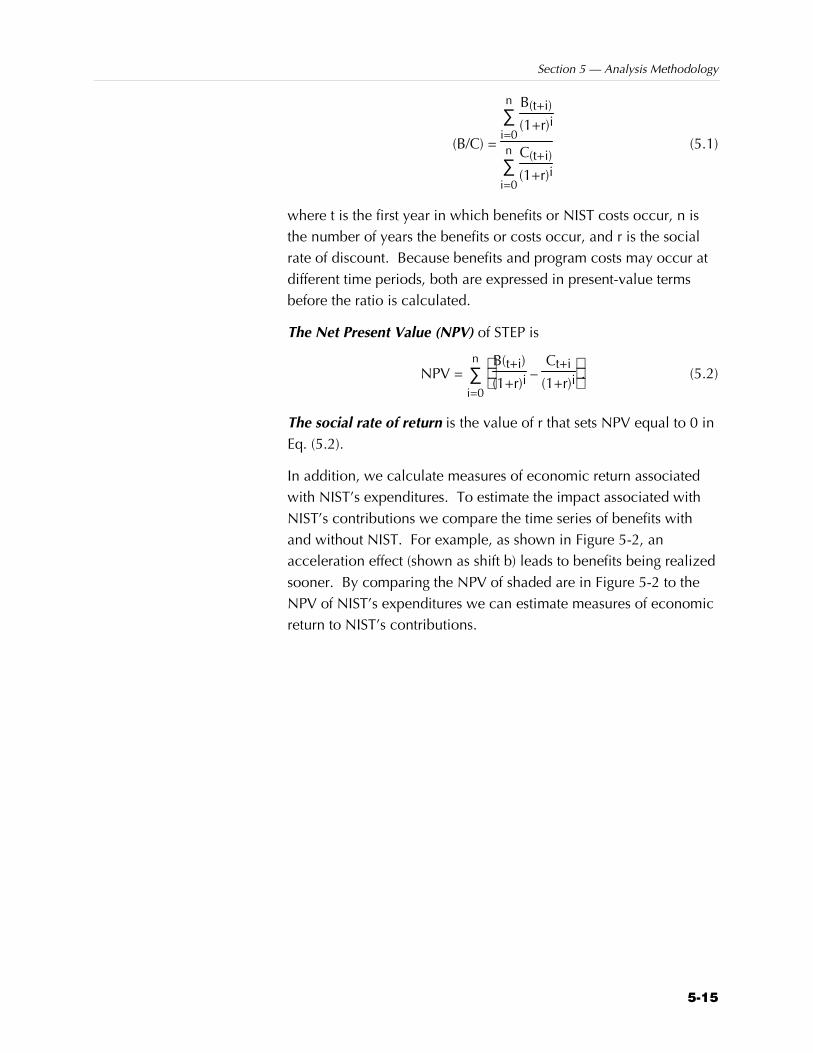
Section 5 — Analysis Methodology
5-15
(B/C) =
∑i=0
n B(t+i)
(1+r)i
∑i=0
n C(t+i)
(1+r)i
(5.1)
where t is the first year in which benefits or NIST costs occur, n is the number of years the benefits or costs occur, and r is the social rate of discount. Because benefits and program costs may occur at different time periods, both are expressed in present-value terms before the ratio is calculated.
The Net Present Value (NPV) of STEP is
NPV = ∑i=0
n
B(t+i)
(1+r)i –
Ct+i
(1+r)i. (5.2)
The social rate of return is the value of r that sets NPV equal to 0 in Eq. (5.2).
In addition, we calculate measures of economic return associated with NIST’s expenditures. To estimate the impact associated with NIST’s contributions we compare the time series of benefits with and without NIST. For example, as shown in Figure 5-2, an acceleration effect (shown as shift b) leads to benefits being realized sooner. By comparing the NPV of shaded are in Figure 5-2 to the NPV of NIST’s expenditures we can estimate measures of economic return to NIST’s contributions.


6-1
Primary Data 6 Collection
To estimate the economic impact of STEP as hypothesized in Section 5, we interviewed STEP end users and CAx software developers. Figure 6-1 provides an overview of our approach to estimating industry-level impacts. The approach begins with informal interviews conducted to identify the activities and types of information exchange for which STEP is applicable in each of the three industry sectors being studied: automotive, aerospace, and shipbuilding. Case studies and surveys are then used to quantify the technical and economic impact metrics. Finally, secondary data were collected to extrapolate per-employee impact estimates to the industry sectors as a whole. This section describes the data collection processes
6.1 END-USER INTERVIEWS The end-user survey component of this research project comprised a significant percentage of the project’s total effort. Over a 5-month period nearly 70 companies participated, either through on-site interviews, telephone interviews, or electronic mail surveys. The interviews and surveys investigated their exchange of product model data between internal divisions and with suppliers, teaming partners, and customers. The data collected from these surveys informed the counterfactual scenario and the economic model that quantifies the economic impact of using STEP to mitigate and avoid interoperability problems.

Economic Impact Assessment of the International Standard for the Exchange of Product Model Data (STEP) in Transportation Equipment Industries
6-2
Figure 6-1. STEP Estimation Methodology
ERIM/RTI InformalInterviews
CaseStudies
Telephone/InternetInterviews
SecondaryData
Applicability ofSTEP
Cell LevelImpact
Estimates
Firm Level InputEstimates
Industry ImpactEstimates
STEP Estimation Methodology
Secondary Data List• Industry
Employment byIndustry andMarket Segment
• Wage Rates, byEmploymentCategory
• Software Costs
Telephone Interviews List• Number of Employees, by
Employment Category• Mitigation Activities• Avoidance Activities• Number of Data Exchanges,
by File Type
Cell Level Cost Analysis• Avoidance Costs
(Firm Level)• Mitigation Costs
(Exchange Level)
Data ExchangeMatrix
Act
ivit
y
Nature of Data Exchange
Figure 6-1 describes the type of information collected as part of the informal interviews, case studies, and telephone/internet interviews. The rationale underlying the decision to employ three interview methods was to use the informal scoping interviews and case studies as a means for gathering in-depth information on how STEP may be deployed within an organization and how different operations may be impacted by that deployment. The case studies involved a series of intensive, 1- to 2-day interviews with representatives employed throughout a firm’s organizational hierarchy. Seven case studies were conducted. Each case study involved interviews with the firm’s data exchange team, CAD designers, technical systems managers, and operations executives. Information was collected on how STEP is currently used within their organization and on how it may be used in the near future. The case studies provided the foundation for developing an accurate picture of the benefits of STEP versus an alternate method of data exchange (primarily IGES).

Section 6 — Primary Data Collection
6-3
The experience and knowledge gained from the case studies were leveraged to develop an efficient survey instrument to be used during the telephone interview process. For the most part, respondents to the telephone survey were technical systems managers or data exchange managers, depending on who the firm felt was the most appropriate individual to respond to our request for an interview. The remainder of this section discusses the topics covered by the survey and further explores the respondent identification, selection, and population.
6.1.1 Case Study and Survey Topics
During the case studies and telephone interviews, we asked respondents to reflect on the role STEP currently plays and may potentially play within their organizations. The case studies were conversational using a question and answer format in an informal setting. The telephone survey was more structured and consisted of a series of short answer and tabular format questions. Appendix A contains a copy of the telephone survey, which is also summarized below.
The survey’s first section asked for some background information on the respondent and his or her function within the firm. The remaining sections asked for the following information:
Z Data Exchange Activity: This section explored the current methods employed by the firm to exchange product model data with customers, teaming partners, and suppliers.
Z Software Systems and Support: We next asked questions about the number of CAx systems maintained by the firm and the number of licenses held for each system. We also asked for data on the number of users working in each system and whether some users worked in more than one system.
Z Data Transfers: This section asked about the different neutral formats, including STEP, and point-to-point translators the firm may use to exchange data both internally and externally. It also asked the firm to approximate file transfer volumes.
Z Manual Reentry: This section asked whether there are instances when the firm manually reenters data because of a data exchange failure. If the firm currently uses STEP, they were asked whether STEP has reduced the prevalence of manual reentry jobs.

Economic Impact Assessment of the International Standard for the Exchange of Product Model Data (STEP) in Transportation Equipment Industries
6-4
Z NIST’s Role in the Development of STEP: The final section asked the firm whether they were familiar with NIST’s STEP activities. If they were, then they were asked to comment on the activities with which they were familiar and whether NIST had an impact on the timing of their adoption of STEP.
The survey instrument contained in Appendix A was used primarily as a discussion guide. It was shared with respondents prior to the interviews and served as the general structure for the discussions. However, in many cases it was the unanticipated information and comments obtained during the interviews that proved most insightful. In some cases respondents were not available for telephone interviews but did agree to complete the survey electronically and return the survey to us via electronic mail.
6.1.2 Case Study and Survey Respondents
Table 6-1 provides a summary of the 66 firms that participated in the project. Six of the firms, encompassing OEMs, first-tier suppliers, and a tool and die company, agreed to partner with us to conduct comprehensive case studies of their data exchange operations. The remaining 60 firms that participated in the telephone interviews were from a randomly selected sample of 100 firms drawn from a larger database of manufacturing firms listed by NAICS-code. Therefore, the survey response rate is 60 percent.
In addition to the firms that supplied data and are therefore included in our survey response statistics, a large number of industry experts representing trade associations and research outfits also contributed to this body of research.
6.2 SOFTWARE DEVELOPER INTERVIEWS Whereas the end-user interviews sought to quantify the impacts of STEP on operations, the software developer interviews focused on (1) identifying and quantifying the cost of integrating STEP functionality into CAx systems and (2) the impact NIST has had on the development and deployment of STEP.
Software developers are actively involved in the development and testing of STEP APs and routinely participate in standards conferences and workshops. We conducted telephone interviews with several software developers to gather information on

Section 6 — Primary Data Collection
6-5
Industry Number of Firms
Automotive 36
Automotive OEMs
First-tier suppliers
Subtier suppliers
Aerospace 19
Aircraft OEMs
Aircraft parts
Aircraft engines and engine parts
Missile and space systems
Shipbuilding 4
Shipbuilders
Shipbuilding systems suppliers
Specialty Tool and Die 7
Total 66
Z standards development activities,
Z software development tools and testing tools,
Z software demonstration and certification, and
Z expenditures to integrate STEP into their products.
6.2.1 Software Developer Survey Topics
The software developer survey gathered information on the impact NIST has had on the development and incorporation of STEP functionality. The survey instrument included in Appendix B contains three main sections:
Z Product Information: This section asked the developer to indicate which of its software products includes STEP functionality.
Z Cost of Developing STEP Functionality: Next, the survey asked the developer to estimate its costs for including STEP in its products, including those costs associated with AP writing and participation in demonstration and certification services.
Table 6-1. Summary of Survey Respondents

Economic Impact Assessment of the International Standard for the Exchange of Product Model Data (STEP) in Transportation Equipment Industries
6-6
Z NIST’s Contributions: This section asked the developer to reflect on whether any of NIST’s activities enhanced the quality of STEP, accelerated STEP’s deployment, and/or reduced their development costs (see Table 6-2). The developer was also asked whether they would have implemented STEP within the same time frame or later in the absence of NIST’s contributions.
Table 6-2. NIST Impact Categories Included in the Survey Instrument
NIST’s Impacts
Quality
Improvements Acceleration Cost
Reductions
Standards Development
Administrative contributions
EXPRESS (ISO 10303-11)
AP203 (ISO 10303-203)
Mapping Table Generator
PDM schema
Software Development Tools and Testing Tools
NIST EXPRESS Toolkit
STEP Class Library
Expresso
STEP File Checker
STEP Geometry Analyzer
Demonstration and Certification Services
AutoSTEP testing project
CAx and PDM implementor forums
STEP certification services
As in the case of the end-user survey, the software developer survey instrument served as the general structure for the telephone interview. The actual conversations held with the developers provided responses to all the questions included on the survey form and also provided us with additional information on the role of NIST and the STEP development process.

Section 6 — Primary Data Collection
6-7
6.2.2 Software Developer Respondents
At the time of this report, it was estimated that approximately 50 software products with significant user bases include some level of STEP functionality. The software vendors we surveyed produce nine of those software packages. Because of confidentiality concerns, we are unable to disclose the names of the vendors participating in the survey, the number of vendors participating, or the combined market share of the products included in this analysis. However, the products represent some of the most widely used products on the market as well as niche products for applications within specific industries.


7-1
Current Use and Future Directions 7 for STEP
During the interviews and surveys, we investigated the current availability and use of STEP as well as the potential impact of currently existing APs. We also investigated enhancements users would like to see integrated into future STEP standards.
7.1 STEP’S CURRENT USE STEP’s current penetration and use by industry is a function of the capabilities supported by existing APs, the level of implementation by vendors in product data systems, and the resources used to integrate STEP into the design process. Current penetration varies greatly by industry and across companies within industries.
7.1.1 Automotive Industry
The major U.S. automotive OEMs—Ford, General Motors, and DaimlerChrysler—still have formal policies that, for all practical purposes, prohibit the use of neutral formats to exchange product data with suppliers. Such companies’ market position permits them to request native format data from their suppliers. Foreign OEMs with operations in the U.S. have similar policies. Smaller, more specialized OEMs, such as heavy-duty truck or rescue vehicle manufacturers, make more extensive use of STEP and other neutral formats. However, the relative volume of data exchange among these OEMs and their suppliers is small when compared to that of major automotive OEMs.

Economic Impact Assessment of the International Standard for the Exchange of Product Model Data (STEP) in Transportation Equipment Industries
7-2
STEP and other neutral format standards are, however, used by the automotive industry. Major first-tier suppliers use STEP on a daily basis, although they generally keep the translation outside their customers’ view. STEP is primarily used to move geometric design data between the different CAD systems customers require using the portion of STEP referred to as AP203 (“Configuration Controlled Design”).
First-Tier Suppliers
Suppliers use STEP to accomplish robust neutral format file transfer. The suppliers may perform their design work using one single system and then translate the data via STEP to whichever system the customer requires. The reverse is also true: suppliers translate files received from customers via STEP for use with their systems. In this fashion, design work can be performed using in-house systems and yet be exchanged in the required format.
It is important to note that even within companies, STEP’s use varies. Different divisions may have different approaches and policies. Thus, one product line at a major supplier may be using a single system internally for design and regularly using STEP to translate data into the customer’s system before sending it to the customer, while another product line may not use STEP at all.
Subtier Suppliers
Other than first-tier suppliers, we found that few automotive suppliers currently use STEP. Smaller suppliers, whether lower-tier parts or tooling suppliers, rarely use solid models even though many of their customers do. Although some subtier suppliers are becoming more aware of STEP’s capabilities, most continue to maintain redundant systems and exchange native format data or use IGES or DXF as neutral formats. STEP’s slow penetration of subtier suppliers is generally a result of a reluctance to change the established practice of using IGES as a neutral format and a lack of information about STEP’s capabilities and advantages.
In addition, many subtier suppliers indicated that there is little incentive to use STEP, given their needs. IGES is quite acceptable and, after many years of use, subtier suppliers are comfortable with it. In fact, IGES has the capability to exchange drawing information and, while many in the industry want to eliminate drawings, they
Major first-tier suppliers use STEP on a daily basis, although they generally keep the translation outside their customers’ view.

Section 7 — Current Use and Future Directions for STEP
7-3
are as yet the only reasonable way to transfer the rich information needed to actually manufacture parts.
One of the issues raised by automotive users of STEP is the need for more reliable exchanges. That is, they believe that the error rates are higher than they should be, especially for some combinations of CAD systems. One company that had tracked such problems explained that, for certain CAD system combinations, they saw 90 to 95 percent problem-free exchanges. For others, however, they saw problems in one-third or even one-half of the exchanges.
7.1.2 Aerospace Industry
In the aerospace industry, the use of STEP is somewhat more widespread than in the automotive industry.1 The aerospace equivalents of the automotive OEMs, the prime contractors (“primes”) are using STEP to exchange data with at least some types of first-tier suppliers. This use of STEP is typically based on a formal agreement between the trading partners and is automated and regular.
In particular, STEP is being used for the exchange of envelope geometry, the geometry that describes the outside of a component, whether an individual part or an assembly. This type of information is needed to check whether parts will fit together properly when assembled, without interfering with other, nearby parts. This is a use for which STEP AP203, the part of STEP widely available in commercial software, is well suited. It does not require the level of detailed information required for actual part manufacturing, which AP203 does not support.
The aerospace industry has also demonstrated effective use of STEP in the exchange of configuration management data. AP203 supports the exchange of configuration management data along with the nominal geometry data. In fact, configuration management was AP203’s principal purpose as originally created. Configuration management requires the exchange of information that describes aspects of other data items relevant to their use. Examples of configuration management data include
1Because of the relative sizes of the industries, however, current STEP benefits in
the aerospace industry account for about 40 percent of the benefits being realized in the automotive industry.
In the Aerospace industry, STEP is being used for the exchange of envelope geometry, the geometry that describes the outside of a component, whether an individual part or an assembly.
Economic Impact Assessment of the International Standard for the Exchange of Product Model Data (STEP) in Transportation Equipment Industries
7-4
Z bills of material,
Z information that specifies when design information is effective,
Z relationships between two collections of data, and
Z ownership and approvals of data (especially design data).
A common example of this form of data is the information included in the title block of a traditional paper engineering drawing. The part of Boeing that was formerly McDonnell Douglas has been using AP203 for several years as the method for exchanging configuration management data between PDM systems at two different locations (St. Louis and Long Beach). This use demonstrates that daily exchange of production data is possible using STEP.
7.1.3 Shipbuilding Industry
The shipbuilding industry’s use of STEP is mostly at the prime contractor level. The nature of government contracting with regard to shipbuilding for the Navy is that there is a great deal of shared and parallel work. That is, two shipyards might build the same class of ship or cooperatively develop and then build a common class of ship. Therefore, there is considerable data exchange among the shipbuilding primes. The primes are ahead of the rest of their industry in using sophisticated solid modeling tools, and STEP is the only reasonable method for neutral-format exchange of solid models. The major shipyards are developing converter programs based on STEP to increase the amount of neutral-format file sharing and reduce redundant CAx system costs.
However, some shipbuilding suppliers that provide large, complex components of the ship have limited knowledge of STEP’s capabilities. They tend to use PC-based CAD software such as AutoCAD and therefore use AutoDesk’s proprietary file formats (.DWG and .DXF) as de facto standards for data exchange. This software limits them to two-dimensional drawing data and three-dimensional wireframe data, but these suppliers see no real reason to change. They have not yet seriously considered moving to solid models, even though there might be advantages to do so, especially due to the fact that capable solid modeling systems are now available on PC platforms.
In the shipbuilding world, the exchange of configuration management data is still almost totally conducted using paper
The shipbuilding’s prime contractors are ahead of the rest of their industry in using sophisticated solid modeling tools, and STEP is the only reasonable method for neutral-format exchange of solid models.

Section 7 — Current Use and Future Directions for STEP
7-5
methods, typically by the exchange of traditional drawings. There are a few limited implementations of PDM systems at the primes, and hardly any at their suppliers.
7.1.4 Small-Company Issues
We consider small companies as a group here for several reasons:
Z They tend to have customers from multiple industries.
Z They generally have limited electronic product data capabilities.
Z Their issues are generally not industry specific.
These companies typically cannot support the expense of complex CAx software systems used by their larger customers. Whether supplying parts, tooling, or services (e.g., machining, heat treating), small companies rarely have the internal infrastructure for complex software systems. Small suppliers generally use PC-based CAD systems such as AutoCAD and Cadkey. They know and understand this software as well as the underlying Windows operating systems and hardware. Just as important, small companies typically have a mix of customers with different systems and sometimes different systems within the same customer. No matter what system they select, it will not meet the requirements for many of their customers.
Some of the PC-based software systems accept STEP files, but small companies rarely work with solid models and are more comfortable with IGES. They see little reason to risk change.
For PDM systems, no good solutions exist for small companies. The PDM systems currently available are focused on highly customized applications at very large firms. These systems are too costly for mid-sized companies, much less small companies. There may actually be a market for a low-cost, off-the-shelf PDM solution in many of these companies. As yet, however, there is little, if anything, available in this arena.
7.2 STEP’S POTENTIAL USE STEP’s potential use goes beyond its current level of application and replaces the prominence IGES once realized. In this section, we describe the potential use of STEP based on current STEP standards and the expressed needs of users, whether currently addressed by software vendors or not. Essentially, this information comprises a
Some of the PC-based software systems accept STEP files, but users of these systems rarely work with solid models and are more comfortable with IGES.
Economic Impact Assessment of the International Standard for the Exchange of Product Model Data (STEP) in Transportation Equipment Industries
7-6
wish list for future STEP implementations, the availability of which may depend on appropriate development tools.
7.2.1 Automotive Industry
Significant potential exists for additional use of STEP in the automotive industry. If the automotive OEM’s insistence on exchanging native format files with their suppliers can be overcome, many suppliers could realize benefits by eliminating multiple CAD systems and internal translators.
A major development has been the recent approval of the part of STEP known as AP214, which focuses on the auto industry. This new standard covers far more types of product data than AP203, though there is substantial overlap in the Geometry and Specification/Configuration areas. A legitimate factor currently limiting adoption is that available implementations of STEP can only support nominal geometric models. Implementations of AP214 address this limitation.
It is important to recognize that while STEP does not yet define the exchange mechanism for every kind of product data, some long-standing parts of STEP have not been widely implemented in commercial software products. A notable example is STEP AP202 (titled “Associative Draughting”2), which supports the exchange of drawing information in a manner richer than in IGES. At present, only one major CAD system vendor has chosen to implement this STEP AP. However, this implementation does represent a significant growth area for the effective use of STEP.
There is a strong movement within the auto industry OEMs and major first-tier suppliers to move away from drawing content altogether. To realize this through STEP will require the implementation of manufacturing information, particularly intelligent geometric dimensioning and tolerancing capabilities to STEP. AP214 supports “Technology Data,” which includes the type of information previously written as notes on a drawing, whether paper or electronic. Thus, the standard now supports this type of information without having to rely on a drawing format, although AP214 also supports drawings, if needed. When software vendors
2Note that all the language that appears in STEP standards uses British English
spelling and word use.

Section 7 — Current Use and Future Directions for STEP
7-7
implement this nongeometry capability, this will help address many of the reservations still held about STEP.
Few, if any, current CAD or related systems have the capability to capture Technology Data in an intelligent form. Because this information is always on the drawing, it has been maintained in the form of a notation or a graphical entity that may have been associated with a specific part of the geometry. Such entities are strictly graphical to the CAD system, with the content being unknown to the program. For the proper use of AP214’s capabilities, software vendors must build new nongraphical entities into their systems. Vendors will also need to establish and maintain within their systems the proper logical relationships of these new entities to their related graphical entities. While not yet available in the major CAD systems, at least some developers are working on adding those capabilities. These enhanced capabilities should both help eliminate drawings and improve the value of the CAD data sent from one company to another.
AP207 is another AP that was developed under the direction of the automotive industry. This AP defines the exchange of data related to sheet metal dies. Recently approved as a standard, AP207 is intended to support the large amount of data related to sheet metal dies that moves across the auto industry. Other than fasteners, most of the metal parts in a car’s body are stamped from sheet metal. To date, however, there are no commercial implementations of AP207. Implementation of this AP in the major automotive CAD and PDM systems could realize a high potential for savings.
Configuration management data is typically created and managed in PDM systems at larger companies, particularly at OEMs. While the capability of exchanging configuration management data exists in STEP (in AP203 and in some other APs), the use of this capability in industry has been very limited to date. The vendors of PDM software have been considering how best to implement STEP, but the work has taken substantial time. In part, the delay is due to the lack of need within the industry, as there are few first-tier suppliers with fully implemented PDM systems.
In addition, there are no “standard” PDM implementations. Every PDM implementation within a given company is specific to that company. Hence, setting up data exchange, even using STEP,

Economic Impact Assessment of the International Standard for the Exchange of Product Model Data (STEP) in Transportation Equipment Industries
7-8
requires significant mapping of configuration management data elements into and out of STEP. This mapping, although feasible, is not simple and cannot be automated because of the heavy customization involved in PDM system application. However, if the vendors built the mapping process into their implementation practices, the process would become standardized, greatly reducing the resources required.
7.2.2 Aerospace Industry
The potential use of current STEP standards in the aerospace industry is essentially the same as in the automotive industry because the data exchange opportunities and needs are fundamentally the same. That is, use of STEP through the supply chain could be expanded for the kind of virtual assembly work OEMs are currently doing with engine suppliers and with a wide variety of other suppliers.
Even though AP214 is nominally for the automotive industry, it will likely meet many needs of the aerospace industry. The STEP community has decreed that the APs are to use the same underlying data models where they overlap in content. Hence, the underlying AP203 geometry and configuration management capabilities are also contained within AP214. The biggest difference tends to be terminology at the user level. Even there, the differences are likely to be minimal and easily addressed. For example, AP203 development was driven primarily by the aerospace industry and the automotive industry has had little problem understanding the content.
Further supporting the likelihood of common use is that the aerospace and automotive industries use the same major CAD systems. Therefore, AP214 capabilities will automatically become available to the aerospace industry when implemented for the automotive industry (and vice versa for any APs the aerospace industry develops).
AP209 is a new standard for which the aerospace industry led the development. AP209 is designed to support the exchange of data related to finite element analysis, particularly for structures, including composite structures. While the automotive and shipbuilding industries also make extensive use of finite element analysis, the aerospace industry uses it at a much higher level. The

Section 7 — Current Use and Future Directions for STEP
7-9
need to make aircraft as light as possible while still strong requires very careful analysis before any prototypes are built. The use of composite materials in aircraft has been steadily increasing as well, and AP209 has the needed ability to describe composite structures. Initial implementations of AP209 have been made by one vendor, but as with AP202, more users are needed before its real value will become apparent.
As in the auto industry, PDM data exchange will become both possible and useful as more suppliers adopt PDM systems and as vendors build data exchange capabilities into their systems. The STEP capability exists, but the software implementations are yet to be fully developed.
7.2.3 Shipbuilding Industry
Several of the approved APs have the potential to be useful for shipbuilding. Of the three industries under consideration, the shipbuilding supply chain as a whole is the least sophisticated in its current use of CAD and PDM systems. As a result, there is limited demand for the STEP capabilities outside the major shipbuilders. One of the major reasons is that new ship design is actually quite rare; most shipbuilding design is repetitive over years. The current series of nuclear aircraft carriers is a good example. While each ship has some changes from its predecessor, the vast majority of the design is still on paper drawings, the original versions of which were created in the late 1960s and early 1970s. The latest nuclear aircraft carrier (to be put in service in 2003), the Ronald Reagan (CVN-76), is fundamentally the same design that was established for the Nimitz (CVN-68), the first of the class. The differences between the Reagan and its immediate predecessor, the Harry S. Truman (CVN 75), are quite small. Because the cost of replacing drawings with rich CAD files is prohibitive, the migration of the shipbuilding industry to solid models and sophisticated CAD and PDM systems naturally lags behind that of other industries.
7.2.4 Small-Company Issues
Even though small companies have been content with PC-based CAD systems, the power of such systems is consistently increasing. Capable solid modeling systems are now available on PC platforms. At least some of the small companies interviewed expressed an interest in exploring the use of solid models. If they do make that

Economic Impact Assessment of the International Standard for the Exchange of Product Model Data (STEP) in Transportation Equipment Industries
7-10
leap, then the value of STEP to them and their customers will increase, as the exchange of more complex information will become much more common.
7.3 FUTURE PRODUCT DATA EXCHANGE NEEDS In this section, we describe the longer-term potential for the use of STEP based on ongoing STEP development and the expressed needs of the users we interviewed within each of the three industries. Future benefits from the capabilities discussed below are included in the empirical benefits estimates presented in Section 8.
7.3.1 Automotive Industry
The consistent message conveyed by the automotive industry is that STEP needs to be able to support the exchange of model “history” data with solid models. Also referred to as the “history tree” or “construction tree,” this information is captured by major CAD systems as the solid model is constructed. The history data tracks the sequence of modeling steps the user went through to create the solid model. The history data is very important if modifications need to be made to the solid model. It is often much better to back up a number of steps in the model construction and then make the change as opposed to trying to graft the change onto a completed model.
On the other hand, a supplier that provides history data to the customer can give away trade secrets or details that are not needed by the customer. Suppliers are understandably reluctant to provide such proprietary information because they have seen their ideas passed on to competing suppliers without recompense. Nonetheless, there was a common message that history data would be widely useful.
Another type of data requested by automotive users is tessellated data. These are models built up from a large collection of triangles with common edges. Tessellated data underlies most CAD model visualization tools (“visualizers”). The use of visualizers is rapidly increasing in the auto industry. Many people need to look at or review a design, but do not need to modify it. Tessellated files can be viewed, but they are normally much smaller than full CAD models. In most visualizers, comments can be added to the file for the use of others. Visualizers avoid the need for many people to
Section 7 — Current Use and Future Directions for STEP
7-11
invest in a full CAD system and the associated training. The potential role for STEP comes in standardizing the tessellated file. If a STEP format for tessellated files existed, then a CAD system could output a generic tessellated file that could be viewed on any viewer that could read such STEP files.
7.3.2 Aerospace Industry
In the aerospace industry, there was interest in using XML as a STEP data transfer mechanism. The aerospace industry sees XML as having the potential to carry more information more efficiently than traditional STEP files. Fortunately, interest in XML has already been recognized within the STEP community and that work is under way.
Another request from the aerospace industry is completion and implementation of AP232 (“Technical Data Packaging”), which is a considerably broader version of the configuration management concept. The basic concept is that a technical data package (TDP) contains all the necessary pieces and collections of data necessary for a given business transaction. Thus, in addition to the usual configuration management data, a TDP might contain other STEP files that define the geometry of a product or the process to be used to make the part with a numerically controlled machine tool. The automotive industry is beginning to show interest in this AP as well. Both in the U.S. and internationally, automotive organizations have formed work groups to look at the potential of AP232 in their industry.
7.3.3 Shipbuilding Industry
The shipbuilding industry, with strong support from the Navy, was heavily involved in the early development of STEP. Several APs appropriate to the industry’s needs were proposed and have been worked on. However, the development of these APs has languished recently. One of the four proposed APs was dropped; the others have substantial work to be done before completion. Because these focused APs are intended to deal with specific aspects of large-scale ship structures, they would provide capabilities not seen in the other existing APs. The shipbuilding industry also indicated that history data would be useful to incorporate into STEP. In addition, one company mentioned that manufacturing process data (process steps) would be a useful enhancement for STEP.


8-1
The Potential and Current Economic 8 Impact of STEP
This section estimates the economic impact of STEP on the U.S. automotive, aerospace, and shipbuilding industries and presents measures of economic return for STEP development, as well as separate measures of return for NIST’s contributions. The section describes the data and methods used to estimate the economic impact of STEP, beginning with a discussion of the employment and wage information used in the analysis. The estimation of STEP’s benefits to end users and the social costs of STEP development and implementation follow. The final sections present the time series of benefits and costs and calculate measures of economic return.
8.1 INDUSTRY EMPLOYMENT AND WAGES The calculation of the economic impact of STEP is partially rooted in the industry employment and wage rates used to extrapolate firm-level results from the survey to industry-level estimates. Because the technical metric for many of the benefit-cost categories are in terms of hourly labor savings, such as redundant labor costs and labor productivity losses, this section begins with a review of the employment statistics and wage rates used.
8.1.1 Industry Employment
To calculate national economic impacts using the results from the surveys and case studies, firm-level results were extrapolated using industry employment estimates. Ideally, the analysis would have used the number of CAx users and support professionals employed

Economic Impact Assessment of the International Standard for the Exchange of Product Model Data (STEP) in Transportation Equipment Industries
8-2
in each of the three industries. However, reliable estimates for these specialized labor categories were not available.
The Bureau of Labor Statistics (BLS) collects employment data by job position at the industry level. However, CAx users and support professionals are distributed across an array of positions and are not a distinct category in the BLS’s definitions. As a result, per-employee impact estimates were developed based on the total company employment of the firms included in the analysis. These per-employee estimates were then applied to the industry employment figures to estimate the economic potential of STEP.
The automotive, aerospace, shipbuilding, and specialty tool and die industries employed a total of 3.5 million people in 2001, of whom nearly 450,000 were employed by firms that participated in the survey. Table 8-1 breaks out the industry employment figures by subsector as well as the total number of employees in each industry represented by survey respondents.1 The survey covered about 13 percent of industry employment. The highest coverage on an industry basis was the aerospace sector at 23.6 percent. The two highest coverage ratios for subsectors were also within the aerospace industry: We conducted case studies and interviews with firms that represented 58.5 percent of aircraft OEM employment and 30.2 percent of aircraft engine employment. The lowest coverage ratio was for shipbuilding suppliers: our survey was only able to capture firms representing 800 employees, or 0.5 percent of the estimated industry employment.
Smaller suppliers dominate the lower rungs of the American industrial supply chain. Although these firms perform a vital function as providers of essential components to larger first-tier suppliers and OEMs, on a firm-by-firm basis, they are very small and account for little industry output. This reality is represented by the coverage ratios for supplier subsectors in Table 8-1. The coverage ratio for subtier automotive suppliers was 3.1 percent; for aircraft parts suppliers, 4.8 percent; and for specialty tool and die, 3.6 percent. While many small firms in these subsectors participated in this analysis, they were only able to account for a
1To maintain the confidentiality of survey respondents, the number of responding
firms by industry subsector was withheld.
The industries included in this analysis employ a total of 3.5 million Americans, of whom nearly 450,000 were employed by firms that participated in the survey.

Section 8 — The Potential and Current Economic Impact of STEP
8-3
Table 8-1. Industry Employment and Survey Coverage Ratios
Number of Firms
Employment of Firms Sampled
Industry Employment
Coverage Ratio (Percent)
Automotive 36 238,749 2,399,000 10
Automotive OEMs 94,086 631,000 15
First-tier suppliers 112,271 738,000 15
Subtier suppliers 32,392 1,029,600 3
Aerospace 19 189,125 800,100 24
Aircraft OEMs 136,000 232,500 58
Aircraft parts suppliers 18,210 380,300 5
Aircraft engines and engine parts 30,600 101,300 30
Missile and space systems 4,315 86,000 5
Shipbuilding 4 20,300 244,700 8
Shipbuilders 19,500 94,700 21
Shipbuilding systems suppliersa 815 150,000 1
Specialty Tool and Die 7 1,207 33,500 4
Total 66 449,381 3,477,800 13
aAccurate estimates on the total employment at shipbuilding suppliers are difficult to obtain. The industry is supplied by a diverse supplier base, many firms of which are only loosely affiliated with the industry, such as piping providers. In addition, shipyards frequently purchase large volumes of raw materials and standardized components and perform fitting and assembly themselves. It is therefore unlikely that shipyards would exchange data with many of their suppliers. Thus, this analysis uses the estimate of 150,000 employees for our calculations, about one-sixth of the 882,314 employees estimated by the American Shipbuilding Association (2001).
Sources: Automotive data: RTI estimates based on Center for Automotive Research at Altarum and the Institute for Labor Relations at the University of Michigan. “Contribution of the Automotive Industry to the U.S. Economy in 1998: The Nation and Its Fifty States.” Prepared for the Alliance of Automobile Manufacturers, Inc. and the Associations of International Automobile Manufacturers, Inc. Winter 2001. Aerospace data: Aerospace Industries Association (AIA). 2001. Aerospace Facts and Figures 2001/2002. Washington, DC: Aerospace Industries Association. Shipbuilding data: RTI Estimates and U.S. Census Bureau. 1999. 1997 Economic Census Industry Series: Ship Building and Repairing. EC97M-3366A. Washington, DC: U.S. Government Printing Office. Specialty tool and die data: RTI Estimates based on membership data available from the National Tooling and Machining Association, as obtained on January 25,2002 at http://www.ntma.org, and compared with Information Access Corporation. 2002. General Business File [computer file]. Foster City, CA: Information Access Corporation.
small percentage of their respective industry employment estimates. Yet, conversations with industry experts and first-tier suppliers as well as review of industry literature indicate that the survey responses from these firms are highly representative of all firms in their supply-chain position.
Economic Impact Assessment of the International Standard for the Exchange of Product Model Data (STEP) in Transportation Equipment Industries
8-4
8.1.2 Industry Wage Estimates
BLS wage rates were used to quantify the hourly productivity benefits and labor savings. To monetize these benefits categories, we multiplied those labor hour savings by the appropriate wage rate for the employee functioning in that position. To simplify discussions in later sections, the employment categories and wage rates used in these calculations are presented and discussed here.
Several employment categories, or job positions, are directly involved in the electronic exchange of product model data. The direct employee productivity benefits identified through the case studies and surveys affect four job positions:
Z CAx Designers and Users. Referred to generally as the CAx user population or designers, this employment category comprises employees who directly employ CAD/CAM/CAE and PDM in their work. CAx users are directly responsible for accomplishing data exchange with customers, partners, and suppliers.
Z CAx Design Support Specialists. CAx design support specialists troubleshoot CAx users’ design problems when they arise, including those related to preparing files for exchange. Design support specialists may be advanced CAx users that support other designers or, as is usually the case in larger organizations, a separate team charged with assisting a large CAx user base as needed.
Z Network and Computer Systems Administrators. Systems administrators maintain the information technology (IT) infrastructure that supports networked environments and house software.
Z Software Support Specialists. Software support specialists troubleshoot CAx software problems. For example, if a program is functioning improperly on a CAx user’s machine, a software support specialist is dispatched to rectify the problem.
The BLS does not collect wage data for CAx users as an employment category; therefore, we used the employment category and wage that best matched the complete job description of individuals using this software. For the automotive industry, the closest matching job category was commercial and industrial designers, which the BLS describes as the occupation that develops and designs products for the industry. Industry-specific job categories were used for CAx users in the aerospace and shipbuilding industries—aerospace engineers, and naval architects and marine engineers, respectively. The materials engineers category was used for the tooling industry.

Section 8 — The Potential and Current Economic Impact of STEP
8-5
The same job categories were used to represent design support staff.2 The other two IT support staff categories, network and computer systems administrators and software support specialists, are common functions. The BLS does collect data for these categories for all industries.
The wage estimates for the four job categories by industry are presented in Table 8-2. The original BLS data have been multiplied by a factor of 2.0 to estimate the fully loaded wage rates that include employee benefits, such as employer-sponsored health and dental insurance and 401(k) contributions, as well as administrative and overhead costs. As is the case for most positions, wage rates for similar positions vary by industry according to each industry’s supply and demand for that labor. Thus, the wage rates used for systems administrators and software support specialists are different for each industry. For example, administrators earn a loaded wage of $48.20 per hour in the automotive industry, but only $43.40 in the tooling industry.
Table 8-2. Loaded Hourly Wage for Designers and Associated Support Staffers
CAx
Designera Design Support
Specialistb
Network and Computer Systems
Administrator
Software and Computer Support
Specialist
Automotive $61.44 $61.44 $48.20 $43.66
Aerospace $65.92 $65.92 $56.66 $45.48
Shipbuilding $59.14 $59.14 $48.62 $35.40
Tooling $48.66 $48.66 $44.34 $37.20
aThe BLS does not collect statistics specifically for designers working in CAx systems, therefore this analysis uses the positions that are most closely related to CAx designers to estimate wage rates. These positions are: for automotive, commercial and industrial designers; for aerospace, aerospace engineers; for shipbuilding, naval architects and marine engineers; and for tooling, mechanical engineers.
bDesign support specialists assist CAx designers with design issues and troubleshoots complications in the design process. They may or may not be an experienced CAx designer who specializes in supporting a design team or a design team member assisting other designers. This analysis assumes that the loaded wage for this position is similar to that of a CAx designer.
Source: Bureau of Labor Statistics. “2000 OES Industry-Specific Occupational Employment and Wage Estimates.” <http://www.bls.gov/oes/2000/oessrci.html>. As obtained on February 2, 2000.
2As with CAx users, no BLS category existed for CAx design support staff.
However, because individuals in this job category are similar to CAx users themselves in that they work with the design tools and help CAx designers troubleshoot logistical issues related to their work, we decided to use the same wage rate for design support as for the CAx users.

Economic Impact Assessment of the International Standard for the Exchange of Product Model Data (STEP) in Transportation Equipment Industries
8-6
8.2 END-USER CAx INTEROPERABILITY BENEFITS The economic benefit of STEP is equivalent to the sum of the costs firms would otherwise incur without STEP. In this section, we identify expenditures at firms that broad use of STEP would either eliminate or reduce. These expenditures fall into three categories: avoidance costs, mitigation costs, and delay costs. The sum of the findings in these cost categories is the potential benefit of STEP.
8.2.1 End-User Avoidance Benefits
Avoidance costs amount to nearly two-thirds of the annual cost savings STEP could yield for OEMs and suppliers: about $451 million. Manufacturers incur avoidance costs to prevent technical interoperability problems before they occur. Avoidance costs are pervasive in these industries because the cost of and complications associated with imperfect data exchange are high. Most large firms invest in several software systems, as well as the staff that uses and maintain them, to facilitate the communication of product model data. With the exception of direct costs of the redundant CAx systems themselves, most avoidance costs are either direct or indirect labor expenses. These include the extra staffing, training, and support needed to maintain multiple CAx systems instead of one.
Of the $451 million in annual avoidance cost savings, $253 million could be saved in the automotive industry alone. Its complex system of OEMs and tiered suppliers reinforce interoperability problems because of the number of companies through which data is shared electronically.
Table 8-3 summarizes STEP’s potential for reducing avoidance costs. On a per-employee basis, the tooling industry is the largest victim of these costs. Specialty tool and die shops contracting for transportation equipment industries incur over $1,728 of avoidance costs per employee each year.
The following sections describe the methods used to calculate the avoidance cost categories summarized in Table 8-4. The cost categories include the following:
Z Investment in redundant CAx systems. Secondary CAx systems maintained primarily for data exchange services or to maintain a specific client relationship.
Of the $451 million in annual avoidance cost savings, $253 million could be saved in the automotive industry alone.
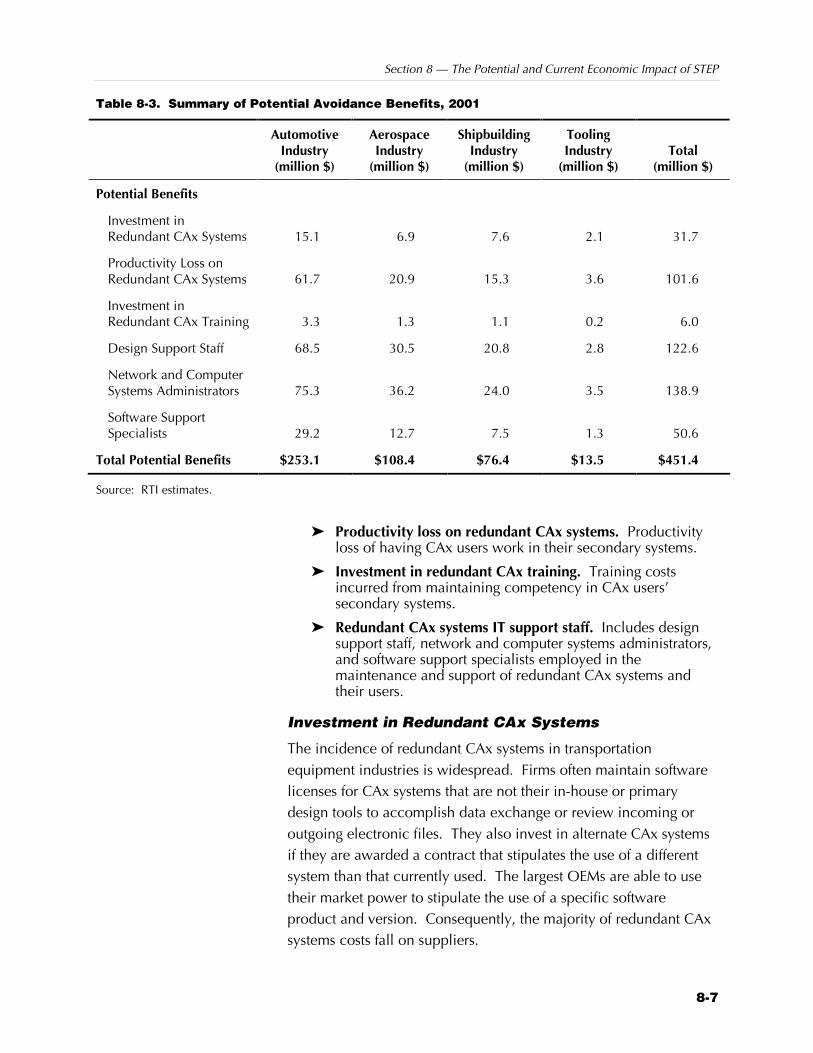
Section 8 — The Potential and Current Economic Impact of STEP
8-7
Table 8-3. Summary of Potential Avoidance Benefits, 2001
Automotive Industry
(million $)
Aerospace Industry
(million $)
Shipbuilding Industry
(million $)
Tooling Industry
(million $) Total
(million $)
Potential Benefits
Investment in Redundant CAx Systems 15.1 6.9 7.6 2.1 31.7
Productivity Loss on Redundant CAx Systems 61.7 20.9 15.3 3.6 101.6
Investment in Redundant CAx Training 3.3 1.3 1.1 0.2 6.0
Design Support Staff 68.5 30.5 20.8 2.8 122.6
Network and Computer Systems Administrators 75.3 36.2 24.0 3.5 138.9
Software Support Specialists 29.2 12.7 7.5 1.3 50.6
Total Potential Benefits $253.1 $108.4 $76.4 $13.5 $451.4
Source: RTI estimates.
Z Productivity loss on redundant CAx systems. Productivity loss of having CAx users work in their secondary systems.
Z Investment in redundant CAx training. Training costs incurred from maintaining competency in CAx users’ secondary systems.
Z Redundant CAx systems IT support staff. Includes design support staff, network and computer systems administrators, and software support specialists employed in the maintenance and support of redundant CAx systems and their users.
Investment in Redundant CAx Systems
The incidence of redundant CAx systems in transportation equipment industries is widespread. Firms often maintain software licenses for CAx systems that are not their in-house or primary design tools to accomplish data exchange or review incoming or outgoing electronic files. They also invest in alternate CAx systems if they are awarded a contract that stipulates the use of a different system than that currently used. The largest OEMs are able to use their market power to stipulate the use of a specific software product and version. Consequently, the majority of redundant CAx systems costs fall on suppliers.

Economic Impact Assessment of the International Standard for the Exchange of Product Model Data (STEP) in Transportation Equipment Industries
8-8
Table 8-4. Potential Redundant CAx Systems Benefits, 2001
Industry Potential Annual Savings per
Employee ($) Potential Annual Savings Industry-wide (million $)
Automotive 15.1
Automotive OEMs 0.61 0.4
First-tier suppliers 9.81 7.2
Subtier suppliers 7.21 7.4
Aerospace 6.9
Aircraft OEMs — —
Aircraft parts suppliers 12.67 4.8
Aircraft engines and engine parts 2.84 0.3
Missile and space systems 20.51 1.8
Shipbuilding 7.6
Shipbuilders 19.20 1.8
Shipbuilding systems suppliers 38.88 5.8
Specialty Tool and Die 62.73 2.1
Total $31.7
Source: RTI estimates.
During the interview phase of this project, firms were asked about their present IT investment and how that investment would be altered given the use of a widely accepted, robust neutral format. Information was collected on both the number of CAx systems they would not otherwise maintain and the number of licenses, or seats, associated with each system.3 The results yielded the number of licenses of various CAx systems that each firm considered redundant.4
Each firm’s redundant CAx system cost was calculated by multiplying the number of redundant licenses by the annual maintenance fee charged by software vendors for those licenses. Using a combination of publicly available pricing schedules and informal interviews with software vendors, we obtained the approximate annual maintenance fees for a large number of CAx system configurations. It is a common practice for vendors to offer
3For some firms, cost savings were offset by the probable decision to purchase a
number of additional licenses of their primary CAx system. 4To maintain confidentiality, data on the number of redundant licenses, CAx
systems, and the annual maintenance fee pricing schedules for those systems and licenses are withheld.

Section 8 — The Potential and Current Economic Impact of STEP
8-9
discounts to customers based on the volume of licenses purchased. We took this practice into account by associating each firm’s number of licenses with the correct price for that volume of licenses. The average annual maintenance fee per license was $2,440.
The primary beneficiaries of STEP in this cost category are suppliers who maintain multiple systems to support their many customers that generally require native format data exchange (see Table 8-4). One exception, however, is the shipbuilding industry. Shipbuilders often collaborate on U.S. Navy contracts in a lead/follow relationship. In such cases, the follow yard adopts the lead yard’s design systems to facilitate collaboration. This usually entails the follow yard’s adoption of a competing software package that mimics the functionality of its existing software. Thus, shipbuilders would benefit from a more widespread application of STEP.
The $32 million estimate (Table 8-4) is considered to be conservative because two components of this cost were unable to be captured. For example, we were unable to capture future new investments in version updates or entire systems purchases. The cost of updating most major CAx systems when new versions are available is significantly more expensive than maintaining software licenses. We could not capture this component of the cost because
Z future release schedules of new versions are unavailable;
Z the cost of the update varies according to the extent of the version update, which is also unknown;
Z version update costs may be included as part of annual maintenance agreements and therefore may be double-counted costs; and
Z not all firms would opt to upgrade to the new version.
In addition, this estimate also excludes instances where systems are housed on separate servers and require additional networking technology and labor. Such information could not be accurately estimated across different firms and industries.
Productivity Loss on Redundant CAx Systems
It is estimated that industry could save $138 million annually in productivity losses stemming from designers working in CAx systems other than their primary systems. According to interviewees, employees are on average 70 percent as productive

Economic Impact Assessment of the International Standard for the Exchange of Product Model Data (STEP) in Transportation Equipment Industries
8-10
when using secondary CAx systems as when using the system on which they have expertise.5
Each CAx system has unique features that require substantial training and hands-on experience to achieve a level of competency. Most CAx users are hired partially because their CAx skill set matches the firms’ in-house systems. When using programs that are not in their primary skill set, users are not as skilled and therefore they require more time to accomplish tasks.
It follows then that if STEP could reduce redundant CAx systems costs, then it could also eliminate the productivity loss associated with employees working with secondary systems. To estimate this cost, we gathered the following information from each firm:
Z the number of CAx users at each firm,
Z the percentage of CAx users who use multiple CAx systems, and
Z the average percentage of time those CAx users spend working with secondary CAx systems.
By multiplying these figures together along with the appropriate average wage rate for the firms’ industry and work hours, we calculated the productivity loss benefit.
For example, suppose an automotive subtier supplier had a CAx user population of 100, and that 50 percent of those users spent 10 percent of their time working in redundant systems. Recall from Section 7.1 that the loaded hourly wage for CAx users in the automotive sector is $61.44 and that there are 2,080 work hours in a calendar year. Multiplying these six pieces of information together yields the following:
100 CAx users
x 0.50 (percentage using redundant systems)
x 0.10 (percentage of time working in those systems)
x 0.30 (percentage of productivity loss)
x $61.44 (average loaded hourly wage)
x 2,080 (number of work hours in a year)
= $191,693 (productivity benefit) 5This is similar to the productivity loss estimates developed by the Automotive
Industry Action Group (1997a).
It is estimated that industry could save $138 million annually in productivity losses stemming from designers working in CAx systems other than their primary systems.
Section 8 — The Potential and Current Economic Impact of STEP
8-11
By eliminating redundant systems, this hypothetical supplier could stem nearly $192,000 annually in productivity losses.
In this analysis, the productivity losses amounted to nearly $138 million annually, the bulk of which is borne by the automotive industry (see Table 8-5). At current wage rates and employment levels, widespread application of STEP in the automotive industry has the potential to reduce productivity losses by $62 million annually. On a per-employee basis, the specialty tool and die firms that contract with automotive and aerospace firms could save $107.42 per industry employee ($3.6 million industry-wide). Similarly, STEP could save the shipbuilding industry $97.46 per employee.
Investment in Redundant CAx Training
Transportation equipment industries spend a combined $8.4 million each year training employees on redundant systems. To maintain competency in using those systems, CAx users undergo periodic training. Total training costs, however, are difficult to estimate because formal training is less common than “on the job” training. It is therefore difficult to distinguish between lost productivity and training-related costs.
However, several of the firms estimated that each user receives on average about 160 hours of formal training on their secondary systems. Although this figure may be an underestimate, interviewees thought this was the best possible figure they were able to provide, given that they more rigorously track training-related expenses for their in-house or preferred systems. We were also unable to obtain estimates on the tuition and fees paid to third-party training centers. However, generally, course fees are minimal compared to the labor expense of sending an employee for training.
Training benefits are calculated using CAx user work life, redundant CAx systems user population, wage rates, and the amount of time spent training. The method for estimating annual training cost is illustrated below:
1. Each CAx user’s work life is estimated to be 25 years.
2. Over the course of that work life it is estimated the user will receive 160 hours of formal training on redundant systems. Thus, if a firm has 25 CAx users, then about 1 employee per year will be new to the industry.
Transportation equipment industries spend a combined $8.4 million each year training employees on redundant systems.

Economic Impact Assessment of the International Standard for the Exchange of Product Model Data (STEP) in Transportation Equipment Industries
8-12
Table 8-5. Potential Benefits from Avoided Productivity Loss on Redundant CAx Systems, 2001
Industry Potential Annual Savings per
Employee ($) Potential Annual Savings Industry-wide (million $)
Automotive 61.7
Automotive OEMs 9.17 5.8
First-tier suppliers 39.03 28.8
Subtier suppliers 26.33 27.1
Aerospace 20.9
Aircraft OEMs — —
Aircraft parts suppliers 34.32 13.1
Aircraft engines and engine parts 37.17 3.8
Missile and space systems 47.66 4.1
Shipbuilding 15.3
Shipbuilders 97.46 9.2
Shipbuilding systems suppliers 40.75 6.1
Specialty Tool and Die 107.42 3.6
Total $137.8
Source: RTI estimates.
3. Not all new employees are trained on a redundant system. Therefore, it is necessary to multiply employee turnover by the percentage of users who work on redundant systems. If 33 percent of users work in redundant CAx systems, then the annualized number of employees receiving this training would be 0.33.
4. If the user was an aerospace engineer, then the 0.33 estimate would be multiplied by the training hours (160) and the wage rate ($65.92).
5. As a result, the firm’s annualized saving on training would be $3,480.
Table 8-6 presents the benefit estimates by each industry subcategory. The annual cost of training users on redundant CAx systems for the three industries is estimated to be $8.4 million, which is the smallest of the avoidance cost categories in the analysis. Per-employee average benefits ranged from zero for aircraft OEMs that indicated that they do not train users on secondary systems to $7.12 for specialty tool and die firms that are forced to maintain competencies in several systems because of their diverse supplier base.

Section 8 — The Potential and Current Economic Impact of STEP
8-13
Table 8-6. Potential Benefits on Redundant CAx Training, 2001
Industry Potential Annual Savings per
Employee ($) Potential Annual Savings
Industry-wide (thousand $)
Automotive 3,339.4
Automotive OEMs 0.54 343.0
First-tier suppliers 1.74 1,288.0
Subtier suppliers 1.66 1,708.4
Aerospace 1,306.4
Aircraft OEMs — —
Aircraft parts suppliers 2.34 891.8
Aircraft engines and engine parts 0.77 78.2
Missile and space systems 3.91 336.3
Shipbuilding 1,118.6
Shipbuilders 5.19 491.7
Shipbuilding systems suppliers 4.18 627.0
Specialty Tool and Die 7.12 238.8
Total $8,428.2
Source: RTI estimates.
Redundant CAx Systems IT Staff
IT staffing needed to support industry’s investment in redundant CAx systems is the single largest avoidance cost incurred. To maintain their software investment and to support employees using that software, firms employ computer network and systems administrators, software support specialists, and design support specialists. These employees maintain smooth operation of networks and troubleshoot technical problems. Although IT infrastructure and software is expensive, firms told us that these costs are minimal compared to the labor needed to support them. Based on the survey findings, it is estimated that the three industries could save over $312 million in annual direct and indirect labor costs associated with these employees.
The relationship between a firm’s number of CAx systems and its IT staff employment is not linear; staffing would not be cut in half if the firm reduced its number of systems from two to one. For most firms,

Economic Impact Assessment of the International Standard for the Exchange of Product Model Data (STEP) in Transportation Equipment Industries
8-14
there is a base number of employees for one system and some incremental number of employees for each additional system. During the onsite interviews, respondents provided detailed information on the support staffing they currently retain and how that staffing would change if they could eliminate their redundant CAx system.
For example, one firm told us that it has 300 CAx users. Approximately 31 IT staff would need to support the CAx users if they were all working on a single system. This would increase to 46 IT staffing (about a 50 percent increase) if two systems were being supported.6 This data, averaged across all on-site interviewees, was used to estimate the approximate increase in IT staff for all three positions relative to the number of CAx users. Table 8-7 lists the firm’s present CAx IT staffing and how the staffing would change with the addition of another system.
Table 8-7. Sample Change in IT Staffing Associated with Redundant Systems, 2001
IT Positions Current Staffing Level Potential Staffing Level with an Additional CAx System
Computer and Network Systems Administrators 15 22
Design Support Specialists 10 15
Software Support Specialists 6 9
Total 31 46
Several variables were taken into account when calculating redundant IT staffing costs, in addition to incremental increase coefficients explained in the preceding paragraph. The large number of variables included in the calculation is attributable to the complex formula needed to estimate, for each respondent, how IT staffing would change if STEP were fully implemented and the number of CAx systems dropped.
6If an additional system were added, but with only a small number of users, then
the impact would not be as great. As part of the analysis, the ratio of in-house systems to total seats was used in the firm-level calculations to adjust the IT staffing increases accordingly.
Based on the survey findings, it is estimated that the three industries could save over $312 million in annual direct and indirect labor costs associated with redundant CAx IT staff.

Section 8 — The Potential and Current Economic Impact of STEP
8-15
The IT staffing calculations were based on the following information:
Z Number of CAx users
Z Existing number of CAx systems
Z Potential number of CAx systems
Z Ratio of in-house system seats to total seats
Z Annual work hours
Z Wage rates for each position
Z Incremental staffing coefficients
The calculations took into account the number of system reductions and calculated the difference between the estimated current number of IT professionals in each position and the with-STEP number. The resulting staff reduction was then multiplied by the annual number of work hours and by the appropriate wage rate for each position and industry.
Extrapolating the firm level results to industry-level results yields over $312 million in potential cost savings (see Table 8-8). The greatest costs savings would be for computer and network system administrators at over $139 million a year. On an industry basis, automotive is again the largest beneficiary overall with potential annual savings of $173 million.
8.2.2 End-User Mitigation Costs
Whereas avoidance costs are incurred before interoperability problems occur, mitigation costs are incurred as a firm corrects them. Mitigation costs are primarily labor costs and consist of the wages paid to an employee for alleviating or mitigating losses associated with imperfect data exchange. The two largest categories of mitigation costs are manual reentry costs and file transfer costs. We also discuss a third cost category, inefficient PDM systems; however, few of our respondents had PDM administrations and, except for first-tier automotive suppliers, we were therefore unable to estimate PDM interoperability costs.
Manual reentry costs are the labor charges associated with correcting data after a failed transfer or an incomplete transfer. STEP is less error-prone than other neutral formats; therefore, there are fewer manual reentry jobs overall.

Economic Impact Assessment of the International Standard for the Exchange of Product Model Data (STEP) in Transportation Equipment Industries
8-16
Table
8-8
. P
ote
nti
al R
ed
undant
CA
x I
T S
upport
Sta
ff B
enefi
ts, 2001
D
esig
n Su
ppor
t St
aff
Com
pute
r N
etw
ork
and
Syst
ems
Adm
inis
trat
ors
Soft
war
e Su
ppor
t Sp
ecia
lists
Indu
stry
Per
Empl
oyee
($
)
Indu
stry
-w
ide
(mill
ion
$)
Per
Empl
oyee
($
)
Indu
stry
-w
ide
(mill
ion
$)
Per
Empl
oyee
($
)
Indu
stry
-w
ide
(mill
ion
$)
Tota
l (m
illio
n $)
Aut
omot
ive
68
.5
75
.3
29
.2
173.
0
A
utom
otiv
e O
EMs
3.97
2.
5 4.
36
2.8
1.69
1.
1 6.
3
Fi
rst-
tier
supp
liers
69
.98
51.7
76
.86
56.8
29
.84
22.0
13
0.5
Su
btie
r su
pplie
rs
13.9
2 14
.3
15.2
9 15
.7
5.94
6.
1 36
.2
Aer
ospa
ce
30
.5
36
.2
12
.7
79.3
A
ircr
aft O
EMs
—
—
—
—
—
—
—
A
ircr
aft p
arts
sup
plie
rs
27.9
5 10
.6
32.2
9 12
.3
11.7
3 4.
5 27
.4
A
ircr
aft e
ngin
es a
nd e
ngin
e pa
rts
7.91
0.
8 9.
52
1.0
3.27
0.
3 2.
1
M
issi
le a
nd s
pace
sys
tem
s 22
1.41
19
.0
266.
43
22.9
91
.65
7.9
49.8
Ship
build
ing
20
.8
24
.0
7.
5 52
.3
Sh
ipbu
ilder
s 18
0.89
17
.1
208.
19
19.7
64
.97
6.2
43.0
Sh
ipbu
ildin
g sy
stem
s su
pplie
rs
24.6
4 3.
7 28
.36
4.3
8.85
1.
3 9.
3
Spec
ialt
y To
ol a
nd D
ie
82.3
3 2.
8 10
5.03
3.
5 37
.76
1.3
7.5
Tota
l
122.
6
138.
9
50.6
31
2.1
Sour
ce:
RTI
est
imat
es.

Section 8 — The Potential and Current Economic Impact of STEP
8-17
File transfer costs are the labor costs associated with transferring data from native formats to neutral formats and vice versa. STEP is more efficient than other formats and permits the transfer of a larger array of data layers than does IGES or DXF. In addition, constructing a STEP file from a native file takes less time and involves fewer manipulations than IGES, yielding a productivity gain.
The extent of STEP’s ability to reduce mitigation costs depends on the amount of neutral format data exchange within and between firms. Nearly all firms incur some level of mitigation cost from file transfer errors or other problems, and STEP will not alleviate 100 percent of these problems due to human error and other complications.
Even firms with significant avoidance costs from redundant CAx systems can benefit from STEP through its use for internal transfers between two competing systems. Firms that work with many customers and suppliers, and consequently with a large number of systems, receive and exchange a large number of files in an array of formats. Therefore, these firms are more likely to have high mitigation costs as well as avoidance costs.
For the three industries, it is estimated that STEP could save $476 million in annual mitigation costs (see Table 8-9). The bulk of the potential annual savings would be accrued through more efficient preparation of files for neutral format transfer. The STEP format is more robust than IGES and also saves time for designers during the conversion to and from the native format file. Based on 2001 data, we estimate that using STEP instead of IGES or DXF for data exchange would yield almost $376 million in productivity benefits a year. The calculations to estimate mitigation costs are described below.
Manual Reentry Costs
Each electronic file is mostly made up of a drawing based on a database containing the measurements and geometries of a discrete component. As implied by the differing formats among CAx systems, each system compiles this information differently. Whereas exchanging files among common CAx systems is not a problem, sharing files between competing systems can lead to significant problems, even when files have been converted into a neutral format.

Economic Impact Assessment of the International Standard for the Exchange of Product Model Data (STEP) in Transportation Equipment Industries
8-18
Table 8-9. Summary of Potential Mitigation Benefits, 2001
Manual Reentry
(million $) File Transfer
Costs (million $)
Less Efficient PDM Systems
(million $) Savings
(million $)
Automotive Industry 38.8 152.3 26.0 217.1
Aerospace Industry 11.6 133.0 — 144.6
Shipbuilding Industry 5.0 65.7 — 70.7
Tooling Industry 19.6 24.9 — 44.4
Total Potential Benefits $74.9 $375.9 $26.0 $476.8
Source: RTI estimates.
Using CAx converter programs and most neutral formats still leads to instances of manual reentry among firms. IGES and DXF files are simplified renditions of complex files. When IGES and DXF files are themselves converted into a third format, not only do they lack the richness of the original file but they may require substantial “tweaking” or even reconstruction because of lines that no longer meet or other complications (as described in Section 3.1.2). However, not all manual reentry jobs are attributable to poor conversion; other factors lead to manual reentry jobs. According to interviewees, the translated file may not be usable if the file was originally poorly constructed.
Paying an employee to manually reenter data into a CAx system due to data exchange failures of unreadable or incompatible files is inefficient. That employee’s time would be better spent accomplishing some other task of greater value to the firm. In instances of manual reentry, the employee is replicating work that had already been completed by another, either within the firm or at a different company.
The quality of STEP translations is substantially greater than other neutral formats; consequently, fewer reentry jobs are required. Interviewees who currently use STEP indicated that it has reduced manual reentry jobs by about 80 percent over IGES, DXF, and other methods. Human and computer error will always cause instances of manual reentry, but the amount of that reentry attributable to low-quality neutral format transfers will be significantly less.
Based on information collected during industry interviews, widespread application of STEP could have reduced the number of manual reentry jobs by over 277,000 in 2001 (see Table 8-10).
The quality of STEP translations is substantially greater than other neutral formats; consequently, fewer reentry jobs are required. Interviewees that currently use STEP indicated that it has reduced manual reentry jobs by about 80 percent over IGES, DXF, and other methods.
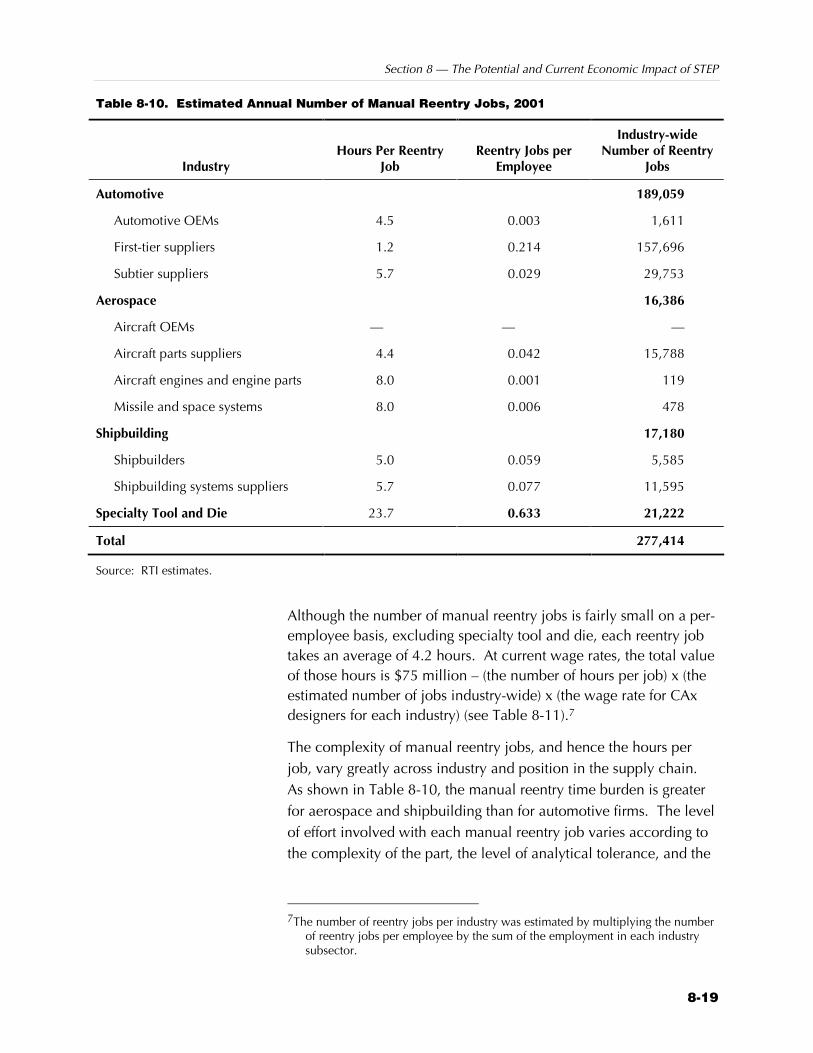
Section 8 — The Potential and Current Economic Impact of STEP
8-19
Table 8-10. Estimated Annual Number of Manual Reentry Jobs, 2001
Industry Hours Per Reentry
Job Reentry Jobs per
Employee
Industry-wide Number of Reentry
Jobs
Automotive 189,059
Automotive OEMs 4.5 0.003 1,611
First-tier suppliers 1.2 0.214 157,696
Subtier suppliers 5.7 0.029 29,753
Aerospace 16,386
Aircraft OEMs — — —
Aircraft parts suppliers 4.4 0.042 15,788
Aircraft engines and engine parts 8.0 0.001 119
Missile and space systems 8.0 0.006 478
Shipbuilding 17,180
Shipbuilders 5.0 0.059 5,585
Shipbuilding systems suppliers 5.7 0.077 11,595
Specialty Tool and Die 23.7 0.633 21,222
Total 277,414
Source: RTI estimates.
Although the number of manual reentry jobs is fairly small on a per-employee basis, excluding specialty tool and die, each reentry job takes an average of 4.2 hours. At current wage rates, the total value of those hours is $75 million – (the number of hours per job) x (the estimated number of jobs industry-wide) x (the wage rate for CAx designers for each industry) (see Table 8-11).7
The complexity of manual reentry jobs, and hence the hours per job, vary greatly across industry and position in the supply chain. As shown in Table 8-10, the manual reentry time burden is greater for aerospace and shipbuilding than for automotive firms. The level of effort involved with each manual reentry job varies according to the complexity of the part, the level of analytical tolerance, and the
7The number of reentry jobs per industry was estimated by multiplying the number
of reentry jobs per employee by the sum of the employment in each industry subsector.
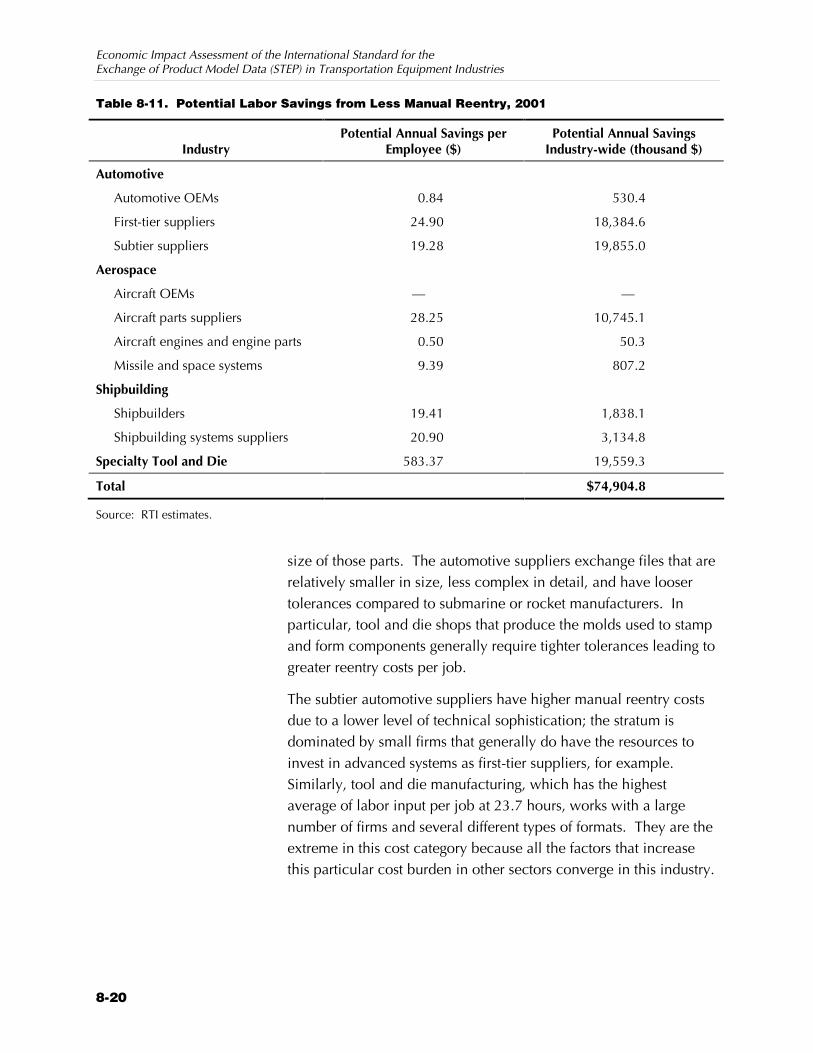
Economic Impact Assessment of the International Standard for the Exchange of Product Model Data (STEP) in Transportation Equipment Industries
8-20
Table 8-11. Potential Labor Savings from Less Manual Reentry, 2001
Industry Potential Annual Savings per
Employee ($) Potential Annual Savings
Industry-wide (thousand $)
Automotive
Automotive OEMs 0.84 530.4
First-tier suppliers 24.90 18,384.6
Subtier suppliers 19.28 19,855.0
Aerospace
Aircraft OEMs — —
Aircraft parts suppliers 28.25 10,745.1
Aircraft engines and engine parts 0.50 50.3
Missile and space systems 9.39 807.2
Shipbuilding
Shipbuilders 19.41 1,838.1
Shipbuilding systems suppliers 20.90 3,134.8
Specialty Tool and Die 583.37 19,559.3
Total $74,904.8
Source: RTI estimates.
size of those parts. The automotive suppliers exchange files that are relatively smaller in size, less complex in detail, and have looser tolerances compared to submarine or rocket manufacturers. In particular, tool and die shops that produce the molds used to stamp and form components generally require tighter tolerances leading to greater reentry costs per job.
The subtier automotive suppliers have higher manual reentry costs due to a lower level of technical sophistication; the stratum is dominated by small firms that generally do have the resources to invest in advanced systems as first-tier suppliers, for example. Similarly, tool and die manufacturing, which has the highest average of labor input per job at 23.7 hours, works with a large number of firms and several different types of formats. They are the extreme in this cost category because all the factors that increase this particular cost burden in other sectors converge in this industry.

Section 8 — The Potential and Current Economic Impact of STEP
8-21
File Transfer Costs
It is well documented that STEP is a more robust neutral format than IGES and DXF, but what is less well known is that it is less time consuming to accomplish neutral format file transfers via STEP than the alternative formats. File transfers occur when firms exchange product model data either internally between two CAx systems or externally with suppliers, customers, and teaming partners. Based on 2001 data, we estimate that STEP could save nearly $400 million annually when used in place of IGES and DXF.
When a file is transferred via STEP, IGES, or DXF, it is converted from a native format, exchanged, and then reconverted into a native format. Neutral formats are frequently used as an intermediate translation solution: for example, a CATIA file may be translated into Unigraphics via STEP or IGES. Converting a file into a neutral format using IGES can be a time-consuming operation. In addition, if the file is not properly prepared the transfer is more likely to fail.
Automotive and aerospace companies said that STEP reduces the file preparation time by 1 hour on average. That means that if a designer used STEP to exchange a file instead of IGES, he or she would save 1 labor hour when preparing the file to be exchanged and 1 labor hour reconstructing the file on the receiving end. Thus, the total benefit per transfer would be 2 hours shared between the transferring and receiving parties.
Several of the data exchange experts interviewed in the automotive and aerospace industries employ STEP as a tool to communicate product model data between systems. In the shipbuilding industry, however, file exchanges are substantially larger and more intricate than those transferred by the aerospace and automotive industries. Internal transfers within shipbuilding firms and external transfers between shipbuilders can be enormous subassemblies and ship components. Because many shipbuilders work in lead yard/follow yard relationships, teaming partners frequently share complete product model data for end products such as destroyers and submarines.
Shipbuilders said that it takes them on average 4 hours to construct a STEP file and 32 hours to construct an equivalent IGES file. This yields an incremental benefit for STEP versus IGES of 28 hours for large transfers within and between shipbuilders.
Based on 2001 data, we estimate that STEP could save nearly $400 million annually when used in place of IGES and DXF.

Economic Impact Assessment of the International Standard for the Exchange of Product Model Data (STEP) in Transportation Equipment Industries
8-22
Whereas we use the 28-hour estimate for transfers among shipbuilders, we a use 1-hour estimate for transfers between shipbuilders and their suppliers. Exchanges between shipbuilders and suppliers are less involved and similar in complexity as transfers in the aerospace and automotive industries.
Volume of Transfers
Based on survey responses, it is estimated that 2.8 million neutral format file transfers were conducted in 2001.8 A transfer may include anything from one discrete part to a collection of parts in a subassembly. It is unlikely that an entire assembled end product would be exchanged electronically; however, it is possible. Thus, information on estimated neutral-format transfers in Table 8-12 does not reflect the number of parts exchanged; rather, the information reflects the number of transfers that are estimated to have occurred. We did not collect information on the number of native-format file transfers conducted. However, companies indicated that the number of native-file transfers was much higher than the number of neutral-format file transfers.
The estimated number of neutral format file transfers illustrates the nature of data exchange in these industries. As hypothesized, suppliers would benefit most from greater usage of STEP. The information in Table 8-13 indicates that STEP could yield significant organizational productivity benefits for suppliers.
For example, of the more than 767,000 transfers performed by subtier automotive suppliers, only slightly more than 40,000 of them were performed via STEP. Perhaps more significant, however, is the case of the first-tier automotive suppliers. These suppliers, long considered the bearer of interoperability costs, are shown to transfer large numbers of neutral-format files externally, but very few of those were with automotive OEMs. The number of neutral-format transfers performed internally is outnumbered more than three to one by external transfers, with the bulk of them being non-STEP external transfers. The data indicate that first-tier suppliers are
8The number of neutral format file transfers per industry was estimated by summing
the number of reported transfers for the companies in the sample and dividing the result by the sum of their employment.

Section 8 — The Potential and Current Economic Impact of STEP
8-23
Ta
ble
8-1
2. E
stim
ate
d V
olu
me
of
Ne
utr
al F
orm
at
File
Tra
nsf
ers
, 2
00
1
In
tern
al F
ile T
rans
fers
Ex
tern
al F
ile T
rans
fers
Indu
stry
ST
EP
Non
-STE
P Su
btot
al
STEP
N
on-S
TEP
Subt
otal
To
tal F
ile
Tran
sfer
s
Aut
omot
ive
67,6
34
354,
006
421,
641
61,0
03
732,
091
793,
094
1,21
4,73
5
A
utom
otiv
e O
EMs
4,89
6 17
,475
22
,371
5,
218
18,6
83
23,9
01
Fi
rst-
tier
supp
liers
52
,210
43
,962
96
,172
25
,730
27
9,32
2 30
5,05
3
Su
btie
r su
pplie
rs
10,5
28
292,
569
303,
097
30,0
54
434,
086
464,
140
Aer
ospa
ce
137,
809
271,
401
409,
210
42,0
03
547,
663
589,
665
998,
875
A
ircr
aft O
EMs
—
—
—
23,9
00
41,9
73
65,8
73
A
ircr
aft p
arts
sup
plie
rs
127,
059
211,
013
338,
072
7,95
7 49
2,69
8 50
0,65
5
A
ircr
aft e
ngin
es a
nd e
ngin
e pa
rts
3,57
5 59
6 4,
171
5,36
3 1,
033
6,39
6
M
issi
le a
nd s
pace
sys
tem
s 7,
175
59,7
91
66,9
66
4,78
3 11
,958
16
,742
Ship
build
ing
14,1
32
242,
760
256,
892
13,8
41
55,7
97
69,6
38
326,
531
Sh
ipbu
ilder
s 14
,132
3,
497
17,6
29
13,8
41
583
14,4
24
Sh
ipbu
ildin
g sy
stem
s su
pplie
rs
—
239,
264
239,
264
—
55,2
15
55,2
15
Spec
ialt
y To
ol a
nd D
ie
32,3
34
90,3
34
122,
667
60,8
34
59,6
67
120,
501
243,
168
Tota
l 25
1,90
9 95
8,50
1 1,
210,
411
177,
680
1,39
5,21
8 1,
572,
898
2,78
3,30
9
Sour
ce:
RTI
est
imat
es.

Economic Impact Assessment of the International Standard for the Exchange of Product Model Data (STEP) in Transportation Equipment Industries
8-24
providing large numbers of IGES, DXF, and other types of files to subtier suppliers but are exchanging native-format files with their customers.
Similarly, aircraft parts suppliers used STEP heavily internally, but exchanged few STEP files externally. The larger suppliers we interviewed, which are akin to first-tier suppliers in the automotive industry, said that they may use STEP internally, but use IGES with smaller contract suppliers. Some aircraft parts suppliers exchange STEP files with OEMs. A number of high-profile projects, such as the Boeing 777 and the Joint Strike Fighter, have made extensive use of STEP transfer between OEMs and subassembly suppliers. In contrast, shipbuilding OEMs and suppliers have no measurable use of STEP at this time. However, this trend may change as shipbuilders become more amenable to the use of STEP with the introduction of a suite of APs developed specifically for that industry.
The potential annual benefit of STEP versus other neutral formats is about $376 million (see Table 8-13). On a per-employee basis, the tooling industry is again the greatest potential beneficiary: it could realize as much as $742.29 of benefit per employee. After specialty tool and die, the largest beneficiaries are the shipbuilding industry and aircraft parts suppliers. The potential benefits were estimated by multiplying, for each industry, the number of transfers, the CAx wage rate, and the time benefit per transfer for internal and external transfers.
The automotive and aerospace OEMs that rely heavily on native-format transfers show the smallest benefits for this category. Automotive OEMs would experience $9.01 of benefit per employee; aircraft engines, $13.75; and aircraft OEMs, $37.35. However, a share of the benefits subsumed in the supply chain would likely accrue to those firms through reduced cycle times and lower prices over time.

Section 8 — The Potential and Current Economic Impact of STEP
8-25
Table 8-13. Potential Benefits from Employing STEP for Neutral-Format File Transfer, 2001
Industry Potential Annual Savings per
Employee ($) Potential Annual Savings Industry-wide (million $)
Automotive 152.3
Automotive OEMs 9.01 5.7
First-tier suppliers 66.77 49.3
Subtier suppliers 94.52 97.3
Aerospace 133.0
Aircraft OEMs 37.35 8.7
Aircraft parts suppliers 294.25 111.9
Aircraft engines and engine parts 13.75 1.4
Missile and space systems 128.33 11.0
Shipbuilding 65.7
Shipbuilders 326.27 30.9
Shipbuilding systems suppliers 232.21 34.8
Specialty Tool and Die 742.29 24.9
Total $375.9
Source: RTI estimates.
Inefficient PDM Administration
Only a small number of the firms interviewed had installed PDM systems at the time of the analysis, although several had plans to do so in the near future. Therefore, we were able to calculate this benefit category only for first-tier automotive suppliers. Several first-tier suppliers indicated that STEP’s use for PDM data exchange would save on PDM reentry costs. Their responses allowed us to estimate $26 million in potential annual STEP benefits for the subsector. This amount is very likely an underestimate, because it only includes potential benefits of STEP associated with supporting existing PDM systems. In many ways, STEP may serve as an enabling technology that will increase the penetration of PDM systems overall. These enabling benefits are not captured in this analysis.
Economic Impact Assessment of the International Standard for the Exchange of Product Model Data (STEP) in Transportation Equipment Industries
8-26
8.2.3 End-User Delay Costs
The third end-user cost category is delay costs: the costs associated with the delay in the production or delivery of manufactured goods caused by imperfect data exchange. An example of a delay cost would be a 3-day delay in the shipment of brake assemblies to an OEM because a key component had to be manually reentered into CAx systems. Delay costs have the potential to account for a significant percentage of the total benefit of STEP.
However, all the firms we spoke with told us that they do not incur delay costs because they incorporate interoperability problems into their design schedules. According to our respondents, mitigation costs are to be expected, and firms react by incorporating buffers into their project milestones. Because of this and the fact that CAx activities are relatively far up stream in the production process, no company indicated that it had ever missed a delivery date due to interoperability problems. However, the fact that interoperability problems influence scheduling indicates that these issues do tacitly delay product development. In addition, late-night and weekend work may resulting from mitigation activities may not show up on cost reports, but they do represent a social cost.
Because respondents were unable to provide information on these issues, however, we were unable to quantify this third cost category.
8.3 SOCIAL COSTS OF STEP The various APs that comprise STEP are the result of efforts supplied by an array of private companies, government and independent research bodies, and public-private consortia. RTI has documented over an estimated $198.4 million (in real-term 2001$) spent since 1987 in the United States on developing STEP, incorporating it into software products, and promoting its use. This cost estimate is very likely to be conservative because many of the costs of STEP development activities were could not be obtained.
These expenditures essentially represent the social costs of STEP—the cost society has incurred to develop this new technology. But STEP’s developers view the costs they have incurred as investments that will provide them future economic return. In their view, that return will be in the form of reduced avoidance and mitigation

Section 8 — The Potential and Current Economic Impact of STEP
8-27
costs, improvements in cycle times, a partial solution to legacy data issues, and an improvement in supply chain management.9
The social costs of STEP began to accrue in 1987. We selected 1987 as our first year because that year was the first in which NIST identified costs directly attributable to STEP development. Industry and software development costs begin with the founding in late 1988 of PDES, Inc., the public-private organization tasked with STEP deployment and coordination in the United States. Although costs were likely incurred for a short time before 1987, information on those activities is vague and unable to be accurately quantified.
This section develops a preliminary estimate of the domestic resources expended to develop STEP. The task of estimating all U.S. expenses is exceedingly difficult because many developers and several standards bodies have entered and exited the STEP arena over time. This analysis also attempts to differentiate between domestic and foreign expenditures because the scope of the benefit analysis is limited to the U.S. automotive, aerospace, and shipbuilding industries.
In summary, the social cost estimates focus only on STEP-related expenditures that support these three U.S. industries. These estimates are admittedly incomplete, because a detailed cost accounting was beyond the scope and resources of this study. However, when paired with the end-user benefits developed in Section 8.2, the social cost estimates allow us to calculate approximate measures of economic return from investments in STEP.
8.3.1 Categories of Social Costs
STEP’s developers fall into three general categories: software developers, industry, and government. This section investigates the STEP development costs by category. Based on the information available, a total of $198.4 million has been invested in STEP development related to the automotive, aerospace, and shipbuilding industries. Of these expenses, software developers (including CAx
9Theoretically, more efficient data exchange should reduce the amount of time
needed to develop and ready a prospective product for production. It could be said, then, that “cycle times” would be reduced, which also implies an improvement in supply chain management. However, because these potential benefits are speculative and difficult to quantify due to variability among firms’ business decisions, they are not quantified in this analysis.
The social costs of STEP began to accrue in 1987. We selected 1987 as our first year because that year was the first in which NIST was able to identify costs directly attributable to STEP development.

Economic Impact Assessment of the International Standard for the Exchange of Product Model Data (STEP) in Transportation Equipment Industries
8-28
vendors and contractors) incurred 27 percent; industry, 42 percent; and federal agencies, including DoD and NIST, 31 percent.
8.3.2 Software Developer Expenditures
At the end of 2001, at least 51 major software suites offered STEP functionality. The first software vendors began the process of developing STEP functionality for inclusion in products in 1993 (see Figure 8-1). Using the data from the software developers survey, we estimate that the inclusion of STEP in software products involved an ongoing average annual expense of $179,113 excluding costs for participation in a number of public-private demonstration services and projects, which were limited to a small number of major vendors. It was also learned that there was approximately a 2-year lag between the decision to support STEP and the product’s release.10
Figure 8-1. Growth in Major CAx Software Packages with STEP Functionality
0
10
20
30
40
50
60
1993 1994 1995 1996 1997 1998 1999 2000 2001
Year
Nu
mb
er o
f S
oft
war
e P
acka
ges
10In this analysis, a software developer is defined as a software vendor or large
contracting firm working to design and implement STEP. Individuals working as developers on specific APs and not also incorporating STEP in products are grouped with industry. According to individuals functioning in this capacity, the funds they receive to perform this work are from industry standards-setting bodies or companies themselves. Thus, this analysis assumes they are the employees of or contractors to such bodies and therefore a part of industry’s expenditures.
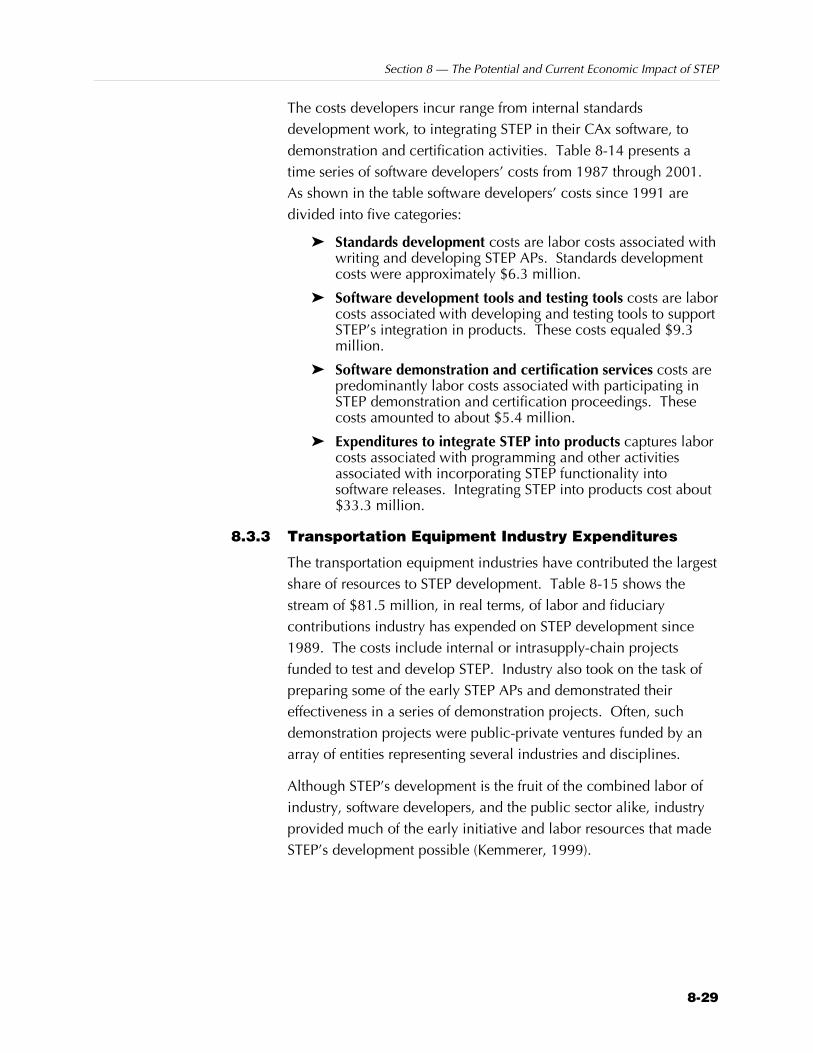
Section 8 — The Potential and Current Economic Impact of STEP
8-29
The costs developers incur range from internal standards development work, to integrating STEP in their CAx software, to demonstration and certification activities. Table 8-14 presents a time series of software developers’ costs from 1987 through 2001. As shown in the table software developers’ costs since 1991 are divided into five categories:
Z Standards development costs are labor costs associated with writing and developing STEP APs. Standards development costs were approximately $6.3 million.
Z Software development tools and testing tools costs are labor costs associated with developing and testing tools to support STEP’s integration in products. These costs equaled $9.3 million.
Z Software demonstration and certification services costs are predominantly labor costs associated with participating in STEP demonstration and certification proceedings. These costs amounted to about $5.4 million.
Z Expenditures to integrate STEP into products captures labor costs associated with programming and other activities associated with incorporating STEP functionality into software releases. Integrating STEP into products cost about $33.3 million.
8.3.3 Transportation Equipment Industry Expenditures
The transportation equipment industries have contributed the largest share of resources to STEP development. Table 8-15 shows the stream of $81.5 million, in real terms, of labor and fiduciary contributions industry has expended on STEP development since 1989. The costs include internal or intrasupply-chain projects funded to test and develop STEP. Industry also took on the task of preparing some of the early STEP APs and demonstrated their effectiveness in a series of demonstration projects. Often, such demonstration projects were public-private ventures funded by an array of entities representing several industries and disciplines.
Although STEP’s development is the fruit of the combined labor of industry, software developers, and the public sector alike, industry provided much of the early initiative and labor resources that made STEP’s development possible (Kemmerer, 1999).
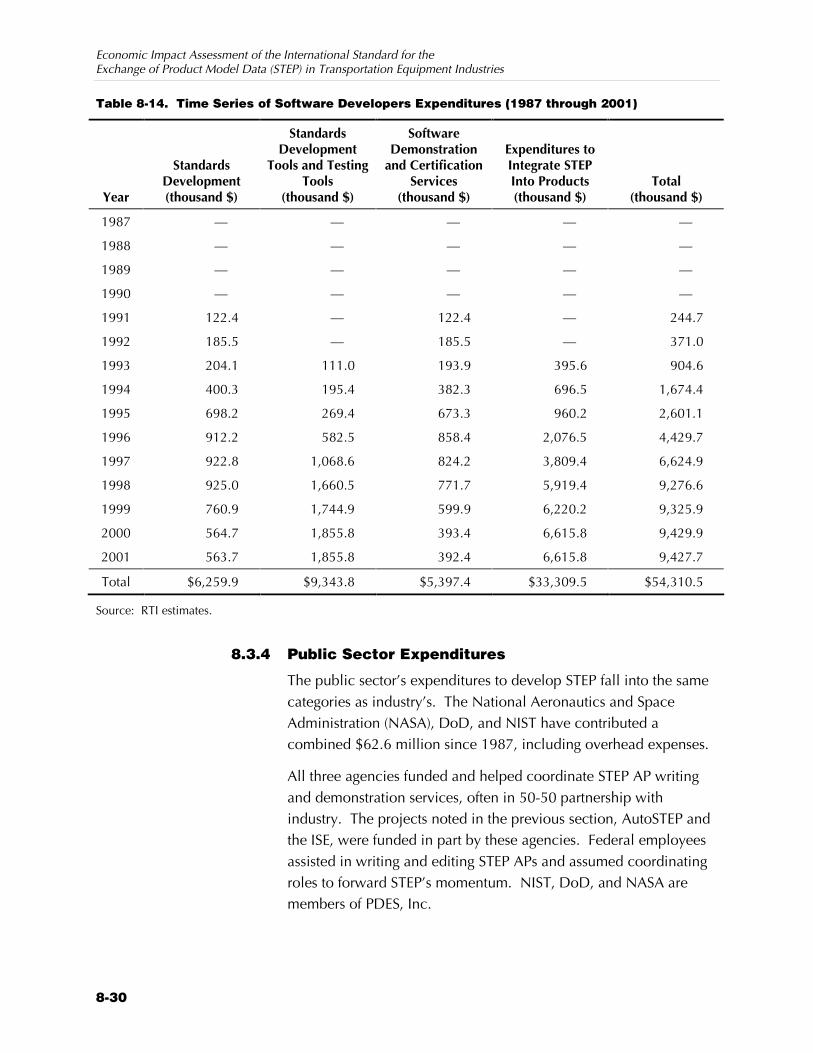
Economic Impact Assessment of the International Standard for the Exchange of Product Model Data (STEP) in Transportation Equipment Industries
8-30
Table 8-14. Time Series of Software Developers Expenditures (1987 through 2001)
Year
Standards Development (thousand $)
Standards Development
Tools and Testing Tools
(thousand $)
Software Demonstration
and Certification Services
(thousand $)
Expenditures to Integrate STEP Into Products (thousand $)
Total (thousand $)
1987 — — — — —
1988 — — — — —
1989 — — — — —
1990 — — — — —
1991 122.4 — 122.4 — 244.7
1992 185.5 — 185.5 — 371.0
1993 204.1 111.0 193.9 395.6 904.6
1994 400.3 195.4 382.3 696.5 1,674.4
1995 698.2 269.4 673.3 960.2 2,601.1
1996 912.2 582.5 858.4 2,076.5 4,429.7
1997 922.8 1,068.6 824.2 3,809.4 6,624.9
1998 925.0 1,660.5 771.7 5,919.4 9,276.6
1999 760.9 1,744.9 599.9 6,220.2 9,325.9
2000 564.7 1,855.8 393.4 6,615.8 9,429.9
2001 563.7 1,855.8 392.4 6,615.8 9,427.7
Total $6,259.9 $9,343.8 $5,397.4 $33,309.5 $54,310.5
Source: RTI estimates.
8.3.4 Public Sector Expenditures
The public sector’s expenditures to develop STEP fall into the same categories as industry’s. The National Aeronautics and Space Administration (NASA), DoD, and NIST have contributed a combined $62.6 million since 1987, including overhead expenses.
All three agencies funded and helped coordinate STEP AP writing and demonstration services, often in 50-50 partnership with industry. The projects noted in the previous section, AutoSTEP and the ISE, were funded in part by these agencies. Federal employees assisted in writing and editing STEP APs and assumed coordinating roles to forward STEP’s momentum. NIST, DoD, and NASA are members of PDES, Inc.
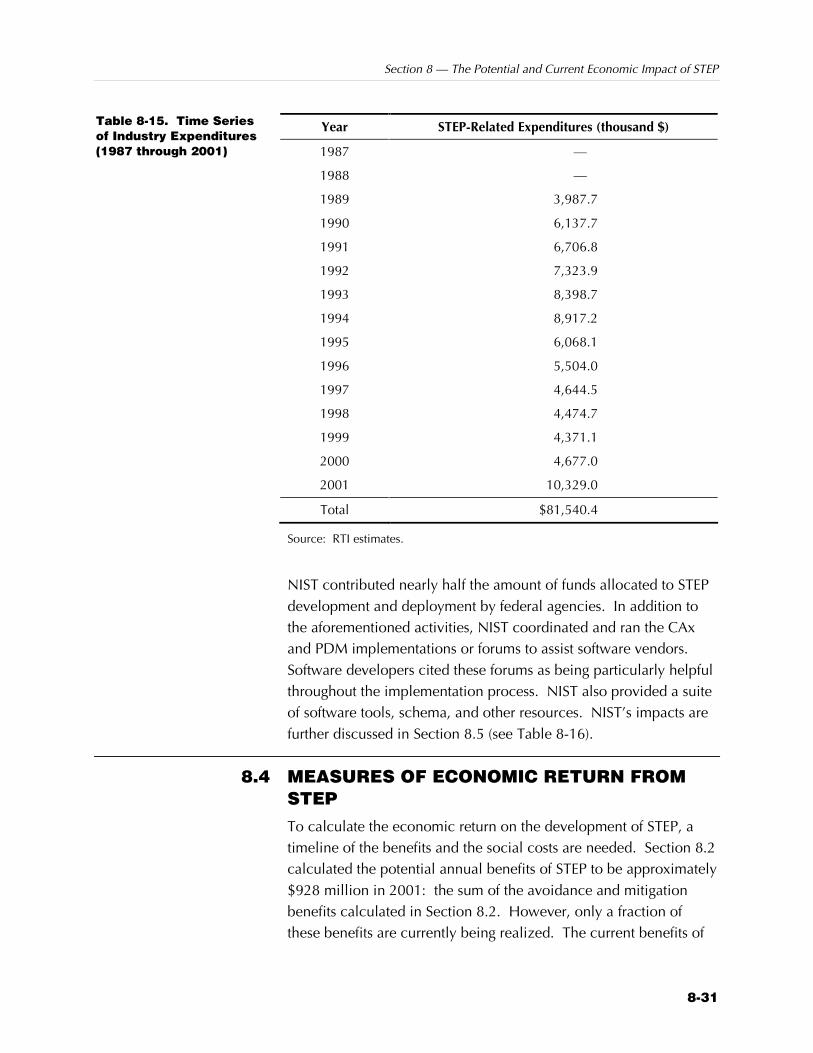
Section 8 — The Potential and Current Economic Impact of STEP
8-31
Year STEP-Related Expenditures (thousand $)
1987 —
1988 —
1989 3,987.7
1990 6,137.7
1991 6,706.8
1992 7,323.9
1993 8,398.7
1994 8,917.2
1995 6,068.1
1996 5,504.0
1997 4,644.5
1998 4,474.7
1999 4,371.1
2000 4,677.0
2001 10,329.0
Total $81,540.4
Source: RTI estimates.
NIST contributed nearly half the amount of funds allocated to STEP development and deployment by federal agencies. In addition to the aforementioned activities, NIST coordinated and ran the CAx and PDM implementations or forums to assist software vendors. Software developers cited these forums as being particularly helpful throughout the implementation process. NIST also provided a suite of software tools, schema, and other resources. NIST’s impacts are further discussed in Section 8.5 (see Table 8-16).
8.4 MEASURES OF ECONOMIC RETURN FROM STEP To calculate the economic return on the development of STEP, a timeline of the benefits and the social costs are needed. Section 8.2 calculated the potential annual benefits of STEP to be approximately $928 million in 2001: the sum of the avoidance and mitigation benefits calculated in Section 8.2. However, only a fraction of these benefits are currently being realized. The current benefits of
Table 8-15. Time Series of Industry Expenditures (1987 through 2001)
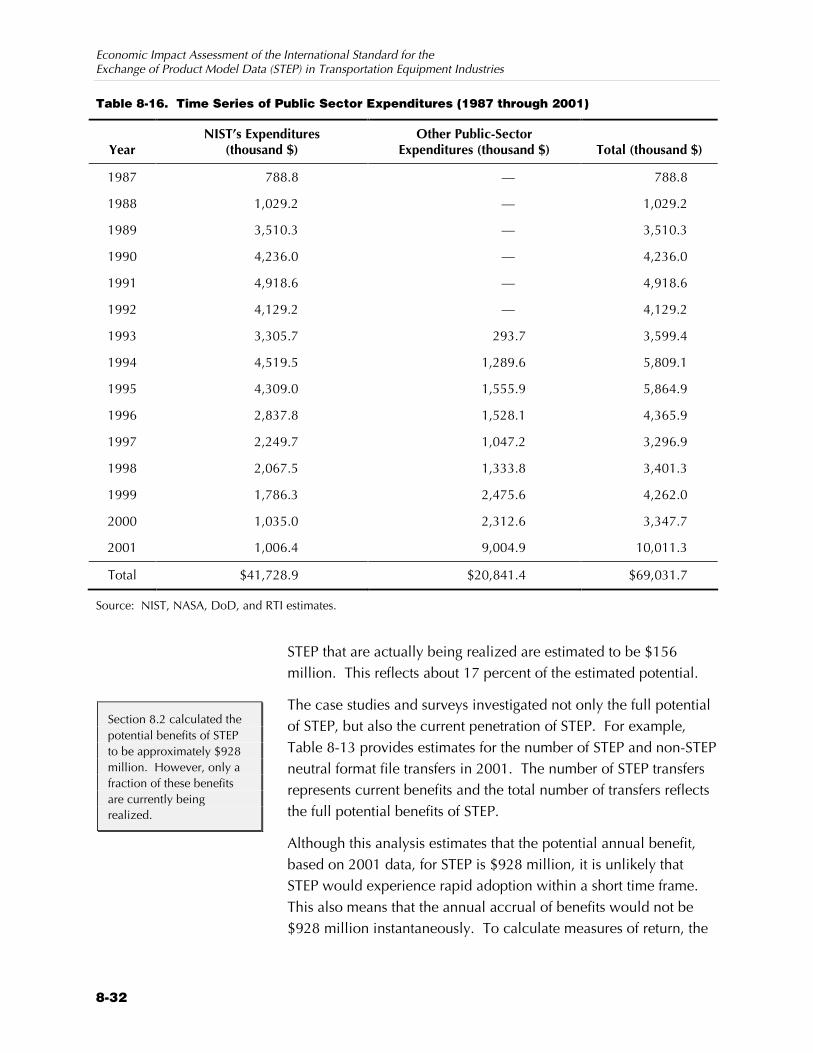
Economic Impact Assessment of the International Standard for the Exchange of Product Model Data (STEP) in Transportation Equipment Industries
8-32
Table 8-16. Time Series of Public Sector Expenditures (1987 through 2001)
Year NIST’s Expenditures
(thousand $) Other Public-Sector
Expenditures (thousand $) Total (thousand $)
1987 788.8 — 788.8
1988 1,029.2 — 1,029.2
1989 3,510.3 — 3,510.3
1990 4,236.0 — 4,236.0
1991 4,918.6 — 4,918.6
1992 4,129.2 — 4,129.2
1993 3,305.7 293.7 3,599.4
1994 4,519.5 1,289.6 5,809.1
1995 4,309.0 1,555.9 5,864.9
1996 2,837.8 1,528.1 4,365.9
1997 2,249.7 1,047.2 3,296.9
1998 2,067.5 1,333.8 3,401.3
1999 1,786.3 2,475.6 4,262.0
2000 1,035.0 2,312.6 3,347.7
2001 1,006.4 9,004.9 10,011.3
Total $41,728.9 $20,841.4 $69,031.7
Source: NIST, NASA, DoD, and RTI estimates.
STEP that are actually being realized are estimated to be $156 million. This reflects about 17 percent of the estimated potential.
The case studies and surveys investigated not only the full potential of STEP, but also the current penetration of STEP. For example, Table 8-13 provides estimates for the number of STEP and non-STEP neutral format file transfers in 2001. The number of STEP transfers represents current benefits and the total number of transfers reflects the full potential benefits of STEP.
Although this analysis estimates that the potential annual benefit, based on 2001 data, for STEP is $928 million, it is unlikely that STEP would experience rapid adoption within a short time frame. This also means that the annual accrual of benefits would not be $928 million instantaneously. To calculate measures of return, the
Section 8.2 calculated the potential benefits of STEP to be approximately $928 million. However, only a fraction of these benefits are currently being realized.

Section 8 — The Potential and Current Economic Impact of STEP
8-33
STEP penetration rate is assumed to be 75 percent in 2010. Put another way, in 2010 the annual STEP benefit, all things held the same, would be about $697 million. STEP penetration therefore moves from 0 percent in 1994 to 17 percent in 2001 to 75 percent in 2010.
The adoption and use of STEP is modeled as a continuous diffusion curve. The S-shaped diffusion curve approaches the full industry potential asymptotically. The net present value of those benefits is their sum discounted back to 2001 using the 7 percent social discount rate recommended by the Office of Management and Budget (OMB).
Forecasting STEP’s rate of diffusion is difficult because it is in the early stages of adoption. It is a function of the number of current adopters, the number of potential adopters, and the rate at which information and knowledge pass from one agent to another. This study forecasts diffusion using the Bass two-parameter diffusion model (Mahajan, Muller, and Bass, 1990; Mahajan and Peterson, 1985). The Bass model generates a common S-shaped causal diffusion curve and is presented in Eq. (8.1),
Bt = Bt-1 + p (M – Bt-1) + q (Bt-1/M)(M – Bt-1) (8.1)
Bt is the benefits realized in year t, and reflects the cumulative number of STEP adopters through year t; p is the external influence coefficient; q is the internal influence coefficient; and M is the total (market) potential of STEP’s impact on interoperability costs.
An S-shaped diffusion curve is theoretically consistent with most empirical studies of technology adoption (Geroski, 2000; Mahajan and Peterson, 1985; RTI, 1999). Originally, only a small number of firms adopt this technology. As more firms observe the benefits realized by initial adopters, they too adopt the technology.
Thus, the benefit diffusion curve is fitted based on the following information:
Z Benefits begin in 1995, the first year STEP functionality was commercially available.
Z Current benefits in 2001 are estimated to be $156 million.
Z Maximum potential benefits are $928 million.
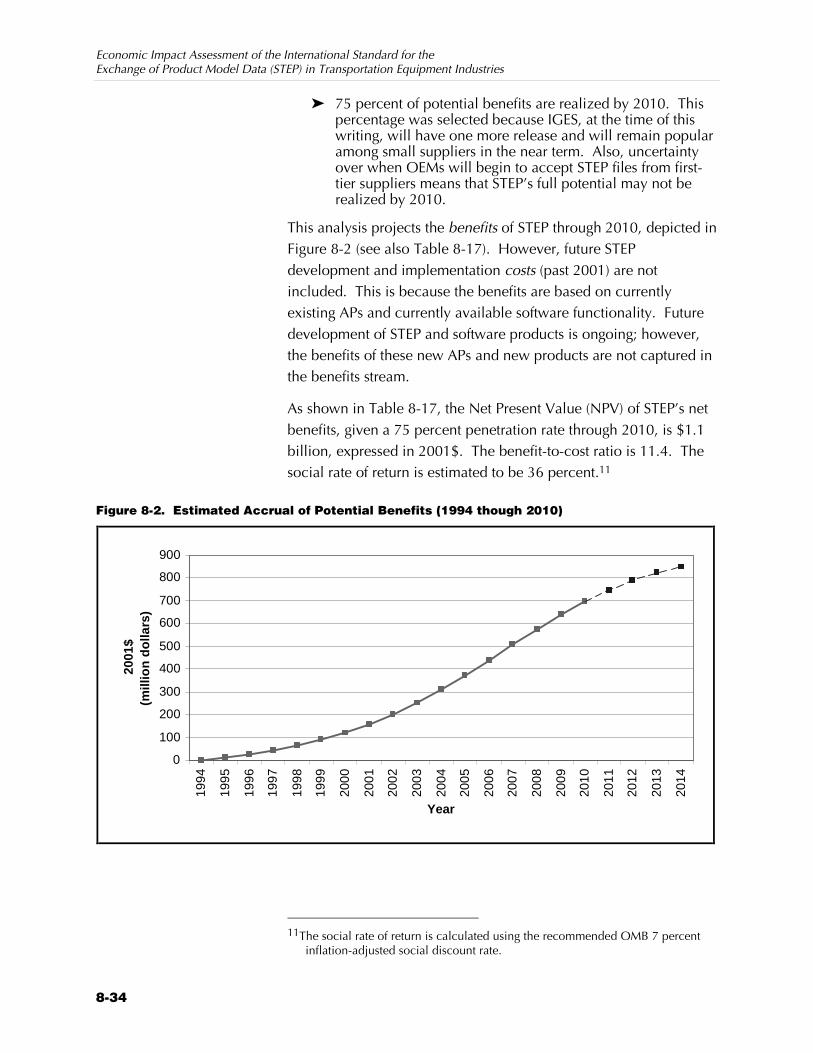
Economic Impact Assessment of the International Standard for the Exchange of Product Model Data (STEP) in Transportation Equipment Industries
8-34
Z 75 percent of potential benefits are realized by 2010. This percentage was selected because IGES, at the time of this writing, will have one more release and will remain popular among small suppliers in the near term. Also, uncertainty over when OEMs will begin to accept STEP files from first-tier suppliers means that STEP’s full potential may not be realized by 2010.
This analysis projects the benefits of STEP through 2010, depicted in Figure 8-2 (see also Table 8-17). However, future STEP development and implementation costs (past 2001) are not included. This is because the benefits are based on currently existing APs and currently available software functionality. Future development of STEP and software products is ongoing; however, the benefits of these new APs and new products are not captured in the benefits stream.
As shown in Table 8-17, the Net Present Value (NPV) of STEP’s net benefits, given a 75 percent penetration rate through 2010, is $1.1 billion, expressed in 2001$. The benefit-to-cost ratio is 11.4. The social rate of return is estimated to be 36 percent.11
Figure 8-2. Estimated Accrual of Potential Benefits (1994 though 2010)
0
100
200
300
400
500
600
700
800
900
1994
1995
1996
1997
1998
1999
2000
2001
2002
2003
2004
2005
2006
2007
2008
2009
2010
2011
2012
2013
2014
Year
2001
$(m
illio
n d
olla
rs)
11The social rate of return is calculated using the recommended OMB 7 percent
inflation-adjusted social discount rate.

Section 8 — The Potential and Current Economic Impact of STEP
8-35
Table 8-17. Time Series of STEP Benefits and Social Costs, Assuming 75 Percent STEP Penetration Rate in 2010
Year Benefits (million $) Social Costs (million $) Net Benefits (million $)
1987 — 0.8 –0.8
1988 — 1.0 –1.0
1989 — 7.5 –7.5
1990 — 10.4 –10.4
1991 — 11.9 –11.9
1992 — 11.8 –11.8
1993 — 12.9 –12.9
1994 — 16.4 –16.4
1995 10.7 14.5 –3.8
1996 24.2 14.3 9.9
1997 41.1 14.6 26.5
1998 62.0 17.2 44.8
1999 87.7 18.0 69.7
2000 119.0 17.5 101.6
2001 156.6 29.8 126.8
2002 200.9 — 200.9
2003 252.1 — 252.1
2004 309.9 — 309.9
2005 373.2 — 373.2
2006 440.3 — 440.3
2007 508.9 — 508.9
2008 576.2 — 576.2
2009 639.7 — 639.7
2010 697.1 — 697.1
NPV $1,186.3 $104.3 $1,082.0
Source: RTI estimates.
8.5 RETURN TO NIST CONTRIBUTIONS NIST’s role has had a positive effect on the quality, timing, and cost of the development and deployment of STEP, according to the software developers interviewed for this analysis. During the interview phase, software developers were asked about their general impressions of NIST’s STEP-related offerings and activities to assess

Economic Impact Assessment of the International Standard for the Exchange of Product Model Data (STEP) in Transportation Equipment Industries
8-36
the impact that NIST has had on STEP’s development. Interviewees indicated that NIST has had a significant impact on the development of STEP APs and STEP’s implementation into their products. Most frequently cited was NIST’s role as a resource, supplying knowledgeable staff to support PDES, attend meetings, and provide the expertise needed to facilitate the standards-development process. They also cited coordination activities between international standard organizations as important contributions.
Vendors stated that NIST improved the overall quality of standards being developed, accelerated the availability of STEP in commercial products, and lowered the cost of development through their contributions to
Z EXPRESS (SIO 10303-11),
Z AP203 (ISO 10303-203),
Z Mapping Table Generators,
Z NIST EXPRESS Toolkit,
Z STEP File Checker,
Z STEP certification process,
Z PDM schema, and
Z General administrative activities.
Interviewees supplemented their anecdotal comments by completing a matrix that asked whether a variety of NIST activities yielded quality improvements, development acceleration, and cost reductions for their own operations. Table 8-18 summarizes software developers’ impressions with open circles symbolizing “some impact” and dark circles representing “great impact.” Their responses indicate that almost all of NIST’s contributions had an impact on the overall quality of STEP, and slightly fewer helped accelerate STEP’s development and introduction. Those that yielded cost reductions numbered five: the Mapping Table Generator, PDM Schema, NIST EXPRESS Toolkit, STEP File Checker, and STEP certification services.
Although they were able to determine whether NIST’s contributions affected their product development cycles, vendors were not able to quantify either quality improvements or cost reductions. However, they did indicate that NIST’s contributions accelerated the implementation of STEP functionality into their products by about 1 year.
Developers indicate that almost all of NIST’s contributions had an impact on the overall quality of STEP, and slightly fewer helped accelerate STEP’s development and introduction. Those that yielded cost reductions numbered five: the Mapping Table Generator, PDM Schema, NIST EXPRESS Toolkit, STEP File Checker, and STEP certification services.

Section 8 — The Potential and Current Economic Impact of STEP
8-37
Table 8-18. Software Developers’ Impressions
NIST’s Impacts
Quality
Improvements Acceleration Cost
Reductions
Standards Development � � �
Administrative contributions X X� �
EXPRESS (ISO 10303-11) X� X� �
AP203 (ISO 10303-203) X� � �
Mapping Table Generator X� X� X�
PDM schema X� X� X�
Software Development Tools and Testing Tools � � �
NIST EXPRESS Toolkit X� X� X�
STEP Class Library � � �
Expresso � � �
STEP File Checker X� X� X�
STEP Geometry Analyzer � � �
Demonstration and Certification Services � � �
AutoSTEP testing project � � �
CAx and PDM implementor forums X� X� X�
STEP certification services X� X� X�
Note: X = Significant Impact X = Moderate Impact
Not surprisingly, industry end users of STEP were less aware of NIST’s role in its development. The CAx engineers and IT staff interviews were generally removed from the standards-development process and were typically not aware of who had supported the development of the testing tools and demonstration and certification services available for STEP. In addition, industry staff who had been involved in the development of STEP were frequently no longer with the company or had been reassigned. As a result, few end-user companies were aware of NIST’s role in the development of STEP.
8.5.1 Estimating NIST’s Impact
The 1-year acceleration effect is used as a partial indicator of the economic impact resulting from NIST’s activities. Admittedly, this does not capture NIST’s full impact because missing are quality improvements and cost reductions. However, the acceleration effect does provide a conservative metric to assess NIST’s contributions.

Economic Impact Assessment of the International Standard for the Exchange of Product Model Data (STEP) in Transportation Equipment Industries
8-38
Table 8-19 provides the time series of NIST expenditures along with the incremental benefits resulting from NIST’s acceleration effect. As shown in Table 8-20, the NPV of NIST’s expenditures through 2001 is $26.0 million and the NPV of NIST acceleration benefit is 206.1 million. As with the total social costs of STEP, future NIST expenditures are not included because benefits are based on existing STEP capabilities.
Subtracting the incremental acceleration benefits and NIST’s expenditures yields a NPV of $180.1 million. The benefit-to-cost ratio is 7.9 and the social rate of return is 32 percent.
8.6 SUMMARY OF IMPACTS Table 8-20 presents an overview of the empirical findings. STEP has the potential to reduce CAx interoperability costs in the three industries studied by approximately $928 million (2001$) annually. The automotive industry represents the largest share of potential benefits (51 percent), followed by aerospace (27 percent), and shipbuilding (16 percent).
Avoidance cost savings accounted for approximately half of the potential benefits of STEP. Eighty percent of avoidance costs were labor costs associated with the use and support of redundant CAx systems. Mitigation costs resulting from file transfer and data reentry accounted for the balance of benefits. No company interviewed indicated that they experienced delay costs associated with CAx interoperability problems.
The current benefits resulting from STEP use in 2001 are estimated to be approximate $156 million. Realized benefits represent approximately 14 percent of STEP’s estimated potential, with most current benefits again realized by the automotive industry.
Table 8-21 presents the present value of benefit and costs, along with the ratio of benefits to costs and the social rate of return for domestic STEP activities. Benefits and costs were projected through 2010 assuming a 75 percent penetration rate for STEP in 2010. STEP development costs include expenditures by government agencies, software vendors, and industry users, and were estimated to be approximately $17 million in the late 1990s.
STEP has the potential to reduce interoperability costs in the three industries studied by approximately $928 million annually. STEP development costs, on the other hand, were estimated to be approximately $17 million per year during the mid to late 1990s.

Section 8 — The Potential and Current Economic Impact of STEP
8-39
Table 8-19. Time Series of NIST Expenditures and Acceleration Benefits
Year NIST Expenditures
(million $)
STEP Benefit with NIST (million $)
(a)
STEP Benefits without NIST (million $) (lagged 1 year)
(b)
NIST’s Acceleration Impact on Benefits
(million $) (a – b)
1987 0.8 — — —
1988 1.0 — — —
1989 3.5 — — —
1990 4.2 — — —
1991 4.9 — — —
1992 4.1 — — —
1993 3.3 — — —
1994 4.5 — — —
1995 4.3 10.7 — 10.7
1996 2.8 24.2 10.7 13.5
1997 2.2 41.1 24.2 16.9
1998 2.1 62.0 41.1 20.9
1999 1.8 87.7 62.0 25.7
2000 1.0 119.0 87.7 31.3
2001 1.0 156.6 119.0 37.6
2001 — 200.9 156.6 44.3
2003 — 252.1 200.9 51.2
2004 — 309.9 252.1 57.8
2005 — 373.2 309.9 63.3
2006 — 440.3 373.2 67.1
2007 — 508.9 440.3 68.6
2008 — 576.2 508.9 67.4
2009 — 639.7 576.2 63.5
2010 — 697.1 639.7 57.4
NPV $26.0 $1,186.3 $980.3 $206.1

Economic Impact Assessment of the International Standard for the Exchange of Product Model Data (STEP) in Transportation Equipment Industries
8-40
Table 8-20. Potential Annual Benefits of STEP for CAx Applications (millions 2001$)
Potential Benefits of STEP
Industry Avoidance Mitigation Total Current Benefits
Total
Automotive $253.1 $217.1 $470.2 $86.6
Aerospace $108.4 $144.6 $253.0 $35.2
Shipbuilding $76.4 $70.7 $147.1 $25.7
Specialty Tool & Die $13.5 $44.4 $57.9 $9.1
Total $451.4 $476.8 $928.2 $156.6
Table 8-21. Measures of Economic Return
Economic Returns
to STEP Returns to NIST
Expenditures
Present Value of Benefits (millions 2001$) b 1,186 206
Present Value of Costs (millions 2001$)a,b –104 –26
Net Present Value (millions 2001$)b 1,082 180
Benefit-to-Cost Ratio 11.4 7.9
Social Rate of Return (percent)b 36.1 31.6
aCosts are presented as negative numbers. bOMB-recommended social discount rate of 7 percent is used.
Table 8-21 also estimates returns to NIST’s approximate $41.7 million (present value $26 million 2001$) investment to support STEP development and software implementation. Industry indicated that NIST’s activities accelerated the development and adoption of STEP by about 1 year, yielding and an economic impact of $180 million (NPV 2001$).

R-1
References
Aerospace Industries Association (AIA). 2000. “2000 Year-end Review and 2001 Forecast—An Analysis.” Washington, DC: Aerospace Industries Association of America.
Aerospace Industries Association (AIA). 2001. Aerospace Facts and Figures 2001/2002. Washington, DC: Aerospace Industries Association.
Altarum (formerly ERIM). September 1997. “Product Data Exchange in Automotive Supply Chains—AutoSTEP at the Midpoint.” Document D-8, AIAG.
American Shipbuilding Association (ASA). 2000a. “The American Shipbuilding Association.” <http://www.americanshipbuilding.com/asa.html>. As obtained on December 11, 2000.
American Shipbuilding Association (ASA). 2000b. “The American Shipbuilding Industrial Base.” <http://www.americanshipbuilding.com/stats-base.html>. As obtained on December 11, 2000.
American Shipbuilding Association (ASA). 2001. “The Defense Shipbuilding Industrial Base: An Industry at Risk.” <http://www.americanshipbuilding.com/defense%20 shipbuilsing%20industrial%20base.html>. May. As obtained on August 12, 2002.
Automotive Industry Action Group (AIAG). 1997a. “Product Data Exchange in Automotive Supply Chains—AutoStep at the Midpoint.” Southfield, MI: Automotive Industry Action Group.

Economic Impact Assessment of the International Standard for the Exchange of Product Model Data (STEP) in Transportation Equipment Industries
R-2
Automotive Industry Action Group (AIAG). 1997b. “A Snapshot of Product Development Practices in Automotive Supply Chains.” Southfield, MI: Automotive Industry Action Group.
Automotive News Europe. December 22, 1997. “Platforms are Fewer, but More Flexible.” 2(26):6.
Automotive News. 1997. 1997 Market Data Book. Detroit: Marketing Services Inc.
Beckert, B.A. 1999. “Taking the Aerospace Industry to New Heights.” Computer-Aided Engineering 18(11):26.
Brooke, L. 1998. “Unibody vs. Body-on-Frame; Sport-Utility Frames; Includes Related Articles on Low-Cost Sport Utility Vehicles and Frame Styles.” Lexis-Nexis Academic Universe 178(1):32. <http://web.lexis-nexis.com/univers…5= 6e903b1dd9914cad980fbeb0942b547a>.
Buchholz, K. 1996. “Simultaneous Engineering Saves Times and Money.” 104(11):97. Lexis-Nexis Academic Universe 178(1):32. <http://web.lexis-nexis.com/univers…5= 97d827356946a181ae480b0eb7207546>.
Bureau of Labor Statistics. “2000 OES Industry-Specific Occupational Employment and Wage Estimates.” <http://www.bls.gov/oes/2000/oessrci.html>. As obtained on February 2, 2000.
Dauch, R.E. 1993. “Passion for Manufacturing.” Dearborne, MI: Society of Manufacturing Engineers.
Doty, R. 1994. “Open Systems: The Next STEP.” Action Line (January/February):30-33.
Dun & Bradstreet via CompaniesOnline. <http://www.companiesonline.com>. A service of Terra Lycos, S.A., Barcelona, Spain, as obtained on December 11, 2000.
Eyres, D.J. 1994. Ship Construction, 4th Edition. Boston: Butterworth-Heinemann, Ltd.
Fine, C.H., and D. Whitney. 1996. “Is the Make or Buy Decision Process a Core Competitiveness?” Working paper. Cambridge, MA: MIT Center for Technology, Policy, and Industrial Development.

References
R-3
Fleischer, Mitchell. 1999. “Supplier Management in Shipbuilding.” <http://www.erim.org/cec/papers/miscip/marineLog/ index.htm>. As obtained on 12/12/00.
Fleischer, M., T. Phelps, and M. Ensing. 1991. CAD/CAM Data Problems and Costs in the Tool and Die Industry. A Report on a Study Conducted for the Michigan Modernization Service by Industrial Technology Institute and the Detroit Chapter of the National Tooling and Machine Association.
Flynn, M.S., B.M. Belzowski, B. Bluestein, M. Ger, M. Tuerks, and J. Waraniak. 1996. “The 21st Century Supply Chain: Changing Roles, Responsibilities and Relationships in the Automotive Industry.” Chicago: A.T. Kearney, Inc.
Frechette, S. 1997. “STEP Implementation: Solid Model Exchange Results in the AutoSTEP Pilot Project.” Agility and Global Competition 1(3):1-12.
Freedman, D. 1994. “Bits to Ships.” Forbes 154(13):28-32.
Fuller, G.H. 1994. “Organizing the Process from Concept to Disposal Research and Development Objectives.” In Marine Engineering: Design and Operation of Ships and Offshore Structures, T.K.S. Murthy and C.A. Brebbia, eds. Boston: Computational Mechanics Publications.
Geroski, P.A. 2000. “Models of Technology Diffusion.” Research Policy 29(2000):603-625.
Hays, B.N., and T.R. McNatt. 1994. “The Integrated, Computer-based Ship Design Environment.” In Marine Engineering: Design and Operation of Ships and Offshore Structures, T.K.S. Murthy and C.A. Brebbia, eds. Boston: Computational Mechanics Publications.
Industry Canada. http://strategis.ic.gc.ca/SSG/ad03597e.html. As obtained on June 20, 2000
Information Access Corporation. 2000. Business & Company ProFile [computer file]. Foster City, CA: Information Access Corporation.
Information Access Corporation. 2002. General Business File [computer file]. Foster City, CA: Information Access Corporation.

Economic Impact Assessment of the International Standard for the Exchange of Product Model Data (STEP) in Transportation Equipment Industries
R-4
Institute for Labor Relations at the University of Michigan. ”Contribution of the Automotive Industry to the U.S. Economy in 1998: The Nation and Its Fifty States.” Prepared for the Alliance of Automobile Manufacturers, Inc. and the Associations of International Automobile Manufacturers, Inc. Winter 2001.
Jenkinson, L.R., P. Simpkin, and D. Rhodes. 1999. Civil Jet Aircraft Design. AIAA Education Series. J.S. Przemieniecki, ed. Reston, VA: American Institute of Aeronautics and Astronautics, Inc.
Jost, K. 1998. “Chrysler Redesigns Its Large Cars for 1998.” Lexis-Nexis Academic Universe 106(1):10. <http://web.lexis-nexis.com/univers…5=21777aca18ea 2177704ce765373ec3d>.
Kaminski, P.G., Under Secretary of Defense for Acquisition and Technology. 1996. “Defense Acquisition and Virtual Prototyping.” Luncheon Address to NSIA Collaborative Virtual Prototyping Symposium, Arlington, VA, April 23.
Kemmerer, J. S. 1999. “STEP: The Grand Experience.” NIST Special Publication 939.
Loates, A. 2000. “Advanced Warship Production Techniques.” Glasgow: Yarrow Shipbuilders Ltd and Inegraph plc. <http://www.integraph.com/impd/articles/advwar.htm>. As obtained on October 20, 2000.
Mahajan, V., E. Muller, and F.M. Bass. 1990. “New Product Diffusion Models in Marketing: A Review and Directions for Research.” Journal of Marketing 54(1):1-26.
Mahajan, V., and R. Peterson. 1985. Models for Innovation Diffusion. Beverly Hills, CA: Sage Publications.
Martin, N. 1998. “Putting the Tools to Work; Automobile Company Design Platforms; Includes Related Article on American Manufacturers.” Lexis-Nexis Academic Universe 178(9):105. <http://web.lexis-nexis.com/univers…5= 7ae9d52b10e7e852d5d723e0b188cc40>.
McEwan, I. 1995. “In STEP with Suppliers: GM’s Perspective on Product Data Exchange.” Excerpt from a speech given at AutoFact ’94. PRONews. <http://www.scra.org/uspro// events/gm_persp.html>.

References
R-5
National Institute of Standards and Technology (NIST). 1997. “Cost Modeling: Economic Loss Due to CAD/CAM File Incompatibility in the Automotive Industry.” NIST presentation.
National Research Council (NRC). 1998. Maintaining U.S. Leadership in Aeronautics: Breakthrough Technologies to Meet Future Air and Space Transportation Needs and Goals. Washington, DC: National Academy Press.
National Tooling and Machining Association. <http://www.ntma.org>. As obtained on January 25,2002.
Phelan, M. 1997. “Sprechen Sie Megasupplier.” Automotive Industries June:71-75.
Research Triangle Institute (RTI). 1999. Interoperability Cost Analysis of the U.S. Automotive Supply Chain. Report prepared for the National Institute of Standards and Technology. Research Triangle Park, NC: Research Triangle Institute.
Sawant, A.V., and J.N. Nazemetz. 1998. “Impediments to Data Exchange and Use of STEP for Data Exchange.” Paper developed under the Computer Assisted Technology Transfer (CATT) research program. Contract number F34601-95-D-00376. Oklahoma State University working paper.
Stiglitz, J.E. 1988. Economics of the Public Sector. New York: W.W. Norton & Company.
Target. 1994. “Are You Prepared for the Information Based Global Economy? STEP Towards the Future.” Target 10(1):30.
Tassey, G. 1997. The Economics of R&D Policy. Westport, CT: Quorum Books.
Thurston, C.W. 1996. “Computer-aided Robotics Trims Manufacturers’ Costs.” Journal of Commerce and Commercial. 408(28713):7a.
U.S. Census Bureau. 1999. 1997 Economic Census, Industry Series: Ship Building and Repairing. EC97M-3366A. Washington, DC: U.S. Government Printing Office.
U.S. Census Bureau. 2000. Statistical Abstract of the Unites States: 1999. Washington, DC: U.S. Government Printing Office.

Economic Impact Assessment of the International Standard for the Exchange of Product Model Data (STEP) in Transportation Equipment Industries
R-6
U.S. Census Bureau. 2002. Annual Survey of Manufactures: Statistics for Industry Groups and Industries: 2000. M00(AS)-1. Issued February 2002. Washington, DC.
U.S. Product Data Association (U.S. Pro). 2002. “What is U.S. Pro?” <http://www.uspro.org/ whatisuspro.html>. As obtained on November 21, 2002.
Wells, K. 2000. “Aerospace.” In U.S. Industry & Trade Outlook, 2000. New York: McGraw-Hill.
Whitney, D. 1995. State of the Art in the United States of CAD Methodologies for Product Development. Final report under grants from Office of Naval Research and the National Science Foundation. Cambridge, MA: MIT, Center for Technology, Policy and Industrial Development.
Wijnolst, N. 1995. Design Innovation in Shipping. Delft, The Netherlands: Delft University Press.
Womack, J.P. 1989. “The U.S. Automobile Industry in an Era of International Competition: Performance and Prospects.” MIT Commission on the Industrial Productivity working paper.

Appendix A: Telephone Survey


A-1
Questionnaire: First-Tier Suppliers
Introduction
On behalf of the National Institute of Standards and Technology (NIST), Research Triangle Institute (RTI) is evaluating the potential benefits of STEP in reducing interoperability costs for the exchange of product data. Interoperability problems arise when members of the supply chain create technical data using different design, manufacturing, engineering, or product data management (PDM) software applications. As a member of an industry that is actively involved in product design and engineering, you have unique insights into the product data exchange problem. The information you provide will help NIST better assess the benefits of STEP and the needs of this portion of the manufacturing sector, thereby allowing NIST to channel future investments towards projects that best meet those needs.
Please answer the questions in the attached questionnaire with reference to your work on design and development of components and systems for projects with OEMs and second-tier suppliers in 2000. If information for 2000 is not available, please record your most recent data and indicate its year. Please feel free to collaborate with your colleagues when answering these questions. The data you provide will only be used in aggregate with other companies and will not be disclosed to third parties.
A staff member from RTI will contact you in the next few days to answer any questions you may have. At that time you can respond to the questionnaire over the phone, or you can complete the questionnaire and fax it to us at (919) 541-6683. If you have any questions prior to the interview, please feel free to contact Mike Gallaher at (919) 541-5935 or Alan O’Connor at (919) 541-7186.
Thank you for participating in this survey.

A-2
OMB NO: 0693-0031 Expires 10/31/2002
This survey is authorized under Executive Order 12862, “Setting Customer Service Standards.” Your response is voluntary and all data collected will be considered confidential. Public reportings for this collection of information is estimated to average 25 minutes per response, including the time of reviewing instructions, searching existing data sources, gathering and maintaining the data needed, and completing and reviewing the collection of information. Send comments regarding this estimate or any other aspects of this collection of information, including suggestions for reducing the length of this questionnaire, to the National Institute of Standards and Technology, 100 Bureau Drive, Stop 3220, Gaithersburg, MD, 20899-3220 and the Office of Management and Budget Information and Regulatory Affairs, Office of Management and Budget, Washington, DC 20503.

A-3
1. Company Identification
Company Name:
Mailing Address:
Contact Name:
Title:
Phone Number:
Is the information in this questionnaire specific to your division, or is it for the entire company?
Division Company
If it is specific to your division, approximately what percentage of your company’s total design work or product exchange is associated with your division? %
All your questionnaire responses are confidential.
2. Product Data Exchange Activity
2.1 In general, how does your firm accomplish product data exchange with customers?
2.2 In general, how does your firm accomplish product data exchange with other suppliers?

A-4
3. Software Systems and Support
This section explores your firm or division’s investments in software systems to support your business relationships with customers and other suppliers.
3.1 CAD/CAM/CAE Systems
If your company maintains multiple software systems (such as Metaphase, UG, CGS, CATIA, Wavefront, Ansys, Tecnomatix/Part, MasterCAM, CIMstation) to exchange product data with customers and/or suppliers, please complete the table below:
CAD/CAM/CAE System Name Number of Licenses
(or Seats) Comments
A-5
3.2 Design Staff
How many CAD users are on staff at your company (or division)?
What percentage of these users use more than one system? %
Of these users, what is the average amount of time they spend using their secondary system? %
3.3 PDM Systems
Does your company have a formal PDM system?
If so, does your company maintain its own PDM systems?
No
On the average, how much time is spent verifying the data accompanying media files and drawings?
hours per designer per month
Yes
If so, are data ever manually reentered from your customer’s system?
No
Don’t know
Yes, requiring about hours per month
4. Data Transfers
Approximately, how many single files does your firm transfer as part of internal and external data exchanges each month? We are interested in exchanges with both customers and suppliers. Your best estimate will suffice.
Translation Method Internally Externally
STEP
IGES
Point-to-Point Translators
Other:
What percentage of STEP translations fail? %

A-6
5. Manual Reentry
If you manually reentered data from one CAD/CAM system to another to exchange product data with OEMs and/or suppliers, please help us calculate the cost of manual re-entry by estimating the
a. Total number of re-entry jobs per years needed to resolve translation problems:
c. Average labor hours per re-entry job: Has STEP reduced the amount of manual re-entries associated with product data exchange? Why or why not?
Yes, by %
No
Don’t know
6. NIST’s Role in the Development of STEP
NIST has been active in the development and promotion of STEP. The following questions are designed to elicit your understanding of the impact of NIST’s activities.
6.1 Are you familiar with the following projects?
AutoSTEP
AeroSTEP
MariSTEP
CAx and PMD Implementor Forums
STEP Certification Services
6.2 Has NIST made contributions to the development of STEP that influenced the timing of your decision to adopt STEP or lowered the cost of adopting STEP?

A-7
7. Comments
Would you like to share other comments about data exchange or your use of STEP?


Appendix B: Software Developer Survey

B-1
Questionnaire: CAD/CAM/CAE/PDM Vendors
Introduction
On behalf of the National Institute of Standards and Technology (NIST), Research Triangle Institute (RTI) is evaluating the potential benefits of STEP in reducing interoperability costs for the exchange of product data. Interoperability problems arise when members of the supply chain create technical data using different design, manufacturing, engineering, or product data management (PDM) software applications. As a member of the industry who produces the software used in the design operations of the industries we are investigating (automobiles, aerospace, shipbuilding), you have unique insights into the state of STEP incorporation in CAD/CAM/CAE or PDM software. The information you provide will help NIST better assess the benefits of STEP and the needs of this portion of the manufacturing sector, thereby allowing NIST to channel future investments towards projects that best meet those needs.
Please answer the questions in the attached questionnaire with reference to your CAD/CAM/CAE or PDM software products. Please feel free to collaborate with your colleagues when answering these questions. The data you provide will only be used in aggregate with other companies and will not be disclosed to third parties.
An RTI staff member will contact you in the next few days to answer any questions you may have. At that time you may respond to the questionnaire over the phone, or alternatively you may complete the questionnaire and fax it to us at (919) 541-6683. If you have any questions prior to the interview, please feel free to contact Mike Gallaher at (919) 541-5935 or Alan O’Connor at (919) 541-7186.
Thank you for participating in this survey.

B-2
OMB NO: 0693-0031 Expires 10/31/2002
This survey is authorized under Executive Order 12862, “Setting Customer Service Standards.” Your response is voluntary and all data collected will be considered confidential. Public reportings for this collection of information is estimated to average 25 minutes per response, including the time of reviewing instructions, searching existing data sources, gathering and maintaining the data needed, and completing and reviewing the collection of information. Send comments regarding this estimate or any other aspects of this collection of information, including suggestions for reducing the length of this questionnaire, to the National Institute of Standards and Technology, 100 Bureau Drive, Stop 3220, Gaithersburg, MD, 20899-3220 and the Office of Management and Budget Information and Regulatory Affairs, Office of Management and Budget, Washington, DC 20503.

B-3
1. Company Identification
Company Name:
Mailing Address:
Contact Name:
Title:
Phone Number:
2. CAD/CAM/CAE or PDM Product information
2.1 Please list your company’s CAD/CAM/CAE or PDM software packages and specialty products below that are used by the transportation equipment industry (automobiles, planes, ships, etc).
2.2 Do the CAD/CAM/CAE or PDM software programs your firm markets offer STEP neutral format functionality?
Yes. In which year did these programs first include STEP? (Continue to Section 3)
No. Do you plan on including STEP in the future? (End survey)

B-4
3. The Cost of Developing STEP Functionality
3.1 Was your company involved in the administrative process to develop the ISO standards for STEP, in developing new technologies and tools, or in supporting demonstrations or certification testing?
Yes. Over what time frame did you participate and what were your approximate annual expenditures in terms of person-months?
Activities
Time Period Involved (example: from 1995
to 2001)
Average Annual Expenditures
(person-months/year)
Standards development process (For example: attended meeting or reviewed draft standards)
Software development tools and testing tools (For example: supported the development of languages or libraries)
Demonstration and certification services (For example: participated in the AutoSTEP project or other implementation forums)
No. Our company was not involved in these activities.
3.2 What was your company’s total expenditures to integrate STEP into your CAD/CAM/CAE or PDM systems? (Choose one)
Dollars
or
Labor (person-months)

B-5
4. NIST’s Activities
NIST has been active in the development and promotion of STEP in several ways:
• participation in the standards development process
• development of software libraries and testing tools
• demonstration of STEP capabilities and provision of certification services
4.1 Are you aware of NIST and its activities in the development of STEP?
Yes No (Skip to end)
4.2 If so, how did you learn about NIST’s contributions? In your view, what are NIST’s most beneficial activities, if any?

B-6
4.3 To the best of your knowledge, which of the NIST contributions listed in the following table had an impact on the development of STEP? Please check in the table below if NIST’s contributions led to
• a broader or more versatile STEP standard (quality improvements),
• acceleration of the development or adoption of STEP, and
• reductions in the cost of developing or adopting STEP.
NIST’s Impacts
Quality
Improvements Acceleration Cost
Reductions
Standards Development
Administrative contributions
EXPRESS (ISO 10303-11)
AP203 (ISO 10303-203)
Mapping Table Generator
PDM schema
Software Development Tools and Testing Tools
NIST EXPRESS Toolkit
STEP Class Library
Expresso
STEP File Checker
STEP Geometry Analyzer
Demonstration and Certification Services
AutoSTEP testing project
CAx and PDM implementor forums
STEP certification services
4.4 Do you think that your company would have implemented STEP in your CAD/CAM/CAE or PDM products at the same time in the absence of NIST’s contributions?
Yes, same time No, approximately _____ years later

B-7
4.5 If you indicated that one or more of NIST’s activities led to cost reductions for your firms, what percentage do you estimate those reductions to be?
Percent
4.6 Has STEP helped your products penetrate foreign markets?
Yes No
5. Comments
5.1 Please provide any additional comments that would help us evaluate the cost of integrating STEP into your CAD/CAM/CAE or PDM software products.
We thank you for your participation.
Please indicate below if you would like to receive a copy of the final report.
Yes, please send a copy No