stereoscopic displays for air traffic control: conflict
TRANSCRIPT

Stereoscopic displays for air traffic control: conflict judgement performance as a function of visualisation, task characteristics and expertise
A. Baier1, A. Zimmer1, C. Vernaleken2 & H. Neujahr2 1Engineering Psychology Unit, University of Regensburg, Germany 2Human-Factors-Engineering Department, Cassidian, Germany
Abstract
Three different stereoscopic 3D visualisations are compared with the 2D display currently used at air traffic control (ATC) controller working positions. Using safety critical air traffic scenarios, air traffic controllers (ATCOs), pilots, and two groups of laypersons, one of which with an appropriate training, are asked to judge safety critical scenarios showing two converging aircraft. To simulate the cognitive demands ATCOs have to face when required to process both visual information of the traffic situation display and auditory information caused by incoming radio messages at the same time, an auditory task is added. Due to the experimental manipulation of visualisation-, task-, and person-related variables, the results allow for an explanation of the inconsistent results that have been reported in studies evaluating the use of 3D for ATC. Analyses reveal that per-formance differences between 2D and 3D depend on both task characteristics and the level of expertise. While the judgement certainty of 2D and 3D is virtu-ally equal in all cases of conflict, the observed differences between the modes of visualisation appear to be due to the dimension on which the aircraft miss each other in case of separation. When judgement certainty is ignored, no noteworthy differences appear. Thus, the results depend on the individual response criterion, because it represents the level of uncertainty the operator is willing to accept. Keywords: air traffic control, conflict detection, false alarm rate, dual task, expertise, 3D display, stereoscopy, judgement certainty, response criterion.
Safety and Security Engineering V 199
www.witpress.com, ISSN 1743-3509 (on-line) WIT Transactions on The Built Environment, Vol 134, © 2013 WIT Press
doi:10.2495/SAFE130191
1 Introduction and theory
Since the late 1980s, numerous studies investigating the suitability and applic-ability of 3D (stereoscopic) displays for ATC controller working positions have been published [1–7, 9, 10]. Often, these are motivated by the expectation of advantages when judging vertical separation with 3D due to its analogous altitude representation. Less frequently investigated, but equally important, are differences between the visualisations regarding their impact on human infor-mation processing. 3D promises a reduction of the operators’ mental workload, because an analogous altitude representation theoretically allows for a visual evaluation of all three dimensions at a glance, causing less interference when in-coming auditory radio messages are to be processed at the same time [8]. By contrast, processing aircraft altitudes displayed alphanumerically alongside the traffic symbol, which is the case with the 2D display, results in an interference with voice communication that reduces the mental resources required for the pre-diction of aircraft separations. This results in a strategy to maintain safety at the cost of efficiency, leading to an increased false alarm rate. However, recent findings demonstrate that especially vertical information processing has to be supported to increase efficiency, since ATCOs experience uncertainty concern-ing vertical separation more frequently than in the horizontal dimension, and often intervene even though vertical distances are four times the permissible safety margin [4].
2 Motivation
Research on the applicability of 3D for ATC to date exhibits multiple inconsist-encies and impedes a clear decision in favour of or against the use of 3D in ATC. So far, only few definite conclusions can be drawn: Due to the graphical inte-gration of all three dimensions, 3D visualisations are better suited than the cur-rent 2D display when a quick overview of a given traffic situation is required. Simultaneously, 3D appears to be disadvantageous with regard to the precise perception and prediction of object positions, since line of sight ambiguities cause uncertainty about object positions. However, several studies report benefits of 2D [9], whereas 3D appears to be advantageous in others [5]. Most studies find no noteworthy performance differences between 2D and 3D [7, 10]. The causes for these inconsistencies, as cited by various researchers, are substantial variations of display characteristics, task parameters, as well as the subjects’ expertise between studies [6]. In this study, we therefore integrate several of these parameters, and aim to shed light on the interdependencies between them.
3 Methods
3.1 Visualisations
We compare four different modes of visualisation with each other - three 3D and a 2D visualisation. The 3D visualisations have been designed based on theo-
200 Safety and Security Engineering V
www.witpress.com, ISSN 1743-3509 (on-line) WIT Transactions on The Built Environment, Vol 134, © 2013 WIT Press

retical considerations concerning benefits and drawbacks for ATC. The 2D visu-alisation represents the display currently used in ATC controller workstations. Figure 1 shows all four modes of visualisation.
Figure 1: Modes of visualisation that are compared with each other [1].
To create comparable conditions, all visualisations contain predictor lines at-tached to the aircraft symbols, indicating the flight direction and speed. Their length is linearly connected to the velocity. Furthermore, labels indicate each object’s altitude and their velocity numerically. Arrows close to the altitude rep-resentation qualitatively indicate altitude changes by pointing up- or downwards. A reference grid with a width of 1.5 NM, drawn on the ground, supports the per-ception of lateral distances. All 3D visualisations use stereoscopy. The partici-pants wear polarized glasses, their position is tracked by an infrared system and the view automatically adapts to their position. With both 2D and 3Ds, the par-ticipants are provided with a vertical top view that promises a more precise per-ception of horizontal distances and convergence angles on the horizontal plane than the 3D bird’s eye perspectives 3DmL and 3DoL since ambiguities along the line of sight are reduced. 3Ds additionally shows the altitude analogously using stereoscopy and drop lines. Due to their bird’s eye perspective of the scenery, 3DmL and 3DoL supposedly amplify the perception of vertical distances. At the same time, line of sight ambiguities are expected to decrease performance with the bird’s eye perspectives when judging horizontal distances. In the case of 3DmL, however, drop lines should reduce the negative effects caused by line of sight ambiguities.
Safety and Security Engineering V 201
www.witpress.com, ISSN 1743-3509 (on-line) WIT Transactions on The Built Environment, Vol 134, © 2013 WIT Press

3.2 Scenarios
To evaluate the visualisations, a representative set of safety critical air traffic scenarios is created, displaying potentially conflicting situations. All situations consist of two aircraft approaching one another with different velocities, reach-ing their closest distance 45s from the start of the scenario. These are displayed for the duration of 10s and then replaced by an entry mask for the subject to pro-vide a judgement. To create a set of different scenarios, vertical speed, lateral convergence angle, and distance at the closest point of approximation are varied. With regard to the vertical speed, either none, one or both of the two objects are climbing or descending. The climb rate is always 1.500 ft/min whereas the de-scent is performed with 500 ft/min. The horizontal convergence angle is either 0°, 90°, or 180° and the closest approximation is set to 0 in the conflict case. To create a separation, either the vertical or the horizontal distance is varied. In the former case, the distance is set to 1000 ft or 2000 ft. A vertical separation there-with appears to be a conflict from a top view perspective. A horizontal separation is created by setting the lateral distance to 3 NM or 6 NM. In these cases, both objects obtain the same altitude after 45s, and therefore appear to be conflicting when viewed from the side. The distinction between conflict, vertical separation, and horizontal separation is referred to as dimension. The variation of the para-meters listed above results in a total of 86 scenarios.
3.3 Situation
In order to enhance realism, additional cognitive workload is introduced by the addition of an auditory task. The test candidates are instructed to conduct both the auditory and the conflict judgement task simultaneously and with the same priority. This creates a situation similar to the one that controllers face in cases where a critical conflict occurs while radio messages are simultaneously being broadcast. The auditory task is based on two different pairs of numbers that have to be memorised before a scenario begins. This simulates the numerical part in aircraft call signs that have to be memorised because they are essential in identi-fying and addressing communication to/from a specific aircraft. While a scenario is presented, one of several sets of numbers previously prepared and stored as an audio file is played, providing a rate of 1.1 numbers per second. Whenever one of the two pairs of initially memorised numbers appears in the presented se-quence, the participant has to affirm this verbally by saying ‘yes’. The amount of positive responses required from the candidate varies between zero and three, allowing the evaluation of his performance on this task. The two situations with and without an additional auditory task are referred to as the high and low work-load condition.
3.4 Subjects
48 subjects participate in the study. They are equally divided into four groups consisting of ATCOs, pilots and two groups of laypersons, one of which receives a specific conflict judgement training to evaluate air traffic situations with two
202 Safety and Security Engineering V
www.witpress.com, ISSN 1743-3509 (on-line) WIT Transactions on The Built Environment, Vol 134, © 2013 WIT Press
aircraft on close approximation. The training is based on the well-documented cognitive strategies controllers use to judge conflicts with the current 2D visuali-sation [4]. This creates an additional group possessing expertise in judging con-flicts like the ATCOs, but lacking both extensive training with this baseline and the cognitive prerequisites for a controller career. Both pilots and untrained lay-persons do not possess extensive training with the baseline nor conducted a spe-cific conflict judgement training, but differ, like ATCOs and trained laypersons, regarding their experience with additional task conditions. Both ATCOs and pilots are experienced in fulfilling concurring tasks simultaneously, whereas lay-persons are not.
3.5 Measures
For data analysis, Receiver Operating Characteristic (ROC) curves based upon conflict judgements on a 6-point-rating-scale are used to analyse both sensitivity (conflict detection rate) and specificity (false alarm rate) as dependent variables. Furthermore, the Area Under the ROC-curve (AUC) is used as a measure that is independent from the individual response criteria. The six categories on which each scenario is judged refer to the expected outcome of the scenario as conflict and are: certainly yes, probably yes, maybe yes, maybe no, probably no, and certainly no. Due to their semantic equidistance, the resulting data is considered as metric. Independent variables are group membership (ATCOs, pilots, trained laypersons, untrained laypersons), visualisation (2D, 3Ds, 3DoL, 3DmL), work-load condition (with and without additional auditory task), and dimension (con-flict, vertical or horizontal separation).
3.6 Procedures
After a short introduction of the experiment, all 86 scenarios are presented using one of the four visualisations, initially without additional auditory task. Both the order of the scenarios and the mode of visualisation are randomised. For each scenario, two judgements are required: one is to measure the certainty of the candidate that a conflict or separation is going to happen, and the other captures how the available time for observing the scenario is perceived. To capture this information, an entry mask is presented after each scenario, allowing candidates to provide their judgements and to start the presentation of the next scenario. After the presentation of all 86 scenarios, another set of 32 scenarios follows, this time exclusively showing cases with a convergence angle of 90°. Further-more, the additional auditory task is presented in this phase while showing the scenarios, allowing for a comparison of the visualisations on the base of highly critical situations in which both task difficulty and cognitive workload is high. The entire procedure is repeated four times in total until all visualisations have been used to judge the scenarios under both workload conditions.
Safety and Security Engineering V 203
www.witpress.com, ISSN 1743-3509 (on-line) WIT Transactions on The Built Environment, Vol 134, © 2013 WIT Press

4 Results
4.1 Conflict detection rate
Assuming that controllers only decide not to intervene when absolutely certain that no conflict will happen, all cases judged with one of the five categories rang-ing from certainly yes to probably no are considered as situations in which the operator would act to mitigate the risk of a collision. Hence, all scenarios show-ing a conflict and assigned to one of these categories are considered as correctly identified conflicts. Conflicts that are classified with certainly no constitute misses. Figure 1 shows the conflict detection rates (number of correctly identi-fied conflicts divided by the total number of displayed conflicts) achieved by ATCOs for each visualisation in the low and high cognitive workload condition.
Figure 2: Conflict detection rates with standard errors of the ATCOs for each visualisation under low and high cognitive workload.
An analysis of variance including the factors visualisation, workload, and group membership indicates a significant difference between the visualisations with regard to conflict detection rate, when the numbers of false alarms is statistically controlled (p=0.022; F(3, 384)=3.244; η2=0.027). Since no significant interactions appear, this difference also applies to the pilots and both groups of laypersons. Though not statistically significant (p=0.06; η2=0.021), the manipulation of cognitive workload results in a remarkable interaction with the visualisations, indicating a higher negative impact of cognitive workload on con-flict detection performance with 2D as with 3D.
4.2 False alarm rate
The false alarm rate is the percentage of separation situations which the operator erroneously treats as conflict. To compare the false alarm rates between the visu-
204 Safety and Security Engineering V
www.witpress.com, ISSN 1743-3509 (on-line) WIT Transactions on The Built Environment, Vol 134, © 2013 WIT Press
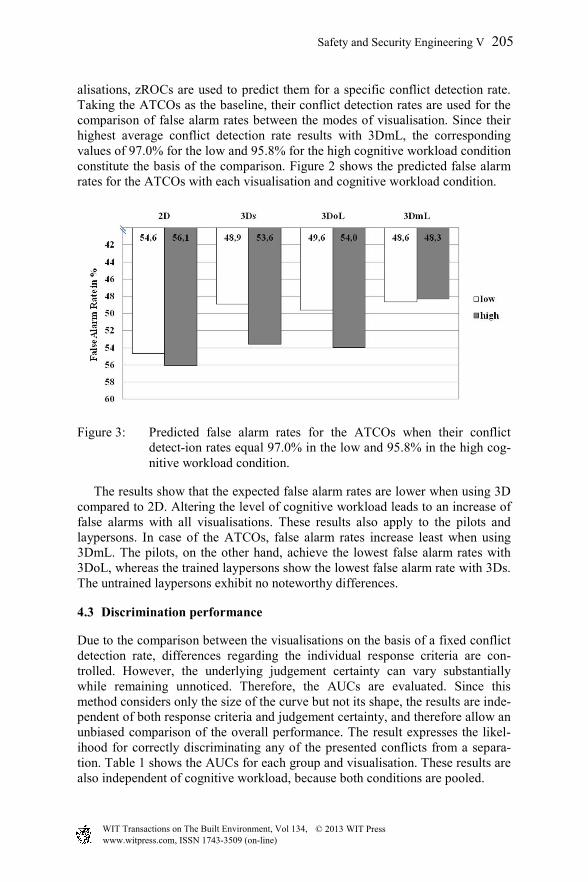
alisations, zROCs are used to predict them for a specific conflict detection rate. Taking the ATCOs as the baseline, their conflict detection rates are used for the comparison of false alarm rates between the modes of visualisation. Since their highest average conflict detection rate results with 3DmL, the corresponding values of 97.0% for the low and 95.8% for the high cognitive workload condition constitute the basis of the comparison. Figure 2 shows the predicted false alarm rates for the ATCOs with each visualisation and cognitive workload condition.
Figure 3: Predicted false alarm rates for the ATCOs when their conflict detect-ion rates equal 97.0% in the low and 95.8% in the high cog-nitive workload condition.
The results show that the expected false alarm rates are lower when using 3D compared to 2D. Altering the level of cognitive workload leads to an increase of false alarms with all visualisations. These results also apply to the pilots and laypersons. In case of the ATCOs, false alarm rates increase least when using 3DmL. The pilots, on the other hand, achieve the lowest false alarm rates with 3DoL, whereas the trained laypersons show the lowest false alarm rate with 3Ds. The untrained laypersons exhibit no noteworthy differences.
4.3 Discrimination performance
Due to the comparison between the visualisations on the basis of a fixed conflict detection rate, differences regarding the individual response criteria are con-trolled. However, the underlying judgement certainty can vary substantially while remaining unnoticed. Therefore, the AUCs are evaluated. Since this method considers only the size of the curve but not its shape, the results are inde-pendent of both response criteria and judgement certainty, and therefore allow an unbiased comparison of the overall performance. The result expresses the likel-ihood for correctly discriminating any of the presented conflicts from a separa-tion. Table 1 shows the AUCs for each group and visualisation. These results are also independent of cognitive workload, because both conditions are pooled.
Safety and Security Engineering V 205
www.witpress.com, ISSN 1743-3509 (on-line) WIT Transactions on The Built Environment, Vol 134, © 2013 WIT Press
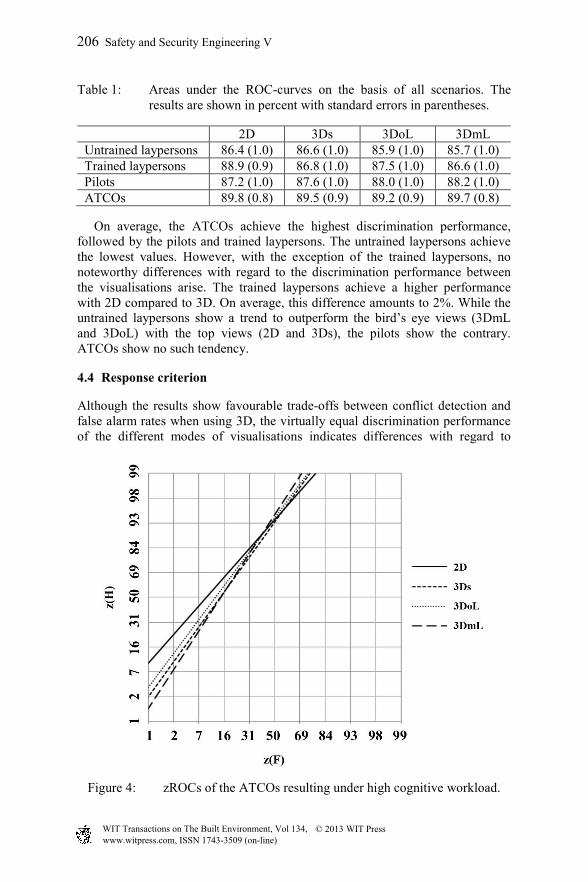
Table 1: Areas under the ROC-curves on the basis of all scenarios. The results are shown in percent with standard errors in parentheses.
2D 3Ds 3DoL 3DmL Untrained laypersons 86.4 (1.0) 86.6 (1.0) 85.9 (1.0) 85.7 (1.0) Trained laypersons 88.9 (0.9) 86.8 (1.0) 87.5 (1.0) 86.6 (1.0) Pilots 87.2 (1.0) 87.6 (1.0) 88.0 (1.0) 88.2 (1.0) ATCOs 89.8 (0.8) 89.5 (0.9) 89.2 (0.9) 89.7 (0.8)
On average, the ATCOs achieve the highest discrimination performance, followed by the pilots and trained laypersons. The untrained laypersons achieve the lowest values. However, with the exception of the trained laypersons, no noteworthy differences with regard to the discrimination performance between the visualisations arise. The trained laypersons achieve a higher performance with 2D compared to 3D. On average, this difference amounts to 2%. While the untrained laypersons show a trend to outperform the bird’s eye views (3DmL and 3DoL) with the top views (2D and 3Ds), the pilots show the contrary. ATCOs show no such tendency.
4.4 Response criterion
Although the results show favourable trade-offs between conflict detection and false alarm rates when using 3D, the virtually equal discrimination performance of the different modes of visualisations indicates differences with regard to
Figure 4: zROCs of the ATCOs resulting under high cognitive workload.
206 Safety and Security Engineering V
www.witpress.com, ISSN 1743-3509 (on-line) WIT Transactions on The Built Environment, Vol 134, © 2013 WIT Press

judgement certainty. The rationale for this conclusion lies in the way in which the ROC-curves are created. A rating scale that captures operators’ judgement certainty forms the basis of each ROC-curve. Thereby, an increasing conflict de-tection rate is not only accompanied by an altered false alarm rate, but also by a reduced judgement certainty. Equal AUCs but different proportions between conflict detection and false alarm rates signify diverging zROC-slopes. Figure 4 illustrates this issue, and shows the zROCs of the ATCOs on the basis of their results achieved under high cognitive workload. The different slopes of the ATCOs’ zROCs for the different visualisations indicate that performance differences do not only depend on the visualisation, but also on the response criterion. Two examples illustrate this: Given false alarms are to be minimized by instructing the operator to only judge a scenario as being a conflict when he is highly certain about its outcome, 2D leads to a higher performance than 3D. On the other hand, maximising the conflict de-tection rate by instructing the operator to judge every scenario as a conflict that cannot for certain be classified as separation results in 3D outperforming 2D. Whereas the instruction in the former example reinforces the operator to adopt a conservative response criterion, the latter facilitates a liberal response behaviour. To understand the meaning of different zROC-slopes, a brief explanation of the underlying processes shall be given: A unit slope indicates that for both conflicts and separations, the standard deviations of the underlying distributions resulting from the conflict and separation ratings equal each other. In our case, a unit slope signifies that the ratings for both conflicts and separations vary equally. Conse-quently, slopes greater than one indicate smaller variations of the conflict ratings, since moving one standard deviation on the z(H)-axis produces a change of less than one standard deviation on the z(F)-axis. Table 2 shows the slopes of the zROCs of each group and visualisation under both workload conditions.
Table 2: Slopes of the zROCs in the low and high cognitive workload condition.
2D 3Ds 3DoL 3DmL Untrained laypersons 1.5/1.2 1.7/1.2 1.7/1.5 1.6/1.3 Trained laypersons 1.4/1.4 1.7/1.8 1.4/1.5 1.6/1.4 Pilots 1.4/1.4 1.2/1.1 2.7*/2.8* 1.4/1.4 ATCOs 1.0/1.1 1.4/1.4 1.6/1.4 1.3/1.6
* Due to comparatively low regression fit (R2 < 0.7), the interpretability of the results may be limited The zROC-slopes indicate that the separation judgements generally vary more widely than the conflict judgements. In the case of ATCOs, however, only the use of 3D results in a wider variation of separation judgements, which is not the case with 2D. With the latter, their responses to both conflicts and separations show equal variation. The pilots, on the other hand, achieve minimum variations with 3Ds, whereas the trained laypersons the broadest. The untrained laypersons show the fewest differences between the modes of visualisation. Conflict and
Safety and Security Engineering V 207
www.witpress.com, ISSN 1743-3509 (on-line) WIT Transactions on The Built Environment, Vol 134, © 2013 WIT Press

separation judgements made by laypersons generally vary more widely than those made by the ATCOs and pilots. 3DoL causes the greatest overall differ-ence.
4.5 Judgement certainty and line of sight ambiguity
Since, with exception of the dimension, all parameters that define a scenario have been equally manipulated to create both conflicts and separations, the non-unit zROC-slopes indicate that the variation of the dimension impacts on judge-ment certainty. ROC-analysis cannot be used to analyse judgement differences between different dimensions, because it depends on the inclusion of both con-flicts and separations. Instead, a measure is created that allows reporting the judgement certainty for each dimension separately with a value between 0 and 1 by assigning specific values to the six response categories. In the case of a con-flict, the value 0 represents the category certainly no, and the value 1 the cate-gory certainly yes, whereas separations receive the value 0 for the category certainly yes, and the value 1 for certainly no. The values 0.2, 0.4, 0.6, and 0.8 are assigned to the categories probably and maybe respectively. Based on these converted judgements, an analysis of variance is conducted. The zROC-slopes vary between the four groups and modes of visualisations, as well as between the two cognitive workload conditions. This being the case, the factors dimension, cognitive workload, mode of visualisation, and group membership are included in the analysis. Because of the comparability of the two cognitive workload con-ditions and the clear distinction between the three dimensions, only the
Figure 5: Judgement certainty differences of the ATCOs under high cognitive workload. The values that result with 2D have been adjusted to zero.
208 Safety and Security Engineering V
www.witpress.com, ISSN 1743-3509 (on-line) WIT Transactions on The Built Environment, Vol 134, © 2013 WIT Press
judgements for scenarios with rectangular convergence angles are considered. The results show a significant interaction between the factors mode of visualisat-ion and dimension (p=0.025; F(6, 43)=2.453; η2=0.054), pointing out that differ-ences with regard to judgement certainty exist between the visualisations, and that they are independent of cognitive workload and group membership. To illus-trate the interaction effect, Figure 4 illustrates the judgement certainty of the ATCOs in the high cognitive workload condition. The values that result with 2D have been adjusted to zero to serve as a baseline and facilitate the comparison. While no noteworthy differences with regard to judgement certainty appear between the modes of visualisation in the case of conflicts, the use of 3D with drop lines (3DmL) leads to a higher judgement certainty than 2D. However this advantage disappears without drop lines. In cases of horizontal separations, 2D results in a higher judgement certainty than any 3D visualisation. To understand these findings, the characteristics of separations and conflicts have to be con-sidered: Conflicts can be excluded by assessing vertical information only. 3D visualisations facilitate vertical separation judgements due to their additional analogous altitude representations. In the case of horizontal separations, 2D is considered to be advantageous, because the exclusion of a conflict solely re-quires the evaluation of lateral information, which, in contrast to the stereoscopic 3D visualisations, is displayed orthoscopic and without optical distortions. The line-of-sight ambiguities inherent to every perspective visualisation aggravate the exclusion of a conflict with 3D. In contrast to the separations, both the hori-zontal and the vertical dimension have to be assessed to exclude a separation when the scenario shows a conflict. The advantages of the analogous altitude re-presentation are counterbalanced by the line of sight ambiguities.
5 Conclusions and discussions
The results show that stereoscopic 3D visualisations can indeed be beneficial for ATC, since they allow for higher overall conflict detection rates and fewer false alarms. The fact that these advantages over 2D become particularly apparent in situations with high cognitive workload, further emphasises their potential for ATC. Also the gain in vertical distance judgment makes 3D an ATC candidate for the future, specifically for airport areas, where approach and departure areas are characterised by a high number of vertical movements. Nevertheless, a series of constraints, given by the experimental character-istics, apply. The scenarios always involved only two aircraft. However, when multiple objects have to be presented, the use of drop lines could cause display clutter and occlusions which might become an issue in an ATC environment. This could prove critical particularly in areas around airports, characterised by their high traffic loads. In these cases, the elevation angle may gain a higher im-portance than in our scenarios, and the top view could outperform the bird’s eye view, because drop lines are shorter from this view-point and occlusions of objects by drop lines are less likely. Furthermore, our results are limited to ste-reoscopic displays with a motion tracking system, permitting only one person to observe the scenery from the correct position. Since today ATCOs often work in
Safety and Security Engineering V 209
www.witpress.com, ISSN 1743-3509 (on-line) WIT Transactions on The Built Environment, Vol 134, © 2013 WIT Press
a team of two operators, this can constrain the use of 3D for ATC. Its use for specific applications, such as to switch the mode of visualisation to facilitate the evaluation of a safety critical scenario, however, seems to be beneficial. Hence, these results indicate that further studies are required to determine the best implementation of 3D to support specific tasks. Since we found our results to be dependent on the operators’ willingness to accept uncertainty when differ-entiating between conflict and separation, we recommend not only to distinguish between correct and incorrect judgments when comparing different visualisa-tions. In addition, the underlying certainty should be measured and the operator instructions should be carefully designed. This is especially important when ATCOs participate in the experiment, since they consistently exhibit a higher degree of uncertainty with 3D compared to 2D when judging specific types of scenarios. Furthermore, we demonstrated that performance differences between 2D and 3D depend on the dimension in which the objects miss each other. While conflicts resulted in similar judgement certainty, 3D, as expected, showed advan-tages for vertical distance judgements while 2D proved to be beneficial for the evaluation of horizontal distances. Thus, the dimension that has to be evaluated to predict the outcome of a situation should be considered when comparing 2D and 3D. Last but not least, we found the mode of visualisation to impact on the results. While the absence of significant differences between both 3D visualisa-tions with drop lines (3Ds and 3DmL) demonstrates that the elevation angle of the perspective does not play a major role, the differences between those two modes of visualisation and the bird’s eye perspective without drop lines (3DoL) highlight the advantage of drop lines for vertical separation judgement, and dem-onstrates the relevance of investigating the impacts of graphical aids on the oper-ators’ performance.
References
[1] Baier, A. (2013). Stereoskopische 3D Anzeigen für die Flugsicherung. Regensburg, Germany: Universität Regensburg.
[2] Brown, M. A. and Slater, M. (1997). Some Experiences with Three-Dimensional Display Design: An Air Traffic Control Visualisation. Proceedings of 6th IEEE International Workshop on Robot and Human Communication RO-MAN ‘97, 296-301.
[3] Brown, M. A. (1994). Displays for Air Traffic Control: 2D, 3D and VR – A Preliminary Investigation. London: QMW Computer Science Technical Report No. 675.
[4] Loft, S., Bolland, S., Humphreys, M. S. and Neal, A. (2009). A Theory and Model of Conflict Detection in Air Traffic Control: Incorporating Environmental Constraints. In: Journal of Experimental Psychology: Applied, 15 (2), 106-124.
[5] Sollenberger, R. L. and Milgram, P. (1993). Effects of Stereoscopic and Rotational Displays in a Three-Dimensional Path-Tracing Task. In: Human Factors, 35 (3), 483-499.
210 Safety and Security Engineering V
www.witpress.com, ISSN 1743-3509 (on-line) WIT Transactions on The Built Environment, Vol 134, © 2013 WIT Press

[6] St. John, M., Cowen, M. B., Smallman, H. S., and Oonk, H. M. (2001). The Use of 2D and 3D Displays for Shape-Understanding versus Relative-Position Tasks. In: Human Factors, 43 (1), 79-98.
[7] Van Orden, K. F., and Broyles, J. W. (2000). Visuospatial task performance as a function of two- and three-dimensional display representation techniques. In: Displays, 12, 17-24.
[8] Wickens, C. D. and Hollands, J. G. (1999). Engineering Psychology and Human Performance (3rd ed.). NJ: Prentice Hall.
[9] Wickens, C. D. (1995). Display Integration of Air Traffic Control Infor-mation: 3D Displays and Proximity Compatibility. University of Illinois at Urbana Champaign, Savoy, IL, USA: Final Technical Report.
[10] Wickens, C. D., Todd, S., and Seidler, K. (1989). Three-dimensional displays: Perception, implementation and applications. Technical Report ARL-89-11/CSERIAC-89-1). Savoy, IL, USA: University of Illinois, Institute of Aviation.
Safety and Security Engineering V 211
www.witpress.com, ISSN 1743-3509 (on-line) WIT Transactions on The Built Environment, Vol 134, © 2013 WIT Press