strategic analysis and valuation of scandinavian airlines
TRANSCRIPT
Master of Science in Economics and Business Administration
Accounting, Strategy and Control (ASC)
Strategic Analysis and Valuation of Scandinavian Airlines - A company in financial turmoil
Master’s Thesis
11 September 2013
Mikkel Allen Kjærsgaard
Supervisor: External Associate Professor Daniel Probst 80 pages and 183.561 characters
Copenhagen Business School 2013

2
3
Executive Summary
The central objective of the thesis has been to determine which models were most suitable in order to
carry out a valuation of Scandinavian Airlines (SAS) as per 1 May 2013. The decision of which model is the
most optimal to apply, does among other things depend on, whether SAS is assumed to continue as going
concern or not - which have been analyzed thoroughly.
Before being able to conduct the valuation, a strategic and financial analysis was conducted, in order to
understand the historical performance, and to estimate future financial performance of SAS, which
obviously lays the foundation for the value creation in a company.
Through the strategic analysis it has been concluded that the airline industry is characterized by high
competition among the different operators. Specifically after the 00’s with the IPO of Norwegian in 2003,
SAS has experienced an increasingly competition, which have resulted in a loss of market share of 7
percentage points from 2008 to 2012. This negative trend is assumed to continue in the realistic scenario,
unless something dramatic happens in SAS.
Among the important initiatives that SAS has in their strategy, is to decrease the level of unit costs. These
are of big importance in the industry, as they decide the competitiveness of the company, in terms of e.g.
offering cheap tickets to passengers. Unfortunately SAS has the highest unit costs in their peer group, 47 %
higher than Norwegian, its biggest competitor.
As of 1 November 2013, SAS has to adapt to new changes to IAS 19, regarding actuarial losses/gains from
future discounted pension obligations. This will cause a loss of SEK 7.9 billion on shareholders’ equity from
next year, which corresponds to a loss of 70.1% of SAS’s equity. As a consequence SAS will likely be forced
to raise additional capital – which may be a difficult task after having asked investors for additional capital
in both 2009 and 2010.
After defining three different scenarios for SAS’s future performance, the share price was determined. The
optimistic and realistic scenarios were based on going concern and were valued by applying the DCF model.
The worst case scenario was liquidation, which was supported by Altman’s Z-score, indicating a high
probability of default within the next 12 months. Also credit default swaps with different maturities
indicated high probability of default. The price was determined to SEK 11.26 against a price of SEK 12.10
observed in the market.
In order to test the valuation methods, a sensitivity analysis was carried out. It clearly indicated that the
share price is very sensitive to the different input factors, such as changes in the assumptions to the
development in e.g. payroll expenses, different levels of the growth rate in the terminal period and the
WACC. Hence, the valuation should be evaluated with prudence.
In order for SAS to continue as going concern, management has, as a minimum, to succeed with the current
strategy, otherwise liquidation may be just around the corner, and the company which we have all known
for years, will suddenly belong to the past.
4
Table of content
Part 1: Introduction .................................................................................................................................... 7
1.1 Motivation ......................................................................................................................................... 7
1.2 Problem statement ........................................................................................................................... 8
1.3 Methodology ..................................................................................................................................... 8
1.3.1 Delimitation ............................................................................................................................... 8
1.3.2 Research approach and quality evaluation ................................................................................ 9
1.3.3 Structure of project .................................................................................................................... 9
1.3.4 Discussion of main theories ..................................................................................................... 11
Part 2: Presentation of SAS ...................................................................................................................... 13
2.1 History ............................................................................................................................................. 13
2.2 Strategy ........................................................................................................................................... 14
2.3 SAS’s markets .................................................................................................................................. 15
2.4 Management, ownership and operational structure ..................................................................... 16
2.5 Peer group ....................................................................................................................................... 17
2.5.1 Norwegian Air Shuttle .............................................................................................................. 17
2.5.2 Ryanair ..................................................................................................................................... 18
2.5.3 Finnair ...................................................................................................................................... 18
Part 3: Strategic analysis .......................................................................................................................... 20
3.1. Analysis of the macro environment ............................................................................................... 20
3.1.1 Political factors ......................................................................................................................... 20
3.1.2 Economic factors ...................................................................................................................... 22
3.1.3 Social factors ............................................................................................................................ 26
3.1.4 Technical factors ...................................................................................................................... 27
3.1.5. Conclusion of PEST analysis .................................................................................................... 28
3.2 Analysis of the industry ................................................................................................................... 29
3.2.1 Threat of new entrants ............................................................................................................ 29
3.2.2 Threat of substitute products or services ................................................................................ 30
3.2.3 Buyers bargaining power ......................................................................................................... 32
3.2.4 Suppliers bargaining power ..................................................................................................... 32
3.2.5 The competition in the industry .............................................................................................. 34
3.2.6 Conclusion of the industry analysis .......................................................................................... 36
3.3 Internal analysis of SAS ................................................................................................................... 37
3.3.1 Unit costs.................................................................................................................................. 37
3.3.2 Payroll expenses ....................................................................................................................... 39
3.3.3 Yield and load factor ................................................................................................................ 40
5
3.3.4 Optimal business model ........................................................................................................... 41
3.3.5 Conclusion of internal analysis................................................................................................. 45
3.4 SWOT analysis ................................................................................................................................. 45
Part 4: Financial Statement Analysis ....................................................................................................... 47
4.1. Accounting policies ........................................................................................................................ 47
4.2. SAS’s new calendar year – due to IAS 19? ..................................................................................... 47
4.3 Preparing analytical income statement .......................................................................................... 49
4.4 Preparing analytical balance sheet ................................................................................................. 51
4.5 Profitability measures ..................................................................................................................... 53
4.5.1 Return on invested capital ....................................................................................................... 53
4.5.2 Profit margin and turnover rate ............................................................................................... 53
4.5.2 Return on equity ...................................................................................................................... 55
4.6 Analysis of other key figures ........................................................................................................... 56
4.7 Conclusion of financial statement analysis ..................................................................................... 57
Part 5: Budgeting ...................................................................................................................................... 58
5.1 Realistic scenario ............................................................................................................................. 58
5.1.1 Revenue ................................................................................................................................... 58
5.1.2 Payroll expenses ....................................................................................................................... 60
5.1.3 Jet-fuel expenses ...................................................................................................................... 60
5.1.4 Other operating expenses ........................................................................................................ 61
5.1.5 Depreciation, amortization and impairment (DAI) .................................................................. 61
5.1.6 Net working capital .................................................................................................................. 62
5.1.7 Net investments ....................................................................................................................... 62
5.2 Optimistic scenario ......................................................................................................................... 62
5.3 Non-going concern scenario - liquidation ....................................................................................... 63
Part 6: Cost of capital & Valuation .......................................................................................................... 65
6.1 Required rate of return on equity ................................................................................................... 65
6.1.1 Risk free interest rate ............................................................................................................... 65
6.1.2 Systematic risk – Beta .............................................................................................................. 66
6.1.3 Market risk premium ............................................................................................................... 67
6.1.4 Calculating required rate of return on equity .......................................................................... 68
6.2 Cost of debt ..................................................................................................................................... 68
6.3 Capital structure .............................................................................................................................. 69
6.4 Weighted Average Cost of Capital (WACC) ..................................................................................... 70
6.5 Valuation ......................................................................................................................................... 70
6.6 The relative valuation approach ..................................................................................................... 71
6
6.6.1 EV/EBITDA ................................................................................................................................ 72
6.6.2 EV/SALES .................................................................................................................................. 72
6.7 Sensitivity analysis .......................................................................................................................... 73
Part 7: Conclusion ..................................................................................................................................... 75
7.1 Conclusion ....................................................................................................................................... 75
7.2 The future of SAS ............................................................................................................................ 76
Bibliography .............................................................................................................................................. 77
Appendix ................................................................................................................................................... 81
7
Part 1: Introduction
1.1 Motivation
Scandinavian Airlines (SAS) has in many years been a very respected and prestigious company. Prior to the
beginning of the 1990s, where EU initiated their deregulation of the aviation industry, SAS benefited from
the monopolistic conditions in Scandinavia, where they had monopoly on different very profitable routes,
which meant poor competition and consequently higher prices and no focus on the cost side (Horn &
Willumsen, 2006)
The growing competition in the industry with low cost carriers (LCC), such as Norwegian, entering the
market, let SAS to losses of market shares and forced SAS into implementing different cost savings
programs such as Turnaround 2005, Profit 08, Strategy 2011, 4Excellence and the latest 4Excellence New
Generation (4XNG), which all have had the purpose of restructuring SAS into being less cost-intensive and
to focus on key competencies, which means divesting areas that is not considered as so. 4XNG is expected
to have an impact of SEK 5.2 billion of which SEK 2.6 million is expected to come from divesting SAS Ground
Handling and the aviation company Widerøe (Annual Report (AR) 2012, p. 9).
On top of this the financial crisis, which stroke Europe in 2008, has impacted the business traveler segment
- a key segment to SAS - and consequently affected SAS negatively. As SAS has a reputation of very high
fixed costs in terms of e.g. payroll expenses, the crisis hit SAS very hard relatively to its peers. This is one of
the reasons that SAS was very aggressive in their collective bargaining in November 2012, where SAS got
through with savings on wages and salaries equal to one monthly salary per year for pilots and half a month
per year for the cabin crew. Despite this, SAS still suffers from very high unit costs compared to its peers.
The financial markets have also reacted to SAS’s financial problems. In February 2012 Standard & Poor’s
(S&P), downgraded SAS from B- to CCC+, which both are “non-investment” grades, meaning that investing
in SAS is regarded as a speculative investment (AR 2012, p. 27).
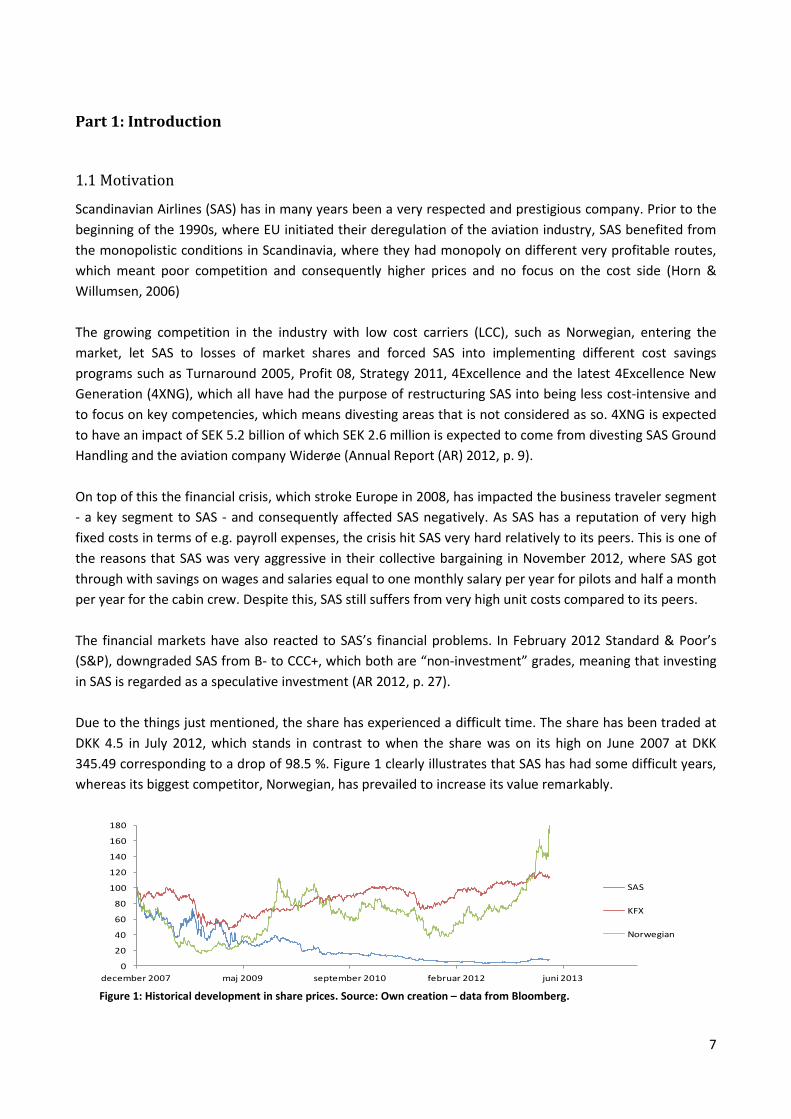
Due to the things just mentioned, the share has experienced a difficult time. The share has been traded at
DKK 4.5 in July 2012, which stands in contrast to when the share was on its high on June 2007 at DKK
345.49 corresponding to a drop of 98.5 %. Figure 1 clearly illustrates that SAS has had some difficult years,
whereas its biggest competitor, Norwegian, has prevailed to increase its value remarkably.
Figure 1: Historical development in share prices. Source: Own creation – data from Bloomberg.
0
20
40
60
80
100
120
140
160
180
december 2007 maj 2009 september 2010 februar 2012 juni 2013
SAS
KFX
Norwegian
8
Based on the critical situation SAS finds itself in, it isinteresting to look at how SAS will perform in the
future. Will the cost saving programs, which have been characterizing SAS in the last couple of years, be
enough to ensure black numbers on the bottom line and thereby make sure that SAS will continue as a
going concern? Or will SAS be forced to enter into a liquidation process?
1.2 Problem statement
The main objective of this thesis is to give an investor a better basis for decision making in regard to
whether he should be buying or selling shares in SAS. As stated in section 1.1, SAS has been challenged
financially due to excessively high unit costs and by the increasing competition from LCC’s. Therefore this
project will focus on answering the following main question:
1. With the current crisis in SAS, what methods and models will be suitable in order to carry out a valuation
– both if considered as a going concern and if liquidated - and what factors should be taken into account
when conducting the valuation?
In order to answer the above mentioned question, SAS will be investigated and analyzed based on different
methods and models. In this process towards the valuation the following secondary questions will be
answered:
1. What is SAS’s strategy, and what is the estimated impact on the performance?
2. How is SAS’s position compared to its peers?
3. What market and industry factors affect SAS’s important value and cost drivers?
4. What has the level and trend in key financial value and cost drivers been historically?
5. What is a realistic budget for SAS?
6. What is an appropriate risk profile for SAS and the corresponding WACC?
7. Should SAS be trading at a premium or discount relatively to its peers?
8. What is the estimated value of SAS applying different models such as DCF, liquidation model and
multiples?
1.3 Methodology
1.3.1 Delimitation
In this thesis it is assumed that the reader has a general economic understanding and consequently has a
basic knowledge of the different theories and models within valuation, accordingly there will not be carried
out a separate presentation of theories and models. However there will be a discussion of the main
theories and models applied in this report, as the ones applied are not indisputable albeit applied by the
majority of the M&A and share analysts.
The thesis will exclude the possibility of trying to get hands on primary data, e.g. by directly contacting the
company. Consequently only secondary public available information will be applied in pursuing a fair value
of the company. This has been decided, as investors normally do not have the possibility of contacting the
9
management of the company they consider to invest in, and thereby only uses information available in the
markets as basis for their investment decisions.
In terms of analyzing the performance of SAS historically, it is estimated that going back five years is
sufficient, as this is the consensus among analysts. This means that the historic performance by SAS, which
will also be part of the basis for the budget, will be analyzed back from 2008 and up until today.
The period of the budget period will be limited to five years, meaning going to and including 2017 from
which the terminal period will be growing with a constant growth rate. The reason that there will not be
budgeted further than five years, is due to the risk associated with it, in terms of unpredictability of the
factors that influence the earnings in SAS.
The cut-off date for including new information and consequently the date of valuation will be set at 1 May
2013.
1.3.2 Research approach and quality evaluation
The research approach will take its starting point in the deductive approach, meaning that well-known
theories and models will be applied on the collected empirical data. This is in contrast to the inductive
method, which starts by collecting empirical knowledge and then from that deduces new theories and
models.
The data used in the project will be qualitative as well as quantitative data. The data will be coming from
annual reports, press releases, newspapers etc. but also from financial data providers such as Bloomberg,
which provides lots of reliable and valid up-to-date financial data. Furthermore organizations such as
International Air Transportation Association (IATA), which provides publications on market developments
and outlooks such as traffic forecasts, will be consulted during the writing of this project.
It is, of course, very important to check the sources, reliability and validity of the empirical data in order not
to get any wrong data but also to leave out subjectivity from the date being used. When conducting a
valuation, as with any other types of projects, it is important to be aware that different stakeholders have
different agendas. SAS do, ceteris paribus, have an interest in presenting the company as being as healthy
and strong as possible, and will of course do that within the legal boundaries. Therefore it is the author of
this project’s job to go beyond these potential “beautifications” and create the most realistic picture of the
company as possible.
1.3.3 Structure of project
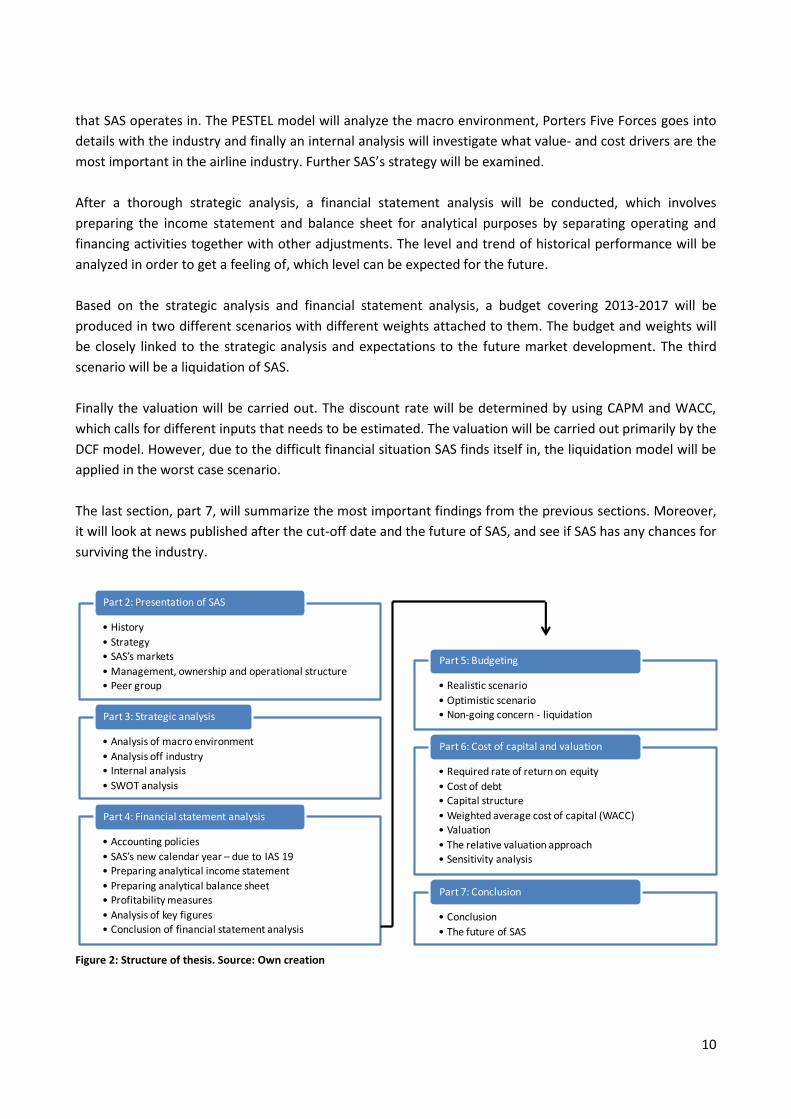
The thesis takes its form as a classical fundamental analysis, hence a strategic analysis together with a
financial statement analysis constitute the inputs to the budget and valuation models.
Figure 2 gives an overview of how the valuation will be approached. After the introduction and
presentation of SAS, it starts out by conducting a strategic analysis, which will be analyzing the environment
10
that SAS operates in. The PESTEL model will analyze the macro environment, Porters Five Forces goes into
details with the industry and finally an internal analysis will investigate what value- and cost drivers are the
most important in the airline industry. Further SAS’s strategy will be examined.
After a thorough strategic analysis, a financial statement analysis will be conducted, which involves
preparing the income statement and balance sheet for analytical purposes by separating operating and
financing activities together with other adjustments. The level and trend of historical performance will be
analyzed in order to get a feeling of, which level can be expected for the future.
Based on the strategic analysis and financial statement analysis, a budget covering 2013-2017 will be
produced in two different scenarios with different weights attached to them. The budget and weights will
be closely linked to the strategic analysis and expectations to the future market development. The third
scenario will be a liquidation of SAS.
Finally the valuation will be carried out. The discount rate will be determined by using CAPM and WACC,
which calls for different inputs that needs to be estimated. The valuation will be carried out primarily by the
DCF model. However, due to the difficult financial situation SAS finds itself in, the liquidation model will be
applied in the worst case scenario.
The last section, part 7, will summarize the most important findings from the previous sections. Moreover,
it will look at news published after the cut-off date and the future of SAS, and see if SAS has any chances for
surviving the industry.
Figure 2: Structure of thesis. Source: Own creation
• History
• Strategy
• SAS’s markets
• Management, ownership and operational structure• Peer group
Part 2: Presentation of SAS
• Analysis of macro environment
• Analysis off industry
• Internal analysis
• SWOT analysis
Part 3: Strategic analysis
• Accounting policies
• SAS’s new calendar year – due to IAS 19• Preparing analytical income statement
• Preparing analytical balance sheet• Profitability measures
• Analysis of key figures• Conclusion of financial statement analysis
Part 4: Financial statement analysis
• Realistic scenario
• Optimistic scenario• Non-going concern - liquidation
Part 5: Budgeting
• Required rate of return on equity
• Cost of debt• Capital structure
• Weighted average cost of capital (WACC)
• Valuation
• The relative valuation approach• Sensitivity analysis
Part 6: Cost of capital and valuation
• Conclusion
• The future of SAS
Part 7: Conclusion
11
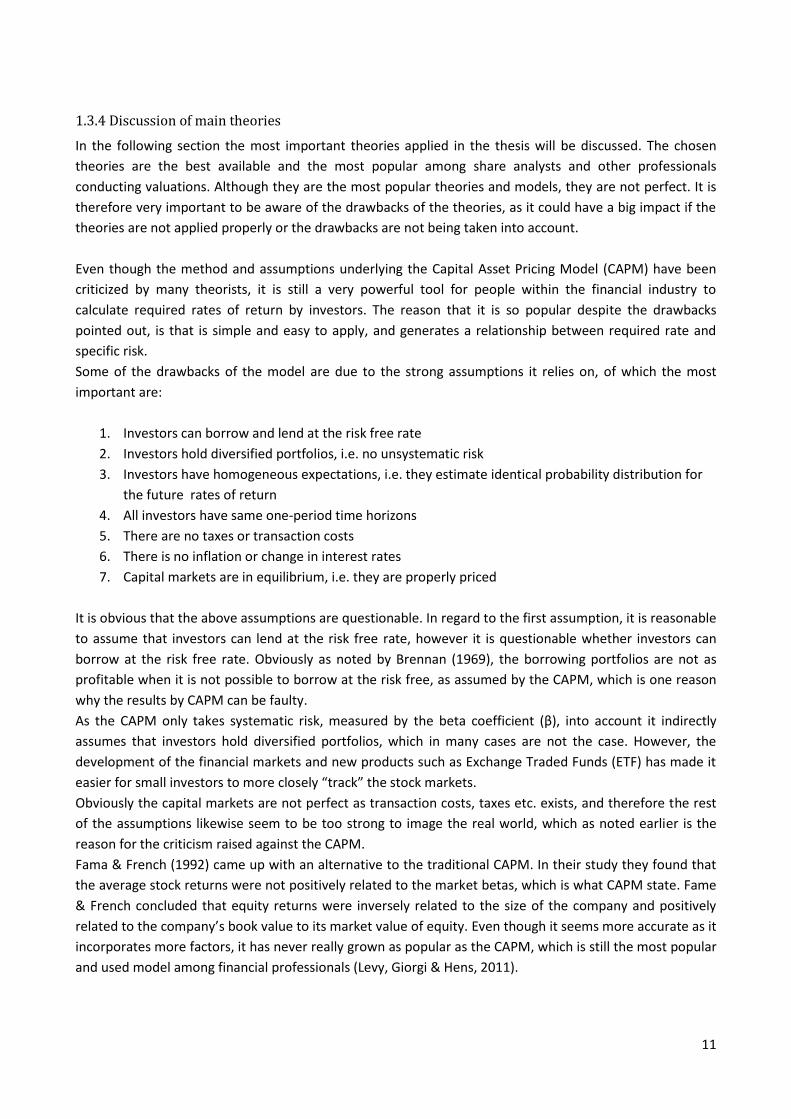
1.3.4 Discussion of main theories
In the following section the most important theories applied in the thesis will be discussed. The chosen
theories are the best available and the most popular among share analysts and other professionals
conducting valuations. Although they are the most popular theories and models, they are not perfect. It is
therefore very important to be aware of the drawbacks of the theories, as it could have a big impact if the
theories are not applied properly or the drawbacks are not being taken into account.
Even though the method and assumptions underlying the Capital Asset Pricing Model (CAPM) have been
criticized by many theorists, it is still a very powerful tool for people within the financial industry to
calculate required rates of return by investors. The reason that it is so popular despite the drawbacks
pointed out, is that is simple and easy to apply, and generates a relationship between required rate and
specific risk.
Some of the drawbacks of the model are due to the strong assumptions it relies on, of which the most
important are:
1. Investors can borrow and lend at the risk free rate
2. Investors hold diversified portfolios, i.e. no unsystematic risk
3. Investors have homogeneous expectations, i.e. they estimate identical probability distribution for
the future rates of return
4. All investors have same one-period time horizons
5. There are no taxes or transaction costs
6. There is no inflation or change in interest rates
7. Capital markets are in equilibrium, i.e. they are properly priced
It is obvious that the above assumptions are questionable. In regard to the first assumption, it is reasonable
to assume that investors can lend at the risk free rate, however it is questionable whether investors can
borrow at the risk free rate. Obviously as noted by Brennan (1969), the borrowing portfolios are not as
profitable when it is not possible to borrow at the risk free, as assumed by the CAPM, which is one reason
why the results by CAPM can be faulty.
As the CAPM only takes systematic risk, measured by the beta coefficient (β), into account it indirectly
assumes that investors hold diversified portfolios, which in many cases are not the case. However, the
development of the financial markets and new products such as Exchange Traded Funds (ETF) has made it
easier for small investors to more closely “track” the stock markets.
Obviously the capital markets are not perfect as transaction costs, taxes etc. exists, and therefore the rest
of the assumptions likewise seem to be too strong to image the real world, which as noted earlier is the
reason for the criticism raised against the CAPM.
Fama & French (1992) came up with an alternative to the traditional CAPM. In their study they found that
the average stock returns were not positively related to the market betas, which is what CAPM state. Fame
& French concluded that equity returns were inversely related to the size of the company and positively
related to the company’s book value to its market value of equity. Even though it seems more accurate as it
incorporates more factors, it has never really grown as popular as the CAPM, which is still the most popular
and used model among financial professionals (Levy, Giorgi & Hens, 2011).
12
Determining the discount rate not only involves the CAPM – it only determines the required rate of return.
After having found the required rate of return, the Weighted Average Cost of Capital (WACC) needs to be
determined, which is the return that providers of the company´s capital require. WACC can be used as a
hurdle rate for investment decisions but also act as a measure to be minimized, in order to find the optimal
capital structure for the company.
WACC has been criticized for being too static in regard to the capital structure of the target firm. The
reason for that is, that firms in their start-up phase do have a lot of debt and as the firm gets more mature
and profitable it does in most cases gradually replace some of the debt with equity. Due to this, the WACC
can potentially result in erroneous values. Further, as firm value is very sensitive to the level of WACC, it is
of course important to bear in mind that one of the inputs into the model comes from the CAPM, which
also has drawbacks as already mentioned above.
There exist many valuation methods in the world of finance. Overall there are two main methods: Cash
flow based or accrual based methods. Koller et al. (2005) argued in favor of the cash flow based method as
it is unaffected by the accounting methods applied. On the other hand Penman & Sougiannis (1998)
concluded in their research that the residual income method (RI), which is an accrual based valuation
method, is more precise than the discounted cash flow model (DCF), which is based on a company’s cash
flows. However, as both methods are based on the dividend discount model (DDM) introduced by Milller &
Modigliani (1961), they should both yield the same value if applied properly.
The main valuation method applied in this thesis will be the DCF model. Therefore it is important to be
attentive of its drawbacks. The biggest problem with the DCF model is that is does not match cash inflows
with cash outflows. In the example of SAS, attention should therefore be drawn towards big investments in
some periods (cash outflows) and significant cash inflows in the following periods. The cash flow can also
be manipulated by the company, by for example taking out a big loan, which will increase the cash flows.
The above have only concerned theories within the valuation section of this thesis. The reason they have
been subject to discussion, is that they are all based on math, equations and a lot of assumptions. This gives
rise to a lot of criticism and theorists testing them by conducting different studies, in order to improve or
finding new methods.
Other theories applied such as the PESTEL, Porters Five Forces, Porters Value Chain etc. will not be
discussed in details in this section. The reason for this is, that the author does not regard them as theories
as such, but merely guidelines of which factors that might be relevant to consider, when analyzing things
such as the industry or the macro environment. They will of course still be critically applied in the analysis
of SAS.
13
Part 2: Presentation of SAS
In part 2 a brief presentation of SAS will be carried out. In order to give a potential investor an introduction
to SAS, the section will include SAS’s history, as this is needed to understand the ownership structure and
the way that SAS has developed. SAS’s strategy is another important aspect to know about. The different
strategies from 2002 up until today will be presented, as they give a good picture of the direction that SAS
has been trying to follow, and where SAS wants to be in the future in terms of markets, financials etc.
The markets that SAS is operating in will be mentioned, and the last section of part 2 will deal with the
SAS’s peer group, as they are very important to know off when conducting benchmarks.
2.1 History
The history of SAS dates back to 1946 as Det Danske Luftfartsselskab (DDL), Det Norske Luftfartsselskab
(DNL) and Svensk Interkontinental Lufttrafik AB (SILA) merged, and created what would be known as SAS.
From the 1960’s – 1980’s SAS grew and expanded into new business areas. In 1960 SAS opened its first
hotel – SAS Royal Hotel Copenhagen and did from then on open hotels in many other countries, the first
one in 1980 in Kuwait named SAS Kuwait Hotel. In 1982 and 1984 SAS won prices for the “most precise
aviation company” and for “Airline of the year” respectively. In 1986 Spanair was founded as a joint venture
between SAS and Viajes Marsans, Consequently SAS expanded into new markets. In 1981 Jan Carlzon
became the CEO of SAS, and held that position for 12 consecutive years. He introduced the strategy “The
Businessman’s Airline” which focused on the businessmen, who was characterized by willing to pay a
higher price and thereby increasing the profit per flight seat. Further it was under management of Jan
Carlzon that the payroll expenses really took off, which gave him the nickname “the world’s best Carlzon”
and “the world’s most expensive Carlson”. Carlzon focused on customers and employee satisfaction which
meant increasing payroll, pension and other operating costs. However, as SAS operated in a monopoly the
solution was to raise prices (Ussing 6 April 2013). This was laying the ground for the SAS we have known for
many years, characterized by a high service level and a continuing battle with high fixed costs.
From 1992 and onwards SAS entered a more turbulent period in its history. The period was characterized
by SAS entering into new markets by acquiring competitors such as Air Botnia (1998) and Widerøe (1999).
However, other areas of the business were divested, such as the majority holding in Intercontinental Hotels
Group in 1992. Jen Reinås who took seat as CEO in 1993 got the task to build a leaner SAS and focus more
on the key activity – aviation. However, as Jan Stenberg became CEO in 1994, he forgot all about cost
savings and focused instead on Total Quality Management. Under management of Stenberg 1,600 people
were hired in 1996 and 1450 more in 1997, which meant a more cost-intensive SAS (Horn & Willumsen,
2006).
Shifting management and cost-cutting plans continued into the new millennium, and culminated in 2001
where theorists attached the World Trade Centers, which affected the aviation industry worldwide. From
then on SAS had to do something drastic in order to survive. The next section will touch upon the strategies
that SAS has been implementing the last decade.
14
2.2 Strategy
As mentioned in section 2.1, SAS needed to do something after the 9/11 attack in order to stay
competitive, as demand had gone down and competition from LCC such ad Norwegian really had increased,
especially after the initial public offering (IPO) of Norwegian in 2003.
In 2002 SAS initiated the “Turnaround 2005” program which aimed at improving the competitiveness and
profitability. The program was rather ambitious and was designed to make cost reductions of SEK 14 billion
within 2005. In 2005 the program was fully implemented and structural cost reductions ended at SEK 14.2
billion, corresponding to unit cost reductions of 30 %, adjusted for currency and fuel effects, and with
reductions in staff of approximately 5,500 full time employees (AR 2005, p. 6).
In 2006 SAS kicked off a new strategic plan, “Strategy 2011”. The new strategy had a clear focus on
customers and employees, and aimed at being better at focusing on the key competence, namely aviation.
The overall aim was to ensure that SAS could ensure a passenger growth of 20 % in 2011.
In 2008 Strategy 2011 had saved costs of SEK 4 billion. However, due to the changed market conditions
primarily caused by the financial crisis, the strategy was not enough. Therefore a new strategy, “Core SAS”,
was launched in 2009. SAS management wanted a more simple structure, meaning that companies that
were outside of the Nordic home market, which was not considered as part of SAS’s core business, would
be divested or outsourced. Core SAS was fully implemented in 2011 with total cost reductions of SEK 7.6
billion and reduction in unit costs of 23 % compared to 2008 (AR 2011 p. 7).
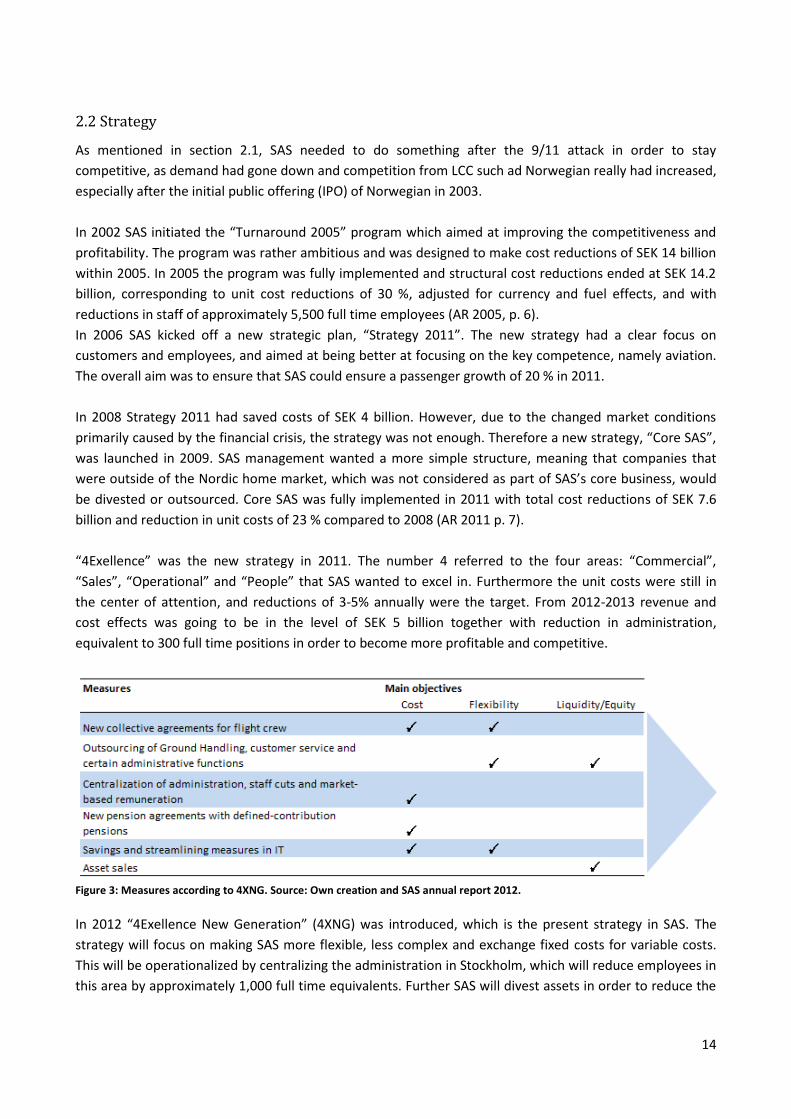
“4Exellence” was the new strategy in 2011. The number 4 referred to the four areas: “Commercial”,
“Sales”, “Operational” and “People” that SAS wanted to excel in. Furthermore the unit costs were still in
the center of attention, and reductions of 3-5% annually were the target. From 2012-2013 revenue and
cost effects was going to be in the level of SEK 5 billion together with reduction in administration,
equivalent to 300 full time positions in order to become more profitable and competitive.
Figure 3: Measures according to 4XNG. Source: Own creation and SAS annual report 2012.
In 2012 “4Exellence New Generation” (4XNG) was introduced, which is the present strategy in SAS. The
strategy will focus on making SAS more flexible, less complex and exchange fixed costs for variable costs.
This will be operationalized by centralizing the administration in Stockholm, which will reduce employees in
this area by approximately 1,000 full time equivalents. Further SAS will divest assets in order to reduce the
15
dependence on external funding. Potential divestments include Widerøe, Airport-related real estate,
Ground handling and Aircraft engines as illustrated in figure 3. The overall aim is to secure cost reductions
of SEK 3 billion in 2012 and 2013 and to divest assets with an effect on liquidity of around SEK 3 billion (AR
2012 p. 5-12).
According to the Q1 12/13 interim report, SAS outsourced the Ground Handling operations to Swissport.
Furthermore the centralization of administration is progressing and staff has been reduced by 30 %. Finally
the call center has been outsourced to a third-party and a sale and leaseback agreement has been signed
regarding reserve engines, which correspond to a liquidity effect of SEK 700 million during the second
quarter. This is all in line with the strategy and SAS is about to become a more streamlined profitable
company with the main focus on its core competency, aviation.
In conjunction with the introduction of 4XNG, SAS has also set new financial targets. The most important
one is the profitability in terms of the EBIT margin. SAS aims at improving the EBIT margin, so that a level of
8 % will be set as target. SAS believe that it is realistic to reach the target EBIT margin in 2014/2015.
2.3 SAS’s markets
SAS’s main market has always been in the Nordic Countries, which consists of Norway, Sweden, Finland and
Denmark. During the history SAS has bought and expanded to new routes and markets. However, Core SAS
had, as one of the objectives, to focus the attention on the home market – the Nordic Market. This is also
known as de-diversifying, which is usually a phenomenon in hard financial times, where a company has
difficulties in creating profit, and therefore start focusing on what they are best at. This is the case in SAS at
the moment cf. section 2.2.
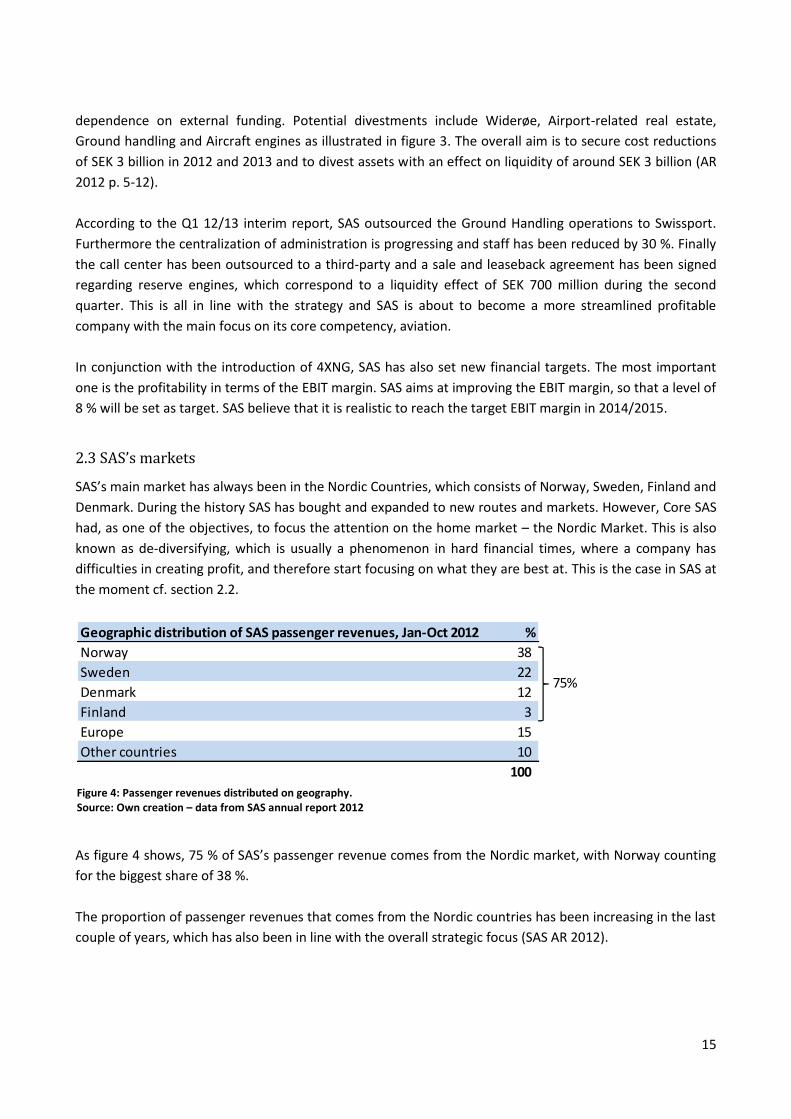
As figure 4 shows, 75 % of SAS’s passenger revenue comes from the Nordic market, with Norway counting
for the biggest share of 38 %.
The proportion of passenger revenues that comes from the Nordic countries has been increasing in the last
couple of years, which has also been in line with the overall strategic focus (SAS AR 2012).
Geographic distribution of SAS passenger revenues, Jan-Oct 2012 %
Norway 38
Sweden 22
Denmark 12
Finland 3
Europe 15
Other countries 10
100
75%
Figure 4: Passenger revenues distributed on geography. Source: Own creation – data from SAS annual report 2012
16
0 5 10 15 20 25 30
SAS group
Norwegian
Ryanair
Finnair
AirFrance/KLM
Widerøe
British Airways
AirBerlin
Easyjet
%
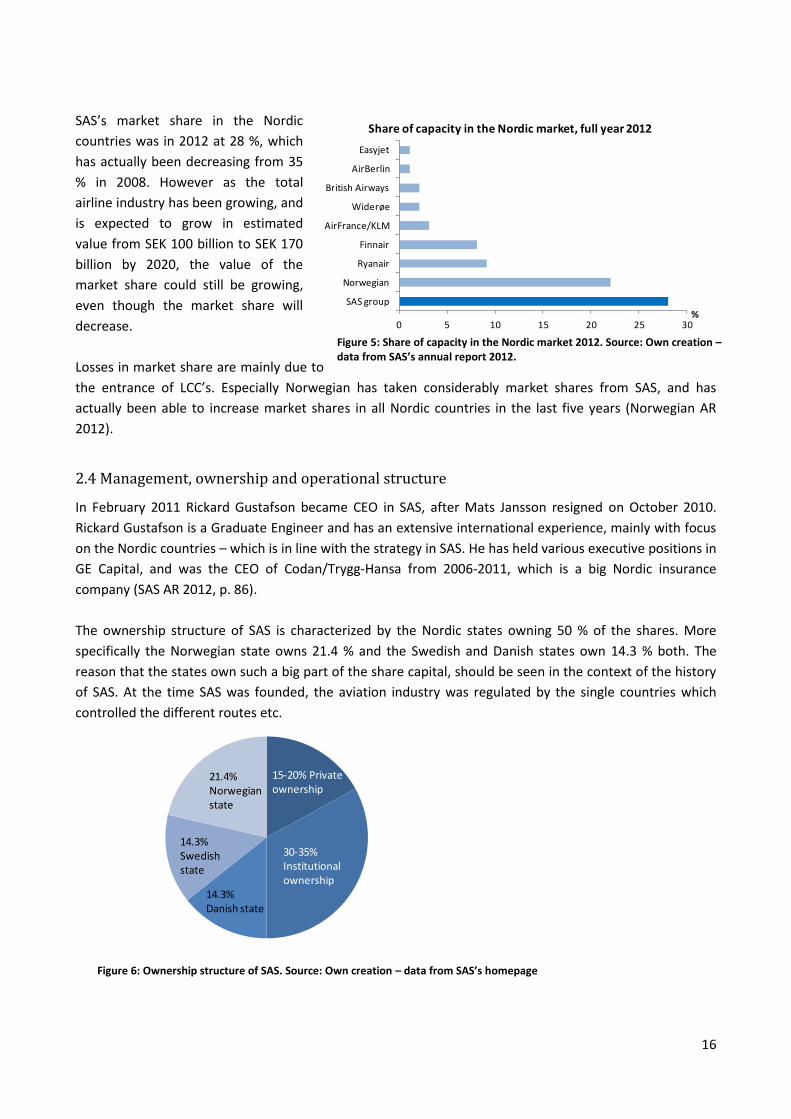
Share of capacity in the Nordic market, full year 2012SAS’s market share in the Nordic
countries was in 2012 at 28 %, which
has actually been decreasing from 35
% in 2008. However as the total
airline industry has been growing, and
is expected to grow in estimated
value from SEK 100 billion to SEK 170
billion by 2020, the value of the
market share could still be growing,
even though the market share will
decrease.
Losses in market share are mainly due to
the entrance of LCC’s. Especially Norwegian has taken considerably market shares from SAS, and has
actually been able to increase market shares in all Nordic countries in the last five years (Norwegian AR
2012).
2.4 Management, ownership and operational structure
In February 2011 Rickard Gustafson became CEO in SAS, after Mats Jansson resigned on October 2010.
Rickard Gustafson is a Graduate Engineer and has an extensive international experience, mainly with focus
on the Nordic countries – which is in line with the strategy in SAS. He has held various executive positions in
GE Capital, and was the CEO of Codan/Trygg-Hansa from 2006-2011, which is a big Nordic insurance
company (SAS AR 2012, p. 86).
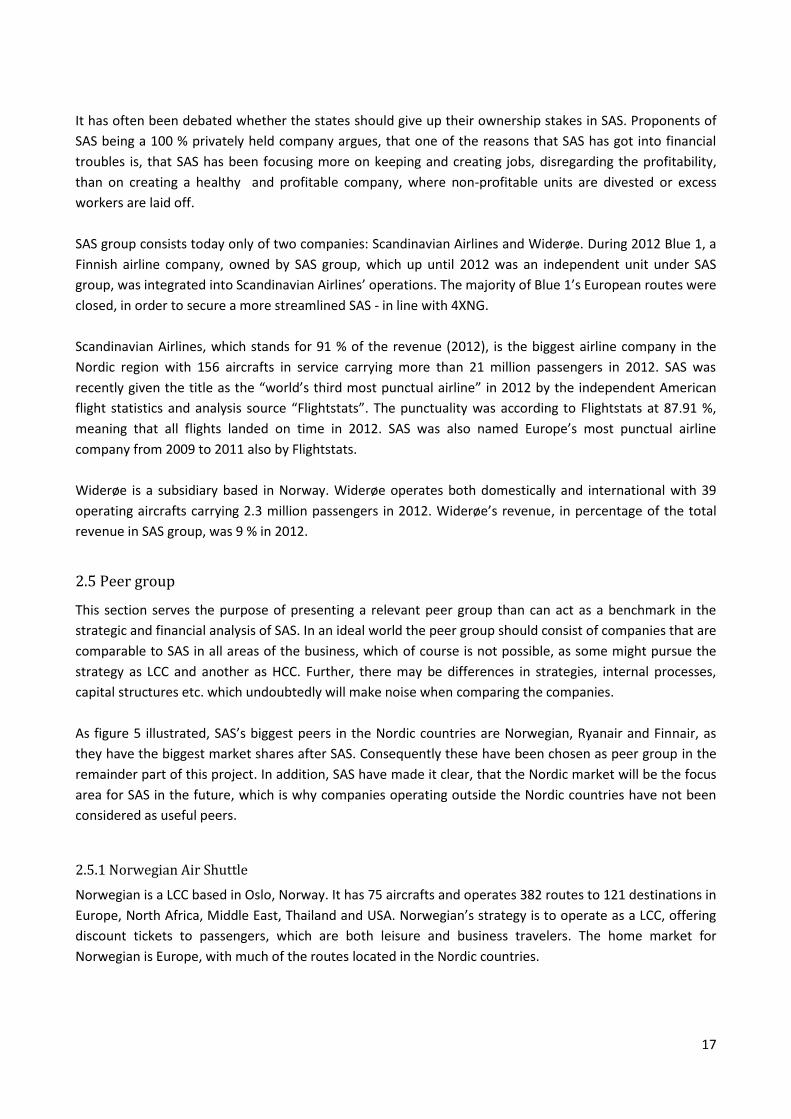
The ownership structure of SAS is characterized by the Nordic states owning 50 % of the shares. More
specifically the Norwegian state owns 21.4 % and the Swedish and Danish states own 14.3 % both. The
reason that the states own such a big part of the share capital, should be seen in the context of the history
of SAS. At the time SAS was founded, the aviation industry was regulated by the single countries which
controlled the different routes etc.
30-35% Institutional ownership
15-20% Private ownership
21.4%Norwegian state
14.3%Danish state
14.3%Swedish state
Figure 5: Share of capacity in the Nordic market 2012. Source: Own creation – data from SAS’s annual report 2012.
Figure 6: Ownership structure of SAS. Source: Own creation – data from SAS’s homepage
17
It has often been debated whether the states should give up their ownership stakes in SAS. Proponents of
SAS being a 100 % privately held company argues, that one of the reasons that SAS has got into financial
troubles is, that SAS has been focusing more on keeping and creating jobs, disregarding the profitability,
than on creating a healthy and profitable company, where non-profitable units are divested or excess
workers are laid off.
SAS group consists today only of two companies: Scandinavian Airlines and Widerøe. During 2012 Blue 1, a
Finnish airline company, owned by SAS group, which up until 2012 was an independent unit under SAS
group, was integrated into Scandinavian Airlines’ operations. The majority of Blue 1’s European routes were
closed, in order to secure a more streamlined SAS - in line with 4XNG.
Scandinavian Airlines, which stands for 91 % of the revenue (2012), is the biggest airline company in the
Nordic region with 156 aircrafts in service carrying more than 21 million passengers in 2012. SAS was
recently given the title as the “world’s third most punctual airline” in 2012 by the independent American
flight statistics and analysis source “Flightstats”. The punctuality was according to Flightstats at 87.91 %,
meaning that all flights landed on time in 2012. SAS was also named Europe’s most punctual airline
company from 2009 to 2011 also by Flightstats.
Widerøe is a subsidiary based in Norway. Widerøe operates both domestically and international with 39
operating aircrafts carrying 2.3 million passengers in 2012. Widerøe’s revenue, in percentage of the total
revenue in SAS group, was 9 % in 2012.
2.5 Peer group
This section serves the purpose of presenting a relevant peer group than can act as a benchmark in the
strategic and financial analysis of SAS. In an ideal world the peer group should consist of companies that are
comparable to SAS in all areas of the business, which of course is not possible, as some might pursue the
strategy as LCC and another as HCC. Further, there may be differences in strategies, internal processes,
capital structures etc. which undoubtedly will make noise when comparing the companies.
As figure 5 illustrated, SAS’s biggest peers in the Nordic countries are Norwegian, Ryanair and Finnair, as
they have the biggest market shares after SAS. Consequently these have been chosen as peer group in the
remainder part of this project. In addition, SAS have made it clear, that the Nordic market will be the focus
area for SAS in the future, which is why companies operating outside the Nordic countries have not been
considered as useful peers.
2.5.1 Norwegian Air Shuttle
Norwegian is a LCC based in Oslo, Norway. It has 75 aircrafts and operates 382 routes to 121 destinations in
Europe, North Africa, Middle East, Thailand and USA. Norwegian’s strategy is to operate as a LCC, offering
discount tickets to passengers, which are both leisure and business travelers. The home market for
Norwegian is Europe, with much of the routes located in the Nordic countries.
18
In 2012 Norwegian had 2,705 full time employees (FTE) and the company transported almost 18 million
passengers. This is 25% less than SAS’s 24 million passengers, which is only from 1 January - 31 October,
due to changes in SAS’s financial year. However, Norwegian is growing aggressively at the moment, and has
between 2005 and 2012 had a compounded annual growth rate of 21% (Norwegian AR 2012).
Norwegian had revenues of NOK 12.8 billion in 2012 compared to 10.5 the year before, corresponding to a
revenue growth of 22%.
Norwegian is by far the biggest competitor in SAS’s home market at the moment, which can also be
concluded from the market shares between the two. In 2008 SAS’s market share in the Nordic countries
was 35% against Norwegians 11%. In 2012 these numbers were 28 % and 22 % respectively, as expressed in
figure 5.
2.5.2 Ryanair
As with Norwegian, Ryanair is a LCC. The main base is Stanstead Airport together with 57 other bases all
over the world. Ryanair operates 1,600 routes and has a fleet consisting of 305 aircrafts. Ryanair is an ultra
LCC compared to e.g. Norwegian, as the main objective is to offer the lowest ticket prices on the market.
This is done by use of surcharges, which by other companies are normally included in the price. In 2010
Ryanair considered to install pay toilets, in order to lower prices even further. However, this was never
realized, and was leaved undone in 2011.
9,127 FTE’s were employed in Ryanair in 2012, which is about 40 % less than the 15,000 in SAS. This is in
contrast to the 79 million transported passengers, which is almost three times the number of transported
passengers in SAS.
Ryanair managed to report revenue of EUR 4,884 million corresponding to SEK 41,6251 million. This was not
much better than SAS revenue in 2012, which reported revenue of SEK 35,986 from 1 January to 31
October. Ryanair’s market share was 9 % in the Nordic countries in 2012, up from 7 % in 2008 – indicating
that Ryanair is not as aggressive in this region as Norwegian in terms of growing the business.
2.5.3 Finnair
Finnair is the national carrier of Finland, and is majority owned by the Finnish government. The prime base
is Helsinki with 45 aircrafts flying to more than 70 destinations worldwide. Finnair’s strategy is to become
the number one airline in the Nordic countries. In contrast to Norwegian and Ryanair, Finnair is not a LCC,
but merely as SAS focused on providing good service during the flight.
Finnair had 6,368 FTE’s in December 2012 and transported 8.8 million passengers, which makes it the
smallest company in the peer group, measured by transported passengers, and almost three times less
than SAS.
1 Using the exchange rate of EUR 1 = SEK 8.52 which was the rate at the cut-off date 1 May 2012
19
The revenue in 2012 was EUR 2,449 million corresponding to SEK 20,865 million, which was approximately
half the size of SAS’s reported revenue.2 Finnair had a market share in the Nordic countries of 8 % in 2012
down from 11 % in 2008. As in the case with SAS, Finnair has lost market shares, mainly due to the
increasing competition from the LCC’s.
Finnair is probably the competitor reminding most of SAS, as it is also a flag carrier, and has its main
activities in the Nordic countries.
2 Applying the same exchange rate as in note 1.
20
Part 3: Strategic analysis
3.1. Analysis of the macro environment
In part 3 a strategic analysis containing political, economic, social and technological factors, which are of big
importance for the airline industry and more importantly SAS, will be examined. These are all external
factors which are very important to try to control, or at least to be aware of. Consequently they should be
assessed continuously in order to minimize the risks associated herewith. The analysis carried out in this
section, will serve as important inputs to the budgeting of future cash flows.
3.1.1 Political factors
The airline industry has in recent years been characterized by being gradually deregulated. In 1978 the
Airline Deregulation Act was approved, which deregulated the industry in USA. From 1993-1997 the
European Union deregulated the airline industry and phased in the open skies regime, which allowed all
transatlantic routes to be opened up to European and American airline companies. Furthermore, all
restrictions concerning which routes should be operated by whom and the corresponding prices were
removed, and replaced with open competition (Horn & Willumsen, 2006).
As mentioned in section 2.4, the Swedish, Norwegian and Danish states each own 50 % in total of the
shares outstanding in SAS, and consequently have the majority of the shares and thereby the ownership of
the company. This has caused a lot of debate in recent years, especially after the deregulation of the
industry, but in particular after the financial turmoil in SAS took off.
Being a state-owned company can have some unfortunate drawbacks, as the main focus might be on things
other than the profitability i.e. increasing shareholder value. With approximately 15,000 employees in SAS
and even more if suppliers and personal in the airports are included; the politicians obviously have an
interest in keeping SAS alive. Unprofitable units in SAS might have been held alive in order to secure as
many as possible employed, especially in light of the recession that e.g. EU finds itself in at the moment.
Another conflict might be the importance of a modern infrastructure, which is crucial for every western
knowledge-based society that focuses on productivity and increasing wealth. In particular in Norway the
airline industry is important, as other means of transport might not be an alternative. Thus politicians might
have an interest in keeping regional routes open to secure the infrastructure, which might not be
profitable. Keeping unprofitable routes artificially alive creates overcapacity which in the end puts a
downward pressure on the yield, not only for the company itself, but for the entire industry.
21
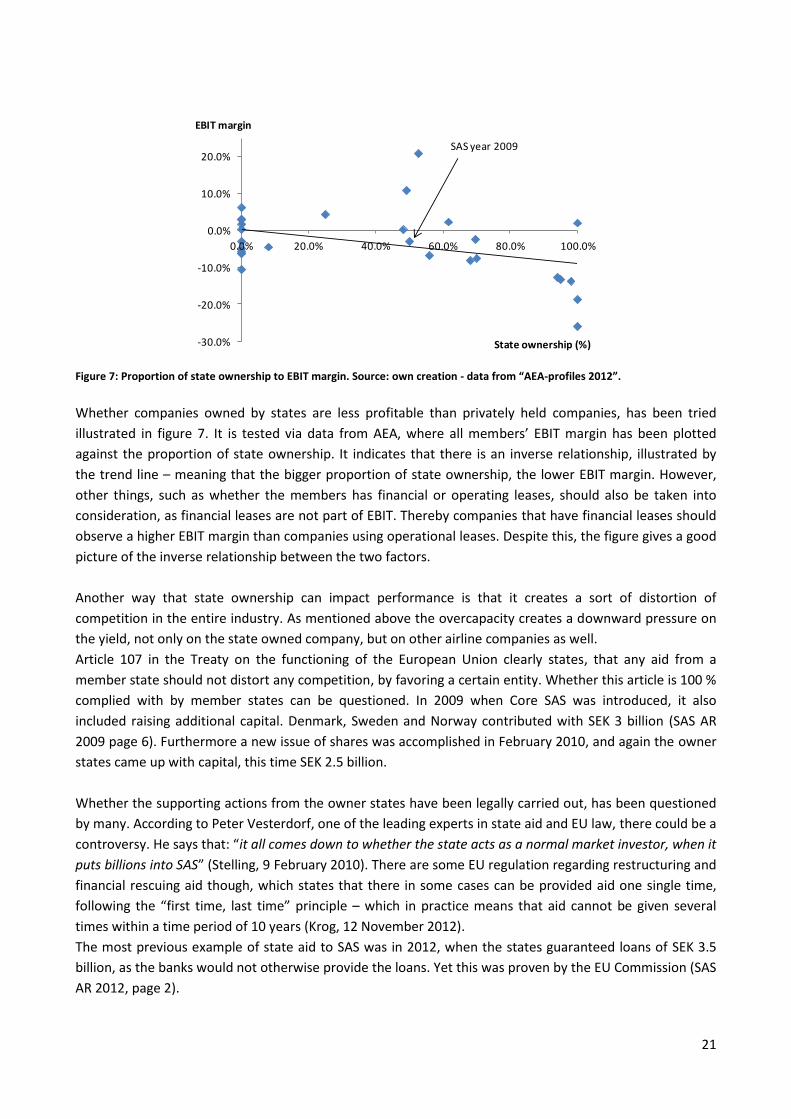
Figure 7: Proportion of state ownership to EBIT margin. Source: own creation - data from “AEA-profiles 2012”.
Whether companies owned by states are less profitable than privately held companies, has been tried
illustrated in figure 7. It is tested via data from AEA, where all members’ EBIT margin has been plotted
against the proportion of state ownership. It indicates that there is an inverse relationship, illustrated by
the trend line – meaning that the bigger proportion of state ownership, the lower EBIT margin. However,
other things, such as whether the members has financial or operating leases, should also be taken into
consideration, as financial leases are not part of EBIT. Thereby companies that have financial leases should
observe a higher EBIT margin than companies using operational leases. Despite this, the figure gives a good
picture of the inverse relationship between the two factors.
Another way that state ownership can impact performance is that it creates a sort of distortion of
competition in the entire industry. As mentioned above the overcapacity creates a downward pressure on
the yield, not only on the state owned company, but on other airline companies as well.
Article 107 in the Treaty on the functioning of the European Union clearly states, that any aid from a
member state should not distort any competition, by favoring a certain entity. Whether this article is 100 %
complied with by member states can be questioned. In 2009 when Core SAS was introduced, it also
included raising additional capital. Denmark, Sweden and Norway contributed with SEK 3 billion (SAS AR
2009 page 6). Furthermore a new issue of shares was accomplished in February 2010, and again the owner
states came up with capital, this time SEK 2.5 billion.
Whether the supporting actions from the owner states have been legally carried out, has been questioned
by many. According to Peter Vesterdorf, one of the leading experts in state aid and EU law, there could be a
controversy. He says that: “it all comes down to whether the state acts as a normal market investor, when it
puts billions into SAS” (Stelling, 9 February 2010). There are some EU regulation regarding restructuring and
financial rescuing aid though, which states that there in some cases can be provided aid one single time,
following the “first time, last time” principle – which in practice means that aid cannot be given several
times within a time period of 10 years (Krog, 12 November 2012).
The most previous example of state aid to SAS was in 2012, when the states guaranteed loans of SEK 3.5
billion, as the banks would not otherwise provide the loans. Yet this was proven by the EU Commission (SAS
AR 2012, page 2).
-30.0%
-20.0%
-10.0%
0.0%
10.0%
20.0%
0.0% 20.0% 40.0% 60.0% 80.0% 100.0%
EBIT margin
State ownership (%)
SAS year 2009
22
It is obvious from the above, that the competition in the airline industry cannot be characterized by open
competition, as many European airlines - among those SAS - are still owned partially by states which often
acts in the grey area in terms of financial aid.
Whether SAS will still be kept as a state owned company in the future is hard to predict. However,
politicians in Norway and Denmark have several times mentioned the idea of selling their ownership in SAS.
Whether this should be regarded as a threat of an opportunity for SAS, would probably depend on which
eyes are looking at it. It was probably not bad for SAS, that they were owned by states during the crisis,
where Sweden, Norway and Denmark guaranteed loans of SEK 3.5 billion and put up additional capital of a
total of SEK 5.5 billion. However, as figure 7 illustrated, companies tend to perform better without the
influence from politicians.
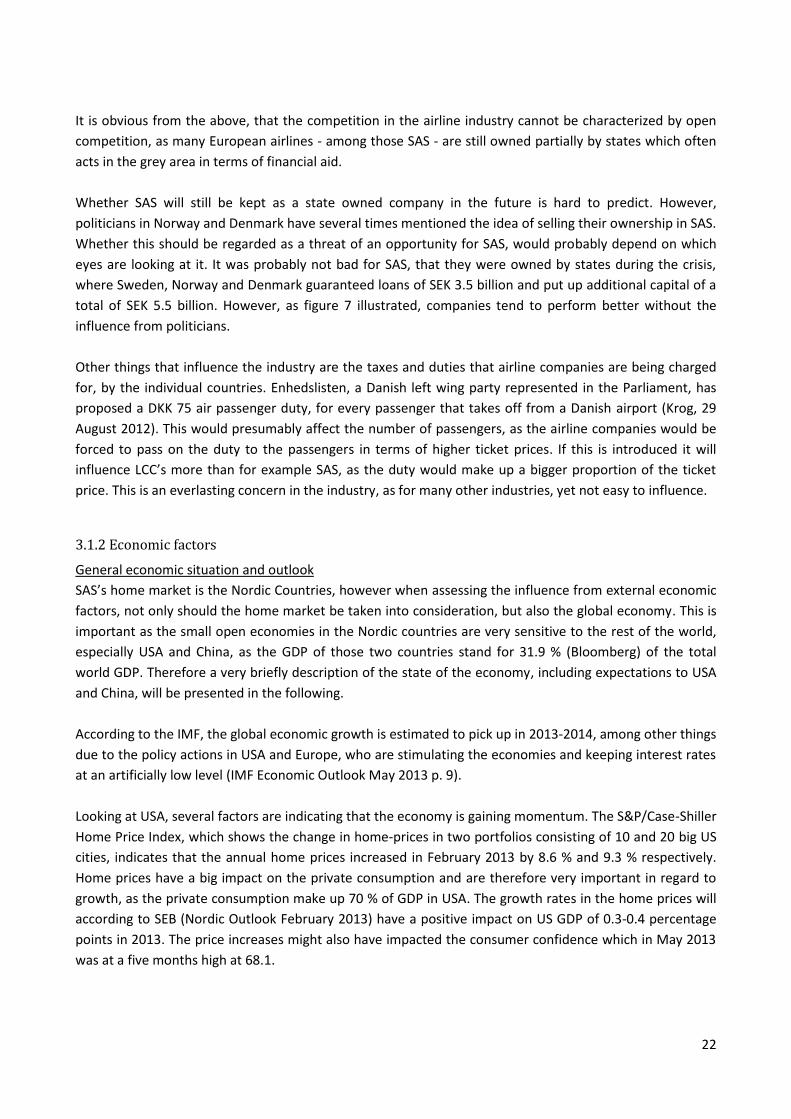
Other things that influence the industry are the taxes and duties that airline companies are being charged
for, by the individual countries. Enhedslisten, a Danish left wing party represented in the Parliament, has
proposed a DKK 75 air passenger duty, for every passenger that takes off from a Danish airport (Krog, 29
August 2012). This would presumably affect the number of passengers, as the airline companies would be
forced to pass on the duty to the passengers in terms of higher ticket prices. If this is introduced it will
influence LCC’s more than for example SAS, as the duty would make up a bigger proportion of the ticket
price. This is an everlasting concern in the industry, as for many other industries, yet not easy to influence.
3.1.2 Economic factors
General economic situation and outlook
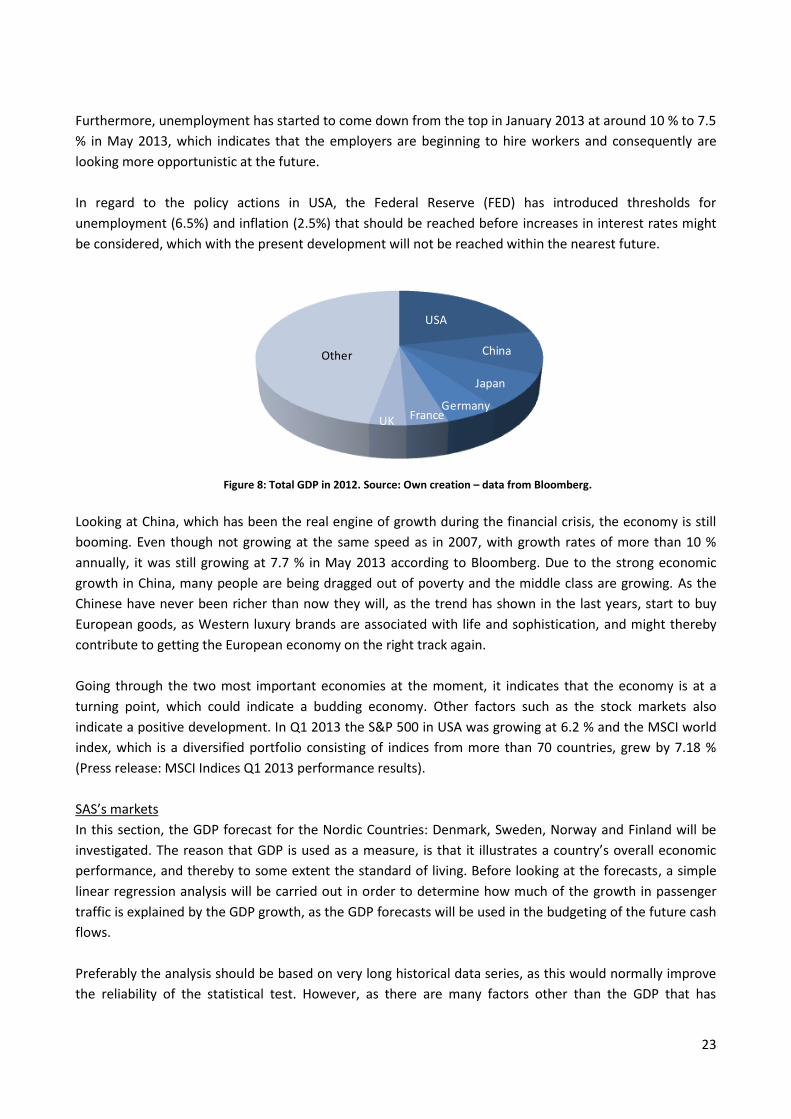
SAS’s home market is the Nordic Countries, however when assessing the influence from external economic
factors, not only should the home market be taken into consideration, but also the global economy. This is
important as the small open economies in the Nordic countries are very sensitive to the rest of the world,
especially USA and China, as the GDP of those two countries stand for 31.9 % (Bloomberg) of the total
world GDP. Therefore a very briefly description of the state of the economy, including expectations to USA
and China, will be presented in the following.
According to the IMF, the global economic growth is estimated to pick up in 2013-2014, among other things
due to the policy actions in USA and Europe, who are stimulating the economies and keeping interest rates
at an artificially low level (IMF Economic Outlook May 2013 p. 9).
Looking at USA, several factors are indicating that the economy is gaining momentum. The S&P/Case-Shiller
Home Price Index, which shows the change in home-prices in two portfolios consisting of 10 and 20 big US
cities, indicates that the annual home prices increased in February 2013 by 8.6 % and 9.3 % respectively.
Home prices have a big impact on the private consumption and are therefore very important in regard to
growth, as the private consumption make up 70 % of GDP in USA. The growth rates in the home prices will
according to SEB (Nordic Outlook February 2013) have a positive impact on US GDP of 0.3-0.4 percentage
points in 2013. The price increases might also have impacted the consumer confidence which in May 2013
was at a five months high at 68.1.
23
Furthermore, unemployment has started to come down from the top in January 2013 at around 10 % to 7.5
% in May 2013, which indicates that the employers are beginning to hire workers and consequently are
looking more opportunistic at the future.
In regard to the policy actions in USA, the Federal Reserve (FED) has introduced thresholds for
unemployment (6.5%) and inflation (2.5%) that should be reached before increases in interest rates might
be considered, which with the present development will not be reached within the nearest future.
Figure 8: Total GDP in 2012. Source: Own creation – data from Bloomberg.
Looking at China, which has been the real engine of growth during the financial crisis, the economy is still
booming. Even though not growing at the same speed as in 2007, with growth rates of more than 10 %
annually, it was still growing at 7.7 % in May 2013 according to Bloomberg. Due to the strong economic
growth in China, many people are being dragged out of poverty and the middle class are growing. As the
Chinese have never been richer than now they will, as the trend has shown in the last years, start to buy
European goods, as Western luxury brands are associated with life and sophistication, and might thereby
contribute to getting the European economy on the right track again.
Going through the two most important economies at the moment, it indicates that the economy is at a
turning point, which could indicate a budding economy. Other factors such as the stock markets also
indicate a positive development. In Q1 2013 the S&P 500 in USA was growing at 6.2 % and the MSCI world
index, which is a diversified portfolio consisting of indices from more than 70 countries, grew by 7.18 %
(Press release: MSCI Indices Q1 2013 performance results).
SAS’s markets
In this section, the GDP forecast for the Nordic Countries: Denmark, Sweden, Norway and Finland will be
investigated. The reason that GDP is used as a measure, is that it illustrates a country’s overall economic
performance, and thereby to some extent the standard of living. Before looking at the forecasts, a simple
linear regression analysis will be carried out in order to determine how much of the growth in passenger
traffic is explained by the GDP growth, as the GDP forecasts will be used in the budgeting of the future cash
flows.
Preferably the analysis should be based on very long historical data series, as this would normally improve
the reliability of the statistical test. However, as there are many factors other than the GDP that has
USA
China
Japan
GermanyFranceUK
Other
24
affected the volume in the industry, especially the deregulation of the airline industry in Europe in the 90’s,
it is estimated that using data from before the 00’s will have a negative impact and add noise to the test.
Consequently the test is based on data from the period 2001-2011.
The two hypotheses are, at a 95 % confidence interval:
H0: No relationship between GDP and no. of passengers
H1: Relationship between GDP and no. of passengers3
The regression analysis indicates a positive relationship between the two factors. The P-value for β0 is 4.9 %
which is less than alpha (α) which is 5 %. Even though not significant less than α, it is still less and thereby
the H0 hypothesis, which stated no relationship between the two factors, is rejected.
R-squared (R2) is 63.3 % indicating that GDP growth has explained 63.3 % of the passenger growth in the
last ten years.
Now that it has been concluded that there is a positive relationship between the GDP and no. of
passengers, the GDP forecasts will be taken into consideration, in order to get a view of the future direction
of the airline industry.
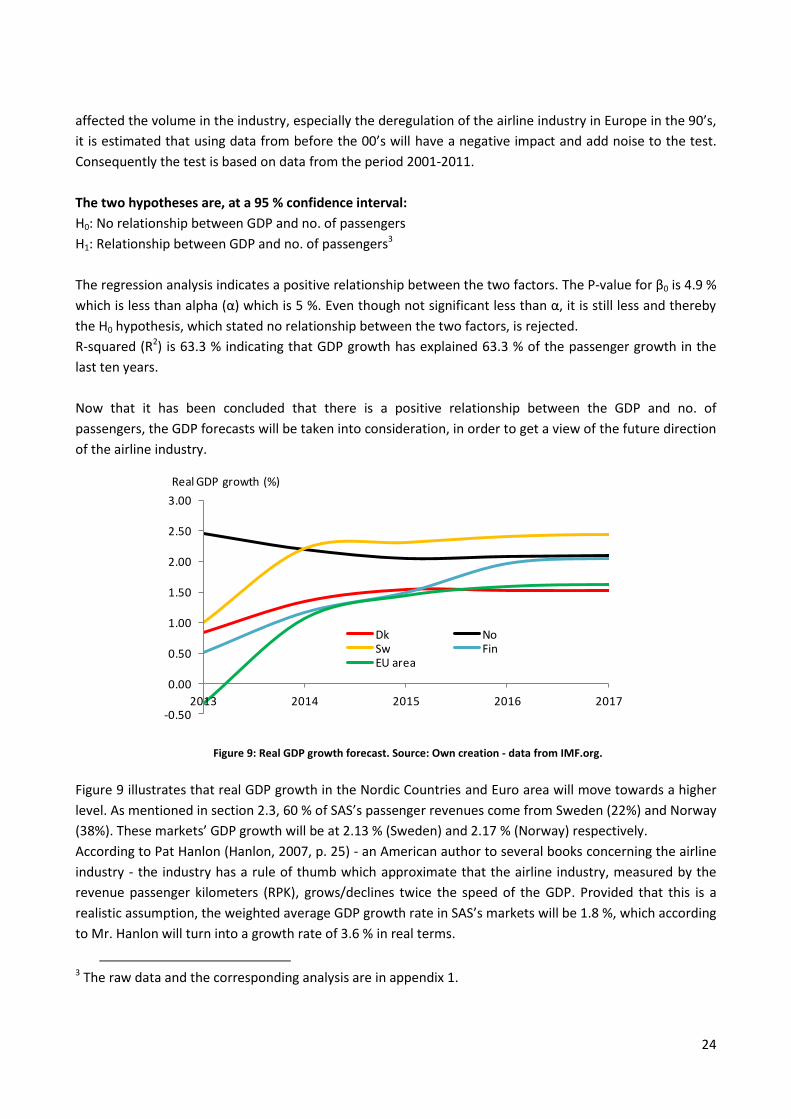
Figure 9: Real GDP growth forecast. Source: Own creation - data from IMF.org.
Figure 9 illustrates that real GDP growth in the Nordic Countries and Euro area will move towards a higher
level. As mentioned in section 2.3, 60 % of SAS’s passenger revenues come from Sweden (22%) and Norway
(38%). These markets’ GDP growth will be at 2.13 % (Sweden) and 2.17 % (Norway) respectively.
According to Pat Hanlon (Hanlon, 2007, p. 25) - an American author to several books concerning the airline
industry - the industry has a rule of thumb which approximate that the airline industry, measured by the
revenue passenger kilometers (RPK), grows/declines twice the speed of the GDP. Provided that this is a
realistic assumption, the weighted average GDP growth rate in SAS’s markets will be 1.8 %, which according
to Mr. Hanlon will turn into a growth rate of 3.6 % in real terms.
3 The raw data and the corresponding analysis are in appendix 1.
-0.50
0.00
0.50
1.00
1.50
2.00
2.50
3.00
2013 2014 2015 2016 2017
Dk NoSw FinEU area
Real GDP growth (%)
25
The International Air Transportation Association (IATA) forecasts in their Economic outlook on May 2013,
that the growth in RPK will be at 4 % annually, and Airbus has in their Global Market Forecast in September
2012 (Leahy, 2012) expected a yearly RPK growth from 2012-2031 of 4 % in Western Europe. Therefore a
level of 3.6 - 4 % seems reasonable to assume in the forecasting period.
Expected development in oil prices
After analyzing the expected development in the growth in revenue, it is just as important to look at the
cost side of the income statement. One of the biggest accounting items in the income statement is the jet-
fuel prices. This is a very important item to analyze, as even small fluctuations in the price of oil, will have a
big impact on a year’s result. Jet-fuel is processed crude oil, and the correlation has historically been very
close to one. Therefore Jet-fuel and crude oil will be used interchangeably in the following section.
In 2012 costs regarding jet-fuel amounted to SEK 8,035 million which is equal to approximately 25 % of
total operating cost in SAS. According to SAS, a 1 % change in the price of jet-fuel costs will have a negative
impact on operating income of SEK 80 million. As the price of oil is known to be very volatile, it should be
watched very carefully.
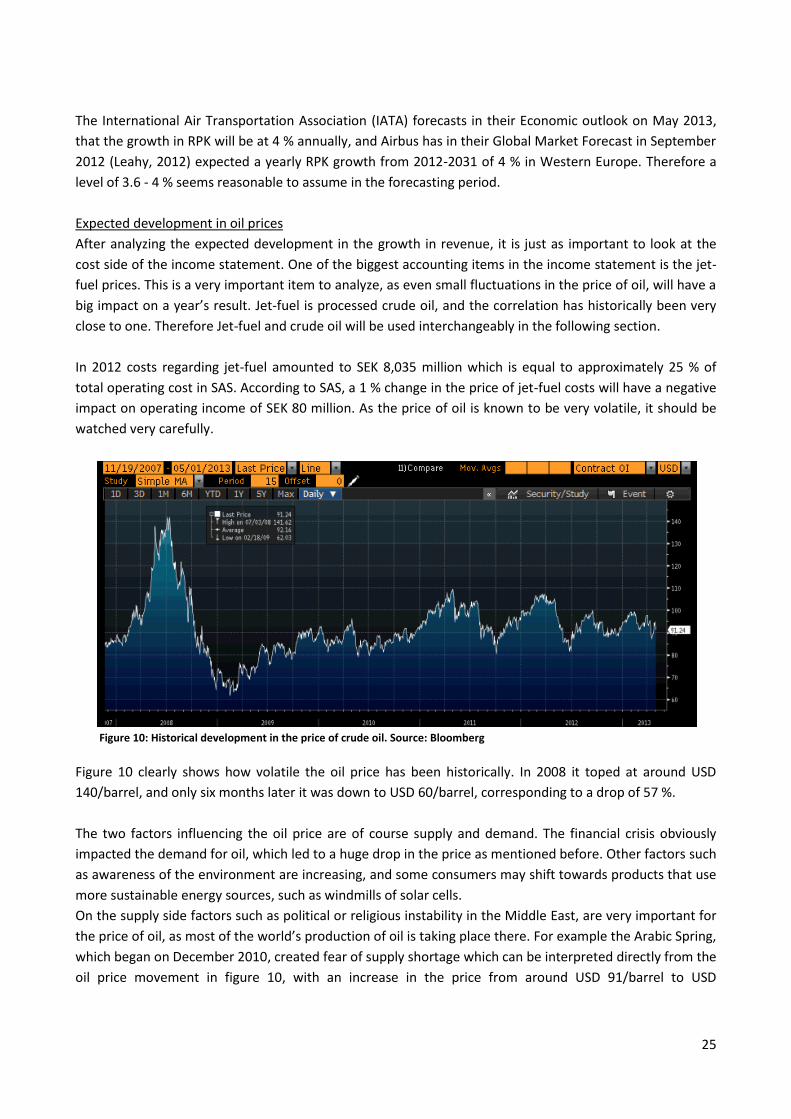
Figure 10: Historical development in the price of crude oil. Source: Bloomberg
Figure 10 clearly shows how volatile the oil price has been historically. In 2008 it toped at around USD
140/barrel, and only six months later it was down to USD 60/barrel, corresponding to a drop of 57 %.
The two factors influencing the oil price are of course supply and demand. The financial crisis obviously
impacted the demand for oil, which led to a huge drop in the price as mentioned before. Other factors such
as awareness of the environment are increasing, and some consumers may shift towards products that use
more sustainable energy sources, such as windmills of solar cells.
On the supply side factors such as political or religious instability in the Middle East, are very important for
the price of oil, as most of the world’s production of oil is taking place there. For example the Arabic Spring,
which began on December 2010, created fear of supply shortage which can be interpreted directly from the
oil price movement in figure 10, with an increase in the price from around USD 91/barrel to USD
26
110/barrel. Consequently, as wars are difficult to predict - so are the oil price movement, and only rough
estimates of the future development can be carried out.
The cocktail of being hard to predict and having a big impact on earnings, is of course something that
makes the airline companies very cautious about it. Therefore most airline companies use hedging tools
such as forwards and futures, in order to reducing the short term risks associated with price fluctuations. As
jet-fuel futures do not exists, futures on crude or heating oil must be used instead.
SAS states in their annual report for 2012, that 40-80 % of their oil consumption has already been hedged
for 2013, meaning that the prices have been locked.
Consensus on Bloomberg, which is formed by reported estimates from many of the world major banks,
states an average increase in oil prices until 2017 of 2.8 % annually. This is almost in line with U.S. Energy
Information Administration, who is predicting the oil price to be at USD 117/barrel in 2025 (U.S. EIA Annual
Energy Outlook 2013). Calculating the compounded annual growth rate (CAGR)4 this equals to 2.2 %.
Therefore, a point between 2.2 % and 2.8 % will be used in the budgeting period.
USD/SEK exchange rate
In regard to the costs associated with jet-fuel consumption, the exchange rate between SEK and USD also
have to be taken into consideration. The reason for this is that jet-fuel is being traded in USD. Accordingly
there is a mismatch between cost currency and the revenue currency. Therefore, if the oil price goes down
but the US dollar goes up relatively more against the Swedish currency, the impact on SAS’s earnings will be
negative.
A screen dump from Bloomberg’s currency rating site is visible in appendix 2. This indicates that the SEK is
currently overvalued against the USD by 4.02 %. The SEK has been very volatile in the past, and should
according to Bloomberg decrease in value compared to the dollar, which consequently would drive up the
jet fuel costs.
3.1.3 Social factors
The general tendency in the airline industry the last ten years for the customers, have been to focus more
on price and less on the convenience during the flight, specifically on short haul routes. Especially after
2008, when the financial crisis erupted, passengers started to look after the price more than ever.
Particularly in the business segment, the prices have become an important factor. During the economic
boom, many business passengers had been using first class and were less concerned about the price. This
changed after the financial crisis as many companies, due to their financial troubles, introduced more strict
policies in regard to air travel. According to Henry H. Tarteveldt, an industry analyst and founder of
Atmosphere Research Group: “More businesspeople are traveling, but companies are being tighter with
their budgets” and he continues “Travelers increasingly have to justify their trips, and trips have to be
approved by managers.” (Mouawad, May 2, 2012). The conclusion by Mr. Tarteveldt is also in line with
SAS’s announcements.
4 CAGR = (Ending value/Beginning value)^(1/# of years) - 1
27
Other factors that might contribute to the increasing price consciousness are internet searching tools such
as momondo.dk in Denmark, where customers simply type in date of departure and destination, where
after all available flight tickets on that specific date pups up, in price order starting with the cheapest. This
way of finding a flight ticket, in contrast to 5-10 years ago where the customers had to contact the airline
companies directly, has without doubt impacted the customers towards LLC’s, as they usually offer the
cheapest tickets.
The increasing price consciousness among customers, both in the business and leisure segment, has
obviously impacted SAS. As the trend began, especially with the introduction of LCC’s in the beginning of
the 00’s, SAS had to adapt to the changing market conditions. As mentioned in section 2.2, SAS has worked
hard towards minimizing the unit costs, in order to be able to compete directly with the LCC’s as
Norwegian.
The demography in the Nordic countries is of course another important factor, when looking at the future
market for the airline companies. Due to the baby-boom in the 1950s, large groups of elderly people in the
Nordic countries are expected to be retiring in the nearest future, which might push up the volume in the
leisure segment. Further the proportion of the household income spend on air transport have increased
steadily in the last decade. Using Denmark as an example, there has been an increase from 0.22 % to 0.38
% of the household income spent on air transport (statistikbanken.dk).
3.1.4 Technical factors
One of the main factors influencing the airline industry is the technological development. With the
possibility of ordering and paying tickets, checking-in and comparing prices over the internet, the airlines as
a means of transportation, have become much more convenient and popular than ever, which might also
explain part of the increase in the household economy spend on air transportation mentioned in the
previous section.
Improving the experience of flying is certainly essential in terms of attracting passengers. Hence, being a
first mover within technology is of a great importance. Norwegian was for example one of the first airline
companies to introduce WIFI on their aircrafts, which obviously was a gigantic competitive advantage, as
the internet today is used to everything from checking news to updating Facebook and communicating with
friends, colleagues and family.
SAS has in several cases been a first mover within the field of technology. This has been essential for SAS, as
their strategy has always been to attract the business segment, and on delivering good services during the
flight. SAS has for example been the first mover in regard to introducing the “Smart Pass” where the Near
Field Communication (NFC) technology is used, which is a wireless communication technology (SAS AR
2013, p.13). Initially this has been ruled out for members of loyalty program “EuroBonus”, which makes it
easy to get through the check-in, security control etc. faster than people on a regular economy ticket.
According to plan, SAS are scheduling to have an app ready before the end of 2013, which makes it possible
for passengers to pay, check-in etc. by holding the mobile phone close to a scanner at the entrance.
28
Moreover, the aircrafts are also continuously being developed. Aerodynamics, improved fuel efficiency and
lighter aircrafts are just a few areas that are continuously being improved and researched in. Therefore the
airline companies should constantly be analyzing the fleet in terms of when they should be replaced with
new and more efficient aircrafts, which is always a trade-off between new investments towards improved
unit costs.
As an example, SAS has signed contracts of 26 new aircrafts as part of the 4XNG strategy, which will reduce
the fuel consumption by 10-15 % compared to the older aircrafts, still with the same number of seats,
which obviously will be included in the forecasts, in terms of decreasing jet-fuel expenses.
3.1.5. Conclusion of PEST analysis
Summing up, the analysis showed a picture of the economic macro environment which is rather attractive
at the moment. Especially the economic conditions which point towards an improvement in the world
economy, with USA gaining momentum and China still delivering solid economic growth rates.
With the GDP forecasts serving as a good indicator for the future activity level in the industry, the growth
rates for SAS’s home markets are also looking to improving from today’s level, with expected growth rates
in the range of 3.6 – 4.0%.
Oil prices which add up to almost 25 % of the total operating costs in SAS, has been very volatility
historically, and are consequently hard to predict in the future. However, a growth rate of around 2.5 % in
the future seems to be the consensus in the market. Taken into consideration the exchange rate between
USD and SEK, it might incur extra costs on SAS, that the SEK is currently overvalued by 4.2 % against the
USD according to Bloomberg.
The industry is to a very high degree affected by political factors as well. The deregulation of the industry
has caused a more free competition, which has allowed LCC’s to enter the market and drive the prices
down and competition up – which obviously has affected SAS negatively, and caused loses in market
shares. Taxes and duties are other things that the politicians have the power to change, and consequently
incur extra risks in the industry.
Consumer preferences have changed in the last decade, making them focusing more on prices than
anything else. This has been a main factor in allowing for LCC’s, and putting pressure on HCC such as SAS.
Finally technology is of a big importance. New improved systems have been invented, aiming at making the
entire process from buying a ticket to when the customer is sitting in the aircraft, more convenient. This
can give a competitive advantage, and therefore it is important in the competition of attracting customers.
Further, being able to offer tickets to competitive prices calls for a modern fleet which is more fuel efficient
and consequently affect the unit costs, which is an important parameter. Therefore, being a first mover
within the field of technology is very important in this industry.
29
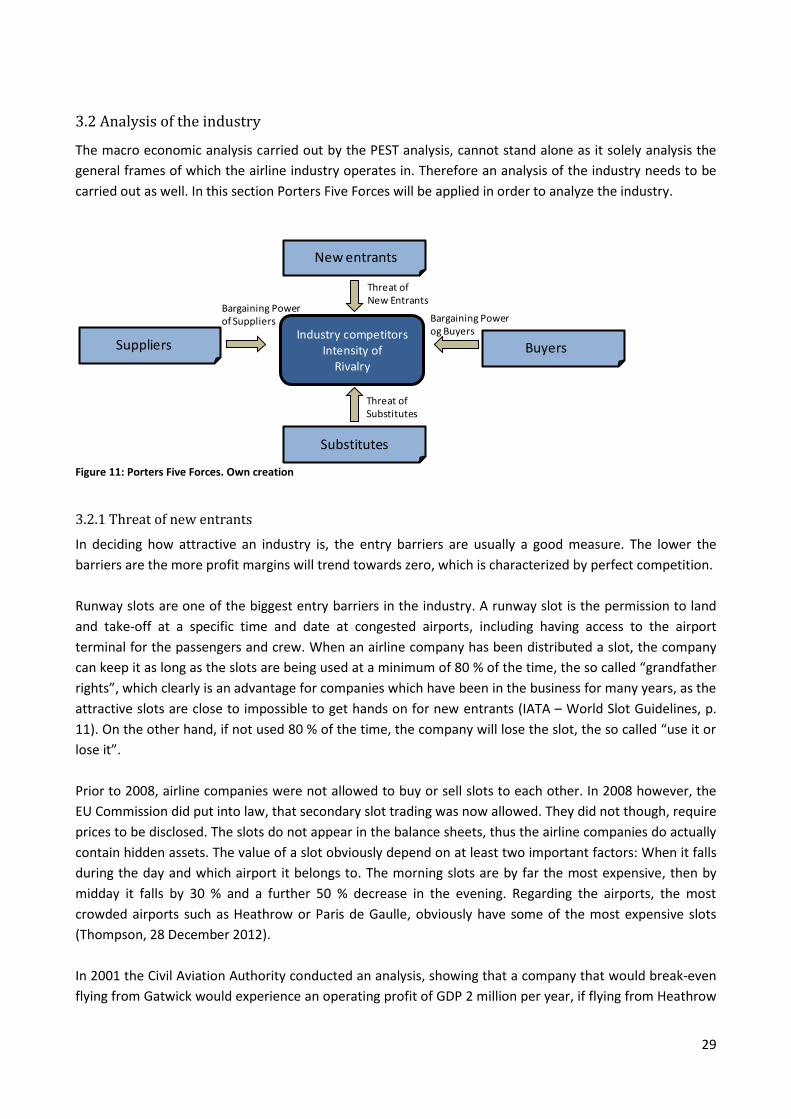
3.2 Analysis of the industry
The macro economic analysis carried out by the PEST analysis, cannot stand alone as it solely analysis the
general frames of which the airline industry operates in. Therefore an analysis of the industry needs to be
carried out as well. In this section Porters Five Forces will be applied in order to analyze the industry.
Figure 11: Porters Five Forces. Own creation
3.2.1 Threat of new entrants
In deciding how attractive an industry is, the entry barriers are usually a good measure. The lower the
barriers are the more profit margins will trend towards zero, which is characterized by perfect competition.
Runway slots are one of the biggest entry barriers in the industry. A runway slot is the permission to land
and take-off at a specific time and date at congested airports, including having access to the airport
terminal for the passengers and crew. When an airline company has been distributed a slot, the company
can keep it as long as the slots are being used at a minimum of 80 % of the time, the so called “grandfather
rights”, which clearly is an advantage for companies which have been in the business for many years, as the
attractive slots are close to impossible to get hands on for new entrants (IATA – World Slot Guidelines, p.
11). On the other hand, if not used 80 % of the time, the company will lose the slot, the so called “use it or
lose it”.
Prior to 2008, airline companies were not allowed to buy or sell slots to each other. In 2008 however, the
EU Commission did put into law, that secondary slot trading was now allowed. They did not though, require
prices to be disclosed. The slots do not appear in the balance sheets, thus the airline companies do actually
contain hidden assets. The value of a slot obviously depend on at least two important factors: When it falls
during the day and which airport it belongs to. The morning slots are by far the most expensive, then by
midday it falls by 30 % and a further 50 % decrease in the evening. Regarding the airports, the most
crowded airports such as Heathrow or Paris de Gaulle, obviously have some of the most expensive slots
(Thompson, 28 December 2012).
In 2001 the Civil Aviation Authority conducted an analysis, showing that a company that would break-even
flying from Gatwick would experience an operating profit of GDP 2 million per year, if flying from Heathrow
Suppliers
Substitutes
Buyers
New entrants
Bargaining Powerof Suppliers
Threat of New Entrants
Bargaining Powerog Buyers
Threat of Substitutes
Industry competitors Intensity of
Rivalry

30
instead, due to higher yields and higher load factors. If applying a discount rate of 20 % over a period of 10
years, this gives a net present value of GDP 10 million. This example clearly indicates why some slots are
more attractive than others.
The value found in the above example, is not far from what slots have been traded at historically in the
secondary market. Appendix 5 shows a list, produced by CAPA research – Centre for Aviation, over some of
the Heathrow slot trades from 1998-2013. The average price per slot is GDP 9 million. The prices though
are very different, with some outliers in 2007 and 2008, which might be illustrating the peak of the market.
Deloitte also conducted an analysis in 2008, in which they concluded that Heathrow had the most
expensive slots trading between GDP 25 and 30 million per slot. They further concluded that while the EU
regulation does a good job in allocating the slots fairly, they have failed in eroding the presence of the
“national flag carriers” at the key airports. 99% of the slots at Heathrow are held by national flag carriers,
which only leave 1 % to new entrants – and consequently is by far the biggest entrance barrier in the
industry (Deloitte, news release, 15 May 2008).
Other barriers are such things as know-how, hiring and educating staff, purchasing or leasing aircrafts and
buildings etc. Especially the last mentioned requires a large capital base, as starting up an airline company
is very capital-intensive. An Airbus 320, which is a very famous aircraft costs USD 91.5 million (Airbus
Aircraft 2013 average price list, January 2013). Accordingly, buying a fleet will in most cases be a financially
challenge for most start-up companies.
As already mentioned, SAS and many other companies are state-owned companies which in some cases
have provided easier access to capital, than 100 % privately held companies, which indirectly acts as a third
barrier, and thereby might keep new entrants away.
Due to the above mentioned factors, new entrants do not come from entrepreneurs creating a completely
new airline company. Usually it happens in the form of old ones expanding to new markets, or by M&A
such as KLM and Air France (2004) or Swiss and Lufthansa (2005). Entrants also happen through vertical
integration such as travel agencies expanding their value chain and thereby starting to operate their own
aircrafts. An example of this is the TUI AG, which is one of the biggest travel and tourism companies in the
world. It owns travel agencies, hotels, airlines, cruise ships and retail stores (tui-group.com).
3.2.2 Threat of substitute products or services
Substitutes are products or services which are providing the same core service to the customer and can
potentially steal market shares from the industry.
One potential threat in terms of substitutes is the high-speed trains. Looking solely at the time of getting
from A to B within Europe, high-speed trains have really had a technological quantum leap in the last
century. One example is the route London-Paris, which is a highly traffic-related route. Travelling with an
31
airline company the trip takes 1 hour and 20 minutes with prices starting at DKK 8005. However, including
check-in one hour before take-off and picking up luggage at the airport, it would be close to 3 hours.
If in contrast the customer is considering travelling by train, this can be done for as little as DKK 600 with
duration of the travel of only 2 hours and 37 minutes. The European commission has analyzed the
relationship between distance and door-door journey time, and concludes that high-speed trains in general
are the fastest on journeys under 800 km (EU Commision, High-speed Europe, p. 9). Further, train
passengers do not have limits in terms of how much luggage they can bring on their trip.
On this particular route the high-speed train has really gained market shares and taken up the competition
with the airline companies. According to Eurostar, who has had the monopoly on high-speed services
through the tunnel between UK and France, they have about 80 % of the market share for travelling
between London, Paris and Brussels. The German state rail operator is also planning to enter the market for
high-speed trains. Initially between London and Frankfurt, which will increase competition and possibly
create even better opportunities for the passengers (Tjolle, Tuesday 28 May 2013).
However, these threats are not currently at the SAS’s routes, but could presumably be it in the future. In
some regions such as in Finland and the northern part of Sweden and Norway, high-speed trains are not
really considered as a substitute, due to difficult passable ground mainly caused by chain of mountains.
Therefore other airline operators than SAS should be more concerned with the growing high-speed train
market.
Another substitute product is conference calls, which are mainly affecting the business travelling segment.
These types of communication tools offer a range of advantages such as being time and cost reducing. In
particular the cost side has been very important, as many companies in the aftermath of the financial crisis
have set new standards and policies in terms of the size of the budget for travelling expenses, as mentioned
in section 3.1.3 “social factors”.
Furthermore the quality of the virtual meetings are only becoming of an even higher quality. Today
meetings with no delays, pauses or interruptions are just to be expected when buying the technology. By
extension, the hotel chain Marriot, did in 2010 launch the “Go There Virtual Meetings”, which is a meeting
room with the necessary equipment, which enables groups to meet and collaborate in multiple locations
worldwide (Press release January 27, 2010).
As more than 50 % of SAS’s customer base is related to the business segment, this is of course a big threat
to SAS. Even though considered as a big threat, especially with the future technological development within
the field, it will still be difficult for the virtual meetings to replace regular face to face meetings, as these
will always be preferred in some industries.
5 Easyjet return ticket on 28 May 2013.
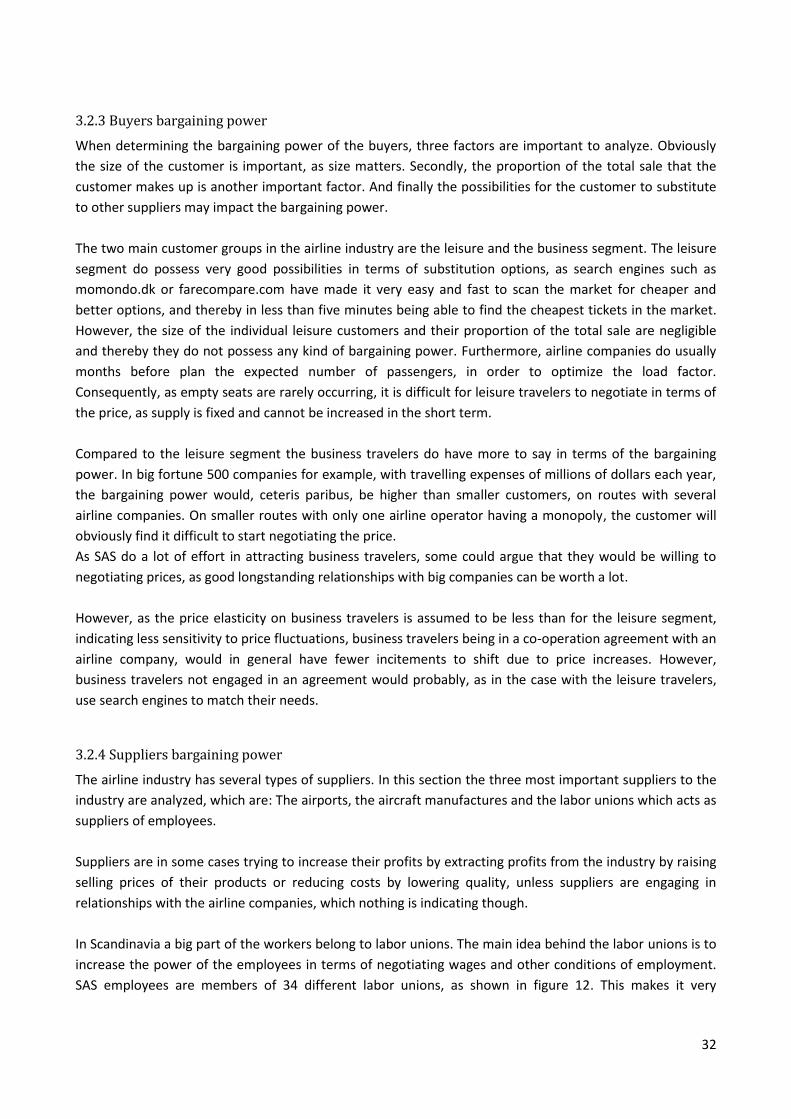
32
3.2.3 Buyers bargaining power
When determining the bargaining power of the buyers, three factors are important to analyze. Obviously
the size of the customer is important, as size matters. Secondly, the proportion of the total sale that the
customer makes up is another important factor. And finally the possibilities for the customer to substitute
to other suppliers may impact the bargaining power.
The two main customer groups in the airline industry are the leisure and the business segment. The leisure
segment do possess very good possibilities in terms of substitution options, as search engines such as
momondo.dk or farecompare.com have made it very easy and fast to scan the market for cheaper and
better options, and thereby in less than five minutes being able to find the cheapest tickets in the market.
However, the size of the individual leisure customers and their proportion of the total sale are negligible
and thereby they do not possess any kind of bargaining power. Furthermore, airline companies do usually
months before plan the expected number of passengers, in order to optimize the load factor.
Consequently, as empty seats are rarely occurring, it is difficult for leisure travelers to negotiate in terms of
the price, as supply is fixed and cannot be increased in the short term.
Compared to the leisure segment the business travelers do have more to say in terms of the bargaining
power. In big fortune 500 companies for example, with travelling expenses of millions of dollars each year,
the bargaining power would, ceteris paribus, be higher than smaller customers, on routes with several
airline companies. On smaller routes with only one airline operator having a monopoly, the customer will
obviously find it difficult to start negotiating the price.
As SAS do a lot of effort in attracting business travelers, some could argue that they would be willing to
negotiating prices, as good longstanding relationships with big companies can be worth a lot.
However, as the price elasticity on business travelers is assumed to be less than for the leisure segment,
indicating less sensitivity to price fluctuations, business travelers being in a co-operation agreement with an
airline company, would in general have fewer incitements to shift due to price increases. However,
business travelers not engaged in an agreement would probably, as in the case with the leisure travelers,
use search engines to match their needs.
3.2.4 Suppliers bargaining power
The airline industry has several types of suppliers. In this section the three most important suppliers to the
industry are analyzed, which are: The airports, the aircraft manufactures and the labor unions which acts as
suppliers of employees.
Suppliers are in some cases trying to increase their profits by extracting profits from the industry by raising
selling prices of their products or reducing costs by lowering quality, unless suppliers are engaging in
relationships with the airline companies, which nothing is indicating though.
In Scandinavia a big part of the workers belong to labor unions. The main idea behind the labor unions is to
increase the power of the employees in terms of negotiating wages and other conditions of employment.
SAS employees are members of 34 different labor unions, as shown in figure 12. This makes it very
33
complicated to reach agreements, as employees and their unions have different interests and
requirements.
Figure 12: SAS Group’s labor union structure. Source: SAS AR 2010.
In 2010 the Swedish, Danish and Norwegian governments demanded cost reductions in the cabin and pilot
crew of SEK 500 million, in order to attend the SEK 5 billion issue of new shares. This caused tensions
between the labor unions, as Norwegian and Swedish unions accused the Danish for having too big
requirements in order to accept the cost-cutting plan. Such a situation was very difficult for SAS; as they
needed all labor unions to accept, in order for the agreement to go through. If SAS slacked off part of their
requirements towards one union, other unions might demand the same – therefore the number of unions
made the negotiations more complex, than if there had only been a few unions.
In November 2012, SAS had some very tough negotiations with the flight crew unions once again. This time
new cost-cutting agreements were necessary in order to obtain a SEK 3.5 billion government and bank loan,
which SAS needed to survive. SAS announced in the public, that without the unions entering into this
agreement, SAS would probably be facing a bankruptcy within days or weeks. Fortunately SAS managed to
get the necessary cost reductions.
Subsequent to the negotiations, several persons have questioned whether the risk of bankruptcy was
reliable or merely a media stunt. According to Jacob Pedersen, an equity analyst at Sydbank with focus on
the airline industry, SAS would have enough cash to stay alive for a few months (Flensburg & Fastrup, 16
November 2012). However, one thing is to calculate e.g. the cash burn rate6, and hence from that derive
the lifetime. Another factor is, if suppliers would start delivering only if paid by cash, or if customers would
leave SAS for other companies for fear of their tickets being worthless. Therefore the bankruptcy could
easily have been closer than what Jacob Pedersen states.
The above examples illustrate that the employees normally possess strong bargaining power due to labor
unions. However, the last couple of years, due to the financial crisis and strong competition from LCC’s, the
employers have had the advantage, and due to the financial turmoil have been able to bring a smoking gun
to the negotiation room every time.
The second important supplier is the airports. Airports are clearly a very central part of the airline
companies’ operations. Airports can in some areas operate under monopolistic market conditions due to
being the only operator in the area, and thereby be in a good position of charging over normal prices.
6 Cash burn rate is defined as: (Cash and cash equivalents + securities + receivables)/EBIT
34
However in 2009 a directive was adopted by the European Union which established a common framework
regulating the airport charges and the way they are set (Directive 2009/12/EC – EUR). This was mainly set in
order to avoid monopolistic price setting as the aviation industry is such a central part of the free
movement of e.g. labor in EU. Due to the regulations, the airports will not being regarded as a threat for
the airline industry in Europe.
Aircraft manufactures are the third important supplier to the airline industry. Globally there are two major
players, which are considered to be the only two being able to deliver to the airline industry. They are: The
American based Boeing and the European aircraft manufacturer, Airbus. These have been in an intense and
aggressively competition for many years, fighting to be the primary chosen supplier of airliners to the
industry.
In favor of high bargaining power for the suppliers are the fact that they are only two suppliers, that the
aircrafts are a necessity for the airline companies and the fact that there exist very high switching costs. The
switching costs are due to new technology etc. which may involve costs such as pilot and mechanic training
(Hoskisson et al., 2008). Furthermore, when SAS in 2011 announced that they were going to shift from
Boeing’s 737s model to Airbus’s A320neo, Boeing commercial airplanes president commented “There are
very high costs of switching…I really don’t think we are going to see many customers really thinking about
switching to a different type of airplane any time soon.”(Rothman & Tan, 7 June, 2011).
Despite the above factors, which should result in high bargaining power from the suppliers, Airbus and
Boeing continue their intense competition, which is in favor of the airline industry. Therefore the
bargaining power is estimated to be medium.
3.2.5 The competition in the industry
The market concentration is a function of the number of players and their respective proportion of the
total market output. As a consequence: the fewer market players there are on a given market and the more
different their proportion of the total market is, the more concentrated is the market. If a market is
characterized by being very concentrated, it usually means that there is very little competition. The most
extreme example is the monopoly with only one market player having 100 % of the market. In this situation
there is zero competition from other players.
A good and easy applicable tool of measuring the market concentration is the Herfindahl-Hirschman Index
(HHI) (Hansen et el., 2006). The index ranges from 1-10,000. It is based on the respective market shares of
the players, which are not only added together; they are squared at first. By squaring them, the index
distributes high values to industries with a very unequal distribution of market share and thereby possibility
of domination.
As illustrated in the figures 13 and 14, industries with monopoly will have a HHI-value of 10,000, and in an
industry with 2 competitors with equal market shares for example the HHI-value will be 5,000.
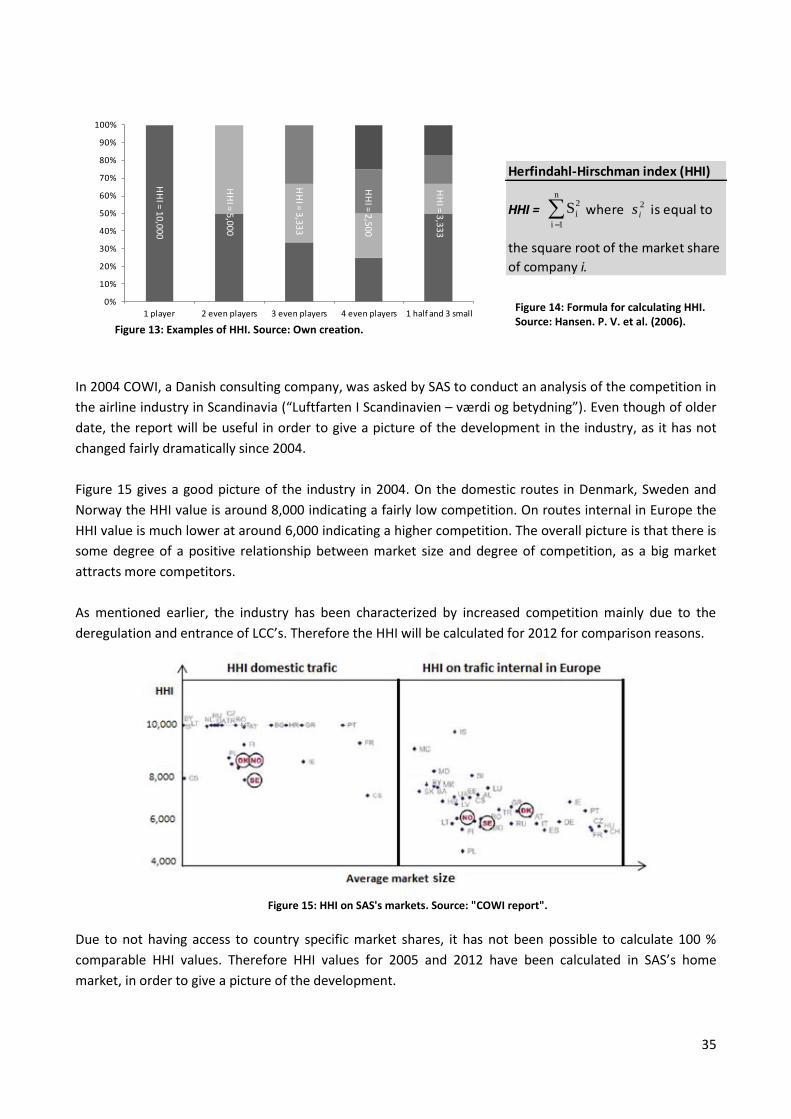
35
Herfindahl-Hirschman index (HHI)
HHI = where is equal to
the square root of the market share
of company i.
n
1 i
2
iS 2
is
0%
10%
20%
30%
40%
50%
60%
70%
80%
90%
100%
1 player 2 even players 3 even players 4 even players 1 half and 3 small
HH
I = 10,000
HH
I = 5,000
HH
I = 3,333
HH
I = 2,5
00
HH
I = 3,3
33
In 2004 COWI, a Danish consulting company, was asked by SAS to conduct an analysis of the competition in
the airline industry in Scandinavia (“Luftfarten I Scandinavien – værdi og betydning”). Even though of older
date, the report will be useful in order to give a picture of the development in the industry, as it has not
changed fairly dramatically since 2004.
Figure 15 gives a good picture of the industry in 2004. On the domestic routes in Denmark, Sweden and
Norway the HHI value is around 8,000 indicating a fairly low competition. On routes internal in Europe the
HHI value is much lower at around 6,000 indicating a higher competition. The overall picture is that there is
some degree of a positive relationship between market size and degree of competition, as a big market
attracts more competitors.
As mentioned earlier, the industry has been characterized by increased competition mainly due to the
deregulation and entrance of LCC’s. Therefore the HHI will be calculated for 2012 for comparison reasons.
Figure 15: HHI on SAS's markets. Source: "COWI report".
Due to not having access to country specific market shares, it has not been possible to calculate 100 %
comparable HHI values. Therefore HHI values for 2005 and 2012 have been calculated in SAS’s home
market, in order to give a picture of the development.
Figure 14: Formula for calculating HHI. Source: Hansen. P. V. et al. (2006).
Figure 13: Examples of HHI. Source: Own creation.
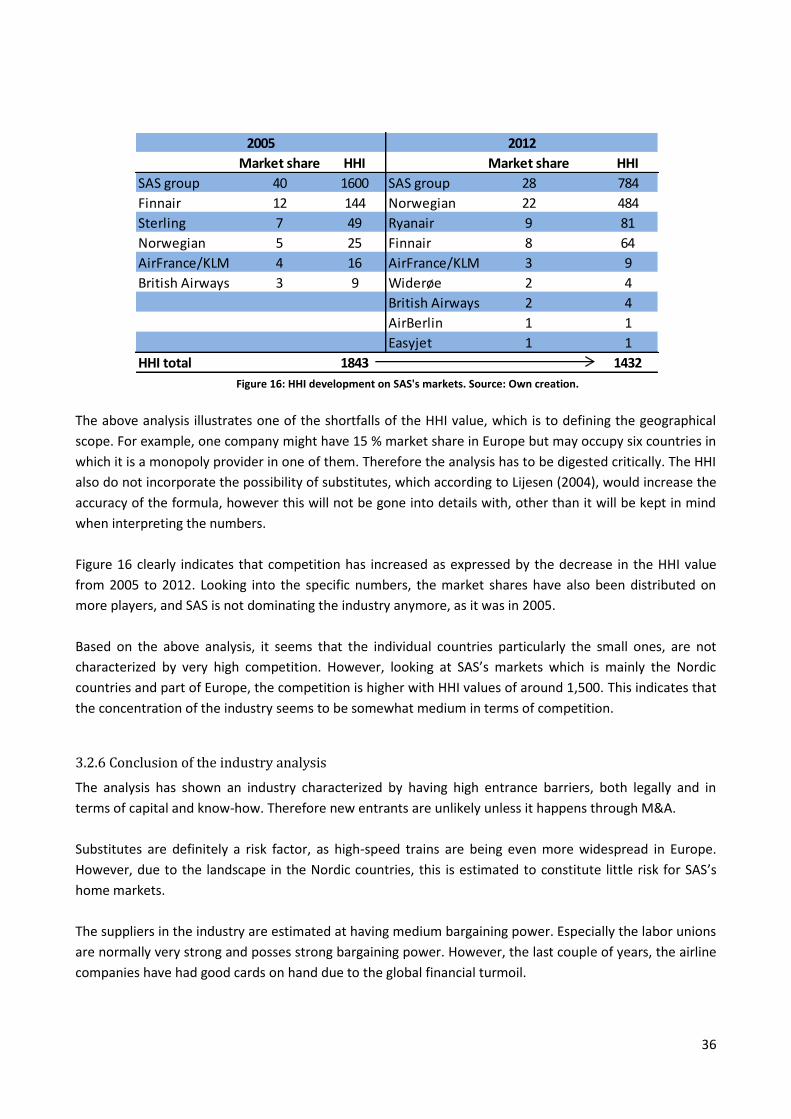
36
Figure 16: HHI development on SAS's markets. Source: Own creation.
The above analysis illustrates one of the shortfalls of the HHI value, which is to defining the geographical
scope. For example, one company might have 15 % market share in Europe but may occupy six countries in
which it is a monopoly provider in one of them. Therefore the analysis has to be digested critically. The HHI
also do not incorporate the possibility of substitutes, which according to Lijesen (2004), would increase the
accuracy of the formula, however this will not be gone into details with, other than it will be kept in mind
when interpreting the numbers.
Figure 16 clearly indicates that competition has increased as expressed by the decrease in the HHI value
from 2005 to 2012. Looking into the specific numbers, the market shares have also been distributed on
more players, and SAS is not dominating the industry anymore, as it was in 2005.
Based on the above analysis, it seems that the individual countries particularly the small ones, are not
characterized by very high competition. However, looking at SAS’s markets which is mainly the Nordic
countries and part of Europe, the competition is higher with HHI values of around 1,500. This indicates that
the concentration of the industry seems to be somewhat medium in terms of competition.
3.2.6 Conclusion of the industry analysis
The analysis has shown an industry characterized by having high entrance barriers, both legally and in
terms of capital and know-how. Therefore new entrants are unlikely unless it happens through M&A.
Substitutes are definitely a risk factor, as high-speed trains are being even more widespread in Europe.
However, due to the landscape in the Nordic countries, this is estimated to constitute little risk for SAS’s
home markets.
The suppliers in the industry are estimated at having medium bargaining power. Especially the labor unions
are normally very strong and posses strong bargaining power. However, the last couple of years, the airline
companies have had good cards on hand due to the global financial turmoil.
Market share HHI Market share HHI
SAS group 40 1600 SAS group 28 784
Finnair 12 144 Norwegian 22 484
Sterling 7 49 Ryanair 9 81
Norwegian 5 25 Finnair 8 64
AirFrance/KLM 4 16 AirFrance/KLM 3 9
British Airways 3 9 Widerøe 2 4
British Airways 2 4
AirBerlin 1 1
Easyjet 1 1
HHI total 1843 1432
2005 2012
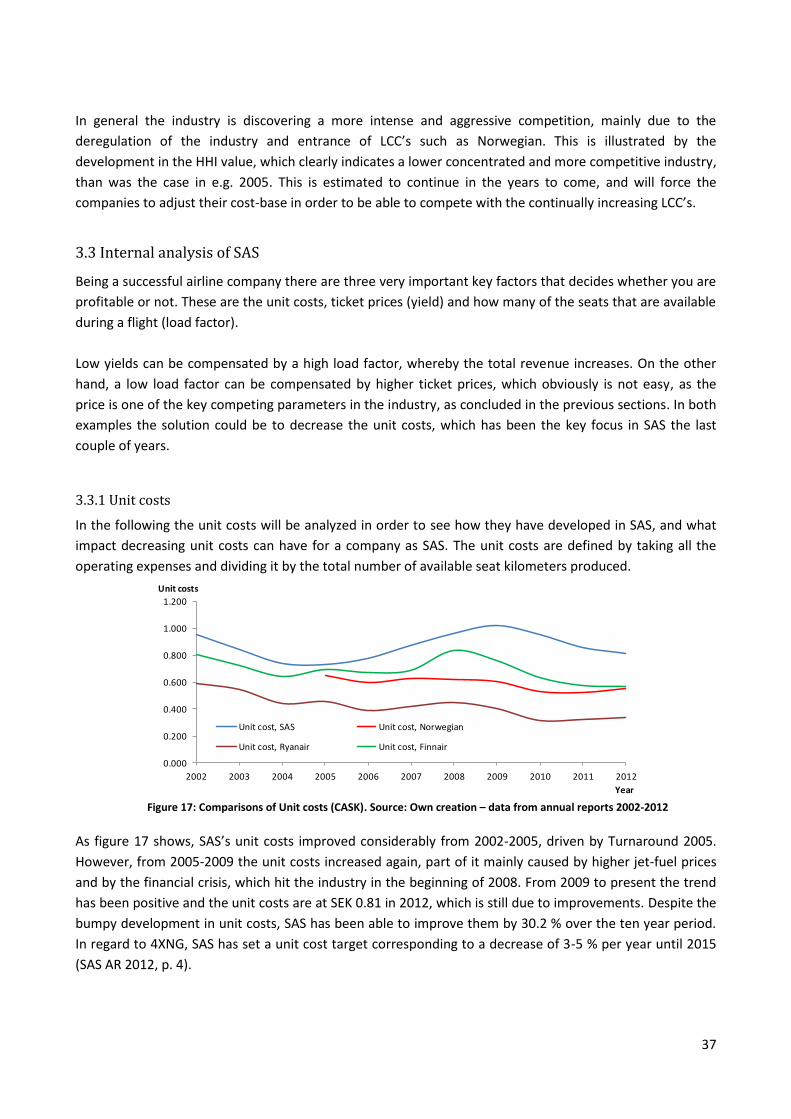
37
In general the industry is discovering a more intense and aggressive competition, mainly due to the
deregulation of the industry and entrance of LCC’s such as Norwegian. This is illustrated by the
development in the HHI value, which clearly indicates a lower concentrated and more competitive industry,
than was the case in e.g. 2005. This is estimated to continue in the years to come, and will force the
companies to adjust their cost-base in order to be able to compete with the continually increasing LCC’s.
3.3 Internal analysis of SAS
Being a successful airline company there are three very important key factors that decides whether you are
profitable or not. These are the unit costs, ticket prices (yield) and how many of the seats that are available
during a flight (load factor).
Low yields can be compensated by a high load factor, whereby the total revenue increases. On the other
hand, a low load factor can be compensated by higher ticket prices, which obviously is not easy, as the
price is one of the key competing parameters in the industry, as concluded in the previous sections. In both
examples the solution could be to decrease the unit costs, which has been the key focus in SAS the last
couple of years.
3.3.1 Unit costs
In the following the unit costs will be analyzed in order to see how they have developed in SAS, and what
impact decreasing unit costs can have for a company as SAS. The unit costs are defined by taking all the
operating expenses and dividing it by the total number of available seat kilometers produced.
Figure 17: Comparisons of Unit costs (CASK). Source: Own creation – data from annual reports 2002-2012
As figure 17 shows, SAS’s unit costs improved considerably from 2002-2005, driven by Turnaround 2005.
However, from 2005-2009 the unit costs increased again, part of it mainly caused by higher jet-fuel prices
and by the financial crisis, which hit the industry in the beginning of 2008. From 2009 to present the trend
has been positive and the unit costs are at SEK 0.81 in 2012, which is still due to improvements. Despite the
bumpy development in unit costs, SAS has been able to improve them by 30.2 % over the ten year period.
In regard to 4XNG, SAS has set a unit cost target corresponding to a decrease of 3-5 % per year until 2015
(SAS AR 2012, p. 4).
0.000
0.200
0.400
0.600
0.800
1.000
1.200
2002 2003 2004 2005 2006 2007 2008 2009 2010 2011 2012
Year
Unit cost, SAS Unit cost, Norwegian
Unit cost, Ryanair Unit cost, Finnair
Unit costs
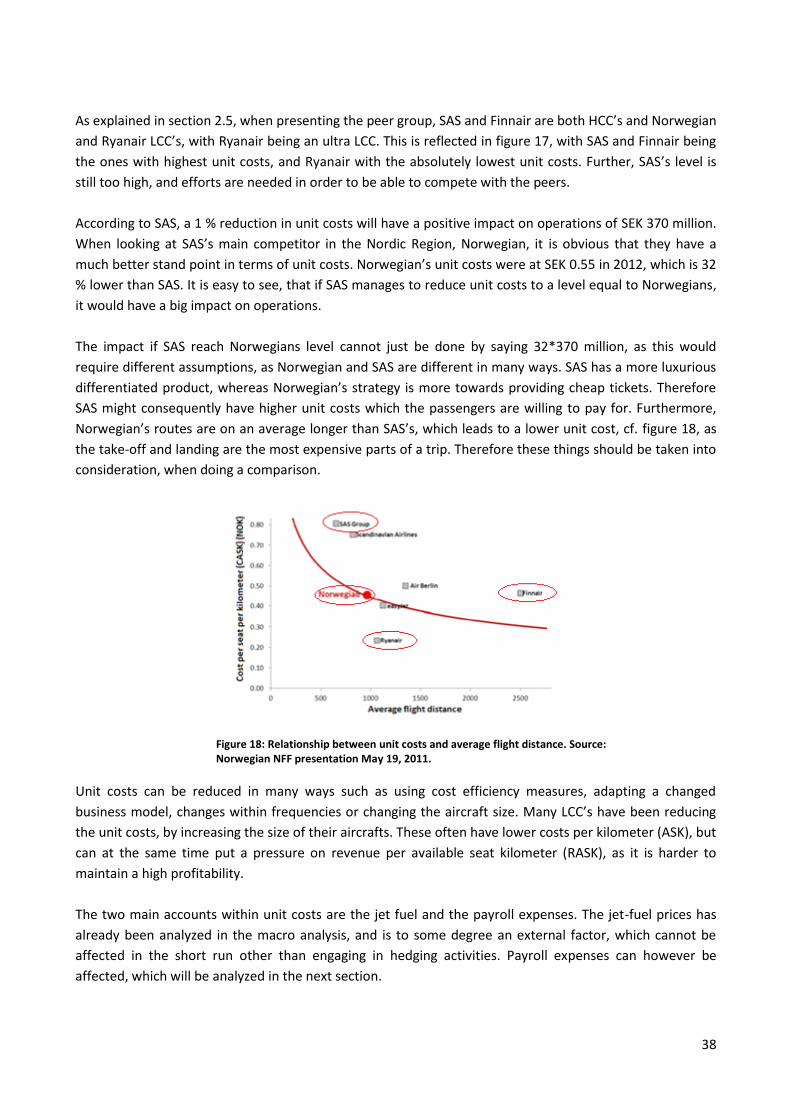
38
As explained in section 2.5, when presenting the peer group, SAS and Finnair are both HCC’s and Norwegian
and Ryanair LCC’s, with Ryanair being an ultra LCC. This is reflected in figure 17, with SAS and Finnair being
the ones with highest unit costs, and Ryanair with the absolutely lowest unit costs. Further, SAS’s level is
still too high, and efforts are needed in order to be able to compete with the peers.
According to SAS, a 1 % reduction in unit costs will have a positive impact on operations of SEK 370 million.
When looking at SAS’s main competitor in the Nordic Region, Norwegian, it is obvious that they have a
much better stand point in terms of unit costs. Norwegian’s unit costs were at SEK 0.55 in 2012, which is 32
% lower than SAS. It is easy to see, that if SAS manages to reduce unit costs to a level equal to Norwegians,
it would have a big impact on operations.
The impact if SAS reach Norwegians level cannot just be done by saying 32*370 million, as this would
require different assumptions, as Norwegian and SAS are different in many ways. SAS has a more luxurious
differentiated product, whereas Norwegian’s strategy is more towards providing cheap tickets. Therefore
SAS might consequently have higher unit costs which the passengers are willing to pay for. Furthermore,
Norwegian’s routes are on an average longer than SAS’s, which leads to a lower unit cost, cf. figure 18, as
the take-off and landing are the most expensive parts of a trip. Therefore these things should be taken into
consideration, when doing a comparison.
Unit costs can be reduced in many ways such as using cost efficiency measures, adapting a changed
business model, changes within frequencies or changing the aircraft size. Many LCC’s have been reducing
the unit costs, by increasing the size of their aircrafts. These often have lower costs per kilometer (ASK), but
can at the same time put a pressure on revenue per available seat kilometer (RASK), as it is harder to
maintain a high profitability.
The two main accounts within unit costs are the jet fuel and the payroll expenses. The jet-fuel prices has
already been analyzed in the macro analysis, and is to some degree an external factor, which cannot be
affected in the short run other than engaging in hedging activities. Payroll expenses can however be
affected, which will be analyzed in the next section.
Figure 18: Relationship between unit costs and average flight distance. Source: Norwegian NFF presentation May 19, 2011.
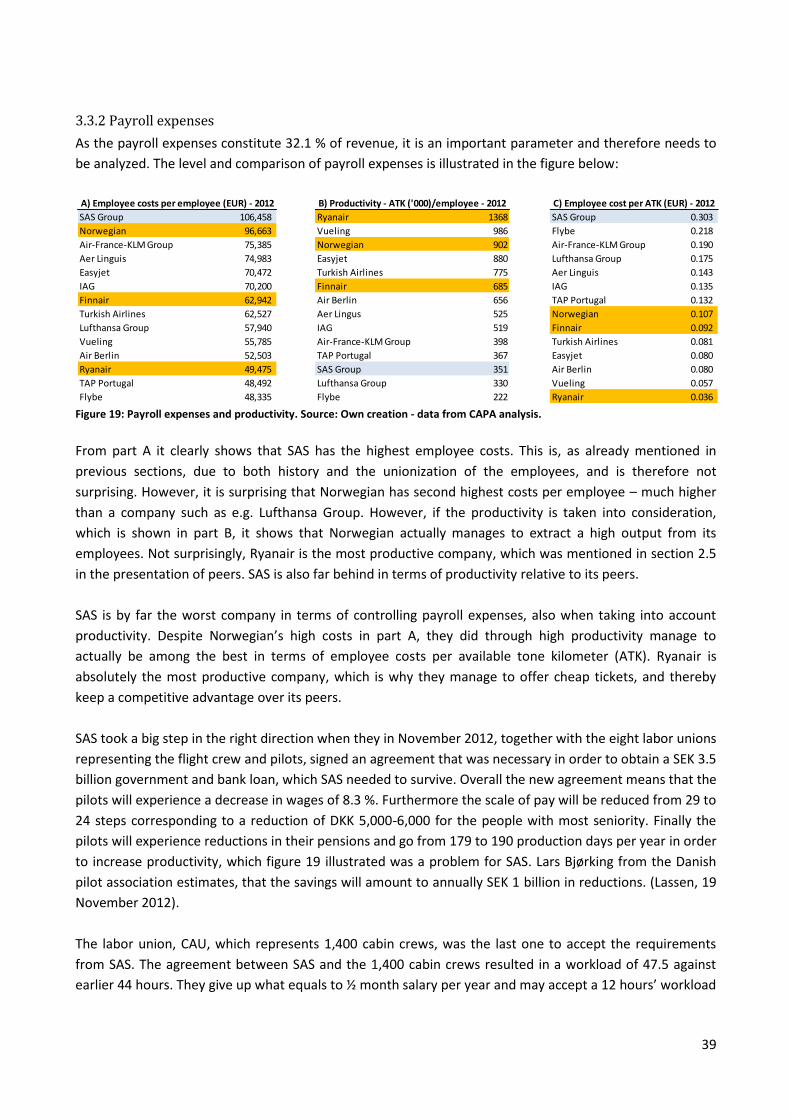
39
3.3.2 Payroll expenses
As the payroll expenses constitute 32.1 % of revenue, it is an important parameter and therefore needs to
be analyzed. The level and comparison of payroll expenses is illustrated in the figure below:
Figure 19: Payroll expenses and productivity. Source: Own creation - data from CAPA analysis.
From part A it clearly shows that SAS has the highest employee costs. This is, as already mentioned in
previous sections, due to both history and the unionization of the employees, and is therefore not
surprising. However, it is surprising that Norwegian has second highest costs per employee – much higher
than a company such as e.g. Lufthansa Group. However, if the productivity is taken into consideration,
which is shown in part B, it shows that Norwegian actually manages to extract a high output from its
employees. Not surprisingly, Ryanair is the most productive company, which was mentioned in section 2.5
in the presentation of peers. SAS is also far behind in terms of productivity relative to its peers.
SAS is by far the worst company in terms of controlling payroll expenses, also when taking into account
productivity. Despite Norwegian’s high costs in part A, they did through high productivity manage to
actually be among the best in terms of employee costs per available tone kilometer (ATK). Ryanair is
absolutely the most productive company, which is why they manage to offer cheap tickets, and thereby
keep a competitive advantage over its peers.
SAS took a big step in the right direction when they in November 2012, together with the eight labor unions
representing the flight crew and pilots, signed an agreement that was necessary in order to obtain a SEK 3.5
billion government and bank loan, which SAS needed to survive. Overall the new agreement means that the
pilots will experience a decrease in wages of 8.3 %. Furthermore the scale of pay will be reduced from 29 to
24 steps corresponding to a reduction of DKK 5,000-6,000 for the people with most seniority. Finally the
pilots will experience reductions in their pensions and go from 179 to 190 production days per year in order
to increase productivity, which figure 19 illustrated was a problem for SAS. Lars Bjørking from the Danish
pilot association estimates, that the savings will amount to annually SEK 1 billion in reductions. (Lassen, 19
November 2012).
The labor union, CAU, which represents 1,400 cabin crews, was the last one to accept the requirements
from SAS. The agreement between SAS and the 1,400 cabin crews resulted in a workload of 47.5 against
earlier 44 hours. They give up what equals to ½ month salary per year and may accept a 12 hours’ workload
SAS Group 106,458 Ryanair 1368 SAS Group 0.303
Norwegian 96,663 Vueling 986 Flybe 0.218
Air-France-KLM Group 75,385 Norwegian 902 Air-France-KLM Group 0.190
Aer Linguis 74,983 Easyjet 880 Lufthansa Group 0.175
Easyjet 70,472 Turkish Airlines 775 Aer Linguis 0.143
IAG 70,200 Finnair 685 IAG 0.135
Finnair 62,942 Air Berlin 656 TAP Portugal 0.132
Turkish Airlines 62,527 Aer Lingus 525 Norwegian 0.107
Lufthansa Group 57,940 IAG 519 Finnair 0.092
Vueling 55,785 Air-France-KLM Group 398 Turkish Airlines 0.081
Air Berlin 52,503 TAP Portugal 367 Easyjet 0.080
Ryanair 49,475 SAS Group 351 Air Berlin 0.080
TAP Portugal 48,492 Lufthansa Group 330 Vueling 0.057
Flybe 48,335 Flybe 222 Ryanair 0.036
A) Employee costs per employee (EUR) - 2012 B) Productivity - ATK ('000)/employee - 2012 C) Employee cost per ATK (EUR) - 2012
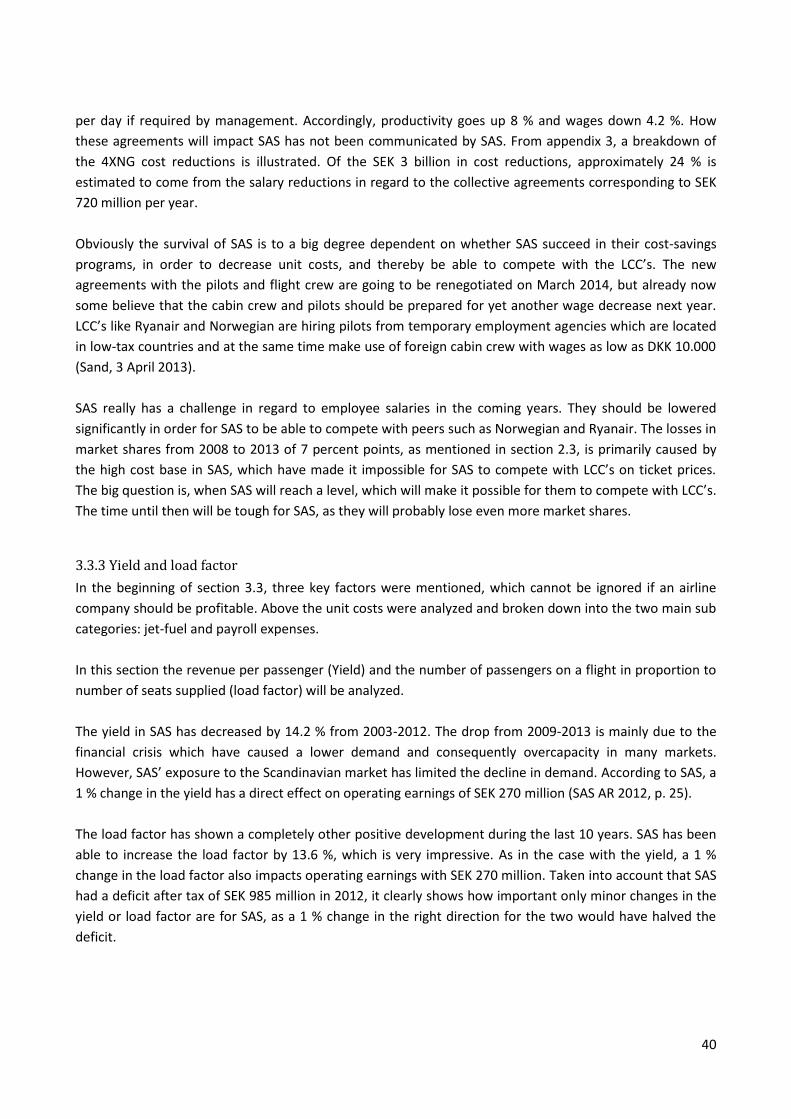
40
per day if required by management. Accordingly, productivity goes up 8 % and wages down 4.2 %. How
these agreements will impact SAS has not been communicated by SAS. From appendix 3, a breakdown of
the 4XNG cost reductions is illustrated. Of the SEK 3 billion in cost reductions, approximately 24 % is
estimated to come from the salary reductions in regard to the collective agreements corresponding to SEK
720 million per year.
Obviously the survival of SAS is to a big degree dependent on whether SAS succeed in their cost-savings
programs, in order to decrease unit costs, and thereby be able to compete with the LCC’s. The new
agreements with the pilots and flight crew are going to be renegotiated on March 2014, but already now
some believe that the cabin crew and pilots should be prepared for yet another wage decrease next year.
LCC’s like Ryanair and Norwegian are hiring pilots from temporary employment agencies which are located
in low-tax countries and at the same time make use of foreign cabin crew with wages as low as DKK 10.000
(Sand, 3 April 2013).
SAS really has a challenge in regard to employee salaries in the coming years. They should be lowered
significantly in order for SAS to be able to compete with peers such as Norwegian and Ryanair. The losses in
market shares from 2008 to 2013 of 7 percent points, as mentioned in section 2.3, is primarily caused by
the high cost base in SAS, which have made it impossible for SAS to compete with LCC’s on ticket prices.
The big question is, when SAS will reach a level, which will make it possible for them to compete with LCC’s.
The time until then will be tough for SAS, as they will probably lose even more market shares.
3.3.3 Yield and load factor
In the beginning of section 3.3, three key factors were mentioned, which cannot be ignored if an airline
company should be profitable. Above the unit costs were analyzed and broken down into the two main sub
categories: jet-fuel and payroll expenses.
In this section the revenue per passenger (Yield) and the number of passengers on a flight in proportion to
number of seats supplied (load factor) will be analyzed.
The yield in SAS has decreased by 14.2 % from 2003-2012. The drop from 2009-2013 is mainly due to the
financial crisis which have caused a lower demand and consequently overcapacity in many markets.
However, SAS’ exposure to the Scandinavian market has limited the decline in demand. According to SAS, a
1 % change in the yield has a direct effect on operating earnings of SEK 270 million (SAS AR 2012, p. 25).
The load factor has shown a completely other positive development during the last 10 years. SAS has been
able to increase the load factor by 13.6 %, which is very impressive. As in the case with the yield, a 1 %
change in the load factor also impacts operating earnings with SEK 270 million. Taken into account that SAS
had a deficit after tax of SEK 985 million in 2012, it clearly shows how important only minor changes in the
yield or load factor are for SAS, as a 1 % change in the right direction for the two would have halved the
deficit.
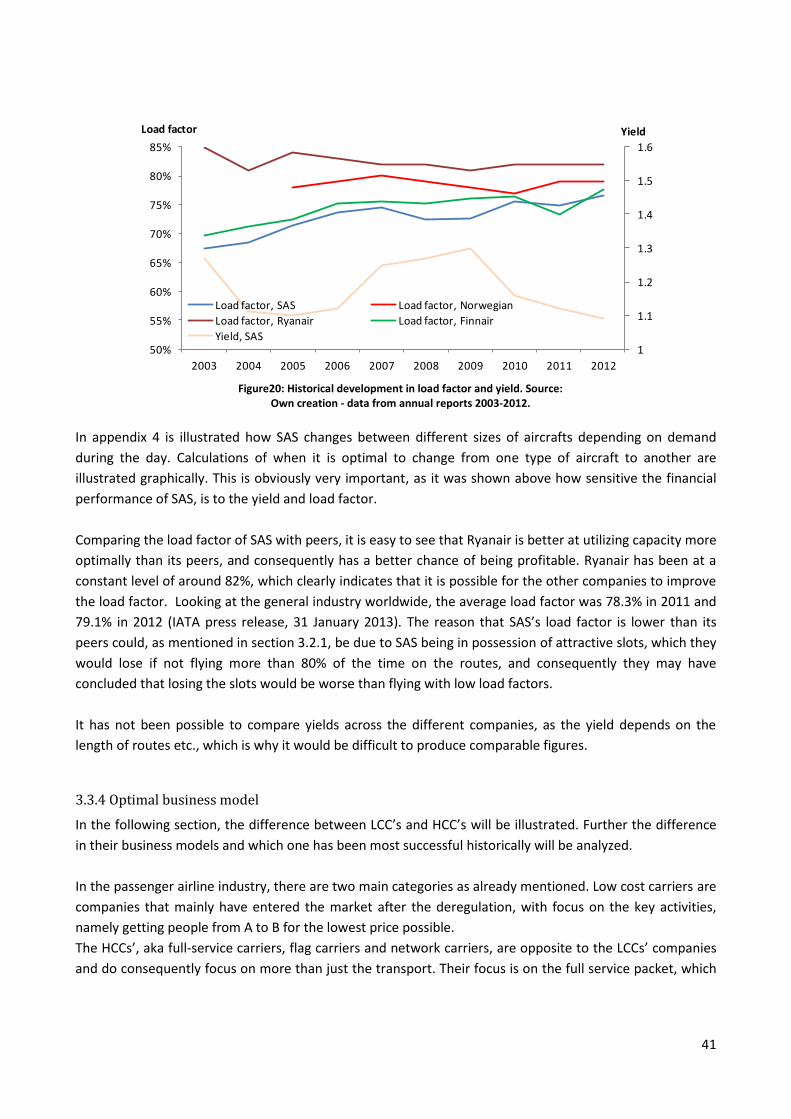
41
Figure20: Historical development in load factor and yield. Source:
Own creation - data from annual reports 2003-2012.
In appendix 4 is illustrated how SAS changes between different sizes of aircrafts depending on demand
during the day. Calculations of when it is optimal to change from one type of aircraft to another are
illustrated graphically. This is obviously very important, as it was shown above how sensitive the financial
performance of SAS, is to the yield and load factor.
Comparing the load factor of SAS with peers, it is easy to see that Ryanair is better at utilizing capacity more
optimally than its peers, and consequently has a better chance of being profitable. Ryanair has been at a
constant level of around 82%, which clearly indicates that it is possible for the other companies to improve
the load factor. Looking at the general industry worldwide, the average load factor was 78.3% in 2011 and
79.1% in 2012 (IATA press release, 31 January 2013). The reason that SAS’s load factor is lower than its
peers could, as mentioned in section 3.2.1, be due to SAS being in possession of attractive slots, which they
would lose if not flying more than 80% of the time on the routes, and consequently they may have
concluded that losing the slots would be worse than flying with low load factors.
It has not been possible to compare yields across the different companies, as the yield depends on the
length of routes etc., which is why it would be difficult to produce comparable figures.
3.3.4 Optimal business model
In the following section, the difference between LCC’s and HCC’s will be illustrated. Further the difference
in their business models and which one has been most successful historically will be analyzed.
In the passenger airline industry, there are two main categories as already mentioned. Low cost carriers are
companies that mainly have entered the market after the deregulation, with focus on the key activities,
namely getting people from A to B for the lowest price possible.
The HCCs’, aka full-service carriers, flag carriers and network carriers, are opposite to the LCCs’ companies
and do consequently focus on more than just the transport. Their focus is on the full service packet, which
1
1.1
1.2
1.3
1.4
1.5
1.6
50%
55%
60%
65%
70%
75%
80%
85%
2003 2004 2005 2006 2007 2008 2009 2010 2011 2012
YieldLoad factor
Load factor, SAS Load factor, Norwegian
Load factor, Ryanair Load factor, Finnair
Yield, SAS
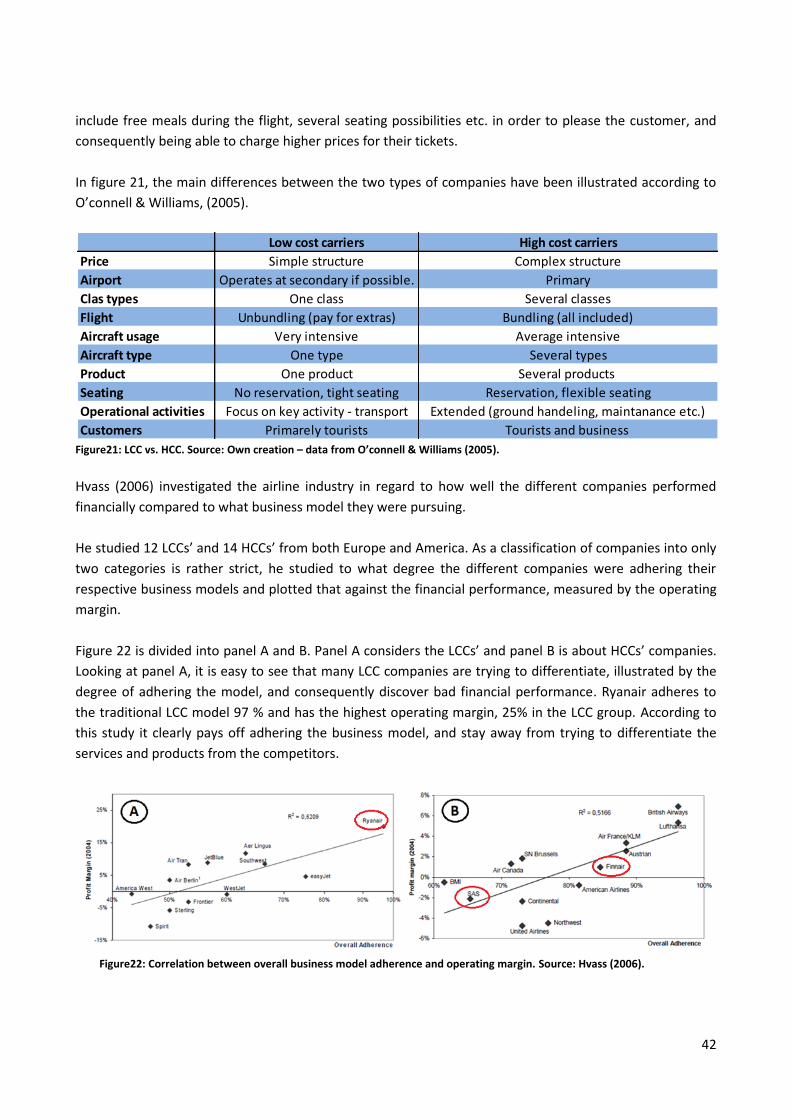
42
include free meals during the flight, several seating possibilities etc. in order to please the customer, and
consequently being able to charge higher prices for their tickets.
In figure 21, the main differences between the two types of companies have been illustrated according to
O’connell & Williams, (2005).
Figure21: LCC vs. HCC. Source: Own creation – data from O’connell & Williams (2005).
Hvass (2006) investigated the airline industry in regard to how well the different companies performed
financially compared to what business model they were pursuing.
He studied 12 LCCs’ and 14 HCCs’ from both Europe and America. As a classification of companies into only
two categories is rather strict, he studied to what degree the different companies were adhering their
respective business models and plotted that against the financial performance, measured by the operating
margin.
Figure 22 is divided into panel A and B. Panel A considers the LCCs’ and panel B is about HCCs’ companies.
Looking at panel A, it is easy to see that many LCC companies are trying to differentiate, illustrated by the
degree of adhering the model, and consequently discover bad financial performance. Ryanair adheres to
the traditional LCC model 97 % and has the highest operating margin, 25% in the LCC group. According to
this study it clearly pays off adhering the business model, and stay away from trying to differentiate the
services and products from the competitors.
Figure22: Correlation between overall business model adherence and operating margin. Source: Hvass (2006).
Low cost carriers High cost carriers
Price Simple structure Complex structure
Airport Operates at secondary if possible. Primary
Clas types One class Several classes
Flight Unbundling (pay for extras) Bundling (all included)
Aircraft usage Very intensive Average intensive
Aircraft type One type Several types
Product One product Several products
Seating No reservation, tight seating Reservation, flexible seating
Operational activities Focus on key activity - transport Extended (ground handeling, maintanance etc.)
Customers Primarely tourists Tourists and business
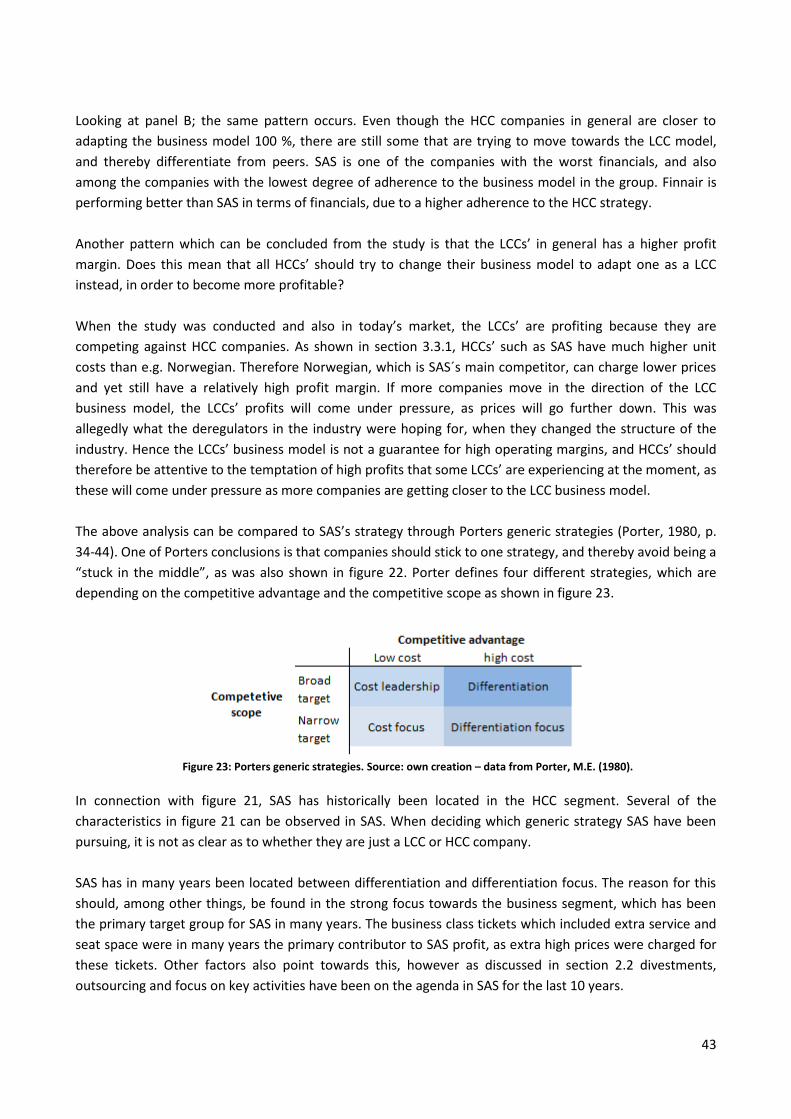
43
Looking at panel B; the same pattern occurs. Even though the HCC companies in general are closer to
adapting the business model 100 %, there are still some that are trying to move towards the LCC model,
and thereby differentiate from peers. SAS is one of the companies with the worst financials, and also
among the companies with the lowest degree of adherence to the business model in the group. Finnair is
performing better than SAS in terms of financials, due to a higher adherence to the HCC strategy.
Another pattern which can be concluded from the study is that the LCCs’ in general has a higher profit
margin. Does this mean that all HCCs’ should try to change their business model to adapt one as a LCC
instead, in order to become more profitable?
When the study was conducted and also in today’s market, the LCCs’ are profiting because they are
competing against HCC companies. As shown in section 3.3.1, HCCs’ such as SAS have much higher unit
costs than e.g. Norwegian. Therefore Norwegian, which is SAS´s main competitor, can charge lower prices
and yet still have a relatively high profit margin. If more companies move in the direction of the LCC
business model, the LCCs’ profits will come under pressure, as prices will go further down. This was
allegedly what the deregulators in the industry were hoping for, when they changed the structure of the
industry. Hence the LCCs’ business model is not a guarantee for high operating margins, and HCCs’ should
therefore be attentive to the temptation of high profits that some LCCs’ are experiencing at the moment, as
these will come under pressure as more companies are getting closer to the LCC business model.
The above analysis can be compared to SAS’s strategy through Porters generic strategies (Porter, 1980, p.
34-44). One of Porters conclusions is that companies should stick to one strategy, and thereby avoid being a
“stuck in the middle”, as was also shown in figure 22. Porter defines four different strategies, which are
depending on the competitive advantage and the competitive scope as shown in figure 23.
Figure 23: Porters generic strategies. Source: own creation – data from Porter, M.E. (1980).
In connection with figure 21, SAS has historically been located in the HCC segment. Several of the
characteristics in figure 21 can be observed in SAS. When deciding which generic strategy SAS have been
pursuing, it is not as clear as to whether they are just a LCC or HCC company.
SAS has in many years been located between differentiation and differentiation focus. The reason for this
should, among other things, be found in the strong focus towards the business segment, which has been
the primary target group for SAS in many years. The business class tickets which included extra service and
seat space were in many years the primary contributor to SAS profit, as extra high prices were charged for
these tickets. Other factors also point towards this, however as discussed in section 2.2 divestments,
outsourcing and focus on key activities have been on the agenda in SAS for the last 10 years.
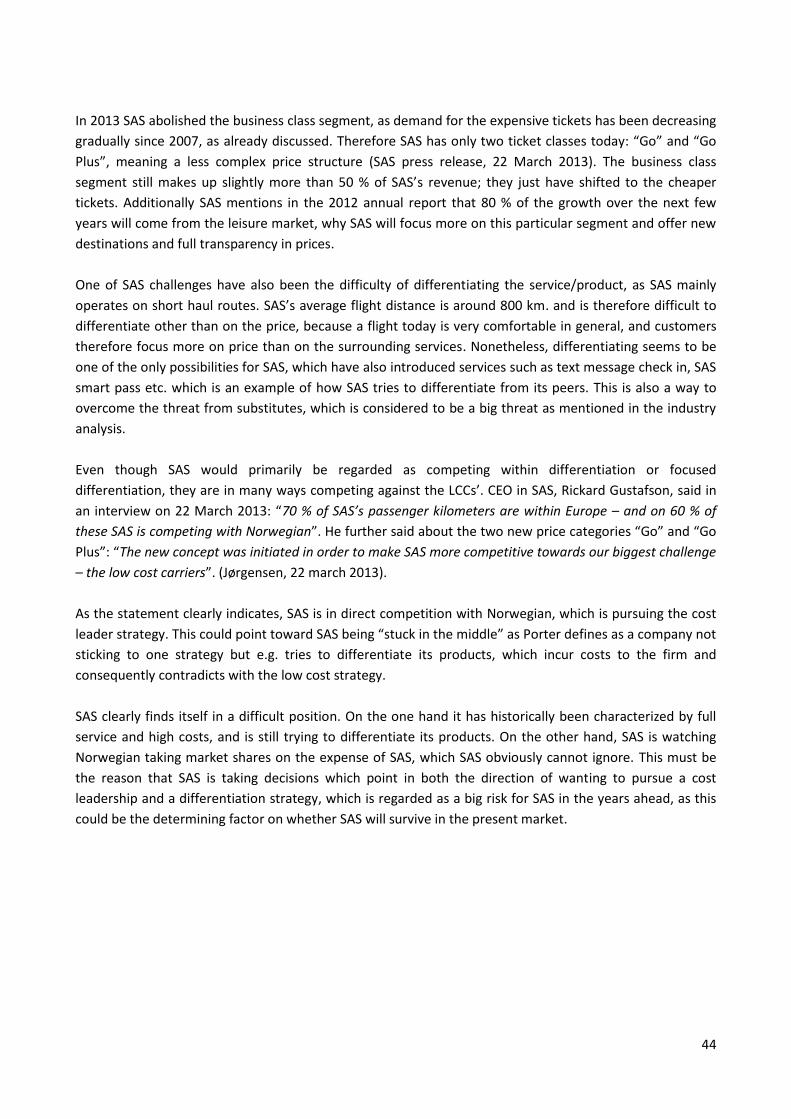
44
In 2013 SAS abolished the business class segment, as demand for the expensive tickets has been decreasing
gradually since 2007, as already discussed. Therefore SAS has only two ticket classes today: “Go” and “Go
Plus”, meaning a less complex price structure (SAS press release, 22 March 2013). The business class
segment still makes up slightly more than 50 % of SAS’s revenue; they just have shifted to the cheaper
tickets. Additionally SAS mentions in the 2012 annual report that 80 % of the growth over the next few
years will come from the leisure market, why SAS will focus more on this particular segment and offer new
destinations and full transparency in prices.
One of SAS challenges have also been the difficulty of differentiating the service/product, as SAS mainly
operates on short haul routes. SAS’s average flight distance is around 800 km. and is therefore difficult to
differentiate other than on the price, because a flight today is very comfortable in general, and customers
therefore focus more on price than on the surrounding services. Nonetheless, differentiating seems to be
one of the only possibilities for SAS, which have also introduced services such as text message check in, SAS
smart pass etc. which is an example of how SAS tries to differentiate from its peers. This is also a way to
overcome the threat from substitutes, which is considered to be a big threat as mentioned in the industry
analysis.
Even though SAS would primarily be regarded as competing within differentiation or focused
differentiation, they are in many ways competing against the LCCs’. CEO in SAS, Rickard Gustafson, said in
an interview on 22 March 2013: “70 % of SAS’s passenger kilometers are within Europe – and on 60 % of
these SAS is competing with Norwegian”. He further said about the two new price categories “Go” and “Go
Plus”: “The new concept was initiated in order to make SAS more competitive towards our biggest challenge
– the low cost carriers”. (Jørgensen, 22 march 2013).
As the statement clearly indicates, SAS is in direct competition with Norwegian, which is pursuing the cost
leader strategy. This could point toward SAS being “stuck in the middle” as Porter defines as a company not
sticking to one strategy but e.g. tries to differentiate its products, which incur costs to the firm and
consequently contradicts with the low cost strategy.
SAS clearly finds itself in a difficult position. On the one hand it has historically been characterized by full
service and high costs, and is still trying to differentiate its products. On the other hand, SAS is watching
Norwegian taking market shares on the expense of SAS, which SAS obviously cannot ignore. This must be
the reason that SAS is taking decisions which point in both the direction of wanting to pursue a cost
leadership and a differentiation strategy, which is regarded as a big risk for SAS in the years ahead, as this
could be the determining factor on whether SAS will survive in the present market.
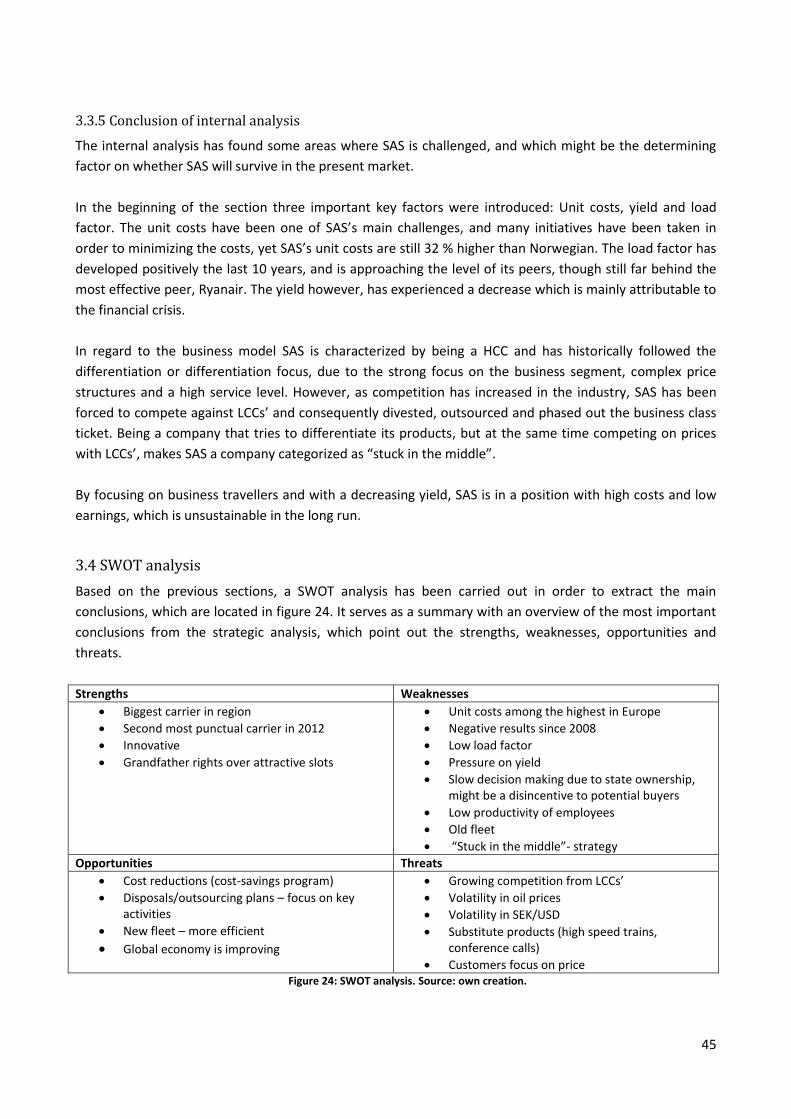
45
3.3.5 Conclusion of internal analysis
The internal analysis has found some areas where SAS is challenged, and which might be the determining
factor on whether SAS will survive in the present market.
In the beginning of the section three important key factors were introduced: Unit costs, yield and load
factor. The unit costs have been one of SAS’s main challenges, and many initiatives have been taken in
order to minimizing the costs, yet SAS’s unit costs are still 32 % higher than Norwegian. The load factor has
developed positively the last 10 years, and is approaching the level of its peers, though still far behind the
most effective peer, Ryanair. The yield however, has experienced a decrease which is mainly attributable to
the financial crisis.
In regard to the business model SAS is characterized by being a HCC and has historically followed the
differentiation or differentiation focus, due to the strong focus on the business segment, complex price
structures and a high service level. However, as competition has increased in the industry, SAS has been
forced to compete against LCCs’ and consequently divested, outsourced and phased out the business class
ticket. Being a company that tries to differentiate its products, but at the same time competing on prices
with LCCs’, makes SAS a company categorized as “stuck in the middle”.
By focusing on business travellers and with a decreasing yield, SAS is in a position with high costs and low
earnings, which is unsustainable in the long run.
3.4 SWOT analysis
Based on the previous sections, a SWOT analysis has been carried out in order to extract the main
conclusions, which are located in figure 24. It serves as a summary with an overview of the most important
conclusions from the strategic analysis, which point out the strengths, weaknesses, opportunities and
threats.
Strengths Weaknesses
Biggest carrier in region
Second most punctual carrier in 2012
Innovative
Grandfather rights over attractive slots
Unit costs among the highest in Europe
Negative results since 2008
Low load factor
Pressure on yield
Slow decision making due to state ownership, might be a disincentive to potential buyers
Low productivity of employees
Old fleet
“Stuck in the middle”- strategy
Opportunities Threats
Cost reductions (cost-savings program)
Disposals/outsourcing plans – focus on key activities
New fleet – more efficient
Global economy is improving
Growing competition from LCCs’
Volatility in oil prices
Volatility in SEK/USD
Substitute products (high speed trains, conference calls)
Customers focus on price Figure 24: SWOT analysis. Source: own creation.
46
A quick look at the SWOT matrix indicates that the right hand side dominates the picture, i.e. there are
more weaknesses and threats than strengths and opportunities. Clearly SAS has some strength, among the
most important are the grandfather rights, which was analyzed in the strategic analysis. This is an area
where the new LCCs’ has some difficulties in the competition with companies such as SAS. Further SAS is
among the most punctual companies in this region, which especially by the business segment, is considered
an important parameter.
The weaknesses make up a big proportion of the total bullet points in the SWOT matrix. Much time has
been spent on analyzing the unit costs, which is a vulnerable point in SAS. Since the monopoly times, SAS
has had too high costs, especially the payroll expenses, which they are still struggling on. Low productivity is
another important weakness. SAS employees are almost four times less productive than employees in
Ryanair, which obviously is not durable in the long run. The last important weakness is the strategy, which
was found to be “stuck in the middle”. SAS has not been able to find a clear strategy and most important,
not been able to show the customers which type of Airline Company SAS wants to be.
As cliché as is might sound, April showers bring about May flowers. If SAS succeed in decreasing unit costs
and get closer to peers, there might be hope for SAS. Further, a new fleet may lower the repair and fuel
costs, and consequently lead to lower ticket prices.
SAS has to be aware of the many threats though. LCCs’ are ready to capture market shares and substitutes
are high risk potentials, all the while price volatility on jet-fuel impose financial risk, due to the big
proportion fuel costs make up of revenue.
All together, SAS is faced with big challenges and different types of risks in the future, and will have to
succeed in cutting costs and improve profitability in order to be able to survive among the keen peers.
47
Part 4: Financial Statement Analysis
In the previous sections during the strategic analysis, the environment that SAS operates in was analyzed
both at a macro and industry level. Also an internal analysis was conducted, in order to see if SAS had a
competitive strategy and cost structure, in order to take up the increasing competition in the industry. The
strategic analysis does tell a lot about the expected future environment, which is necessary to know in
order to determine the earnings possibilities for SAS in the future.
In order to carry out the most accurate budget possible, an analysis of SAS’s historical financial
performance also needs to be prepared. This is important as the historical trend and level, also will serve as
an important parameter for the forecasting of future earnings. These findings obviously need to be
adjusted with the conclusions found in the strategic analysis, as the past does not tell much about the
future, and also because SAS are undergoing big internal changes at the moment. To facilitate the best
possible analysis of historical performance, a period of five years will be included in the analysis. That is, the
years 2008 to and including 2012 will be subject to the analysis.
4.1. Accounting policies
The annual report in SAS is reported in accordance with the International Financial Reporting Standards
(IFRS), and has been so since 2004.
The 2012 annual report has been audited by Deloitte AB who had no comments or corrections to the
report. This does not necessarily mean that it is 100 % correct, it merely means that the auditor in
collaboration with SAS, have estimated the report as giving a true and fair presentation of SAS’s
performance. In accordance to the accounting policies the auditor moreover vouch for, that the annual
report, according to his conviction, is reported according to the “going concern” principle, meaning that the
business will not experience the threat of liquidation within the next 12 months.
Based on the above, the SAS’s annual report is estimated at containing valid data, which will be used in the
following analysis and valuation.
4.2. SAS’s new calendar year – due to IAS 19?
At the 2012 annual general meeting, SAS decided to change the calendar year from January 1 - December
31 to November 1 - October 31, thereby shortening the 2012 financial year to only comprising the period
January 1 – October 31. According to SAS this has been done in order to align the fiscal year with SAS’s
operations, which is divided into two periods – summer and winter (SAS AR 2012, note 1).
Whether this is the main reason is hard to say. However, it is striking that it coincides with the changes in
IAS 19 regarding the defined benefit pension plans, which are supposed to be implemented from the fiscal
year beginning on or after January 1, 2013 (European Commission 2011).
SAS employees have been covered by a so called defined benefit pension, which is a pension plan that
promises a monthly benefit on retirement, which is predetermined based on the age, tenure, and wage
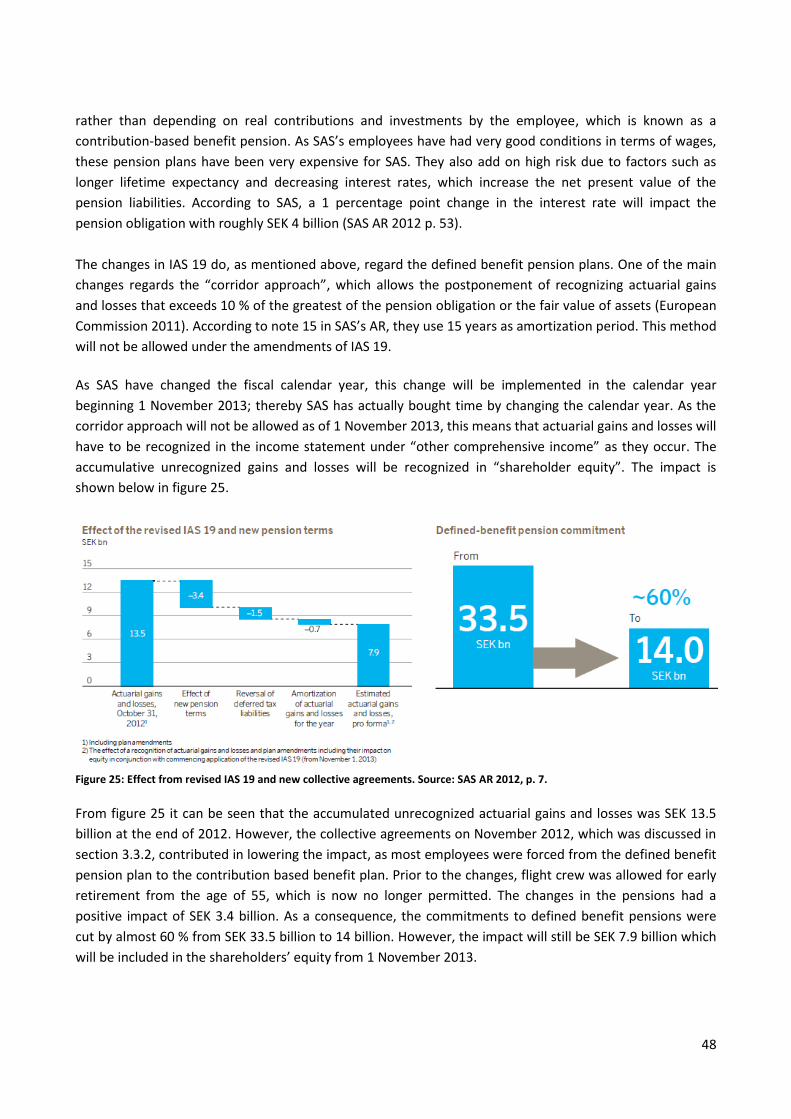
48
rather than depending on real contributions and investments by the employee, which is known as a
contribution-based benefit pension. As SAS’s employees have had very good conditions in terms of wages,
these pension plans have been very expensive for SAS. They also add on high risk due to factors such as
longer lifetime expectancy and decreasing interest rates, which increase the net present value of the
pension liabilities. According to SAS, a 1 percentage point change in the interest rate will impact the
pension obligation with roughly SEK 4 billion (SAS AR 2012 p. 53).
The changes in IAS 19 do, as mentioned above, regard the defined benefit pension plans. One of the main
changes regards the “corridor approach”, which allows the postponement of recognizing actuarial gains
and losses that exceeds 10 % of the greatest of the pension obligation or the fair value of assets (European
Commission 2011). According to note 15 in SAS’s AR, they use 15 years as amortization period. This method
will not be allowed under the amendments of IAS 19.
As SAS have changed the fiscal calendar year, this change will be implemented in the calendar year
beginning 1 November 2013; thereby SAS has actually bought time by changing the calendar year. As the
corridor approach will not be allowed as of 1 November 2013, this means that actuarial gains and losses will
have to be recognized in the income statement under “other comprehensive income” as they occur. The
accumulative unrecognized gains and losses will be recognized in “shareholder equity”. The impact is
shown below in figure 25.
Figure 25: Effect from revised IAS 19 and new collective agreements. Source: SAS AR 2012, p. 7.
From figure 25 it can be seen that the accumulated unrecognized actuarial gains and losses was SEK 13.5
billion at the end of 2012. However, the collective agreements on November 2012, which was discussed in
section 3.3.2, contributed in lowering the impact, as most employees were forced from the defined benefit
pension plan to the contribution based benefit plan. Prior to the changes, flight crew was allowed for early
retirement from the age of 55, which is now no longer permitted. The changes in the pensions had a
positive impact of SEK 3.4 billion. As a consequence, the commitments to defined benefit pensions were
cut by almost 60 % from SEK 33.5 billion to 14 billion. However, the impact will still be SEK 7.9 billion which
will be included in the shareholders’ equity from 1 November 2013.
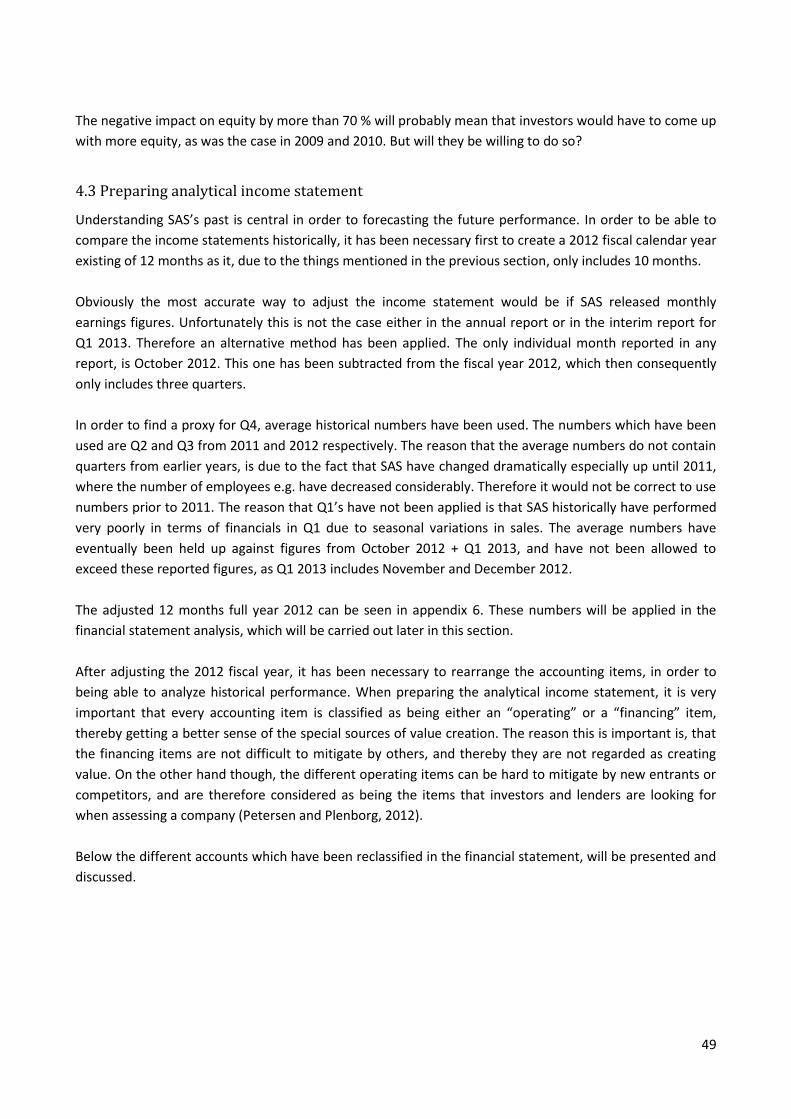
49
The negative impact on equity by more than 70 % will probably mean that investors would have to come up
with more equity, as was the case in 2009 and 2010. But will they be willing to do so?
4.3 Preparing analytical income statement
Understanding SAS’s past is central in order to forecasting the future performance. In order to be able to
compare the income statements historically, it has been necessary first to create a 2012 fiscal calendar year
existing of 12 months as it, due to the things mentioned in the previous section, only includes 10 months.
Obviously the most accurate way to adjust the income statement would be if SAS released monthly
earnings figures. Unfortunately this is not the case either in the annual report or in the interim report for
Q1 2013. Therefore an alternative method has been applied. The only individual month reported in any
report, is October 2012. This one has been subtracted from the fiscal year 2012, which then consequently
only includes three quarters.
In order to find a proxy for Q4, average historical numbers have been used. The numbers which have been
used are Q2 and Q3 from 2011 and 2012 respectively. The reason that the average numbers do not contain
quarters from earlier years, is due to the fact that SAS have changed dramatically especially up until 2011,
where the number of employees e.g. have decreased considerably. Therefore it would not be correct to use
numbers prior to 2011. The reason that Q1’s have not been applied is that SAS historically have performed
very poorly in terms of financials in Q1 due to seasonal variations in sales. The average numbers have
eventually been held up against figures from October 2012 + Q1 2013, and have not been allowed to
exceed these reported figures, as Q1 2013 includes November and December 2012.
The adjusted 12 months full year 2012 can be seen in appendix 6. These numbers will be applied in the
financial statement analysis, which will be carried out later in this section.
After adjusting the 2012 fiscal year, it has been necessary to rearrange the accounting items, in order to
being able to analyze historical performance. When preparing the analytical income statement, it is very
important that every accounting item is classified as being either an “operating” or a “financing” item,
thereby getting a better sense of the special sources of value creation. The reason this is important is, that
the financing items are not difficult to mitigate by others, and thereby they are not regarded as creating
value. On the other hand though, the different operating items can be hard to mitigate by new entrants or
competitors, and are therefore considered as being the items that investors and lenders are looking for
when assessing a company (Petersen and Plenborg, 2012).
Below the different accounts which have been reclassified in the financial statement, will be presented and
discussed.
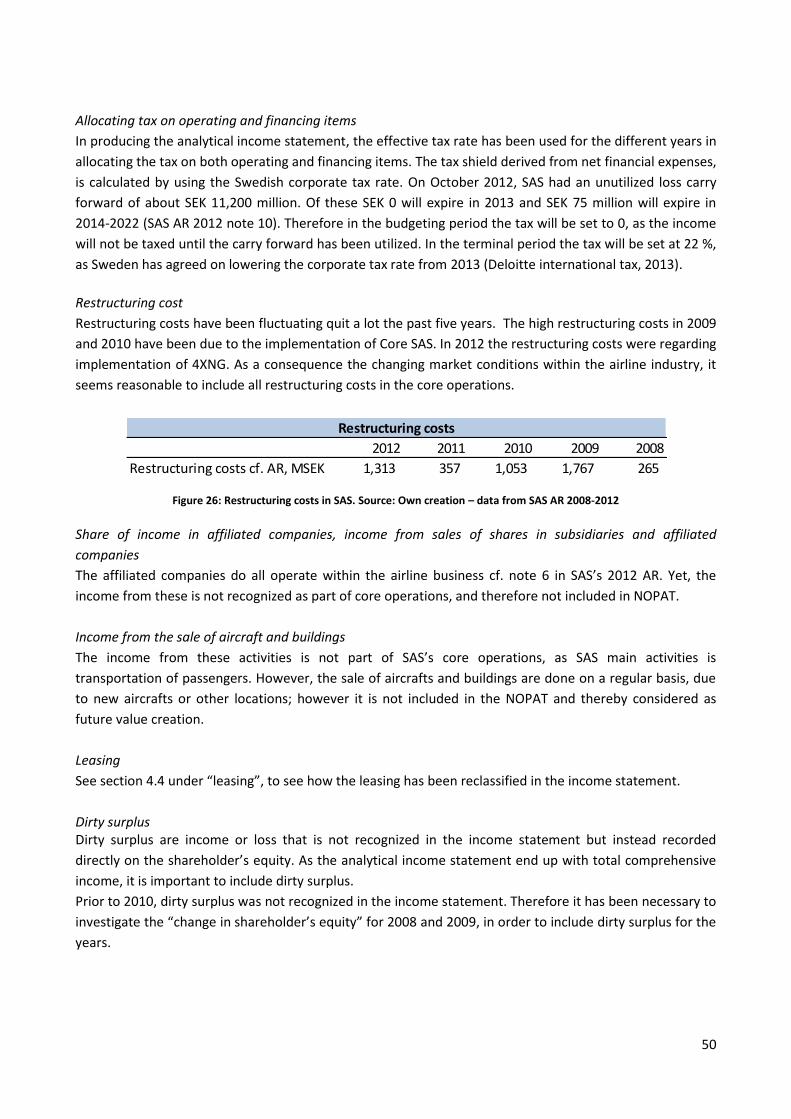
50
Allocating tax on operating and financing items
In producing the analytical income statement, the effective tax rate has been used for the different years in
allocating the tax on both operating and financing items. The tax shield derived from net financial expenses,
is calculated by using the Swedish corporate tax rate. On October 2012, SAS had an unutilized loss carry
forward of about SEK 11,200 million. Of these SEK 0 will expire in 2013 and SEK 75 million will expire in
2014-2022 (SAS AR 2012 note 10). Therefore in the budgeting period the tax will be set to 0, as the income
will not be taxed until the carry forward has been utilized. In the terminal period the tax will be set at 22 %,
as Sweden has agreed on lowering the corporate tax rate from 2013 (Deloitte international tax, 2013).
Restructuring cost
Restructuring costs have been fluctuating quit a lot the past five years. The high restructuring costs in 2009
and 2010 have been due to the implementation of Core SAS. In 2012 the restructuring costs were regarding
implementation of 4XNG. As a consequence the changing market conditions within the airline industry, it
seems reasonable to include all restructuring costs in the core operations.
Figure 26: Restructuring costs in SAS. Source: Own creation – data from SAS AR 2008-2012
Share of income in affiliated companies, income from sales of shares in subsidiaries and affiliated
companies
The affiliated companies do all operate within the airline business cf. note 6 in SAS’s 2012 AR. Yet, the
income from these is not recognized as part of core operations, and therefore not included in NOPAT.
Income from the sale of aircraft and buildings
The income from these activities is not part of SAS’s core operations, as SAS main activities is
transportation of passengers. However, the sale of aircrafts and buildings are done on a regular basis, due
to new aircrafts or other locations; however it is not included in the NOPAT and thereby considered as
future value creation.
Leasing
See section 4.4 under “leasing”, to see how the leasing has been reclassified in the income statement.
Dirty surplus Dirty surplus are income or loss that is not recognized in the income statement but instead recorded
directly on the shareholder’s equity. As the analytical income statement end up with total comprehensive
income, it is important to include dirty surplus.
Prior to 2010, dirty surplus was not recognized in the income statement. Therefore it has been necessary to
investigate the “change in shareholder’s equity” for 2008 and 2009, in order to include dirty surplus for the
years.
2012 2011 2010 2009 2008
Restructuring costs cf. AR, MSEK 1,313 357 1,053 1,767 265
Restructuring costs
51
In 2008 SEK -336 million have been included in regard to translation reserves, which stems from translating
a foreign controlled subsidiary’s financial statement into SEK. Another SEK -1,848 million stems from hedge
reserves, which concerns losses on derivatives.
In 2009 the same two accounts are adjusted with SEK 27 and 970 million respectively.
The reclassified income statement is located in appendix 7.
4.4 Preparing analytical balance sheet
As in the case with the analytical income statement, it is also important to reorganize the balance sheet in
order to assess the historical performance.
It has not been possible to correct the balance sheet from Jan-Oct to Jan-Dec, as was the case in the income
statement, therefore the numbers from 31 Oct will be applied. They have been checked against the Q1
2013, in order to see if there have been any major changes in any of the line items, which should be further
investigated, but that has not been the case.
In the reported balance sheet, assets and liabilities are divided into current and non-current, without
regard to whether they belong to operating or financing items. This categorization is mainly in order to
cover the creditors need for information regarding credit analysis. However, in terms of a valuation a
classification in terms of the different sources of profitability is needed i.e. operating and financing
activities. Therefore the balance sheet needs to be classified, so that it gives information in terms of how it
raises capital (financing) and how the capital is applied (operations).
The reorganized balance sheet is located in appendix 8. The invested capital on the asset side, is the
difference between the operating assets and operating liabilities, and corresponds to the capital invested in
the operations.
Below some of the items, which are not obvious, to whether they belong to operating or financing items
are discussed and presented.
Cash and bank balances and short-term investments
According to Sørensen (2012, p. 161) 0.5 % - 2% of sales, as a proportion of these two line items should be
classified as operating items, in order to respond to daily payments. In the reclassification of the balance
sheet 1 % has been used. The remaining part is classified as financial items.
Other liabilities
In the reported balance sheet there are two accounts with the name “other liabilities”. As there is no
detailed information in the notes regarding them, assumptions have to be made. The one item under
current liabilities is assumed to be concerning daily operations, and is therefore classified under operating
liabilities. The other, which is a long-term liability, is assumed to be regarding financial items.
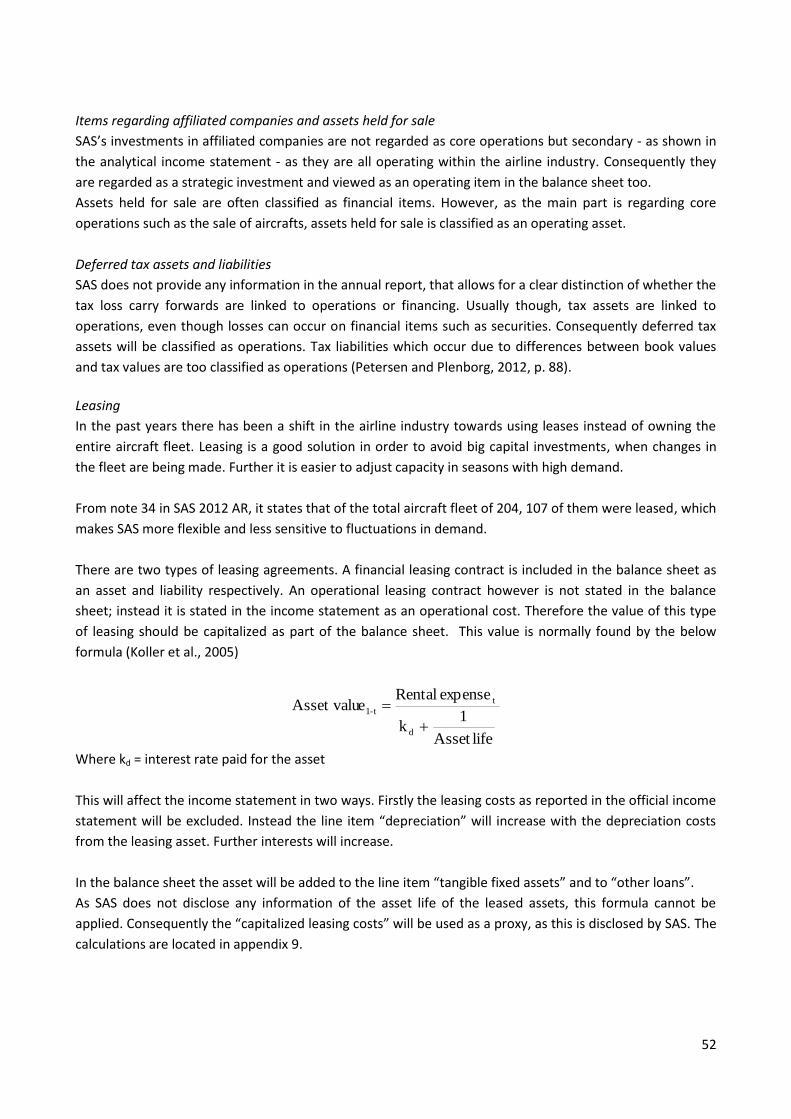
52
Items regarding affiliated companies and assets held for sale
SAS’s investments in affiliated companies are not regarded as core operations but secondary - as shown in
the analytical income statement - as they are all operating within the airline industry. Consequently they
are regarded as a strategic investment and viewed as an operating item in the balance sheet too.
Assets held for sale are often classified as financial items. However, as the main part is regarding core
operations such as the sale of aircrafts, assets held for sale is classified as an operating asset.
Deferred tax assets and liabilities
SAS does not provide any information in the annual report, that allows for a clear distinction of whether the
tax loss carry forwards are linked to operations or financing. Usually though, tax assets are linked to
operations, even though losses can occur on financial items such as securities. Consequently deferred tax
assets will be classified as operations. Tax liabilities which occur due to differences between book values
and tax values are too classified as operations (Petersen and Plenborg, 2012, p. 88).
Leasing
In the past years there has been a shift in the airline industry towards using leases instead of owning the
entire aircraft fleet. Leasing is a good solution in order to avoid big capital investments, when changes in
the fleet are being made. Further it is easier to adjust capacity in seasons with high demand.
From note 34 in SAS 2012 AR, it states that of the total aircraft fleet of 204, 107 of them were leased, which
makes SAS more flexible and less sensitive to fluctuations in demand.
There are two types of leasing agreements. A financial leasing contract is included in the balance sheet as
an asset and liability respectively. An operational leasing contract however is not stated in the balance
sheet; instead it is stated in the income statement as an operational cost. Therefore the value of this type
of leasing should be capitalized as part of the balance sheet. This value is normally found by the below
formula (Koller et al., 2005)
lifeAsset
1k
expense Rental eAsset valu
d
t
t-1
Where kd = interest rate paid for the asset
This will affect the income statement in two ways. Firstly the leasing costs as reported in the official income
statement will be excluded. Instead the line item “depreciation” will increase with the depreciation costs
from the leasing asset. Further interests will increase.
In the balance sheet the asset will be added to the line item “tangible fixed assets” and to “other loans”.
As SAS does not disclose any information of the asset life of the leased assets, this formula cannot be
applied. Consequently the “capitalized leasing costs” will be used as a proxy, as this is disclosed by SAS. The
calculations are located in appendix 9.
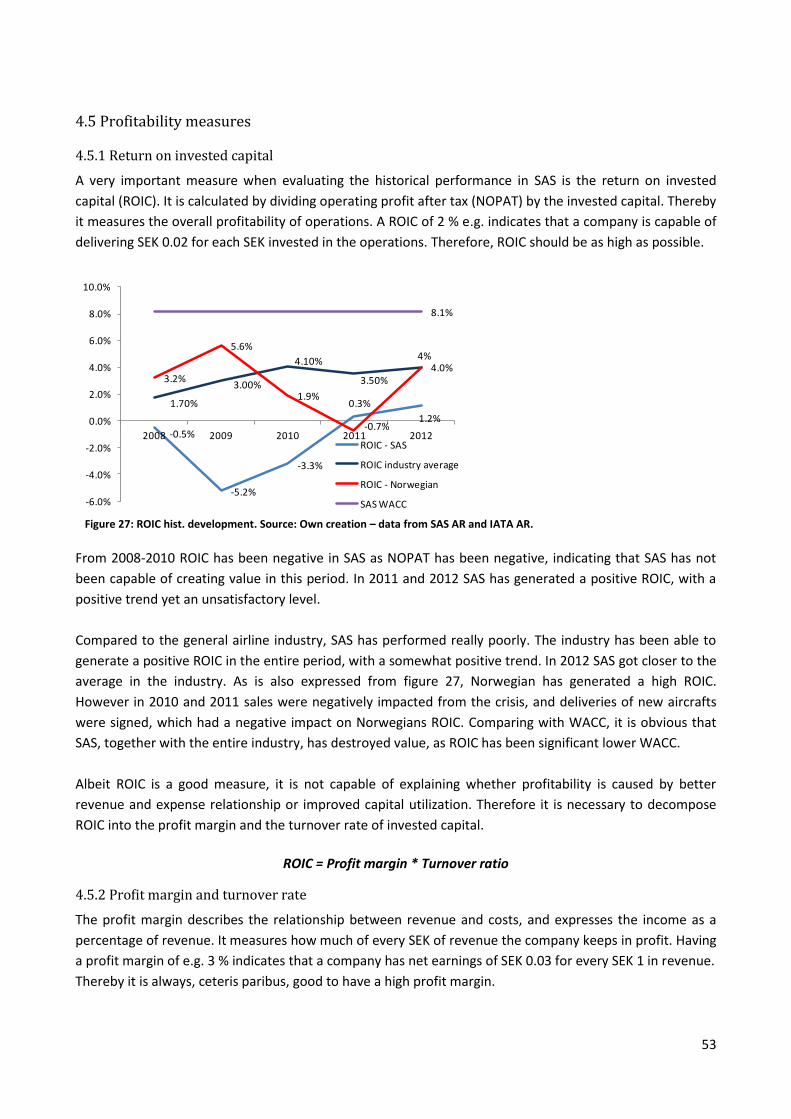
53
4.5 Profitability measures
4.5.1 Return on invested capital
A very important measure when evaluating the historical performance in SAS is the return on invested
capital (ROIC). It is calculated by dividing operating profit after tax (NOPAT) by the invested capital. Thereby
it measures the overall profitability of operations. A ROIC of 2 % e.g. indicates that a company is capable of
delivering SEK 0.02 for each SEK invested in the operations. Therefore, ROIC should be as high as possible.
Figure 27: ROIC hist. development. Source: Own creation – data from SAS AR and IATA AR.
From 2008-2010 ROIC has been negative in SAS as NOPAT has been negative, indicating that SAS has not
been capable of creating value in this period. In 2011 and 2012 SAS has generated a positive ROIC, with a
positive trend yet an unsatisfactory level.
Compared to the general airline industry, SAS has performed really poorly. The industry has been able to
generate a positive ROIC in the entire period, with a somewhat positive trend. In 2012 SAS got closer to the
average in the industry. As is also expressed from figure 27, Norwegian has generated a high ROIC.
However in 2010 and 2011 sales were negatively impacted from the crisis, and deliveries of new aircrafts
were signed, which had a negative impact on Norwegians ROIC. Comparing with WACC, it is obvious that
SAS, together with the entire industry, has destroyed value, as ROIC has been significant lower WACC.
Albeit ROIC is a good measure, it is not capable of explaining whether profitability is caused by better
revenue and expense relationship or improved capital utilization. Therefore it is necessary to decompose
ROIC into the profit margin and the turnover rate of invested capital.
ROIC = Profit margin * Turnover ratio
4.5.2 Profit margin and turnover rate
The profit margin describes the relationship between revenue and costs, and expresses the income as a
percentage of revenue. It measures how much of every SEK of revenue the company keeps in profit. Having
a profit margin of e.g. 3 % indicates that a company has net earnings of SEK 0.03 for every SEK 1 in revenue.
Thereby it is always, ceteris paribus, good to have a high profit margin.
-0.5%
-5.2%
-3.3%
0.3%
1.2%
1.70%
3.00%
4.10%
3.50%
4%
3.2%
5.6%
1.9%
-0.7%
4.0%
8.1%
-6.0%
-4.0%
-2.0%
0.0%
2.0%
4.0%
6.0%
8.0%
10.0%
2008 2009 2010 2011 2012ROIC - SAS
ROIC industry average
ROIC - Norwegian
SAS WACC
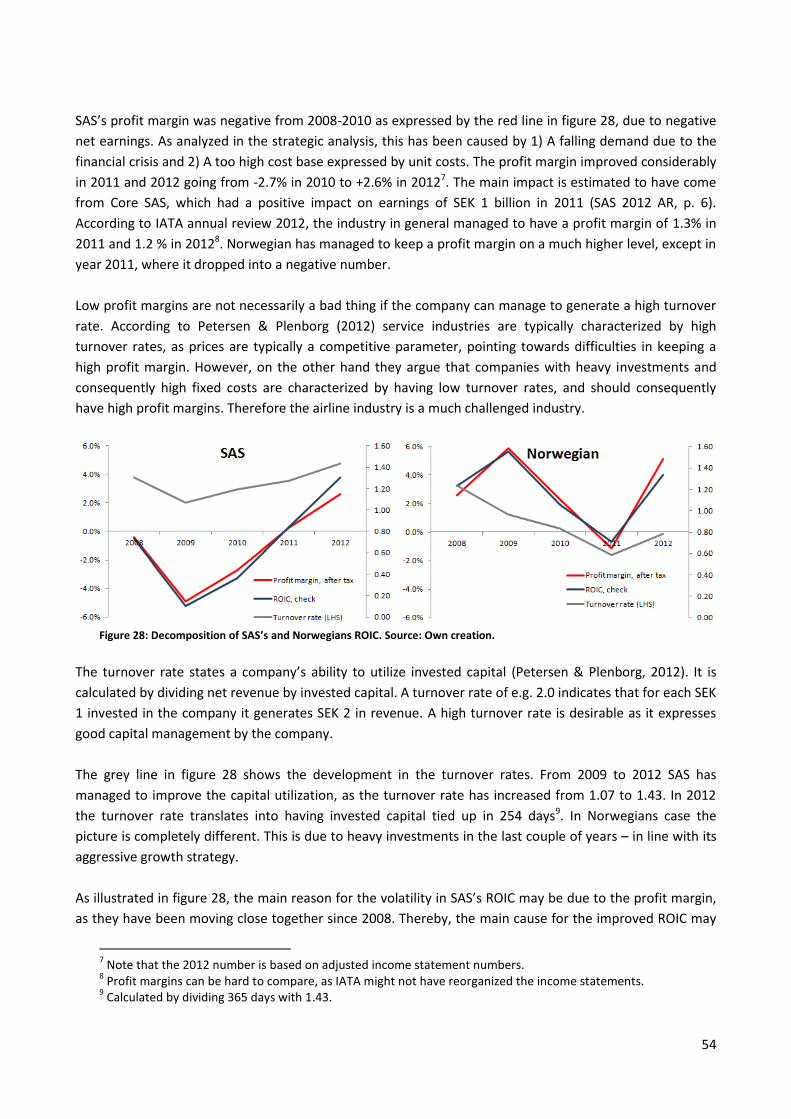
54
SAS’s profit margin was negative from 2008-2010 as expressed by the red line in figure 28, due to negative
net earnings. As analyzed in the strategic analysis, this has been caused by 1) A falling demand due to the
financial crisis and 2) A too high cost base expressed by unit costs. The profit margin improved considerably
in 2011 and 2012 going from -2.7% in 2010 to +2.6% in 20127. The main impact is estimated to have come
from Core SAS, which had a positive impact on earnings of SEK 1 billion in 2011 (SAS 2012 AR, p. 6).
According to IATA annual review 2012, the industry in general managed to have a profit margin of 1.3% in
2011 and 1.2 % in 20128. Norwegian has managed to keep a profit margin on a much higher level, except in
year 2011, where it dropped into a negative number.
Low profit margins are not necessarily a bad thing if the company can manage to generate a high turnover
rate. According to Petersen & Plenborg (2012) service industries are typically characterized by high
turnover rates, as prices are typically a competitive parameter, pointing towards difficulties in keeping a
high profit margin. However, on the other hand they argue that companies with heavy investments and
consequently high fixed costs are characterized by having low turnover rates, and should consequently
have high profit margins. Therefore the airline industry is a much challenged industry.
Figure 28: Decomposition of SAS’s and Norwegians ROIC. Source: Own creation.
The turnover rate states a company’s ability to utilize invested capital (Petersen & Plenborg, 2012). It is
calculated by dividing net revenue by invested capital. A turnover rate of e.g. 2.0 indicates that for each SEK
1 invested in the company it generates SEK 2 in revenue. A high turnover rate is desirable as it expresses
good capital management by the company.
The grey line in figure 28 shows the development in the turnover rates. From 2009 to 2012 SAS has
managed to improve the capital utilization, as the turnover rate has increased from 1.07 to 1.43. In 2012
the turnover rate translates into having invested capital tied up in 254 days9. In Norwegians case the
picture is completely different. This is due to heavy investments in the last couple of years – in line with its
aggressive growth strategy.
As illustrated in figure 28, the main reason for the volatility in SAS’s ROIC may be due to the profit margin,
as they have been moving close together since 2008. Thereby, the main cause for the improved ROIC may
7 Note that the 2012 number is based on adjusted income statement numbers.
8 Profit margins can be hard to compare, as IATA might not have reorganized the income statements.
9 Calculated by dividing 365 days with 1.43.
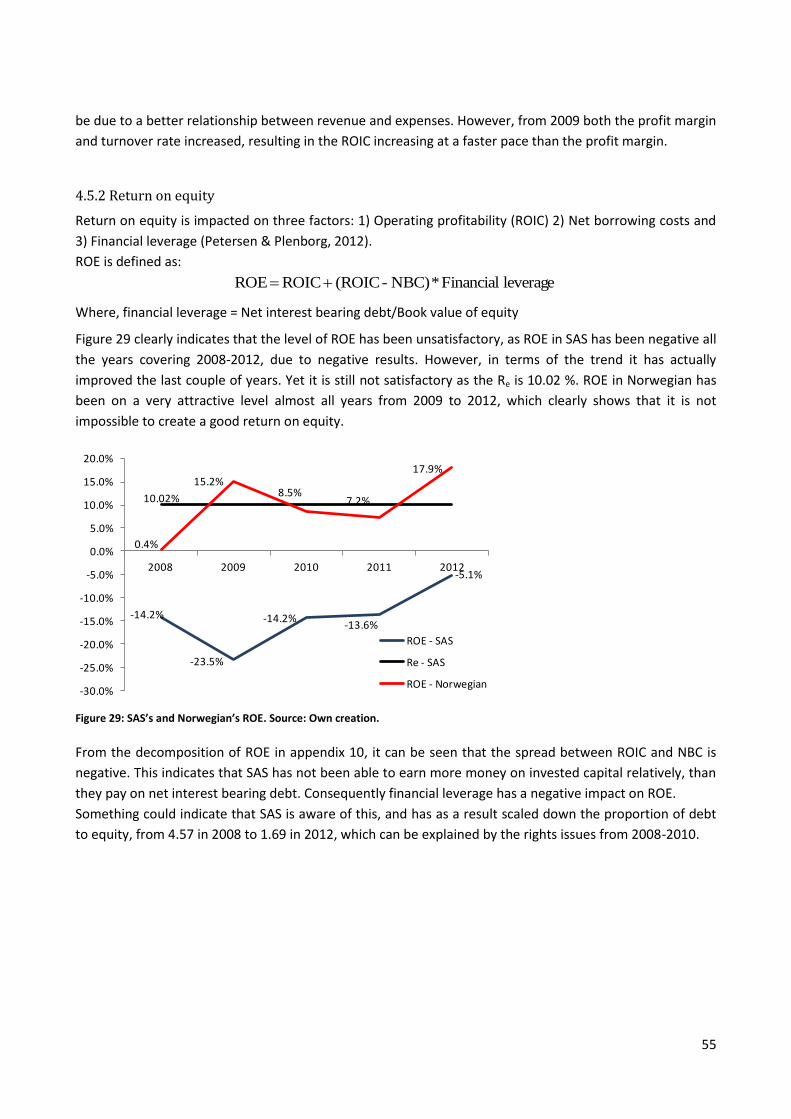
55
be due to a better relationship between revenue and expenses. However, from 2009 both the profit margin
and turnover rate increased, resulting in the ROIC increasing at a faster pace than the profit margin.
4.5.2 Return on equity
Return on equity is impacted on three factors: 1) Operating profitability (ROIC) 2) Net borrowing costs and
3) Financial leverage (Petersen & Plenborg, 2012).
ROE is defined as:
leverage Financial * NBC)-(ROIC ROIC ROE
Where, financial leverage = Net interest bearing debt/Book value of equity
Figure 29 clearly indicates that the level of ROE has been unsatisfactory, as ROE in SAS has been negative all
the years covering 2008-2012, due to negative results. However, in terms of the trend it has actually
improved the last couple of years. Yet it is still not satisfactory as the Re is 10.02 %. ROE in Norwegian has
been on a very attractive level almost all years from 2009 to 2012, which clearly shows that it is not
impossible to create a good return on equity.
Figure 29: SAS’s and Norwegian’s ROE. Source: Own creation.
From the decomposition of ROE in appendix 10, it can be seen that the spread between ROIC and NBC is
negative. This indicates that SAS has not been able to earn more money on invested capital relatively, than
they pay on net interest bearing debt. Consequently financial leverage has a negative impact on ROE.
Something could indicate that SAS is aware of this, and has as a result scaled down the proportion of debt
to equity, from 4.57 in 2008 to 1.69 in 2012, which can be explained by the rights issues from 2008-2010.
-14.2%
-23.5%
-14.2%-13.6%
-5.1%
10.02%
0.4%
15.2%8.5%
7.2%
17.9%
-30.0%
-25.0%
-20.0%
-15.0%
-10.0%
-5.0%
0.0%
5.0%
10.0%
15.0%
20.0%
2008 2009 2010 2011 2012
ROE - SAS
Re - SAS
ROE - Norwegian
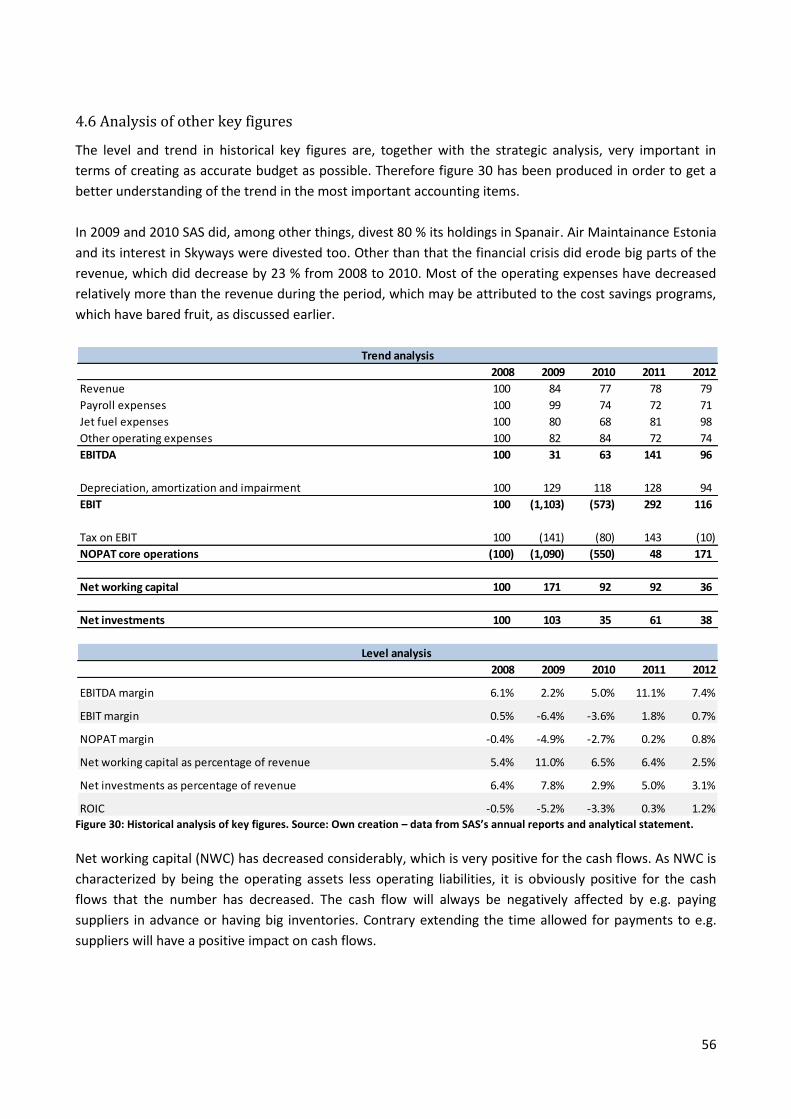
56
4.6 Analysis of other key figures
The level and trend in historical key figures are, together with the strategic analysis, very important in
terms of creating as accurate budget as possible. Therefore figure 30 has been produced in order to get a
better understanding of the trend in the most important accounting items.
In 2009 and 2010 SAS did, among other things, divest 80 % its holdings in Spanair. Air Maintainance Estonia
and its interest in Skyways were divested too. Other than that the financial crisis did erode big parts of the
revenue, which did decrease by 23 % from 2008 to 2010. Most of the operating expenses have decreased
relatively more than the revenue during the period, which may be attributed to the cost savings programs,
which have bared fruit, as discussed earlier.
Figure 30: Historical analysis of key figures. Source: Own creation – data from SAS’s annual reports and analytical statement.
Net working capital (NWC) has decreased considerably, which is very positive for the cash flows. As NWC is
characterized by being the operating assets less operating liabilities, it is obviously positive for the cash
flows that the number has decreased. The cash flow will always be negatively affected by e.g. paying
suppliers in advance or having big inventories. Contrary extending the time allowed for payments to e.g.
suppliers will have a positive impact on cash flows.
2008 2009 2010 2011 2012
Revenue 100 84 77 78 79
Payroll expenses 100 99 74 72 71
Jet fuel expenses 100 80 68 81 98
Other operating expenses 100 82 84 72 74
EBITDA 100 31 63 141 96
Depreciation, amortization and impairment 100 129 118 128 94
EBIT 100 (1,103) (573) 292 116
Tax on EBIT 100 (141) (80) 143 (10)
NOPAT core operations (100) (1,090) (550) 48 171
Net working capital 100 171 92 92 36
Net investments 100 103 35 61 38
2008 2009 2010 2011 2012
EBITDA margin 6.1% 2.2% 5.0% 11.1% 7.4%
EBIT margin 0.5% -6.4% -3.6% 1.8% 0.7%
NOPAT margin -0.4% -4.9% -2.7% 0.2% 0.8%
Net working capital as percentage of revenue 5.4% 11.0% 6.5% 6.4% 2.5%
Net investments as percentage of revenue 6.4% 7.8% 2.9% 5.0% 3.1%
ROIC -0.5% -5.2% -3.3% 0.3% 1.2%
Trend analysis
Level analysis
57
SAS’s own target for the EBIT margin is 8 % from the year 2014/2015. With an EBIT margin of 0.7% in 2012,
there is still a long way. However with the goal of decreasing unit costs with 3-5% per year, it is reachable
yet very questionable.
The above figures will be used as considerations when producing the budget, and serve as guiding principle
for the level and trend of the budgeted numbers.
4.7 Conclusion of financial statement analysis
In 2012 SAS changed its financial calendar year from Jan-Dec to Nov-Oct. Therefore 2012 only contains ten
months i.e. 1 January – 31 October. Therefore adjustments have been necessary to be made in order to
make 2012 comparable to prior years, and in terms of budgeting. The full year 2012 (January-December) is
to be found in appendix 6.
The changes in the financial calendar year might be due to changes in IAS 19, which becomes effective from
1 January 2013. One of the main changes regards the “corridor approach”, which allows the postponement
of recognizing actuarial gains and losses that exceeds 10 % of the greatest of the pension obligation or the
fair value of assets. This change will from the income year, starting on November 2013, have a negative
impact on SEK 7.9 billion which will be included in the shareholders’ equity. As SAS only has SEK 11.2 billion
in equity, it will obviously have a big impact. SAS is therefore in desperate need of money, either by issuing
new shares of by e.g. selling Widerøe which has already been discussed in SAS.
In terms of the reorganized income statement and balance sheet, one of the most important accounting
items was the leasing contracts. As SAS leases several aircrafts through so called operational leasing, these
are not registered as assets in the balance sheet, but instead only as expenses in the income statement.
Therefore adjustments needed to be made, in order to comparing it with peers.
The profitability measures have been benchmarked against Norwegian, SAS biggest competitor. It is
evident that SAS’s performance has not been acceptable, being at a much lower level than Norwegian’s.
SAS has been through significant restructurings in the last couple of years, and is still changing in order to
try to become more competitive in the future. Therefore the level of the profitability measures might be a
somewhat skewed picture of the future, hence it should not be attributed too much weight in the
budgeting section.
58
Part 5: Budgeting
In the following section a budget of SAS’s future performance will be carried out. The budget rests on the
conclusions made in the strategic and financial analysis, which includes the historical level of some financial
value drivers as well as expectations to some of the strategic value drivers presented in the strategic
analysis. These will enable an insightful and well argued forecasting of the future performance for SAS. The
budget is a very important part of the process, as it serves as inputs in the valuation of SAS.
The length of the budget period has in many years been subject to a lot of debate, both by theorists and
practitioners. Koller et al. (2005) argues that a forecast period of 10 to 15 years, and even longer for cyclical
companies, should be used in regard to valuing a company. By having a long budget period, the terminal
period will directly be assigned less significance, and the overall forecasting will be more accurate. While
many theorists call for long budget periods, many practitioners use periods of five-six years, which is also
argued for in a study by Petersen et al. (2006). For the purpose of this paper, a budget period of five years
will be used. The budget period of five years, will be discounted to present value with the weighted average
cost of capital (WACC). The terminal period, which is the period subsequent to the fifth year, will be
assumed to grow with a constant growth rate (g).
There are several methods in terms of forecasting future performance. The “line-item” approach is a
method where each accounting item is being forecasted without reference to the expected level of activity
(Petersen and Plenborg, 2012). Another method is the “sales-driven” approach, which assumes that the
different accounting items are driven by the level of activity, i.e. sales. The latter will be applied in this
section, as it is the author’s conviction that this reflects the most realistic picture of the company, in terms
of activity and the related expenses and investments.
In order to make the valuation as accurate and realistic as possible, three scenarios will be formed with
different weights attached to each of them. The scenarios will each be presented and argued for under the
respective sub-sections.
The weights attached to each scenario will be elaborated on in section 6.5, where Altman’s Z-score and
different maturities of credit default swaps (CDS), will be used.
5.1 Realistic scenario
This scenario is the first to be presented, as this will be based solely on the strategic and financial analysis,
and thereby be the most realistic and plausible scenario, as it is based on the general beliefs in the marked
of the direction and level of the future activity in the industry. Due to the above, is will also found the basis
for the optimistic scenario, which also will include SAS’s expectations.
5.1.1 Revenue
The revenue is the most important item to forecast, as many of the other items are directly related to the
activity, i.e. the revenue. As mentioned above the sales-driven approach will be applied, indicating the
revenue has to be considered very carefully as it will affect other items in the budget.
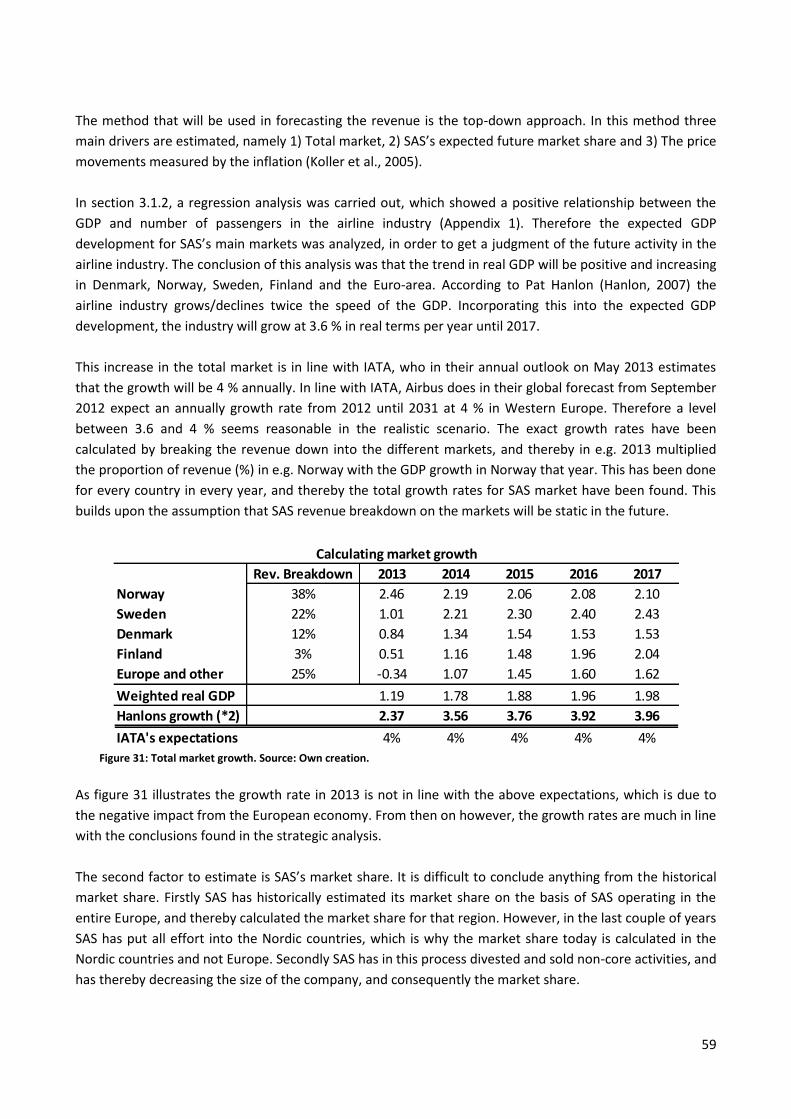
59
The method that will be used in forecasting the revenue is the top-down approach. In this method three
main drivers are estimated, namely 1) Total market, 2) SAS’s expected future market share and 3) The price
movements measured by the inflation (Koller et al., 2005).
In section 3.1.2, a regression analysis was carried out, which showed a positive relationship between the
GDP and number of passengers in the airline industry (Appendix 1). Therefore the expected GDP
development for SAS’s main markets was analyzed, in order to get a judgment of the future activity in the
airline industry. The conclusion of this analysis was that the trend in real GDP will be positive and increasing
in Denmark, Norway, Sweden, Finland and the Euro-area. According to Pat Hanlon (Hanlon, 2007) the
airline industry grows/declines twice the speed of the GDP. Incorporating this into the expected GDP
development, the industry will grow at 3.6 % in real terms per year until 2017.
This increase in the total market is in line with IATA, who in their annual outlook on May 2013 estimates
that the growth will be 4 % annually. In line with IATA, Airbus does in their global forecast from September
2012 expect an annually growth rate from 2012 until 2031 at 4 % in Western Europe. Therefore a level
between 3.6 and 4 % seems reasonable in the realistic scenario. The exact growth rates have been
calculated by breaking the revenue down into the different markets, and thereby in e.g. 2013 multiplied
the proportion of revenue (%) in e.g. Norway with the GDP growth in Norway that year. This has been done
for every country in every year, and thereby the total growth rates for SAS market have been found. This
builds upon the assumption that SAS revenue breakdown on the markets will be static in the future.
Figure 31: Total market growth. Source: Own creation.
As figure 31 illustrates the growth rate in 2013 is not in line with the above expectations, which is due to
the negative impact from the European economy. From then on however, the growth rates are much in line
with the conclusions found in the strategic analysis.
The second factor to estimate is SAS’s market share. It is difficult to conclude anything from the historical
market share. Firstly SAS has historically estimated its market share on the basis of SAS operating in the
entire Europe, and thereby calculated the market share for that region. However, in the last couple of years
SAS has put all effort into the Nordic countries, which is why the market share today is calculated in the
Nordic countries and not Europe. Secondly SAS has in this process divested and sold non-core activities, and
has thereby decreasing the size of the company, and consequently the market share.
Rev. Breakdown 2013 2014 2015 2016 2017
Norway 38% 2.46 2.19 2.06 2.08 2.10
Sweden 22% 1.01 2.21 2.30 2.40 2.43
Denmark 12% 0.84 1.34 1.54 1.53 1.53
Finland 3% 0.51 1.16 1.48 1.96 2.04
Europe and other 25% -0.34 1.07 1.45 1.60 1.62
Weighted real GDP 1.19 1.78 1.88 1.96 1.98
Hanlons growth (*2) 2.37 3.56 3.76 3.92 3.96
IATA's expectations 4% 4% 4% 4% 4%
Calculating market growth
60
As a consequence the basis year for estimating SAS’s future market share will be 2012, in which SAS had a
28 % market share c.f. section 2.3. Many factors will obviously affect the market share henceforward. The
biggest risk for SAS is the LCCs’; especially Norwegian which is the biggest airline company in the Nordic
countries after SAS. Norwegian has a very aggressive growth strategy as mentioned in the strategic
analysis, and might therefore take even more market shares from SAS. SAS will presumably find it difficult
to maintain its market share as long as the unit costs, which were analyzed in section 3.3.1, are so much
higher than its peers. Further a clear strategy needs to be formed in order to move away from the “stock in
the middle” situation.
As 80% of the growth in the industry is expected to come from the leisure travelers in the future, SAS needs
to focus its attention more on this group. At the moment more than 50 % of the group’s revenue comes
from business travelers. In addition SAS is still by many associated with business traveling, therefore SAS
needs to work with its brand.
Taken the above conclusions from the strategic analysis into consideration, SAS’s market share is expected
to decrease slightly towards to terminal period, due to the many risk factors in SAS’s environment.
The last factor influencing the revenue growth is the prices, which are represented by the inflation. Price
changes are based on numbers from the European Commission’s forecast, which are in the level between
1.5% and 2% in the budget period. In the terminal period the growth rate is set to 2 %.
5.1.2 Payroll expenses
Payroll expenses are difficult to forecast, as SAS has not released any figures showing the real impact from
the collective agreements discussed in section 3.3.2. However, SAS estimated before the collective
agreements that about 24% of expected SEK 3 billion in cost savings from the 4XNG, will come from
lowering the payroll expenses, which is equal to SEK 720 million.
In the realistic scenario this will be downgraded to SEK 500 million, thereby the payroll expenses will
constitute 29.7 % of revenue in the budget period, after taken into consideration the savings of SEK 500
million. The fact that SAS has not been able to reduce the payroll expenses more, despite the critical
situation SAS finds itself in, should be considered as SAS possessing poor bargaining power due to the
strong labor unions in the Nordic countries, which was also concluded in Porters five forces. Therefore a
significant lowered payroll account is not considered as likely in the realistic scenario. Future lay-off of
employees will not have a significant impact on the budget, as the payroll expenses are expressed in
percentage of revenue.
5.1.3 Jet-fuel expenses
In section 3.1.2, expectations to the future development in oil prices were analyzed. It was concluded that
the historical correlation between crude oil and jet-fuel has been close to one, mainly due to the fact, that
jet-fuel is processed crude oil. Consensus from Bloomberg points towards an annual increase in the price of
61
crude oil of 2.6 % up until 2017, which is also mainly in line with the U.S. Energy Information
Administration. Therefore this growth rate will be used in the budget period.
Not only will the price changes on crude oil determine the future jet-fuel expenses in SAS. The activity, i.e.
revenue, will also determine the level, which is why an average of the last five years jet-fuel expenses as a
proportion of revenue will be used as base. After including the price changes in the forecast, which were
determined above, adjustments need to be carried out as a consequence of SAS investing in new and more
fuel efficient aircrafts.
According to SAS AR 2012, new generation aircrafts are 15 % more fuel efficient than the older generation.
SAS further states that the fleet makes up a total of 204 aircrafts of which old generation aircrafts
constitutes 79 %. In 2014 however, the entire fleet will consist of 100 % new generation aircrafts according
to SAS.
In order to simplify the calculations, it is assumed that the total number of aircrafts stays the same in the
budget period. By that it can be concluded that SAS will reduce the jet-fuel consumption of 3% towards
201410. It is assumed that the new aircrafts will be delivered equally in 2013 and 2014, and taken into
operations immediately. From and after 2014, small improvements of 1 % per year are anticipated as SAS
are expecting deliveries of other new aircrafts during the budget period.
5.1.4 Other operating expenses
This item of account includes things such as government user fees and technical aircraft maintenance,
which are the two biggest items included in other operating expenses. These are not considered to be
decreasing significant in the budget period. It could be argued though, that new aircrafts need less
maintenance than older ones, and therefore the item in general are decreasing slightly in the budget
period.
Historically the item has made up 40 % of revenue with a decreasing trend, which it why the level will be
set at 38-39 % of revenue in the budget period.
5.1.5 Depreciation, amortization and impairment (DAI)
There are several ways this item can be forecasted. The most precise way would be to use property, plant
and equipment (PP&E) as forecast driver. However, as the information in regard to the future PP&E is
limited, it would only lead to pointless inaccurate assumptions of future PP&E. Therefore revenue is used as
driver. The last five years, DAI has made up 7.8 % of revenue. Due to new investments in aircrafts, DAI is
expected to increase to 10 % in the budget period, and then revert towards the historical average in the
terminal period.
10
100 % - 79 % = 21 % 21% * 15 % = 3 %
62
5.1.6 Net working capital
NWC is derived from operational activities; consequently the change in NWC is calculated as a percentage
of revenues in regard to the forecasting. The historical change in NWC have been calculated, and based on
that a 3 % change in NWC of revenues is considered to be realistic.
5.1.7 Net investments
Net investments in intangible and tangible assets are determined as the difference between assets at the
end and beginning of the period. Depreciation and amortization are added back, as they have no cash
impact. The five-year historical average is 5 %, which is not regarded as a good proxy in the budget period,
due to investments in new aircrafts, which was covered in the strategic analysis. Therefore, net investments
as a proportion of revenue are estimated to be at 9 % in the budget period, which obviously will have a
negative impact on the free cash flows. In the terminal period 6.5 % is viewed as a good proxy, as SAS will
have to invest slightly more in new aircrafts than they have done historically, in order to become
competitive towards its peers.
5.2 Optimistic scenario
In this section the different line items will not be discussed and elaborated on, as was the case in the
realistic scenario, due to the limited pages of this project. Only the major accounts will briefly be discussed.
The optimistic scenario is primarily based on SAS’s expectations. In terms of revenue growth, SAS has not
released any information regarding its own expectations for the future. Therefore, as well as in the realistic
scenario, the revenue growth will be based on the findings in the strategic and financial analysis, as it is
assumed that SAS also to some degree, do base their expectations of future growth on findings from e.g.
IATA and IMF. However, instead of SAS losing market share as was the case in the realistic scenario due to
the growth coming from the leisure market, and the increasing competition from peers, it is expected that
SAS will be able to capture market share from peers. The reason that this is expected is that SAS has been
capable of decreasing its cost base, and is expected to continue this in the future. Consequently SAS will
have the strength to compete more on price, than has been the case so far, which in the strategic analysis
was concluded, is one of the key competitive parameters in the airline industry.
In terms of cost savings it is expected that the different initiatives by SAS, will succeed and provide the
published expected improvements in the cost structure. One of the biggest items is the payroll expenses.
As mentioned in the realistic scenario, SAS expects SEK 720 million in savings on the payroll expenses. If this
is achieved, which is expected in the optimistic scenario, is will imply that the payroll expenses will
decrease to 29.1 % of revenue, which will be assumed in this scenario.
Jet-fuel prices remain the same as in the optimistic scenario, as the findings from the strategic analysis
seems reasonable, since SAS presumably do base their expectations of future development in jet-fuel prices
on the estimates found on Bloomberg or the U.S. Energy Information Administration. Further, the
reductions in the jet-fuel consumptions due to the renewal of the fleet, was calculated in the realistic
scenario, which are assumed to be a fair estimate for the future.
63
Both the optimistic and realistic full budgets are available in appendices 16 and 17, where the items which
have not been discussed in this section are available.
5.3 Non-going concern scenario - liquidation
The third and worst case scenario will be expressed by the liquidation value. The reason this method has
been considered as being suitable and the best match in the worst case scenario, is due to SAS´s financial
problems and the fact that SAS has actually been rescued several times by its shareholders, which they
might not be willing to in the future, if SAS goes to the capital markets and ask for more capital.
Furthermore, Altman’s z-score is at 1.26 indicating that SAS is in a high probability of bankruptcy. Altman’s
z-score has historically been good in terms of predicting bankruptcies, as 95 % of the observations have
been correctly one year prior to a bankruptcy (Petersen & Plenborg, 2012, p. 294). Further Credit Default
Swap premiums are very high on SAS’s debt, which will be elaborated on later. Therefore it seems naturally
to include the liquidation method in this scenario.
The liquidation value is an estimate for how much a company could be sold for, if all assets were sold and
liabilities were paid off. Consequently this method differs very much from the present value method, as it
does not take future earnings into consideration. Therefore the liquidation value is typically higher than the
one found in a present value model, for companies operating in industries where negative outlooks and
returns are dominating, and vice versa in industries with positive growth rates and acceptable returns.
Therefore it should be expected that the liquidation value for SAS, would be lower than the values
estimated by the DCF-model.
There are two types of liquidation values, which depend on the time available for the liquidation process.
The first one is the “orderly liquidation value” which assumes that the owners have the necessary time for
selling the assets, thereby yielding the highest possible price for a given asset. The second method is the
“distress liquidation value” which, as the name implies, is the value earned on assets that have been sold as
fast as possible, and thereby might not have yielded the highest possible price. The latter approach has
been found reasonable in this scenario, justified by SAS’s financial problems and supported by the Altman’s
z-score, which indicate a high probability of bankruptcy within a year.
If all assets were sold at book value and the money from this sale was used to pay off the debt, the
company would exit a bankruptcy with the book value of equity, shown by the following relationship:
Equity + Debt = Assets ↔ Assets – Debt = Equity
However selling all assets at book value is hardly never possible, as the selling price is affected by factors
such as alterative use of the asset, level of maintenance, number of potential buyers and as mentioned
above; the time available for the sales process. In addition, off-balance sheet items need to be accounted
for. In order to find the most exact liquidation value, market values for the assets should be researched,
and if such do not exist, selling prices for comparable assets should be investigated. However, as this is a
very time consuming and difficult task to execute (almost impossible as specific details about asset age, size
and composition is not available) without any insider information, this will not be carried out. Therefore the
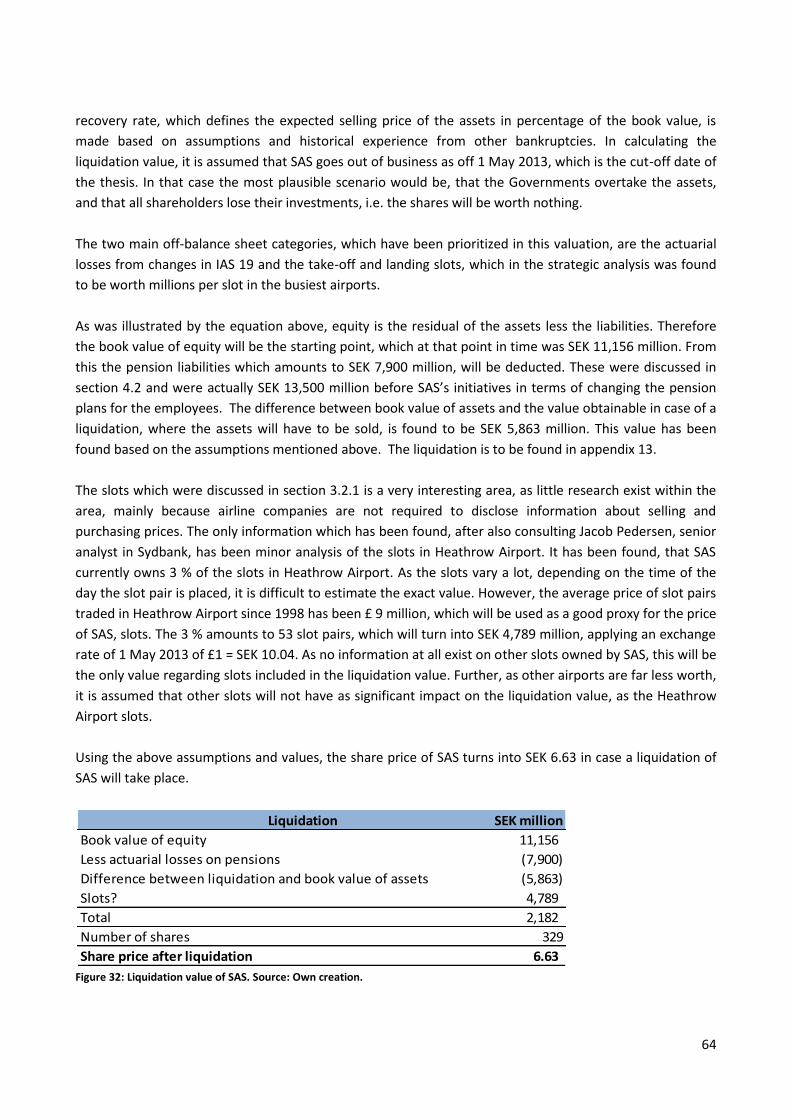
64
recovery rate, which defines the expected selling price of the assets in percentage of the book value, is
made based on assumptions and historical experience from other bankruptcies. In calculating the
liquidation value, it is assumed that SAS goes out of business as off 1 May 2013, which is the cut-off date of
the thesis. In that case the most plausible scenario would be, that the Governments overtake the assets,
and that all shareholders lose their investments, i.e. the shares will be worth nothing.
The two main off-balance sheet categories, which have been prioritized in this valuation, are the actuarial
losses from changes in IAS 19 and the take-off and landing slots, which in the strategic analysis was found
to be worth millions per slot in the busiest airports.
As was illustrated by the equation above, equity is the residual of the assets less the liabilities. Therefore
the book value of equity will be the starting point, which at that point in time was SEK 11,156 million. From
this the pension liabilities which amounts to SEK 7,900 million, will be deducted. These were discussed in
section 4.2 and were actually SEK 13,500 million before SAS’s initiatives in terms of changing the pension
plans for the employees. The difference between book value of assets and the value obtainable in case of a
liquidation, where the assets will have to be sold, is found to be SEK 5,863 million. This value has been
found based on the assumptions mentioned above. The liquidation is to be found in appendix 13.
The slots which were discussed in section 3.2.1 is a very interesting area, as little research exist within the
area, mainly because airline companies are not required to disclose information about selling and
purchasing prices. The only information which has been found, after also consulting Jacob Pedersen, senior
analyst in Sydbank, has been minor analysis of the slots in Heathrow Airport. It has been found, that SAS
currently owns 3 % of the slots in Heathrow Airport. As the slots vary a lot, depending on the time of the
day the slot pair is placed, it is difficult to estimate the exact value. However, the average price of slot pairs
traded in Heathrow Airport since 1998 has been £ 9 million, which will be used as a good proxy for the price
of SAS, slots. The 3 % amounts to 53 slot pairs, which will turn into SEK 4,789 million, applying an exchange
rate of 1 May 2013 of £1 = SEK 10.04. As no information at all exist on other slots owned by SAS, this will be
the only value regarding slots included in the liquidation value. Further, as other airports are far less worth,
it is assumed that other slots will not have as significant impact on the liquidation value, as the Heathrow
Airport slots.
Using the above assumptions and values, the share price of SAS turns into SEK 6.63 in case a liquidation of
SAS will take place.
Figure 32: Liquidation value of SAS. Source: Own creation.
Liquidation SEK million
Book value of equity 11,156
Less actuarial losses on pensions (7,900)
Difference between liquidation and book value of assets (5,863)
Slots? 4,789
Total 2,182
Number of shares 329
Share price after liquidation 6.63
65
Part 6: Cost of capital & Valuation
The main objective in part 6 is to find the rate at which, future estimated cash flows determined in part 5,
will be discounted back to present value.
The approach used to find the discount rate is the WACC, which needs several inputs in order to calculate
the discount rate. These inputs will be found in the following sections and eventually the discount rate will
be calculated.
6.1 Required rate of return on equity
The Capital Asset Pricing Model (CAPM) is the model used in order to find the required rate of return for
investors (re). In order to apply this model, a number of assumptions have to be made. These assumptions
are located in section 1.3.4, in which important drawbacks have also been discussed. However, as no better
alternative exist in the financial theory, this serves as the best model for estimating re.
Below CAPM is presented:
)r - (r r r fmefe
re = Investors’ required rate of return
rf = Risk-free interest rate
βe = Systematic risk on equity
rm = Return on market portfolio
By comparing the equation for WACC with the above it shows, that re = WACC if the company is entirely
financed by equity, which obviously is not the case in SAS – more on that later. Furthermore the CAPM
expresses, that investors will only be compensated for the risk that cannot be diversified away, i.e. the
systematic risk, expressed by beta. All of the above inputs to CAPM will be estimated in the following
subsections.
6.1.1 Risk free interest rate
The risk free interest rate expresses the return required by an investor for postponing his consumption, and
instead investing his money in an asset with zero risk. Theoretically a risk free investment implies, that the
expected return equals the actual return i.e. there is no variance around the expected return, when looking
at a normal distribution curve. Zero risk is merely a theoretically concept, as investments in e.g.
government bonds, which is considered to be risk free, is associate with small amounts of risk such as
inflation risk, in which case the investor could risk his investment to get eroded, if the inflation goes up.
However, this will not be discussed further, as no other alternative investments are considered to be risk-
free.
As the risk-free interest rate cannot be looked up anywhere directly, there are different opinions on which
proxy to apply. Most practitioners argue that the leading 10-year government bond serves as the best
proxy, as it empirically has provided the best estimate, when long term future cash flows must be
discounted back to present value.
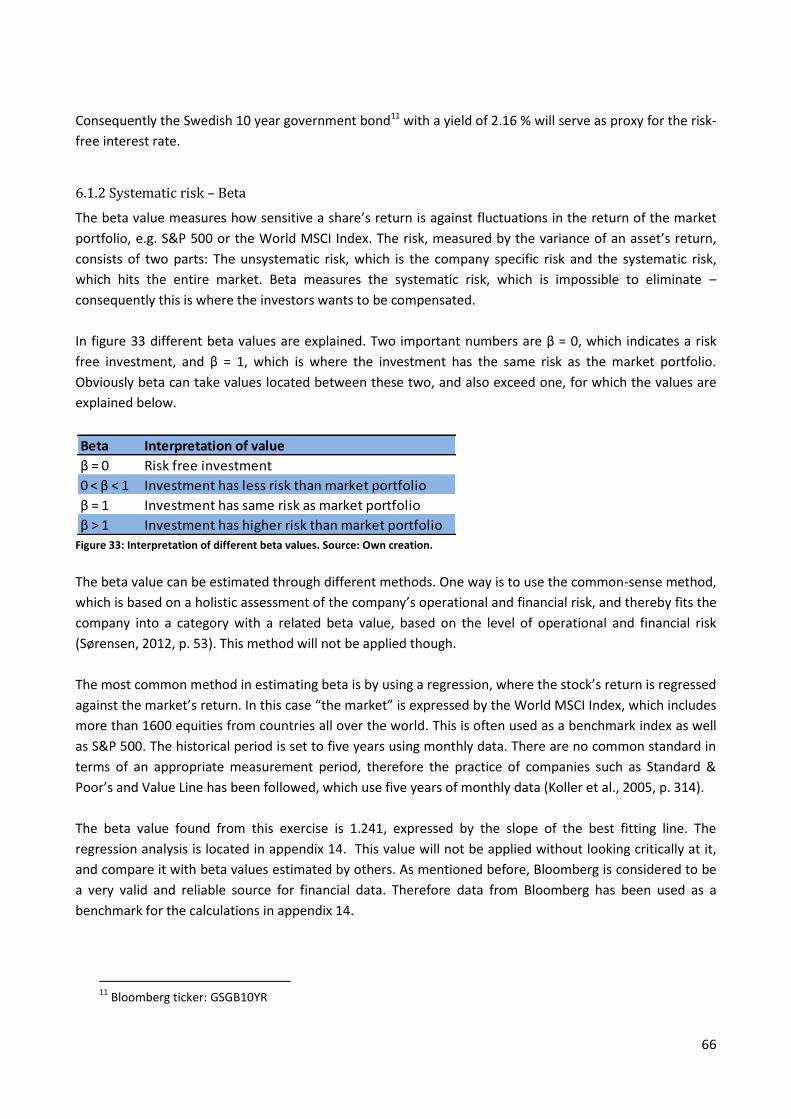
66
Consequently the Swedish 10 year government bond11 with a yield of 2.16 % will serve as proxy for the risk-
free interest rate.
6.1.2 Systematic risk – Beta
The beta value measures how sensitive a share’s return is against fluctuations in the return of the market
portfolio, e.g. S&P 500 or the World MSCI Index. The risk, measured by the variance of an asset’s return,
consists of two parts: The unsystematic risk, which is the company specific risk and the systematic risk,
which hits the entire market. Beta measures the systematic risk, which is impossible to eliminate –
consequently this is where the investors wants to be compensated.
In figure 33 different beta values are explained. Two important numbers are β = 0, which indicates a risk
free investment, and β = 1, which is where the investment has the same risk as the market portfolio.
Obviously beta can take values located between these two, and also exceed one, for which the values are
explained below.
Figure 33: Interpretation of different beta values. Source: Own creation.
The beta value can be estimated through different methods. One way is to use the common-sense method,
which is based on a holistic assessment of the company’s operational and financial risk, and thereby fits the
company into a category with a related beta value, based on the level of operational and financial risk
(Sørensen, 2012, p. 53). This method will not be applied though.
The most common method in estimating beta is by using a regression, where the stock’s return is regressed
against the market’s return. In this case “the market” is expressed by the World MSCI Index, which includes
more than 1600 equities from countries all over the world. This is often used as a benchmark index as well
as S&P 500. The historical period is set to five years using monthly data. There are no common standard in
terms of an appropriate measurement period, therefore the practice of companies such as Standard &
Poor’s and Value Line has been followed, which use five years of monthly data (Koller et al., 2005, p. 314).
The beta value found from this exercise is 1.241, expressed by the slope of the best fitting line. The
regression analysis is located in appendix 14. This value will not be applied without looking critically at it,
and compare it with beta values estimated by others. As mentioned before, Bloomberg is considered to be
a very valid and reliable source for financial data. Therefore data from Bloomberg has been used as a
benchmark for the calculations in appendix 14.
11
Bloomberg ticker: GSGB10YR
Beta Interpretation of value
β = 0 Risk free investment
0 < β < 1 Investment has less risk than market portfolio
β = 1 Investment has same risk as market portfolio
β > 1 Investment has higher risk than market portfolio
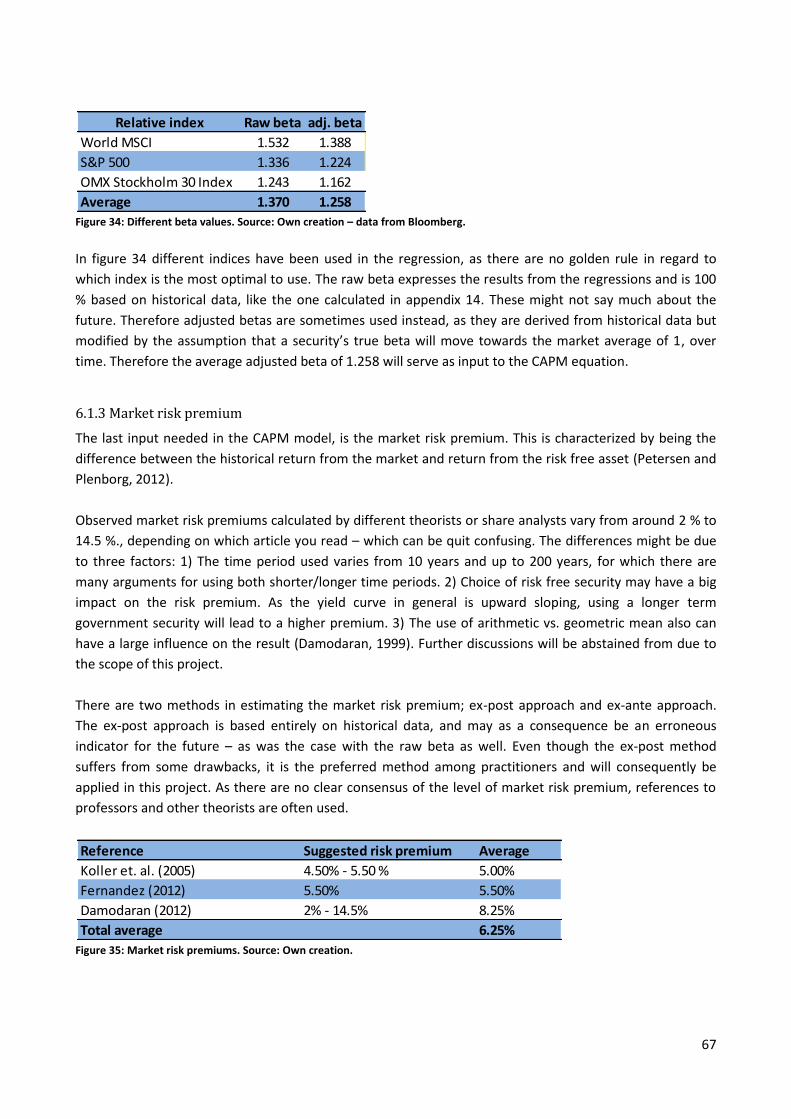
67
Figure 34: Different beta values. Source: Own creation – data from Bloomberg.
In figure 34 different indices have been used in the regression, as there are no golden rule in regard to
which index is the most optimal to use. The raw beta expresses the results from the regressions and is 100
% based on historical data, like the one calculated in appendix 14. These might not say much about the
future. Therefore adjusted betas are sometimes used instead, as they are derived from historical data but
modified by the assumption that a security’s true beta will move towards the market average of 1, over
time. Therefore the average adjusted beta of 1.258 will serve as input to the CAPM equation.
6.1.3 Market risk premium
The last input needed in the CAPM model, is the market risk premium. This is characterized by being the
difference between the historical return from the market and return from the risk free asset (Petersen and
Plenborg, 2012).
Observed market risk premiums calculated by different theorists or share analysts vary from around 2 % to
14.5 %., depending on which article you read – which can be quit confusing. The differences might be due
to three factors: 1) The time period used varies from 10 years and up to 200 years, for which there are
many arguments for using both shorter/longer time periods. 2) Choice of risk free security may have a big
impact on the risk premium. As the yield curve in general is upward sloping, using a longer term
government security will lead to a higher premium. 3) The use of arithmetic vs. geometric mean also can
have a large influence on the result (Damodaran, 1999). Further discussions will be abstained from due to
the scope of this project.
There are two methods in estimating the market risk premium; ex-post approach and ex-ante approach.
The ex-post approach is based entirely on historical data, and may as a consequence be an erroneous
indicator for the future – as was the case with the raw beta as well. Even though the ex-post method
suffers from some drawbacks, it is the preferred method among practitioners and will consequently be
applied in this project. As there are no clear consensus of the level of market risk premium, references to
professors and other theorists are often used.
Figure 35: Market risk premiums. Source: Own creation.
Relative index Raw beta adj. beta
World MSCI 1.532 1.388
S&P 500 1.336 1.224
OMX Stockholm 30 Index 1.243 1.162
Average 1.370 1.258
Reference Suggested risk premium Average
Koller et. al. (2005) 4.50% - 5.50 % 5.00%
Fernandez (2012) 5.50% 5.50%
Damodaran (2012) 2% - 14.5% 8.25%
Total average 6.25%
68
In figure 35 an arithmetic mean has been calculated of different estimates of the market risk premium by
different well-reputed professors. The average has been found to 6.25% which will be applied in the CAPM
calculation. The risk premium found might seem a bit high. However, as the article Adjusting the market
risk premium to reflect the global financial crisis (Bishop et al., 2011) argues, the market risk premium has
risen to reflect the increased risk due to the global financial crisis, therefore the level seems to be realistic –
they argue for a market risk premium of 6-7%, which is in line with the one found in this section.
6.1.4 Calculating required rate of return on equity
As explained in section 6.1 the CAPM is used in calculating the required rate of return for investors. As all
inputs have now been estimated, they can be plugged into the equation:
re = rf + βe (rm-rf) → re = 2.16% + 1.258 * 6.25% → re = 10.02 %
6.2 Cost of debt
The general equation applied when finding the cost of debt for a company is shown below:
t)-(1 * )r(r r sfd
rd = Required rate of return on net interest bearing debt (NIBD)
rf = Risk-free interest rate
rs = Credit spread (Risk premium on debt)
t = Corporate tax rate
Except the credit spread, the other inputs has already been found in former chapters. The credit spread,
also known as a company’s specific risk, is characterized by being the difference between a security and a
risk free benchmark security. The coupon rates on the bonds obviously depends on the credit rating of SAS,
which by Moody’s is Caa1 and by Standard and Poor’s is CCC+, downgraded from B- in November 2012.
Estimating the cost of debt directly from the credit ratings and plotting them into a theoretical table could
be one method. However, this is difficult to do without introducing several assumptions.
Implicitly the cost of debt is reflected in the interest rate SAS pays on the financial markets. Consequently,
it has been calculated as the average historical difference between the bond coupon rate paid by SAS and
the risk free rate, based on historical data in SAS’s annual reports 2008-2013. In appendix 15 the
calculations can be seen. However, due to large fluctuations in the risk premium which have been between
2.1% and 10.2%, an average does not seem to be the right choice. Instead the level from last year seems to
be best in representing the present risk premium, due to SAS’s financial situation. Consequently the risk
premium is set to 10.2 %.
The company’s cost of debt is therefore estimated to be:
rd = (2.16% + 10.2%)*(1-26.3%) → rd = 9.12%
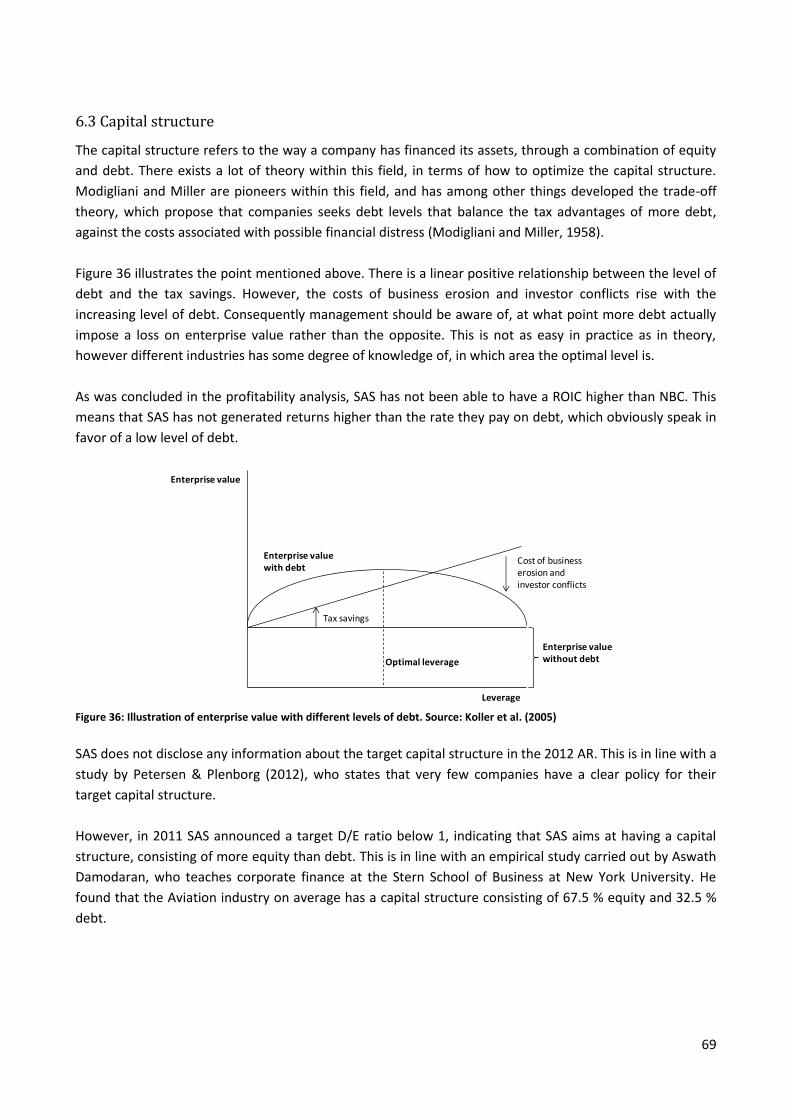
69
6.3 Capital structure
The capital structure refers to the way a company has financed its assets, through a combination of equity
and debt. There exists a lot of theory within this field, in terms of how to optimize the capital structure.
Modigliani and Miller are pioneers within this field, and has among other things developed the trade-off
theory, which propose that companies seeks debt levels that balance the tax advantages of more debt,
against the costs associated with possible financial distress (Modigliani and Miller, 1958).
Figure 36 illustrates the point mentioned above. There is a linear positive relationship between the level of
debt and the tax savings. However, the costs of business erosion and investor conflicts rise with the
increasing level of debt. Consequently management should be aware of, at what point more debt actually
impose a loss on enterprise value rather than the opposite. This is not as easy in practice as in theory,
however different industries has some degree of knowledge of, in which area the optimal level is.
As was concluded in the profitability analysis, SAS has not been able to have a ROIC higher than NBC. This
means that SAS has not generated returns higher than the rate they pay on debt, which obviously speak in
favor of a low level of debt.
Figure 36: Illustration of enterprise value with different levels of debt. Source: Koller et al. (2005)
SAS does not disclose any information about the target capital structure in the 2012 AR. This is in line with a
study by Petersen & Plenborg (2012), who states that very few companies have a clear policy for their
target capital structure.
However, in 2011 SAS announced a target D/E ratio below 1, indicating that SAS aims at having a capital
structure, consisting of more equity than debt. This is in line with an empirical study carried out by Aswath
Damodaran, who teaches corporate finance at the Stern School of Business at New York University. He
found that the Aviation industry on average has a capital structure consisting of 67.5 % equity and 32.5 %
debt.
Tax savings
Cost of business erosion and investor conflicts
Enterprise value with debt
Enterprise value without debt
Leverage
Enterprise value
Optimal leverage
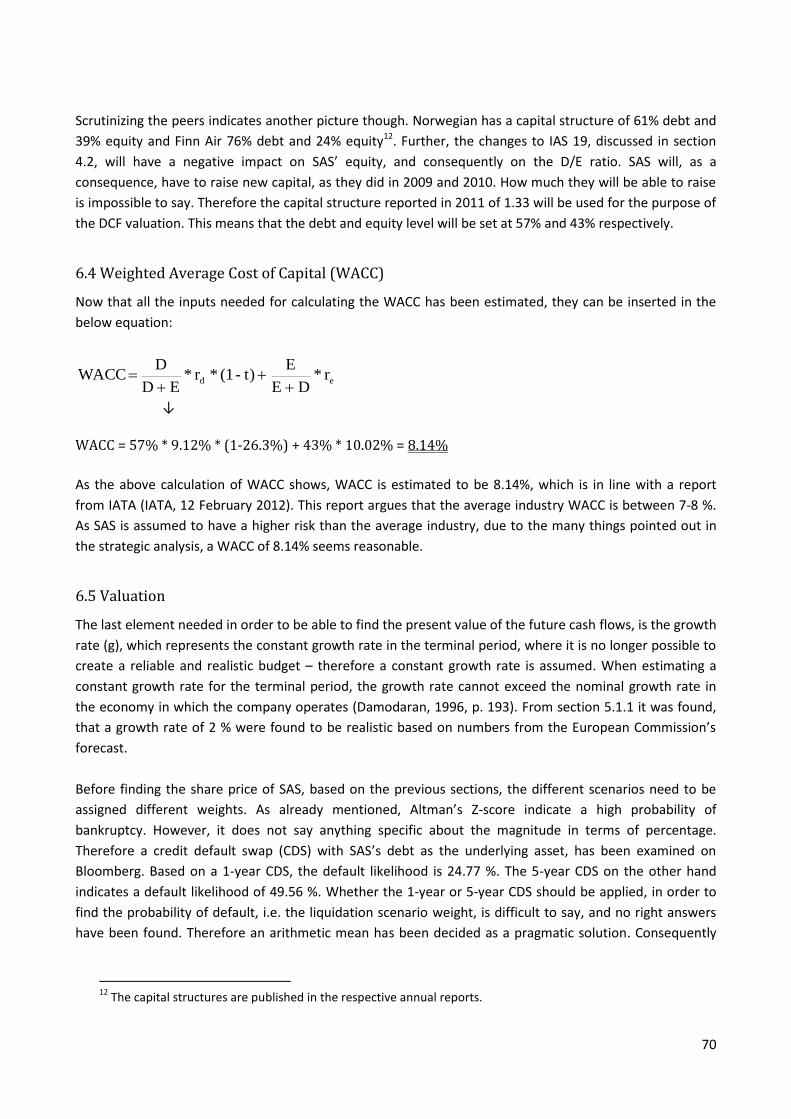
70
Scrutinizing the peers indicates another picture though. Norwegian has a capital structure of 61% debt and
39% equity and Finn Air 76% debt and 24% equity12. Further, the changes to IAS 19, discussed in section
4.2, will have a negative impact on SAS’ equity, and consequently on the D/E ratio. SAS will, as a
consequence, have to raise new capital, as they did in 2009 and 2010. How much they will be able to raise
is impossible to say. Therefore the capital structure reported in 2011 of 1.33 will be used for the purpose of
the DCF valuation. This means that the debt and equity level will be set at 57% and 43% respectively.
6.4 Weighted Average Cost of Capital (WACC)
Now that all the inputs needed for calculating the WACC has been estimated, they can be inserted in the
below equation:
ed r*DE
Et)-(1*r*
ED
D WACC
↓
WACC = 57% * 9.12% * (1-26.3%) + 43% * 10.02% = 8.14%
As the above calculation of WACC shows, WACC is estimated to be 8.14%, which is in line with a report
from IATA (IATA, 12 February 2012). This report argues that the average industry WACC is between 7-8 %.
As SAS is assumed to have a higher risk than the average industry, due to the many things pointed out in
the strategic analysis, a WACC of 8.14% seems reasonable.
6.5 Valuation
The last element needed in order to be able to find the present value of the future cash flows, is the growth
rate (g), which represents the constant growth rate in the terminal period, where it is no longer possible to
create a reliable and realistic budget – therefore a constant growth rate is assumed. When estimating a
constant growth rate for the terminal period, the growth rate cannot exceed the nominal growth rate in
the economy in which the company operates (Damodaran, 1996, p. 193). From section 5.1.1 it was found,
that a growth rate of 2 % were found to be realistic based on numbers from the European Commission’s
forecast.
Before finding the share price of SAS, based on the previous sections, the different scenarios need to be
assigned different weights. As already mentioned, Altman’s Z-score indicate a high probability of
bankruptcy. However, it does not say anything specific about the magnitude in terms of percentage.
Therefore a credit default swap (CDS) with SAS’s debt as the underlying asset, has been examined on
Bloomberg. Based on a 1-year CDS, the default likelihood is 24.77 %. The 5-year CDS on the other hand
indicates a default likelihood of 49.56 %. Whether the 1-year or 5-year CDS should be applied, in order to
find the probability of default, i.e. the liquidation scenario weight, is difficult to say, and no right answers
have been found. Therefore an arithmetic mean has been decided as a pragmatic solution. Consequently
12
The capital structures are published in the respective annual reports.
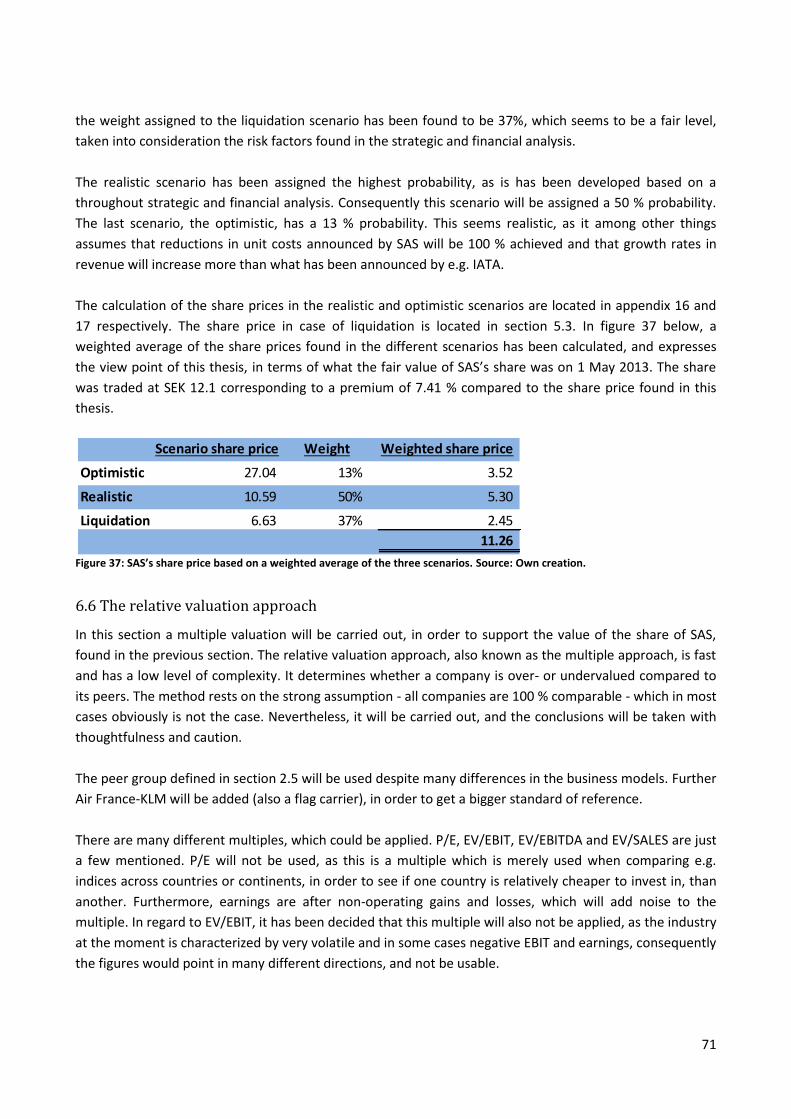
71
the weight assigned to the liquidation scenario has been found to be 37%, which seems to be a fair level,
taken into consideration the risk factors found in the strategic and financial analysis.
The realistic scenario has been assigned the highest probability, as is has been developed based on a
throughout strategic and financial analysis. Consequently this scenario will be assigned a 50 % probability.
The last scenario, the optimistic, has a 13 % probability. This seems realistic, as it among other things
assumes that reductions in unit costs announced by SAS will be 100 % achieved and that growth rates in
revenue will increase more than what has been announced by e.g. IATA.
The calculation of the share prices in the realistic and optimistic scenarios are located in appendix 16 and
17 respectively. The share price in case of liquidation is located in section 5.3. In figure 37 below, a
weighted average of the share prices found in the different scenarios has been calculated, and expresses
the view point of this thesis, in terms of what the fair value of SAS’s share was on 1 May 2013. The share
was traded at SEK 12.1 corresponding to a premium of 7.41 % compared to the share price found in this
thesis.
Figure 37: SAS’s share price based on a weighted average of the three scenarios. Source: Own creation.
6.6 The relative valuation approach
In this section a multiple valuation will be carried out, in order to support the value of the share of SAS,
found in the previous section. The relative valuation approach, also known as the multiple approach, is fast
and has a low level of complexity. It determines whether a company is over- or undervalued compared to
its peers. The method rests on the strong assumption - all companies are 100 % comparable - which in most
cases obviously is not the case. Nevertheless, it will be carried out, and the conclusions will be taken with
thoughtfulness and caution.
The peer group defined in section 2.5 will be used despite many differences in the business models. Further
Air France-KLM will be added (also a flag carrier), in order to get a bigger standard of reference.
There are many different multiples, which could be applied. P/E, EV/EBIT, EV/EBITDA and EV/SALES are just
a few mentioned. P/E will not be used, as this is a multiple which is merely used when comparing e.g.
indices across countries or continents, in order to see if one country is relatively cheaper to invest in, than
another. Furthermore, earnings are after non-operating gains and losses, which will add noise to the
multiple. In regard to EV/EBIT, it has been decided that this multiple will also not be applied, as the industry
at the moment is characterized by very volatile and in some cases negative EBIT and earnings, consequently
the figures would point in many different directions, and not be usable.
Scenario share price Weight Weighted share price
Optimistic 27.04 13% 3.52 -
Realistic 10.59 50% 5.30 -
Liquidation 6.63 37% 2.45
11.26
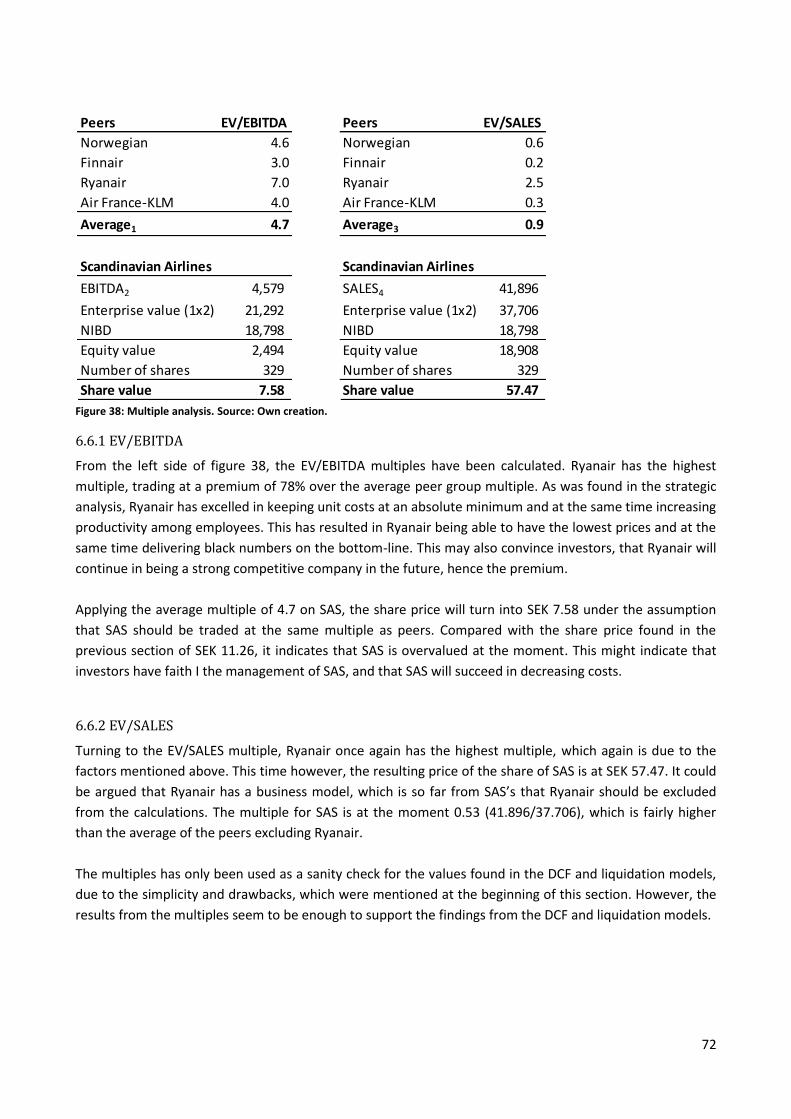
72
Figure 38: Multiple analysis. Source: Own creation.
6.6.1 EV/EBITDA
From the left side of figure 38, the EV/EBITDA multiples have been calculated. Ryanair has the highest
multiple, trading at a premium of 78% over the average peer group multiple. As was found in the strategic
analysis, Ryanair has excelled in keeping unit costs at an absolute minimum and at the same time increasing
productivity among employees. This has resulted in Ryanair being able to have the lowest prices and at the
same time delivering black numbers on the bottom-line. This may also convince investors, that Ryanair will
continue in being a strong competitive company in the future, hence the premium.
Applying the average multiple of 4.7 on SAS, the share price will turn into SEK 7.58 under the assumption
that SAS should be traded at the same multiple as peers. Compared with the share price found in the
previous section of SEK 11.26, it indicates that SAS is overvalued at the moment. This might indicate that
investors have faith I the management of SAS, and that SAS will succeed in decreasing costs.
6.6.2 EV/SALES
Turning to the EV/SALES multiple, Ryanair once again has the highest multiple, which again is due to the
factors mentioned above. This time however, the resulting price of the share of SAS is at SEK 57.47. It could
be argued that Ryanair has a business model, which is so far from SAS’s that Ryanair should be excluded
from the calculations. The multiple for SAS is at the moment 0.53 (41.896/37.706), which is fairly higher
than the average of the peers excluding Ryanair.
The multiples has only been used as a sanity check for the values found in the DCF and liquidation models,
due to the simplicity and drawbacks, which were mentioned at the beginning of this section. However, the
results from the multiples seem to be enough to support the findings from the DCF and liquidation models.
Peers EV/EBITDA Peers EV/SALES
Norwegian 4.6 Norwegian 0.6
Finnair 3.0 Finnair 0.2
Ryanair 7.0 Ryanair 2.5
Air France-KLM 4.0 Air France-KLM 0.3
Average1 4.7 Average3 0.9
Scandinavian Airlines Scandinavian Airlines
EBITDA2 4,579 SALES4 41,896
Enterprise value (1x2) 21,292 Enterprise value (1x2) 37,706
NIBD 18,798 NIBD 18,798
Equity value 2,494 Equity value 18,908
Number of shares 329 Number of shares 329
Share value 7.58 Share value 57.47
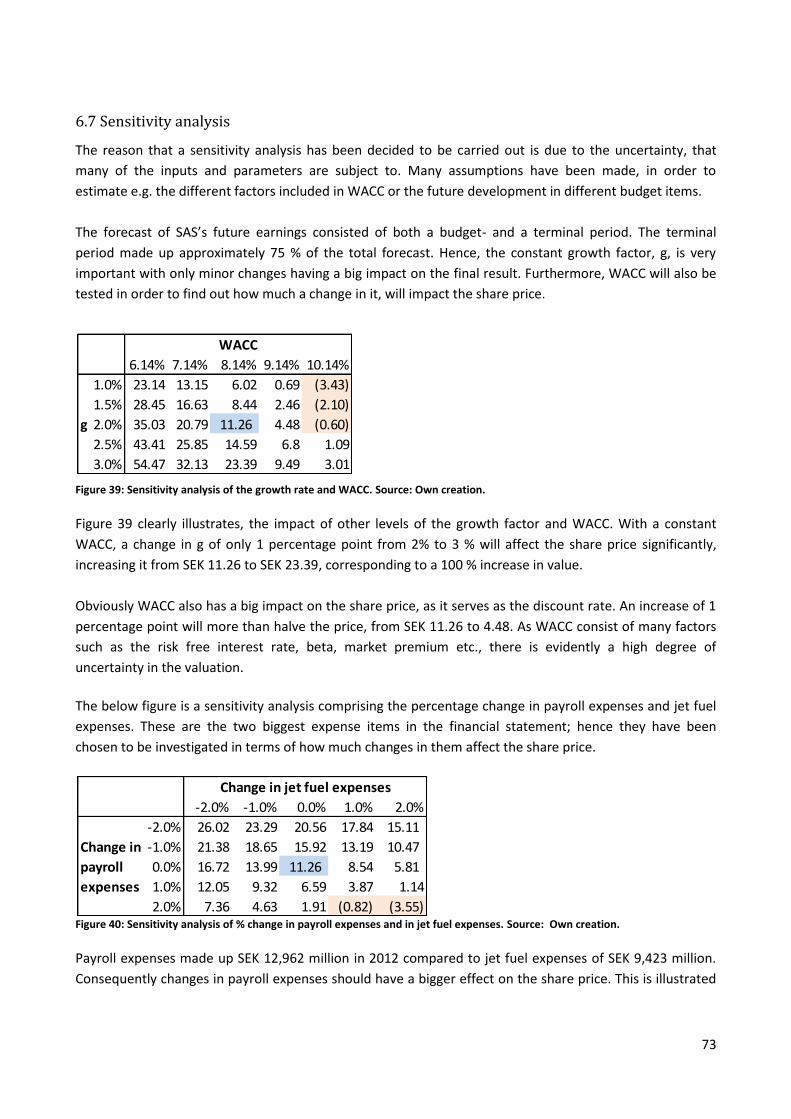
73
6.7 Sensitivity analysis
The reason that a sensitivity analysis has been decided to be carried out is due to the uncertainty, that
many of the inputs and parameters are subject to. Many assumptions have been made, in order to
estimate e.g. the different factors included in WACC or the future development in different budget items.
The forecast of SAS’s future earnings consisted of both a budget- and a terminal period. The terminal
period made up approximately 75 % of the total forecast. Hence, the constant growth factor, g, is very
important with only minor changes having a big impact on the final result. Furthermore, WACC will also be
tested in order to find out how much a change in it, will impact the share price.
Figure 39: Sensitivity analysis of the growth rate and WACC. Source: Own creation.
Figure 39 clearly illustrates, the impact of other levels of the growth factor and WACC. With a constant
WACC, a change in g of only 1 percentage point from 2% to 3 % will affect the share price significantly,
increasing it from SEK 11.26 to SEK 23.39, corresponding to a 100 % increase in value.
Obviously WACC also has a big impact on the share price, as it serves as the discount rate. An increase of 1
percentage point will more than halve the price, from SEK 11.26 to 4.48. As WACC consist of many factors
such as the risk free interest rate, beta, market premium etc., there is evidently a high degree of
uncertainty in the valuation.
The below figure is a sensitivity analysis comprising the percentage change in payroll expenses and jet fuel
expenses. These are the two biggest expense items in the financial statement; hence they have been
chosen to be investigated in terms of how much changes in them affect the share price.
Figure 40: Sensitivity analysis of % change in payroll expenses and in jet fuel expenses. Source: Own creation.
Payroll expenses made up SEK 12,962 million in 2012 compared to jet fuel expenses of SEK 9,423 million.
Consequently changes in payroll expenses should have a bigger effect on the share price. This is illustrated
6.14% 7.14% 8.14% 9.14% 10.14%
1.0% 23.14 13.15 6.02 0.69 (3.43)
1.5% 28.45 16.63 8.44 2.46 (2.10)
g 2.0% 35.03 20.79 11.26 4.48 (0.60)
2.5% 43.41 25.85 14.59 6.8 1.09
3.0% 54.47 32.13 23.39 9.49 3.01
WACC
-2.0% -1.0% 0.0% 1.0% 2.0%
-2.0% 26.02 23.29 20.56 17.84 15.11
Change in -1.0% 21.38 18.65 15.92 13.19 10.47
payroll 0.0% 16.72 13.99 11.26 8.54 5.81
expenses 1.0% 12.05 9.32 6.59 3.87 1.14
2.0% 7.36 4.63 1.91 (0.82) (3.55)
Change in jet fuel expenses
74
in figure 40. If payroll expenses are being cut by 2 percentage point, more than what has been used in the
budget, the share price will go from SEK 11.26 to 20.56, meaning that there is a huge incitement from the
management’s point of view to decrease payroll expenses. However, as mentioned in the strategic analysis,
there are many strong labor unions, which can be very hard to persuade. However, SAS is known of very
high salaries, and must in the future bring the level of salaries closer to that of its peer group, in order to be
able to compete on level playing field.
Jet fuel expenses are another important area. Obviously fluctuations in crude oil is hard to avoid in the long
run, however as mentioned in earlier sections, SAS has invested in new and more fuel efficient aircrafts,
which will have a positive impact on the amount of fuel used. These savings have already been accounted
for in the budget, therefore it is not believed that this is where big changes can happen.
The sensitivity analysis has shown that the PV valuation models are very sensitive to only minor changes in
the inputs. Consequently the distance from success to bankruptcy is not very big. If for example jet fuel
expenses increase with 2 percentage points the share price will, ceteris paribus, decrease from SEK 11.26 to
SEK 5.81. On the other hand, if management succeeds in decreasing salaries by e.g. 2 percentage point
more than the assumptions in the budget, the share price will increase with about 82%. Therefore, as
mentioned previously, only small changes in the wrong direction, would threaten the existence of SAS.
75
Part 7: Conclusion
7.1 Conclusion
In the previous a throughout analysis has been carried out, in order to understand the history, internal
factors and environment that SAS operates in, for the purpose of assessing a fair value of the SAS share.
SAS was founded back in 1946, where the airline industry was characterized by being heavily regulated by
the states. Therefore SAS had monopoly on many routes, which resulted in management not having focus
on the cost side, as high costs could be solved by higher prices.
High costs are still one of the main problems in SAS today. As concluded in the strategic analysis, SAS’s unit
costs are the highest among peers with Norwegian, its main competitor, with a level corresponding to 32 %
lower than SAS’s. Payroll expenses are the biggest hurtle, and accounting for productivity, SAS has by far
the lowest productive employees, which is something management has to turn around.
The industry has since the 00’s been characterized by increasingly competition from LCCs’ such as Ryanair
and Norwegian. As a consequence SAS has lost market shares, and SAS has felt no choice but to changing
e.g. the ticket structure, in order to be able to offer cheaper tickets and thereby hopefully retaining market
shares. This has had the unfortunate drawback of locating SAS with a strategy, defined as “stuck in the
middle”, which as concluded in section 3.3.4, can be problematic.
The macro environment is however experiencing some bright spots. The global economy, analyzed in the
strategic analysis, is about to exit the recession which has been characterizing the global economy since fall
2008. Many economic indicators are supporting this, e.g. the GDP growth prospects. As the regression
analysis illustrated a positive linear relationship between the growth in the airline industry and GDP, it
looks brighter for the future growth in the industry, than has been the case for many years.
A major concern in SAS has been the changes to the IAS 19, which for SAS will have effect from the financial
year starting on 1 November 2013. The loss of SEK 7.9 billion, which will be recorded on shareholders
equity, will call for additional capital in order for SAS to continue as going concern. As SAS has asked
investors for help several times the last couple of years, it will be interesting to see, if they are willing to
come up with additional capital, which obviously impose a huge risk for SAS.
With the above conclusions, including an analysis of the historical performance, indicating an unacceptable
performance, with ROIC < WACC and ROE < Re, the share price of SAS was determined, based on three
different scenarios. The optimistic and realistic scenarios were based on budgets of the future
performance, which was valued by using the DCF model. The worst case scenario was a liquidation value of
SAS, which has been supported by Altman’s Z-score, indicating high probability of bankruptcy within 12
months, and the default probabilities of credit default swaps with different maturities.
76
The different scenarios with different weights attached, resulted in a share price of SAS as of 1 May 2013 of
SEK 11.26, corresponding to a discount of 7.41 % relatively to the price of SEK 12.1 observed in the market,
indicating that the share might have been overvalued on the cut-off date.
After carrying out a sensitivity analysis, it was concluded that the valuation is very sensitive to changes in
underlying assumptions, such as changes in e.g. the growth rate in the terminal period, WACC and
growth/declines in difference cost items. Hence, the valuation should be evaluated with prudence.
7.2 The future of SAS
As it has been found necessary to set up a cut-off date in this thesis, due to the endless amount of news
streams on a company like SAS listed on the stock exchange, there have obviously been published some
interesting news since 1 May 2013, for which part the most important and interesting briefly will be
touched upon in this section.
In June SAS succeeded in divesting 80 % of Widerøe to a Norwegian investor group. This sale amounted to
SEK 2.7 billion, and was part of the 4XNG strategy, where an asset sale of SEK 3 billion was the objective, in
order to raise liquidity. In this sales process, the Norwegian investor group was offered the option to buy
the remaining 20 % of Widerøe in 2016. This naturally has reduced the amount of needed capital, when
changes to IAS 19 become effective from 1 November 2013, where a loss on shareholders’ equity, of SEK
7.9 billion, will take place. SAS however, will still have to raise capital, which is still one of the big risk
factors of the company.
SAS published the Q3 interim report on 4 September 2013. This showed earnings before tax of SEK 1,120
million, up from SEK 726 from 2012. The positive result was to some degree due to non-recurring items of
SEK 247. However, the big picture showed a SAS which was following the strategy, by selling non-key
related activities, decreasing unit costs and increasing the passenger number. This is a good sign which, in
hindsight, could indicate a lower possibility of default than what was anticipated in the valuation of SAS.
However, the overall picture, supported by Altman’s Z-score, default probabilities from the credit default
swaps and the risk factors found in the strategic analysis, still points towards a SAS in big financial troubles.
77
Bibliography Books: Andersen F. R., Jensen B. W., Jepsen K., Schmalz P. and Sørensen J.K. (2007), International Markedsføring, Trojka, 3rd edition. Damodaran, A. (1996), Investment Valuation, John Wiley & Sons, 1st edition. Hanlon P. (2007), Global Airlines, Competition in a transnational industry, Butterworth/Heinemann publishing firm. Hansen P. V., Lotz P., Dalum B. og Bech H. (2006). Erhvervsbeskrivelse – Økonomiske begreber og data om virksomheders omverden. Handelshøjskolens forlag. 1st edition. Horn P. and Willumsen J. W. (2006), SAS – Når tiden er vigtigst, historien om SAS’ turnaround. Børsen forlag, 1st edition. Hoskission R. E., Hitt M. A., Ireland D. and Harrison J. S. (2008), Competing for Advantage, 2. edition, Thomson. Koller T., Goedhart M. and Wessels D. (2005), Valuation – measuring and managing the value of companies. McKinsey & Company. 4th edition. Petersen C. V. and Plenborg T. (2012), Financial Statement Analysis – Valuation, Credit analysis and Executive compensation. Pearson. Porter M. E. (1980), Competitive strategy – techniques for analyzing industries and competitors, The free press. Sørensen O. (2012), Regnskabsanalyse og værdiansættelse – en praktisk tilgang, Gjellerup/Gads forlag. 4th edition. Annual reports and other publications: Airbus Aircraft 2013 Average Price List Prices, January 2013. Airbus Global Market Forecast 2012-2031, September 2012. COWI – Luftfarten I Scandinavien – værdi og betydning. November 2004. Deloitte – International Tax, Sweden highlights 2013. January 2013. Deloitte – News release: UK airlines start to value landing slots as assets on balance sheets. 15 May 2008. European Commission, Directorate-General for Mobility and Transportation – High Speed Europe, 2010. European Commision (2011), Endorsement of the Amendments to IAS 19 Employee benefits – Introduction, background and analysis, Brussels, December 2011.
78
IMF - Regional Economic Outlook, Western Hemisphere – Time to Rebuild Policy Spare, May 2013. IATA – World Slot Guidelines. Effective January 2013, 4th edition. IATA – Press release no. 2, 31. January 2013, Passenger demand grew as air cargo declined in 2012. IATA – Annual review 2008-2012. Norwegian annual reports – 2002-2012 Norwegian NFF presentation May 19, 2011. Press release: MSCI Indices Q1 2013 Performance Results, April 2013. Press release: Marriot announces Go There Virtual Meetings, 27 January 2010. Press release: SAS makes travelling easier – introducing SAS GO and SAS Plus. 22 March 2013. SAS annual reports – 2002-2012 SEB – Nordic Outlook, Economic Research, February 2013. U.S. Energy Information Administration, Annual Energy Outlook 2003 – with projections to 2040, April 2013. Journal articles and working papers: Bishop S., Fitzsimmons M. and Officer B. (2011), Adjusting the Market Risk Premium to Reflect the Global Financial Crisis, The Finsia Journal of Applied Finance, No. 1, pages 8-14. Brennan, Michael (1969), Capital market Equilibrium with Divergent Borrowing and Lending Rules, Journal of Financial and Quantitative Analysis 4, no. 1 (March) 4-14. Damodaran A. (1999), Equity Risk Premiums, Working paper, Stern School of Business. Fama E. and French K., The Cross-Section of Expected Stock Returns, Journal of Finance, (June 1992), pages 427-465. Fernandez P., Aquirreamalloa J. and Corres Luis (2012), Market Risk Premium used in 82 countries in 2012: A survey with 7,192 answers, IESE Business School, June 19, 2012. Hvass, K. (2006), Fra LCC til FSC: Forretningsmodellernes nuancer og deres indflydelse på profitabiliteten, Working paper no. 4, April 2006. Levy Haim, Giorgi G. D. Enrico and Hens Thorsten (2011), Two Paradigms and Nobel Prizes in Economics: A Contradiction or Coexistence?, European Financial Management, Vol. 18, Issue 2, (March 2012), pages 163-182. Lijesen M. G. (2004), Adjusting the Herifindahl index for close substitutes: an application to pricing in civil aviation, Transportation Research Part E, Vol. 40, Issue 2, (March 2004), pages 123-134.
79
Miller M. H., & Modigliani F. (1961), Dividend policy, growth, and the valuation of shares, Journal of Business, Vol. 34, issue 4, pages 411–433. Modigliani F. & Miller M. H. (1958), The cost of capital, Corporation Finance and the Theory of Investment, The American Economic Review, vol. 48, no. 3, pages 261-297. O’connell J. F. and Williams G., (2005), Passengers’ perceptions of low cost airlines and full service carriers – A case study involving Ryanair, Aer Lingus, Air Asia and Malaysia Airlines., Journal of Air Transport Management, Vol. 11, Issue 4, July 2005, pages 259-272. Penman, Stephen H. and Sougiannis, Theodore, (1998), A Comparison of Dividend, Cash Flow, and Earnings Approaches to Equity Valuation, Contemporary Accounting Research, Vol. 15, issue 3, pages 343-383. Petersen C., Plenborg T. and Schøler F. (2006), Hvordan værdiansættes unoterede virksomheder I praksis?, Ledelse & Erhvervsøkonomi, Vol. 70, Issue 3, pages 157-172. Philippe J. and Goetzmann W. N. (2000), Global stock markets in the twentieth century, Working paper, Yale School of Management.
Newspaper and other articles:
Damodaran A., 19 May 2013, Musings on Markets. www.aswathdamodaran.blogspot.com
Flensburg T. and Fastrup N., 16 November 2012, Skæbnemøde i ryggen af en truende SAS-konkurs.
www.politiken.dk
Jørgensen S., 22 Marc 2013, SAS afskaffer business class. www.finans.tv2.dk
Krog A., 29 August 2012, Dansk Luftfart: Afgift vil være pind til indenrigsflyvningens ligkiste.
www.check-in.dk
Krog A., 12 November 2012, Ekspert: Stater kan slippe af sted med ulovlig SAS-støtte. www.check-in.dk
Lassen L. H., 19 November 2012, Sådan er aftalen mellem SAS og piloterne. www.business.dk
Mouawas J., 2 May 2012, Trapped in the Middle Seat. www.nytimes.com
Rothman A. & Tan L., 7 June, 2011 Airbus expects to get Boeings customer to switch to A302neo
www.bloomberg.com
Sand, T., 3 April 2013, Lavprisselskaber truer SAS. www.business.dk
Stelling I., 9 February 2010, Ekspert: Det ligner ulovlig statsstøtte. www.avisen.dk
Tjolle V., 28 May 2013, Eurostar to challenge more airline routes. www.travelmole.com
80
Thompson S., 28 December 2012, Heathrow Airport slot trading. www.routes-news.com Ussing J., 6 April 2013, Den grønne SAS-bog og de andre år. www.business.dk Internet pages:
www.aea.be
www.airbus.com
www.avisen.dk
www.borsen.dk
www.bloomberg.com
www.business.dk
www.centreforaviation.com
www.check-in.dk
www.deloitte.com
www.epn.dk
www.finnair.com
www.finance.yahoo.com
www.finans.tv2.dk
www.iata.org
www.imf.org
www.msci.com
www.norwegian.com
www.nytimes.com
www.politiken.dk
www.routes-news.com
www.ryanair.com
www.sasgroup.net
www.statistikbanken.dk
www.travelmole.com
www.tui-group.com
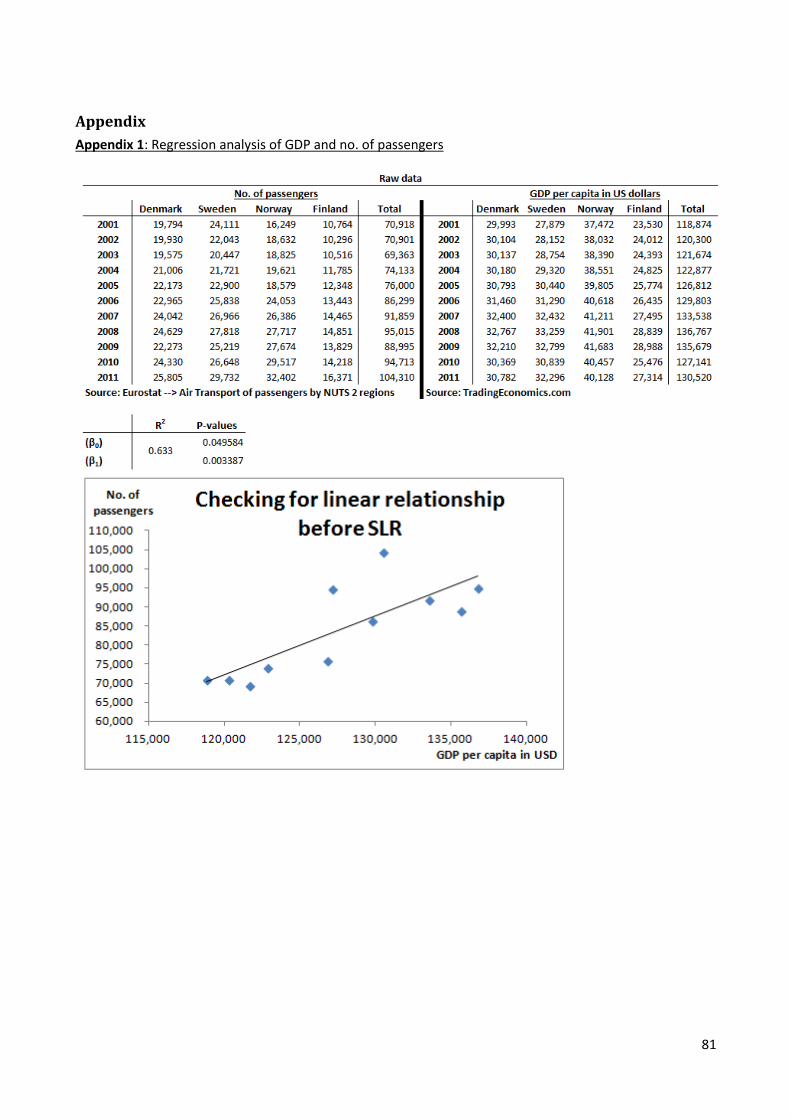
81
Appendix
Appendix 1: Regression analysis of GDP and no. of passengers
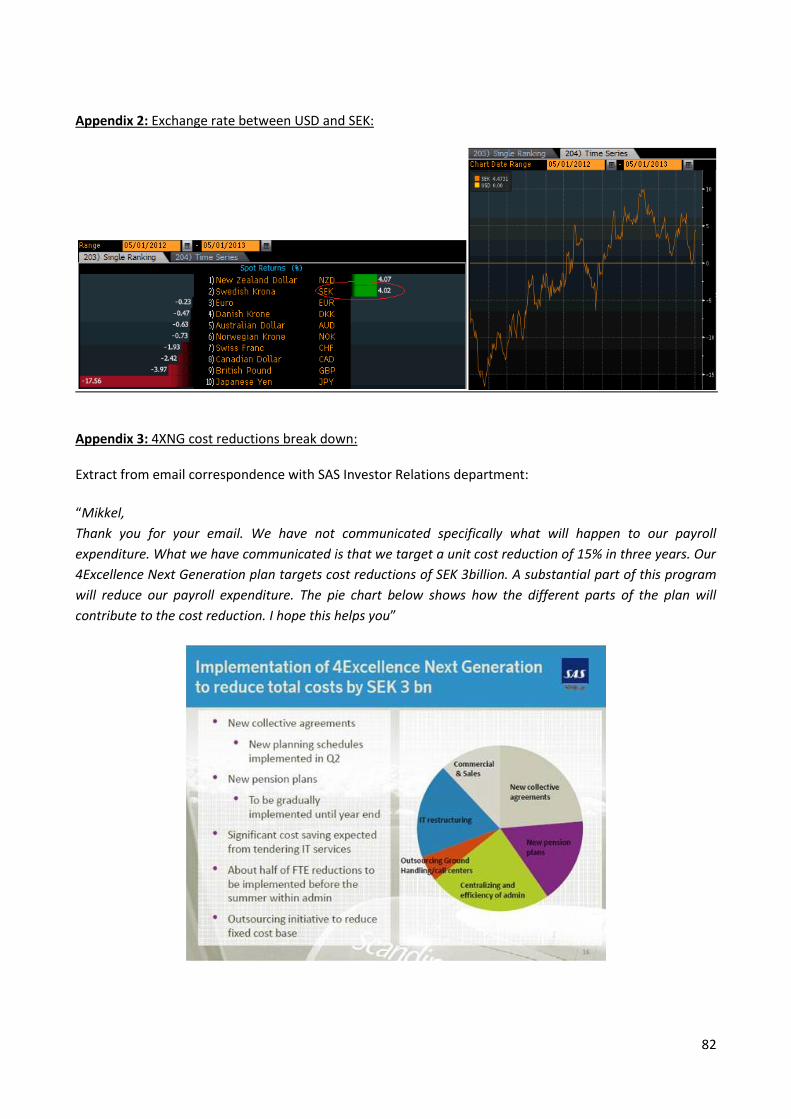
82
Appendix 2: Exchange rate between USD and SEK:
Appendix 3: 4XNG cost reductions break down: Extract from email correspondence with SAS Investor Relations department:
“Mikkel,
Thank you for your email. We have not communicated specifically what will happen to our payroll
expenditure. What we have communicated is that we target a unit cost reduction of 15% in three years. Our
4Excellence Next Generation plan targets cost reductions of SEK 3billion. A substantial part of this program
will reduce our payroll expenditure. The pie chart below shows how the different parts of the plan will
contribute to the cost reduction. I hope this helps you”
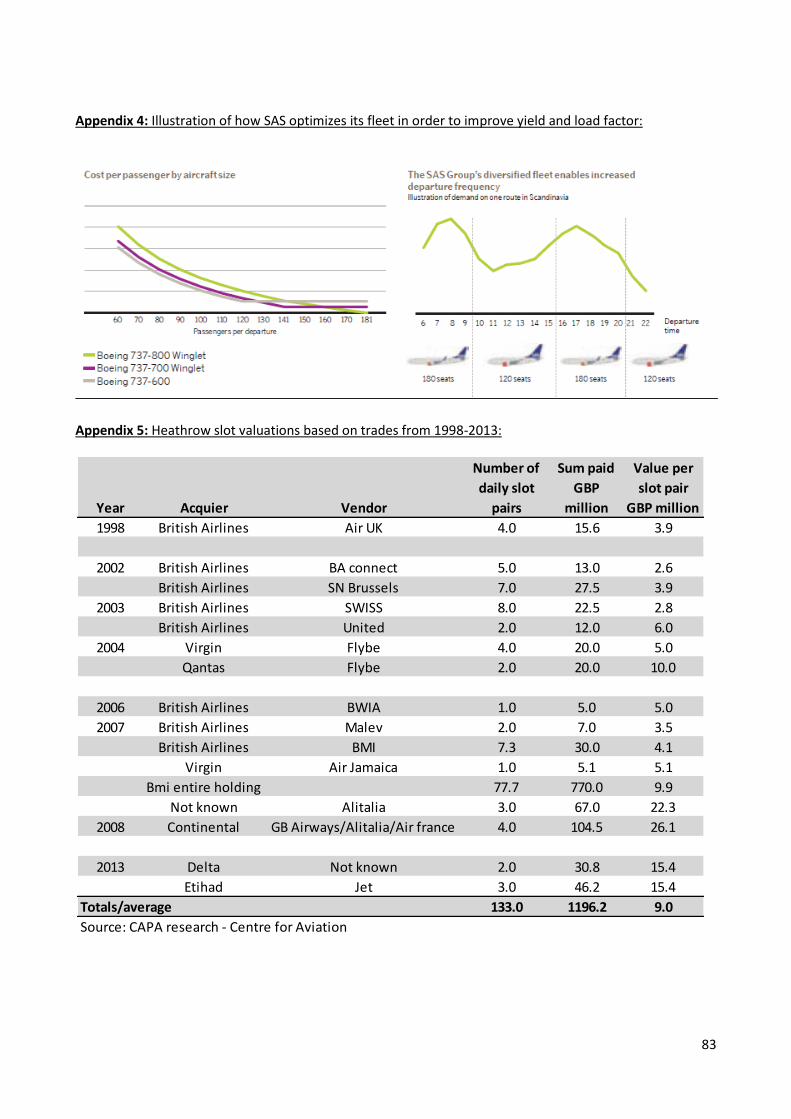
83
Appendix 4: Illustration of how SAS optimizes its fleet in order to improve yield and load factor:
Appendix 5: Heathrow slot valuations based on trades from 1998-2013:
Year Acquier Vendor
Number of
daily slot
pairs
Sum paid
GBP
million
Value per
slot pair
GBP million
1998 British Airlines Air UK 4.0 15.6 3.9
2002 British Airlines BA connect 5.0 13.0 2.6
British Airlines SN Brussels 7.0 27.5 3.9
2003 British Airlines SWISS 8.0 22.5 2.8
British Airlines United 2.0 12.0 6.0
2004 Virgin Flybe 4.0 20.0 5.0
Qantas Flybe 2.0 20.0 10.0
2006 British Airlines BWIA 1.0 5.0 5.0
2007 British Airlines Malev 2.0 7.0 3.5
British Airlines BMI 7.3 30.0 4.1
Virgin Air Jamaica 1.0 5.1 5.1
Bmi entire holding 77.7 770.0 9.9
Not known Alitalia 3.0 67.0 22.3
2008 Continental GB Airways/Alitalia/Air france 4.0 104.5 26.1
2013 Delta Not known 2.0 30.8 15.4
Etihad Jet 3.0 46.2 15.4
Totals/average 133.0 1196.2 9.0
Source: CAPA research - Centre for Aviation
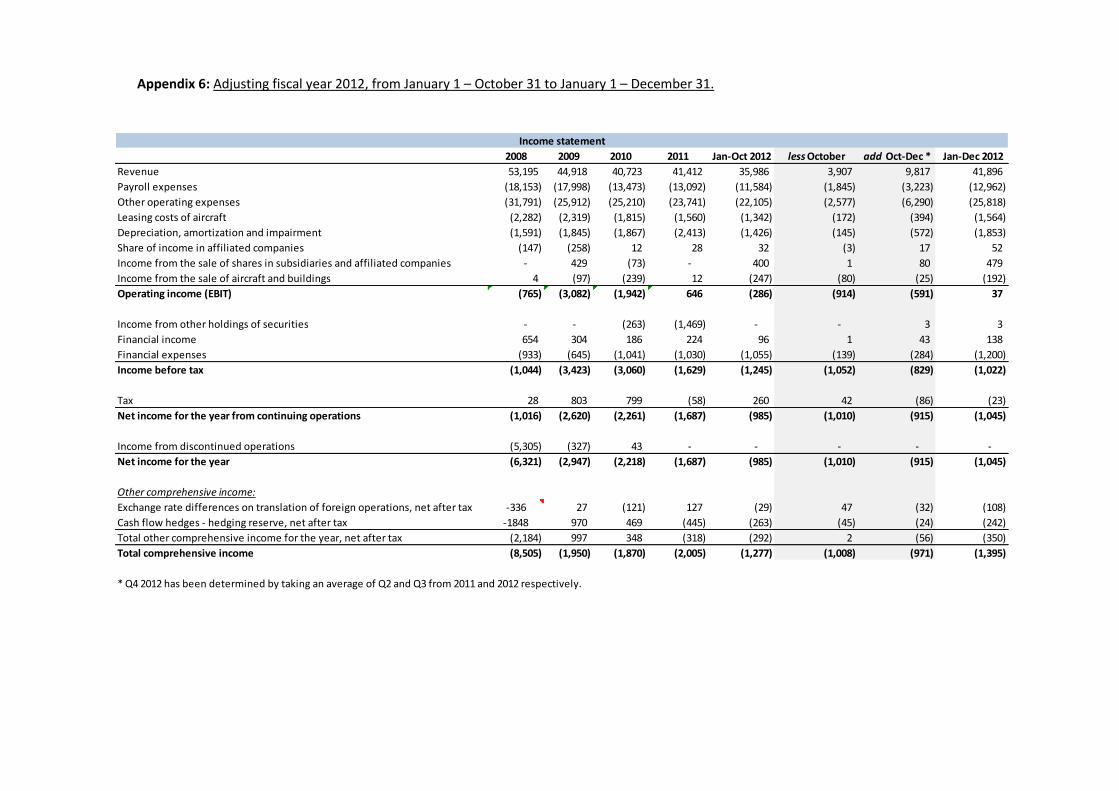
Appendix 6: Adjusting fiscal year 2012, from January 1 – October 31 to January 1 – December 31.
2008 2009 2010 2011 Jan-Oct 2012 less October add Oct-Dec * Jan-Dec 2012
Revenue 53,195 44,918 40,723 41,412 35,986 3,907 9,817 41,896
Payroll expenses (18,153) (17,998) (13,473) (13,092) (11,584) (1,845) (3,223) (12,962)
Other operating expenses (31,791) (25,912) (25,210) (23,741) (22,105) (2,577) (6,290) (25,818)
Leasing costs of aircraft (2,282) (2,319) (1,815) (1,560) (1,342) (172) (394) (1,564)
Depreciation, amortization and impairment (1,591) (1,845) (1,867) (2,413) (1,426) (145) (572) (1,853)
Share of income in affiliated companies (147) (258) 12 28 32 (3) 17 52
Income from the sale of shares in subsidiaries and affiliated companies - 429 (73) - 400 1 80 479
Income from the sale of aircraft and buildings 4 (97) (239) 12 (247) (80) (25) (192)
Operating income (EBIT) (765) (3,082) (1,942) 646 (286) (914) (591) 37
Income from other holdings of securities - - (263) (1,469) - - 3 3
Financial income 654 304 186 224 96 1 43 138
Financial expenses (933) (645) (1,041) (1,030) (1,055) (139) (284) (1,200)
Income before tax (1,044) (3,423) (3,060) (1,629) (1,245) (1,052) (829) (1,022)
Tax 28 803 799 (58) 260 42 (86) (23)
Net income for the year from continuing operations (1,016) (2,620) (2,261) (1,687) (985) (1,010) (915) (1,045)
Income from discontinued operations (5,305) (327) 43 - - - - -
Net income for the year (6,321) (2,947) (2,218) (1,687) (985) (1,010) (915) (1,045)
Other comprehensive income:
Exchange rate differences on translation of foreign operations, net after tax -336 27 (121) 127 (29) 47 (32) (108)
Cash flow hedges - hedging reserve, net after tax -1848 970 469 (445) (263) (45) (24) (242)
Total other comprehensive income for the year, net after tax (2,184) 997 348 (318) (292) 2 (56) (350)
Total comprehensive income (8,505) (1,950) (1,870) (2,005) (1,277) (1,008) (971) (1,395)
* Q4 2012 has been determined by taking an average of Q2 and Q3 from 2011 and 2012 respectively.
Income statement
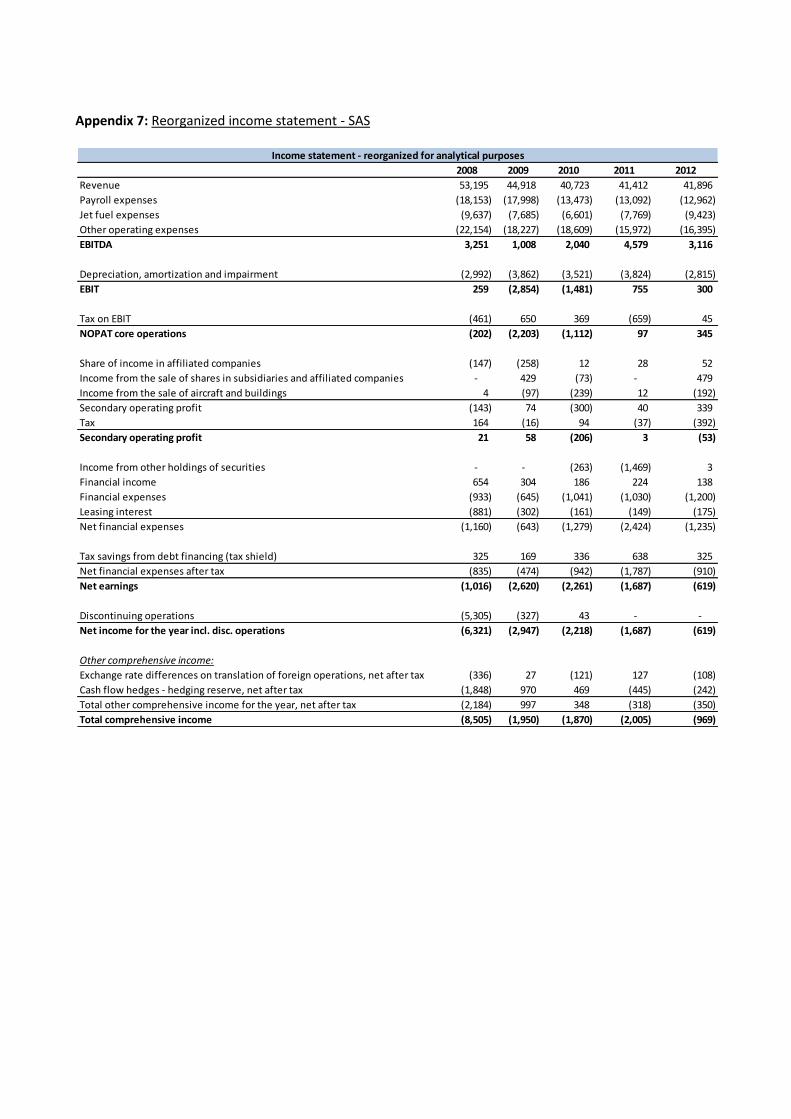
Appendix 7: Reorganized income statement - SAS
2008 2009 2010 2011 2012
Revenue 53,195 44,918 40,723 41,412 41,896
Payroll expenses (18,153) (17,998) (13,473) (13,092) (12,962)
Jet fuel expenses (9,637) (7,685) (6,601) (7,769) (9,423)
Other operating expenses (22,154) (18,227) (18,609) (15,972) (16,395)
EBITDA 3,251 1,008 2,040 4,579 3,116
Depreciation, amortization and impairment (2,992) (3,862) (3,521) (3,824) (2,815)
EBIT 259 (2,854) (1,481) 755 300
Tax on EBIT (461) 650 369 (659) 45
NOPAT core operations (202) (2,203) (1,112) 97 345
Share of income in affiliated companies (147) (258) 12 28 52
Income from the sale of shares in subsidiaries and affiliated companies - 429 (73) - 479
Income from the sale of aircraft and buildings 4 (97) (239) 12 (192)
Secondary operating profit (143) 74 (300) 40 339
Tax 164 (16) 94 (37) (392)
Secondary operating profit 21 58 (206) 3 (53)
Income from other holdings of securities - - (263) (1,469) 3
Financial income 654 304 186 224 138
Financial expenses (933) (645) (1,041) (1,030) (1,200)
Leasing interest (881) (302) (161) (149) (175)
Net financial expenses (1,160) (643) (1,279) (2,424) (1,235)
Tax savings from debt financing (tax shield) 325 169 336 638 325
Net financial expenses after tax (835) (474) (942) (1,787) (910)
Net earnings (1,016) (2,620) (2,261) (1,687) (619)
Discontinuing operations (5,305) (327) 43 - -
Net income for the year incl. disc. operations (6,321) (2,947) (2,218) (1,687) (619)
Other comprehensive income:
Exchange rate differences on translation of foreign operations, net after tax (336) 27 (121) 127 (108)
Cash flow hedges - hedging reserve, net after tax (1,848) 970 469 (445) (242)
Total other comprehensive income for the year, net after tax (2,184) 997 348 (318) (350)
Total comprehensive income (8,505) (1,950) (1,870) (2,005) (969)
Income statement - reorganized for analytical purposes
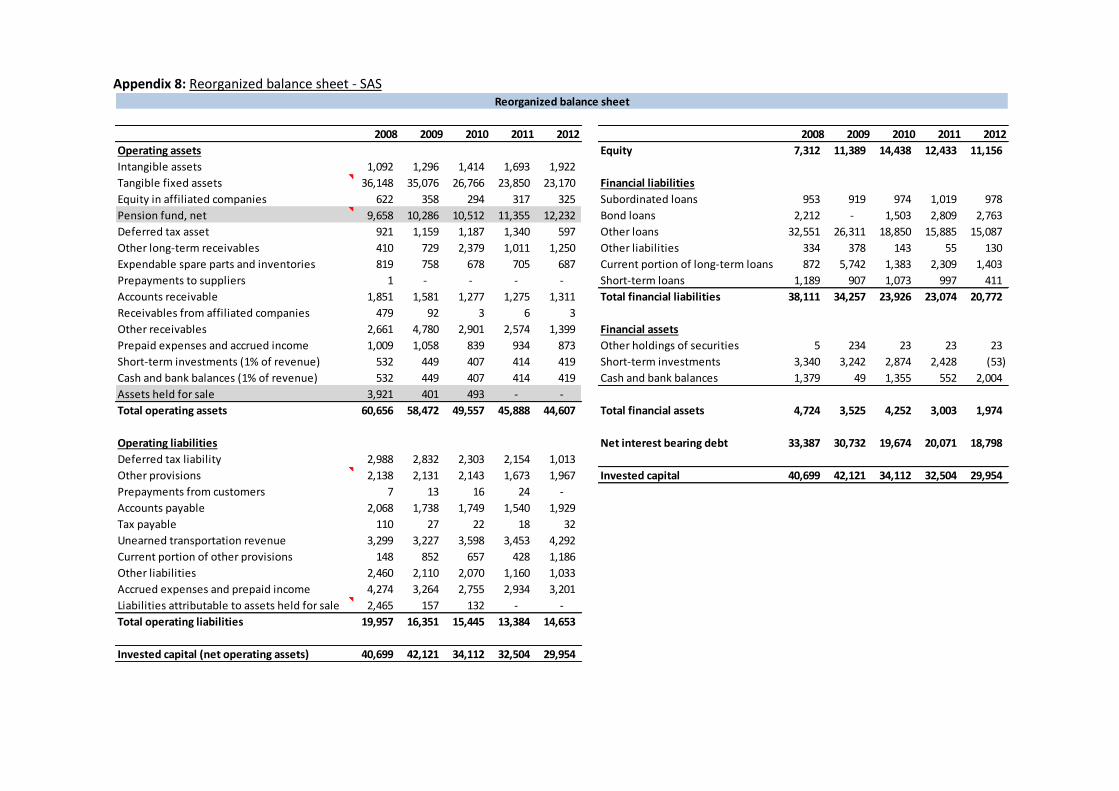
Appendix 8: Reorganized balance sheet - SAS
2008 2009 2010 2011 2012 2008 2009 2010 2011 2012
Operating assets Equity 7,312 11,389 14,438 12,433 11,156
Intangible assets 1,092 1,296 1,414 1,693 1,922
Tangible fixed assets 36,148 35,076 26,766 23,850 23,170 Financial liabilities
Equity in affiliated companies 622 358 294 317 325 Subordinated loans 953 919 974 1,019 978
Pension fund, net 9,658 10,286 10,512 11,355 12,232 Bond loans 2,212 - 1,503 2,809 2,763
Deferred tax asset 921 1,159 1,187 1,340 597 Other loans 32,551 26,311 18,850 15,885 15,087
Other long-term receivables 410 729 2,379 1,011 1,250 Other liabilities 334 378 143 55 130
Expendable spare parts and inventories 819 758 678 705 687 Current portion of long-term loans 872 5,742 1,383 2,309 1,403
Prepayments to suppliers 1 - - - - Short-term loans 1,189 907 1,073 997 411
Accounts receivable 1,851 1,581 1,277 1,275 1,311 Total financial liabilities 38,111 34,257 23,926 23,074 20,772
Receivables from affiliated companies 479 92 3 6 3
Other receivables 2,661 4,780 2,901 2,574 1,399 Financial assets
Prepaid expenses and accrued income 1,009 1,058 839 934 873 Other holdings of securities 5 234 23 23 23
Short-term investments (1% of revenue) 532 449 407 414 419 Short-term investments 3,340 3,242 2,874 2,428 (53)
Cash and bank balances (1% of revenue) 532 449 407 414 419 Cash and bank balances 1,379 49 1,355 552 2,004
Assets held for sale 3,921 401 493 - -
Total operating assets 60,656 58,472 49,557 45,888 44,607 Total financial assets 4,724 3,525 4,252 3,003 1,974
Operating liabilities Net interest bearing debt 33,387 30,732 19,674 20,071 18,798
Deferred tax liability 2,988 2,832 2,303 2,154 1,013
Other provisions 2,138 2,131 2,143 1,673 1,967 Invested capital 40,699 42,121 34,112 32,504 29,954
Prepayments from customers 7 13 16 24 -
Accounts payable 2,068 1,738 1,749 1,540 1,929
Tax payable 110 27 22 18 32
Unearned transportation revenue 3,299 3,227 3,598 3,453 4,292
Current portion of other provisions 148 852 657 428 1,186
Other liabilities 2,460 2,110 2,070 1,160 1,033
Accrued expenses and prepaid income 4,274 3,264 2,755 2,934 3,201
Liabilities attributable to assets held for sale 2,465 157 132 - -
Total operating liabilities 19,957 16,351 15,445 13,384 14,653
Invested capital (net operating assets) 40,699 42,121 34,112 32,504 29,954
Reorganized balance sheet
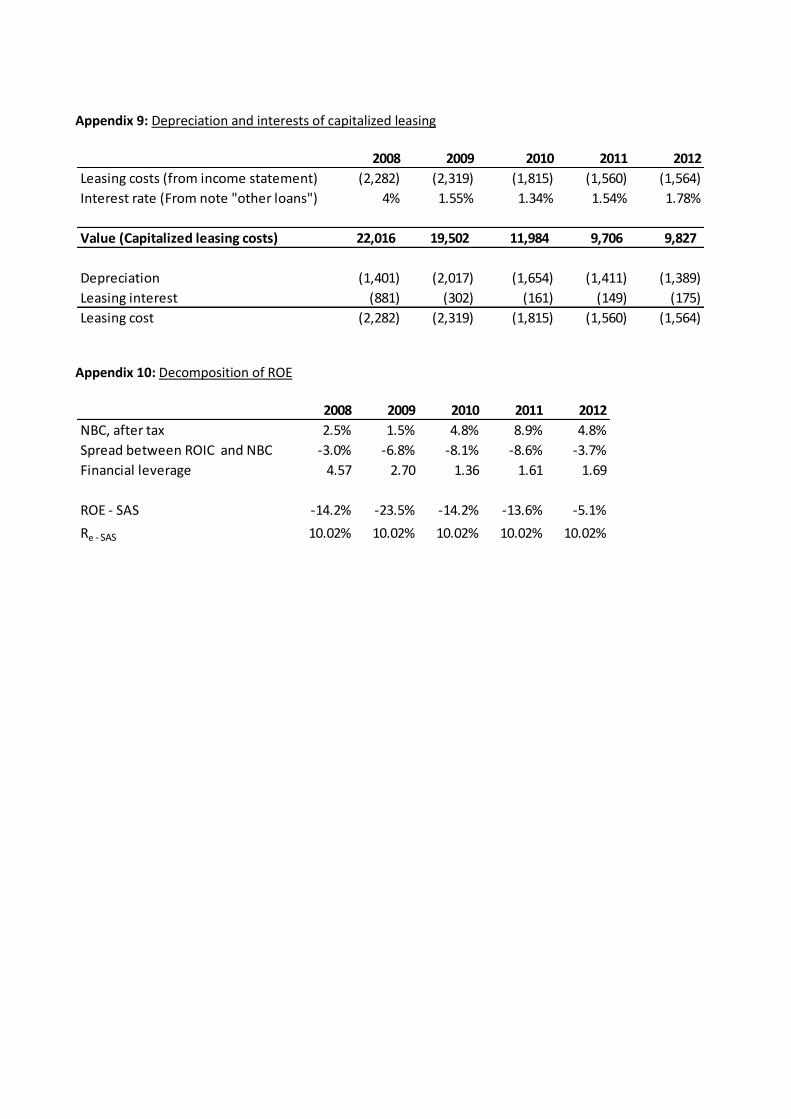
Appendix 9: Depreciation and interests of capitalized leasing
Appendix 10: Decomposition of ROE
2008 2009 2010 2011 2012
Leasing costs (from income statement) (2,282) (2,319) (1,815) (1,560) (1,564)
Interest rate (From note "other loans") 4% 1.55% 1.34% 1.54% 1.78%
Value (Capitalized leasing costs) 22,016 19,502 11,984 9,706 9,827
Depreciation (1,401) (2,017) (1,654) (1,411) (1,389)
Leasing interest (881) (302) (161) (149) (175)
Leasing cost (2,282) (2,319) (1,815) (1,560) (1,564)
2008 2009 2010 2011 2012
NBC, after tax 2.5% 1.5% 4.8% 8.9% 4.8%
Spread between ROIC and NBC -3.0% -6.8% -8.1% -8.6% -3.7%
Financial leverage 4.57 2.70 1.36 1.61 1.69
ROE - SAS -14.2% -23.5% -14.2% -13.6% -5.1%
Re - SAS 10.02% 10.02% 10.02% 10.02% 10.02%
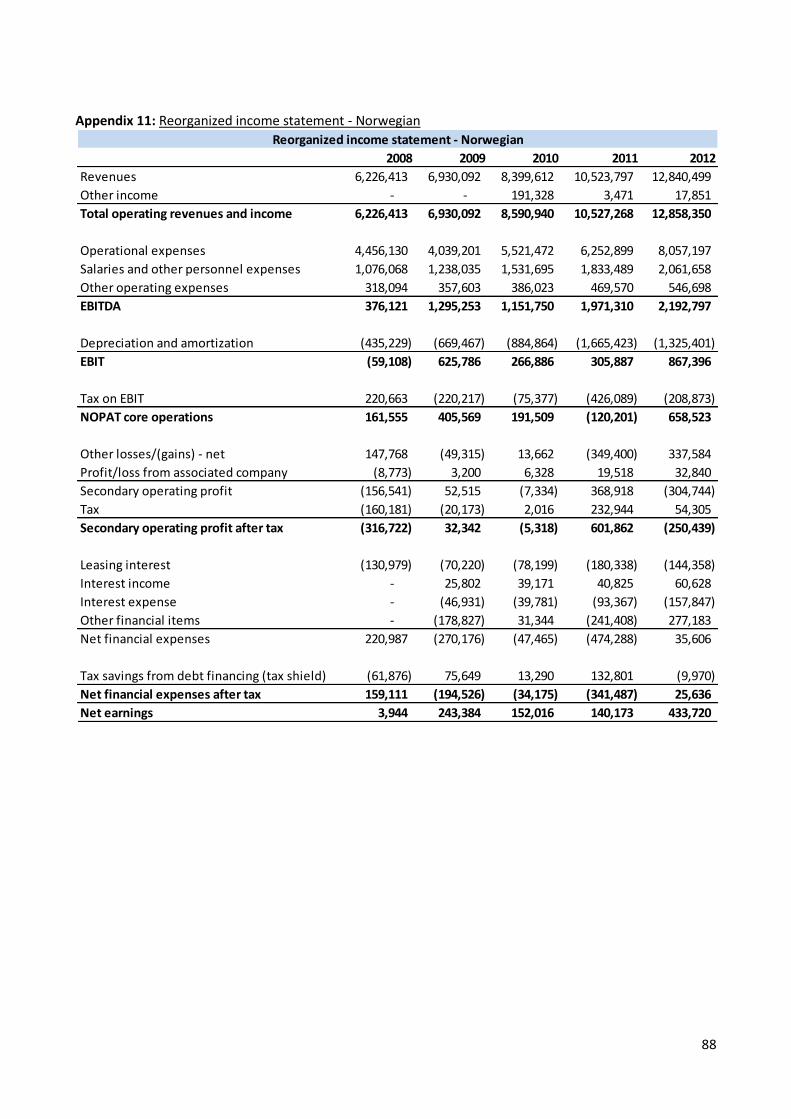
88
Appendix 11: Reorganized income statement - Norwegian
2008 2009 2010 2011 2012
Revenues 6,226,413 6,930,092 8,399,612 10,523,797 12,840,499
Other income - - 191,328 3,471 17,851
Total operating revenues and income 6,226,413 6,930,092 8,590,940 10,527,268 12,858,350
Operational expenses 4,456,130 4,039,201 5,521,472 6,252,899 8,057,197
Salaries and other personnel expenses 1,076,068 1,238,035 1,531,695 1,833,489 2,061,658
Other operating expenses 318,094 357,603 386,023 469,570 546,698
EBITDA 376,121 1,295,253 1,151,750 1,971,310 2,192,797
Depreciation and amortization (435,229) (669,467) (884,864) (1,665,423) (1,325,401)
EBIT (59,108) 625,786 266,886 305,887 867,396
Tax on EBIT 220,663 (220,217) (75,377) (426,089) (208,873)
NOPAT core operations 161,555 405,569 191,509 (120,201) 658,523
Other losses/(gains) - net 147,768 (49,315) 13,662 (349,400) 337,584
Profit/loss from associated company (8,773) 3,200 6,328 19,518 32,840
Secondary operating profit (156,541) 52,515 (7,334) 368,918 (304,744)
Tax (160,181) (20,173) 2,016 232,944 54,305
Secondary operating profit after tax (316,722) 32,342 (5,318) 601,862 (250,439)
Leasing interest (130,979) (70,220) (78,199) (180,338) (144,358)
Interest income - 25,802 39,171 40,825 60,628
Interest expense - (46,931) (39,781) (93,367) (157,847)
Other financial items - (178,827) 31,344 (241,408) 277,183
Net financial expenses 220,987 (270,176) (47,465) (474,288) 35,606
Tax savings from debt financing (tax shield) (61,876) 75,649 13,290 132,801 (9,970)
Net financial expenses after tax 159,111 (194,526) (34,175) (341,487) 25,636
Net earnings 3,944 243,384 152,016 140,173 433,720
Reorganized income statement - Norwegian
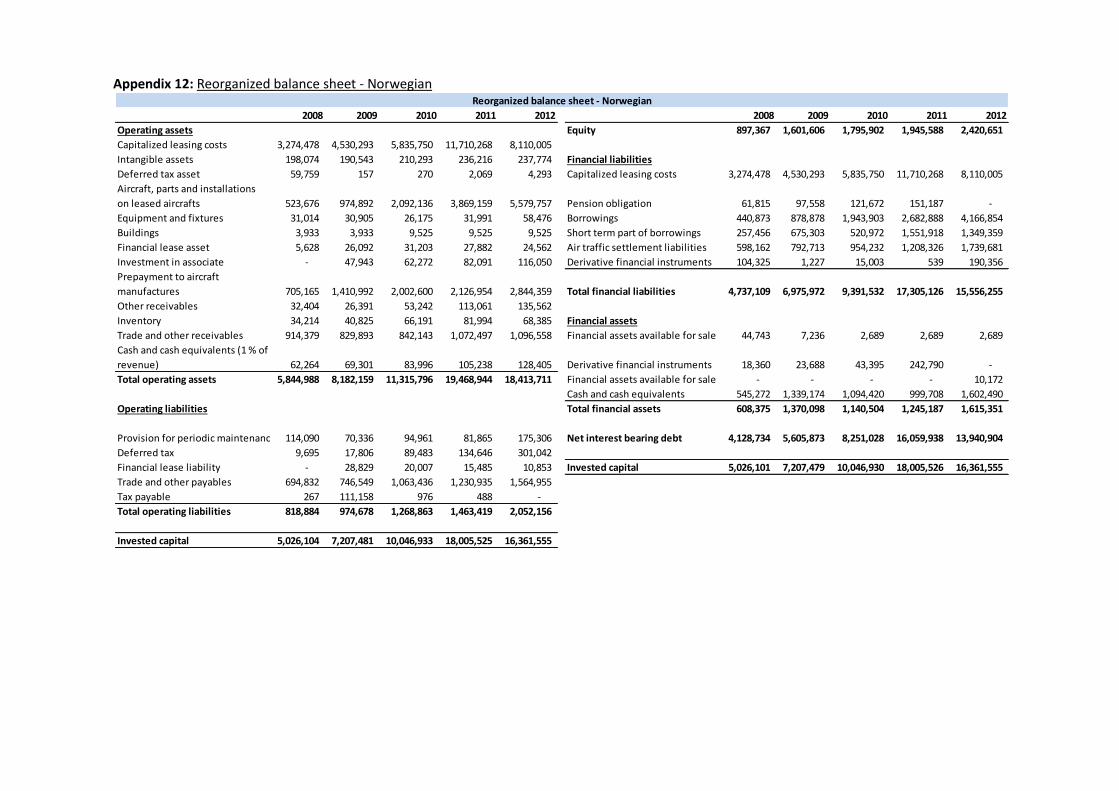
Appendix 12: Reorganized balance sheet - Norwegian
2008 2009 2010 2011 2012 2008 2009 2010 2011 2012
Operating assets Equity 897,367 1,601,606 1,795,902 1,945,588 2,420,651
Capitalized leasing costs 3,274,478 4,530,293 5,835,750 11,710,268 8,110,005
Intangible assets 198,074 190,543 210,293 236,216 237,774 Financial liabilities
Deferred tax asset 59,759 157 270 2,069 4,293 Capitalized leasing costs 3,274,478 4,530,293 5,835,750 11,710,268 8,110,005
Aircraft, parts and installations
on leased aircrafts 523,676 974,892 2,092,136 3,869,159 5,579,757 Pension obligation 61,815 97,558 121,672 151,187 -
Equipment and fixtures 31,014 30,905 26,175 31,991 58,476 Borrowings 440,873 878,878 1,943,903 2,682,888 4,166,854
Buildings 3,933 3,933 9,525 9,525 9,525 Short term part of borrowings 257,456 675,303 520,972 1,551,918 1,349,359
Financial lease asset 5,628 26,092 31,203 27,882 24,562 Air traffic settlement liabilities 598,162 792,713 954,232 1,208,326 1,739,681
Investment in associate - 47,943 62,272 82,091 116,050 Derivative financial instruments 104,325 1,227 15,003 539 190,356
Prepayment to aircraft
manufactures 705,165 1,410,992 2,002,600 2,126,954 2,844,359 Total financial liabilities 4,737,109 6,975,972 9,391,532 17,305,126 15,556,255
Other receivables 32,404 26,391 53,242 113,061 135,562
Inventory 34,214 40,825 66,191 81,994 68,385 Financial assets
Trade and other receivables 914,379 829,893 842,143 1,072,497 1,096,558 Financial assets available for sale 44,743 7,236 2,689 2,689 2,689
Cash and cash equivalents (1 % of
revenue) 62,264 69,301 83,996 105,238 128,405 Derivative financial instruments 18,360 23,688 43,395 242,790 -
Total operating assets 5,844,988 8,182,159 11,315,796 19,468,944 18,413,711 Financial assets available for sale - - - - 10,172
Cash and cash equivalents 545,272 1,339,174 1,094,420 999,708 1,602,490
Operating liabilities Total financial assets 608,375 1,370,098 1,140,504 1,245,187 1,615,351
Provision for periodic maintenance 114,090 70,336 94,961 81,865 175,306 Net interest bearing debt 4,128,734 5,605,873 8,251,028 16,059,938 13,940,904
Deferred tax 9,695 17,806 89,483 134,646 301,042
Financial lease liability - 28,829 20,007 15,485 10,853 Invested capital 5,026,101 7,207,479 10,046,930 18,005,526 16,361,555
Trade and other payables 694,832 746,549 1,063,436 1,230,935 1,564,955
Tax payable 267 111,158 976 488 -
Total operating liabilities 818,884 974,678 1,268,863 1,463,419 2,052,156
Invested capital 5,026,104 7,207,481 10,046,933 18,005,525 16,361,555
Reorganized balance sheet - Norwegian
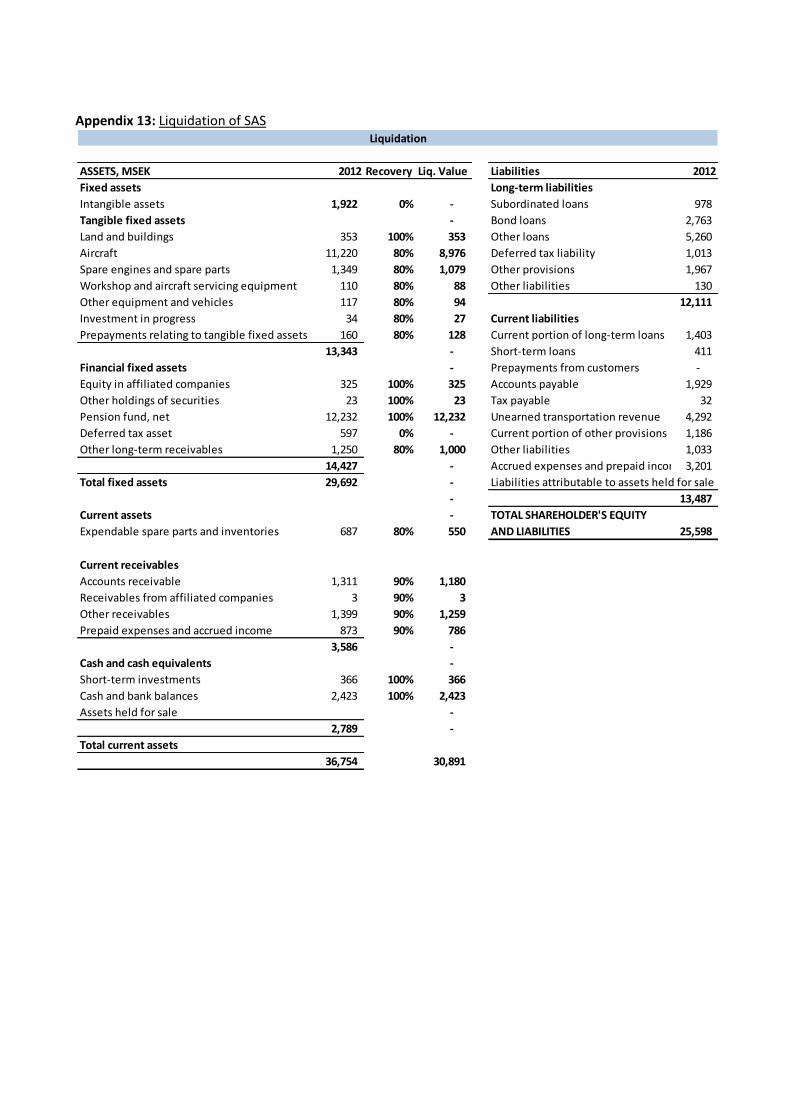
Appendix 13: Liquidation of SAS
ASSETS, MSEK 2012 Recovery Liq. Value Liabilities 2012
Fixed assets Long-term liabilities
Intangible assets 1,922 0% - Subordinated loans 978
Tangible fixed assets - Bond loans 2,763
Land and buildings 353 100% 353 Other loans 5,260
Aircraft 11,220 80% 8,976 Deferred tax liability 1,013
Spare engines and spare parts 1,349 80% 1,079 Other provisions 1,967
Workshop and aircraft servicing equipment 110 80% 88 Other liabilities 130
Other equipment and vehicles 117 80% 94 12,111
Investment in progress 34 80% 27 Current liabilities
Prepayments relating to tangible fixed assets 160 80% 128 Current portion of long-term loans 1,403
13,343 - Short-term loans 411
Financial fixed assets - Prepayments from customers -
Equity in affiliated companies 325 100% 325 Accounts payable 1,929
Other holdings of securities 23 100% 23 Tax payable 32
Pension fund, net 12,232 100% 12,232 Unearned transportation revenue 4,292
Deferred tax asset 597 0% - Current portion of other provisions 1,186
Other long-term receivables 1,250 80% 1,000 Other liabilities 1,033
14,427 - Accrued expenses and prepaid income3,201
Total fixed assets 29,692 - Liabilities attributable to assets held for sale
- 13,487
Current assets - TOTAL SHAREHOLDER'S EQUITY
Expendable spare parts and inventories 687 80% 550 AND LIABILITIES 25,598
Current receivables
Accounts receivable 1,311 90% 1,180
Receivables from affiliated companies 3 90% 3
Other receivables 1,399 90% 1,259
Prepaid expenses and accrued income 873 90% 786
3,586 -
Cash and cash equivalents -
Short-term investments 366 100% 366
Cash and bank balances 2,423 100% 2,423
Assets held for sale -
2,789 -
Total current assets
36,754 30,891
Liquidation
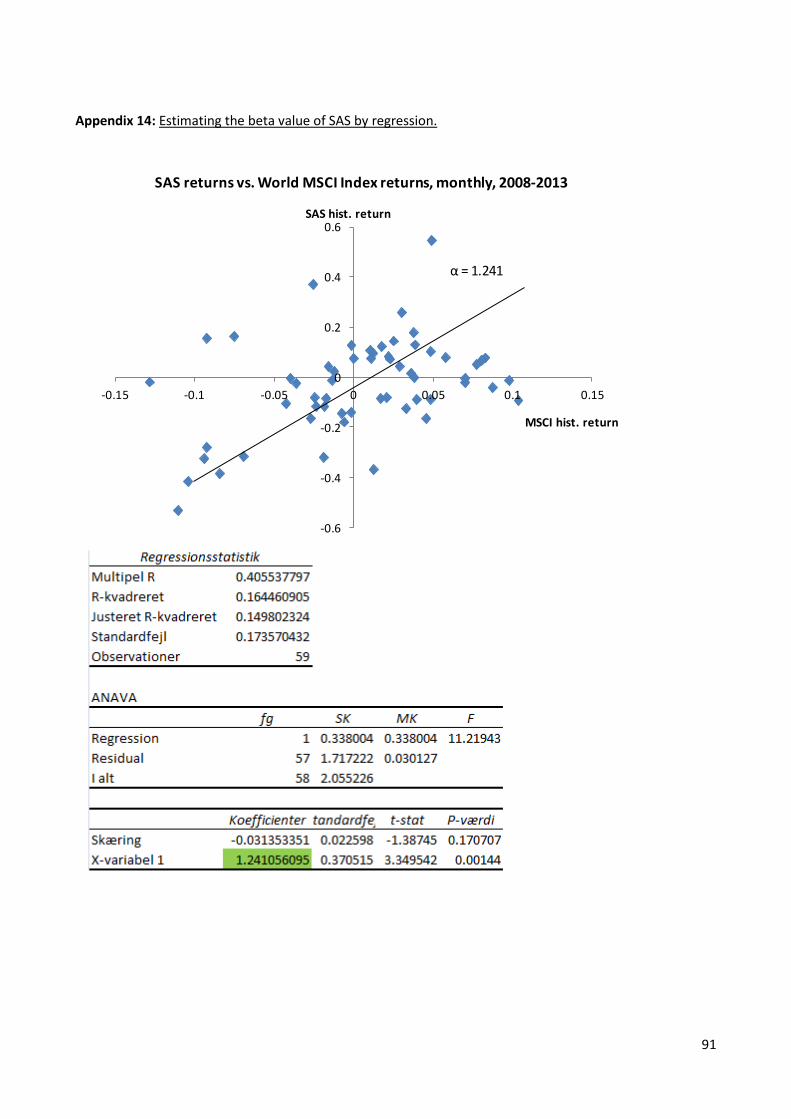
91
Appendix 14: Estimating the beta value of SAS by regression.
-0.6
-0.4
-0.2
0
0.2
0.4
0.6
-0.15 -0.1 -0.05 0 0.05 0.1 0.15
SAS hist. return
MSCI hist. return
SAS returns vs. World MSCI Index returns, monthly, 2008-2013
α = 1.241
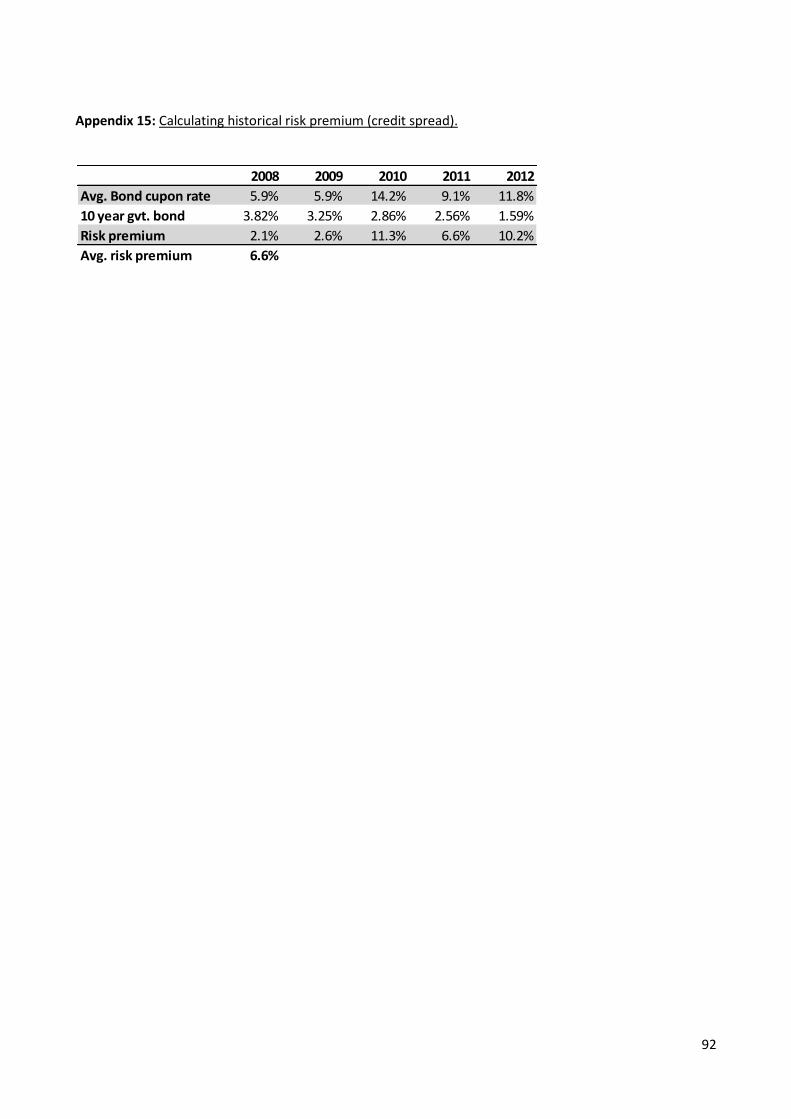
92
Appendix 15: Calculating historical risk premium (credit spread).
2008 2009 2010 2011 2012
Avg. Bond cupon rate 5.9% 5.9% 14.2% 9.1% 11.8%
10 year gvt. bond 3.82% 3.25% 2.86% 2.56% 1.59%
Risk premium 2.1% 2.6% 11.3% 6.6% 10.2%
Avg. risk premium 6.6%
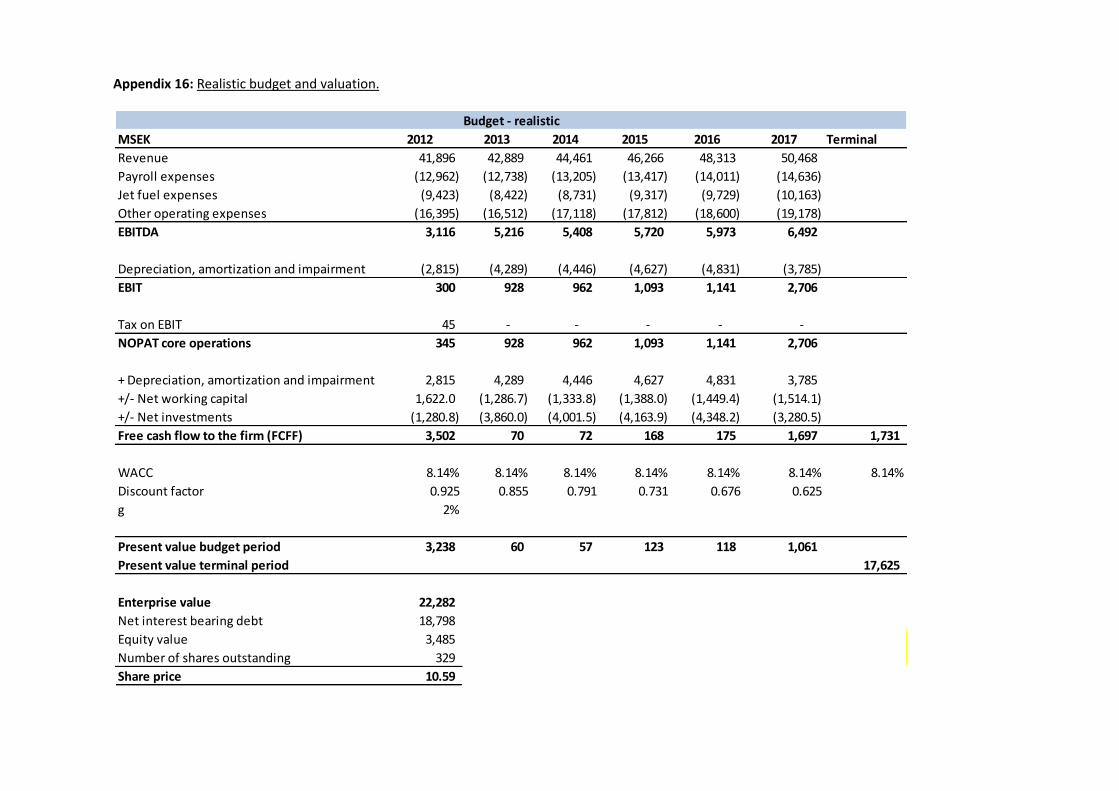
Appendix 16: Realistic budget and valuation.
MSEK 2012 2013 2014 2015 2016 2017 Terminal
Revenue 41,896 42,889 44,461 46,266 48,313 50,468
Payroll expenses (12,962) (12,738) (13,205) (13,417) (14,011) (14,636)
Jet fuel expenses (9,423) (8,422) (8,731) (9,317) (9,729) (10,163)
Other operating expenses (16,395) (16,512) (17,118) (17,812) (18,600) (19,178)
EBITDA 3,116 5,216 5,408 5,720 5,973 6,492
Depreciation, amortization and impairment (2,815) (4,289) (4,446) (4,627) (4,831) (3,785)
EBIT 300 928 962 1,093 1,141 2,706
Tax on EBIT 45 - - - - -
NOPAT core operations 345 928 962 1,093 1,141 2,706
+ Depreciation, amortization and impairment 2,815 4,289 4,446 4,627 4,831 3,785
+/- Net working capital 1,622.0 (1,286.7) (1,333.8) (1,388.0) (1,449.4) (1,514.1)
+/- Net investments (1,280.8) (3,860.0) (4,001.5) (4,163.9) (4,348.2) (3,280.5)
Free cash flow to the firm (FCFF) 3,502 70 72 168 175 1,697 1,731
1 2 3 4 5 6
WACC 8.14% 8.14% 8.14% 8.14% 8.14% 8.14% 8.14%
Discount factor 0.925 0.855 0.791 0.731 0.676 0.625
g 2%
Present value budget period 3,238 60 57 123 118 1,061
Present value terminal period 17,625
Enterprise value 22,282
Net interest bearing debt 18,798
Equity value 3,485
Number of shares outstanding 329
Share price 10.59
Budget - realistic
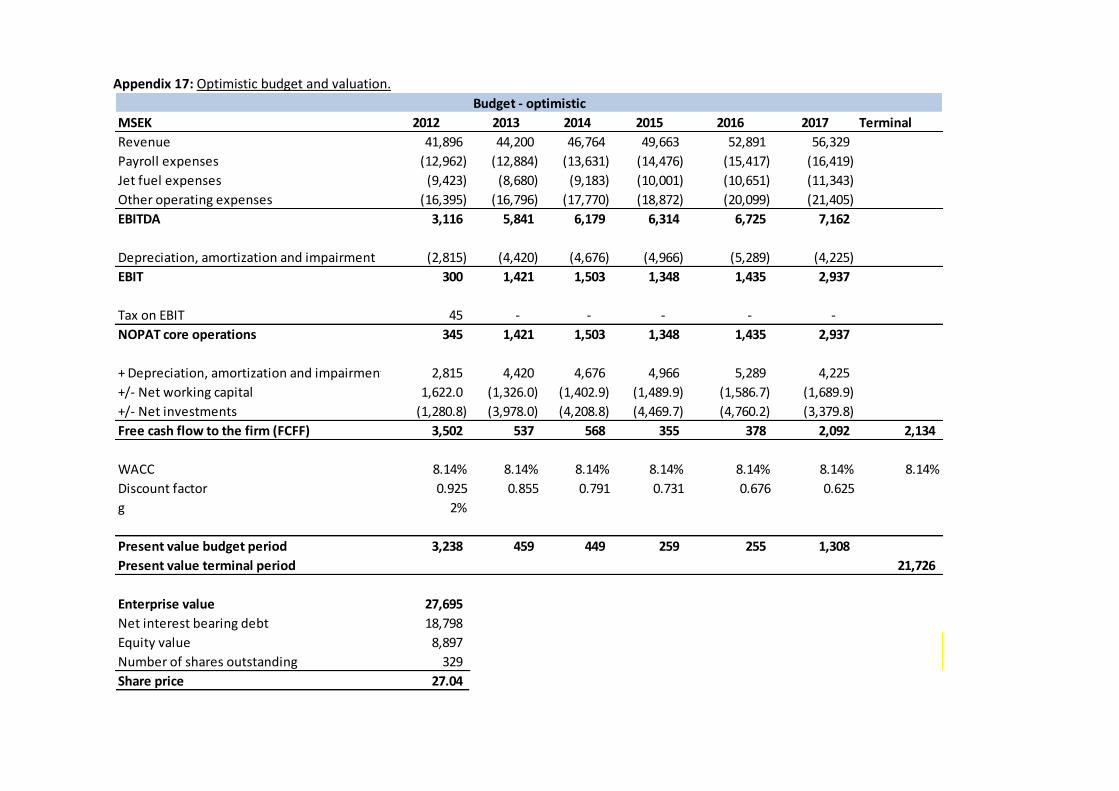
Appendix 17: Optimistic budget and valuation.
MSEK 2012 2013 2014 2015 2016 2017 Terminal
Revenue 41,896 44,200 46,764 49,663 52,891 56,329
Payroll expenses (12,962) (12,884) (13,631) (14,476) (15,417) (16,419)
Jet fuel expenses (9,423) (8,680) (9,183) (10,001) (10,651) (11,343)
Other operating expenses (16,395) (16,796) (17,770) (18,872) (20,099) (21,405)
EBITDA 3,116 5,841 6,179 6,314 6,725 7,162
Depreciation, amortization and impairment (2,815) (4,420) (4,676) (4,966) (5,289) (4,225)
EBIT 300 1,421 1,503 1,348 1,435 2,937
Tax on EBIT 45 - - - - -
NOPAT core operations 345 1,421 1,503 1,348 1,435 2,937
+ Depreciation, amortization and impairment 2,815 4,420 4,676 4,966 5,289 4,225
+/- Net working capital 1,622.0 (1,326.0) (1,402.9) (1,489.9) (1,586.7) (1,689.9)
+/- Net investments (1,280.8) (3,978.0) (4,208.8) (4,469.7) (4,760.2) (3,379.8)
Free cash flow to the firm (FCFF) 3,502 537 568 355 378 2,092 2,134
1 2 3 4 5 6
WACC 8.14% 8.14% 8.14% 8.14% 8.14% 8.14% 8.14%
Discount factor 0.925 0.855 0.791 0.731 0.676 0.625
g 2%
Present value budget period 3,238 459 449 259 255 1,308
Present value terminal period 21,726
Enterprise value 27,695
Net interest bearing debt 18,798
Equity value 8,897
Number of shares outstanding 329
Share price 27.04
Budget - optimistic
