strategisches tuning – teil 2 analyse · logical reads, physical reads and similar performance...
TRANSCRIPT

Database Consult GmbH 1
Strategisches Tuning – Teil 2Analyse
TOAD User Konferenz 2007Dr. Günter Unbescheid
Database Consult GmbH
©Database Consult GmbH - Jachenau
Seminartitel
Folie 2 von 7110/2007
Agenda
• Teil 1 – Werkzeuge, Erstellung von Profilen– Analysestrategien– Informationsquellen der Versionen 10g und 11g– Erstellung von Lastprofilen
• Teil 2 – Analyse von Lastprofilen– Analysetools– Beispielreports– Typisches: CPU-Zeiten, Wait Events, SQL Zugriffspläne

Database Consult GmbH 2
©Database Consult GmbH - Jachenau
Seminartitel
Folie 3 von 7110/2007
Teil 2: AnalyseAnalysetools
©Database Consult GmbH - Jachenau
Seminartitel
Folie 4 von 7110/2007
Ausgangspunkt
...Tracefiles liegen vor......Tracefiles liegen vor...

Database Consult GmbH 3
©Database Consult GmbH - Jachenau
Seminartitel
Folie 5 von 7110/2007
Analyse-Szenarien
©Database Consult GmbH - Jachenau
Seminartitel
Folie 6 von 7110/2007
STATSPACK
• Verfügbar ab Version 8i• Erweiterung von utlbstat/utlestat• Snapshots von V$-Objekten
– Umfänge steuerbar über Level 0 bis 10
• Reports über Delta-Werte• Geeignet zur Parametrierung der Instanz, • Nur bedingt geeignet für einzelne Anwendungen• Vorgeschaltete, strategische Analyse wichtig!• Braucht mehr Ressourcen als AWR
Werkzeuge

Database Consult GmbH 4
©Database Consult GmbH - Jachenau
Seminartitel
Folie 7 von 7110/2007
STATSPACK
• Steuerbar über Level (Detaillierung) und Threshholds (SQL-Befehle)
• Installiert über ?/rdbms/admin/spcreate.sql– User PERFSTAT, Hilfstabellen, Package STATSPACK
• Arbeiten mit– EXECUTE statspack.snap;– Job über SPAUTO.SQL– Auswertungen:
• Instanzreport über SPREPORT.SQL und SPREPINS.SQL• SQL-Report über SPREPSQL.SQL und SPRSQINS.SQL
Werkzeuge
©Database Consult GmbH - Jachenau
Seminartitel
Folie 8 von 7110/2007
Statspack
• gut geeignet zur Ermittlung allgemeiner Kennzahlen• zur „Performance“-Vorsorge und IST-Darstellung• Doku unter ?\rdbms\admin\spdoc.txt
SQL> exec statspack.snapSQL> start ?\rdbms\admin\spreport.sql
Listing all Completed SnapshotsSnap
Instance DB Name Snap Id Snap Started Level Comment------------ ------------ --------- ----------------- ----- --------------------ora102 ORA102 1 26 Okt 2005 12:06 5
11 26 Okt 2005 13:28 521 28 Okt 2005 08:41 522 28 Okt 2005 08:55 10
Specify the Begin and End Snapshot Ids~~~~~~~~~~~~~~~~~~~~~~~~~~~~~~~~~~~~~~Geben Sie einen Wert f³r begin_snap ein:
Die Praxis –
IST-Zusatnd
Database Consult GmbH 5
©Database Consult GmbH - Jachenau
Seminartitel
Folie 9 von 7110/2007
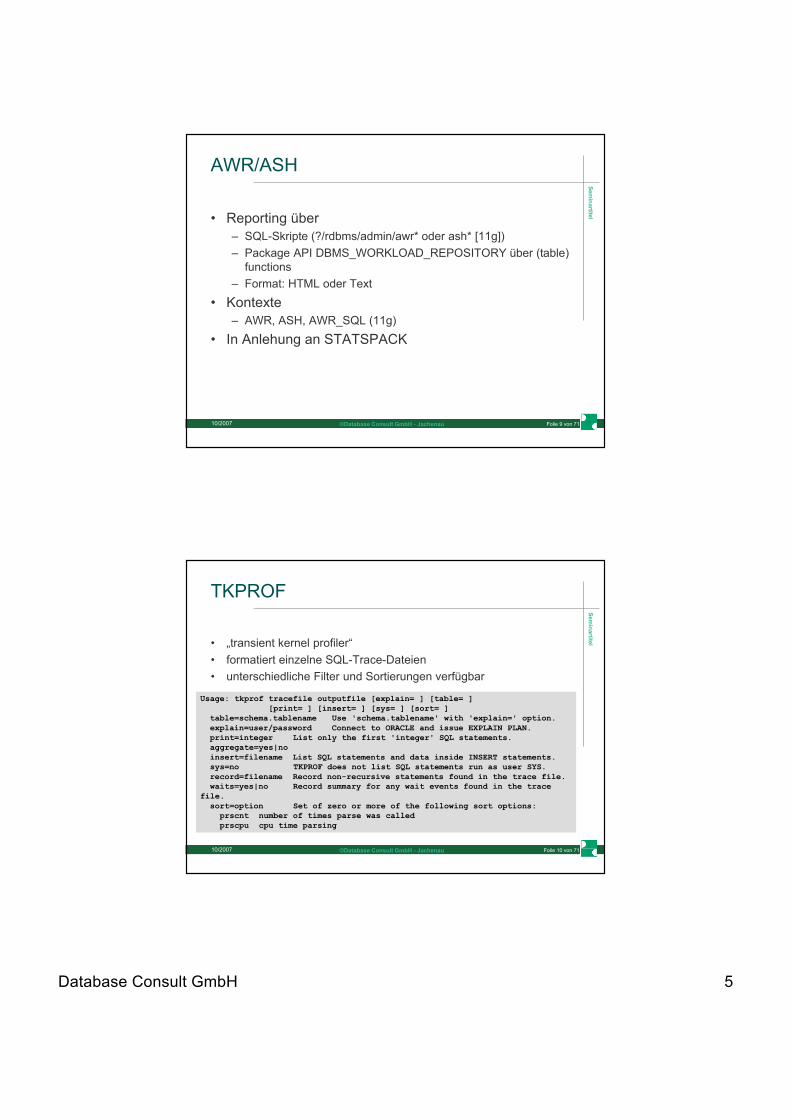
AWR/ASH
• Reporting über– SQL-Skripte (?/rdbms/admin/awr* oder ash* [11g])– Package API DBMS_WORKLOAD_REPOSITORY über (table)
functions– Format: HTML oder Text
• Kontexte– AWR, ASH, AWR_SQL (11g)
• In Anlehung an STATSPACK
©Database Consult GmbH - Jachenau
Seminartitel
Folie 10 von 7110/2007
TKPROF
• „transient kernel profiler“• formatiert einzelne SQL-Trace-Dateien• unterschiedliche Filter und Sortierungen verfügbar
Usage: tkprof tracefile outputfile [explain= ] [table= ][print= ] [insert= ] [sys= ] [sort= ]
table=schema.tablename Use 'schema.tablename' with 'explain=' option.explain=user/password Connect to ORACLE and issue EXPLAIN PLAN.print=integer List only the first 'integer' SQL statements.aggregate=yes|noinsert=filename List SQL statements and data inside INSERT statements.sys=no TKPROF does not list SQL statements run as user SYS.record=filename Record non-recursive statements found in the trace file.waits=yes|no Record summary for any wait events found in the trace
file.sort=option Set of zero or more of the following sort options:
prscnt number of times parse was calledprscpu cpu time parsing

Database Consult GmbH 6
©Database Consult GmbH - Jachenau
Seminartitel
Folie 11 von 7110/2007
TKPROF
• Sichtweise SQL, keine Lastprofile• Gute Auswertung von SQL-Befehlen
– Zugriffspläne und Zeiten– Wait-Events pro SQL– jedoch keine Bindevariablen
• Gesamtübersicht der rekursiven und nicht-rekursiven Befehle
• Keine Befehlsübergreifenden CPU und Wait-Gewichtungen!
• (Gut) geeignet für Execution-Plan Optimierungen
©Database Consult GmbH - Jachenau
Seminartitel
Folie 12 von 7110/2007
Trace-Analyzer• Skriptsammlung zur formatierten Analyse und Ausgabe
(HTML) von 10046er Traces– RDBMS > 8.1.6
• Über Metalink Note 224270.1– derzeit Version 2.4.6
• Erweiterte Funktionalität und Reports – auch für 8i funktionabel
• Arbeitet über Hilfstabellen und PL/SQL-Prozeduren– Zugriff auf Trace-Verzeichnis mittels DIRECTORY-Objekt
• Ausführliche Analysen (s.u.)• In manchen Fällen Laufzeitprobleme bei sehr grossen
Trace-Dateien ( ca. > 2GB)

Database Consult GmbH 7
©Database Consult GmbH - Jachenau
Seminartitel
Folie 13 von 7110/2007
Trace-Analyzer Ausgabe• Trace identification
– actual start and completion time, host name, RDBMS version, etc.
• SQL statements count, user and internal, total and unique.
• Time summary– elapsed, cpu, non-idle wait events, idle wait events, for user
(recursive and non-recursive) and for internal.
• Call summary for user and internal, with elapsed, cpu, logical reads, physical reads and similar performance details.
• Summary of wait events, classified by non-idle and idle for user and for internal
©Database Consult GmbH - Jachenau
Seminartitel
Folie 14 von 7110/2007
Trace-Analyzer Ausgabe
• Top 20 SQL statements - importance for SQL tuning analysis.
• List of all unique SQL statements with one-line performance summary per statement.
• Gaps of no trace activity found on file.• List of transactions found (commits and rollbacks).• Oracle errors if any.• I/O core waits including schema objects affected (tables,
indexes, partitions), when traced with level 8 or 12. • Top 5 hot blocks, indicating the schema objects (l 8/12).• Latch Wait summary
Database Consult GmbH 8
©Database Consult GmbH - Jachenau
Seminartitel
Folie 15 von 7110/2007
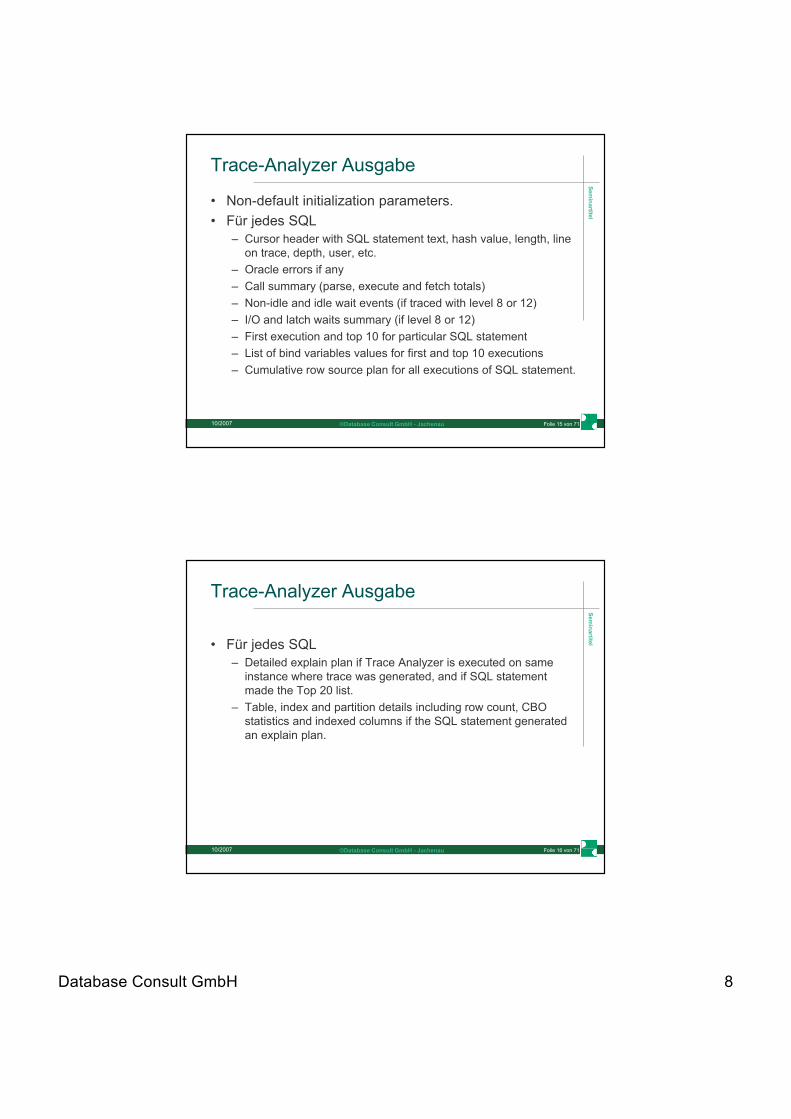
Trace-Analyzer Ausgabe
• Non-default initialization parameters.• Für jedes SQL
– Cursor header with SQL statement text, hash value, length, line on trace, depth, user, etc.
– Oracle errors if any– Call summary (parse, execute and fetch totals)– Non-idle and idle wait events (if traced with level 8 or 12)– I/O and latch waits summary (if level 8 or 12)– First execution and top 10 for particular SQL statement– List of bind variables values for first and top 10 executions– Cumulative row source plan for all executions of SQL statement.
©Database Consult GmbH - Jachenau
Seminartitel
Folie 16 von 7110/2007
Trace-Analyzer Ausgabe
• Für jedes SQL– Detailed explain plan if Trace Analyzer is executed on same
instance where trace was generated, and if SQL statement made the Top 20 list.
– Table, index and partition details including row count, CBO statistics and indexed columns if the SQL statement generated an explain plan.

Database Consult GmbH 9
©Database Consult GmbH - Jachenau
Seminartitel
Folie 17 von 7110/2007
oraSRP
• Oracle Session Resource Profiler – derzeit Vers. 3.1.2 (www.oracledba.ru/orasrp/ )– frei verfügbar für Windows und Linux– geschrieben in D – command line utility– sehr performant auch mit grossen Trace-Dateien!
• formatiert und analysiert extended trace files– Ausgabe in Text oder HTML– operiert ohne DB
• Vergleich (Version 3.0) mit Hotsos-Profiler– jforonda.blogspot.com/2007/02/orasrp-v30b-very-short-
initial.html
©Database Consult GmbH - Jachenau
Seminartitel
Folie 18 von 7110/2007
oraSRP
orasrp [options] file [outfile]options: -h, --help show this help message and exit --version show program's version number and exit -t, --text output in text format --aggregate=YES/no aggregate similar statements -bn, --binds=n how many unique bind-sets to display (1 by defaut) --maxbinds=n how many unique bind-sets to analyze (allby default) --recognize-idle-events=YES/no recognize or not idle wait events --sys=YES/no print sys statements --sort how to sort statements in output (values like in tkprof) --display-sections what sections of report to display (all
by default) --skip-sections what sections of report to skip --sessionid analyze data only for the specified session id --threshold omit statements which spend less than
threshold % from total time (not used by default)
Database Consult GmbH 10
©Database Consult GmbH - Jachenau
Seminartitel
Folie 19 von 7110/2007
Teil 2: AnalyseBeispielreports
©Database Consult GmbH - Jachenau
Seminartitel
Folie 20 von 7110/2007
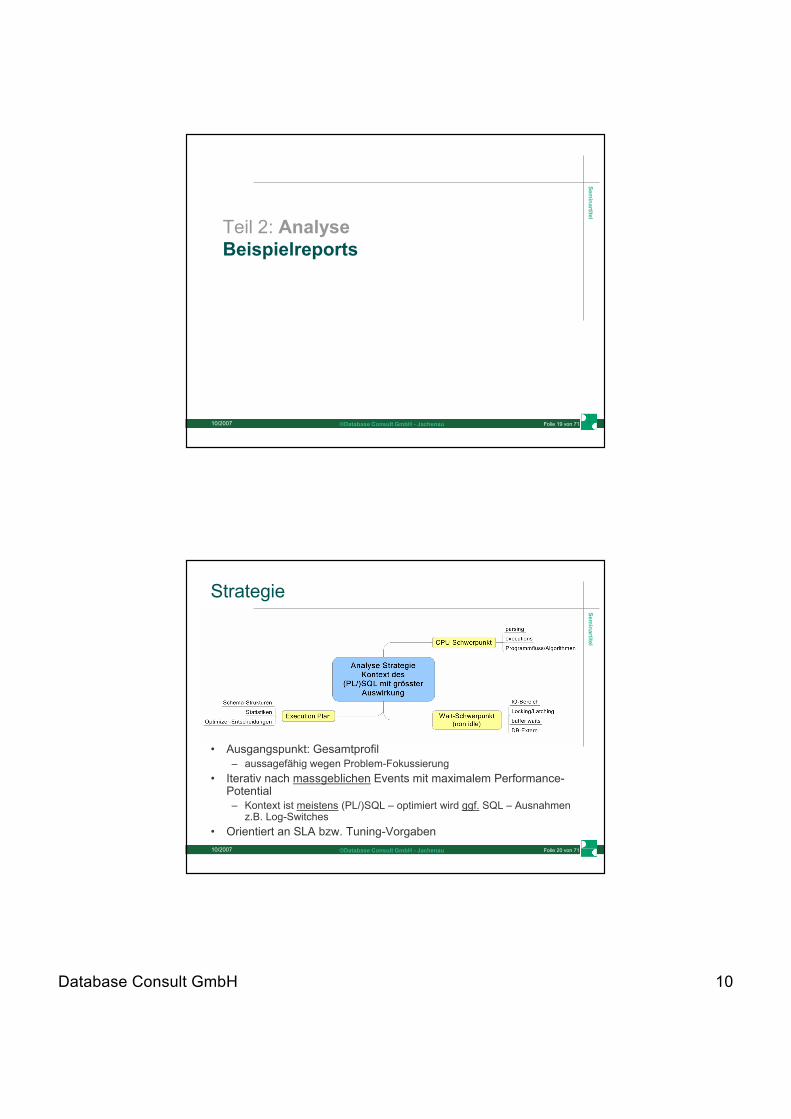
Strategie
• Ausgangspunkt: Gesamtprofil– aussagefähig wegen Problem-Fokussierung
• Iterativ nach massgeblichen Events mit maximalem Performance-Potential– Kontext ist meistens (PL/)SQL – optimiert wird ggf. SQL – Ausnahmen
z.B. Log-Switches• Orientiert an SLA bzw. Tuning-Vorgaben
Database Consult GmbH 11
©Database Consult GmbH - Jachenau
Seminartitel
Folie 21 von 7110/2007
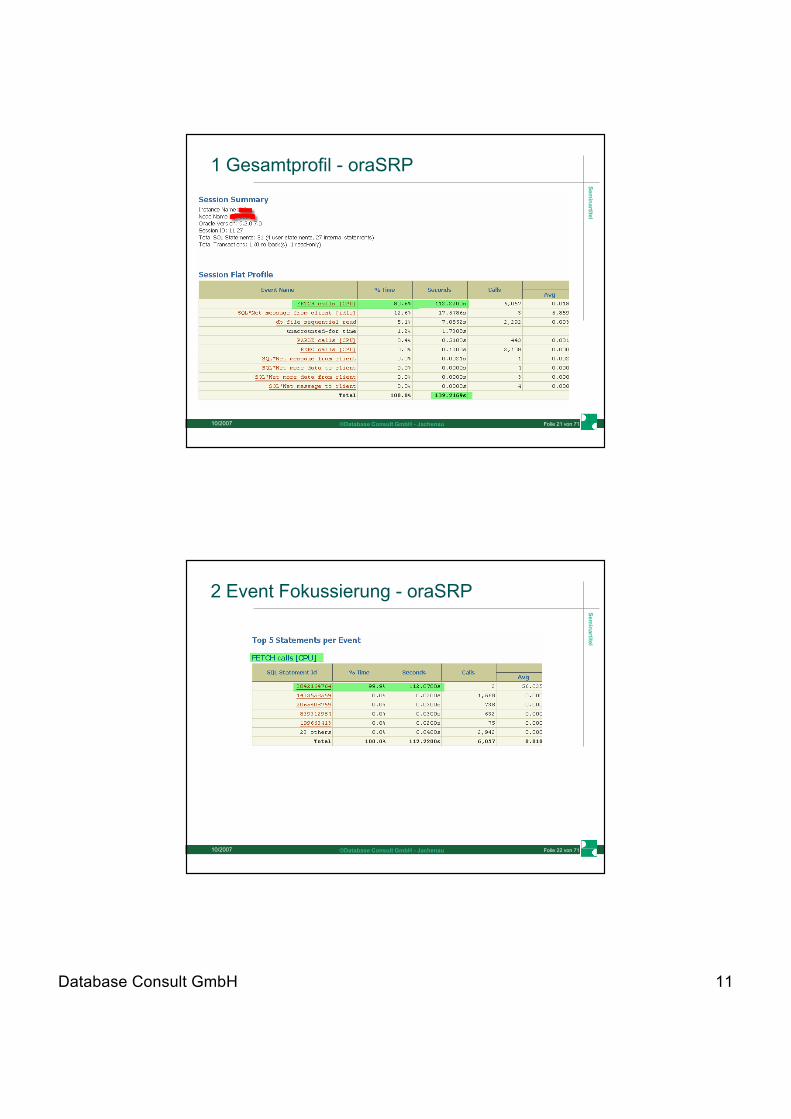
1 Gesamtprofil - oraSRP
©Database Consult GmbH - Jachenau
Seminartitel
Folie 22 von 7110/2007
2 Event Fokussierung - oraSRP
Database Consult GmbH 12
©Database Consult GmbH - Jachenau
Seminartitel
Folie 23 von 7110/2007
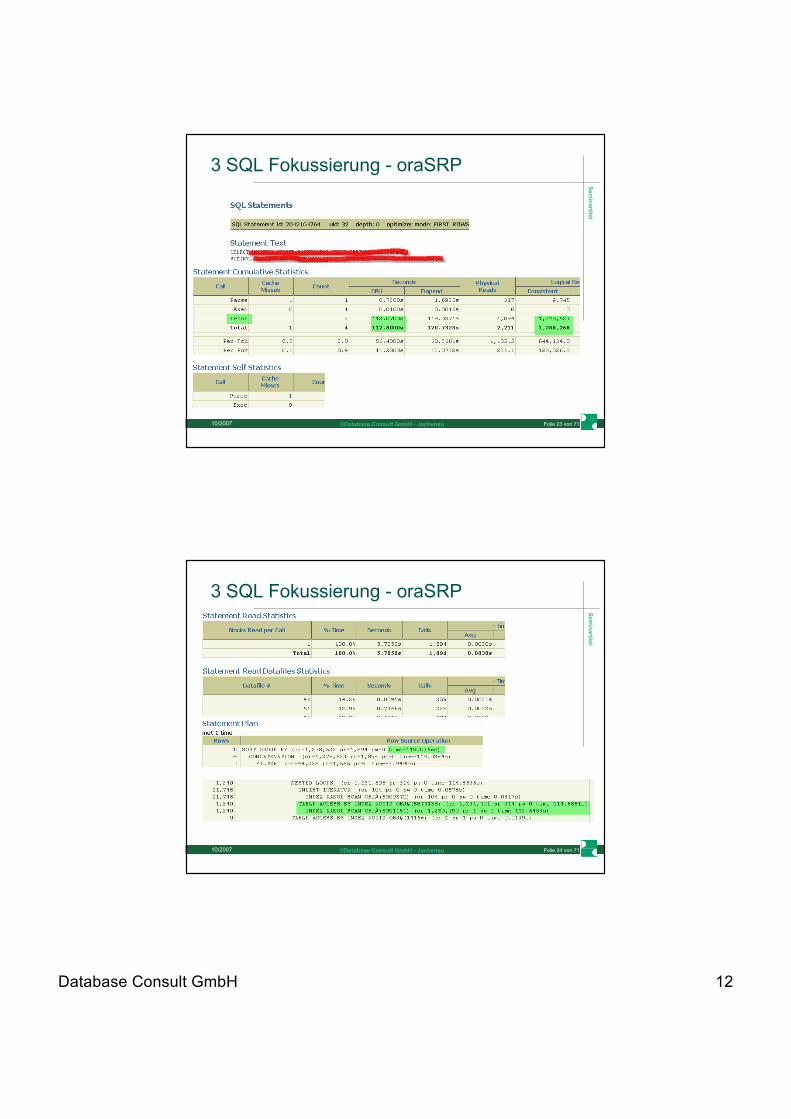
3 SQL Fokussierung - oraSRP
©Database Consult GmbH - Jachenau
Seminartitel
Folie 24 von 7110/2007
3 SQL Fokussierung - oraSRP

Database Consult GmbH 13
©Database Consult GmbH - Jachenau
Seminartitel
Folie 25 von 7110/2007
Trace Analyzer 1
©Database Consult GmbH - Jachenau
Seminartitel
Folie 26 von 7110/2007
Trace Analyzer 2
Database Consult GmbH 14
©Database Consult GmbH - Jachenau
Seminartitel
Folie 27 von 7110/2007
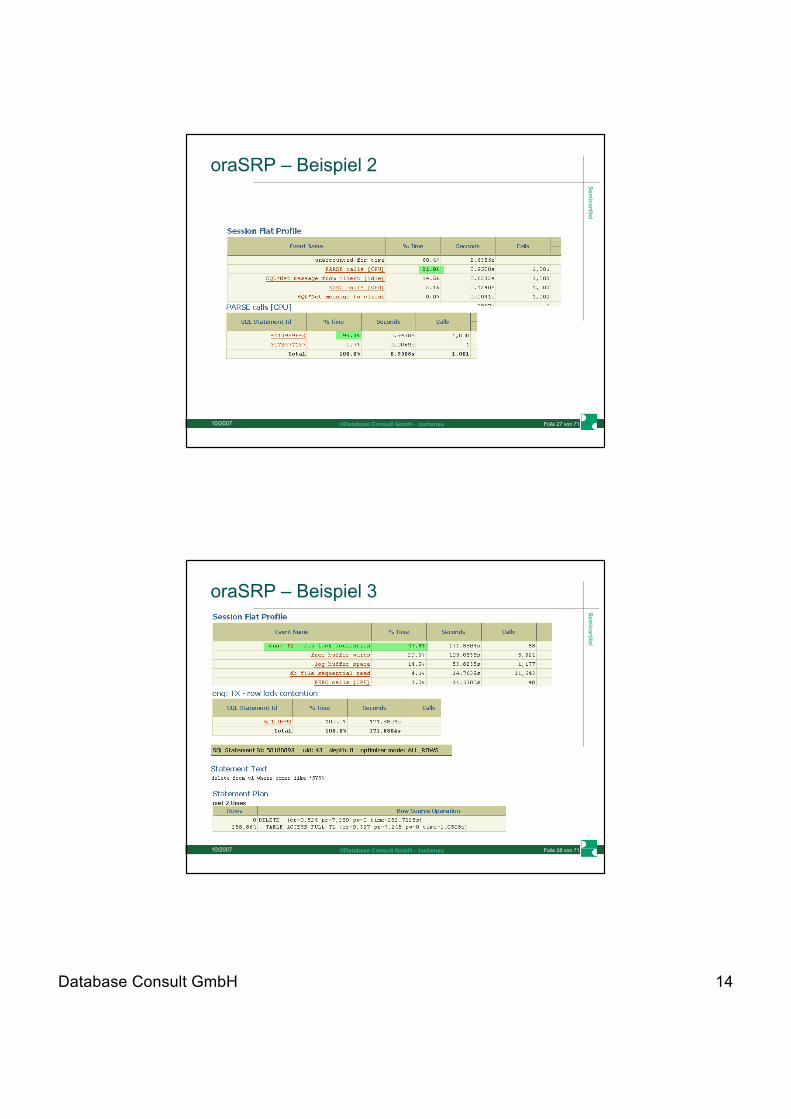
oraSRP – Beispiel 2
©Database Consult GmbH - Jachenau
Seminartitel
Folie 28 von 7110/2007
oraSRP – Beispiel 3

Database Consult GmbH 15
©Database Consult GmbH - Jachenau
Seminartitel
Folie 29 von 7110/2007
AWR Report
©Database Consult GmbH - Jachenau
Seminartitel
Folie 30 von 7110/2007
AWR ReportMischung von CPU- und Wait Events
Hierarchische Buchführung !

Database Consult GmbH 16
©Database Consult GmbH - Jachenau
Seminartitel
Folie 31 von 7110/2007
AWR Report
weiterführende Reports zu SQL ID, z.B.SELECT VALUE(P).sql_text FROM table(dbms_sqltune.select_workload_repository ...
©Database Consult GmbH - Jachenau
Seminartitel
Folie 32 von 7110/2007
Statspack –AusschnitteCache Sizes
Begin End---------- ----------
Buffer Cache: 292M 284M Std Block Size: 8KShared Pool Size: 128M Log Buffer: 2,828K
Load ProfilePer Second Per Transaction
--------------- ---------------Redo size: 475.25 15,589.84
Logical reads: 51.65 1,694.37Block changes: 2.67 87.65
Physical reads: 0.01 0.39Physical writes: 0.12 4.05
User calls: 0.12 3.85Parses: 0.51 16.89
Hard parses: 0.02 0.74.......
Database Consult GmbH 17
©Database Consult GmbH - Jachenau
Seminartitel
Folie 33 von 7110/2007
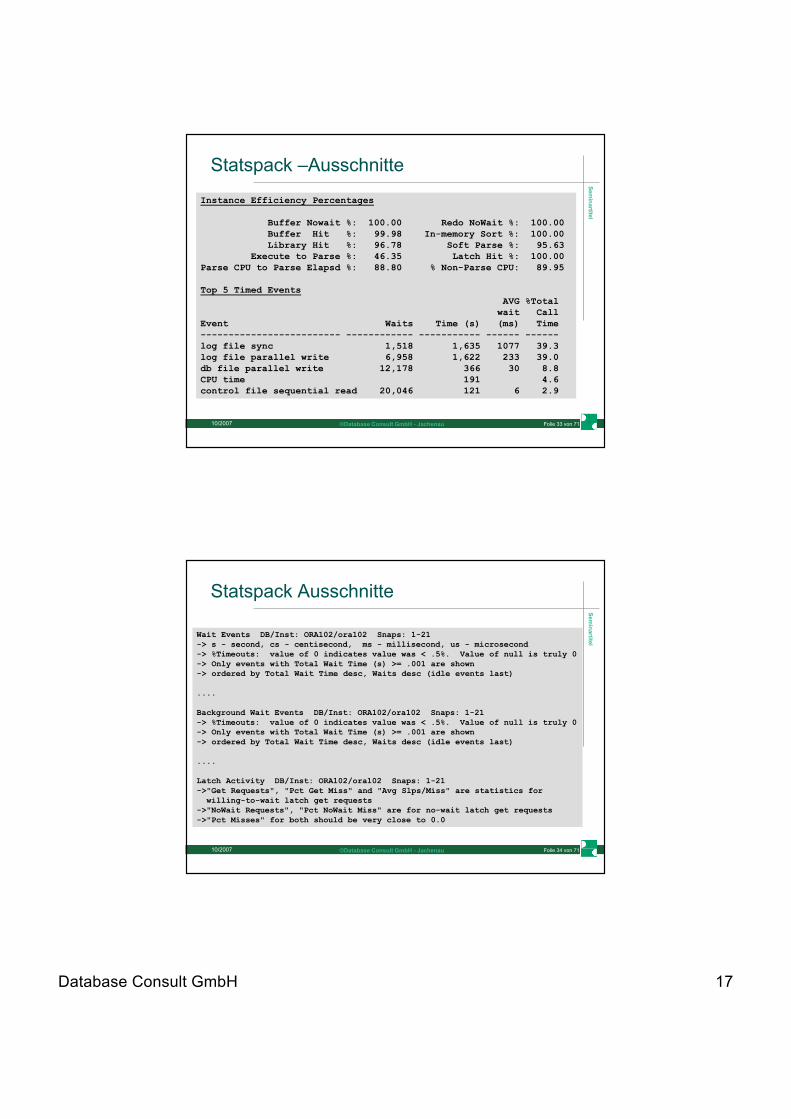
Statspack –Ausschnitte
Instance Efficiency Percentages
Buffer Nowait %: 100.00 Redo NoWait %: 100.00Buffer Hit %: 99.98 In-memory Sort %: 100.00Library Hit %: 96.78 Soft Parse %: 95.63
Execute to Parse %: 46.35 Latch Hit %: 100.00Parse CPU to Parse Elapsd %: 88.80 % Non-Parse CPU: 89.95
Top 5 Timed EventsAVG %Total
wait CallEvent Waits Time (s) (ms) Time------------------------- ------------ ----------- ------ ------log file sync 1,518 1,635 1077 39.3log file parallel write 6,958 1,622 233 39.0db file parallel write 12,178 366 30 8.8CPU time 191 4.6control file sequential read 20,046 121 6 2.9
©Database Consult GmbH - Jachenau
Seminartitel
Folie 34 von 7110/2007
Statspack Ausschnitte
Wait Events DB/Inst: ORA102/ora102 Snaps: 1-21-> s - second, cs - centisecond, ms - millisecond, us - microsecond-> %Timeouts: value of 0 indicates value was < .5%. Value of null is truly 0-> Only events with Total Wait Time (s) >= .001 are shown-> ordered by Total Wait Time desc, Waits desc (idle events last)
....
Background Wait Events DB/Inst: ORA102/ora102 Snaps: 1-21-> %Timeouts: value of 0 indicates value was < .5%. Value of null is truly 0-> Only events with Total Wait Time (s) >= .001 are shown-> ordered by Total Wait Time desc, Waits desc (idle events last)
....
Latch Activity DB/Inst: ORA102/ora102 Snaps: 1-21->"Get Requests", "Pct Get Miss" and "Avg Slps/Miss" are statistics for
willing-to-wait latch get requests->"NoWait Requests", "Pct NoWait Miss" are for no-wait latch get requests->"Pct Misses" for both should be very close to 0.0

Database Consult GmbH 18
©Database Consult GmbH - Jachenau
Seminartitel
Folie 35 von 7110/2007
Tracing – Rawtrace
• sinnvoll bei unvollständigen Auswertungen• exakte Zuordnung von Wait Events zu Calls• Gliederung
– Allgemeiner Header– Identification:
*** ACTION NAME:(Action X) 2005-11-03 13:24:10.265*** MODULE NAME:(Module A) 2005-11-03 13:24:10.265*** SERVICE NAME:(SYS$USERS) 2005-11-03 13:24:10.265*** CLIENT ID:(GU) 2005-11-03 13:24:10.265*** SESSION ID:(16.1022) 2005-11-03 13:24:10.265=====================
©Database Consult GmbH - Jachenau
Seminartitel
Folie 36 von 7110/2007
Tracing – Rawtrace• Cursor Informationen direkt nach Parse Call oder später• Nummer nimmt Bezug auf nachfolgende Calls• len – Länge des Stmts,• uid – schema ID des parsenden Benutzers• oct – Oracle Call Type• lid – privileged user id• tim Zeitstempel in Mikrosekunden (>= 9i) z.B. gettimeofday• hv – hash value • ad - address
PARSING IN CURSOR #7 len=32 dep=0 uid=58 oct=3 lid=58 tim=22374257176 hv=2935929963 ad='1fd73f00'select count(*) from dba_objectsEND OF STMT

Database Consult GmbH 19
©Database Consult GmbH - Jachenau
Seminartitel
Folie 40 von 7110/2007
Tracing - Rawtrace• Rekursive Calls erscheinen vor ihren Parents• Parents enthalten in elapsed time die Zeiten ihrer Kinder
PARSING IN CURSOR #1 len=46 dep=1 uid=0 oct=3 lid=0 tim=3282021354 hv=1343089354 ad='2aac0994'select node,owner,name from syn$ where obj#=:1END OF STMTPARSE #1:c=0,e=46,p=0,cr=0,cu=0,mis=0,r=0,dep=1,og=4,tim=3282021346PARSING IN CURSOR #1 len=179 dep=1 uid=0 oct=3 lid=0 tim=3282058960 hv=2812844157 ad='2aaf9d38'select owner#,..... from dependency$ d, obj$ o where d_obj#=:1 and p_obj#=obj#(+) order by order#END OF STMT ...=====================PARSING IN CURSOR #7 len=32 dep=0 uid=58 oct=3 lid=58 tim=3282347867 hv=2935929963 ad='1fcc1024'select count(*) from dba_objectsEND OF STMTPARSE #7: c=328125,e=327028,p=0,cr=97,cu=0,mis=1,r=0,dep=0,og=1,tim=3282347858
©Database Consult GmbH - Jachenau
Seminartitel
Folie 42 von 7110/2007
Teil 2: AnalyseTypisches: CPU-Zeiten, Wait-Events, SQL-Zugriffspläne
Database Consult GmbH 20
©Database Consult GmbH - Jachenau
Seminartitel
Folie 43 von 7110/2007
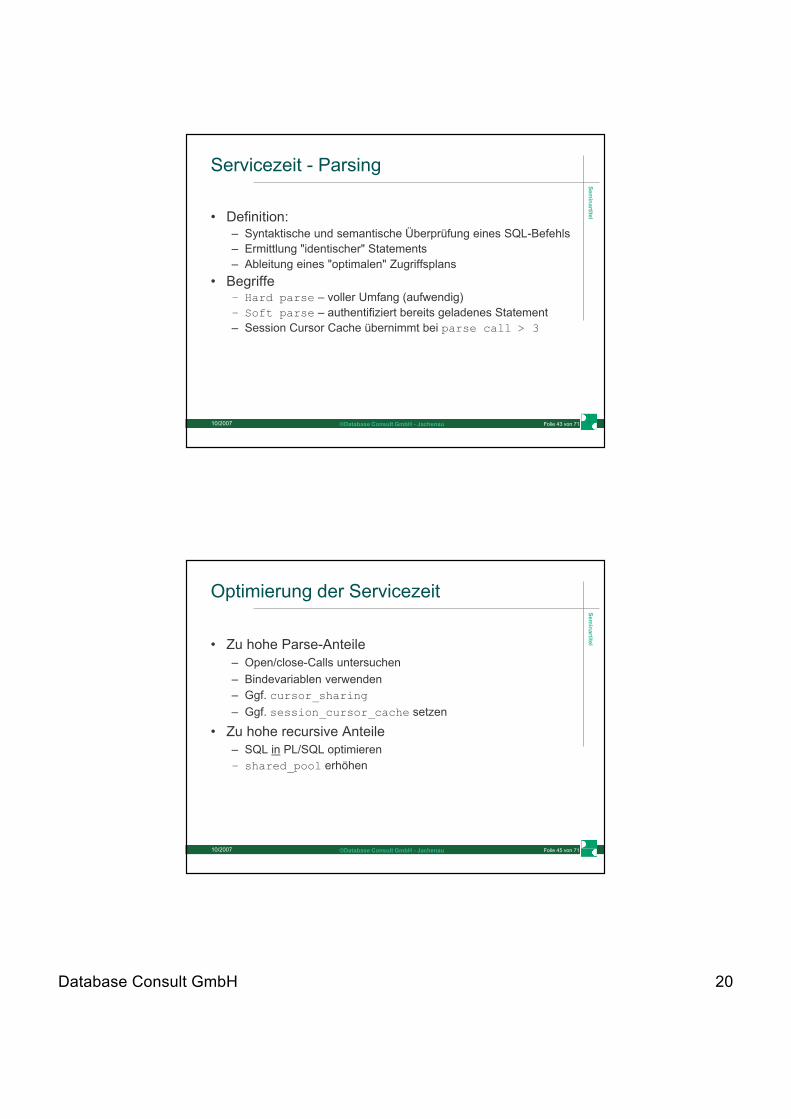
Servicezeit - Parsing
• Definition:– Syntaktische und semantische Überprüfung eines SQL-Befehls– Ermittlung "identischer" Statements– Ableitung eines "optimalen" Zugriffsplans
• Begriffe– Hard parse – voller Umfang (aufwendig)– Soft parse – authentifiziert bereits geladenes Statement– Session Cursor Cache übernimmt bei parse call > 3
©Database Consult GmbH - Jachenau
Seminartitel
Folie 45 von 7110/2007
Optimierung der Servicezeit
• Zu hohe Parse-Anteile– Open/close-Calls untersuchen– Bindevariablen verwenden– Ggf. cursor_sharing– Ggf. session_cursor_cache setzen
• Zu hohe recursive Anteile– SQL in PL/SQL optimieren– shared_pool erhöhen
Database Consult GmbH 21
©Database Consult GmbH - Jachenau
Seminartitel
Folie 46 von 7110/2007
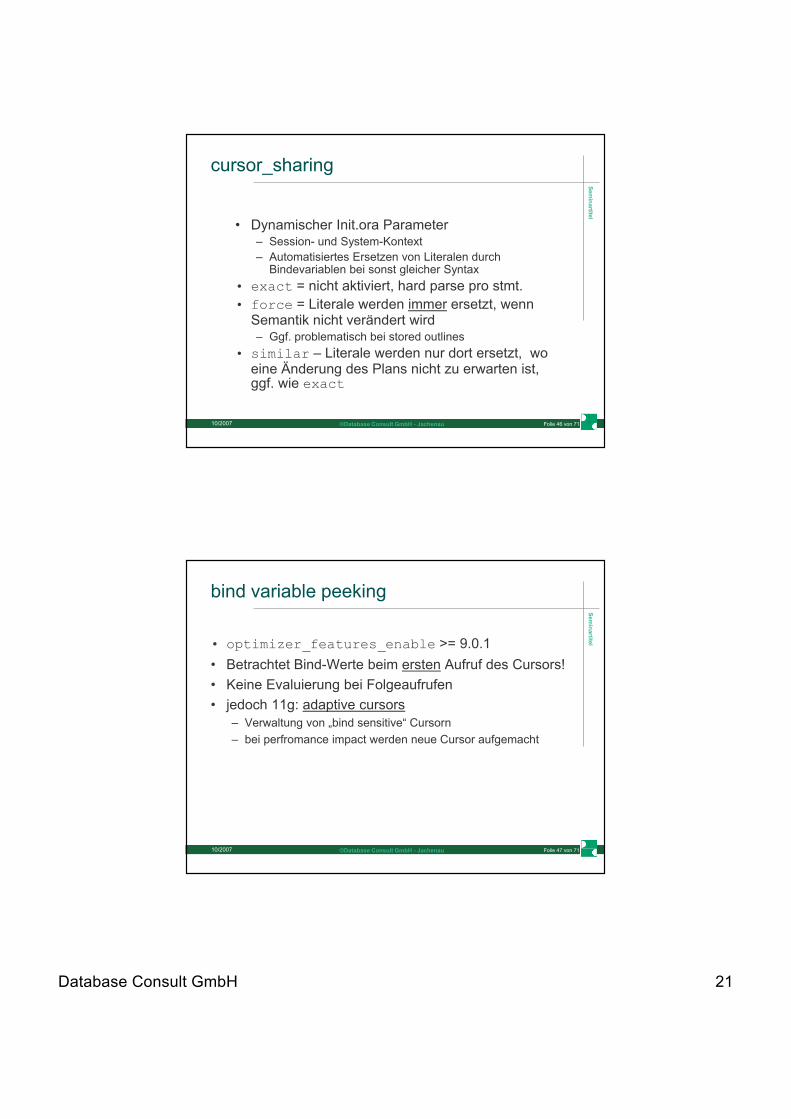
cursor_sharing
• Dynamischer Init.ora Parameter– Session- und System-Kontext– Automatisiertes Ersetzen von Literalen durch
Bindevariablen bei sonst gleicher Syntax• exact = nicht aktiviert, hard parse pro stmt.• force = Literale werden immer ersetzt, wenn
Semantik nicht verändert wird– Ggf. problematisch bei stored outlines
• similar – Literale werden nur dort ersetzt, wo eine Änderung des Plans nicht zu erwarten ist, ggf. wie exact
©Database Consult GmbH - Jachenau
Seminartitel
Folie 47 von 7110/2007
bind variable peeking
• optimizer_features_enable >= 9.0.1• Betrachtet Bind-Werte beim ersten Aufruf des Cursors!• Keine Evaluierung bei Folgeaufrufen• jedoch 11g: adaptive cursors
– Verwaltung von „bind sensitive“ Cursorn– bei perfromance impact werden neue Cursor aufgemacht

Database Consult GmbH 22
©Database Consult GmbH - Jachenau
Seminartitel
Folie 49 von 7110/2007
db file sequential read• Wartezustände bei read()-Operationen (Unix)
– read()-Call – kontinuierliche Speicherung im Memory-Bereich– entspricht Single-Block Read aus Sicht von Oracle– Ausnahme: MB reads auf temporären Segmenten
• Verwendet für– Index Scans– Table Access by Rowid– Undo Zugriffe– Control File und Datafile Header
• Parameter– p1 – file#– p2 – block#– p3 - blocks
©Database Consult GmbH - Jachenau
Seminartitel
Folie 50 von 7110/2007
db file sequential read
• Optimierung der zugehörigen SQL-Statements– dadurch Reduzierung des LIO und dadurch Reduzierung
des PIO– Implementierung, Indexstrukturen, Parameter
• wenn nicht möglich dann IO-Durchsatz erhöhen– Durchschnittliche Single Block Reads ca. 10ms oder ca. 6-
8 ms (SAN) – siehe Tabelle aux_stats$– IO-Verteilung: Platten und Controller – v$filestat
– Filesystem und Blockgrösse versus Rawdevice– Raid Level– Multiple Buffer Pools oder Cache-Klausel

Database Consult GmbH 23
©Database Consult GmbH - Jachenau
Seminartitel
Folie 51 von 7110/2007
db file scattered read• Wartezustände bei read()-Operationen (Unix)
– readv()-Call – verteilte Speicherung im Memory-Bereich– entspricht Multi-Block Read aus Sicht von Oracle – maximal db_file_mulitblock_read_count
• Verwendet für– Full Table Scans– Fast Full Scans auf Indizes (FFS)
• Parameter– p1 – file#– p2 – block#– p3 – block count
©Database Consult GmbH - Jachenau
Seminartitel
Folie 52 von 7110/2007
db file scattered read
• Gemischte db file waits bei full table Scans möglich:– „gecachte“ Blöcke– extent boundaries– Migrierte oder „gechainte“ Rows– Index-Pflege bei INSERTS über Subqueries mit Full Scans
• Optimierung ähnlich sequential reads:– SQL-Optimierung– wenn nicht möglich dann IO-Durchsatz erhöhen

Database Consult GmbH 24
©Database Consult GmbH - Jachenau
Seminartitel
Folie 53 von 7110/2007
direct path read (temp)
• single oder multiblock rad in PGA– entspricht Anzahl der read-requests für Synch-IO– ungenau wegen Überlappungen bei Asynch-IO
• Ursachen– Sorts auf Platte– Hash-Joins > hash_area_size– Parallelisierung von SQL – für Query Slaves (!!)
• für Parent der Event „PX Deq: Execute Reply“• Parameter
– p1 – file#– p2 – block#– p3 – block count
©Database Consult GmbH - Jachenau
Seminartitel
Folie 54 von 7110/2007
direct path read (temp)
• Tuning Massnahmen– SQL Optimierung – sort_area_size, hash_area_size, pga_aggregate_target
• Direct IO Buffer Size– Grösse in Byte über _db_file_direct_io_count– Trace über Event 10357 zeigt slots und slot size– Einstellung von Sltos size über Event 10351– Anzahl slots über Event 10353
• aktuelle Nutzung siehe über v$tempseg_usage
Database Consult GmbH 25
©Database Consult GmbH - Jachenau
Seminartitel
Folie 56 von 7110/2007
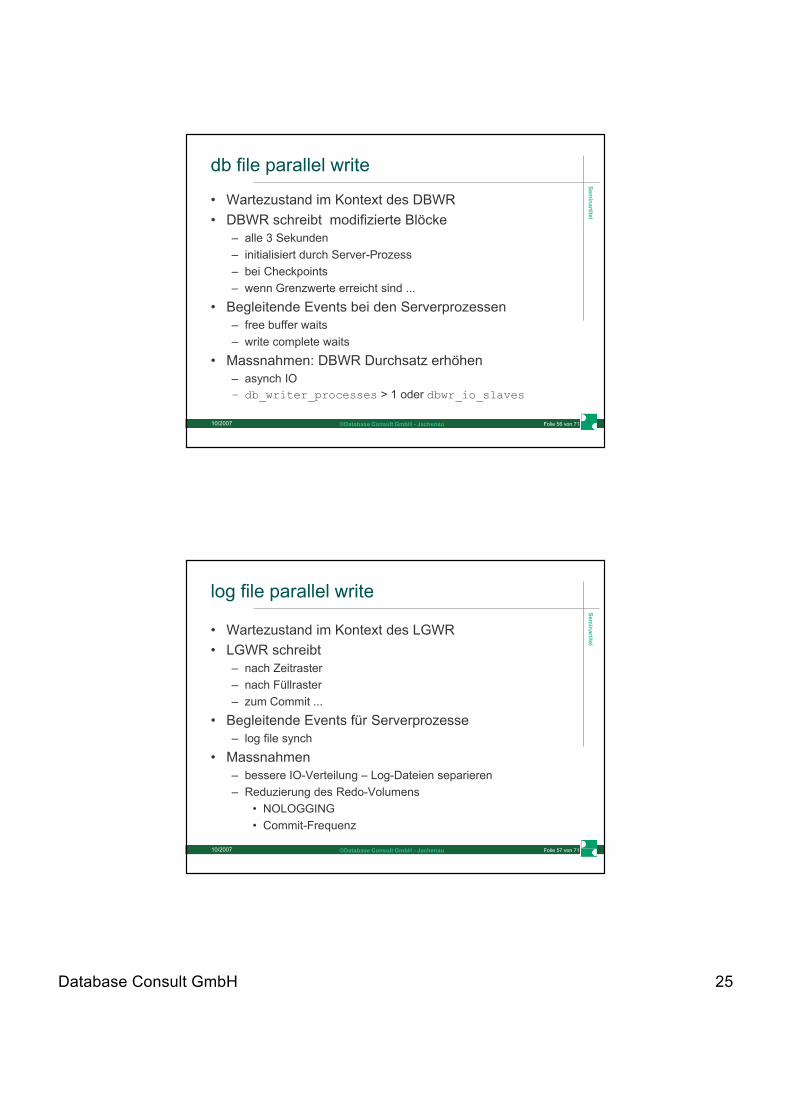
db file parallel write
• Wartezustand im Kontext des DBWR• DBWR schreibt modifizierte Blöcke
– alle 3 Sekunden– initialisiert durch Server-Prozess– bei Checkpoints– wenn Grenzwerte erreicht sind ...
• Begleitende Events bei den Serverprozessen– free buffer waits– write complete waits
• Massnahmen: DBWR Durchsatz erhöhen– asynch IO– db_writer_processes > 1 oder dbwr_io_slaves
©Database Consult GmbH - Jachenau
Seminartitel
Folie 57 von 7110/2007
log file parallel write
• Wartezustand im Kontext des LGWR• LGWR schreibt
– nach Zeitraster– nach Füllraster– zum Commit ...
• Begleitende Events für Serverprozesse– log file synch
• Massnahmen– bessere IO-Verteilung – Log-Dateien separieren– Reduzierung des Redo-Volumens
• NOLOGGING• Commit-Frequenz
Database Consult GmbH 26
©Database Consult GmbH - Jachenau
Seminartitel
Folie 64 von 7110/2007
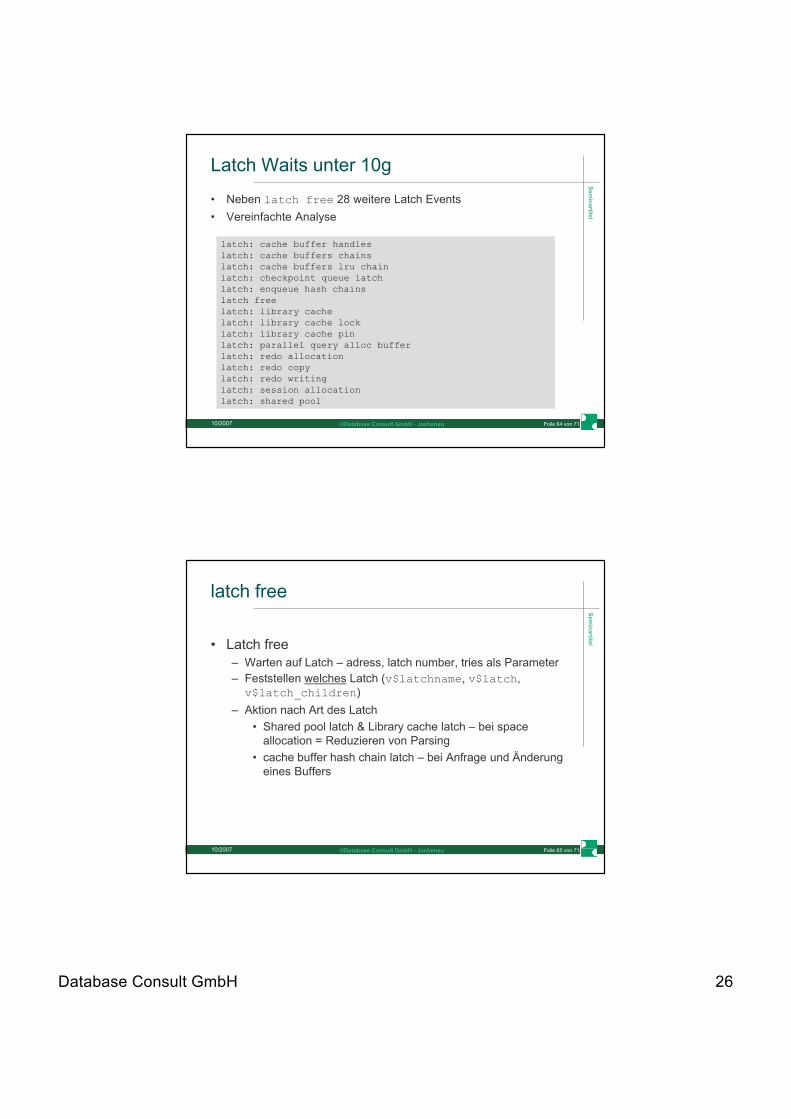
Latch Waits unter 10g
• Neben latch free 28 weitere Latch Events• Vereinfachte Analyse
latch: cache buffer handleslatch: cache buffers chainslatch: cache buffers lru chainlatch: checkpoint queue latchlatch: enqueue hash chainslatch freelatch: library cachelatch: library cache locklatch: library cache pinlatch: parallel query alloc bufferlatch: redo allocationlatch: redo copylatch: redo writinglatch: session allocationlatch: shared pool
©Database Consult GmbH - Jachenau
Seminartitel
Folie 65 von 7110/2007
latch free
• Latch free– Warten auf Latch – adress, latch number, tries als Parameter– Feststellen welches Latch (v$latchname, v$latch, v$latch_children)
– Aktion nach Art des Latch• Shared pool latch & Library cache latch – bei space
allocation = Reduzieren von Parsing• cache buffer hash chain latch – bei Anfrage und Änderung
eines Buffers

Database Consult GmbH 27
©Database Consult GmbH - Jachenau
Seminartitel
Folie 66 von 7110/2007
SQL Optimierung
CBO arbeitet i.d.R. zufriedenstellend wenn er korrekt konfiguriert wurde!
Gute Kenntnis der Grundlagen (init.ora und Statistiken) garantieren Verlässlichkeit!
©Database Consult GmbH - Jachenau
Seminartitel
Folie 68 von 7110/2007
Serverparameter CBO
GrundlegendOPTIMIZER_MODEOPTIMIZER_FEATURES_ENABLEOPTIMIZER_DYNAMIC_SAMPLINGOPTIMIZER_INDEX_COST_ADJOPTIMIZER_INDEX_CACHINGDB_FILE_MULTIBLOCK_READ_COUNT
MemoryWORKAREA_SIZE_POLICYPGA_AGGREGATE_TARGETHASH_AREA_SIZESORT_AREA_SIZEBITMAP_MERGE_AREA_SIZE
Query transformationQUERY_REWRITE_ENABLEDQUERY_REWRITE_INTEGRITYSTAR_TRANSFORMATION_ENABLEDOPTIMIZER_SECURE_VIEW_MERGING
DiverseCURSOR_SHARINGSKIP_UNUSABLE_INDEXESDB_FILE_MULTIBLOCK_READ_COUNTparallel processingunderscore-Parameters
Database Consult GmbH 28
©Database Consult GmbH - Jachenau
Seminartitel
Folie 69 von 7110/2007
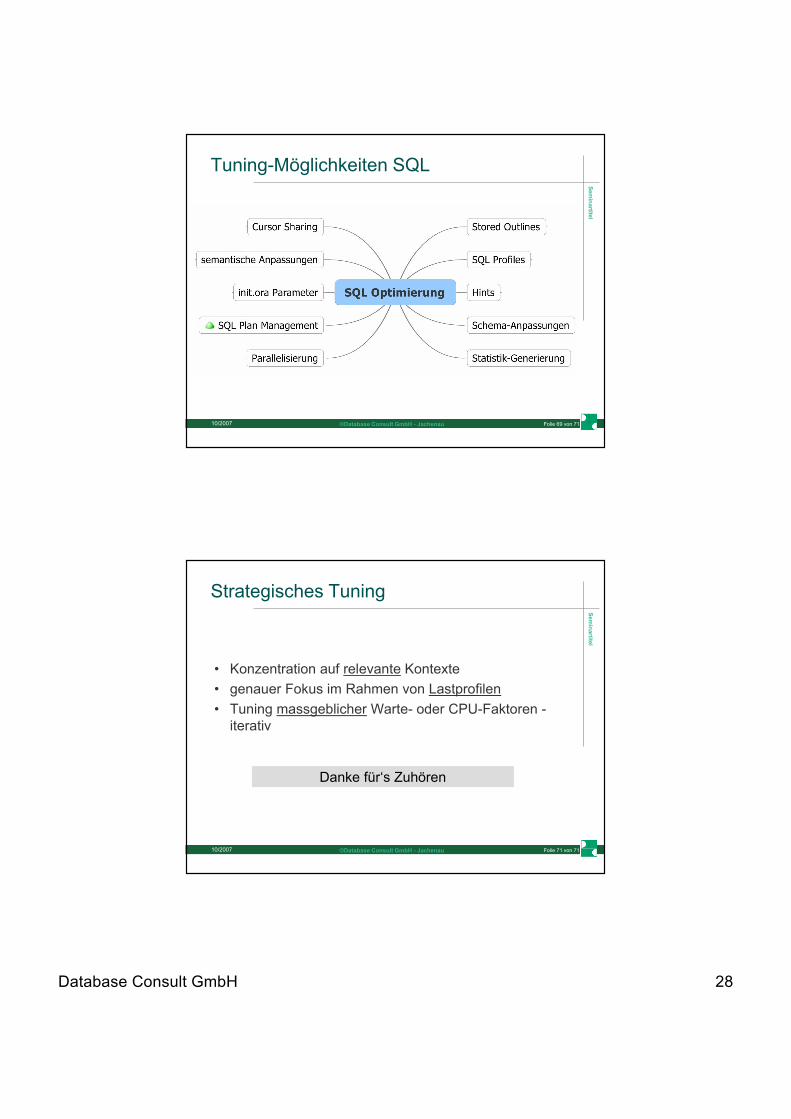
Tuning-Möglichkeiten SQL
©Database Consult GmbH - Jachenau
Seminartitel
Folie 71 von 7110/2007
Strategisches Tuning
• Konzentration auf relevante Kontexte• genauer Fokus im Rahmen von Lastprofilen• Tuning massgeblicher Warte- oder CPU-Faktoren -
iterativ
Danke für‘s Zuhören