streaming is the new black: a consumer-based examination of netflix inc. original programming and...
DESCRIPTION
Founded in 1997 in the United States, Netflix Inc. was originally a DVD-by- mail service, providing an alternative option to big box rental stores and their accompanying late fees. Foreseeing the potential in over-the-top Internet streaming and the fall of DVDs, Netflix began offering on-demand Internet streaming of licensed films and television programs in 2007 as a free perk for subscribers. By 2010, Netflix's streaming business had grown so quickly that the company transformed from the most rapidly growing customer of the United States Postal Service's mail service to the largest source of evening Internet traffic in North America. That same year, streaming became a separate subscription option from DVD rentals, marking the company's shift in focus towards streaming. In 2014, Netflix further defined its streaming strategy with the stated goal of releasing original content every two and half weeks. This change transformed Netflix from a content aggregator into a major content creator, potentially redefining the company’s entire business model and brand image. However, it is unclear if this strategy modification has been successful in customer acquisition and retention as Netflix releases very little subscriber data. It is also unknown if viewers are taking to Netflix originals with the same alacrity as other premium content services known for such content. Though Netflix openly compares itself to HBO, a company known for quality originals, there is no data regarding its originals to back up this comparison. Additionally, in the face of rising content costs diminishing the bottom line at Netflix, it is critical that major content investments are proven to be stimuli for growth. If originals are proven to be important to users and beneficial to the company, this could legitimize the large budgets of some of the Netflix originals. This thesis examines Netflix streaming users habits, preferences, and opinions on Netflix streaming and original programming via survey to determine how important original programming is for the company and if it will help achieve the company’s wider goal of becoming the world’s first Internet- only premium content network.TRANSCRIPT

Streaming is the New Black: A Consumer-based Examination of Netflix Inc.
Original Programming and Streaming Strategy
A Thesis
Submitted to the Faculty
of
Drexel University
by
Lindsay B. Strott
in partial fulfillment of the
requirements for the degree
of
Master of Science in Television Management
March 2015

© Copy Right 2015 Lindsay B. Strott. All Rights Reserved

i Acknowledgements
Thank you to my thesis advisor Dr. Lydia Timmins and program director Al Tedesco for your guidance throughout my studies and the thesis writing process. I would also like to thank my family, friends, and classmates for their support and encouragement.
ii Table of Contents
List of Tables ............................................................................................................. vii
List of Figures ........................................................................................................... viii
List of Appendices ...................................................................................................... xi
Abstract ...................................................................................................................... xii
Chapter 1 : Introduction ............................................................................................ 1
1.1 Introduction ............................................................................................................. 1
1.2 Statement of the Problem ........................................................................................ 4
1.3 Background ............................................................................................................. 8
1.4 Purpose of the Study ............................................................................................. 20
1.5 Research Questions ............................................................................................... 21
1.6 Significance to the Field ....................................................................................... 22
1.7 Definitions............................................................................................................. 22
1.8 Limitations ............................................................................................................ 25
1.9 Ethical Considerations .......................................................................................... 25
Chapter 2 : Literature Search ................................................................................. 26
2.1 Introduction ........................................................................................................... 26
2.2 Who online video users are ................................................................................... 27
2.3 What online video users watch ............................................................................. 31
2.4 How users find content ......................................................................................... 36
2.5 Netflix Content Spending ..................................................................................... 38
Chapter 3 : Data Presentation ................................................................................. 43
3.1 Introduction ........................................................................................................... 43
3.2 Respondent demographics .................................................................................... 43
3.2.1 Ethnicity and gender .......................................................................................... 43
3.2.2 Location and gender ........................................................................................... 44
3.2.3 Respondent ages ................................................................................................. 44
3.2.4 Respondents with children under 16 in their household .................................... 45
3.2.5 Respondent household income in US dollars .................................................... 46

iii 3.2.6 How respondents paid for Netflix access ........................................................... 47
3.3 Netflix usage ......................................................................................................... 48
3.3.1 Total respondents’ frequency of Netflix streaming use ..................................... 48
3.3.2 How long ago respondents first used Netflix streaming .................................... 49
3.3.3 Frequency of Netflix streaming use arranged by how long ago Netflix streaming
was first used ............................................................................................................... 49
3.3.4 Frequency of use for children under 16 in respondent’s household .................. 50
3.3.5 Why respondents first began using Netflix ........................................................ 51
3.3.6 Why people began using Netflix arranged by frequency of use ........................ 52
3.3.7 Why people begin using Netflix arranged by first use of streaming ................. 53
3.3.8 Reasons for suspending Netflix usage ............................................................... 54
3.3.9 Reasons for rejoining Netflix ............................................................................. 55
3.4 Usage and Opinion of Other Content Sources ...................................................... 56
3.4.1 Number of premium content services used in addition to Netflix ..................... 56
3.4.2 Which other premium content services respondents used ................................. 57
3.4.3 Percentage of users subscribing to other content services arranged by first
Netflix streaming use .................................................................................................. 58
3.4.4 Percentage of respondents subscribing to other content services arranged by
streaming frequency .................................................................................................... 59
3.4.5 Respondents’ opinion of premium content providers ........................................ 59
3.4.6 Domestic respondents’ opinion of broadcast and basic cable content in
comparison with Netflix ............................................................................................. 60
3.5 Viewership and opinion of content genre and forms ............................................ 61
3.5.1 Respondent viewership of content forms ........................................................... 61
3.5.2 How often respondents watched specific content genres .................................. 63
3.5.3 How often respondents watched specific content genres by gender .................. 64
3.5.4 Whether or not Netflix needs to add additional content to its catalog by content
forms ........................................................................................................................... 65
3.5.5 Whether or not Netflix needs to add additional content to its catalog by genre 66
3.6 Respondent opinion on Netflix original programs ................................................ 68
3.6.1 Respondent awareness of select Netflix original programs ............................... 68

iv 3.6.2 Respondent viewership for select Netflix originals, restricted to those who were
aware of the programs ................................................................................................. 70
3.6.3 Respondents’ rating of Netflix original programming vs. entire content
collection ..................................................................................................................... 71
3.7 Perceived value of Netflix streaming features ...................................................... 73
3.7.1 Importance of Netflix features and activities on a 5-point scale ....................... 73
3.7.2 Respondents’ most important feature to Netflix usage satisfaction ................... 75
3.7.3 Respondents’ most important feature to Netflix usage satisfaction by gender .. 75
3.7.3 Respondents’ most important feature to Netflix usage satisfaction by frequency
of use ........................................................................................................................... 76
3.7.4 Respondents’ most important feature to Netflix usage satisfaction by how long
ago Netflix streaming was first used ........................................................................... 77
3.8 Importance of future Netflix original programming ............................................. 78
3.8.1 Whether or not knowing that Netflix is greatly expanding original programming
adds value to Netflix access arranged by frequency of use ........................................ 78
3.8.2 Whether or not knowing that Netflix is greatly expanding original programming
adds value to Netflix access arranged by how long ago Netflix streaming was first
used ............................................................................................................................. 79
3.8.3 Importance of the prospect of future original programming to respondents’
continued Netflix usage arranged by frequency of use ............................................... 81
3.8.4 Importance of the prospect of future original programming to respondents’
continued Netflix use arranged by how long ago Netflix streaming was first used ... 82
Chapter 4 : Discussion .............................................................................................. 84
4.1 Introduction ........................................................................................................... 84
4.2 R1: Who are Netflix’s streaming consumers? ...................................................... 84
4.3 R2: How do consumers access Netflix and what inspires them to join or leave
Netflix? ....................................................................................................................... 85
4.3.1 Access ................................................................................................................ 85
4.3.2 Joining Netflix ................................................................................................... 85
4.3.3 Leaving Netflix .................................................................................................. 86
4.3.4 Rejoining Netflix ............................................................................................... 87
v 4.3.5 Summary ............................................................................................................ 88
4.4 R3: How often consumers use Netflix streaming and what do they watch? ........ 89
4.4.1 Frequency ........................................................................................................... 89
4.4.2 TV series vs. Films ............................................................................................ 90
4.4.3 Content Genres ................................................................................................... 91
4.4.4 Summary ............................................................................................................ 92
4.5 R4: What features and activities do Netflix streaming users value most? ............ 92
4.5.1 Rating the importance of various features and activities ................................... 92
4.5.2 Choosing the most important feature ................................................................. 95
4.5.3 Summary ............................................................................................................ 97
4.6 R5: What do Netflix streamers think about Netflix original programs? ............... 98
4.6.1 Awareness .......................................................................................................... 98
4.6.2 Viewership and Interest ..................................................................................... 99
4.6.3 Summary .......................................................................................................... 102
4.7 R6: How do Netflix users feel about Netflix’s original programming in
comparison to other content providers’ original programming? .............................. 102
4.7.1 Respondent usage of other premium content services ..................................... 102
4.7.2 Respondent opinion of premium service original programming in comparison
with Netflix original programming ........................................................................... 104
4.7.3 Domestic respondent opinion of broadcast and basic cable original
programming in comparison with Netflix original programming ............................ 106
4.7.4 Summary .......................................................................................................... 107
4.8 R7: Do consumer viewing habits warrant a reallocation of Netflix’s content
budget towards spending more on original programming? ...................................... 108
4.8.1 As indicated by survey respondents ................................................................. 108
4.8.2 In the face of a changing streaming environment ............................................ 109
4.8.3 Summary .......................................................................................................... 110
4.9 R8: If it is a good investment, what genres and forms of original programming
should the company pursue for the most efficient use of capital? ............................ 111
4.9.1 Content format ................................................................................................. 111
4.9.2 Genres .............................................................................................................. 112

vi 4.9.3 Content in languages other than English ......................................................... 113
4.9.4 Children’s programming .................................................................................. 113
4.9.5 Summary .......................................................................................................... 114
Chapter 5 : Conclusion ........................................................................................... 115
5.1 Conclusion .......................................................................................................... 115
5.2 Recommendations for future studies .................................................................. 119
List of References .................................................................................................... 120
Appendix A: List of Netflix Original Programs as Defined by this Thesis, as of
March 2015 .............................................................................................................. 131
Appendix B: Netflix Streaming Consumer Survey .............................................. 137

vii
List of Tables
1. Female respondent viewership of TV series and films ................................... 62
2. Male respondent viewership of TV series and films ...................................... 62
3. Respondent average genre viewership ............................................................ 63
4. Female respondent average genre viewership ................................................ 64
5. Male respondent average genre viewership .................................................... 64
6. Female respondents on forms of content additions ......................................... 65
7. Male respondents on forms of content additions ............................................ 66
8. Female respondents on genre additions .......................................................... 67
9. Male respondents on genre additions .............................................................. 67
10. Average respondent satisfaction with Netflix content collections .................. 72
11. Average importance of Netflix features and activities ................................... 73
12. Average importance of original programming expansion by streaming
frequency ......................................................................................................... 78
13. Average importance of original programming expansion by how long ago
Netflix streaming was first used ..................................................................... 80
14. Average Importance of future original programming to continued Netflix use
by streaming frequency ................................................................................... 81
15. Average importance of future original programming to continued Netflix use
by how long ago Netflix streaming was first used .......................................... 83

viii
List of Figures
1. Respondent ethnicity and gender .................................................................... 43
2. Respondent location and gender ..................................................................... 44
3. Respondent ages .............................................................................................. 44
4. Respondents with children under 16 in their households ............................... 45
5. Responden household income in US dollars .................................................. 46
6. How respondents paid for Netflix access ........................................................ 47
7. Respondents' frequency of Netflix streaming ................................................. 48
8. How long ago respondents first used Netflix streaming ................................. 49
9. Frequency of Netflix streaming use arranged by how long ago Netflix
streaming was first used .................................................................................. 49
10. Frequency of Netflix streaming use for children under 16 in respondent
households....................................................................................................... 50
11. Why respondents first began using Netflix streaming .................................... 51
12. Why people began Netflix streaming arranged by frequecy of use ................ 52
13. Why people began Netflix streaming arranged by first use of streaming ....... 53
14. Reasons for suspending Netflix usage ............................................................ 54
15. Reasons for rejoining Netflix .......................................................................... 55
16. Number of premium content services used in addition to Netflix .................. 56
17. Which other premium content services respondents used .............................. 57
18. Percentage of users subscribing to other content services arranged by first
Netflix streaming use ...................................................................................... 58
ix 19. Percentage of users subscribing to other content services arranged by Netflix
streaming frequency ........................................................................................ 59
20. Respondents' opinion of premium content services' original programming ... 59
21. Domestic respondents' opinion of broadcast and basic cable original content in
comparison with Netflix ................................................................................. 60
22. Respondent viewership of content forms ........................................................ 61
23. How often respondents watched specific content genres ............................... 63
24. Whether or not Netflix needs to add additional content by content form ....... 65
25. Whether or not Netflix needs to add additional content by genre .................. 66
26. Respondent awareness of select Netflix original programs ............................ 68
27. Respondent viewership for select Netflix originals ........................................ 70
28. Respondents' rating of Netflix original programming vs. entire content
collection ......................................................................................................... 71
29. Importance of Netflix features on a 5-point scale ........................................... 73
30. Respondents' most important feature to Netflix usage satisfaction ................ 75
31. Respondents' most important feature to Netflix usage satisfaction by gender 75
32. Respondents' most important feature to Netflix usagae satisfaction by
frequency of use .............................................................................................. 76
33. Respondents' most important feature to Netflix usagae satisfaction by how
long ago Netflix streaming was first used ....................................................... 77
34. Whether or not knowing that Netflix is greatly expanding original
programming adds value to Netflix access arranged by frequency of use ..... 78

x 35. Whether or not knowing that Netflix is greatly expanding original
programming adds value to Netflix access arranged by how long ago Netflix
streaming was first used .................................................................................. 79
36. Importance of future original programming to respondents’ continued Netflix
usage arranged by frequency of use ................................................................ 81
37. Importance of future original programming to respondents’ continued Netflix
use arranged by how long ago Netflix streaming was first used .................... 82

xi List of Appendices
Appendix A: List of Netflix Original Programs As Defined by this Thesis, as of
March 2015 ............................................................................................................... 131
Appendix B: Netflix Streaming Consumer Survey .................................................. 137

xii Abstract
Streaming is the New Black: A Consumer-based Examination of Netflix Inc. Original Programming and Streaming Strategy
Lindsay B. Strott
Founded in 1997 in the United States, Netflix Inc. was originally a DVD-by-
mail service, providing an alternative option to big box rental stores and their
accompanying late fees. Foreseeing the potential in over-the-top Internet streaming
and the fall of DVDs, Netflix began offering on-demand Internet streaming of
licensed films and television programs in 2007 as a free perk for subscribers. By
2010, Netflix's streaming business had grown so quickly that the company
transformed from the most rapidly growing customer of the United States Postal
Service's mail service to the largest source of evening Internet traffic in North
America. That same year, streaming became a separate subscription option from
DVD rentals, marking the company's shift in focus towards streaming. In 2014,
Netflix further defined its streaming strategy with the stated goal of releasing original
content every two and half weeks. This change transformed Netflix from a content
aggregator into a major content creator, potentially redefining the company’s entire
business model and brand image. However, it is unclear if this strategy modification
has been successful in customer acquisition and retention as Netflix releases very
little subscriber data. It is also unknown if viewers are taking to Netflix originals with
the same alacrity as other premium content services known for such content. Though
Netflix openly compares itself to HBO, a company known for quality originals, there
is no data regarding its originals to back up this comparison. Additionally, in the face
of rising content costs diminishing the bottom line at Netflix, it is critical that major

xiii content investments are proven to be stimuli for growth. If originals are proven to be
important to users and beneficial to the company, this could legitimize the large
budgets of some of the Netflix originals. This thesis examines Netflix streaming users
habits, preferences, and opinions on Netflix streaming and original programming via
survey to determine how important original programming is for the company and if it
will help achieve the company’s wider goal of becoming the world’s first Internet-
only premium content network.


1
Chapter 1 : Introduction
1.1 Introduction
Entertainment and media proliferation is splintering the traditional television
viewing audience and changing what it means to watch TV. The Big 3 broadcast
networks (ABC, NBC, CBS) were the only available options for the majority of
American viewers in the early years of television (Edgerton, 2007). Even as late as
the 1978–79 season, ABC, NBC, and CBS collectively commanded a whopping 91%
share of the prime-time audience (Bradley, 2007). Over the following twenty years,
however, viewership of the Big 3 declined steadily and significantly due to the rise in
accessibility, quantity and quality of cable channels as well as the creation of other
broadcast networks. In 2013, the Big 3 claimed less than 35% of the prime time
viewing audience (IBISWorld, 2013). However, traditional television (including both
broadcast and cable networks) is losing viewers at an increasing rate to a new
competitor: new media platforms. New media platforms include apps, mobile
devices, OnDemand services, Internet sites like YouTube, subscription services such
as Hulu, and DVR (TV broadcasting & cable networks, 2013). According to
Leichtman Research Group, 76% of American households have a DVR, subscribe to
Netflix or use OnDemand, and 70% of people that have these platforms use them
weekly (Leichtman Research Group, 2015). Expanding technology and Internet
capabilities allows television viewers to enjoy and even expect concierge-like service:
they want to see their programs anytime, anywhere, on any device. Despite new
media’s advantages, forecasting the demise of broadcast networks is premature. For
the foreseeable future, broadcasters remain the best way for advertisers to reach a

2 broad, diverse audience that advertisers are willing to pay for (eMarketer, 2013).
Additionally, users of new media platforms make up traditional television’s most avid
consumers (Kafka, 2013). Nonetheless, alternative viewing platforms are an
entertainment source worth paying attention to as a growing trend and increasing
segment of entertainment media.
One of the most prominent forms of new media platforms is over-the-top
service. Over-the-top service, or OTT, in the broadest terms is the delivery of any
media over the Internet directly to consumers without the participation of a multi-
channel video provider such as a cable company (Comcast, Time Warner Cable,
Cablevision, etc.) or direct-broadcast satellite television system (DirecTV, Dish
Network, etc.) (Smith, 2007). Unlike with IPTV (Internet Protocol television), the
Internet provider has no direct responsibility or control over the OTT content and
does not use a dedicated managed system, sometimes referred to as a walled garden
ecosystem, for delivery (Narang, 2013). Examples of OTT services are Crackle,
YouTube, Netflix, Amazon Prime, and Skype. OTT content can be free or paid
content, and users can access OTT via a myriad of Internet enabled devices including
televisions, computers, smart phones, gaming consuls, Blu-ray players, and dedicated
OTT boxes. According to research by The Diffusion Group, as of 2011 there were 90
million households worldwide watching OTT content (Reedy, 2011); by 2016 there
will be over 250 million OTT households (Reedy, 2011). The OTT video industry
generated around $2-3 billion in revenue globally in 2011 (Taga, 2012), which is
significantly less than the $468 billion global film, entertainment and television
industry (Taga, 2012). However, one estimate suggests revenue will reach $15 billion

3 by 2016 (Taga, 2012), and other studies suggest that OTT is growing even faster than
this estimate, forecasting 2017 revenues to reach $37 billion (Informa Media Group,
2012). Because this industry is growing so rapidly and becoming a huge economic
force, there is value is examining what is helping OTT become a top entertainment
source.
The most successful OTT service based on paying subscribers, international
availability, and downstream traffic is Netflix. Netflix ended 2014 with more than 53
million subscribers globally, over 36 million of them being U.S. based (O’Toole,
2014). In comparison, Amazon Prime has an estimated 40 million subscribers
globally as of September 2014 (Hanley Frank, 2014). However, while the company
reports that membership is steadily rising thanks to new products like Amazon Fire
TV and an ever-expanding video library, it is estimated as few as one third of these
subscribers actually utilize the video service aspect of the membership (Thomas,
2013). Hulu has about 6 million paid subscribers as of April 2014, but it also benefits
from an unknown number of free users through advertising revenue (Perez, 2014). In
terms of actually using OTT services, Netflix members spend much more time on the
service as measured by Internet traffic. According to Sandvine Inc., a broadband
service company, in 2014 Netflix accounted for 34.2% of all downstream Internet
traffic in North America (Stenovec, 2014). The website of any kind that comes
closest to that downstream rate is YouTube, which consists of a much smaller 13.9%
of traffic (Stenovec, 2014). As far as direct competitors go, Amazon Prime Video
comes in at 1.9% and Hulu is slightly lower at 1.74% (Stenovec, 2014). While some
of Netflix’s downstream data demands may be attributed to its adding Super HD

4 content, which is 50% larger than the previously available 1080p content, Netflix still
commanded over 31% of North American downstream data in November 2013,
before Super HD content was available (di Graza, 2013). And while Netflix has only
been available in the United Kingdom and Ireland since 2012, in two years it became
the second largest source of traffic during peak evening hours and accounted for over
17% of downstream fixed access traffic (Sandvine, 2014). In other words, not only
are more consumers using Netflix domestically and internationally than competitor
services, they are watching significantly more content on the service for longer
periods of time.
1.2 Statement of the Problem
While the majority of Netflix content consists of licensed material sourced
from various television networks and film studios, Netflix began releasing its own
original programming in 2012 and announced a goal of releasing at least five original
series per years starting in 2013 (Hastings & Wells, 2013). Speculation suggests the
reasons in doing so are to combat subscriber churn and grow the company’s
subscription base. However, the business move is more radical than many realize.
The original programming strategy transforms Netflix from a merely a content
aggregator into content creator, potentially redefining the company’s entire business
model and brand image. Nevertheless, it is unclear if this strategy change has been
successful in customer retention and if it will achieve the company’s wider goal of
becoming the world’s first Internet-only premium content network. In fact, Netflix
CEO Reed has openly voiced that the company strives to become “the HBO” of the
over-the-top space (Daly, 2013), meaning it would like to be known for engrossing

5 original programs in addition to its quality re-packaged content library. Taking the
idea one step further, Netflix Chief Content Officer Ted Sardanos said, “The goal is
to become HBO faster than HBO can become us,” (Hass, 2013). The urgency of this
goal was heightened after the October 2014 announcement that HBO will be offering
a stand-alone streaming service in 2015 called HBO Now, but consumer response
alone will decide its success.
Consumer response and program achievement in media is typically measured
by audience ratings. However, as a company, Netflix has repeatedly stated it has no
reason to release ratings. This is because, as Netflix has no commercials, there are no
advertisers to impress with audience numbers. Additionally, in terms of Netflix’s
content-buying model and philosophy, it does not really matter how many people
watch a given program if the investment price and license period are appropriate.
Occasionally Netflix will release relative statements to sate curiosity such as the
announcement that Orange is the New Black ended 2013 as Netflix’s most watched
original series (Hastings & Wells, 2013), but the company refrains from releasing
hard numbers.
With the lack of direct data, investors, journalists, and media researchers have
resorted to external popularity measurements to estimate original programming
success, namely via social media measurement. In a Q3 2013 letter to shareholders,
Hastings and CFO David Wells themselves credited domestic net subscriber additions
being 11% higher than the prior year Q3 to original content’s press coverage, social
buzz, and Emmy nominations (Hastings and Wells, 2013). But in the same letter,
Hastings and Wells admit that a bigger percentage of overall Netflix viewing is

6 generated by exclusive complete season-after series (Hastings and Wells, 2013).
Nonetheless, Twitter, Facebook, blogs, and other websites are continually monitored
for mentions of Netflix, its original programs, characters, and actors, especially
before and after premieres and award shows. But does this actually translate into
subscriber growth? Do these measurements reflect all consumers or just the vocal
few? Netflix believes the chatter has some value, at least in terms of advertisement
and brand awareness. In its April 22, 2013 statement to investors, Reed cited the
creation of buzz as the primary reason for releasing entire original series at once.
"Our decision to launch all episodes at once created enormous media and social buzz,
reinforcing our brand attribute of giving consumers complete control over how and
when they enjoy their entertainment,” (Netflix Inc., 2013). This tactic clearly helps
create a deluge of talk and perhaps saves the company some advertising dollars, but
when looking at actual data, consumer social interactions based around Netflix
original programming are dwarfed by traditional television shows that get the same or
less media attention.
According to research firm NetBase, in a review of multiple social media sites
there were 51,045 social media mentions for House of Cards (68% positive, 32%
negative) in the 30 days leading up to its February 1, 2013 premiere, and Arrested
Development garnered 170,431 social mentions (77% positive, 23% negative), in the
30 days leading up to its premiere (Spangler, 2013). However, high-profile traditional
TV shows have generated even more talk. For example, in the month before HBO’s
Game of Thrones season 3 premiere, NetBase tallied 1.23 million interactions (71%
positive, 29% negative). AMC’s Mad Men premiere had 288,605 social

7 mentions (37% positive, 63% negative) in the 30 days before the season 6 debut
(Spangler, 2013). Comparatively, the Netflix buzz does not produce the same level of
social media response as traditional TV programs.
Looking at another company’s research, Nielsen’s measurement of Twitter
buzz found Netflix’s December 2014 original Marco Polo garnered 2,400 tweets
throughout the full day it debuted on the streaming service (Ramachandran, 2014). In
comparison, an HBO original series The Leftovers premiered in June 2014 to 19,000
tweets in just the three hours before and after live airing. Blackish, an ABC comedy,
inspired 72,000 tweets for the series premiere in September 2014, while HBO’s Game
of Thrones season 4 premiere had 300,000 tweets during the three hours before and
after live broadcast (Ramachandran, 2014). While any amount of buzz is helpful to
the brand, Netflix social buzz is not proving to measure up to its television
counterparts. Whether or not social mentions can be considered an accurate reflection
of viewership, it is not reason enough alone for the original programming investment.
Netflix’s first ventures into original programming have certainly garnered
critical attention. In 2013 alone, the company was nominated for 14 Primetime Emmy
awards in all, winning three of them, and was nominated for 6 Golden Globe awards,
winning one. This marked the first time that a web-based television series had been
nominated for, let alone won, a Primetime Emmy (Sharma & Cheney, 2013). The
original programs have been nominated for other awards including Producers Guild
of America Awards, Satellite Awards, Screen Actors Guild Awards, People’s Choice
Awards, Golden Reel Awards, Television Critics Association Awards, Writers Guild
of America Awards, Directors Guild of America Awards, Peabody Awards, and

8 BAFTA TV Awards. Clearly, critics, viewers, and industry members acknowledge
the quality of the original programming and are recognizing Netflix for it, but awards
cannot be monetized and do not pay the expenses of such shows.
The best measure for the effectiveness of Netflix’s original programming
strategy is its overall effect on subscriber relationship: subscriber growth, subscriber
value perception, and the prevention of subscriber churn, the metric that measures
how many of a service's users cancel in any given month. If original programming
can be proven to improve Netflix’s membership, then it should be considered an
important part of the company’s strategy and a worthwhile investment. Industry
analysts have speculated positive results regarding original programming, citing that
Netflix doubled its year-over-year investment in such content for 2014 (Meyers,
2013). While this sounds like a glowing endorsement of the strategy, 2014’s original
content investment represented less than 10% of the company’s global content
expense (Meyers, 2013). Compare this to HBO, the standard to which Netflix openly
strives, which has a 40% budgetary investment in original programming (Daly, 2013).
Netflix’s approach to the strategy now appears to be much more cautious and
fledgling. So while it is growing exponentially, original programming still does not
prove a significant expenditure for the company. Yet to truly compete with a
company like HBO and expand subscriber growth, it might need to be.
1.3 Background
Established in 1997 as a DVD rental service by Marc Randolph and Reed
Hastings, Netflix, Inc. started its digital distribution service and subscription-based
model in 1999 (Netflix, Inc., 2013). The following year, the company launched the

9 personalized movie recommendation system that uses members’ ratings to predict
viewing suggestions. On May 22, 2002, Netflix made its initial public offering on
Nasdaq under the ticker “NFLX” while having 600,000 members. For the next
several years the company experienced incredible subscriber growth, usually
increasing over 60% year over year (Timeline, N.d.). Netflix progressively rolled out
digital streaming in 2007 as a complimentary service included in membership with a
small initial offering of 1,000 titles (Anderson, 2007). The number of hours per
month allowed for online streaming was limited by plan: those with the $5.99
subscription were allowed 6 hours of streaming while those with the $17.99 plan were
allowed 18 hours of streaming (Anderson, 2007). At the time of the announcement,
CEO Reed Hastings said, "While mainstream consumer adoption of online movie
watching will take a number of years due to content and technology hurdles, the time
is right for Netflix to take the first step. Over the coming years we'll expand our
selection of films, and we'll work to get to every Internet-connected screen, from cell
phones to PCs to plasma screens," (Anderson, 2007). The inclusion of streaming as
part of the Netflix subscription proved to be a popular bonus with consumers.
By 2010, Netflix's streaming business had grown so quickly that the company
had transformed from the most rapidly growing customer of the United States Postal
Service's first-class mail service to the largest source of Internet traffic in North
America in the evening (Arango & Carr, 2010). That year, the company began
offering a stand-alone streaming subscription that allowed unlimited streaming for
$7.99 a month (Arango & Carr, 2010). Netflix also began its international expansion
in 2010 by launching in Canada. It subsequently launched in Latin America, the

10 Caribbean, the United Kingdom, Ireland, the Nordics, and the Netherlands (Timeline,
N.d.). As of 2015, American Netflix members can watch unlimited content, anytime,
anywhere, on nearly any Internet-connected screen in SD for $7.99 per month or HD
for $8.99 per month (Overview, 2015). Netflix has over 53 million subscribers in
nearly 50 countries watching more than two billion hours of TV shows and movies
per month (Overview, 2015). On its investor relations website, Netflix now calls itself
“the world’s leading Internet television network,” signaling a new era and loftier aims
for the company (Overview, 2015).
It is difficult to find any investor relations letter or interview where Reed
Hastings does not compare Netflix to HBO or voice his desire to surpass that
company’s success (Daly, 2013). But to understand what it means to be “the HBO of
OTT” (Daly, 2013) one must examine HBO’s brand identity. And as pop culture
analyst Alyssa Rosenberg said, “what really makes HBO the thing we understand it to
be today is the decision to expand its scripted original programming slate in addition
to its movie library,” (Rosenberg, 2013). With HBO’s decision to enter original
programming, it became known as a network that was willing to take risks and trust
its creative talent. The reward for these risks was quality programs for a discerning
and exclusive audience, over 127 million subscribers globally as of 2014 (Home Box
Office core stats, 2015).
HBO was founded in 1972 as a premium cable channel and began with a
programming library of mainly films and sporting events (Mair, 1988). HBO aired for
nine hours each day during its first nine years of existence and did not expand to a 24-
hour schedule until December 28, 1981 (Mair, 1988). HBO’s first venture into
11 original content was in 1983 with the first ever made-for-pay-TV movie The Terry
Fox Story (Mair, 1988). That year also saw the premiere of the first original children's
program on the channel: Fraggle Rock, an international collaboration of British
regional ITV franchise-holder Television South (TVS), Canadian Broadcasting
Corporation Television, and Henson Associates (later Jim Henson Productions)
(Mair, 1988). The network expanded its original programming offerings in the
following years, experimenting with drama, comedy, anthologies, and game shows.
The new original programming was found especially to be a boon in 1988. That year,
the Writers Guild of America went on strike, leaving the broadcast networks with
only reruns to air while HBO had new programming (Rosenberg, 2013). HBO's
subscriber base expanded greatly as a result.
HBO did not gain a strong reputation for daring original programming
offerings until the early 1990s. During that period, original series such as Tales from
the Crypt, Tracey Takes On..., Mr. Show and Arliss gained critical and popular
attention (Edgerton & Jones, 2009). Debuting in 1992, The Larry Sanders Show
arguably became HBO's flagship series in that decade. Although it was not as popular
as shows on the Big Three networks and Fox, the show did enjoy a cult status, critical
acclaim and received nominations and wins for many major awards (Edgerton &
Jones, 2009). The series ranked #38 on TV Guide's 50 Greatest TV Shows of All Time,
becoming the only HBO comedy to make the list (Cosgrove-Mather, 2002). The
show’s influence can be seen in subsequently aired programs on HBO such as Curb
Your Enthusiasm, Extras, and Entourage.
12 Besides the numerous Emmy Award nominations and wins, the original
programs that HBO has developed since the early 1990s have transformed the
network image from a film distributor to the birthplace of high quality, daring and
innovative television. This is partially possible because of the networks pay model.
Since HBO is a subscription-only service that does not rely on commercial
advertising, the network is relieved from pressures from the FCC and advertisers to
tone down controversial aspects of its programs, leaving it free to experiment with
formats. This allows for explicit content to air, such as graphic violence, sexual
situations and profanity. The network took full advantage of this freedom with the
1997 launch of its first one-hour dramatic narrative series Oz, remarkable for its
strong language, portrayal of drug abuse, and male nudity (DeFino, 2013). Although
Oz was critically acclaimed, it was not until The Sopranos premiered in 1999 that the
premium network hit its stride in achieving both critical mass and Emmy success. The
Sopranos received 111 Emmy nominations during its six-season run, resulting in 21
wins, two of them for Best Drama (IMDB, 2015). In 2002, HBO debuted The Wire,
which although not surpassing The Sopranos in viewership success, did match its
critical acclaim over its five-season run and further cemented HBO's reputation as
being a network that produces quality programming (DeFino, 2013). Today, the
network maintains this reputation with lauded programs like Game of Thrones, True
Detective, and Veep.
Similarly to HBO, Netflix first ventured into original programming with a
multinational coproduction. In 2011, Netflix, along NRK from Norwegian Rubicon
TV AS and German-owned distributor Red Arrow International, commissioned

13 Lilyhammer, a one-hour drama about a New York gangster trying to start a new life in
isolated Lillehammer in Norway (Greene, 2013). The program premiered on
Norwegian NRK1 on January 25, 2012 with a record audience of 998,000 viewers
(one fifth of Norway's population), and premiered on Netflix in North America on
February 6, 2012, with all eight episodes being available in full for streaming on the
service (Greene, 2013). While the effort garnered extensive media attention, the series
received mixed reviews.
On February 1, 2013, Netflix released its first exclusive original series House
of Cards, for which it paid $100 million in a 26-episode, 2 season commitment
(McNeill, 2011). The streaming company out bid several major cable networks for
the airing rights, including HBO and AMC. Later in 2013, Netflix released several
other originals including Orange is the New Black, Hemlock Grove, the return of
Arrested Development, Bad Samaritans, and season 2 of The Problem Solverz (di
Grazia, 2013). While most of the series attained popular success, House of Cards
became the first Internet TV series to win an Emmy Award without ever airing on a
broadcast network or cable channel (Hastings & Wells, 2013). Arrested Development,
Hemlock Grove and House of Cards earned a combined 14 Emmy nominations.
Orange is the New Black missed the Emmy cutoff for that year, but it ended 2013 as
Netflix’s most watched original series ever and reportedly maintains an audience
comparable with successful shows on cable and broadcast TV (Hastings & Wells,
2013).
The series announced in 2013 included Turbo: F.A.S.T., the first original
product of Netflix’s highly publicized deal with DreamWorks Animation; Sense8, an

14 adult sci-fi series created by The Wachowskis (The Matrix) and J. Michael
Straczynski (Babylon 5); Narcos, a drama series that will chronicle the life and death
of Colombian drug lord Pablo Escobar; an Untitled psychological thriller
from Damages creators Todd A. Kessler, Daniel Zelman, and Glenn Kessler; and
Marco Polo, originally developed at Starz before the cable network returned the
series to The Weinstein Co. due to concerns over rising costs (Mentel, 2013b). Netflix
also announced a blockbuster deal unparalleled in scope and size with Walt Disney
Co.’s Marvel Entertainment to bring four original series and a miniseries to the
streaming service (Mentel, 2013a). The four series will focus on marvel superheroes
Daredevil, Jessica Jones, Iron Fist, and Luke Cage while the mini series will be a The
Defenders event (Mentel, 2013a). The series are expected to unfold over multiple
years of original programming.
Shortly before the second season began streaming in February 2014, House of
Cards was renewed for a third season to air in 2015 (O’Connell, 2014). On March 7,
2014 Disney/ABC Television Group, Lucasfilm, and Netflix Inc. announced the
debut of the sixth and final season of the Emmy Award-winning series Star Wars:
The Clone Wars exclusively to Netflix members in the US and Canada. In April 2014,
Netflix signed a multi-year original programming deal with Mitch Hurwitz and The
Hurwitz Company (Andreeva, 2014). 2014 saw the release of four original animation
productions: BoJack Horseman (geared towards adults), Star Wars: The Clone Wars
season 6, VeggieTales in the House, and All Hail King Julien. Additionally, the
company released over 20 original comedy specials and documentaries (Deadline
Team, 2014). Future announced originals include The Magic School Bus 360°, an

15 unnamed Chelsea Handler talk show, the Judd Apatow produced comedy series Love,
Wet Hot American Summer: The Series, a French-language political drama, a
Spanish-language soccer comedy, and a show based off of the popular book
collection A Series of Unfortunate Events (Levin, 2015). At a media conference,
Netflix Chief Content Officer Ted Sardanos announced it is the company’s long-term
goal to premiere original content every two and a half weeks, or about 20 new
programs/seasons per year (Luckerson, 2014).
Traditionally, programing success is measured by viewership as this directly
impacts the rate at which advertising is sold. Though Netflix and HBO do not sell
advertising, it is important to understand the rating system and why the television
industry is desperate for OTT viewership data. While there are many companies with
different methods of measuring audiences, Nielsen Media Research has been the
industry standard since Arthur Nielsen first released TV program ratings in 1950
(Balvanes & Regan, 2011). Nielsen results are reported in two measurements: ratings
and shares. A single national ratings point represents one percent of the total number
of television households in the United States (Eastman & Ferguson, 2013). For
example, if there is an estimated 120 million television households in the market, a
single ratings point for a program in that market would equate to 1.2 million
households watching that same program. A single national share point, on the other
hand, equals one percent of the total number of television households watching
television at that time (Eastman & Ferguson, 2013). So while there may be 120
million television households, perhaps only 80 million are in use at that give time.
The 1.0 rating translates to a 1.5 share. Shares are typically higher than ratings

16 because it is unlikely that all televisions are ever in use at the same time. Nielsen
collects audience data through manual diary keeping (which requires active viewer
participation), Local People Meters (a more passive and automated system), and
Global Television Audience Metering (a technology that measures multiple platforms
like Internet and DVR) (Webster, 2008). Survey participants are randomly selected
through multi-stage area probability sampling to represent a cross-section of the
market demographics (Gunter, 2000). Additionally, because of time-shifted viewing,
ratings are collected over several periods of time: live, live and same day playback
(live +SD), live plus 3 days playback (C3), and live plus 7 days playback (C7)
(Eastman & Ferguson, 2013).
Many question the accuracy of Nielsen ratings. The Council for Research
Excellence (an independent research group which includes some Nielsen executives)
found that only 11.3% of diaries are within the accepted 10% error margin, survey
participation can be very inconsistent, and the company has difficulty in recruiting
young people, minorities, and low-income households (Li, 2014). While people
meters are typically more accurate than diaries, they are only used in major markets
and still have the same demographic participation issues (Eastman & Ferguson,
2013). Nielsen ratings also do not account for any group TV-viewings in settings like
bars, dorm rooms, and airports (Eastman & Ferguson, 2013). There are even more
concerns regarding Nielsen’s ability to accurately track DVR, IPTV, and OTT usage.
NBC's President of Research and Media Development Alan Wurtzel underscored this
issue. "Ratings are a currency, so they're just as important now as they were ten years
ago. It's how we get paid. But in this new media environment, do these numbers

17 reflect accurately how many people are viewing this content? The answer is no,"
(Herrman, 2011). There are other companies with different methods of measuring
audiences (such a Rentrak) that claim to solve some of these issues, but so far no
product offered is competitive enough to unseat Nielsen’s domination.
As mentioned earlier, the entire purpose of audience measurement is to put a
value on commercial airtime during programs. Broadly speaking, the higher a
program’s rating is, the more people there are watching it, and the more money a
station or network can charge to advertise during that program. However, more
recently the quality of viewers is becoming as important as the quantity. In the 1950’s
a hit television program might average around 45 rating points an episode, thus
commanding top dollar for advertisers to reach that 45% of households with
televisions (Eastman & Ferguson, 2013). With the successive splintering of TV
audiences, a 12 rating is a runaway hit in 2015, typically only seen at episode
premieres or finales. However, shows that average a lower rating around 2 are able to
stave off cancelation because the niche demographics of the viewers are valuable to
specific advertisers. By advertising on programs that may have a lower total rating
but a high concentration of its target demographic, a company can spend advertising
dollars more efficiently and effectively (Eastman & Ferguson, 2013). An early
example of seeking particular viewers put to practice in programming can be seen in
the “rural purge” of 1969-1972 (Edgerton, 2007). During this time, many highly rated
rural-themed shows preferred by older viewers like The Beverly Hillbillies and Mister
Ed were widely canceled across all networks in favor of shows that would appeal to
the wealthier young, modern, and urban demographics (Edgerton, 2007). The mass

18 cancelations directly followed the release of research that showed the younger
demographic was more attractive and worth more money to advertisers. While the
replacement programs were not nearly as niche as programs airing after 2005, the
rural purge shows the evolving thinking regarding ratings and in-demand
demographics.
Though Nielsen announced in November 2014 that the company would begin
tracking Netflix and other OTT companies viewership in order to keep the greater
industry informed on media trends, Netflix has no use for Nielsen ratings (Hagey &
Vranica, 2014). Like all other OTT services, being web based allows Netflix to
independently and accurately monitor viewership and usage of its service.
Additionally, because Netflix’s revenue model is subscription-based rather than
advertising-based, there is no need to release audience numbers for individual
programs, series, or movies. There are no advertisers paying Netflix based on the
number or type of viewers it is attracting. In terms of gross income, it simply does not
matter to the company what is being watched because that is not a basis for
generating revenue. The retaining subscribers and the ability to attract new
subscribers is far important to Netflix. But most media analysts and business
managers consider ratings a common currency for evaluating programs, and they
have been relying on them to conduct business since the beginning of television
(Herman, 2011). Without this currency, many are at a loss of how to quantify
Netflix’s success.
Industry insiders disappointed with the lack of ratings may point to premium
cable channels like HBO that are similarly subscription-based yet still release ratings

19 for original programs. However, it must be pointed out that Netflix has a unique
characteristic that makes public ratings undesirable. Even with DVRs and On
Demand viewing, the typical broadcast and cable channel ratings measurement
timeframes (live+ SD, C7, etc.) are applicable to premium cable channels and their
viewers’ habits. They are on a level playing field: though broadcast, cable, and
premium cable channels earn revenue through different means, their viewers behave
essentially in the same TV-set timeframe manner. Additionally HBO, Starz,
Showtime, et al, do get a benefit from sharing high ratings: the announcements act as
a form of advertising and a sign of subscriber satisfaction to potential subscribers and
investors. This benefit cannot apply to Netflix because it has an entirely different
approach to providing content. Having no foundation in linear viewing, there is no
“live” airing of Netflix programs; entire series are released at once to be viewed at
subscribers’ leisure whether that is the same day or a year later. There are no
expiration dates on Netflix’s original content and its acquired content usually has
contracts spanning years at a time. This gives the service’s content a much longer
value timeframe. A subscriber enjoying a program on Netflix at anytime, no matter
how old it is, is returned value on the company’s purchase of that content. So while a
program on a linear television network is mainly amortized over the 7-day ratings
timeframe, Netflix content is amortized over its multi-year contract or, in the case of
original content, indefinitely. It is impossible to fairly compare audience numbers
between a broadcast or cable program and a Netflix program because the two content
forms depend on entirely different time scales.

20 The Netflix business model essentially follows the “Long Tail” theory as
popularized by Chris Anderson. Principally, the theory states that in an era without
the constraints of physical shelf space, narrowly targeted goods and services can be as
economically attractive as mainstream products (Anderson, 2014). Companies no
longer need to focus on a relatively small number of "hits" but instead obtain a huge
number of niches and still be economically successful. TV has traditionally been an
industry that survives off of hits (Wei-Skillern & Marciano, 2008), but the bulk of
Netflix’s content catalog does not fall under that descriptor. As the company’s Chief
Product Officer Neil Hunt said, “There are no bad shows, just shows with small
audiences,” (Roettgers, 2014). That is not to say Netflix ignores hits: big titles
enhances overall product appeal and attract mainstream users.
1.4 Purpose of the Study
Netflix is a trendsetter in the OTT space, and its most recent step into unexplored
territory is original programming. The purpose of this study is to define the value of
Netflix original programming in terms of subscriber value, retention, and opinion,
discern the amount of original programming spending appropriate for the company,
and identify the types of original programming best suited for the company’s goals
and growth. This study specifically focuses on Netflix because its large subscriber
base provides a potentially larger pool for survey than other services, its aggressive
yet varied approach to original programming offers a wide range of content to
explore, and its popularity for being discussed in trade, media, and business
publications. Additionally, Netflix’s open goal to become an OTT network has
caused insiders to wonder whether such a business model is the future of the
21 television industry. This study examines how consumers are reacting to the changing
entertainment ecosystem and if they are willing to adhere to this model.
The study’s data was collected through a survey of Netflix users, including those
who have unsubscribed. Participants were contacted via the snowball method, various
social media sites such as Facebook and LinkedIn, and the discussion board website
Reddit. Specifically on Reddit, the survey link was posted on the subreddits
/r/samplesize, /r/netflix, and /r/NetflixBestOf. Of the 807 people who began the
survey, 535 completed it. The collected information was expected to expose that
while original programming is helpful in subscriber growth and retention, there is a
limit to original programming’s benefits; the balance between original content and
licensed content should weigh heavily in licensed content’s favor. It was also this
study’s goal to prove that certain genres of content, namely children’s programming,
dramatic series, and foreign language productions, are more efficient original
programming investments for Netflix than others.
1.5 Research Questions
• R1: Who are Netflix’s streaming consumers?
• R2: How do consumers access Netflix and what inspires them to join or leave
Netflix?
• R3: How often consumers use Netflix streaming and what do they watch?
• R4: What features and activities do Netflix streaming users value most?
• R5: What do Netflix streamers think about Netflix original programs?
• R6: How do Netflix users feel about Netflix’s original programming in
comparison to other content providers’ original programming?

22 • R7: Do consumer viewing habits warrant a reallocation of Netflix’s content
budget towards spending more on original programming?
• R8: If it is a good investment, what genres and forms of original programming
should the company pursue for the most efficient use of capital?
1.6 Significance to the Field
As previously stated, OTT services are a rapidly expanding segment of the
television industry and a major revenue stream. However, all of these services release
very little if any usage data to the public. Most inferences that appear in trade
publications regarding reasoning behind the wave of original programming in OTT
are based on speculation and conjecture. There have been a few Netflix studies
conducted by major marketing and research companies that are available for fees
upwards of several thousands of dollars, but none are a deep-dive into consumers’
relationships with original programming specifically. Better understanding consumer
response to original programming offerings at Netflix will help identify areas for
improvement and potential for growth across the field. By collecting and interpreting
new consumer research in this area, this study will provide more concrete insight into
the decision-making process of original OTT programming and suggestions for future
strategy in this growing industry. This report illuminates an under-served area of
study.
1.7 Definitions
The term original programming is used to describe any content available on
Netflix streaming that is at least partially produced for or funded by Netflix, and it
must have a national premiere on the company’s streaming service in at least one of

23 its operating regions. This includes series that initially air on broadcast or cable
television but are subsequently renewed by Netflix, but only the additional seasons of
content created exclusively for the streaming service. For example, the previously
mentioned program Lilyhammer qualifies for this description because the program
was co-produced by Netflix and premiered in the United States exclusively on
streaming even though it first premiered in Norway on traditional broadcast channel
NRK1 (Green, 2013). The revived series Arrested Development and The Killing
qualify because the fourth seasons of both shows were commissioned by Netflix and
are exclusive to its streaming. The program Peaky Blinders conversely does not meet
the criteria of this definition because although it exclusively airs on Netflix in the
United States, it was commissioned for BBC Two. Many series and programs
displayed with “Netflix” banner in the Netflix catalog fit into this latter category and
are instead referred to as Netflix exclusives within the study. Additionally, language-
localized programs that Netflix has exclusive streaming rights over, such as the
Japanese anime series Knights of Sadonia, are not considered original series. Netflix
has no direct influence over these productions as the company merely presents re-
recorded audio with regional translations. (See Appendix A for a list of all Netflix
originals according to this definition as of March 2015.)
Subscriber is used to describe any person who uses the Netflix streaming
service whether as the payer of the subscription or as a profile on someone else’s
subscription account. Currently Netflix has three different subscription plans allowing
for viewing on one, two, or four screens simultaneously, thus allowing for multiple
people to use the same subscription at the same time. Netflix also allows the creation

24 of up to five viewer profiles per subscription account. Each profile allows
individualized personalized content suggestions, “Recently Watched” list, ratings and
reviews, taste preferences, and streaming queue. While not necessarily being a paying
consumer, these users are included in this study because they still may influence the
account payer’s reason for subscribing and perceived value of the service.
Churn, or churn rate, is the term used for the measure of subscriptions
canceled in a given period of time. This is particularly important for any business
with a subscriber-based service model as it is a possible indicator of customer
dissatisfaction, cheaper and/or better offers from the competition, more successful
sales and/or marketing by the competition, or reasons having to do with customer life
cycle. Knowing churn rates can illuminate whether a company is relying on new
customers to maintain subscriber numbers or is able to retain existing customers.
Netflix formerly reported churn rates in filings and investor reports but halted the
practice in 2011 despite the SEC’s and analysts’ recommendations against this.
Netflix reasons that churn is not an important metric because the ability to easily
cancel an account is part of its consumer-friendly ethos, does not reflect consumer
acceptance, and many customers rejoin the service within the same year (Savitz,
2011). Nonetheless, analysts maintain that subscriber churn is useful data, and
investors can interpret the hiding of such information as a red flag (Savitz, 2011).
Additionally, Variety reported in 2013 that a RBC Capital Markets survey found
original programming to be an important factor influencing subscribers’ decision to
keep the service and establishes expectations about future potential offerings
(Spangler, 2013).
25 1.8 Limitations
All survey participants were volunteers and not monetarily compensated for
their time. Though the survey was open to all Netflix subscribers across the globe, the
survey was only distributed in English and therefore restricted to those who
understood English. Additionally, as the survey was distributed via the Internet, only
people with web access were able to participate. As the survey was done without the
participation of Netflix, there is no way to determine if the respondent demographic
percentages reflect Netflix streaming subscriber demographics. The survey’s validity
is entirely dependent on the accurate and honest answers of survey responders.
1.9 Ethical Considerations
This study did not include a minimum participant age. While some of the
Netflix programs included in this survey are not appropriate for all ages, they are
mentioned in name only. The survey did not include any program content or direct
references to explicit content. The youngest participants were 14 years old. All survey
participation was anonymous.

26
Chapter 2 : Literature Search
2.1 Introduction
It is clear that Netflix internally has massive amounts of data regarding user
content preferences and habits. As Todd Yellin, VP of Product Innovation at Netflix,
said, “We own the Netflix customer experience from the moment they sign up, for the
whole time they are with us, across TV, phone and laptop. We climb under the hood
and get all greasy with algorithms, numbers and vast amounts of data. Getting to
know a user, millions of them, and what they play. If they play one title, what did
they play after, before, what did they abandon after five minutes?" (Sweney, 2014).
Cindy Holland, Head of Original Content, echoed the sentiment saying, "We can
identify subscriber populations that gravitate around genre areas, such as horror,
thriller and supernatural. That allows us to project a threshold audience size to see if it
makes for a viable project for us," (Sweney, 2014). Netflix has revealed that this
exact user data was what led to green-lighting House of Cards. While this show has
been a major success for Netflix, Holland admits the similarly successful original
series Orange is the New Black had no such specific data to indicate it would work
(Sweney, 2014). So while Netflix holds its proprietary data close to the chest, the
Netflix user data has limits use in original programming decisions. There are many
other data sources that may provide better insights depending on the particular
consumer segment sought. This is especially true regarding original programming
strategy in terms of subscriber acquisition. Therefore, it is important to look at the
online video market as a whole in terms of user identity, trends, and voids. However,
27 as shown by the research that follows, the publicly available data lacks completeness,
thoroughness, and consistency.
2.2 Who online video users are
According to the Mintel November 2012 Online and Streaming Video report,
Netflix reached 32% of Internet users aged 18 and up and 47% of Internet users 18-24
that year (Hulkower, 2012). Followed up by a Mintel December 2013 Streaming
Media: Movies and Television report, the survey found that streaming subscription
usage has reached 46% of Internet users 18 and up (Hulkower, 2013). The 2012
report found 32% of Internet users aged 18 and up use the Internet to watch full-
length TV shows or movies monthly. The amount of time watching online video
decreases with age—18-24 year olds spend the most time watching, viewing 3.7
hours of content per week on average, compared to 1.6 hours per week among seniors
(Hulkower, 2012). The 2013 report supports this trend, claiming that age is the central
driver for usage: 75% of 18-34s in the 2013 online survey watched a professionally
produced movie or television show online in a given month, and usage drops
dramatically in each subsequent age bracket (Hulkower, 2013). According to these
surveys, similar trends are seen in the amount of content viewed by age group – even
where older age groups do watch streaming movies, they consume far less of it than
those aged 18-34 (Hulkower, 2013). These findings concur with the Pew Research
Center Online Video 2013 report. This Pew study found that 76% of online adults 18-
29 watch videos online as compared to 64% for 30-49 year olds and 34% for online
adults 50 years and up (Purcell, 2013). Despite these two research groups agreeing
that online video users skew younger, the 2014 Nielsen Cross-Platform Report claims

28 that 40% of online video users are aged 35-54 as opposed to only 12% being aged 18-
24 and a much larger 30% being aged 55 and up (Nielsen, 2014). These disparities
may be the result of differences in survey technique and specific wording of
questions, but nonetheless provide an unclear image of the online video consumer
market.
Both Mintel reports delve deeper into what demographics show higher levels
of penetration and consumption. The 2013 survey found that households with
children under 18 are 1.5 times more likely to use a digital video service in a given
month (60% vs. 40%) (Hulkower, 2013). It also found that Internet users in these
same households are more likely to be heavy streaming video users (6 or more hours)
(Hulkower, 2013). The Mintel study credits Netflix’s “family plan” option
(previously discussed in background) that allows up to four simultaneous streams for
$11.99/month as taking advantage of this information. In the case of users with
children, multiple profiles prevents child viewing from skewing the adult’s viewing
suggestions, ensuring the company’s suggestion algorithm achieves maximum value
and effect. The Netflix Profiles feature also allows parents to set parental controls on
individual profiles or set a profile to be “kid friendly,” which permits access only to
content appropriate for children aged 12 and younger.
The 2013 Mintel survey also found men to be more likely to use streaming
video in a given month than women (53% vs. 40%) (Hulkower, 2013). Compounding
this, 27% of men are daily streaming video users as opposed to 19% of women
(Hulkower, 2013). However, this conflicts with the 2014 Nielsen Cross-Platform
Report, which states that 53% of online video users are actually women (Nielsen,

29 2014). The 2012 Mintel survey suggested that because Asians show substantially
elevated levels of ownership of hardware that facilitates usage of online video and
show a unique engagement with online video on par with 18-24 year olds in general,
video service providers should pay special attention to the group’s needs and
preferences (Hulkower, 2012). And while not on par with Asians, English-language
Hispanics utilize online video at levels far greater than those seen for non-Hispanic
whites and non-Hispanic blacks, also permitting them special attention (Hulkower,
2012). Nielsen initially does not support this information, reporting that18-24 year
olds on average watch 1 hour and 32 minutes of online video weekly, while Asians
watch 1 hour and Hispanics watch 48 minutes (Nielsen, 2014). It is important to note,
however, that the Nielsen survey definition of “online video” may be more limited in
scope than the other companies’. Nielsen lists “Watching Video on a Smartphone,”
“Using any App/Web on a Smartphone,” “Using a Multimedia Device,” and
“Watching Timeshifted TV” as other survey options, all of which could potentially
fall under the general activity of watching online video. The overlapping categories
may have confused survey respondents, resulting in diverging information. Later, the
Nielsen survey does support heavier streaming video usage among Asians and
Hispanics. It reports that the top quintile of Asians streaming averages 35.4 minutes
daily and the top quintile of Hispanics streaming average 24.5 minutes a day, while
the top composite quintile of streaming averages 22 minutes a day (Nielsen, 2014).
This section of the Nielsen report also provides data that African Americans are
heavier streaming video users, with the top quintile streaming and average of 27
minutes daily (Nielsen, 2014).

30 The three research groups diverge in regards to the distribution of income
levels among online video viewers. The 2012 Mintel study did not ask survey
participants any information about income, but the 2013 study did and reported, “No
significant trends are seen by household income, suggesting that it is not a useful
segmentation for understanding the [online video] market,” (Hulkower, 2013). The
Pew survey, on the other hand, says that online adults in high-income households
(above $75,000) are more likely than those in middle or low-income households to
watch online videos (Purcell, 2013). Specifically, the study states that 86% of adults
in high-income household watch online video as opposed to 72% of online adults in
low-income households ($30,000 or less) (Purcell, 2013). The Nielson report once
again disputes the other surveys’ information, reporting that users residing in
households making $75,000 consist of only 38% of online video users (Nielsen,
2014).
The 2013 Mintel study did however make conclusions regarding household
income and specifically subscription streaming services. It found Netflix maintains a
dramatic lead among any other subscription services across all household income
groups, with three times as many respondents using it, as compared to the penetration
for any other service. Amazon’s service performs best among the highest-income
groups, with this group likely seeing an Amazon Prime account as a valued product
as related to its shipping prices for tangible purchases on the website and other
service inclusions (Hulkower, 2013). Of note as well is that the survey found
subscription streaming services in general perform best in the middle-income group
of $75K-99K (Hulkower, 2013). This is most likely because this group has the
31 discretionary income to afford multiple subscriptions, while also lacking the ability to
buy all the programming they would like to see a la carte (Hulkower, 2013).
Interestingly, the 2013 Mintel report found that across every type of
subscription surveyed, those who subscribed to one service were substantially more
likely to subscribe to every other listed type of subscription (Hulkower, 2013). This is
especially true with Netflix; out of Netflix users polled: 59% use HBO Go, 74% use
Hulu Plus, and 65% use Amazon Prime (Hulkower, 2013). The data suggest that the
most valuable marketing tool a brand could have are leads from other subscriptions
and that marketing on a streaming site, whenever possible, will be a high value
purchase. Despite a market sentiment of competition, subscription brands may do
well to create partnerships, potentially providing a discount to new subscribers who
sign on to multiple services all at once (Hulkower, 2013). The Nielsen April 2013
Advertising Audiences State of the Media report found that while Hulu (including
both the free Hulu service and Hulu Plus) had 14.3 million unique viewers per month
compared to Netflix’s 10.8 million, users spent almost twice as much time on Netflix,
averaging 7.4 billion monthly minutes versus Hulu users’ 4.2 billion monthly minutes
(Nielsen, 2013). While users may go to both services for long form content, Netflix
keeps users’ attention for longer on average.
2.3 What online video users watch
The Pew study delves into discovering popular video genres among online
video users, finding that comedy and education videos are the most widely viewed,
with 57% of all online adults saying the watch comedy/humorous videos and 50% of
online adults saying the watch educational videos (Purcell, 2013). Music videos

32 showed the largest growth in viewership between 2009 and 2013 from 32% to 50% of
all online adults now watching this type of video (Purcell, 2013). Measuring how-to
videos for the first time, the 2013 survey found that 56% of online adults are
watching how-to videos (Purcell, 2013). This report also found that among adults
who watch videos online, different genres appeal to different demographic groups.
For instance, online video watchers age 18-29 are more likely than those age 50 and
older to watch music videos (81% v. 39%), comedy videos (82% v. 61%), and
animation videos (47% v. 20%) (Purcell, 2013). More male than female online video
watchers view sports videos (49% v. 23%), political videos (40% v. 30%), and adult
videos (25% v. 8%) online (Purcell, 2013). However, the 2012 Mintel noted that the
younger the internet user, the more likely he or she is to watch every category of
online video, including how-to videos, news, home videos (Hulkower, 2012).
It is very difficult to find any research in regard to what specifically Netflix
users are watching as the company releases no data on this subject. What little
information there is on Netflix user viewing preferences has been garnered from
independent surveys and analysis of ISP data; however, much of the information
tends to be projected due to incomplete or unavailable research. In 2012, Nielsen
research found that 47% of Netflix users watch moves most often, while 19% favor
TV shows and 35% watch the two formats equally (Nielsen, 2012). The survey shows
that both media formats are heavily used on the service, but there is a marked
preference for movies. Nevertheless, Nielsen compared the 2012 survey to a 2011
survey concerning the same questions and found that the preference for movies has
declined by 6% and the preference for TV shows has risen by 8% (Nielsen, 2012).

33 While the rise in preference to TV shows coincides with Netflix’s release of original
programming (at the time of the survey, Lilyhammer was available for streaming and
several other original shows had been announced), there is no indication whether this
is the cause of or effect of original programming. Just as changing subscriber tastes
could have informed Netflix’s decision to pursue original programming, the
documented rise in preference for TV shows on Netflix could have equally signaled
acceptance and encouragement for the new original shows. Nonetheless, these figures
still show a stark contrast to Hulu users, of whom 73% were found to favor TV shows
in 2011 (Nielsen, 2011). Although there appears to be a rising trend for preference of
TV Shows among Netflix users, the percentage is far behind Hulu.
Nielsen’s 2012 Cross-Platform Report provides a little more insights as to
what streaming subscribers are watching (or not watching). It indicates that 60% of
Spanish speaking U.S. Hispanic consumers feel there is a lack of Spanish-language
content on subscription services like Netflix, and the same group’s most valued
content include music videos and TV shows (Nielsen, 2012b). Considering previously
cited data marking Hispanics as an important demographic in online video usage, this
is a huge gap.
While it is unclear what Netflix users are watching, it is known that they are
watching a lot of it in one sitting, “binging.” Conducted online by Harris Interactive
on behalf of Netflix among nearly 1,500 TV streamers (online U.S. adults who stream
TV shows at least once a week), the survey found that 73% of those polled define
binge watching as watching 2-6 episodes of the same TV show in one sitting and 61%
of the respondents do it regularly (PR Newswire, 2013). The survey also found that

34 binge watching isn’t necessarily a solo experience. Among those who stream multiple
episodes of a TV series in a row, more than one-third (38%) most like to do so solo;
however, a combined 51% prefer to watch with at least one other person (PR
Newswire, 2013). A cultural anthropologist who worked with Netflix on the study,
Grant McCracken believes the practice of binge watching is due to “the perfect storm
of better TV, our current economic climate and the digital explosion of the last few
years,” (PR Newswire, 2013).
According to a 2014 survey conducted by TiVo, the most binge-watched
shows on any platform are Breaking Bad (35%), House of Cards (29%), and Game of
Thrones (25%) (Bradley, 2014). Breaking Bad, while originally airing on AMC
network, is available on Netflix. In fact, the service is often credited with buoying the
show’s later season ratings thanks to viewers’ catch-up watching on Netflix. House of
Cards, as previously mentioned is a Netflix original, and Game of Thrones is on
HBO, Netflix’s prime network competitor. Other notably binged shows included
Walking Dead, Downton Abbey, various Star Trek versions, Homeland, Mad Men,
Doctor Who and NCIS, of which many are currently or previously available on
Netflix (Bradley, 2014). A number of study participants said they binge-watched to
keep up with a show, to be able to participate in conversations in their social circle,
because their scheduled only permitted watching at certain times, and also because
watching so many episodes at once makes complicated plotlines easier to follow
(Bradley, 2014). So while there is little data as to what exactly Netflix viewers are
binge-watching, it can be conjectured that there is some crossover of content with the
TiVo study.

35 Based on another 2014 TiVo survey, analysts determined heavy (6 or more
hours of viewing per month) Netflix users’ favorite pay TV networks and shows. The
most favored networks were, in order: AMC, Comedy Central, Nick, Fox, Lifetime,
CNN, PBS, BBC America, HGTV, and Food. The most favored programs were, in
order: On the Case with Paula Zahn (Investigation Discovery), Washington Week
with Gwen Ifill (PBS), Great Performances (PBS), Futurama (Comedy Central),
Independent Lens (PBS), Project Runway (Lifetime), The Mindy Project (FOX),
Parks and Recreation (NBC), The Thundermans (Nick), and The Haunted Hathaways
(Nick) (Harvey & Petrilli, 2014). While this survey is measuring exclusively what
Netflix viewers are watching on traditional television, the top indexing series are a
very telling indication of what type of original or licensed programming might work
for the streaming service. The survey also puts the same questions to Hulu and
Amazon users and finds diverse viewing preferences between the three services. Only
two networks fall on three lists, Lifetime and FOX. Only Washington Week with
Gwen Ifill is in the top 10 series for all three services, and only Independent Lens is
on both Amazon’s and Netflix’s list. The rest of the given preferences are not
repeated between services (Harvey & Petrilli, 2014). The cross-comparison of
subscriber preferences not only indicates how to best oblige a given service’s
audience, but also how a service might expand its audience to the competitions’
consumers.
According to statements by Amazon, children do a large amount of binge-
watching and repeat watching on its service. In 2013 the company announced that
65% of the most-replayed programs on its streaming service are shows for children

36 (Stetler, 2013). Nearly half of all video views are second-, third- or fourth-time views
for the Amazon Kindle’s subscription service FreeTime Unlimited, geared towards
children ages 3 to 8 (Stetler, 2013). Other major media companies have also
experienced this trend. Albert Cheng, the Disney-ABC Television Group’s digital
media chief, noted that while the Watch Disney Junior app has been downloaded five
million times, it has had 650 million video views from June 2012 through October
2013 (Barnes, 2013). According to GFK media analyst David Tice, popular children’s
programs can be a driver for use and subscriber loyalty (Stetler, 2013). GFK market
research has shown that families with children are more likely to subscribe to Netflix
and Amazon Prime than those without (Stetler, 2013). Netflix is reportedly taking
such observations into account during licensing deals, realizing that it does not need
to license every episode of a hit children’s show as long as it has enough episodes to
satisfy its youngest viewers. In a deal with PBS, for example, Netflix licensed 20
episodes of Arthur produced from 2009 through 2011 out of a total of 195 episodes
(Stetler, 2013).
2.4 How users find content
The Mintel 2013 study does extensive research into how online video users
are finding content. It said about a third of respondents browsed for movies when
they are looking for something to watch, while about a third only go online to find
content when they have a specific title in mind (Hulkower, 2013). This means that
recommendation systems are a powerful way to the show the value of a content
library for one third of online video consumers. This also means that the number of
potential titles that consumers might want to watch is likely more important than the

37 total size of the library. The report surmises that heavy users (6 or more hours
viewing weekly), who average nearly a movie or a TV show on a daily basis, are
more likely to be browsers and are also more likely to agree that recommendation
services work for them (Hulkower, 2013). This indicates that an effective content
recommendation is crucial to maintaining user satisfaction and retaining heavy users.
Netflix itself refers to its recommendation system as one of its most valued assets,
estimating that 75% of viewer activity is related to its recommendation system
(Hulkower, 2013). However, it is also possible that heavy users are interested in a
wider variety of titles, enabling them to successfully find programming they want to
watch. Nonetheless, the Mintel 2013 study suggests that, considering the uniqueness
of Netflix’s success in the market, competitors can hardly afford not to mimic the
services that may have made it popular. Not building an internal cutting-edge
proprietary recommendation system may simply be too large of a risk in a service
arena where multiple of the world’s largest technology firms are adding offerings
(Hulkower, 2013).
Mintel also found that heavy, medium (3-5 hours viewing weekly), and light
users (1-2 hours viewing weekly) are more likely to be in a discourse with friends and
family regarding desirable titles than solely traditional TV viewers (Hulkower, 2013).
The Mintel 2012 survey findings also support this, saying younger online viewers 18-
44 are much more likely to tout the videos they enjoy to friends and family, but heavy
viewers (5 or more hours viewing weekly) regardless of age are also central to
creating marketing buzz around content (Hulkower, 2012). 44% of the heaviest users
tell friends in person or over the phone about videos they have watched (Hulkower,

38 2012). Additionally, the 2013 survey contends that content discovery app usage and
social television usage rises even higher among heavy users of streaming video: one
in four heavy streamers use a mobile app for content discovery, and one in five post
the shows they are watching to a social medium (Hulkower, 2013). This suggests
content providers and streaming video distributors can effectively reach their most
important audience through ads on social networks and relevant apps.
Despite these various ways to discover programming, content discovery
remains an issue with ever increasing library sizes. Younger viewers and light to
medium viewers reportedly have the most trouble finding content to watch. About
one in five streamers aged 18-34 and 38% of light and medium viewers have trouble
finding content they want to watch (Hulkower, 2013). This appears to be a substantial
opportunity for vendors to base marketing on the size of their library to attract.
However, the Mintel 2013 report notes that as the market matures, it may increasingly
encompass later adopters who have more narrow tastes in programming, favoring
providers not with the largest absolute library size, but rather with the largest number
of premium titles relevant to the user considering subscribing (Hulkower, 2013).
2.5 Netflix Content Spending
According to the company, improvement in Netflix's online content has been
the cornerstone of its subscriber growth since 2013. However, increasing content
costs put pressure on Netflix's margins. As Hastings and Wells said in the Q4 2014
review letter to investors, “We will continue to grow the percentage of our content
spending dedicated to originals for the next several years. This will mean more cash
usage, which means more debt,” (Hastings & Wells, 2015). But in the same letter,
39 they also state that the 2014 original content was some of the company’s most
efficient content (Hastings & Wells, 2015). According to the company’s Investor
Relations website, Netflix measures efficiency by comparing cost per hour viewed
against other similar content, looking for high engagement (Top investor questions,
2015). However, it is unclear what “some” of the most efficient content actually
means. This could refer to a few select episodes, a few series and programs, or just
one very popular series. It is important to know how efficient original content is
because it is replacing rather than being added to licensed content spending (Top
investor questions, 2015). If originals, or certain types of originals, are found to be
inefficient, they investment in them should be halted and replaced by other licensed
material. All forms of content spending are under particular scrutiny for Netflix as it
is a continually rising expenditure with which investors are vocally concerned. A
financial reporter for the Wall Street Journal called the quickly rising expense
Netflix’s “albatross” (Jakab, 2014), and analysts continually downgrade the
company’s stock valuation due to content costs minimizing contribution margins
(Treafis Team, 2013) (Levine-Weinberg, 2014) (Zacks Equity Research, 2015).
According to Netflix’s third quarter 2014 results, streaming content obligations
increased more than $1.6 billion in the first nine months of 2014, from about $7.2
billion at the end of 2013 to more than $8.8 billion as of September 30, 2014
(Hastings & Wells, 2015). Content expenses are the largest cost component for
Netflix and account for over 70% of the total expenses (Hastings & Wells, 2015). The
effect of increasing content costs is especially seen in the international segment,
which has not been profitable on a contribution basis as of year-end 2014 (Hastings &
40 Wells, 2015). Some of the rising costs are due to the company’s move away from
non-exclusive bulk content towards exclusive and curated content in an effort to
create a differentiated service (Top investor questions, 2015). However, it is unclear
if this strategy is successful.
The following Netflix original programming costs are estimations, but they
are numbers released by lawyers, agents, and actors involved in the productions.
Though House of Cards supposedly initially cost Netflix $100 million for the first
two seasons (or about $3.8 million per episode) (McNeill, 2011), executive producer
David Fincher has reportedly raised costs to well over $4.5 million per episode
(Wallenstein, 2013). Orange is the New Black and Hemlock Grove are said to have
both cost just under $4 million per episode (Wallenstein, 2013). As Reed Hastings
announced Orange was the most watched Netflix original in 2013 (Hastings & Wells,
2013), it is likely to be one of the more efficient original programs. These examples
are above average according to the 2011 estimate of 1-hour network dramas costing
$3 million per episode (Carter, 2010), but inflation accounts for some of the
difference in cost. Many Netflix originals, like its stand-up specials and several of its
documentaries, are designed to have niche audience appeal and have a lower cost to
validate this spending (McDuling, 2015). But Netflix took on a huge expense with
Marco Polo, released December 12, 2014 and costing $9 million per episode (Ayers,
2014). It is one of the most expensive TV programs ever, let alone at Netflix (Ayers,
2014). Such a huge cost demands a mainstream, large audience, but there is doubt
about the show delivering.

41 Marco Polo was expected to be Netflix's answer to HBO's fantasy series
Game of Thrones, but critical response has been unenthusiastic at best, one reviewer
calling it “the most gorgeous thing you’ll ever fall asleep to,” (Venable, 2014). While
poor reviews do not necessarily mean a small audience, as previously mentioned
Nielsen reported a small U.S. Twitter response on the premiere date (Ramachandran,
2014). The show might be building an audience over time through word of mouth and
the internal recommendation system, and international audiences might take to it
more strongly. The company seems to be betting on this as Chief Content Officer Ted
Sardanos announced at the Television Critics Association's winter press tour the
commission of season 2 (Goldberg, 2015). However, Netflix has a tendency of
ordering second seasons for its shows regardless of the response they generate
(Treafis Team, 2014). The company can allow a show more time to grow an audience
due to the company’s advantageously small opportunity cost. If a customer does not
like a TV show on Netflix, he or she can always move on to another program. A pay-
TV channel by contrast dedicates a particular time slot to a TV show and faces a
much bigger opportunity cost. Compare this to HBO, which cancelled six shows in
their first season from 2012-2014 for disappointing viewership (Treafis Team, 2014).
The lack of a programmatic schedule allows Netflix to take more chances with its
content and give its content more time to grow an audience. There is minimal
additional opportunity cost for keeping a middling or unpopular original show in its
catalog. However, However, Netflix has stated that it no longer amortizes original
programming on a straight-line basis and has accelerated the amortization schedule
based on the company’s experience with TV series from other networks (Top investor
42 questions, 2015). This puts the two forms of content on more level evaluation terms.
Nonetheless, it is impossible to be sure about the rationalization behind Marco Polo
and its big budget without any subscriber insight.
Not all of Netflix’s original programming deals are estimated to be as costly.
The company’s five-season deal with Marvel Television to produce four live action
superhero series and a mini-series is expected to cost Disney around $200 million to
produce (Spangler, 2014). While that number is not an estimate of what Netflix
actually paid for the partnership, it is unlikely to come anywhere near Marco Polo’s
$90 million bottom line. Securing rights for the second-run of hit broadcast shows
appears to fall in between these two price points. According to Deadline, Netflix
signed a deal with Warner Bros. Worldwide Television Distribution to broadcast the
show Gotham for a reported $1.75 million per episode (Andreeva, 2014b). Other top
shows are reportedly being priced in the same range, such as NBC’s The Blacklist at
$2 million per episode and AMC's The Walking Dead at $1.35 million per episode
(Kissell, 2014). The license period of these specific agreements are unknown, but the
length of the license period effects cost efficiency and amortization.

43
Chapter 3 : Data Presentation
3.1 Introduction This chapter presents the data collected from the respondents. The complete
survey is attached at Appendix B. The survey completion rate was 66% (535/807).
3.2 Respondent demographics
3.2.1 Ethnicity and gender
Figure 1
0
100
200
300 205
13 11 11 1 1 6
248 260
4 10 6 0 0 7
287
Female Male

44 3.2.2 Location and gender
Figure 2
3.2.3 Respondent ages
Figure 3
0
50
100
150
200
250 215
8 0 0 0 0 0 1 0 15
2 1 1 2 0 2
225
17 4 2 3 1 1 2 1
17 1 0 5 3 2 3
Female Male
11%
42% 35%
5% 7%
under 18
18-25
26-35
36-45
46+

45 The 77% of respondents were 18-35 years old. The youngest respondent was
14 and the oldest respondent was 76. The average respondent age was 27.3 years old
and the most common respondent age was 23.
3.2.4 Respondents with children under 16 in their household
Figure 4
The 75% of respondents did not have children under the age of 16 in their
household, and only 9.5% respondents had multiple children in their household.
75%
16% 8%
1% 0%
None
1
2
3
4 or more

46 3.2.5 Respondent household income in US dollars
Figure 5
Only respondents who indicated their current location as the United States
(440) were asked their annual household income in US dollars. Respondents were
also given the option to opt out the question. This graph displays the income
breakdown out of the respondents who chose to not opt out (344).
6%
4%
7%
9%
11%
20% 12%
15%
16%
Under $10,000
$10,000 - $19,999
$20,000 - $29,999
$30,000 - $39,999
$40,000 - $49,999
$50,000 - $74,999
$75,000 - $99,999
$100,000 - $150,000
Over $150,000

47 3.2.6 How respondents paid for Netflix access
Figure 6
A majority of respondents paid for Netflix streaming themselves, followed by
32% sharing a subscription with a relative who was the main account holder.
Respondents were able to make multiple choices to reflect if they changed their
access method over time or if they had access to multiple accounts.
0.00%
10.00%
20.00%
30.00%
40.00%
50.00%
60.00%
Self Significant Other
Friend Relative Other
54.39%
8.22% 5.23%
32.15%
3.36%
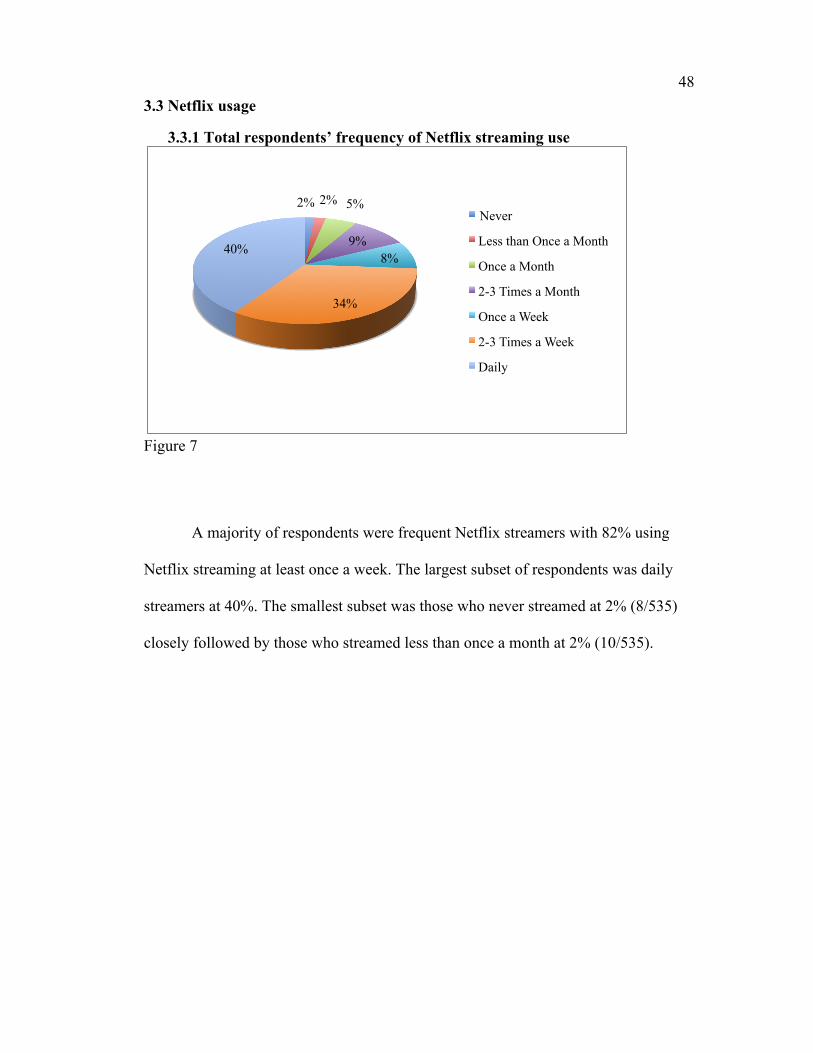
48 3.3 Netflix usage
3.3.1 Total respondents’ frequency of Netflix streaming use
Figure 7
A majority of respondents were frequent Netflix streamers with 82% using
Netflix streaming at least once a week. The largest subset of respondents was daily
streamers at 40%. The smallest subset was those who never streamed at 2% (8/535)
closely followed by those who streamed less than once a month at 2% (10/535).
2% 2% 5%
9% 8%
34%
40%
Never
Less than Once a Month
Once a Month
2-3 Times a Month
Once a Week
2-3 Times a Week
Daily
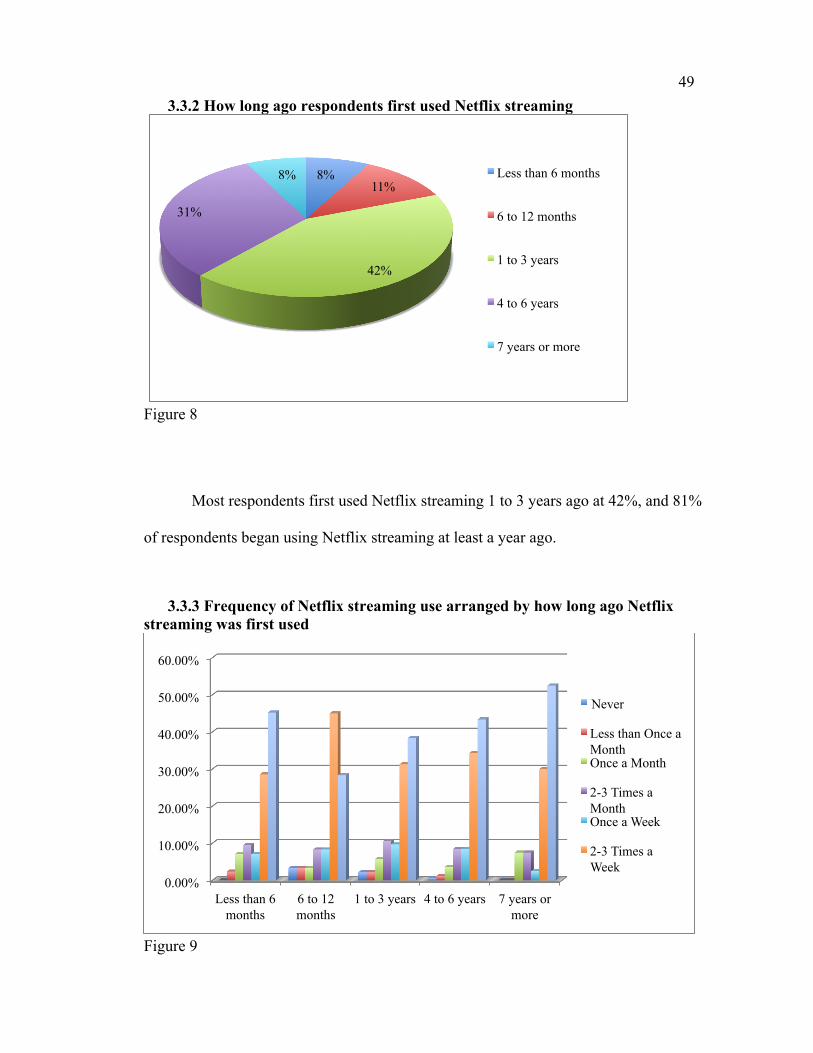
49 3.3.2 How long ago respondents first used Netflix streaming
Figure 8
Most respondents first used Netflix streaming 1 to 3 years ago at 42%, and 81%
of respondents began using Netflix streaming at least a year ago.
3.3.3 Frequency of Netflix streaming use arranged by how long ago Netflix streaming was first used
Figure 9
8% 11%
42%
31%
8% Less than 6 months
6 to 12 months
1 to 3 years
4 to 6 years
7 years or more
0.00%
10.00%
20.00%
30.00%
40.00%
50.00%
60.00%
Less than 6 months
6 to 12 months
1 to 3 years 4 to 6 years 7 years or more
Never
Less than Once a Month Once a Month
2-3 Times a Month Once a Week
2-3 Times a Week
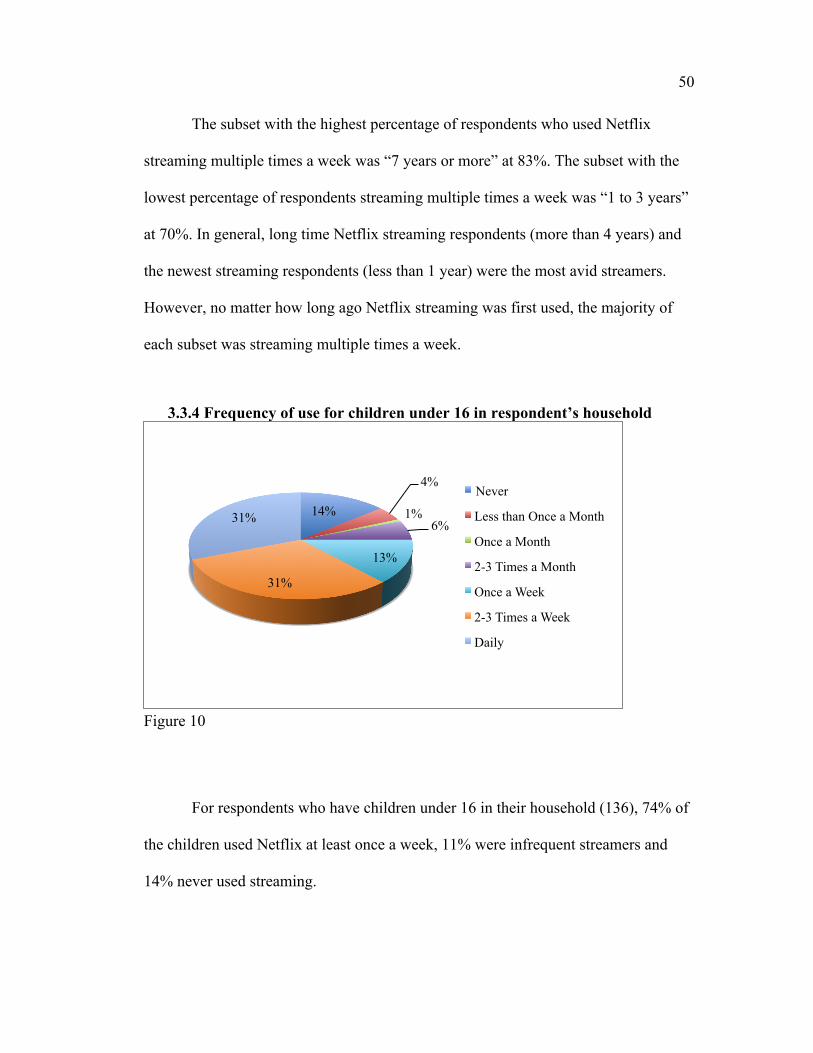
50
The subset with the highest percentage of respondents who used Netflix
streaming multiple times a week was “7 years or more” at 83%. The subset with the
lowest percentage of respondents streaming multiple times a week was “1 to 3 years”
at 70%. In general, long time Netflix streaming respondents (more than 4 years) and
the newest streaming respondents (less than 1 year) were the most avid streamers.
However, no matter how long ago Netflix streaming was first used, the majority of
each subset was streaming multiple times a week.
3.3.4 Frequency of use for children under 16 in respondent’s household
Figure 10
For respondents who have children under 16 in their household (136), 74% of
the children used Netflix at least once a week, 11% were infrequent streamers and
14% never used streaming.
14%
4%
1% 6%
13%
31%
31%
Never
Less than Once a Month
Once a Month
2-3 Times a Month
Once a Week
2-3 Times a Week
Daily

51 3.3.5 Why respondents first began using Netflix
Figure 11
Out of all respondents, the 52% of users began using Netflix for its catalog
size. Only 11% (61/535) began using Netflix because of a specific program. Of the
11%, 46% (28/61) of the stated programs were Netflix original programs: House of
Cards (13), Orange is the New Black (11), Arrested Development (3), and Aziz
Ansari: Buried Alive (1). The remaining 54% (33/61) consisted of programs that were
non-exclusive licensed content. Netflix originals were responsible for initiating
streaming use for 5% (28/535) of all respondents.
11%
23%
52%
14%
There was a specific exclusive program I wanted to watch
Someone recommended I try it
I wanted access to its large content catalog
Other

52 3.3.6 Why people began using Netflix arranged by frequency of use
Figure 12
Wanting access to its large catalog was the number one reason for beginning
to use Netflix across all except for “once a month,” where it was third to
recommendation and a specific exclusive title. The “2-3 times a week” category had
the highest percentage of respondents choosing the large catalog at 58%. The “once a
month” category had the highest percentage of respondents indicating that a specific
program inspired his or her Netflix usage at 30% while the “daily” category had the
lowest at 8%. The “once a month” category had the highest percentage of respondents
choosing recommendation at 41% and “2-3 times a week” had the least at 19%.
0.00%
10.00%
20.00%
30.00%
40.00%
50.00%
60.00%
Less than Once a Month
Once a Month
2-3 Times a Month
Once a Week
2-3 Times a Week
Daily
There was a specific exclusive program I wanted to watch
Someone recommended I try it
I wanted access to its large content catalog
Other

53 3.3.7 Why people begin using Netflix arranged by first use of streaming
Figure 13
Respondents who were the newest Netflix users had the highest percentage
that began to use Netflix due to a specific program. “Less than 6 months” had the
highest percentage at 26% and “6 to 12 months” had 25%. Only 3% of “7 years or
more” respondents chose this option, but this number more than doubled to 7% for “4
to 6 years” and increased to 10% for “1 to 3 years.” The highest percentage of
respondents who chose recommendation was from those in the “6 to 12 month”
category at 25%, closely followed by the “1 to 3 years” category at 24%. The newest
Netflix streaming users had the lowest percentage of respondents who chose
recommendation at 12%.
0.00%
10.00%
20.00%
30.00%
40.00%
50.00%
60.00%
Less than 6 months
6 to 12 months
1 to 3 years
4 to 6 years
7 years or more
There was a specific exclusive program I wanted to watch
Someone recommended I try it
I wanted access to its large content catalog
Other

54 3.3.8 Reasons for suspending Netflix usage
Figure 14
72% of respondents have never suspended their Netflix usage. The most
commonly selected reason for Netflix usage suspension was lack of interest in
available programs, but over 16% of respondents indicated suspending usage due to a
lack of a necessary resource rather than disinterest in the service.
4% 6% 8%
6% 4%
72%
The person who pays for my subscription (other than myself) suspended it I could no longer afford the subscription
I was not interested in the available programs
I had no free time to watch Netflix
Other
I have never suspended my Netflix usage

55 3.3.9 Reasons for rejoining Netflix
Figure 15
Respondents were able to choose multiple reasons for rejoining Netflix
streaming incase they rejoined multiple times or had multiple factors for doing so.
89% of respondents who suspended their usage eventually returned to the service.
25% of those who suspended Netflix usage rejoined due to content expansion in
general while 7% rejoined due to a specific title. For that 7%, 6 out of the 11 stated
programs were Netflix originals and none were regional exclusives. And though they
rejoined for a specific program, 73% did not suspend their usage of streaming again
immediately after finishing that program.
0%
5%
10%
15%
20%
25%
30%
The person who pays
for my subscription (other than
myself) rejoined
I could again afford
the subscription
Netflix gained more
content I wanted to
watch
I had more free time to
watch Netflix
Netflix announced
or released a specific
exclusive program I wanted to
see
I did not rejoin Netflix
17%
24% 25% 26%
7%
11%

56 3.4 Usage and Opinion of Other Content Sources
3.4.1 Number of premium content services used in addition to Netflix
Figure 16
79% of Netflix subscribers used at least one additional premium content
service. A substantial portion of Netflix users surveyed were heavy consumers of
premium content services, with 40% using 3 or more services in addition to Netflix.
15%
24%
23%
11%
6%
21% 1
2
3
4
5
None
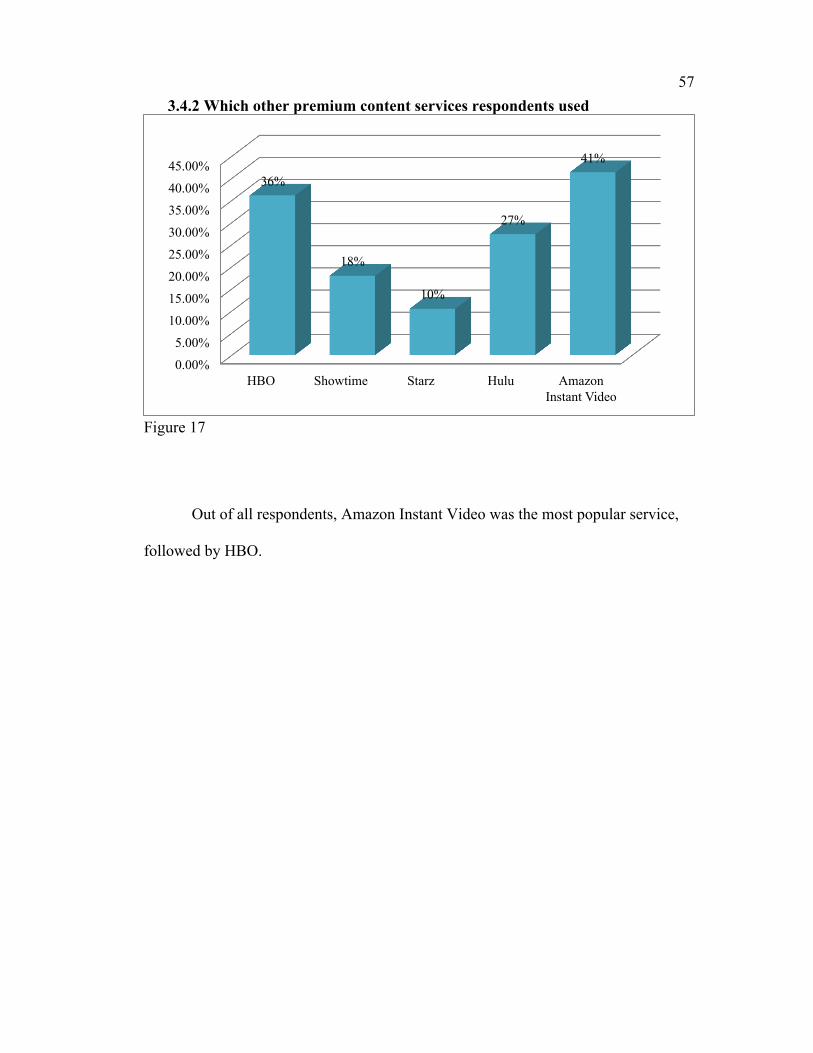
57 3.4.2 Which other premium content services respondents used
Figure 17
Out of all respondents, Amazon Instant Video was the most popular service,
followed by HBO.
0.00%
5.00%
10.00%
15.00%
20.00%
25.00%
30.00%
35.00%
40.00%
45.00%
HBO Showtime Starz Hulu Amazon Instant Video
36%
18%
10%
27%
41%

58 3.4.3 Percentage of users subscribing to other content services arranged by
first Netflix streaming use
Figure 18
Early adopter respondents were most likely to use another content service in
addition to Netflix, with 88% of respondents in the “7 years or more” category and
78% in “4 to 6 years” using at least one additional premium content service. Amazon
Instant Video was used most by early adopters at 83% in “7 years or more” and 56%
in “4 to 6 years). HBO was the most used content service among “1 to 3 year”
respondents at 32%, but its highest penetration was among “4 to 6 year” respondents
at 45%. Hulu’s highest percentage of use was in the “7 years or more” category at
58%, but it dropped over 20 percentage points in its next highest category, “4 to 6
years” at 34%. Starz was consistently the least used service in each respondent
category with a high of 14% in “4 to 6 years” and a low of 7% in “1 to 3 years.”
0.00%
10.00%
20.00%
30.00%
40.00%
50.00%
60.00%
70.00%
80.00%
90.00%
Less than 6 months
6 to 12 months
1 to 3 years 4 to 6 years 7 years or more
HBO
Showtime
Starz
Hulu
Amazon Instant Video
None of these

59 3.4.4 Percentage of respondents subscribing to other content services
arranged by streaming frequency
Figure 19
3.4.5 Respondents’ opinion of premium content providers
Figure 20
0.00%
10.00%
20.00%
30.00%
40.00%
50.00%
Never Less than
Once a Month
Once a Month
2-3 Times a Month
Once a Week
2-3 Times a Week
Daily
HBO
Showtime
Starz
Hulu
Amazon Instant Video
None of these
0
50
100
150
200
250
300
350 They're mostly great.
They're mostly okay.
They're mostly bad or uninteresting.
I am not familiar with or have no opinion of them.

60 Respondents were asked to rate the available content on premium content
services, including Netflix. HBO had slightly more respondents who regard the
content as “mostly great” than Netflix (327 vs. 321) and less negative responses (14
vs. 19). Netflix had more positive responses (an answer of “They’re mostly great” or
“They’re mostly okay”) overall than HBO (492 vs. 433). Disregarding those who
were not familiar with or had no opinion of the content services, positive opinion of
the available content ranked as follows: HBO with 97%, Netflix with 96%, Showtime
with 92%, Amazon Instant Video with 85%, Starz with 82%, and Hulu with 66%. Out
of OTT services, Netflix had the most favorably viewed content and was nearly on
par with HBO.
3.4.6 Domestic respondents’ opinion of broadcast and basic cable content in comparison with Netflix
Figure 21
0
50
100
150
200
250
300
ABC NBC CBS FOX CW AMC Netflix
They're mostly great.
They're mostly okay.
They're mostly bad or uninteresting.
I am not familiar with or have no opinion of them.

61 The CW was the least popular network, with about 63% of respondents being
unfamiliar with the network, having no opinion of its content, or a negative opinion
on its content. Respondents favored NBC the most out of broadcast networks, having
had the most “mostly great” responses at 21% and the least “mostly bad or
uninteresting” responses at 13%. Respondents viewed the cable network AMC’s
content much more favorably than broadcast networks’ content, with about 51% of
respondents familiar with the network designating its content as “mostly great” and
40% calling content “mostly okay.” Still, Netflix’s domestic scorings were well
above the domestic broadcast and basic cable channels’ scorings both in terms of
familiarity and positivity.
3.5 Viewership and opinion of content genre and forms
3.5.1 Respondent viewership of content forms
Figure 22
2% 4%
26%
39%
29%
Films
1% 2% 9%
32% 56%
TV Series
Never
Rarely
Sometimes
Often
All of the Time

62 Table 1: Female respondent viewership of TV series and films
Content Form Min Value
Max Value Mean Standard
Deviation Responses
TV Series 1 5 4.39 0.72 248 Films 1 5 3.97 0.92 248
Table 2: Male respondent viewership of TV series and films
Content Form Min Value
Max Value Mean Standard
Deviation Responses
TV Series 1 5 4.39 0.81 287 Films 1 5 3.86 0.92 287
Respondents showed a clear preference for TV series, viewing them much
more frequently than films. Still, respondents were not unwelcoming towards films,
with only 6% of respondents saying they “never” or “rarely” watch them. Female
respondents showed a slightly greater frequency of watching films than male
respondents, with a coded mean of 3.97 vs. 3.86 where “all of the time” coded as a 5
through “never” coded as a 1. Both genders showed equal frequency of TV series
viewing at a coded mean of 4.39.

63 3.5.2 How often respondents watched specific content genres
Figure 23
Table 3: Respondent average genre viewership
Genre Min Value
Max Value Mean Standard
Deviation Responses
Children’s Programming 1 5 1.78 1.05 535 Documentaries 1 5 2.93 1.01 535 Non-English content 1 5 1.94 1.03 535 Comedies 1 5 3.56 0.94 535 Dramas 1 5 3.49 0.93 535 Sci-fi/Fantasy 1 5 3.27 1.14 535 Action 1 5 3.18 1.01 535 Animation/Anime 1 5 2.39 1.22 535 Reality 1 5 1.74 1.03 535 Talk Shows 1 5 1.33 0.69 535 Stand-up Comedy Specials 1 5 2.53 1.19 535
Using the same coding method in 3.5.1, comedy content was most popular
with a mean of 3.56, closely followed by drama content at 3.49. Talks shows were the
0 100 200 300 400 500 600 All of the
Time
Often
Sometimes
Rarely
Never
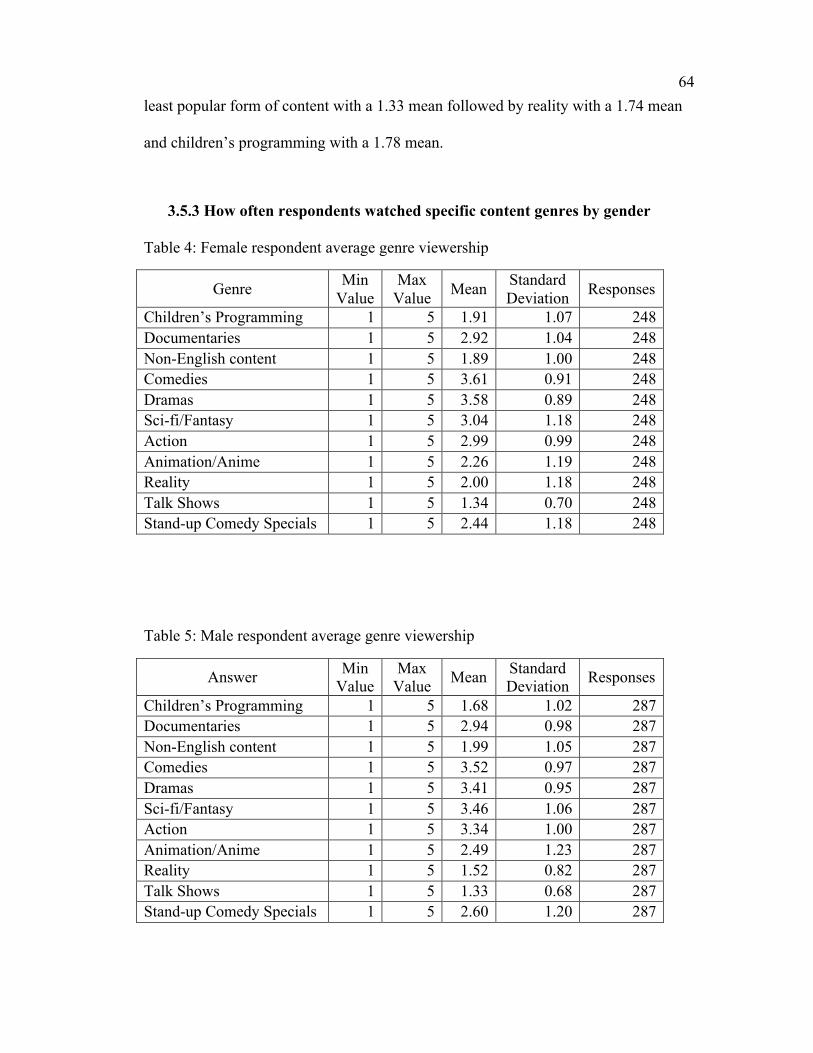
64 least popular form of content with a 1.33 mean followed by reality with a 1.74 mean
and children’s programming with a 1.78 mean.
3.5.3 How often respondents watched specific content genres by gender Table 4: Female respondent average genre viewership
Genre Min Value
Max Value Mean Standard
Deviation Responses
Children’s Programming 1 5 1.91 1.07 248 Documentaries 1 5 2.92 1.04 248 Non-English content 1 5 1.89 1.00 248 Comedies 1 5 3.61 0.91 248 Dramas 1 5 3.58 0.89 248 Sci-fi/Fantasy 1 5 3.04 1.18 248 Action 1 5 2.99 0.99 248 Animation/Anime 1 5 2.26 1.19 248 Reality 1 5 2.00 1.18 248 Talk Shows 1 5 1.34 0.70 248 Stand-up Comedy Specials 1 5 2.44 1.18 248
Table 5: Male respondent average genre viewership
Answer Min Value
Max Value Mean Standard
Deviation Responses
Children’s Programming 1 5 1.68 1.02 287 Documentaries 1 5 2.94 0.98 287 Non-English content 1 5 1.99 1.05 287 Comedies 1 5 3.52 0.97 287 Dramas 1 5 3.41 0.95 287 Sci-fi/Fantasy 1 5 3.46 1.06 287 Action 1 5 3.34 1.00 287 Animation/Anime 1 5 2.49 1.23 287 Reality 1 5 1.52 0.82 287 Talk Shows 1 5 1.33 0.68 287 Stand-up Comedy Specials 1 5 2.60 1.20 287

65 Female respondents showed a greater preference for children’s programming
(1.91 vs. 1.68), comedy (3.61 vs. 3.52), drama (3.58 vs. 3.41), and reality (2.00 vs.
1.52) while male respondents showed a greater preference for sci-fi or fantasy (3.46
vs. 3.04), action (3.34 vs. 2.99), animation or anime (2.49 vs. 2.26) and stand-up
comedy specials (2.60 vs. 2.44). Preference for documentaries, content in languages
other than English, and talk shows were comparable between genders.
3.5.4 Whether or not Netflix needs to add additional content to its catalog by content forms
Figure 24
Table 6: Female respondents on forms of content additions
Content Form Yes No Films 87.10% 13.71% TV series 84.27% 16.53%
85%
15%
Films
86%
14%
TV Series
Yes
No

66
Table 7: Male respondents on forms of content additions
Content Form Yes No Films 84.67% 16.03% TV series 88.50% 11.50%
A large majority of respondents believed Netflix should add more films and
TV series to its catalog at 85% and 86%, respectively. Female respondents were
slightly more favorable to films while male respondents where slightly more
favorable to TV series.
3.5.5 Whether or not Netflix needs to add additional content to its catalog by genre
Figure 25
0
50
100
150
200
250
300
350
400
450
Yes No

67
Table 8: Female respondents on genre additions
Content Form Yes No Children's Programming 25.40% 78.23% Documentaries 60.08% 41.94% Content in Languages Other Than English
34.68% 66.13%
Comedies 69.35% 32.26% Dramas 67.74% 33.47% Sci-fi or Fantasy 55.65% 45.56% Action 48.39% 53.23% Animation or Anime 37.90% 63.31% Reality 24.60% 75.81% Talk Shows 16.13% 85.08% Stand-up Comedy Specials 42.74% 58.87%
Table 9: Male respondents on genre additions
Content Form Yes No Children's Programming 21.95% 81.18% Documentaries 52.96% 48.43% Content in Languages Other Than English
33.10% 66.90%
Comedies 67.60% 33.80% Dramas 63.76% 36.59% Sci-fi or Fantasy 76.31% 24.74% Action 62.02% 39.02% Animation or Anime 45.64% 56.10% Reality 16.38% 85.37% Talk Shows 19.16% 81.53% Stand-up Comedy Specials 46.69% 53.66%
The least popular genres for additions to the Netflix catalog were talk shows,
reality, and children’s programming with only 18%, 20%, and 24% of respondents
believing them to be necessary additions, respectively. Even when isolating responses

68
to people with children under 16 in their household, only 35.3% believe Netflix
should add more children’s programming. The most popular genres to add were
comedy, sci-fi/fantasy, and drama at 68%, 67%, and 66%, respectively. Though only
34% of respondents would have liked Netflix to add content in languages other than
English, when responses were limited to those who do not speak English as a primary
language the number jumped to 63%.
3.6 Respondent opinion on Netflix original programs
3.6.1 Respondent awareness of select Netflix original programs
Figure 26
0
100
200
300
400
500
600
Lily
ham
mer
Hou
se o
f Car
ds
Ora
nge
is th
e N
ew B
lack
Turb
o FA
ST
BoJ
ack
Hor
sem
an
Vegg
ieTa
les i
n th
e H
ouse
Mar
co P
olo
All
Hai
l Kin
g Ju
lien
Hem
lock
Gro
ve
Arr
este
d D
evel
opm
ent,
Seas
on 4
The
Kill
ing,
Sea
son
4
Star
War
s: T
he C
lone
War
s, Se
ason
6
The
Prob
lem
Sol
verz
, Sea
son
2
Trai
ler P
ark
Boy
s, Se
ason
8
Che
lsea
Han
dler
: Uga
nda
Be
Kid
ding
Me
Azi
z Ans
ari:
Bur
ied
Aliv
e
Bill
Bur
r: Yo
u Pe
ople
Are
All
The
Sam
e
Mik
e B
irbig
lia: M
y G
irlfr
iend
's B
oyfr
iend
E-Te
am
Mitt
The
Lady
in N
umbe
r 6
The
Squa
re
Heard of it Have Not Heard of It

69
Awareness of Netflix originals reached above 90% among respondents only
for three programs: House of Cards, Orange is the New Black, and Arrested
Development season 4. The original documentaries (including E-Team, Mitt, The
Lady in Number 6, and The Square) were the least-known programs. Children’s
programming (including Turbo FAST, Veggie Tales in the House, All Hail King
Julien, and The Problem Solverz, Season 6) had the next-highest percentage of being
unknown to respondents. This was most likely due to 75% of respondents not having
children under 16 in their household. Stand-up comedy (including Chelsea Handler:
Uganda Be Kidding Me, Aziz Ansari: Buried Alive, Bill Burr: You People Are All The
Same, and Mike Birbiglia: My Girlfriend’s Boyfriend) had moderate respondent
awareness ranging from 74% to 46% being aware of the individual programs.
Netflix’s oldest original Lilyhammer had a 53% respondent awareness.
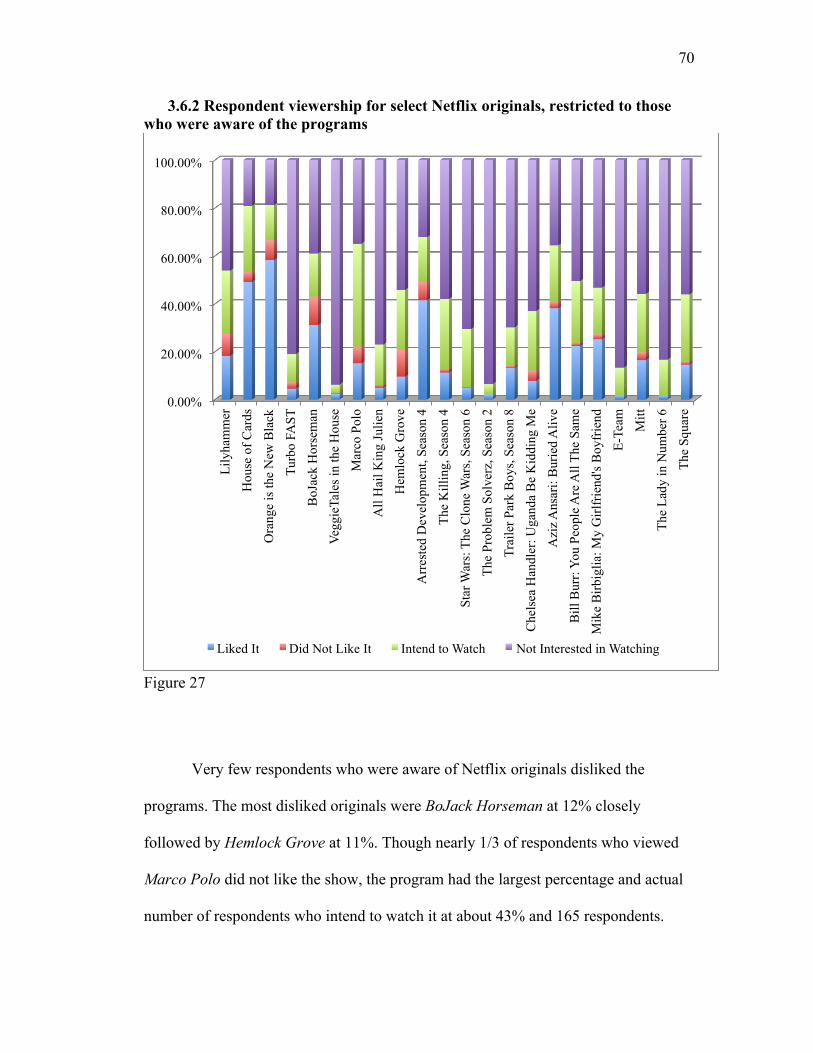
70
3.6.2 Respondent viewership for select Netflix originals, restricted to those who were aware of the programs
Figure 27
Very few respondents who were aware of Netflix originals disliked the
programs. The most disliked originals were BoJack Horseman at 12% closely
followed by Hemlock Grove at 11%. Though nearly 1/3 of respondents who viewed
Marco Polo did not like the show, the program had the largest percentage and actual
number of respondents who intend to watch it at about 43% and 165 respondents.
0.00%
20.00%
40.00%
60.00%
80.00%
100.00%
Lily
ham
mer
Hou
se o
f Car
ds
Ora
nge
is th
e N
ew B
lack
Turb
o FA
ST
BoJ
ack
Hor
sem
an
Vegg
ieTa
les i
n th
e H
ouse
Mar
co P
olo
All
Hai
l Kin
g Ju
lien
Hem
lock
Gro
ve
Arr
este
d D
evel
opm
ent,
Seas
on 4
The
Kill
ing,
Sea
son
4
Star
War
s: T
he C
lone
War
s, Se
ason
6
The
Prob
lem
Sol
verz
, Sea
son
2
Trai
ler P
ark
Boy
s, Se
ason
8
Che
lsea
Han
dler
: Uga
nda
Be
Kid
ding
Me
Azi
z Ans
ari:
Bur
ied
Aliv
e
Bill
Bur
r: Yo
u Pe
ople
Are
All
The
Sam
e
Mik
e B
irbig
lia: M
y G
irlfr
iend
's B
oyfr
iend
E-Te
am
Mitt
The
Lady
in N
umbe
r 6
The
Squa
re
Liked It Did Not Like It Intend to Watch Not Interested in Watching

71
Orange is the New Black had the highest percentage and actual number of
respondents who enjoyed the show at 58% and 310 respondents. Children’s
programming originals had the highest percentages of disinterest averaging at 86%,
which is most likely due to only 2% of respondents being under 16 and 25% of
respondents having children under 16 in their household. This was followed by
documentary originals averaging 71% disinterest and stand-up comedy specials
averaging 51% disinterest. The individual program with the largest actual number of
disinterested respondents was Star Wars: The Clone Wars, season 6 with 298
respondents, which translates to 71% of respondents who are aware of the program.
3.6.3 Respondents’ rating of Netflix original programming vs. entire content collection
Figure 28
2% 5%
21%
37%
35%
Original Programming
1% 6%
31%
51%
11%
Entire Content Collection
1 star
2 stars
3 stars
4 stars
5 stars

72
Table 10: Average respondent satisfaction with Netflix content collections
Answer Min Value
Max Value
Average Value
Standard Deviation Responses
Entire collection 1 5 3.66 0.78 535 Original programming 1 5 3.99 0.96 535
When asked to rate their satisfaction with it on a 5-star scale, respondents
rated Netflix original programming an average of 3.99 stars with a 0.96 standard
deviation. This was slightly higher than how respondents rated Netflix’s entire
content collection, which averaged 3.66 stars. However, the entire content collection
rating had a slightly lower standard deviation of 0.78. 72% of respondents rated
original programming at 4 or 5 stars while 62% of respondents did the same with the
entire content collection. Despite the responses for original programming being
slightly more varied, survey respondents were overall slightly more satisfied with
Netflix original programming than Netflix’s entire catalog.
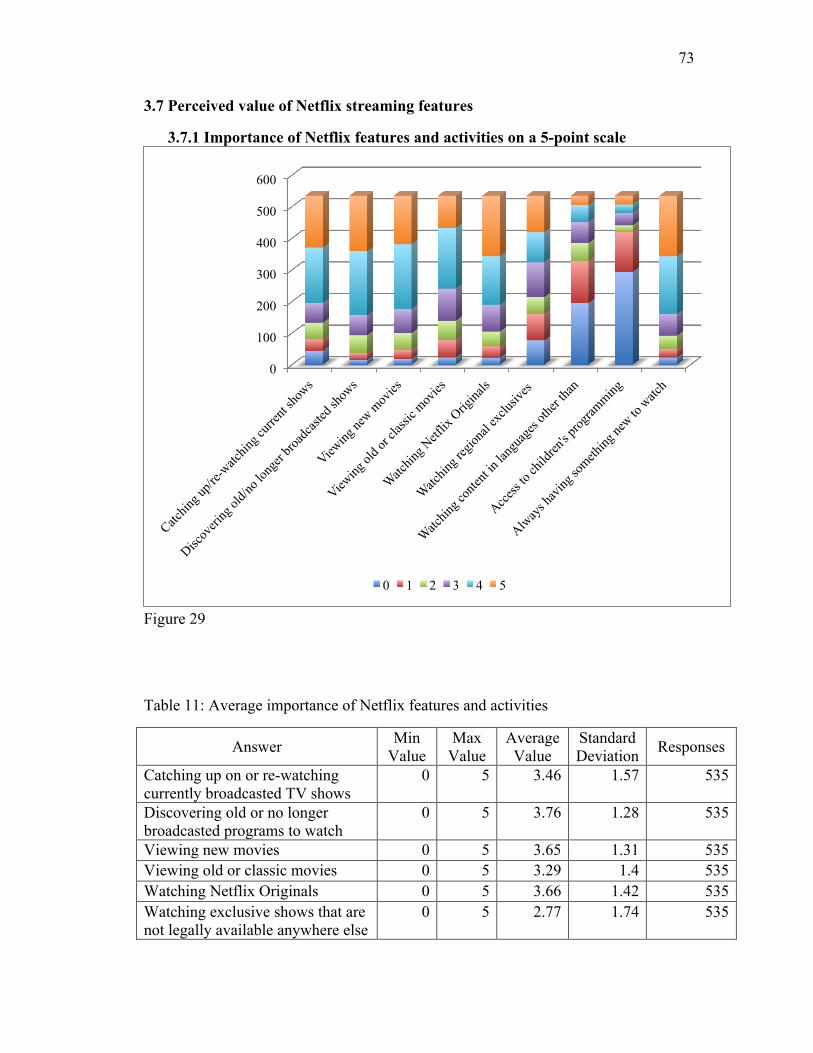
73
3.7 Perceived value of Netflix streaming features
3.7.1 Importance of Netflix features and activities on a 5-point scale
Figure 29
Table 11: Average importance of Netflix features and activities
Answer Min Value
Max Value
Average Value
Standard Deviation Responses
Catching up on or re-watching currently broadcasted TV shows
0 5 3.46 1.57 535
Discovering old or no longer broadcasted programs to watch
0 5 3.76 1.28 535
Viewing new movies 0 5 3.65 1.31 535 Viewing old or classic movies 0 5 3.29 1.4 535 Watching Netflix Originals 0 5 3.66 1.42 535 Watching exclusive shows that are not legally available anywhere else
0 5 2.77 1.74 535
0
100
200
300
400
500
600
0 1 2 3 4 5

74
in my location Watching content in languages other than English
0 5 1.51 1.58 535
Access to children’s programming for the children in my household
0 5 0.99 1.47 535
Always having something new to watch
0 5 3.75 1.37 535
On a scale where 0 is “Not At All Important” and 5 is “Very Important,”
respondents rated the importance of specific Netflix features and activites to the value
of their Netflix access. “Access to children’s programming” was valued least with an
average importance of 0.99. Isolating responses only to households with children
under 16, this rised only to 2.18. The next least valued activity was “watching content
in languages other than English” with an average value of 1.51, but this activity also
had the highest response variation with a 1.58 standard deviation. Isolating responses
to those who indicated their primary language as something other than English, the
importance value only rised to 1.89. “Discovering old or no longer broadcasted
programs” was the highest valued activity with an average of 3.76. “Discovering old
or no longer broadcasted programs” also had the smallest response variation with a
standard deviation of 1.28. The very close second-most highly rated activity was
“always having something new to watch” with an average importance value of 3.75.
“Always having something new to watch” and “watching Netflix originals” both had
the most number of 5 ratings, 192.

75
3.7.2 Respondents’ most important feature to Netflix usage satisfaction
Figure 30
Respondents were given three Netflix features and asked to choose which was
most important to their satisfaction with Netflix.
3.7.3 Respondents’ most important feature to Netflix usage satisfaction by gender
Figure 31
63% 13%
24%
Having access to a large catalog of titles
Having access to titles that are not available anywhere else
Having access to the newest and most popular TV shows and movies
61% 13%
26%
Female Respondents
64% 12%
24%
Male Respondents
Having access to a large catalog of titles
Having access to titles that are not available anywhere else
Having access to the newest and most popular TV shows and movies

76
Though female respondents showed a slightly higher preference for exclusive
titles (13% vs. 12%) and access to new and popular content (26% vs. 24%), a
majority of both genders chose a large catalog as the most important Netflix feature.
Access to exclusive titles was the least common choice as the most important Netflix
feature.
3.7.3 Respondents’ most important feature to Netflix usage satisfaction by frequency of use
Figure 32
The majority of users in all categories of usage frequency chose a large
catalog as being the most important Netflix feature, except for the “never” category in
which it tied with access to new and popular content. The more frequently a
respondent used Netflix, the less likely it was for title exclusivity to be the
respondent’s most valued feature. In all usage categories except for those who use
0.00%
10.00%
20.00%
30.00%
40.00%
50.00%
60.00%
70.00%
Never Less than
Once a Month
Once a Month
2-3 Times
a Month
Once a Week
2-3 Times
a Week
Daily
Having access to a large catalog of titles
Having access to titles that are not available anywhere else
Having access to the newest and most popular TV shows and movies

77
Netflix less than once a month, access to new and popular TV shows was chosen as
the most important feature more often than title exclusivity.
3.7.4 Respondents’ most important feature to Netflix usage satisfaction by how long ago Netflix streaming was first used
Figure 33
Respondent selection of the most important Netflix feature was very similar
across all categories. Respondents who first used streaming 6-12 months ago showed
the most variation with slightly more respondents choosing new and popular content
and content exclusivity as the most important Netflix feature.
0.00%
10.00%
20.00%
30.00%
40.00%
50.00%
60.00%
70.00%
Less than 6 months
6 to 12 months
1 to 3 years
4 to 6 years
7 years or more
Having access to a large catalog of titles
Having access to titles that are not available anywhere else
Having access to the newest and most popular TV shows and movies

78
3.8 Importance of future Netflix original programming
3.8.1 Whether or not knowing that Netflix is greatly expanding original programming adds value to Netflix access arranged by frequency of use
Figure 34
Table 12: Average importance of original programming expansion by streaming frequency
Respondent Group Min
Value (No)
Max Value (Yes)
Average Value
Standard Deviation Responses
Never 1 3 2 0.76 8 Less than once a month 1 3 1.80 0.79 10 Once a month 1 3 2.78 0.42 27 2-3 times a month 1 3 2.66 0.66 50 Once a week 1 3 2.83 0.53 45 2-3 Times a week 1 3 2.69 0.63 179 Daily 1 3 2.72 0.61 216
A majority of all respondents who used Netflix at least once a month believe
that the prospect of future original programming adds value to their Netflix access,
0.00% 10.00% 20.00% 30.00% 40.00% 50.00% 60.00% 70.00% 80.00% 90.00%
Never Less than Once a Month
Once a Month
2-3 Times a Month
Once a Week
2-3 Times a Week
Daily
Yes No I'm not sure

79
with the lowest percentage for “2-3 times a month” respondents at 76% and the
highest for “once a week” respondents at 89%. Those who “never” used Netflix
streaming or used it “less than once a month” had the highest percentages of not
believing future original programming adds any value at 25% and 40%, respectively.
These two groups also had the highest levels of uncertainty regarding the value of
future original programming at 50% and 40%, respectively. When coding the
responses so that “yes” equaled 3, “I’m not sure” equaled 2, and “no” equaled 1 the
“once a week” category of respondents had the highest average, 2.83 and “less than
once a month” had the lowest average, 1.80.
3.8.2 Whether or not knowing that Netflix is greatly expanding original programming adds value to Netflix access arranged by how long ago Netflix streaming was first used
Figure 35
0.00% 10.00% 20.00% 30.00% 40.00% 50.00% 60.00% 70.00% 80.00% 90.00%
Less than 6 months
6 to 12 months 1 to 3 years 4 to 6 years 7 years or more
Yes No I'm not sure

80
Table 13: Average importance of original programming expansion by how long ago Netflix streaming was first used
Respondent Group Min
Value (No)
Max Value (Yes)
Average Value
Standard Deviation Responses
Less than 6 months 1 3 2.81 0.45 42 6 to 12 months 1 3 2.73 0.52 60 1 to 3 years 1 3 2.65 0.70 227 4 to 6 years 1 3 2.72 0.63 166 Once a 7 years or more 1 3 2.60 0.61 40
The newest user category had the highest percentage of respondents who
believe future original programming adds value to their Netflix access and the lowest
percentage of respondents who do not. The oldest user category was a complete
reversal: it had the lowest percentage of respondents who believed original
programming adds value and the highest percentage of respondents who did not.
Respondents who began using Netflix streaming within the last 6 months valued the
prospect of future original programming the most at a coded average of 2.81 (using
the same coding method mentioned in 4.8.1). Respondents who have used Netflix
streaming for 7 years or more valued future original programming the least at a 2.60
average.

81
3.8.3 Importance of the prospect of future original programming to respondents’ continued Netflix usage arranged by frequency of use
Figure 36
Table 14: Average Importance of future original programming to continued Netflix use by streaming frequency
Respondent Group Min Value (Not)
Max Value (Very)
Average Value
Standard Deviation Responses
Never 1 3 1.88 0.83 8 Less than once a month 1 3 1.80 0.63 10 Once a month 1 3 2.07 0.62 27 2-3 times a month 1 3 2.14 0.70 50 Once a week 1 3 2.02 0.75 45 2-3 Times a week 1 3 2.09 0.68 179 Daily 1 3 2.09 0.62 216
Out of all respondents, 82% considered original programming at least
“somewhat important” to his or her continued Netflix use while 18% did not. The
“never” category had lowest percentage of respondents who consider it at least
0.00%
10.00%
20.00%
30.00%
40.00%
50.00%
60.00%
70.00%
Never Less than
Once a Month
Once a Month
2-3 Times a Month
Once a Week
2-3 Times a Week
Daily
Very important
Not important
Somewhat important
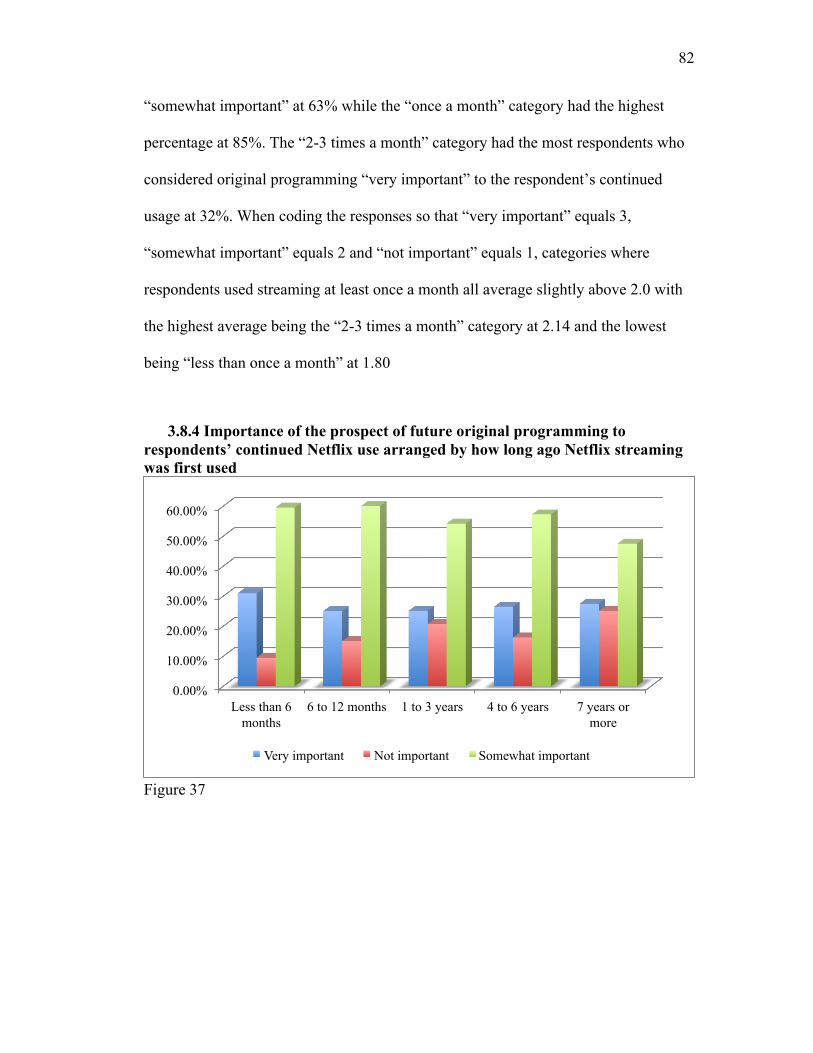
82
“somewhat important” at 63% while the “once a month” category had the highest
percentage at 85%. The “2-3 times a month” category had the most respondents who
considered original programming “very important” to the respondent’s continued
usage at 32%. When coding the responses so that “very important” equals 3,
“somewhat important” equals 2 and “not important” equals 1, categories where
respondents used streaming at least once a month all average slightly above 2.0 with
the highest average being the “2-3 times a month” category at 2.14 and the lowest
being “less than once a month” at 1.80
3.8.4 Importance of the prospect of future original programming to respondents’ continued Netflix use arranged by how long ago Netflix streaming was first used
Figure 37
0.00%
10.00%
20.00%
30.00%
40.00%
50.00%
60.00%
Less than 6 months
6 to 12 months 1 to 3 years 4 to 6 years 7 years or more
Very important Not important Somewhat important

83
Table 15: Average importance of future original programming to continued Netflix use by how long ago Netflix streaming was first used
Respondent Group Min Value (Not)
Max Value (Very)
Average Value
Standard Deviation
Responses
Less than 6 months 1 3 2.21 0.61 42 6 to 12 months 1 3 2.10 0.63 60 1 to 3 years 1 3 2.04 0.68 227 4 to 6 years 1 3 2.10 0.65 166 Once a 7 years or more 1 3 2.03 0.73 40
The newest Netflix user category had the most respondents who consider
original programming “very important” to their continued Netflix use at 31% and the
fewest respondents who considered it “not important” to their continued use at 10%.
The “6-12 month” category had the least amount of respondents who considered
original programming “very important” at 25% but was only 0.11% below the “1 to 3
years” category. The oldest Netflix user category had the most number of respondents
who considered original programming “not important” to their continued use of the
service at 25%. Using the same method in 4.8.3 to code the responses, the averages of
each respondent category and a very low standard deviation of 0.074 with averages
ranging from 2.03 to 2.21.
84
Chapter 4 : Discussion
4.1 Introduction Using the collected data, this chapter answers the research questions listed in chapter
one, section 1.5.
4.2 R1: Who are Netflix’s streaming consumers?
Survey respondents were 46% female and 54% male, and 82% were located in
the Unites States. Other respondent countries were as follows: 6% Canada, 5% United
Kingdom, 1% Germany, and 1% Australia. The remaining 5% consisted of
respondents from Norway, Ireland, Brazil, Netherlands, Denmark, Spain, Sweden,
Mexico, Finland, France, Austria, Gibraltar, New Zealand, Belgium, and Cambodia.
95% of respondents indicated that English is their primary language. Nearly 2% of
respondents were located in countries where Netflix was not officially available at the
time the survey was conducted (Australia, New Zealand, Cambodia, and Gibraltar).
Respondents identified their race as the following: 87% white or Caucasian, 4%
Hispanic or Latino, 3% black or African American, 3% Asian, and 3% Native
American, Pacific Islander or other.
In terms of age, survey response skewed towards millennials, as 77% of
respondents were 18-35 years old. The youngest respondent was 14 and the oldest
respondent was 76. The average respondent age was 27.3 years old and the most
common respondent age was 23. A majority of respondents had no children under 16
years old living in their household at 75%. 16% of respondents had one child under
16, 8% had two, 1% had 3, and 0% (2 respondents) had four or more.

85
Only respondents who indicated their current location as the United States
(440) were asked their annual household income in US dollars. Of those who did not
opt out of the questions (344), 31% indicated their household income $100,000 or
above, 12% reported $75,000-$99,999, 20% reported $50,000-$74,999, 20% reported
$30,000-$49,999, and 17% reported household income below $30,000. Household
income did not prove to be a significant respondent usage or preference indicator.
4.3 R2: How do consumers access Netflix and what inspires them to join or leave Netflix?
4.3.1 Access
Out of all respondents, 54% paid for their Netflix access while 32% reported
that a relative did. Generally speaking, frequent streamers were more likely to pay for
their own subscription while rare streamers were more likely to share access with
someone else. Respondents who consider themselves “daily” streamers reported the
same percentages, while 61% of “2-3 times a week” respondents said they pay for
their subscription. 75% of those who “never” stream indicated someone other than
themselves paid for their access as did 60% of “less than once a month” respondents.
“Once a month” respondents were nearly split with 52% paying for their subscription
and 48% sharing an account.
4.3.2 Joining Netflix
The more than half of all respondents (52%) began using Netflix streaming
due to wanting access to its large content catalog. 23% began using it at the
recommendation of another person, and just 11% began using it for a specific

86
exclusive program. Of the 14% who indicated “other,” supplied reasons included free
trial offers, streaming being included for free with their DVD subscription plan, gifted
subscriptions, a household member offering to share his or her subscription, and cord-
cutting. Of the 11% that joined for a specific exclusive show, 46% (28/61) of the
stated programs were Netflix original programs: House of Cards (13), Orange is the
New Black (11), Arrested Development (3), and Aziz Ansari: Buried Alive (1). The
remaining 54% (33/61) consisted of programs that were non-exclusive licensed
content: New Girl, 30 Rock, Fringe, Doctor Who, How I Met Your Mother, Bones,
Scandal, Glee, Lost, Top Gear, and others. Though Breaking Bad and The Walking
Dead were cited as impetus programs several times, all respondents of those
programs were located in the United States where the shows are not regional
exclusives. Out of all respondents, Netflix originals were responsible for initiating
streaming use for only 5% (28/535). These results show that a large catalog was most
important for new users, and that even when respondents join because of a specific
show, more than half the time it is not a Netflix exclusive or original. This points to
respondents valuing catalog size and popular shows (no matter the original source)
over unique access to content.
4.3.3 Leaving Netflix
Though 72% of respondents have never suspended their streaming use,
respondents were less likely to do so if they were “daily” or “2-3 times a week”
streamers. 75% of “daily” respondents and 76% of “2-3 times a week” respondents
have never suspended their usage while the same is true for only 13% of “never”
87
respondents and 30% of “less than once a month” respondents. Not being interested
in the available programs was the most common reason for suspending usage at 8%
of all respondents. This selection goes as high as 38% for “never” respondents and as
low at 6% for “2-3 times a month,” “2-3 times a week,” and “daily” respondents.
Though lack of interest in the available content was the most common reason, a
majority of respondents indicated suspending usage due to a lack of a necessary
resource for permitting access rather than disinterest in the service. Over 16% of all
respondents reported suspending usage due to a lack of a time, money, Internet, etc.
rather than disinterest in the service. When respondents who selected “other” were
prompted to explain, commonly cited reasons were international travel, lack of an
Internet connection, and switching to another service.
4.3.4 Rejoining Netflix
Of those respondents who did at one point suspend their Netflix streaming
usage, 89% eventually rejoined the services. Respondents were able to indicate
multiple reasons for rejoining Netflix incase of multiple times they rejoined or
multiple factors, therefore the total percentages exceed 100%. 26% indicated that they
rejoined because they regained free time, 24% because they could again afford the
subscription, and 17% gained access to another person’s account. The second most
common reason for rejoining at 25% was because respondents believed Netflix’s
content catalog improved. Just 7% (11 respondents) rejoined because of a specific
program. Of the 11 respondents, 6 mentioned original programs: Orange is the New
Black (4), House of Cards (1), and Marco Polo (1). This translates to 4% of

88
respondents who suspended Netflix streaming reinitiating their Netflix usage because
of original programming. This is fairly consistent with the previously stated statistic
that only 5% of all respondents started to use Netflix streaming due to an original
series and shows that original programing is not a major factor in attracting or re-
attracting users.
4.3.5 Summary
In evaluating whether or not to use Netflix streaming, respondents indicated
overall content catalog as the most important impetus to using the service. Influence
of friends and relatives was also a significant motivation, whether via
recommendation, gifting subscriptions, or sharing access. A very small minority of
respondents chose to use Netflix due to a specific program, and less than half of those
stated programs were Netflix originals. Though the most active streamers were least
likely to suspend their usage, 72% of all respondents have never suspended their
usage. Of those who did suspend Netflix streaming usage, the majority did so due to
lack of a key resource (time, money, Internet access) rather than dissatisfaction with
the service. Additionally, 89% of respondents who cancelled eventually rejoined the
service, most commonly because of regaining necessary access resources.
Respondents have proven to be loyal Netflix streaming consumers who value the
service in its entirety rather than for a specific program. Even for those respondents
who do join Netflix due to a specific program, 73% do not suspend their access
immediately after finishing that program.

89
4.4 R3: How often consumers use Netflix streaming and what do they watch?
4.4.1 Frequency
A majority of respondents were frequent Netflix streamers with 82% using
Netflix streaming at least once a week. The largest subset of respondents were daily
streamers at 40%, and 34% of respondents streamed multiple times a week. The smallest
subset is those who never stream at 1.8% closely followed by those who stream less than
once a month at 1.5% Male respondents were slightly more likely to be more active
streamers. “Daily” streamers were 53% male, “2-3 times a week” streamers were 58%
male, and “once a week” streamers were 64% male. “2-3 times a month” streamers were
62% female and “less than once a month” streamers were 70% female. “Never” streamers
were split even at 50% and “once a month” streamers were nearly split at 48% female,
52% male.
Respondents below the age of 28 are more likely to stream at least once a
week than older respondents. The average age of “daily” Netflix streaming
respondents was 25.84, “2-3 times a week” averaged 27.02 years old, and “once a
week” averaged 25.93 years old. Meanwhile, “2-3 times a month” averaged 28.5
years old, “once a month” averaged 37.04 years old, “less than once a month”
averaged 34.10 years old, and “never” averaged 29.25 years old. International
respondents had a slightly higher percentage of users who stream at least weekly at
87% while 81% of domestic users stream at least weekly.
When a respondent has children under 16 in his or her household and is a
frequent streamer, the household’s children are likely to match or exceed the
respondent’s streaming frequency. For respondents who stream “daily,” 48% said
90
their household’s children also stream “daily.” 87% of “daily” streaming respondents
indicated that the children in their household stream at least weekly, while only 11%
indicated they never stream Netflix. For “2-3 times a week” respondents, 63%
indicated that their household’s children stream 2-3 times a week or more, and 83%
of “once a week” respondents indicated that their household’s children stream once a
week or more. Conversely, 67% of “once a month” respondents reported their
household’s children stream less than once a month or never and “less than once a
month” respondents reported their household’s children stream less than once a
month or never at 50%. Those who “never” use Netflix streaming reported their
children never stream at 80%.
4.4.2 TV series vs. Films
Respondents showed a clear preference for TV series, viewing them more
frequently than films. 88% of respondents reported that they watch TV series “all of
the time” or “often” while 68% did the same for films. Still, respondents are not
unwelcoming towards films, with only 6% of respondents saying they “never” or
“rarely” watch them (compared to 3% for TV series). Coding frequency responses so
that “all of the time” is a 5 and “never” is a 1, female respondents showed a slightly
greater frequency for watching films than male respondents, with a coded mean of
3.97 vs. 3.86. Both genders showed equal frequency for TV series viewing at a coded
mean of 4.39. “Daily” streaming respondents showed the highest average TV
viewership with a mean of 4.7, while only the most infrequently streaming
respondents indicated a higher viewership mean for film over TV series. Respondents
91
who stream “once a month” or “less than once a month” had film viewership averages
of 3.67 and 3.9, respectively.
4.4.3 Content Genres
Respondents were asked to indicate how often they view 11 specific content
genres using the same TV/Film scale. The results in order of most commonly to least
commonly viewed are as follows: comedy (#1, 3.56), drama (#2, 3.49), sci-fi/fantasy
(#3, 3.27), action (#4, 3.18), documentaries (#5, 2.93), stand-up comedy specials (#6,
2.53), animation or anime (#7, 2.39), content in languages other than English (#8,
2.39), children’s programming (#9, 1.78), reality (#10, 1.74), and talk shows (#11,
1.33). Low children’s programming viewership was most likely due to just 2% of
respondents being under 16 years old and only 25% of respondents having children
under 16 in their household.
Female respondents showed greater viewership of children’s programming
(1.91 vs. 1.68), comedy (3.61 vs. 3.52), drama (3.58 vs. 3.41), and reality (2.00 vs.
1.52) while male respondents showed a greater viewership of sci-fi or fantasy (3.46
vs. 3.04), action (3.34 vs. 2.99), animation or anime (2.49 vs. 2.26) and stand-up
comedy specials (2.60 vs. 2.44). Viewership for documentaries, content in languages
other than English, and talk shows were comparable between genders. Individual
respondent categories based on frequency of streaming ranked the content genres
similarly to each other. However, the respondent category that “never” streams was
the only streaming frequency category to not have comedy and drama content in its
top 3 viewed genres. Instead, it favored sci-fi/fantasy and action, both at 3.13.
92
4.4.4 Summary
A large majority of respondents stream Netflix at least once a week. The most
frequently streaming respondents were slightly more likely to be male than female
and on average younger than 28 years old. If respondents had children under 16 in
their household and were frequent streamers, those children were very likely to
emulate or exceed the respondents’ streaming frequency. Respondents on average
watched more TV series than films, but very few respondents rarely or never watched
either. Female respondents tended to watch more films than male respondents, but
both genders favored TV series over films. While there were some differences in
preference between genders, all respondents on average watch more comedies and
dramas than any other genres. Male respondents showed greater inclinations to watch
sci-fi/fantasy, action, anime/animation, and stand-up comedy, but female respondents
on average were not disinterested in these genres. Male and female respondents
showed equal disinclination to watch talk shows. Though reality shows were not
popular with either gender, female respondents showed a slightly higher inclination to
watch such programs.
4.5 R4: What features and activities do Netflix streaming users value most?
4.5.1 Rating the importance of various features and activities
On a scale where 0 is “not at all important,” 3 is “neither important nor
unimportant” and 5 is “very important,” respondents rated the importance of 9
specific Netflix features and activites to the value of their Netflix access.

93
“Discovering old or no longer broadcasted programs” was the highest valued activity
with an average of 3.76. This activity also had the smallest response variation with a
standard deviation of 1.28. The very close second-most highly rated activity is
“always having something new to watch” with an average importance value of 3.75.
“Always having something new to watch” also had the most number of 5 ratings, 192.
These two categories being rated the most important streaming activites on average
indicates that respondents greatly valued a wide variety of content options that
includes the television industry’s back-catalog of older programs. “Watching Netflix
originals” had the third highest average at 3.66, indicating that respondents
considered original programming somewhat important, but not the most important
feature.
Respondents did not rate movie watching as very important to their
satisfaction with Netflix streaming. “Viewing new movies” was the fourth highest
rated activity and averaged 3.65 while “viewing old or classic movies” was the sixth
highest rated activity and averaged 3.29. So while respondents did report that the
activites increase their value of Netflix streaming, they do not have as much influence
as tv programs. Additionally, though “watching old or classic movies” was rated the
fourth least valued activity on average, only 26% of respondents felt it was
unimportant to their satisfaction with Netflix streaming. “Catching up/re-watching
currently broadcasted shows” had the median average importance at 3.46. Though
this activity is often credited with creating ratings boosts for later seasons of
broadcast and cable shows (ie, Breaking Bad, Grimm), respondents on average
considered it only slightly important to their percieved value of Netflix.
94
“Access to children’s programming” was valued least important with an
average of 0.99. Isolating responses only to households with children under 16 raises
the average to 2.18, but this still fell on the “unimportant” side of the scale. Even if
they have children, respondents did not see Netflix as an important source of
children’s programming. The next least valued activity was “watching content in
languages other than English” with an average value of 1.51. Isolating responses to
those who indicated their primary language as something other than English, the
importance value only raised to 1.89. This indicates that respondents were not
interested in non-English content no matter what their primary language was.
The third least average importance value was 2.77 for “watching regional
exclusives,” and each individual respondent group rated “watching Netflix originals”
more important than it. However, it is unclear if respondents were acturately
differentiating between regional exclusives and original programming. For example,
one survey taker shared his disappointment that Peaky Blinders was not included by
name in the survey because it was the best Netflix original in his opinion. However,
Peaky Blinders is actually a regional exclusive in the United States as the show was
originally produced for BBC Two. Additionally, in another part of the survey where
respondents were prompted to provide the name of the specific exclusive program
that inspired them to use Netflix, none of the named programs were regional
exclusives. They were either Netflix originals or non-exclusive programs widely
available on broadcast TV, cable, OnDemand, or other OTT services. If respondents
had a clearer understanding of what programs were actually exclusives, they would
most likely have rated exclusives as much more important.

95
The most frequently streaming respondents’ averages were consistently rate in
each individual category as more important to their satisfaction with Netflix than all
other respondents’ averages, with “daily” averages ranging from being equal to, to as
much as .31 points above the total average. Additionally, “daily” streaming
respondents rated “always having something new to watch” as the most important
feature at 4.05, followed by “discovering old or no longer broadcasted programs” at
4.02. “Daily streamers” on average rated “Catching up on or re-watching currently
broadcasted TV Shows” as the third most important activity at 3.77, closely followed
by “viewing new movies” and “watching Netflix originals,” both at 3.75. This
indicates that respondents who use Netflix streaming more often are more satisfied
with its various features and activities than other respondents who stream less
frequently.
The heavier streamer the respondent was, the greater he or she valued Netflix
original programming. “Never” was the only respondent group to rate “watching
Netflix originals” less than a 3 on average, and the more frequently a respondent
group streams, the more important it rated “watching Netflix originals” on average.
However, “daily” respondents did rate “catching up on or re-watching currently
broadcasted TV Shows” as more important on average than “watching Netflix
originals.”
4.5.2 Choosing the most important feature
When asked to pick the feature most important to their satisfaction with
Netflix streaming out of the following three options, 63% of respondents chose

96
“having access to a large catalog of titles,” 24% chose “having access to the newest
and most popular TV shows and movies,” and 13% chose “having access to titles that
are not available anywhere else.” Though female respondents showed a slightly
higher preference for exclusive titles (13.3% vs. 12.5%) and access to new and
popular content (25.4% vs. 23.7%), a majority of both genders chose a large catalog
as the most important Netflix feature. This is consistent with the research’s finding of
catalog size being the most common impetus for respondents beginning to use Netflix
streaming. This also is consistent with “watching Netflix originals” and “watching
regional exclusives” being rated on average less important than “always having
something new to watch.”
In analyzing this question in terms of respondent streaming frequency, the
majority of users in all categories of usage frequency chose a large catalog as being
the most important Netflix feature, except for the “never” category in which it tied
with access to new and popular content. The more frequently a respondent uses
Netflix, the less likely it is for title exclusivity to be the most important feature. Only
9% of “daily” streamers selected as the most important feature, while each
subsequent streaming frequency chose 13%, 15.5%, 16%, 22%, and 30%,
respectively. In all usage categories except for those who use Netflix “less than once
a month,” access to new and popular TV shows was chosen as the most important
feature more often than title exclusivity.
However, it is unclear if respondents were able to connect original
programming to the “having access to titles that are not available anywhere else”
option. Original programs as well as exclusives are implied in this statement, but

97
respondents may not have understood that due to the indirect wording. In tandem with
a better understanding of what programs are exclusive, using the actual word
“original” in the statement might have led more respondents to select it.
4.5.3 Summary
The top 3 Netflix streaming features rated most important by respondents
were, in order, “discovering old or no longer broadcasted programs,” “always having
something new to watch,” and “watching Netflix originals.” This indicates that
respondents were most interested in a large catalog of content, including both new
and old content. Respondents on average did not consider exclusive programs very
important, but this might have been affected by respondents not being aware of what
programs actually are exclusive. Daily streaming respondents were most likely to rate
any Netflix feature on average. Additionally, the more frequently a respondent
streamed, the higher he or she valued “watching Netflix originals” on average. When
asked to pick one feature as most important to their satisfaction with Netflix
streaming, most respondents chose “having access to a large catalog of titles.” Less
than half as many respondents chose “watching the newest and most popular TV
shows and movies,” and less than half as many of those respondents chose “having
access to titles that are not available anywhere else.” The distribution of choice
between genders and among the streaming frequencies were fairly similar. However,
the more frequently a respondent streamed, the less likely it was for respondents to
choose exclusivity as the most important feature. However, it is unclear if
respondents understood that original programming makes up a large portion of

98
exclusive titles. If the term “original” was explicitly used in the statement, this might
have increased the percentage of respondents who chose that feature. Still, it is
unlikely to have made a major difference as all other data points to respondents caring
most about content volume.
4.6 R5: What do Netflix streamers think about Netflix original programs?
4.6.1 Awareness
Respondents were first asked if they were aware of a select set of Netflix
original programs. It was necessary to judge program awareness because Netflix
rarely advertises specific programs and instead relies on word-of-mouth and their
internal content recommendation system. If respondents are not even aware that the
given original programs exist, this indicates that respondents did not seek out content
for specifically being a Netflix original nor are the programs successfully permeating
the Netflix audience. Orange is the New Black had the highest awareness at 99.4%
followed by House of Cards at 99.2%. Awareness of Netflix originals reached above
90% among respondents only for three programs: the two previously mentioned and
Arrested Development, season 4 at 94%. The original documentaries listed (including
E-Team, Mitt, The Lady in Number 6, and The Square) are the least-known programs.
Despite The Lady in Number 6 having won a 2014 Oscar and The Square winning
several Emmys and being nominated for a 2013 Oscar, only 11% and 15% of
respondents were aware of the movies, respectively. The children’s programming
listed (including Turbo FAST, Veggie Tales in the House, All Hail King Julien, and
The Problem Solverz, season 6) had the next-least awareness to respondents, all

99
having awareness percentages below 50% and as low as 17%. However, this is most
likely due to 75% of respondents not having children under 16 in their household.
The stand-up comedy listed (including Chelsea Handler: Uganda Be Kidding Me,
Aziz Ansari: Buried Alive, Bill Burr: You People Are All The Same, and Mike
Birbiglia: My Girlfriend’s Boyfriend) had moderate respondent awareness ranging
from 74% to 46% being aware of the individual programs. Netflix’s oldest original
Lilyhammer had a 53% respondent awareness while the newest included in the listed
programs Marco Polo had a 75% awareness.
4.6.2 Viewership and Interest
If respondents were aware of the programs, they were asked if they liked it,
disliked it, intended to watch it, or had no interest in watching it. On average, 58% of
respondents were not interested in the selected original programs. Children’s
programming originals had the highest disinterest percentages, averaging 86%, which
is most likely due to only 2% of respondents being under 16. But even removing the
children’s programming titles from the total average only lowers it to 52% disinterest.
Documentary originals also had very high disinterest averaging 71% disinterest,
followed by stand-up comedy specials averaging 51% disinterest. The individual
program with the largest actual number of disinterested respondents was Star Wars:
The Clone Wars, season 6 with 298 respondents, which translated to 71% of
respondents who were aware of the program. Though disinterest percentages appear
high, it is important to remember that very few individual programs interest everyone
and that these percentages are very reasonable when scaled. 58% of respondents
100
being disinterested with any given original on average means that 42% are interested.
If that percentage is applied to Netflix’s entire membership (over 50 million), that
means that over 21 million people are interested in watching any given Netflix
original, an audience number with which any broadcast, cable, or premium cable
network would be thrilled. So, for a niche program to have 71% disinterest could still
translate to 14.5 million Netflix viewers, a respectable audience size depending on the
type of content.
Very few respondents who were aware of the listed programs disliked Netflix
originals, with some content even having no respondents indicating dislike. The most
disliked originals were BoJack Horseman at 12% closely followed by Hemlock Grove
at 11%. Hemlock Grove was also the only original to have more viewers dislike it
than like, which could explain why it was not renewed beyond a third season. The
five most liked originals were as follows: Orange in the New Black (58%), House of
Cards (49%), Arrested Development, season 4 (41%), Aziz Ansari: Buried Alive
(38%), BoJack Horseman (31%), and Mike Birbiglia: My Girlfriend’s Boyfriend
(25%). But note: these percentages are derived from the total of respondents who are
aware of the programs rather than those who viewed the programs, so the percentages
do not directly equate to an average viewer rating. While it would be possible to
calculate those numbers from the collected data, it does not serve the purpose of this
discussion. Audience size and potential audience size are much more relevant as
traditional television is rated on these metrics instead of how the viewer feels about
programs. The specific percentages of whether or not a program is liked do not matter
as much as whether or not it is watched, as long as viewers are generally positive
101
overall. Because only one of the listed original programs had a comparatively high
“dislike” percentage that was above its “like” percentage, program favorability does
not appear to be an issue for Netflix originals.
Subscriber interest in watching a program is important in evaluating Netflix’s
original programming because it can indicate audience potential and growth.
Additionally, even if subscribers never watch the program they are interested in, just
having the content available can increase their perceived value of Netflix. On
average, 20% of respondents aware of the listed programs intended to watch them.
Marco Polo had the largest percentage and actual number of respondents intending to
watch it at about 43% and 165 respondents. Veggie Tales in the House had the
smallest percentage of respondents intending to watch it at 4%; and outside of
children’s programming, E-Team had the lowest percentage of intended viewers at
12%. Disregarding all children’s programming, the respondent average of intended
viewers raises to 23%.
When asked to rate their satisfaction with it on a 5-star scale, respondents
rated Netflix original programming an average of 3.99 stars with a 0.96 standard
deviation. This is slightly higher than how respondents rated Netflix’s entire content
collection, which averaged 3.66 stars. However, the entire content collection rating
has a slightly lower standard deviation of 0.78. 72% of respondents rated original
programming at 4 or 5 stars while 62% of respondents did the same with the entire
content collection. Despite the responses for original programming being slightly
more varied, survey respondents are slightly more satisfied with Netflix original
programming than Netflix’s entire catalog.

102
4.6.3 Summary
Only 9 of the 22 listed original programs had awareness levels below 50%,
and 8 of those 9 shows were documentaries or children’s programming, which attract
niche audiences. The programs with the highest awareness percentages were dramas,
comedies, and stand-up comedy specials. All of these programs were previously
advertised by Netflix (which is rarely done), frequently discussed in social and
entertainment media, or featured a high-profile celebrity. Among respondents who
were aware of the programs, potential audience sizes (a combination of respondents
who planned to watch or had already watched) were determined to be high. The
various interest and viewing percentages were comparable to broadcast and cable
television series when scaled to Netflix’s entire membership. Additionally, very few
of the respondents who viewed any of the programs disliked the programs. Compared
to Netflix’s entire content catalog, respondents were more satisfied with Netflix
original programming on average. All of this data indicates that respondents were not
only interested in watching the majority of original programs but also were very
pleased with the content once watched.
4.7 R6: How do Netflix users feel about Netflix’s original programming in comparison to other content providers’ original programming?
4.7.1 Respondent usage of other premium content services
Respondents were asked if they used any premium content services that are
widely available or often compared with Netflix streaming: HBO, Showtime, Starz,
103
Hulu, and Amazon Instant Video. 79% of respondents used at least one of the
additional premium content services, and 40% of respondents used 3 or more of the
services in addition to Netflix. Amazon Instant Video was the most popular, used by
41% of respondents, followed by HBO used by 36%. Next in order, 27% of
respondents used Hulu, and after that, Showtime at 18% and Starz at 10%.
Drilling down all responses by when respondents first began streaming
Netflix revealed some trends. Early adopter respondents were most likely to use
another content service in addition to Netflix, with 88% of respondents in the “7 years
or more” category and 78% in “4 to 6 years” using at least one additional premium
content service. Amazon Instant Video is used most by early adopters at 83%
penetration “7 years or more” and 56% penetration “4 to 6 years.” HBO is the most
used content service only among “1 to 3 year” respondents at 32%, but its highest
penetration is among “4 to 6 year” respondents at 45%. Hulu’s highest percentage of
use is in the “7 years or more” category at 58%, but it drops over 20 percentage points
in its next highest category, “4 to 6 years” at 34%. Starz is consistently the least used
service in each respondent category with a high of 14% in “4 to 6 years” and a low of
7% in “1 to 3 years.” Showtime ranged in popularity from 14% to 22%, but no major
trends occurred based on the respondent categories.
Looking at usage of other premium content services based on how frequently
respondents streamed Netflix, the least likely respondents to use an additional
premium content service were “less than once a month streamers” and “daily”
streamers. Those respondents did not use an additional content service at 50% and
40%, respectively. HBO was more likely to be used by a respondent if he or she was
104
not a “daily” Netflix streamer and had its highest respondent percentage of 44% with
respondents who streamed “2-3 times a month.” Though, the “2-3 times a week”
category had the highest percentage of respondents who used at least one additional
service, the “once a week” category had the highest combined percentage of each
service, meaning that these respondents are most likely to use multiple services in
addition to Netflix. Starz was the least popular service with all streaming frequency
categories except “never,” where it was tied with Amazon Instant Video for 2nd most
popular service at 25%. The top three premium content services in 6 out of the 7
streaming frequency categories were some combination of HBO, Amazon Instant
Video, and Hulu. HBO was most often the most popular, Amazon Instant Video was
most often the second most popular, and Hulu was usually the third most popular.
Only in “once a month” was Showtime third most popular rather than Hulu.
Additionally, Hulu was the most popular content service in the “less than once a
month” category at 30%.
Female respondents were twice as likely to use Starz (14% vs. 7%) and nearly
one-and-a-half times more likely to use Showtime (21% vs. 15%). Female
respondents were also slightly more likely to use Hulu (30% vs. 25%). Usage of
HBO, Amazon Instant Video, and no additional service were very close between
genders.
4.7.2 Respondent opinion of premium service original programming in comparison with Netflix original programming
Respondents were asked to select the most appropriate statement to describe
the available content on premium content services, including Netflix. The provided
105
statements were: “they’re mostly great,” “they’re mostly okay,” “they’re mostly bad
or uninteresting,” and “I am not familiar with or have no opinion of them.” The HBO
had slightly more respondents who regard the content as “mostly great” than Netflix
(327 vs. 321) and less negative responses (14 vs. 19). Netflix did have more positive
responses (an answer of “They’re mostly great” or “They’re mostly okay”) overall
than HBO (492 vs. 433), but this difference is most likely due to a greater awareness
of Netflix content over HBO content rather than ambivalence given that Netflix usage
is a requirement of survey participation. With this in mind, respondents rated Netflix
and HBO content very similarly. Outside of the United States, Starz content had the
highest level of unfamiliarity or ambivalence at 82% followed by Hulu at 75%,
Amazon Instant Video at 72%, and Showtime at 63%. Netflix had by far the least
amount of unfamiliarity or ambivalence at 5% (again, likely due to Netflix usage
being a participation requirement) followed by HBO at 36%. The ranking of
international unfamiliarity or ambivalence is consistent with domestic and combined
rankings of the responses. Disregarding those who were not familiar with or had no
opinion of the content services, positive opinion of the available content ranked as
follows: HBO with 97%, Netflix with 96%, Showtime with 92%, Amazon Instant
Video with 85%, Starz with 82%, and Hulu with 66%. Out of OTT services, Netflix
had the most favorably viewed content. Out of premium cable services, Netflix
streaming is nearly on par with HBO content’s perceived high quality.

106
4.7.3 Domestic respondent opinion of broadcast and basic cable original programming in comparison with Netflix original programming
Respondents located in the United States (440) were asked to rate the content
available on common broadcast and cable networks that also were sources of popular
and mainstream content for Netflix. The CW was the least popular network, with
about 63% of respondents being unfamiliar with the network, having no opinion of its
content, or a negative opinion on its content. Respondents favored NBC the most out
of broadcast networks, having the most “mostly great” responses at 21%, the highest
combined “mostly great” and “mostly okay” responses at 71%, and the least “mostly
bad or uninteresting” responses at 13%. Based on averaging coded responses, the
respondents ranked the broadcast networks’ content as the following from highest
regarded to least regarded: NBC, FOX, ABC, CBS, CW. However overall, there were
very minor deviations among the average respondent rating for the four older
broadcast networks ABC, NBC, CBS, and FOX with a standard deviation of 0.08.
Though there were slightly fewer respondents who were familiar with cable network
AMC’s content than most of the broadcast networks, respondents viewed AMC’s
content much more favorably than the broadcast networks’, with about 43% of
respondents designating its content as “mostly great” and 33% calling its content
“mostly okay.” Respondents were more familiar with AMC and rated AMC’s content
more favorably than premium cable channels Starz and Showtime, as well as OTT
services Amazon Instant Video and Hulu.
Nonetheless, Netflix’s domestic scorings were well above the domestic
broadcast and basic cable channels’ scorings both in terms of familiarity and
positivity. Only 4% of domestic respondents considered themselves as unfamiliar

107
with or having no opinion of Netflix content, and only 4% found the content “bad or
uninteresting.” 61% of domestic respondents found Netflix’s content “mostly great”
and 31% found the content “mostly okay.” Domestic respondents overwhelming rated
Netflix original programming more favorably than broadcast and cable original
programming. Additionally, the more often domestic respondents stream Netflix and
the longer amount of time they have been using Netflix streaming, the more favorably
they rate Netflix original programming on average. Female domestic respondents
rated Netflix original programming slightly higher on average than male domestic
respondents, but both genders rated it very high.
4.7.4 Summary
The majority of survey respondents, 79%, used additional premium content
services (both via cable and OTT) in addition to Netflix. Even so, respondents rated
Netflix’s original programming much more favorably than all premium content
services mentioned in the survey except HBO. However, Netflix was rated so closely
to HBO that the differences were almost insignificant. Compared to domestic
networks, Netflix original programming was rated as being a significantly higher
quality. There was a tendency for respondents to rate Netflix original programming
more highly on average the longer they have used the streaming service, the more
often they use it, and if they were female, but all respondents were very favorable.

108
4.8 R7: Do consumer viewing habits warrant a reallocation of Netflix’s content budget towards spending more on original programming?
4.8.1 As indicated by survey respondents
As discussed in R4, on a 5-star scale respondents rated Netflix original
programming an average of 3.99 stars and Netflix’s entire content collection an
average of 3.66 stars. 72% of respondents rated original programming at 4 or 5 stars
while 62% of respondents did the same with the entire content collection. This
indicates that when taken as a whole, respondents believed Netflix’s original
programming was better than the entire content catalog. Also discussed in R4,
respondents additionally had a high level of interest in the Netflix originals mentioned
in the survey. And as stated in R3, the average respondent importance rating ranked
“watching Netflix originals” as the third most important Netflix streaming feature or
activity. Therefore, it is clear that respondents enjoyed Netflix original programming
and saw them as an important feature of their Netflix access. However, it was also
clear from R3 that respondents valued a large catalog size, watching no longer
broadcasted programs, and catching up on current TV shows more than exclusive
programs. And from R2, most respondents were initially attracted to Netflix
streaming due to the enormous content catalog. This indicates that while increasing
original programming spending is not a bad idea, it is important that Netflix not do
this so greatly that it becomes a boutique content service. Doing so may alienate
respondents who valued their access to Netflix for the ability to watch content new
and old that originated elsewhere.

109
4.8.2 In the face of a changing streaming environment
Nonetheless, the changing environment of streaming media may force Netflix
to become a boutique service. The cost of licensing content is increasing and original
distributors are holding on to streaming rights as the industry realizes contents’ full
earnings potential. This is most clearly seen in Netflix’s early streaming license deals.
In the early days of streaming, Netflix secured deals with companies like Warner
Bros. Studios and MTV to license large TV and film catalogs for about $5 million to
$10 million per year (Pepitone, 2011). Netflix famously struck a four-year, $30
million a year deal with Starz in 2008 that gave it streaming access to Starz' offerings,
adding over 2,500 titles to Netflix (Peitone, 2011). In 2011, Netflix CEO Reed
Hastings said that renewing Starz's contract for $200 million a year, more than 6
times the original cost, "wouldn't be shocking," (Hesseldahl, 2011). However, the
deal was not renewed, causing the sudden removal of 2,500 titles on February 29,
2012 (Aguilar, 2012) which one reporter called “the Great Netflix Starzagedeon,”
(Warren, 2013). Starz explained the decision in a press release:
“This decision is a result of our strategy to protect the premium nature of our brand by preserving the appropriate pricing and packaging of our exclusive and highly valuable content. With our current studio rights and growing original programming presence, the network is in an excellent position to evaluate new opportunities and expand its overall business.” (Starz Entertainment, 2011)
This is a prime example of distributors and studios beginning to realize that Netflix is
no longer the only option to monetize streaming rights. Many of them have launched
their own streaming business: CBS has a standalone streaming services called CBS
All Access, HBO launched a fan-demanded service called HBO Now, Warner
Brothers has Warner Archive Instant for streaming hard to find and classic TV and
110
movies, and many others. The increasing number of proprietary streaming services
could cause licensed content deals to become so expensive that they are no longer
cost efficient, or distributors might choose to not even offer them.
If this were the future of the content streaming environment, however, it
would not be disastrous for Netflix. As R6 showed, respondents viewed Netflix
original programming as nearly equal in quality to that of HBO and superior to all
other cable and broadcast networks, premium content services, and OTT services.
While the transition may be difficult and users might loudly morn the decreased
catalog size, survey respondents showed that Netflix original programming is strong
enough to stand on its own if it must. As this change would unlikely be overnight, it
is not likely to have a drastic effect on subscriber numbers like the Qwiksters debacle
where Netflix lost 800,000 domestic subscribers in three months at the announcement
of a price hike and spin-off of DVD service to a new brand (Wagstaff, 2011).
Subscribers would slowly become accustomed to a world where there is no longer a
one-stop-shop for streaming content, but Netflix is known as a true streaming
network with some of the best original programming available.
4.8.3 Summary
Netflix should reallocate some of its budget toward original programming, but
on a sliding scale based on the economic feasibility of retaining a large catalog
populated by licensed content. According to survey respondents, catalog size and
licensed content have historically been the largest draws to Netflix streaming and its
most valued features. Through this method, as maintaining such a content catalog

111
becomes less and less possible, subscribers are eased into Netflix’s new identity as a
boutique network of original content. Respondents have proven Netflix original
content is a highly valued feature in its own right and better than that of most other
networks and services, so they are likely to stand by Netflix through the transition. As
the Qwikster experiment showed, Netflix subscribers do not like sudden service
changes, and they can result in huge subscriber loss. As long as Netflix scales its
percentage of original programming spending with the evolving streaming
environment, it should be able to maintain its status as the most popular OTT service.
4.9 R8: If it is a good investment, what genres and forms of original programming should the company pursue for the most efficient use of capital?
4.9.1 Content format
As 4.4 showed, respondents watched more TV series than films on Netflix.
But when asked outright what content forms should be added to the Netflix catalog,
respondents believed Netflix should add more films and TV series nearly equally at
85% and 86%, respectively. Female respondents favored additional films at 87%
(males at 85%) while male respondents favored additional TV series at 89% (females
at 84%). Based on this information, Netflix should focus on producing a higher
volume of TV series than films, but both are welcomed to users. Additionally,
because female respondents showed a slightly greater frequency of watching films
than male respondents and a greater preference for them as additional content, Netflix
should consider adding some original films in genres favored by female respondents.
Likewise, as more male respondents believed Netflix should add more TV series,

112
Netflix should consider adding some TV series in genres favored by male
respondents.
4.9.2 Genres
When respondents were asked, the most popular genres to add to the Netflix
catalog were comedy, sci-fi/fantasy, and drama at 68%, 67%, and 66%, respectively.
This was consistent with respondent viewing habits, as those three genres were the
most watched on average as discussed in 4.4. The least popular genres for additions to
the Netflix catalog were talk shows, reality, and children’s programming with only
18%, 20%, and 24% of respondents believing them to be necessary additions,
respectively. This was also consistent with respondent viewing habits. Though talks
shows and reality programs may be tempting genres to add due to their average low
production costs, Netflix should add these genres sparingly and be very selective.
Reality shows that are female-geared and talk shows that are male-geared are more
likely to be successful based on respondent preferences and habits.
Anime and animation should be niche content additions and generally aimed
towards male viewers. Very few respondents watched this type of content, and those
who did were much more likely to be male. The two original programs of this genre
in the survey, BoJack Horseman and Star Wars: The Clone Wars, season 6, were
much more popular with male respondents and somewhat divisive among all
respondents. Though stand-up comedy specials as a genre was ranked mid-level in
terms of how often respondents view them, only 26% of respondents indicated they
never view them. Because of this and their relatively inexpensive production cost,

113
Netflix should continue producing them. As the Aziz Ansari special was particularly
popular with respondents, Netflix should consider more specials staring him and other
comedians with a similar profile. In general, respondents were favorable to more
documentaries being added to Netflix. However, female respondents were more so
(60% vs. 53%), indicating that Netflix would do well to make a few documentaries
focused towards female audiences. Respondents were mostly favorable to more
action content, but male respondents much more so.
4.9.3 Content in languages other than English
Though only 34% of respondents would have liked Netflix to add content in
languages other than English, when responses were limited to those who do not speak
English as a primary language the number jumped to 63%. As Netflix expands
internationally, original programming in those regions’ native languages would likely
be a large boon to subscription numbers in those regions. And because 56% of all
respondents watched content in languages other than English, this content would
likely be of interest to many of Netflix’s other subscribers.
4.9.4 Children’s programming
Even when isolating responses to people with children under 16 years old in
their household, only 35% believed Netflix should add more children’s programming.
This indicates that though research has shown children are heavy streamers and do
the most re-watching of programs, most respondents believed there is a sufficient
amount of children’s programming available on Netflix. Access to children’s
programming is an important feature for some survey respondents, but as long as

114
Netflix has a select library, children’s programming does not need to be an original
programming focus.
4.9.5 Summary Based on respondents, most new original programming should be comedic,
dramatic, or sci-fi/fantasy. Anime/animation, talk shows, and action originals would
best serve male audiences while documentaries and reality shows would best serve
female audiences. Stand-up comedy was slightly more preferred by male audiences
but is an excellent cost-effective option when starring high-profile comedic talent.
Content in languages other than English would greatly interest those who primarily
speak a language other than English and be a boon to international expansion while
still being of interest to English-speaking audiences. Children’s programming, while
important for families to have, does not need to be a major part of Netflix’s original
programming slate.
115
Chapter 5 : Conclusion
5.1 Conclusion
As OTT and other Internet streaming services become more and more
prevalent, Netflix Inc. needs a strong streaming content strategy to grow subscription
numbers and maintain its status as the most popular streaming content service. It has
been speculated that original programming is a major component of this strategy, and
the data presented in this thesis provides insight into this strategy. Based on streaming
users’ demographics, habits, preferences, and opinions on Netflix streaming and
original programming, this thesis finds that original programming is important to
subscriber satisfaction, but it is not the most important feature and it barely accounts
for any subscriber sign-ups.
Survey respondents were 87% white or Caucasian, and 82% were located in
the Unites States. 46% of respondents were female and 54% were male, 77% were
18-35 years old, and just 25% had children under 16 years old in their household.
Survey results were occasionally drilled down by gender, whether or not respondents
had children in their household, and location (United States versus elsewhere) to
further illuminate trends and preferences. A more than half of respondents paid for
their own Netflix subscription and 32% shared an account with a relative being the
primary subscriber. More frequently streaming respondents were more likely to pay
for their own account. Additionally, 72% of respondents had never cancelled or lost
access to their Netflix subscriptions and 82% used Netflix streaming at least once a
week. Overall, respondents were loyal and frequent Netflix streaming users.

116
Respondents were asked through several different questions to rate various
Netflix streaming features and activities and rank their importance regarding
satisfaction with Netflix streaming. On average, respondents most greatly valued
Netflix’s large content catalog. This feature was the number one reason for joining
Netflix streaming, was a component of the top two ranked Netflix streaming
activities, and was chosen by 63% of respondents as the most important feature to
their satisfaction with the service. Netflix original programming was responsible for
just 5% of respondents beginning to use Netflix streaming, though watching originals
was rated as the third most important Netflix streaming feature on average. So while
it was not a major impetus for using the service, respondents did place high value on
Netflix originals.
When respondents were questioned about an array of specific Netflix original
programs, respondents displayed strong interested in watching the majority of
originals and were very pleased with the content once watched. Most of the originals
with low awareness levels (below 50%) were documentaries or children’s
programming, which tend to attract niche audiences. The programs with the highest
awareness percentages were dramas, comedies, and stand-up comedy specials. These
programs also shared at least two of the following traits: being specifically advertised
by Netflix, being frequently discussed in social and entertainment media, or featuring
a high-profile celebrity. Among respondents who were aware of the programs, Netflix
originals also had high potential audience sizes (a combination of respondents who
planned to watch or had already watched). The various interest and viewing
percentages were comparable to broadcast and cable television series when scaled to

117
Netflix’s entire membership. Compared to Netflix’s entire content catalog,
respondents were more satisfied with Netflix original programming on average.
Out of all respondents, 79% used additional premium content services (both
via cable and OTT) in addition to Netflix, but Netflix original programming was rated
more favorably on average than all other content distributors mentioned in the survey
except HBO, to which it was rated as nearly equal. Domestic respondents rated
Netflix originals significantly better than the originals of all broadcast networks
included in the survey. Though the cable network AMC’s originals were rated more
favorably than several premium cable networks, they were not rated as favorably as
Netflix originals. Respondents indicated that Netflix originals consist of some of the
best original programming available and are comparable to the quality of HBO
originals.
Netflix should reallocate some of its budget toward original programming, but
gradually as the industry changes and subscribers acclimate. Respondents appreciated
and enjoyed original programming, but not quite as much as other activities such as
“watching old or no longer broadcasted programs.” If the costs of licensing deals
make sense, Netflix should continue pursuing them (even without exclusivity)
because that is what respondents were shown to prefer most in their Netflix streaming
experiences. But by consistently releasing original programming, subscribers will
already be comfortable with Netflix’s identity as a network of original content when
maintaining such a large licensed content catalog becomes impossible. A gradual
slide towards a network consisting of mostly or all original programming respects
subscriber preferences and habits and will likely not result in a dramatic subscriber

118
loss. Respondents have proven Netflix original content is a highly valued feature and
better than that of most other networks and services, so they are likely to stand by
Netflix through the transition.
Based on survey responses, most new original programming should be
comedic, dramatic, or sci-fi/fantasy. Respondents were overwhelmingly not interested
in reality and talk shows as prospective Netflix original programs. Stand-up comedy
was slightly more preferred by male audiences but is an excellent and cost-effective
option when starring high-profile comedic talent. Content in languages other than
English should be considered as a strategy to help international expansions. And
while such content would greatly interest those who speak a primary language other
than English, it is of considerable interest to English-speaking audiences. Although
children’s programming was expected to be an important genre, it does not need to be
a major part of Netflix’s original programming slate. Even when isolated to just those
who have children under 16 in their household, respondents on average were satisfied
with the amount of children’s programming available on Netflix streaming.
While, Netflix original programming was not found to be a significant motive
for using the service nor the most important feature to user satisfaction, it is
nonetheless a feature that users valued, enjoyed, and rated as among the highest
quality original content. Based on potential audience size and average satisfaction
ratings from survey respondents, it is fair and appropriate for Netflix Inc. to compare
itself with HBO. Additionally, while Netflix original programming was found not to
be as important to subscriber interest and company growth as media attention might
lead one to believe, it is important for the company’s future and long-term success in

119
the face of an evolving streaming content landscape. As licensed content becomes
more expensive and less available due to more competition and the creation of
proprietary streaming services, original programming becomes more important for
every OTT streaming service. By meaningfully investing in original programming
before it is forced to by industry changes, Netflix is laying the foundation and
acclimating users to what they may expect from the service in the future. Overall,
increasing the original programming budget is a smart bet on Netflix’s part.
5.2 Recommendations for future studies As the respondents in this study were fairly homogenous in terms of ethnicity,
it would be beneficial for future studies to purposely seek out more multicultural
respondents or focus on the habits and preferences of specific ethnicities for
comparison purposes. Additionally, future studies may need to focus on international
subscribers. With Netflix’s rapid global expansion, international subscribers will soon
outnumber domestic ones and become a hugely important revenue source. It would
also be interesting to conduct a deep-dive on the shelf life of original series after they
conclude to evaluate their long-term value. Hemlock Grove is the first Netflix series
to be officially concluded with its third and final season being released in 2015.

120
List of References
Aguilar, M. (2012, February 27). The 20 best movies getting pulled from Netflix streaming tomorrow. Retrieved March 9, 2015, from http://gizmodo.com/5888553/the-20-best-movies-getting-pulled-from-netflix-streaming-tomorrow
Anderson, C. (2014). The long tail: Why the future of business is selling less of more.
New York: Hachette. Anderson, N. (2007, January 16). Netflix offers streaming movies to subscribers.
Retrieved October 11, 2014, from http://arstechnica.com/uncategorized/2007/01/8627/
Andreeva, N. (2014, April 22). Mitch Hurwitz inks multi-year deal with Netflix for
new series. Retrieved April 24, 2014, from http://www.deadline.com/2014/04/mitch-hurwitz-to-create-new-series-for-netflix-under-multi-year-deal/
Andreeva, N. (2014, September 2). Netflix nabs rights to new drama 'Gotham' in
precedent-setting deal. Retrieved January 20, 2015, from http://deadline.com/2014/09/gotham-netflix-deal-826991/
Arango, T., & Carr, D. (2010, November 24). Netflix’s Move Onto the Web Stirs
Rivalries. NY Times. Retrieved October 27, 2013, from http://www.nytimes.com/2010/11/25/business/25netflix.html?pagewanted=all&_r=0
Ayers, M. (2014, December 12). Inside 'Marco Polo,' Netflix's $90 million epic.
Retrieved January 2, 2015, from http://blogs.wsj.com/speakeasy/2014/12/12/marco-polo-netflix/
Balnaves, M., & Regan, T. (2011). Rating the audience: the business of media.
London: Bloomsbury Academic. Barnes, B. (2013, October 27). Disney show will appear first on app for tablets.
Retrieved January 22, 2015, from

121
http://www.nytimes.com/2013/10/28/business/media/disney-show-will-appear-first-on-app-for-tablets.html?_r=0
Bradley, B. (2014, June 26). The whole entire world binge-watched 'Breaking Bad'
because of course. Retrieved August 2, 2014, from http://www.huffingtonpost.com/2014/06/26/breaking-bad-binge-watched_n_5534736.html
Bradley, S. & Bartlett, N. (2007). Broadcast Television in a Broadband World.
Boston: Harvard Business Publishing. Carter, B. (2010, April 4). Weighty dramas flourish on cable. Retrieved January 22,
2015, from http://www.nytimes.com/2010/04/05/business/media/05cable.html?pagewanted=1&_r=0
Cosgrove-Mather, B. (2002, April 26). TV Guide Names Top 50 Shows. CBSNews.
Retrieved December 11, 2013, from http://www.cbsnews.com/news/tv-guide-names-top-50-shows/
Daly, K. (2013). Netflix CEO: 1 Season for ‘Arrested,’ many for ‘House of Cards’
for HBO-modeled Netflix. SNL Kagan. Retrieved from: http://www.snl.com/Interactivex/article.aspx?ID=17056863&KPLT=2
Deadline Team. (2014, March 13). DreamWorks Animation beefs up Netflix lineup
with 'King Julien,' 'Puss In Boots' and 'Veggie Tales' Retrieved August 29, 2014, from http://deadline.com/2014/03/dreamworks-animation-beefs-up-netflix-lineup-with-king-julien-puss-in-boots-and-veggie-tales-698292/
DeFino, D. (2013). The HBO effect. New York: Bloomsbury Academic. di Grazia, P. (2013). Profile: Netflix. SNL Kagan. Retrieved from:
http://www.snl.com/Interactivex/article.aspx?ID=17005540&KPLT=2 Eastman, S., & Ferguson, D. (2013). Media programming: Strategies and practices
(9th ed.). Australia: Wadsworth.

122
Edgerton, G. (2007). The Columbia history of American television (pp. 274-276). New York: Columbia University Press.
Edgerton, G., & Jones, J. (2009). The essential HBO reader (Paperback ed.).
Lexington, KY: University Press of Kentucky. eMarketer. (2013, April 13). TV advertising keeps growing as mobile boosts digital
video spend. Retrieved September 30, 2013, from http://www.emarketer.com/Article/TV-Advertising-Keeps-Growing-Mobile-Boosts-Digital-Video-Spend/1009780
Goldberg, L. (2015, January 7). Netflix's 'Marco Polo' renewed for second season.
Retrieved January 8, 2015, from http://www.hollywoodreporter.com/live-feed/netflixs-marco-polo-renewed-second-761550
Greene, A. (2013, December 5). How 'Lilyhammer' Changed the TV World. Rolling
Stone. Retrieved December 11, 2013, from http://www.rollingstone.com/movies/news/how-lilyhammer-changed-the-tv-world-20131205
Gunter, B. (2000). CHAPTER 4 MEASURING MEDIA USAGE AND EXPOSURE.
In Media research methods. (pp. 93-135). London, England: SAGE Publications, Ltd. doi: http://dx.doi.org.ezproxy2.library.drexel.edu/10.4135/9780857028983.d4
Hagey, K., & Vranica, S. (2014, November 18). Nielsen to measure Netflix viewing.
Retrieved November 19, 2014, from http://www.wsj.com/articles/nielsen-to-measure-netflix-viewing-1416357093
Hanley Frank, B. (2014, September 18). Analyst: Amazon may have 50 million Prime
members. Retrieved November 19, 2014, from http://www.geekwire.com/2014/amazon-may-50-million-prime-members-according-analyst-estimate/
Harvey, B., & Petrille, A. (2014, May 14). OTT: Netflix, Hulu, and Amazon audience
differences. Retrieved August 2, 2014, from http://www.mediabizbloggers.com/bill-harvey/OTT-Netflix-Hulu-and-Amazon-Audience-Differences----Bill-Harvey-and-Alex-Petrilli.html

123
Hass, N. (2013, February 1). Reed Hastings on Arrested Development, House of Cards, and the Future of Netflix. Retrieved March 8, 2014, from http://www.gq.com/entertainment/movies-and-tv/201302/netflix-founder-reed-hastings-house-of-cards-arrested-development?currentPage=1
Hastings, R. and Wells, D. (2013). Q3 13 Letter to shareholders. Retrieved from:
http://files.shareholder.com/downloads/NFLX/2756670973x0x698482/16B65268-0108-4CA7-96F5-BB4341C75B90/Q313%20Earnings%20Letter%2010.21.13%2010.30am.pdf
Hastings, R. and Wells, D. (2015). Q4 14 Letter to shareholders. Retrieved from:
http://files.shareholder.com/downloads/NFLX/2756670973x0x804108/043A3015-36EC-49B9-907C-27960F1A7E57/Q4_14_Letter_to_shareholders.pdf
Herrman, J. (2011, January 31). Why Nielsen ratings are inaccurate, and why they'll
stay that way. Retrieved November 10, 2014, from http://splitsider.com/2011/01/why-nielsen-ratings-are-inaccurate-and-why-theyll-stay-that-way/
Hesseldahl, A. (2011, June 1). Netflix CEO: $200 million to renew Starz deal
“wouldn’t be shocking”. Retrieved March 9, 2015, from http://allthingsd.com/20110601/netflix-ceo-200-million-to-renew-starz-deal-wouldnt-be-shocking/
Home Box Office core stats. (2015). Retrieved January 21, 2015, from
http://www.timewarner.com/company/operating-divisions/home-box-office Hulkower, B. (2012) Online and streaming video – US – November 2012. Retrieved
from Mintel database. Hulkower, B. (2013) Online and streaming video – US – November 2013. Retrieved
from Mintel database. IBISWorld. (2013). Television Broadcasting in the US Industry Report. Retrieved
October 19, 2013, from IBISWorld database.
124
Jakab, S. (2014, October 14). Netflix's albatross of content costs. Retrieved January 23, 2015, from http://www.wsj.com/articles/netflixs-albatross-of-content-costs-ahead-of-the-tape-1413316829
Kafka, P. (2013, July 13). Your poor couch! Netflix viewers don’t cut back on regular
TV. Retrieved October 10, 2013, from http://allthingsd.com/20130729/your-poor-couch-netflix-viewers-dont-cut-back-on-regular-tv/
Kissell, R. (2014, August 28). Netflix nabs rights to stream hit NBC drama 'The
Blacklist.' Retrieved January 20, 2015, from http://variety.com/2014/tv/news/netflix-nabs-rights-to-stream-hit-nbc-drama-the-blacklist-1201292903/
Leichtman Research Group. (2015, January 2). 76% of US households have a DVR,
Netflix, or use On-Demand. Retrieved January 13, 2015, from http://www.leichtmanresearch.com/press/ 010215release.html
Levin, G. (2015, January 8). Netflix has big plans for 2015 originals. Retrieved
January 10, 2015, from http://www.usatoday.com/story/life/tv/2015/01/06/netflix-2015-lineup/21308665/
Levine-Weinberg, A. (2014, June 4). Netflix Inc. bulls are still underestimating
content costs. Retrieved January 23, 2015, from http://www.fool.com/investing/general/2014/06/04/netflix-inc-bulls-are-still-underestimating-conten.aspx
Li, A. (2014, November 24). Nielsen method for TV ratings missing minorities,
young people. Retrieved December 10, 2014, from http://www.poynter.org/news/mediawire/225876/nielsen-method-for-tv-ratings-missing-minorities-young-people/
Luckerson, V. (2014, December 14). Netflix wants new original content every three
weeks. Retrieved January 10, 2015, from http://time.com/3625164/netflix-originals-three-weeks/
Mair, G. (1988). Inside HBO: The billion dollar war between HBO, Hollywood, and
the home video revolution. New York: Dodd, Mead.

125
McDuling, J. (2015, January 21). This is what Netflix means by “efficient content”. Retrieved January 22, 2015, from http://qz.com/330595/this-is-what-netflix-means-by-efficient-content/
McNeill, B. (2011). Netflix secures rights to original TV series, will debut in late
2012. SNL Kagan. Retrieved from: http://www.snl.com/Interactivex/article.aspx?ID=12508893&KPLT=2
Mentel, T. (2013, November 16). 5 new Netflix-original series set for 2014
premieres. Wall St. Cheat Sheet. Retrieved December 11, 2013, from http://wallstcheatsheet.com/stocks/5-new-netflix-original-series-set-for-2014-premieres.html/?a=viewall
Mentel, T. (2013, November 9). 4 Marvel superheroes set to arrive on original Netflix
shows. Wall St. Cheat Sheet. Retrieved December 11, 2013, from http://wallstcheatsheet.com/stocks/4-marvel-superheroes-set-to-arrive-on-original-netflix-shows.html/
Meyers, D. (2013). Netflix’s content costs climb. SNL Kagan. Retrieved from:
http://www.snl.com/Interactivex/article.aspx?ID=18118790&KPLT=2 Narang, N. (2013, April 19). Concept series: What is the difference between OTT and
IPTV? Retrieved November 8, 2014, from http://www.mediaentertainmentinfo.com/2013/04/2-concept-series-what-is-the-difference-between-ott-and-iptv.html/
Netflix declares binge watching is the new normal. (2013, December 13). Retrieved
August 2, 2014, from http://www.prnewswire.com/news-releases/netflix-declares-binge-watching-is-the-new-normal-235713431.html
Netflix, Inc. (2013, April 22). For 8-K. Retrieved from
http://ir.netflix.com/secfiling.cfm?filingID=1065280-13-11&CIK=1065280. Nielsen. (2011, July 12). What Netflix and Hulu users are watching...and how.
Retrieved January 22, 2015, from http://www.nielsen.com/us/en/insights/news/2011/what-netflix-and-hulu-users-are-watching-and-how.html

126
Nielsen. (2012, June 12). Survey: Netflix users streaming more TV. Retrieved October 16, 2013, from http://www.nielsen.com/us/en/insights/news/2012/survey-netflix-users-streaming-more-tv.html
Nielsen. (2012, October 29). In any language content is king. Retrieved October 16,
2013, from http://www.nielsen.com/us/en/insights/news/2012/in-any-language-content-is-still-king-new-survey-finds-spanish-speaking-us-hispanics-interested-in-more-spanish-language-digital-content.html
Nielsen. Cross-platform report: An era of growth. (2014, March). Retrieved
November 4, 2014, from http://www.nielsen.com/us/en/newswire/2014/cross-platform-report-an-era-of-growth.html
O'Connell, M. (2014, February 4). Netflix renews 'House of Cards' for season 3.
Retrieved February 6, 2014, from http://www.hollywoodreporter.com/live-feed/netflix-renews-house-cards-season-677027
O'Toole, J. (2014, July 22). Netflix now has 50 million subscribers. Retrieved August
5, 2014, from http://money.cnn.com/2014/07/21/technology/netflix-subscribers/
OTT Video Revenue Forecasts, 2011-2017. (2012, November 15) Informa Media
Group. Retrieved October 19, 2013, from https://commerce.informatm.com/reports/ott-video-revenue-forecasts.html
Overview. (2013). Netflix. Retrieved October 27, 2013, from http://ir.netflix.com Pepitone, J. (2011, July 11). Studios are starting to play hardball with Netflix.
Retrieved March 9, 2015, from http://money.cnn.com/2011/07/08/technology/netflix_starz_contract/
Perez, S. (2014, April 30). Hulu, now with 6 million subscribers, will make some TV
episodes free on mobile. Retrieved June 12, 2014, from http://techcrunch.com/2014/04/30/hulu-now-with-6-million-subscribers-will-make-some-tv-episodes-free-on-mobile/

127
Purcell, K. (2013, October 9). Online video 2013. Retrieved April 10, 2014, from http://www.pewinternet.org/2013/10/10/online-video-2013/
Ramachandran, S. (2014, December 16). Twitterverse To Netflix’s “Marco Polo”:
Meh. Retrieved December 20, 2014, from http://blogs.wsj.com/cmo/2014/12/16/twitterverse-to-netflixs-marco-polo-meh/
Reedy, S. (2011, May 18). The 10 over-the-top video commandments. UDM Tech.
Retrieved from http://www.lightreading.com/cable-video/ott/the-10-over-the-top-video-commandments/d/d-id/686857
Roettgers, J. (2014, October 9). Netflix spends $150 million on content
recommendations every year. Retrieved January 2, 2015, from https://gigaom.com/2014/10/09/netflix-spends-150-million-on-content-recommendations-every-year/
Rosenberg, A. (2013, September 23). The golden age of television wasn’t about anti-
heroes. And it isn’t over. Retrieved December 4, 2014, from http://thinkprogress.org/alyssa/2013/09/23/2660791/golden-age-television/
Sandvine Report: Netflix's British invasion. (2014, May 14). Retrieved June 11, 2014,
from https://www.sandvine.com/pr/2014/5/14/sandvine-report-netflix’s-british-invasion.html
Savitz, E. (2011, September 19). Should Netflix keep disclosing churn? Analyst says
yes. Retrieved October 15, 2013, from http://www.forbes.com/sites/ericsavitz/2011/09/19/should-netflix-keep-disclosing-churn-analyst-says-yes/
Sharma, A., & Cheney, A. (2013, September 23). Netflix makes some history with
showing at Emmys. Retrieved October 11, 2013, from http://online.wsj.com/news/articles/SB10001424052702303759604579092061505560526
Smith, D. (2007, July 20). How OTT will change everything. Retrieved January 7,
2015, from http://www.imediaconnection.com/content/15893.asp#multiview
128
Spangler, T. (2013, May 22). Netflix’s ‘Arrested Development’ Has Triple Social Buzz of ‘House of Cards’. Variety. Retrieved December 9, 2013, from http://variety.com/2013/digital/news/netflixs-arrested-development-has-triple-social-buzz-of-house-of-cards-1200486382/
Spangler, T. (2013, May 22). Netflix’s ‘Arrested Development’ Has Triple Social
Buzz of ‘House of Cards’. Variety. Retrieved December 9, 2013, from http://variety.com/2013/digital/news/netflixs-arrested-development-has-triple-social-buzz-of-house-of-cards-1200486382/
Spangler, T. (2014, February 26). Disney to spend $200 mil on Marvel series for
Netflix set to film in New York. Retrieved January 20, 2015, from http://variety.com/2014/biz/news/disney-chief-bob-iger-new-york-gov-andrew-cuomo-set-11-am-et-news-conference-1201121502/
Starz Entertainent. (2011, September 1). Starz Entertainment issues statement on
status of Netflix affiliation agreement renewal discussions. Retrieved March 9, 2015, from http://www.prnewswire.com/news-releases/starz-entertainment-issues-statement-on-status-of-netflix-affiliation-agreement-renewal-discussions-128907398.html
Stelter, B. (2013, November 10). Same time, same channel? TV woos kids who can’t
wait. Retrieved January 22, 2015, from http://www.nytimes.com/2013/11/11/business/media/same-time-same-channel-tv-woos-kids-who-cant-wait.html?pagewanted=1
Stenovec, T. (2014, May 14). Our national Netflix addiction just keeps getting worse.
Retrieved May 14, 2014, from http://www.huffingtonpost.com/2014/05/14/netflix-bandwidth-data_n_5318601.html.html
Sweeny, M. (2014, February 23). Netflix gathers detailed viewer data to guide its
search for the next hit. Retrieved April 10, 2014, from http://www.theguardian.com/media/2014/feb/23/netflix-viewer-data-house-of-cards
Taga, K. & Schwaiger, C. (2012, November 5) Over-the-top video – “First to scale
wins”. Retrieved October 19, 2013, from http://www.adlittle.com/downloads/tx_adlreports/TIME_2012_OTT_Video_v

129
2.pdf The Sopranos - Awards. (2008, January 1). Retrieved January 10, 2015, from
http://www.imdb.com/title/tt0141842/?ref_=ttawd_awd_tt Thomas, O. (2013, March 11). Amazon has an estimated 10 million members for its
surprisingly profitable prime club. Retrieved June 4, 2014, from http://www.businessinsider.com/amazon-prime-10-million-members-morningstar-2013-3
Timeline. (n.d.). Netflix. Retrieved December 9, 2013, from
https://signup.netflix.com/MediaCenter/Timeline Timeline. (n.d.). Netflix. Retrieved December 9, 2013, from
https://signup.netflix.com/MediaCenter/Timeline Top investor questions. (2015). Retrieved January 23, 2015, from
http://ir.netflix.com/faq.cfm#Question31066 Trefis Team. (2013, May 6). A look at Netflix's downside from rising content costs.
Retrieved January 23, 2015, from http://www.trefis.com/stock/nflx/articles/186200/a-look-at-netflixs-downside-from-rising-content-costs/2013-05-16
Trefis Team. (2014, December 29). Why growing content costs are a necessary evil
for Netflix. Retrieved January 20, 2015, from http://www.forbes.com/sites/greatspeculations/2014/12/29/why-growing-content-costs-are-a-necessary-evil-for-netflix/
TV broadcast & cable networks - quarterly update 10/21/2013. (2013). Austin:
Hoover's Inc. Retrieved from http://search.proquest.com/docview/1443710929?accountid=10559
Venable, N. (2014, December 15). Marco Polo review: The most gorgeous thing
you'll ever fall asleep to. Retrieved December 15, 2014, from http://www.cinemablend.com/television/Marco-Polo-Review-Most-Gorgeous-Thing-You-Ever-Fall-Asleep-68951.html

130
Wagstaff, K. (2011, October 24). Netflix loses 800,000 subscribers after price hike,
Qwikster debacle. Retrieved March 9, 2015, from http://techland.time.com/2011/10/24/netflix-loses-800000-subscribers-after-price-hike-qwikster-debacle/
Wallenstein, A. (2013, March 8). Netflix series spending revealed. Retrieved January
22, 2015, from http://variety.com/2013/digital/news/caa-agent-discloses-netflix-series-spending-1200006100/
Warren, C. (2013, April 30). Netflix will lose almost 2,000 movies Wednesday.
Retrieved March 9, 2015, from http://mashable.com/2013/04/30/netflix-streamageddon-2013/
Webster, J. (2008). Nielsen Ratings. In W. Donsbach (Ed.), The international
encyclopedia of communication (pp. 3318 - 3320). Malden, MA: Blackwell Publishing.
Wei-Skillern, J, & Maciano, S. (2008) A primer on the U.S. television industry. HBS
No. 9-308-128. Boston, MA: Harvard Business School. Zacks Equity Research. (2015, January 8). Netflix to air The Interview, Daredevil,
Marco Polo this year. Retrieved January 23, 2015, from http://www.zacks.com/stock/news/159792/netflix-to-air-the-interview-daredevil-marco-polo-this-year
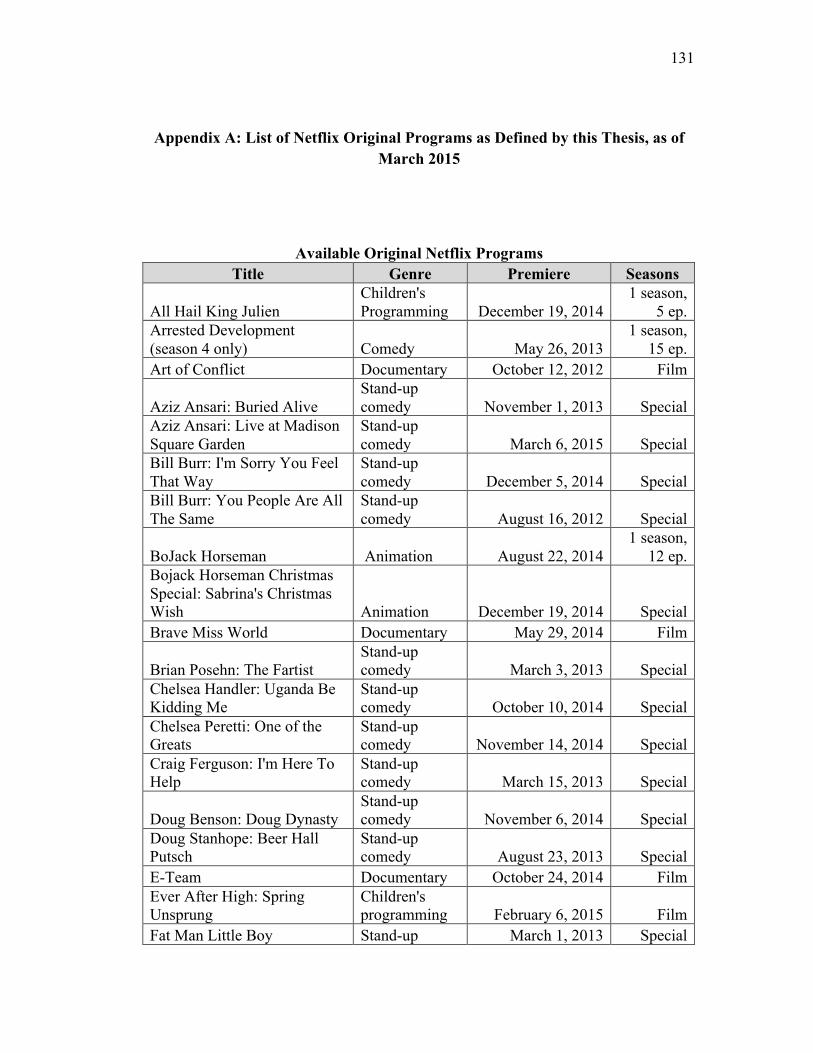
131
Appendix A: List of Netflix Original Programs as Defined by this Thesis, as of March 2015
Available Original Netflix Programs Title Genre Premiere Seasons
All Hail King Julien Children's Programming December 19, 2014
1 season, 5 ep.
Arrested Development (season 4 only) Comedy May 26, 2013
1 season, 15 ep.
Art of Conflict Documentary October 12, 2012 Film
Aziz Ansari: Buried Alive Stand-up comedy November 1, 2013 Special
Aziz Ansari: Live at Madison Square Garden
Stand-up comedy March 6, 2015 Special
Bill Burr: I'm Sorry You Feel That Way
Stand-up comedy December 5, 2014 Special
Bill Burr: You People Are All The Same
Stand-up comedy August 16, 2012 Special
BoJack Horseman Animation August 22, 2014 1 season,
12 ep. Bojack Horseman Christmas Special: Sabrina's Christmas Wish Animation December 19, 2014 Special Brave Miss World Documentary May 29, 2014 Film
Brian Posehn: The Fartist Stand-up comedy March 3, 2013 Special
Chelsea Handler: Uganda Be Kidding Me
Stand-up comedy October 10, 2014 Special
Chelsea Peretti: One of the Greats
Stand-up comedy November 14, 2014 Special
Craig Ferguson: I'm Here To Help
Stand-up comedy March 15, 2013 Special
Doug Benson: Doug Dynasty Stand-up comedy November 6, 2014 Special
Doug Stanhope: Beer Hall Putsch
Stand-up comedy August 23, 2013 Special
E-Team Documentary October 24, 2014 Film Ever After High: Spring Unsprung
Children's programming February 6, 2015 Film
Fat Man Little Boy Stand-up March 1, 2013 Special

132
comedy HANK: 5 Years From The Brink Documentary September 16, 2013 Film
Hemlock Grove Horror/thriller April 19, 2013 2 seasons,
23 ep. House of Bodies Action April 19, 2013 Film
House of Cards Drama February 1, 2013 3 seasons,
39 ep.
Iliza Shlesinger: Freezing Hot Stand-up Comedy January 23, 2015 Special
Jim Jeffries: Bare Stand-up comedy August 29, 2014 Special
John Caparulo: Come Inside Me
Stand-up comedy September 5, 2013 Special
John Hodgman: Ragnarok Stand-up comedy June 20, 2013 Special
Lilyhammer Comedy-drama February 6, 2012 3 seasons,
24 ep.
Marc Maron: Thinky Pain Stand-up comedy October 7, 2013 Special
Marco Polo Drama December 12, 2014 1 season,
10 ep. Mike Birbiglia: My Girlfriend's Boyfriend
Stand-up comedy August 23, 2013 Special
Mission Blue Documentary August 15, 2014 Film Mitt Documentary January 24, 2014 Film Moshe Kasher: Live in Oakland
Stand-up comedy October 26, 2012 Special
My Own Man Documentary March 6, 2015 Film Nick Offerman: American Ham
Stand-up comedy December 12, 2014 Special
Orange Is the New Black Comedy-drama July 11, 2013 2 seasons,
26 ep. Percentage Action April 24, 2013 Film Print the Legend Documentary September 26, 2014 Film
Ralphie May: Unruly Stand-up comedy February 27, 2015 Special
Richie Rich Children's Programming February 20, 2015
1 season, 10 ep.
Rob Schneider: Soy Sauce and the Holocaust
Stand-up comedy August 1, 2013 Special
Russell Peters Vs. The World Documentary October 14, 2013 Miniseries
(4 ep.)
Russell Peters: Notorious Stand-up comedy October 14, 2013 Special

133
Shotgun Wedding Comedy April 1, 2013 Film Star Wars: The Clone Wars (season 6 only) Animation March 7, 2014
1 season, 13 ep.
The Adventures of Puss in Boots
Children's Programming January 16, 2015
1 season, 5 ep.
The Battered Bastards of Baseball Documentary July 11, 2014 Film The Fabulous Ice Age Documentary February 3, 2014 Film
The Killing (season 4 only) Drama August 1, 2014 1 season,
6 ep. The Lady in Number 6 Documentary April 4, 2014 Film The Problem Solverz (season 2 only)
Children's Programming March 30, 2013
1 season, 8 ep.
The Short Game Documentary December 12, 2013 Film The Square Documentary January 17, 2014 Film The Zen of Bennett Documentary November 12, 2012 Film This is Not a Ball Documentary June 13, 2014 Film Trailer Park Boys (season 8 only) Mockumentary September 5, 2014
1 season, 10 ep.
Trailer Park Boys Live at the North Pole Mockumentary November 15, 2014 Special Trailer Park Boys Live In F**kin´ Dublin Mockumentary June 1, 2014 Special Trailer Park Boys Swearnet Live Mockumentary October 1, 2014 Special
Turbo FAST Children's Programming December 24, 2013
1 season, 26 ep.
Unbreakable Kimmy Schmidt Comedy March 6, 2015 1 season,
13 ep.
VeggieTales in the House Children's Programming November 26, 2014
1 season, 10 ep.
Virunga Documentary November 7, 2014 Film
Wyatt Cenac: Brooklyn Stand-up comedy October 21, 2014 Special

134
Renewed Netflix Original Series
Announced Netflix Original Programs
Title Genre Premiere Format A Series of Unfortunate Events
Comedy-Drama TBA Series
A.K.A. Jessica Jones Action-Drama 2015 Series B.O.O. (Bureau of Otherworldly Operations) Animation TBA Series
Beasts of No Nation War drama film 2015 Film
Between Drama May 21, 2015 Series Bloodline Drama March 20, 2015 Series Care Bears and Cousins Animation 2016 Series Chef's Table Documentary 2015 Series Chelsea Handler Docu-Series Documentary 2015 Miniseries Chelsea Handler Talk Show Talk Show 2016 Series
Chris D'Elia: Incorrigible Stand-up comedy April 17, 2015 Series
Club de Cuervas
Spanish-language Comedy 2015 Series
Crouching Tiger, Hidden Action August 28, 2015 Film
Title Genre Premiere Trailer Park Boys season 9 Mockumentary March 27, 2015 Hemlock Grove season 3 (final season) Horror/thriller 2015 Orange Is the New Black season 3 Comedy-drama June 12, 2015 DreamWorks Dragons season 4 Animation TBA Dinotrux season 2 and season 3 Animation TBA BoJack Horseman season 2 Comedy-drama TBA VeggieTales in the House season 2 and 3 Animation TBA Marco Polo season 2 Drama TBA Unbreakable Kimmy Schmidt season 2 Comedy TBA

135
Dragon II: The Green Legend Daredevil Action-Drama April 10, 2015 Series
Dinotrux Children's Programming Spring 2015 Series
DreamWorks Dragons (season 3)
Children's Programming Spring 2015 Series
Ever After High Children's Programming 2015 Series
F Is for Family Children's Programming 2015 Series
Flaked Comedy 2016 Series Grace and Frankie Comedy May 8, 2015 Series Iron Fist Action-Drama TBA Series Jadotville Action TBA Film Jen Kirkman: I'm Gonna Die Alone (And I Feel Fine)
Stand-up comedy May 22, 2015 Special
Justin Time: The New Adventures Animation 2016 Series Kong Animation 2016 Film Kong: King of the Apes Animation 2016 Series
Little Wizard Tao Children's Programming Fall 2015 Series
Longmire (season 4 only) Crime drama 2015 Series Love Comedy 2016 Series Luke Cage Action-Drama TBA Series
Marseille
French-language drama 2015 Series
Narcos Drama 2015 Series Pee Wee's Big Holiday Comedy TBA Film
Popples Children's Programming 2015 Series
Ridiculous 6 Comedy 2015 Film Sense8 Sci-fi-drama June 5, 2015 Series The Crown Drama 2016 Series The Defenders Superhero TBA Miniseries The Get Down Drama 2016 Series The Legend of Zelda Fantasy TBA Series The Magic School Bus 360° Animation 2016 Series The OA Drama 2016 Series Untitled Adam Sandler film Comedy TBA Film Untitled Adam Sandler film Comedy TBA Film Untitled Adam Sandler film Comedy TBA Film

136
Untitled Duplass Brothers film Comedy TBA Film Untitled Duplass Brothers film Comedy TBA Film Untitled Duplass Brothers film Comedy TBA Film Untitled Duplass Brothers film Comedy TBA Film Wet Hot American Summer Comedy July 17, 2015 Series What Happened, Miss Simone? Documentary June 26, 2015 Film Winx Club WOW: World of Winx
Children's Programming Early 2016 Series

137
Appendix B: Netflix Streaming Consumer Survey Note: Below is Netflix consumer survey, but not all participants saw all questions.
Display logic is included in brackets and highlighted.
What is your gender? m Female m Male What is your age? Where are you located? m United States m United Kingdom m Norway m Denmark m Ireland m Sweden m Mexico m Brazil m Finland m Canada m Netherlands m France m Germany m Other ____________________

138
What is your primary language (i.e., the one you speak most of the time)? m English m Spanish m Chinese m French m German m Dutch m Japanese m Hebrew m Swedish m Portuguese m Other (specify) ____________________ What is your race? m White or Caucasian m Black or African American m Hispanic or Latino m Asian m Native American m Pacific Islander m Other How many children under 16 years old live in your household? m None m 1 m 2 m 3 m 4 or more

139
[Answer If Where are you located? United States Is Selected] Please indicate your current household income in U.S. dollars m Rather not say m Under $10,000 m $10,000 - $19,999 m $20,000 - $29,999 m $30,000 - $39,999 m $40,000 - $49,999 m $50,000 - $74,999 m $75,000 - $99,999 m $100,000 - $150,000 m Over $150,000 How long ago did you first use Netflix streaming? m Less than 6 months m 6 to 12 months m 1 to 3 years m 4 to 6 years m 7 years or more Why did you begin using Netflix? m There was a specific exclusive program I wanted to watch m Someone recommended I try it m I wanted access to its large content catalog m Other ____________________ [Answer If Why did you begin using Netflix? There was a specific exclusive program I wanted to watch Is Selected] What program made you want to join? How often do you use Netflix streaming? m Never m Less than Once a Month m Once a Month m 2-3 Times a Month m Once a Week m 2-3 Times a Week m Daily

140
[Answer If How many children under 16 years old live in your household? None Is Not Selected] How often do the children in your household use Netflix? m Never m Less than Once a Month m Once a Month m 2-3 Times a Month m Once a Week m 2-3 Times a Week m Daily Who pays (or paid) for your Netflix streaming access? q Self q Significant Other q Friend q Relative q Other If you have ever stopped using Netflix streaming or suspended your subscription, why did you do so? m The person who pays for my subscription (other than myself) suspended it m I could no longer afford the subscription m I was not interested in the available programs m I had no free time to watch Netflix m Other ____________________ m I have never suspended my Netflix usage [Answer If If you have ever stopped using Netflix streaming or suspended your subscription, why did you do so? I have never suspended my Netflix usage Is Not Selected] If you have ever rejoined Netflix streaming after leaving the service, why did you do so? q The person who pays for my subscription (other than myself) rejoined q I could again afford the subscription q Netflix gained more content I wanted to watch q I had more free time to watch Netflix q Netflix announced or released a specific exclusive program I wanted to see q I did not rejoin Netflix

141
[Answer If If you have ever rejoined Netflix streaming after leaving the service, why did you do so? Netflix announced or released a specific exclusive program I wanted to see Is Selected] What program made you want to rejoin? [Answer If What program made you want to rejoin? Text Response Is Displayed] Did you end your subscription again immediately after finishing that program? m Yes m No Which of the following content services do you use? q HBO q Showtime q Starz q Hulu q Amazon Instant Video q None of these Please rate the importance of the following activities or features to the value of your Netflix access. (0-5) ______ Catching up on or re-watching currently broadcasted TV Shows ______ Discovering old or no longer broadcasted programs to watch ______ Viewing new movies ______ Viewing old or classic movies ______ Watching Netflix Originals ______ Watching exclusive shows that are not legally available anywhere else in my location ______ Watching content in languages other than English ______ Access to children’s programming for the children in my household ______ Always having something new to watch Please rate your satisfaction with the following. (1-5) ______ Netflix's entire content collection ______ Netflix's original programming collection Which feature is most important to your satisfaction with Netflix? m Having access to a large catalog of titles m Having access to titles that are not available anywhere else m Having access to the newest and most popular TV shows and movies

142
Please answer the following questions about content. How often do you watch the following genres (on
or off Netflix)? Does Netflix need to add more of the
following to its collection?
Never Rarely Sometimes Often All of
the Time
Yes No
Children's Programming m m m m m q q
Documentaries m m m m m q q Content in Languages Other Than
English
m m m m m q q
Comedies m m m m m q q Dramas m m m m m q q Sci-fi or Fantasy m m m m m q q
Action m m m m m q q Animation or
Anime m m m m m q q
Reality m m m m m q q Talk Shows m m m m m q q
Stand-up Comedy Specials
m m m m m q q
Films m m m m m q q TV series m m m m m q q
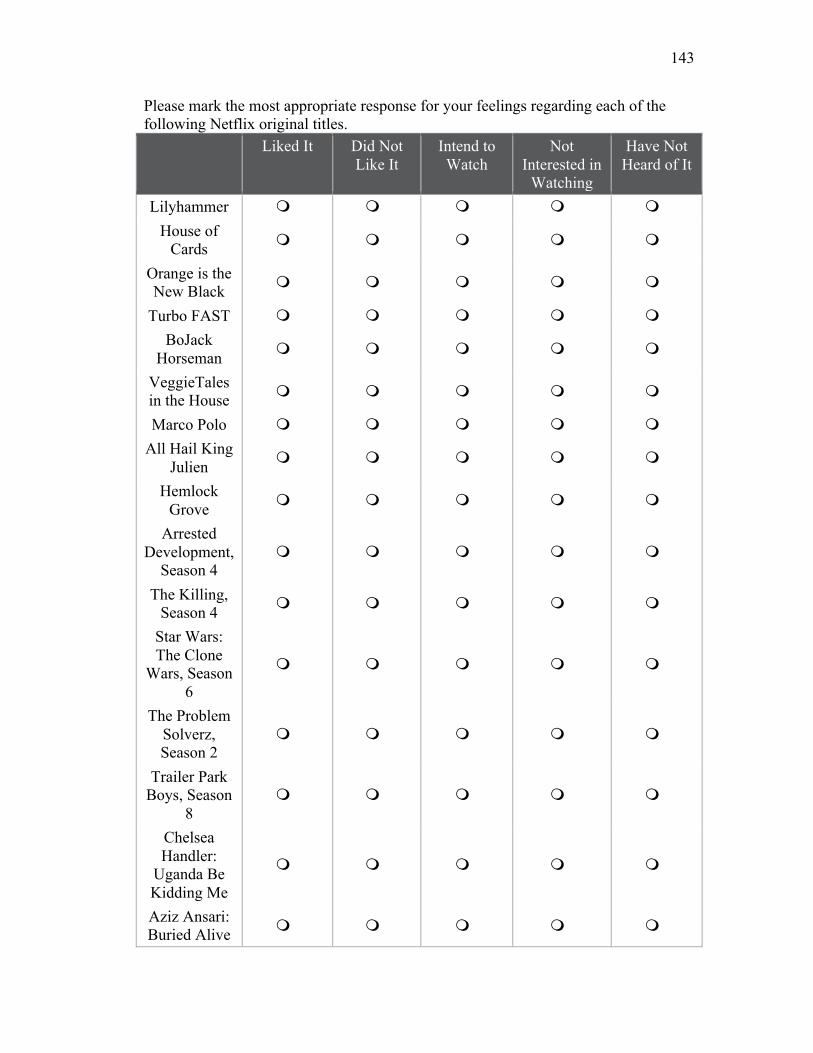
143
Please mark the most appropriate response for your feelings regarding each of the following Netflix original titles.
Liked It Did Not Like It
Intend to Watch
Not Interested in
Watching
Have Not Heard of It
Lilyhammer m m m m m House of
Cards m m m m m
Orange is the New Black m m m m m
Turbo FAST m m m m m BoJack
Horseman m m m m m
VeggieTales in the House m m m m m
Marco Polo m m m m m All Hail King
Julien m m m m m
Hemlock Grove m m m m m
Arrested Development,
Season 4 m m m m m
The Killing, Season 4 m m m m m
Star Wars: The Clone
Wars, Season 6
m m m m m
The Problem Solverz, Season 2
m m m m m
Trailer Park Boys, Season
8 m m m m m
Chelsea Handler:
Uganda Be Kidding Me
m m m m m
Aziz Ansari: Buried Alive m m m m m

144
Bill Burr: You People Are All The
Same
m m m m m
Mike Birbiglia: My Girlfriend’s Boyfriend
m m m m m
E-Team m m m m m Mitt m m m m m
The Lady in Number 6 m m m m m
The Square m m m m m [Answer If Where are you located? United States Is Not Selected] Please select the statement that best describes your opinion of the following content distributors' original programming.
They're mostly great.
They're mostly okay.
They're mostly bad or
uninteresting.
I am not familiar with or have no opinion of
them. HBO m m m m
Showtime m m m m Starz m m m m
Netflix m m m m Amazon
Instant Video m m m m
Hulu m m m m
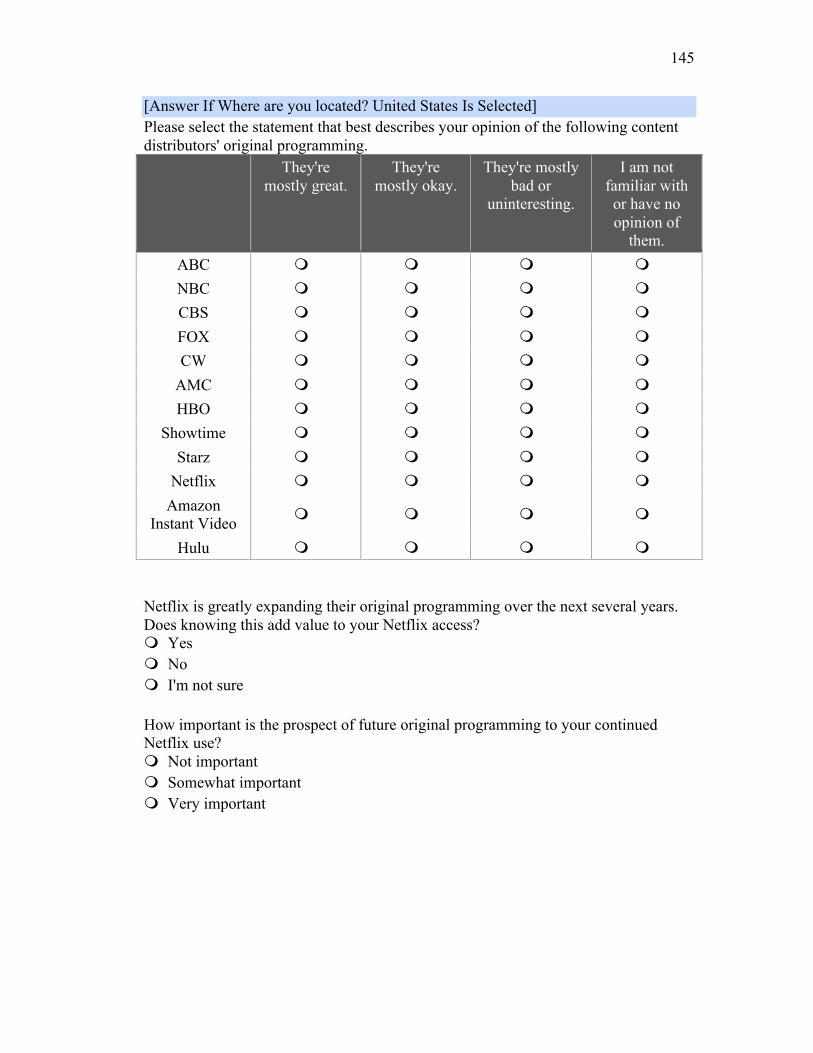
145
[Answer If Where are you located? United States Is Selected] Please select the statement that best describes your opinion of the following content distributors' original programming.
They're mostly great.
They're mostly okay.
They're mostly bad or
uninteresting.
I am not familiar with or have no opinion of
them. ABC m m m m NBC m m m m CBS m m m m FOX m m m m CW m m m m
AMC m m m m HBO m m m m
Showtime m m m m Starz m m m m
Netflix m m m m Amazon
Instant Video m m m m
Hulu m m m m Netflix is greatly expanding their original programming over the next several years. Does knowing this add value to your Netflix access? m Yes m No m I'm not sure How important is the prospect of future original programming to your continued Netflix use? m Not important m Somewhat important m Very important
