street weapons commission: guns, knives and … · collate the best available data capable of...
TRANSCRIPT
1
Street Weapons Commission: Guns, Knives and Street Violence Professor Peter Squires and Arianna Silvestri with Dr Roger Grimshaw and Enver Solomon
June 2008

2
Acknowledgements The authors would like to thank the following for their time, supply of information and advice whilst compiling this report: Strathclyde Police Violence Reduction Unit Tom Harper, Mail on Sunday Stephen Fidler, Financial Times Jonathon Toy, Southwark Borough Council Paul Dawson, Carol Eniffer and Kathryn Coleman (Home Office) Betsy Stanko of the Metropolitan Police Service Nina Vaswani, Glasgow City Council Zoe Crane, Islington Borough Council About the authors Peter Squires is Professor in Criminology and Public Policy at the University of Brighton. Arianna Silvestri is research and policy intern at the Centre for Crime and Justice Studies. Dr Roger Grimshaw is research director at the Centre for Crime and Justice Studies and Enver Solomon is deputy director. Produced by: Centre for Crime and Justice Studies King’s College, London Strand London WC2R 2LS Tel: 020 7848 1688 Fax: 020 7848 1689 www.crimeandjustice.org.uk The Centre for Crime and Justice Studies at King’s College London is an independent charity that informs and educates about all aspects of crime and criminal justice. We provide information, produce research and carry out policy analysis to encourage and facilitate an understanding of the complex nature of issues concerning crime. Registered Charity No 251588 A Company Limited by Guarantee Registered in England No 496821 This report was commissioned by Channel 4 television for its Street Crime Weapons Commission. The copyright is owned by Channel 4.
3
Contents Introduction: the purpose of this report 4 Guns, knives and violence – an overview 8 Guns and violence: a national profile Knives and violence: a national profile Gangs: a national perspective Key themes and issues: commentary London: Metropolitan Police Area 29 Overall violent crime in London Murders in London Weapon-enabled crime in London ‘Gangs’ in London Key issues and key facts: London Manchester and Greater Manchester Police Area 44 Manchester Multi-Agency Gangs Strategy (MMAGS) Key issues and key facts: Manchester Birmingham and West Midlands Police Area 53 Key issues and key facts: Birmingham Liverpool and Merseyside Police Area 57 Violent crime in Liverpool Firearms offences in Merseyside Gangs Young people’s perceptions Key issues and key facts Glasgow and Strathclyde Police Area 72 Violent crime in Scotland and Strathclyde Violent crime in Glasgow Knife crime Murders Gun crime The violence reduction unit Key issues and key facts Guns and violence in four English cities 88 Comparisons between English cities The Tackling Gangs Action Programme Summary Concluding issues 105
4
Introduction: the purpose of this report The purpose of this report is to provide the Channel 4 Street Weapons Commission with an informed analysis of patterns and significant trends in ‘gun and knife crime’ across the country and also to focus specifically on five major cities - London, Birmingham, Manchester, Liverpool, and Glasgow - over at least three years. In order to achieve this we have collated national and city-wide recorded crime statistics for the current and previous two years. Statistics have also been obtained from the Home Office and, where necessary, from separate police forces. In addition, local studies in the cities have been collated from the police forces and from local researchers. Where the evidence was available, we also sought police performance data detailing the impact of police interventions. An interim report of 10 to 12 pages was to be produced to provide background information to the Commission, and a final report, this report, was to present a more comprehensive analysis of trends and local differences in the recorded crime statistics whilst also collating the findings of local research reports and studies. The report would also provide a demographic analysis of those accused of gun- and knife-related crimes and, where possible, available victimisation data. The final report was to be up to 40 pages long. The fact that the interim report ran to over 40 pages and that this final report exceeds 100 suggests that there is no shortage of data, but that the issues are often complex and involved, and the data do not always easily speak for themselves but require careful interpretation. There are important gaps: for example, English and Welsh police forces were not required by the Home Office to collect knife crime data until 2007. In London, by contrast, although the Metropolitan Police have been collecting such data since 2003, in the midst of our recent ‘knife crime crisis’, the police figures seem to show knife crimes to be falling and few think them reliable indicators of the trend.1 Likewise, the police recorded crime data are generally collected and made available at the police force level. While the Metropolitan Police is generally (with the exception of the City of London Police district) coterminous with Greater London, the same is not true of Greater Manchester Police (covering a substantially larger area than the City of Manchester alone), Merseyside Police (extending beyond Liverpool) West Midlands Police (rather more extensive than Birmingham) and Strathclyde Police (covering rather more than just Glasgow). Generally speaking, police forces were often either unable or unwilling to provide city-level data of the type necessary to enable us to be able to make neat, city-based comparisons, although Home Office staff were able to help us to fill some of these gaps.
1 Given the significance of the knife crime history associated with Glasgow, these data have been collected more consistently in the city for a much longer time. It is also worth noting that reference to Glasgow and to Strathclyde Police also involves us making comparisons across differing legal jurisdictions and political authorities.
5
With these kinds of considerations in mind, in the following pages we attempt to fulfil three related aims:
1. Collate the best available data capable of throwing light upon the nature, scale and relevant trends concerning young people and weapon-related violence. While the questions about scale and trends privilege the use of quantitative data, we will also be employing some more qualitative and experiential material to explain and explore issues further.
2. Interpret what the data is telling us, recognising that it is not always
consistent, compatible or comparable. Data are often collected at different times for different purposes and may be more or less reliable, and sometimes the priorities and perspectives of the agencies undertaking the data collection may compromise the utility of that which is collated – they may not tell us what they claim or what we think.
3. Finally we intended to indicate where the gaps in the evidence base
lie, as well as suggesting how those gaps may be filled and, where possible, what the evidence is likely to look like.
It is fair to say that, at one level, there was no shortage of information and commentary available to us as we set about the task of collating this report. But whether the data was always especially appropriate or ‘fit for purpose’ was another matter. Throughout the period during which this report was being compiled, virtually every other news bulletin, every day, featured stories about another person, often young, being stabbed or shot on Britain’s apparently dangerous streets. Furthermore, every few days we had new governmental announcements about ‘knife crime’, the preoccupation of the moment. This has included: new police powers to search for weapons, calls for stiffer sentencing, and proposals to reduce the age at which the presumption in favour of prosecuting young people for carrying knives applies. MPs have even discussed a suggestion, drawing upon findings about the lethality of stabbings presented in the British Medical Journal,2 that cutlery manufacturers be encouraged to produce knives without points because it is the action of stabbing, with a pointed implement, which seems especially responsible for the lethality of so many knife attacks. Finally, in the midst of this growing concern about knife crime, the government also published the results of its 2007-08, Tackling Gangs Action Plan (TGAP) and disseminated its new ‘practical guide’ for tackling gangs.
2 Konig, T. and Knowles, C. H. (2006), ‘Stabbing: data support public perception’, British Medical Journal. Accessed at: http://www.bmj.com/cgi/content/full/333/7569/652
6
Drafting this report in such a climate has been like trying to negotiate a river crossing in full flood. The dangers associated with such a fast flowing and furious political climate when trying to convey a message that sits at odds with the mainstream public discourse are all too well illustrated by the case of the Children’s Commissioner for England, Sir Al Aynsley-Green, who cautioned against what he called the heavy handed police tactics being proposed to tackle the carrying of weapons, chiefly knives, by young people. The tabloid media had a field day, a triumph of contrived misunderstanding likened his comment to the suggestion that the police might ‘go soft’ on criminals for fear of upsetting them. Yet Sir Al’s comments reflected a not entirely unfamiliar (but more sophisticated) notion that the criminal justice system should seek, first, to do less harm and avoid demonising young people in general and, second, to address more effectively the underlying causes of youth exclusion and the issues – conflict, fear and violence – so closely associated with it. And it is here that our first key observation regarding the issues of weapon use and youth violence, and the veritable tsunami of comment, policy and proposals they appear to be provoking, needs to be registered. The youth violence issue is overwhelmingly constructed as a criminal justice problem, as if it were amenable to criminal justice solutions alone, something which more or tougher punishment, stronger laws or more police stop and search intervention might solve. It is deeply concerning that, to the extent that youth violence is construed as a ‘law and order’ problem, other potentially more effective and enduring policy responses tend to become sidelined in a self-defeating rush to ‘police’ the crisis, ‘enforce’ order and ‘punish’ the already marginal. In the face of complex problems, difficult evidence or even gaps in the evidence, commentators sometimes opt for the comfort of simple solutions – especially in a mediated political culture where the soundbite is king. With that in mind, we also have an implicit fourth aim in our report, one which has, in part, contributed to its length. This has concerned the need to present the evidence we have found in all its diversity but also develop an informed commentary upon it that understands its place and significance and acknowledges its various causes and contexts – always trying to do justice to the complexity of these issues. We return to these issues throughout the city-by-city sections of the report, having considered evidence about the social characteristics of our most violent young people and the contexts in which their violence choices appear most prevalent. In considering the five cities - Birmingham, Glasgow, Liverpool, London and Manchester - we do not overlook national differences in the way policy is developed and statistics are compiled in the separate jurisdictions and political systems of England and Wales and Scotland. Indeed, the very uniqueness of the history and culture of knife violence in Glasgow forms a significant part of our argument that different places have different cultures of violence which need to be considered in context. If, therefore, the details of the

7
report appear at times to be somewhat biased towards the English case, this simply reflects the greater number of English cities in the sample, not the significance of the picture in Scotland.

8
Guns, knives and violence – an overview Overall, levels of violent crime in England and Wales have fallen by 31% between 1997 and 2006-07, according to the British Crime Survey (BCS). Incidents of wounding (more serious injury) have fallen by 26% since 1997, while assaults resulting in minor injury fell by 52%.3 The recent Home Office Action Plan for Tackling Violence: 2008-2011 makes the point that although violent crime has been falling overall (according to the BCS) serious violence has been the most resistant to improvement. This is significant because violence, above all other crime, is what drives public concern. To adopt Zimring and Hawkins’s phrase, ‘crime is not the problem’.4 Violence is a potent symbol of conflict and social division: violence sends a powerful signal.5 It is the strength of this signal, and the fear and concern that it evokes, which explains the determination expressed in the Home Secretary’s Foreword to the Action Plan: ‘Our commitment is that, by 2011, we will have reduced gun and gang-related violence, [and] knife crime … and improved the criminal justice response to these offences.’ It has to be said that things did not get off to an auspicious start for the government. No sooner was the document published than the country appeared to plunge headlong into the ‘knife crime crisis’ that we have already referred to. First, however, it is necessary to reflect upon the reliability of contemporary crime statistics given: (i) the explicit scepticism voiced in some areas about the reliability of crime data which appear to show violence rates are falling (ii) public perceptions (fuelled in part by the media) that violence rates are increasing and (iii) alternative sources of data (youth self-report surveys and hospital accident and emergency admissions) which paint a different picture of our violence trends. The reliability of crime figures The police recorded crime6 figures for violent crime show an overall rise since 1997, which can be attributed in part to changes in crime recording practices.
3 Nicholas, S., Kershaw, C.and Walker, A. (2007) Crime in England and Wales 2006/7, London: Home Office. 4 F.E. Zimring and G. Hawkins (1997), Crime is Not the Problem: Lethal Violence in America, Oxford University Press. 5 Innes, M. (2004), ‘Signal crimes and signal disorders: notes on deviance as communicative action’, British Journal of Sociology, 55, p.335. 6 Police recorded crimes are those suspected offences that the police document during the course of their activities. Much of this data comes about as a result of members of the public reporting incidents. It is limited in its reliability because of a number of factors, including: much criminal activity does not get reported to the police, is not detected, or does not get recorded by the police. Moreover, changes in recording practices (which may mean, for example, that more or new offences are included in the records) make it difficult to compare data historically. Trends in police data are also susceptible to changes in the way the police go about their activities, in Home Office requirements and in the way suspected crimes are recorded. Victimisation surveys

9
Increases in reporting levels have also contributed to this rise. However, for the most serious violent offences, which include murder and grievous bodily harm, police recorded figures become much more reliable because they tend to be reported and recorded more consistently. Likewise, it seems reasonable to assume that more serious injuries are more likely to require hospital attendance. Following year on year increases since 1997, we have seen decreases in these offences in each of the last three years, including a 9% fall between 2005-06 and 2006-07 (see Figure 1). An index of violence Figure 1 details percentage indices for both British Crime Survey reports and police recorded crime for a range of types of violence. All the trends in Figure 1 are percentage indices (the percentage index is based upon the relevant 1997 figure; each subsequent year is recorded as a percentage of the 1997 figure. Representing the information in this way is a particularly useful method of showing comparative trends in different offence types).
(British Crime Survey (BCS) in England and Wales) and Scottish Crime and Victimisation Survey (SCVS)) were developed in part because of the recognition that police recorded crime data can only provide a partial picture of crime levels and trends. They are based on large samples (about 50,000 people in England and Wales) and individuals are asked about their experience of being a victim of certain types of crimes over the course of the previous 12 months. Most commentators agree that such surveys provide a more reliable estimate of the offences they cover than that given by police recorded data. However, the range of offences covered by the BCS is narrower than police data. It also tends to underestimate some of the offences it covers (e.g. domestic violence),and persons under 16 do not form part of the survey.
10
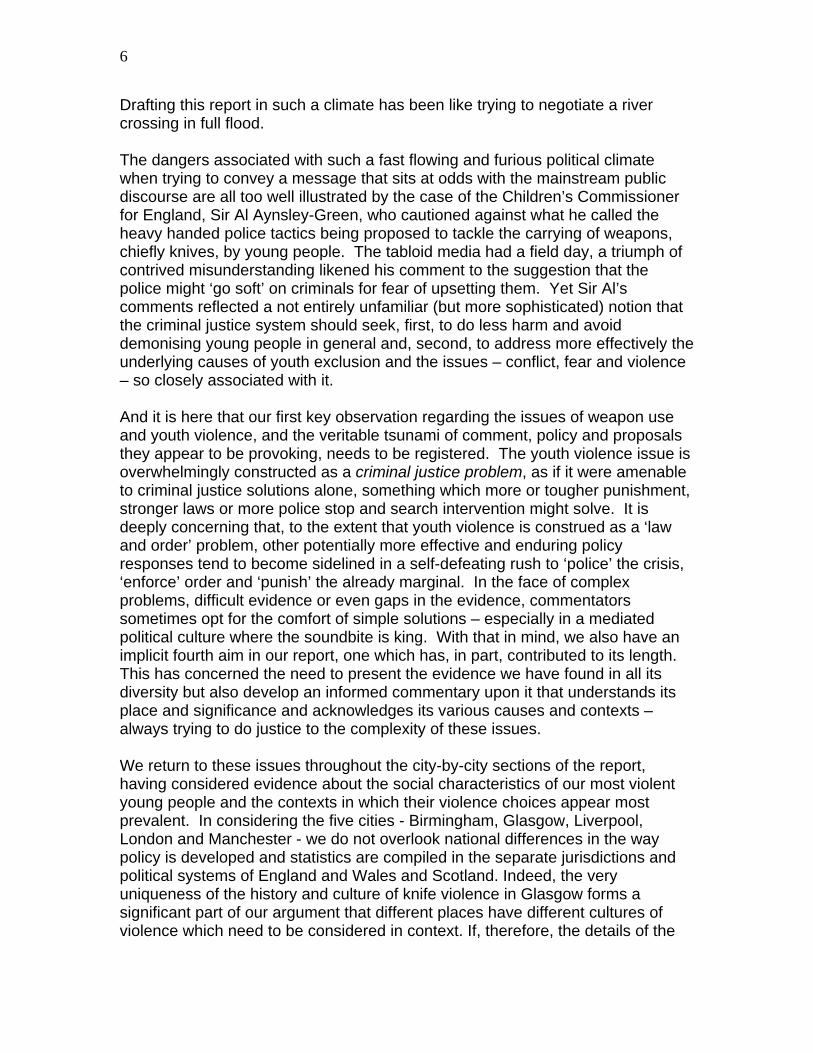
Figure 1: National Violence Index: trends in police recorded violence and BCS reports of violent offences7 (With the exception of weapon possession, which is indexed to 1998-99, all the other trends are indexed to 1997)
40
60
80
100
120
140
160
180
1997 1997-98
1998-99
1999-00
2000-01
2001-02
2002-03
2003-04
2004-05
2005-06
2006-07
All BCS ViolenceBCS WoundingBCS Violence with injuryMurderGun murderAll serious violenceWeapon possession
The striking issue revealed by the graph in Figure 1 is that over the past six years the British Crime Survey reports of violence all appear to have fallen significantly (typically by almost 30%) compared with 1997, providing a national perspective on declining levels of violence which the government has been keen to claim credit for. By contrast, police recorded violence, even though it is acknowledged as a partial record of offending, shows increases generally in excess of 20% as compared with 1997 figures. (In particular, the number of serious violent offences recorded by the police increased by 35 per cent between 1997 and 2006-2007, although it declined by 9 per cent between 2005-06 and 2006-07.8) Gun murder has risen and fallen particularly sharply.9 The implication is that the BCS, with its supposedly representative national sample of respondents, no longer adequately represents the most heavily victimised sections of the community which are bearing a disproportionate share of the crime recorded by the police. In a sense this has always been true in that the British Crime Survey has not included the victimisation of under-16s, the social group – especially young males –
7 Sources: British Crime Surveys and national police recorded crime data. N.B. The data in each trend line represents a percentage index based upon 1997 providing a full decade’s trend. The three BCS lines (although still indexed on the 1997 BCS figure) are not complete because (i) the BCS was not run annually until 2001-02 (ii) there was some reclassification of offences in the intervening period – in particular the BCS "violence involving injury" figure was not reported on prior to 2001, and (iii) figures were statistically recalibrated in the light of 2001 census data. The overall effect of the latter changes artificially disrupts the statistical trends before and after 2001. As a result, for clarity’s sake, we have chosen to show the BCS trends only after 2001. 8 Nicholas, S., Kershaw, C. and Walker, A. (2007) Crime in England and Wales 2006/7, London: Home Office, Table 2.01. 9 Figures for gun homicide will fluctuate more because the numbers are substantially lower than all the other offence types in Figure 1, peaking at 91 gun homicides in 2001-02, and falling sharply during the following two years.
11
experiencing the highest rates of violence victimisation. In an effort to address these important gaps in the survey the Home Office has recently announced that under-16s will, in future, be included within the BCS.10 A second factor in the way the British Crime Survey captures rates of violence concerns the redistribution of violent victimisation over the past two to three decades. Tim Hope11 has described the concentration of violence in the poorest sections of society whilst Dorling12 has shown how murder rates are also concentrated in the poorest and most deprived communities. Taken together this evidence suggests that violence rates amongst young people in poor areas will be quite disproportionate compared to any notional ‘average’ rate of violence. Measuring the ‘average’, as the British Crime Survey has done successfully for many years now, is likely to mislead us. It is important, therefore, to develop more contextualised understandings of localised violence rates and patterns. This is one of the merits of the city-by-city approach adopted in this enquiry. The validity of a city-by-city approach is to some extent underpinned by the following graph (Figure 2) which provides violence profiles for the four English police force areas containing cities in this survey. The opportunity to make comparisons across the English cities stems from access to a common dataset, and we have therefore treated Glasgow and Strathclyde Police Force Area as a separate case.
10 Home Office Press Release, 14 May 2008. ‘British Crime Survey extended to under-16s as design experts meet to tackle youth crime’. http://press.homeoffice.gov.uk/press-releases/Youth-Crime 11 Hope, T. (2001), ‘Crime victimisation and inequality in risk society’, in Matthews, R. and Pitts, J. (ed.), Crime, Disorder and Community Safety, London: Routledge. 12 Dorling, D. (2005), ‘Prime suspect: murder in Britain’, in Hillyard, P., Pantazis, C., Tombs, S., Gordon, D. and Dorling D., Criminal Obsessions: Why Harm Matters More than Crime, London: Crime and Society Foundation/Centre for Crime and Justice Studies.

12
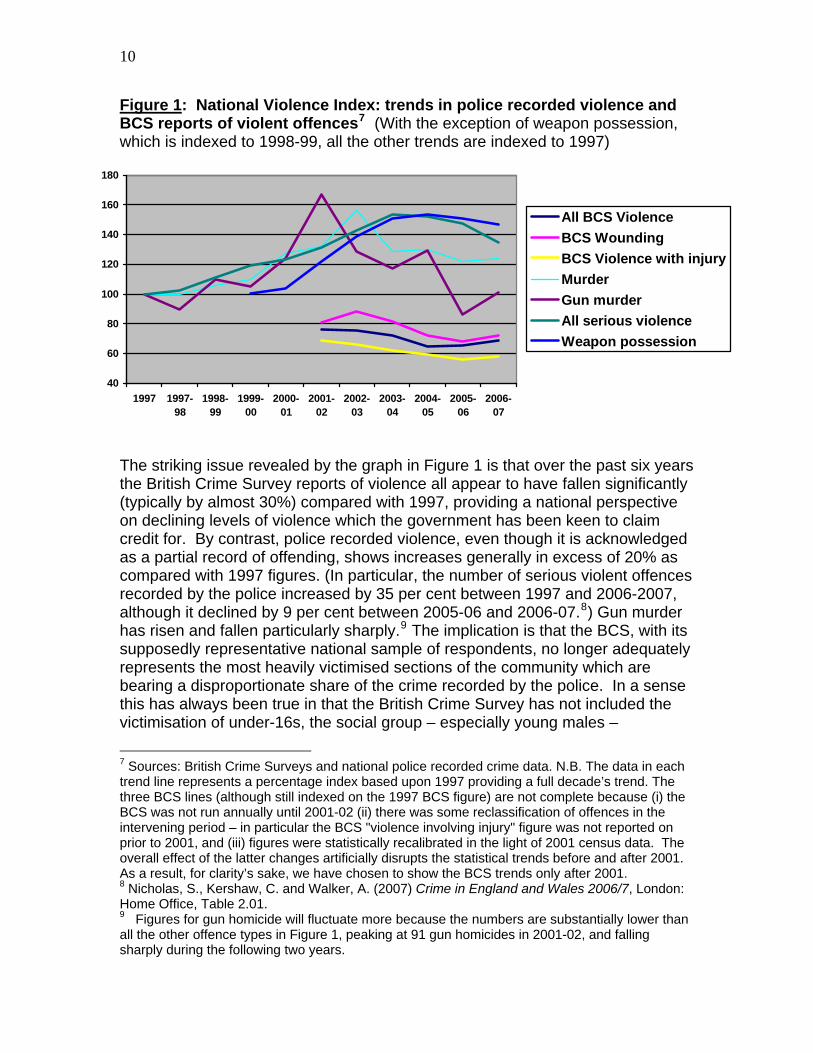
Figure 2: All violence against the person (murder, attempted murder and other acts endangering life and other violence against the person) in four police force areas in England, 2004-05 to 2006-07
0
200
400
600
800
1000
1200
1400
1600
GMP05
GMP06
GMP07
Mers05
Mers06
Mers07
MPS05
MPS06
MPS07
WM05
WM06
WM07
HomicideAttempted murderServious violence against the person
The violence profiles for three of our four English police force areas are clearly falling across the entire three-year period, the exception being the West Midlands (Birmingham). In the GMP (Manchester) and Merseyside (Liverpool) the reduction in overall violence is mainly attributable to falling rates of recorded serious violence against the person. Violence against the person is also falling in the MPS area (London) but so (in 2006-07) is the figure for ‘attempted murder and acts endangering life’. Only in London (the MPS area, excluding the City of London) does the number of actual murders really register on the graph, further underscoring the relatively low rates of murder in England and even the relatively few murders compared to overall levels of violence. Recent public perceptions about the lethality of British violence would seem to run contrary to this aspect of our crime data. This, of course, raises other issues about the derivation of these perceptions.

13
Key issues: overall violence • Rates of murder and serious violence in England and Wales fall midway down
a range of similarly developed societies but, as the Home Office makes clear, murder rates have been increasing over the past decade.13
• The government has sought to take credit for the declining rates of recorded and reported crime,14 but serious violence seems to be falling least. Concerns about violence are, in any event, undermining the message about falling rates of crime.
• There are problems with the available data on weapon-related crime. It seems likely that a significant proportion of this offending is not reported.
• The British Crime Survey has not adequately surveyed younger people, the section of society experiencing the highest rates of weapon-related violence.
• The statistical disparities referred to here have been becoming more evident in the different sets of crime statistics collected.
• Other sources of data (self-report surveys and hospital accident and emergency figures) paint a different picture of our violence trends (see Figures 7 and 8).
• Violent and weapon-related crime are highly localised and concentrated in the poorest and most deprived areas in which violence is often a symptom of deeper problems.
• The focus on ‘criminal justice’ policy responses is sidelining other ways of seeing the problem, and distracting attention from potentially more effective policy responses tackling the underlying causes of problems.
Guns and violence: a national profile While gun crime represents a serious threat to the neighbourhoods in which it occurs, sending worrying signals about the breakdown of law and order and the loss of civilised community, we do need to see it in perspective. It is still a highly concentrated phenomenon, and while this may be little consolation to those communities blighted by the problem, it serves as a reminder that an understanding of context is vital to grasping the problem. Overall, less than 0.5% of recorded crime involves guns. Furthermore, around half of all gun crime involves only air weapons, and about half of what remains involves replica guns. Guns are mostly used to threaten, rather than to shoot (handguns were fired in only 12% of the times they were used in crimes). Finally, guns caused serious or fatal injuries on only 3% of the occasions they were used.
13 See, for example, Home Office (2008), Violent Crime Action Plan, p.12, Fig. 4. 14 Although there are more problems with the claim about falling crime. Much rests upon the definition of ‘crime’ which is counted. See Garside, R. (2006), Right for the Wrong Reasons, Crime and Society Foundation.

14
In 1998, following the horror of the Dunblane school shootings, handguns were banned in England, Wales and Scotland. Many claimed that the continuing increase in gun crime after 1998 showed that ‘gun control’ in Britain had failed. In fact, it suggests something of a displacement of weapon choice by offenders onto air guns, replica weapons, convertible weapons, re-activated weapons and, more recently, knives. The Violent Crime Reduction Act (2006) sought to tighten up controls on a number of ‘firearm’ types whilst parallel legislation in the European parliament15 seems likely to limit the potential for trafficking of many of these weapon types within the EU. Control of illegal gun supply is only part of the story, and it can take a while for such legislation to have an impact. Even so, the long-term trend on gun crime in England and Wales is now – at least at face value – rather more positive, as Figure 3 suggests. Figure 3: Crime recorded by the police in which firearms were reported to have been used by principal weapon, England and Wales, 1998-99 to 2006-0716
0
5000
1000015000
20000
25000
30000
1998-99
1999-00
2000-01
2001-02
2002-03
2003-04
2004-05
2005-06
2006-07
All Firearms (inclairweapons)Air Weapons
Firearms (excluding airweapons)Handguns
Imitation firearms
As Figure 3 shows, all types of firearm misuse (while higher than a decade ago) show a downward trend since 2005. The specific types of firearms indicating the greatest proportionate increases since 1998 are the use of: • imitation firearms (up 345% from 566 to 2,517) • unidentified firearms (up 92% from 665 to 1,277) and • handguns (up 55% from 2,687 to 4,175).17 15European Union (1991), Council Directive 91/477/EEC, on control of the acquisition and possession of weapons (as amended 2007) http://ec.europa.eu/enterprise/regulation/goods/dir91477_en.htm 16 Kaiza, P. (2008), ‘Homicides, recorded crimes involving firearms’, in Povey D. et al. (eds.), Homicides, Firearm Offences and Intimate Violence 2006/07, Supplementary Volume 2 to Crime in England and Wales 2006/07, Home Office Online Report 03/08. 17 Kaiza (2008), ibid.

15
An important caveat to enter about the adequacy of these recorded crime figures is the fact that all the available research on gun crime (and not just that in the UK) reveals that suspected perpetrators of gun crime typically share many attributes with their victims. Many shooters have themselves been shot at in the past and a high proportion of victims are known to the police. There is often a strong ‘no grassing’ presumption: the communities in which gun crime is most common tend to have the lowest levels of trust and confidence in the police and, invariably, the worst experiences of policing. In some cases, amongst the newest resident migrant communities, these attitudes may also reflect the experiences of policing they have brought with them to the UK. Either way, whether through fear, previous experiences or street culture, significant under-reporting is likely. Key issues: guns and violence • Gun crime is relatively rare in the UK but concentrated in a number of
particular areas which are already well-known for their deeper social and economic problems, social conflicts and accumulated disadvantage.
• The levels of recorded gun crime rose quickly for four years after 1998, then stabilised, and the last two years have seen a slight decline.
• Much of recorded gun crime is committed with a motley collection of real, converted, reactivated, replica and lower-powered air weapons.
• Guns are generally used far more to intimidate than to injure, even when they are fired.
• There are, overall, many similarities between the groups most likely to carry and use illegal firearms and the groups they are most likely to be used against.
• The 2006 Violent Crime Reduction Act, plus a ban on reactivated firearms, may impact upon the availability of many types of ‘firearms’ currently misused, but it will take time to ascertain the impact of the new legislation.
Knives and violence: a national profile Knives and sharp instruments are the most common method of killing, accounting for around a third of murders. It is not unreasonable to see the recent preoccupations with ‘knife crime’ as, in part, a reflection of the wider displacement of weapon-related violence which we have referred to already. In the case of ‘knife crime’, however, even more difficulties manifest themselves in that the police have historically been required to record violence injuries by the scale and type of the injury (GBH, wounding etc.), not by the weapon that has inflicted it. The National Audit Office Report, Reducing the Risk of Violent Crime (2008), has criticised the availability of police data regarding weapon use in crime and, from 2007-08 onwards, figures for attempted murder, serious wounding and robbery involving knives and other sharp instruments will be presented in police crime data.

16
The evidence on knife crime contains a number of ambiguities,18 but combining the various data sets, a rather clearer picture emerges. Despite increased media attention, levels of knife crime reflected in the British Crime Survey have remained fairly stable at around 6-7% of all violent crime. Problems with the construction of the BCS survey sample referred to already (specifically the exclusion of those aged under 16, under-reporting of less serious knife injuries by victims and the BCS focus on ‘national average’ rates of victimisation) may be responsible for obscuring the relevant trends. In the absence of national police records of knife-enabled crime prior to 2007, we have to rely upon a range of other sources (although see Figure 30: the Metropolitan Police has been collecting knife crime data since 2003; contrary to public perception, this appears to suggest a falling number of incidents). Daily Mail journalist Tom Harper obtained data from 37 police forces in England and Wales following a ‘freedom of information’ request concerning ‘knife crimes’ (specifically, stabbings and knife-facilitated robberies) recorded between 1 April and 30 June 30 2007. Figure 4 details the findings. Figure 4: ‘The knife crime map of Britain’19
By this definition, London, Manchester and Birmingham fall within the top three knife crime police force areas while Liverpool, in Merseyside, is sixth in the table. Glasgow, not reflected in this graphic, sometimes dubbed the ‘knife crime capital 18 Eades, C., Grimshaw, R., Silvestri, A. and Solomon, E. (2007), ‘Knife Crime’: A Review of Evidence and Policy (second edition), CCJS. 19 Daily Mail, Knife Crime Map of Britain, 28th October 2007: http://www.dailymail.co.uk/news/article-490135/Knife-crime-figures-pile-pressure-Labour.html

17
of Europe’, has (according to the World Health Organization) the highest rate of murder in Europe per head of population. Although overall levels of crime have fallen in the west of Scotland, levels of violent crime, in particular knife crime, have remained relatively constant for the last 40 years. The rate of murder committed with a knife in Scotland is 3.5 times higher than that in England and Wales.20 Data from three further sources point to an increase in knife carrying. First, surveys with young people suggest increasing number of young people carrying knives; the rates of knife carrying increase markedly for young people excluded from mainstream education. Second, police data regarding offenders charged with carrying a pointed or bladed weapon in a public place show increases in weapon carrying (although such figures could entirely reflect targeted policing activity). Third, data from hospital accident and emergency departments indicate an increase in people injured as a result of stabbings. Looking at these data in turn, the following picture emerges. A survey conducted on behalf of the National Youth Agency21 found:
• One in five 16 year old boys admitted attacking someone intending to hurt them seriously. • Twenty-five per cent of young people at school admitted that they had carried a penknife compared to 46% of excluded students. • Nearly half of excluded young people (47%) admit to having carried a weapon but say they have never used it. A further 21% have threatened somebody with a knife. • Of those carrying weapons, 30% have carried a flick knife and 16% a kitchen knife. • Young girls are considerably less likely to have carried a knife in the last year than boys (15% of girls compared to 40% of boys).
Moreover, surveys by MORI for the Youth Justice Board and the Home Office Offending Crime and Justice Survey (OCJS) have asked young people about their carrying of knives. The MORI survey showed a significant jump in the numbers of young people reportedly carrying knives in 2003, although this was largely attributable to the way in which MORI altered the question posed in 2003 compared to previous years.
20 Scottish Government (2007), ‘Knife crime policy’, Press Release: 20/3/07. 21 National Youth Agency (2006), ‘Knives, guns and gangs’, Spotlight Issue 37, September 2006.

18
Figure 5: Percentage of school children who say they have carried a knife in the last 12 months, 2002–0522
0
5
10
15
20
25
30
35
2002 2003 2004 2005
% carrying knives
When looking at why young people carried a knife it was found that:
• More than eight out of ten (85%) of those who had carried a knife said the main reason for doing so was for protection. • Less than one in ten (7%) of those who had carried a knife had used it to threaten someone and 2% had used the knife to injure someone.23
However, as Eades et al. comment, more specific and reliable evidence can be gained from the Home Office’s OCJS, which focused exclusively on young people, in 2004 and 2005. Around 5,000 people aged between 10 and 25 living in private households were interviewed about their involvement in various criminal and potentially disruptive activities. It asked respondents whether they had carried a knife or gun in the last 12 months either ‘for protection, for use in crimes or in case they got into a fight’. The 2004 OCJS found that:
• Four per cent of young people said they had carried a knife of some sort in the last 12 months for those reasons. • Males were significantly more likely than females to have carried a knife. • Carrying of knives was, according to the respondents, most common among 14 to 21 year olds (6%).24
As Eades et al. note, the OCJS survey followed up its 2004 survey with more specific questions about the circumstances, frequency and types of knives carried by young people, and how the knives had been used. 22 Source: MORI (2004), MORI Youth Survey 2004, London: Youth Justice Board for England and Wales, p.73; MORI (2006), MORI Five-Year Report: An Analysis of Youth Survey Data, London: Youth Justice Board for England and Wales, p.13. 23 Eades et al. (2007), p.13 24 Budd, T., Sharp, C., Weir, G., Wilson, D. and Owen, N. (2005), Young People and Crime: Findings from the 2004 Offending, Crime and Justice Survey, London: Home Office.

19
The 2005 survey found that:
• Four per cent of respondents had carried a knife in the previous 12 months. • Carrying of knives was most common amongst 16 to 17 year olds (7%). • Of the 4% who carried a knife, four in ten (41%) had carried a penknife, 29% had carried a flick knife and one in ten (10%) had carried a kitchen knife • In terms of frequency of knife carrying, the majority of those who said they had carried a knife stated that that they did so only rarely. Half (50%) had carried a knife ‘once or twice’ in the preceding 12 months, 23% said they had carried one ‘three or four times’ and only 16% said they had carried a knife ‘ten times or more’. • More than eight out of ten (85%) of those who had carried a knife said the main reason for doing so was for protection. • Less than one in ten (7%) of those who had carried a knife had used it to threaten someone and 2% had used the knife to injure someone.25
While the above findings provide some context for understanding knife carrying and use, the following figure (Figure 6) incorporates offenders of all ages and contains data from three sets of weapon possession offences: having an article with blade or point in public place, which increased by 66% overall during the time period represented by the graph; possession of offensive weapons without lawful authority or reasonable excuse, which increased by 30% during the same years; and having an article with blade or point on school premises (increased by over 500% during the same years, although from a considerably lower base). While such evidence might be used to suggest a greater frequency of weapon carrying by some groups at some times and places, the data could just as well reflect the impact of police targeting of weapon carrying.
25 Eades et al. (2007), ibid, p.13.

20
Figure 6: Weapon possession offences recorded by the police in England and Wales, 1999-0526
0
5000
10000
15000
20000
25000
30000
1999 2000 2001 2002 2003 2004 2005
This issue of police action appearing to exacerbate the knife problem has been acknowledged by the police themselves. A spokesman for Lothian and Borders Police stated that ‘Scottish police have prioritised searching the general public for knives, above just about everything else. The 50% rise [in knife possession offences in Scotland] is the result of the police being more proactive’.27
The figures on weapon possession offences correspond much more closely to our third source of knife crime data, namely evidence from hospital accident and emergency (A&E) departments where the hospital admission was attributed to ‘assault with a sharp object’. See Figure 7.
26 Coaker (2007); N.B. Three categories of weapon possession offence are captured: having an article with blade or point in public place as defined by the Criminal Justice Act 1988 section 139, as amended by the Offensive Weapons Act 1996 section 3; having an article with blade or point on school premises, as defined by Criminal Justice Act 1988 section 139A (1)(5)(a) as added to by the Offensive Weapons Act 1996 section 4(1); and possession of offensive weapons without lawful authority or reasonable excuse defined by Prevention of Crime Act 1953 section 1(1) and amended by Offensive Weapons Act 1996 section 2(1). From V. Coaker, 2007 Parliamentary Under-Secretary of State, Home Office: Supplementary memorandum submitted to the Home Affairs Select Committee by the Home Office. May 1st, 2007. http://www.publications.parliament.uk/pa/cm200607/cmselect/cmhaff/433/433we10.htm
27 Royal Armouries Museum (2007), Tackling Knife Crime: A Review of Literature on Knife Crime in the UK, A Report for the Royal Armouries Museum, Leicester: Royal Armouries and the Perpetuity Group. p.5.

21
Figure 7: Hospital A&E admissions episodes where external cause is ‘assault by a sharp object’, 1997-98 to 2006-0728
3000
3500
4000
4500
5000
5500
6000
1997-98 1998-99 1999-00 2000-01 2001-02 2002-03 2003-04 2004-05 2005-06 2006-07
Similarly, a hospital A&E study published in 2007 confirmed that, during the period 1997-2005, the number of people admitted as a result of stab or sharp object injuries rose by 30%.29 A&E consultants in London have also argued that, unlike crime data on knife-enabled crime, hospital admissions evidence broadly supports public perceptions of increasing rates of knife crime.30
Combining the data in Figures 6 and 7 and showing the results as a percentage index based upon 1999 suggests a close relation between increasing rates of weapon possession charges and increasing stabbing injuries turning up in hospital A&E departments (see Figure 8). An index for handgun-enabled crime is also added to this graph. The convergence of gun and knife crime trends may be evidence of some weapon use displacement occurring, with knives growing in relative significance.
28 Home Office (2008) Saving Lives, Reducing Harm, Protecting the Public: An Action Plan for Tackling Violence 2008-11, London: Home Office, p13, Figure 10 29 Maxwell, R. et al. (2007), ‘Trends in admissions to hospital involving an assault using a knife or other sharp instrument, England, 1997–2005’, Journal of Public Health, 29(2), pp.186-190. 30 Konig, T. and Knowles, C. H. (2006) ‘Stabbing: data support public perception’, British Medical Journal. Accessed at: http://www.bmj.com/cgi/content/full/333/7569/652.

22
Figure 8: Percentage indices for weapon possession charges and A&E stabbing admissions
80
100
120
140
160
180
200
220
240
1999 2000 2001 2002 2003 2004 2005 2006 2007
Blade Possession Index
Hospital StabbingAdmissions IndexHandgun crime index
Key issues: knives and violence • The distribution of knife crime in the UK closely follows the pattern of gun
crime. However, there appears to be a particularly strong ‘knife crime’ violence culture in Glasgow.
• A considerable flurry of media interest has centred upon the issue of a knife crime problem, but the criminal justice evidence base contains a number of ambiguities because, until very recently, police forces have not systematically recorded the type of cutting weapons used to cause stab or cut wounds.
• There is, however, a growing body of other evidence, including hospital data, circumstantial and anecdotal evidence31 and some self-report survey evidence, that some groups of young people are carrying knives (with both offensive but primarily defensive intent). There is little reliable evidence about rates of knife carrying in the past to compare this new evidence with.
• The overwhelming reason given by knife carriers (and others) for carrying knives concerns self-protection.
• Only a minority of those who carry knives admit to having used them in an aggressive fashion.
31 M. Kite (2008), ‘Violent crime is worse than ever, say PCs on the front line’, Daily Telegraph, 30/04/2008.
23
Gangs: a national perspective ‘Gangs’ and ‘gang-related’ criminal activities have recently been at the forefront of media attention and have now infiltrated mainstream political debates. However, it is important to bear in mind that ‘gang activities’ are but a small part of what drives gun and knife crime. Violence and injuries can be inflicted for a number of other reasons, including the perpetrator’s mental health state or, in the context of public disorder incidents, especially in connection with the heavy consumption of alcohol in city centres at weekends. Moreover, it is not clear that there is a shared and consistent understanding or interpretation of what constitutes a ‘gang’ and what makes certain types of behaviour ‘gang-related’. For example, some police forces have used a very broad definition of gang activities, which ranges from congregating in a group, smoking cannabis, drinking, to anti-social behaviour and criminal activities. According to a recent Home Office survey of arrestees, gang members are far more likely to possess weapons and guns than those who are not: 59% of current gang members have ever possessed a gun, compared to 21% of non-gang members.32 However, it is difficult to pinpoint exactly who falls within the official definitions of ‘gang member’. Gang membership is taken to include a wide range of people, along an increasing scale of involvement and association, topped by a minority of older (usually taken to mean over 18 years old) individuals who take part in serious and organised crime to very young ‘hangers-on’ and school children running ‘errands’ for older offenders with various degrees of regularity. More recent work has also identified other young people who may be rather more ‘reluctant’ gang members, bullied or coerced into illegal activity.33 It is unlikely that all people associated with or ‘members’ of gangs will be associated with guns and weapons use to the same extent. It is important to bear this fluidity and breadth of definitions in mind when considering official estimates in relation to gang membership and activities. For example, conflating groups of young people who just hang out together in a neighbourhood under the term ‘gang’ is likely to have an inflationary and alarmist effect on popular and political debate. Various commentators have cautioned against the 'over-definition' of youth peer groups as 'gangs' and the 'street socialisation' activities of young people as ‘gang activities’.34
32 Eniffer, C., Home Office Violent Crime Unit, Presentation to 11 Million Stakeholder event , 14th May 2008, on the Tackling Violent Action Plan 2008-11 and the Tackling Gangs Action Plan: Where are We now? 33 Pitts, J. (2007), Reluctant Gangsters: Youth Gangs in Waltham Forest, University of Luton. 34 Hallsworth, S. (2005), Street Crime, Cullompton: Willan Publishing.
24
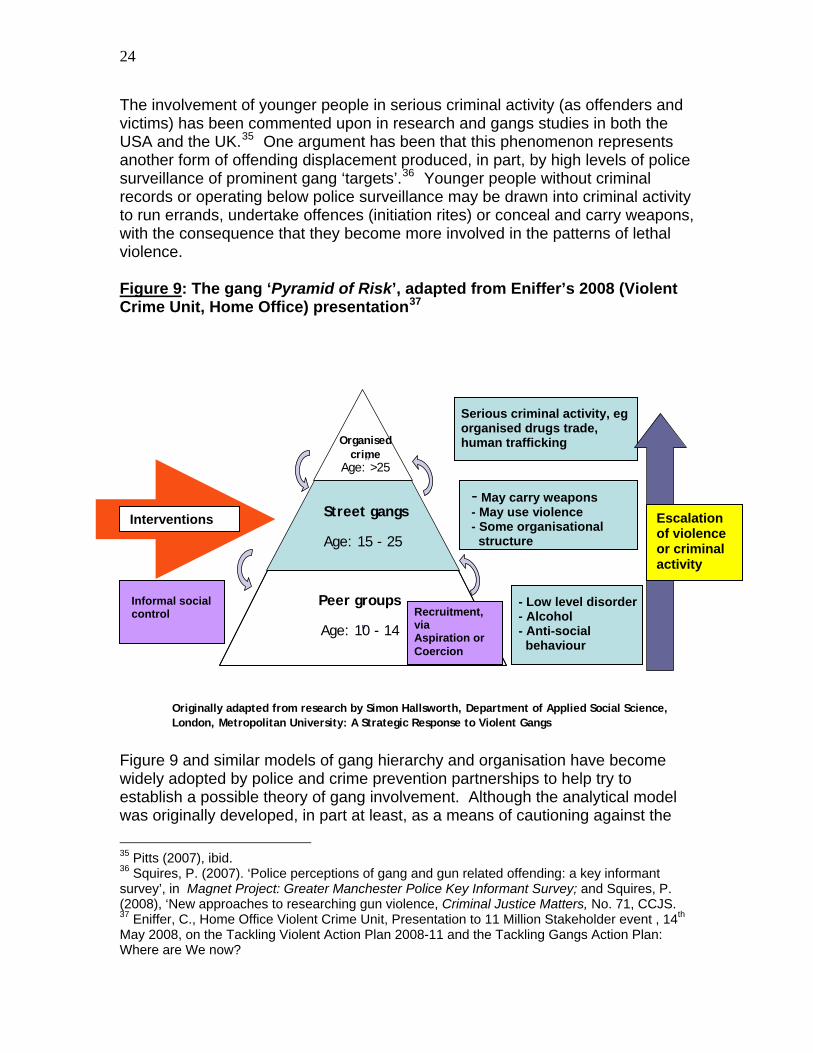
The involvement of younger people in serious criminal activity (as offenders and victims) has been commented upon in research and gangs studies in both the USA and the UK.35 One argument has been that this phenomenon represents another form of offending displacement produced, in part, by high levels of police surveillance of prominent gang ‘targets’.36 Younger people without criminal records or operating below police surveillance may be drawn into criminal activity to run errands, undertake offences (initiation rites) or conceal and carry weapons, with the consequence that they become more involved in the patterns of lethal violence. Figure 9: The gang ‘Pyramid of Risk’, adapted from Eniffer’s 2008 (Violent Crime Unit, Home Office) presentation37
n Organised
crime
Figure 9 and similar models of gang hierarchy and organisation have become
odel
widely adopted by police and crime prevention partnerships to help try to establish a possible theory of gang involvement. Although the analytical mwas originally developed, in part at least, as a means of cautioning against the
35 Pitts (2007), ibid. 36 Squires, P. (2007). ‘Police perceptions of gang and gun related offending: a key informant survey’, in Magnet Project: Greater Manchester Police Key Informant Survey; and Squires, P. (2008), ‘New approaches to researching gun violence, Criminal Justice Matters, No. 71, CCJS. 37 Eniffer, C., Home Office Violent Crime Unit, Presentation to 11 Million Stakeholder event , 14th May 2008, on the Tackling Violent Action Plan 2008-11 and the Tackling Gangs Action Plan: Where are We now?
London, Metropolitan University: A Strategic Response to Violent Gangs Originally adapted from research by Simon Hallsworth, Department of Applied Social Science,
n
Street gangs
Peer groups
Age: >25
Age: 15 - 25
Age: 10 - 14
Serious criminal activity, eg organised drugs trade, human trafficking
Informal social control
- May carry weapons - May use violence - Some organisational structure
Escalation Interventions of violence or criminal activity
- Low level disorder - Alcohol - Anti-social behaviour
Recruitment, via Aspiration or Coercion
25
over-definition of peer groups as ‘gangs’, in its subsequent dissemination this more cautionary and critical tone has been somewhat displaced by an apparenneed to fashion a model of gang hierarchy, recruitment and development which corresponds with enforcement assumptions and priorities.
t
esearch has shown that the children and young people most at risk of
a tend
.g.
stood in
ey issues: gangs
Different definitions are employed to describe ‘gangs’, ‘gang members’ and
iminal activity and a ) gang
gly associated with Black Caribbean ethnic origins -
ofile was around 19 to 22
ated. erpinned by
Rgang involvement and gang victimisation are those who live in multiply disadvantaged neighbourhoods, where poverty and the associated stigmto isolate residents from the socio-cultural mainstream. The effects of structural unemployment and family poverty, exacerbated by negative experiences in school and confrontations with the police on the street, can foster alternativeforms of social and cultural sub-structures.38 Norms and rules of behaviour (erespect, territoriality, honour) develop, in which violence can be seen as acceptable. However, it is also suggested that ‘gangs’ are not best underterms of territoriality and youth-on-youth violence, but are often a smokescreen for organised, commercial criminal activities (e.g. drug dealing, contraband) run by a relatively few individuals who take advantage of the chaotic lives and social formations of young people in deprived neighbourhoods. K •
‘gang-related’ illegal activity. Use of different definitions can result in much greater or smaller constructions of the problem. There is evidence of the ‘over-definition’ of youth peer groups as gangs.
• Gang membership appears to inflate levels of crwillingness to use weapons. The Tackling Gangs Action Plan (TGAPmember profile suggested that gang members typically had around 11 previous convictions.
• Gangs tend to be stron(except in Liverpool and Glasgow), but the TGAP profile appeared to ‘overtarget’ black gang members (except in Liverpool).
• The average age of gang members in the TGAP pryears, but there is evidence of an increasing number of younger people beingdrawn into gang activity – both willingly and reluctantly.
• A majority of street violence in some areas was gang rel• According to some commentators, gang criminality is often und
illegal drug markets.
38 See e.g. Chair’s Report of the Lambeth Executive Commission on Children, Young People and Violent Crime, January 2008.
26
Key themes and issues: commentary There are, arguably, a number of important lessons from the evidence presented in this chapter. A first issue concerns the levels of and trends in violent crime over time. Violence rates in the UK are not exceptional, falling midway in a league table of similar nations. However, trends are susceptible to short-term patterns and fluctuations. It is important not to become overly preoccupied by year on year changes which dominate the short-term horizons of politics but to keep in mind the longer-term trends. Having said that, being able to identify emergent trends (such as the over-concentration of lethal violence in socially deprived areas, an increasing ‘weaponisation’ effect, the highly publicised racialisation of a proportion of violence, and the increased involvement of younger people in violence (all of which are discussed below) is important. Second, contexts and motivations are crucial to an understanding of street violence in a number of senses. It is important to take seriously the concentrations of violence in deprived areas (beyond statistical debates about ‘clustering effects’) as noted above, and especially the ways in which these areas curtail and distort the lives, opportunities and aspirations of young people growing up in them. In such areas many young people come to see crime and violence as a credible and even necessary ‘career’ choice. Some aspire to become involved, others are drawn, reluctantly, into illegality. Many young people who become involved in ‘gang activity’ cite protection, ‘safety in numbers’, as a reason for doing so and the overwhelming majority who carry weapons say that they do so for the same reason. For many young people the ‘performance’ of violence in public is crucial to their street credibility and respect: itself a form of ‘social capital’.39 Third, the key issue is to understand the role of interpersonal violence in people’s lives and especially the willingness of certain groups of people to use it against one another. There is undoubtedly an issue about the weapon facilitation of violence (especially for younger groups), but the history of violence also shows people killing and injuring one another with whatever comes to hand. So classifying violence according to weapon type (while understandable in the case of guns which are, per se, largely illegally held anyway) may meaninglessly aggregate a whole variety of quite disparate illegal behaviours together (from criminal damage committed with an air gun to a gang-related murder). This leads to another important question about the fitness for purpose of the data we have and their ability to provide answers to our most pressing questions. Data gathering and aggregation In the light of the above, what follows are the best available data we have been able to collate from the five cities to be featured in this project. By virtue of the 39 See e.g. Hallsworth, S. (2005), Street Crime, Cullompton: Willan Publishing; Mullins, C. (2006), Holding your Square: Masculinities, Street Life and Violence, Cullompton: Willan.
27
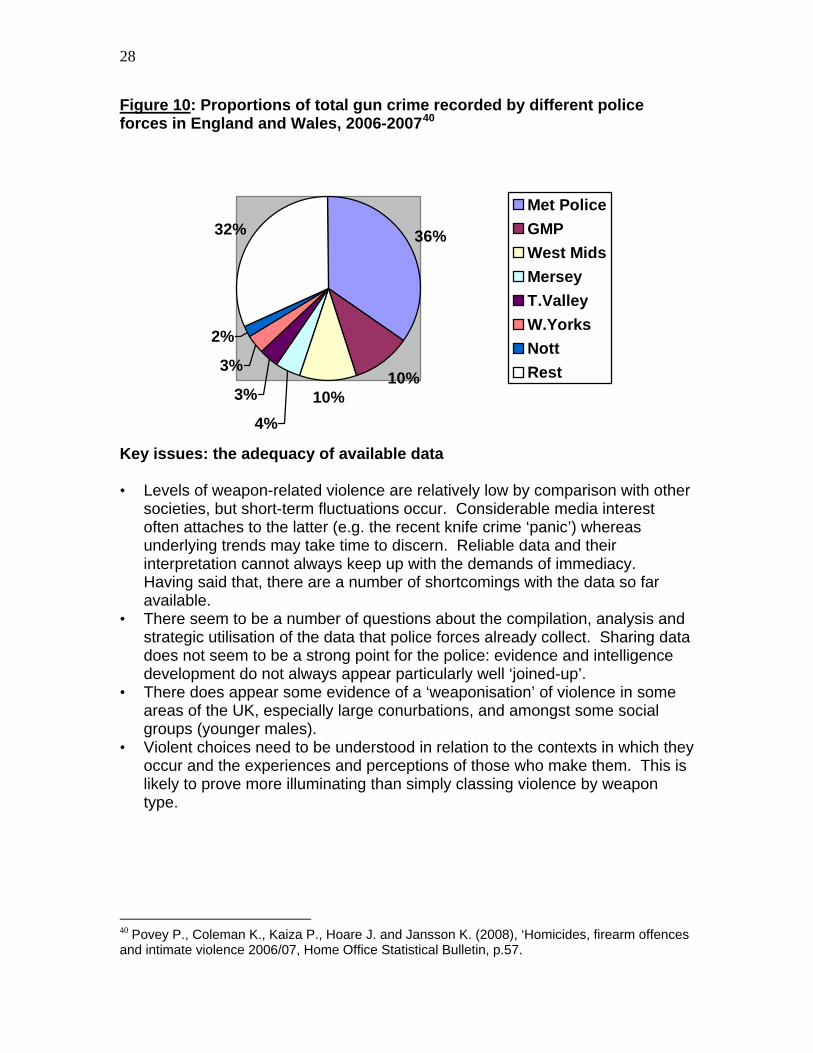
kinds of data we have obtained it seems clear that many police forces collect more data than they know how to use effectively and strategically – or to share effectively. The most thorough data made available have been provided by the Metropolitan Police but even here the material (collected for a number of administrative and managerial purposes within the police) was not always available in a form that was easy to use in our enquiry. Other police forces such as Manchester and Birmingham, running dedicated gun crime intelligence-led operations, collected a range of data (for example, Manchester’s Operation Xcalibre had information on firearm discharges and more detailed data on gun crime activity) but they have seemed rather reluctant share it with us. Most of the data we have been able to obtain and present in this report are aggregated for other policing purposes and do not always detail specific weapon involvements. Police forces did not always have the time, or perhaps the inclination, either to disaggregate or disclose it. We present the data on the five cities in the sequence suggested by the following chart (Figure 10), which represents the proportions of gun crime occurring in different police force areas in 2006-07. We noted earlier the significant concentration of gun crime in particular areas – and within particular neighbourhoods and communities within these areas. First, London – the Metropolitan Police - records just over a third of all gun crime in England and Wales, followed by Greater Manchester Police, West Midland Police and Merseyside Police. Taken together, these four police force areas account for just over 55% of all gun crime recorded in England and Wales, whilst also topping the ‘knife crime’ league table (see.Figure 4). The last city we discuss is Glasgow which, as we noted earlier, is sometimes referred to as the ‘knife crime capital of Europe’ because it has the highest rate of murder in Europe per head of population.
28
Figure 10: Proportions of total gun crime recorded by different police forces in England and Wales, 2006-200740
36%
10%10%
4%
3%
3%
2%
32%Met PoliceGMPWest MidsMerseyT.ValleyW.YorksNottRest
Key issues: the adequacy of available data • Levels of weapon-related violence are relatively low by comparison with other
societies, but short-term fluctuations occur. Considerable media interest often attaches to the latter (e.g. the recent knife crime ‘panic’) whereas underlying trends may take time to discern. Reliable data and their interpretation cannot always keep up with the demands of immediacy. Having said that, there are a number of shortcomings with the data so far available.
• There seem to be a number of questions about the compilation, analysis and strategic utilisation of the data that police forces already collect. Sharing data does not seem to be a strong point for the police: evidence and intelligence development do not always appear particularly well ‘joined-up’.
• There does appear some evidence of a ‘weaponisation’ of violence in some areas of the UK, especially large conurbations, and amongst some social groups (younger males).
• Violent choices need to be understood in relation to the contexts in which they occur and the experiences and perceptions of those who make them. This is likely to prove more illuminating than simply classing violence by weapon type.
40 Povey P., Coleman K., Kaiza P., Hoare J. and Jansson K. (2008), ‘Homicides, firearm offences and intimate violence 2006/07, Home Office Statistical Bulletin, p.57.
29
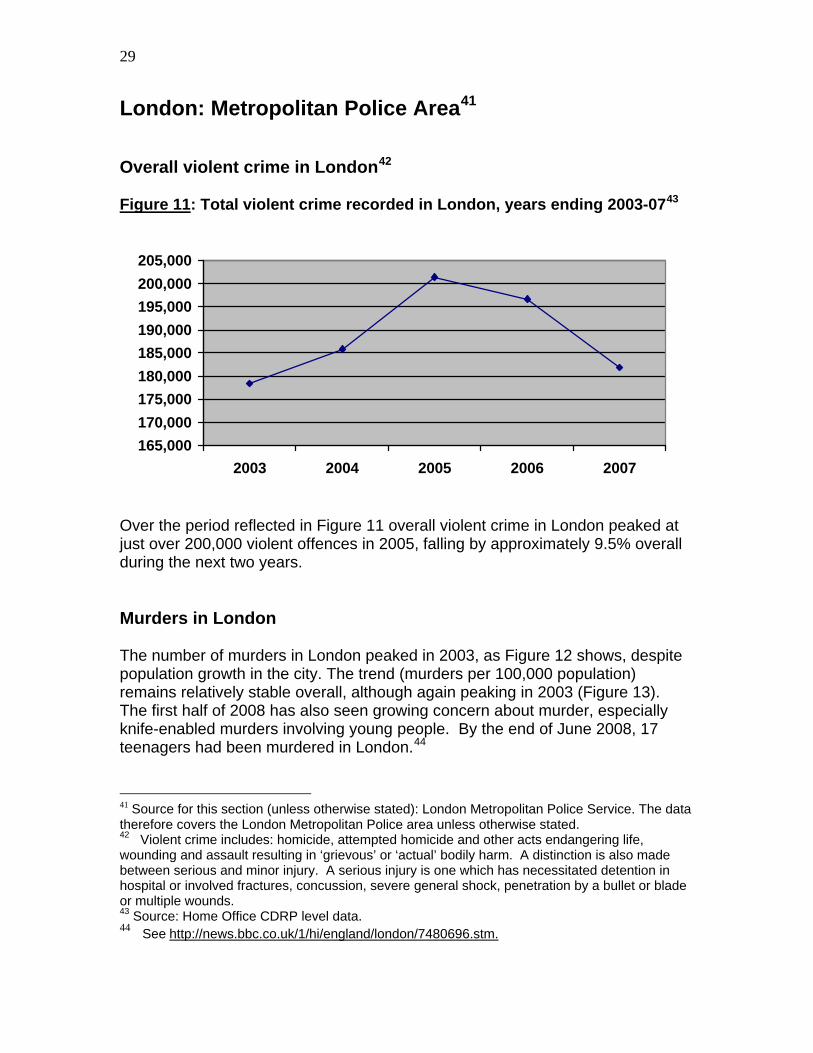
London: Metropolitan Police Area41 Overall violent crime in London42 Figure 11: Total violent crime recorded in London, years ending 2003-0743
165,000170,000175,000180,000185,000190,000195,000200,000205,000
2003 2004 2005 2006 2007
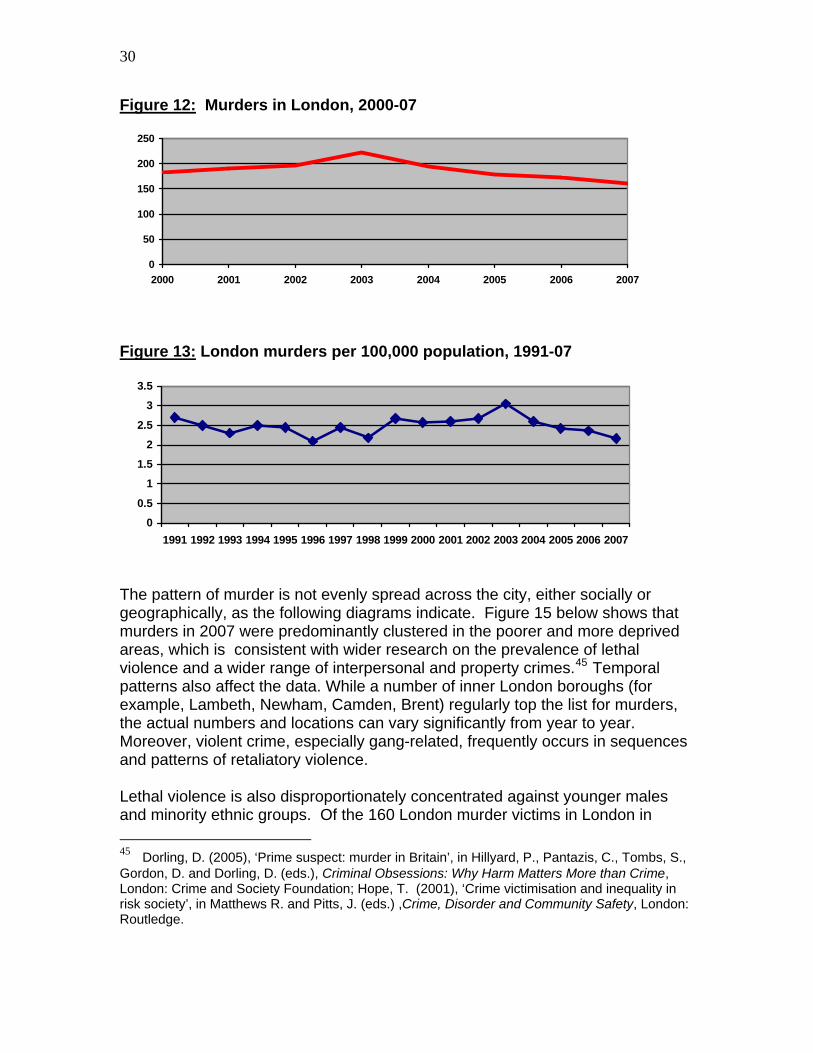
Over the period reflected in Figure 11 overall violent crime in London peaked at just over 200,000 violent offences in 2005, falling by approximately 9.5% overall during the next two years. Murders in London The number of murders in London peaked in 2003, as Figure 12 shows, despite population growth in the city. The trend (murders per 100,000 population) remains relatively stable overall, although again peaking in 2003 (Figure 13). The first half of 2008 has also seen growing concern about murder, especially knife-enabled murders involving young people. By the end of June 2008, 17 teenagers had been murdered in London.44
41 Source for this section (unless otherwise stated): London Metropolitan Police Service. The data therefore covers the London Metropolitan Police area unless otherwise stated. 42 Violent crime includes: homicide, attempted homicide and other acts endangering life, wounding and assault resulting in ‘grievous’ or ‘actual’ bodily harm. A distinction is also made between serious and minor injury. A serious injury is one which has necessitated detention in hospital or involved fractures, concussion, severe general shock, penetration by a bullet or blade or multiple wounds. 43 Source: Home Office CDRP level data. 44 See http://news.bbc.co.uk/1/hi/england/london/7480696.stm.
30
Figure 12: Murders in London, 2000-07
0
50
100
150
200
250
2000 2001 2002 2003 2004 2005 2006 2007
Figure 13: London murders per 100,000 population, 1991-07
0
0.5
1
1.5
2
2.5
3
3.5
1991 1992 1993 1994 1995 1996 1997 1998 1999 2000 2001 2002 2003 2004 2005 2006 2007
The pattern of murder is not evenly spread across the city, either socially or geographically, as the following diagrams indicate. Figure 15 below shows that murders in 2007 were predominantly clustered in the poorer and more deprived areas, which is consistent with wider research on the prevalence of lethal violence and a wider range of interpersonal and property crimes.45 Temporal patterns also affect the data. While a number of inner London boroughs (for example, Lambeth, Newham, Camden, Brent) regularly top the list for murders, the actual numbers and locations can vary significantly from year to year. Moreover, violent crime, especially gang-related, frequently occurs in sequences and patterns of retaliatory violence. Lethal violence is also disproportionately concentrated against younger males and minority ethnic groups. Of the 160 London murder victims in London in
45 Dorling, D. (2005), ‘Prime suspect: murder in Britain’, in Hillyard, P., Pantazis, C., Tombs, S., Gordon, D. and Dorling, D. (eds.), Criminal Obsessions: Why Harm Matters More than Crime, London: Crime and Society Foundation; Hope, T. (2001), ‘Crime victimisation and inequality in risk society’, in Matthews R. and Pitts, J. (eds.) ,Crime, Disorder and Community Safety, London: Routledge.

31
2007, 82 (51.2%) were from black or minority ethnic communities. Weapon-involved lethal violence has had a particularly severe impact on the black community in London. Not only have the areas in which they live become the scene of terrible acts of lethal violence but there is also a sense among many that the black community as a whole has become vilified for the actions of a few.46 The findings of a report by the Home Affairs Select Committee (dealing with race and crime across the country as a whole) reflect the situation in London:47
‘Statistics indicate that black people are no more likely that white people to fall victim to crime… [but] evidence does point strongly to a much greater likelihood of young black people falling victim to violent and weapon-enabled crime, including homicide. Overall, black people are 5.5 times more likely than white people to be a victim of homicide… but the greatest disproportionality is at younger ages, where black males account for nearly two thirds of all murders of 10 to 17 year olds.’
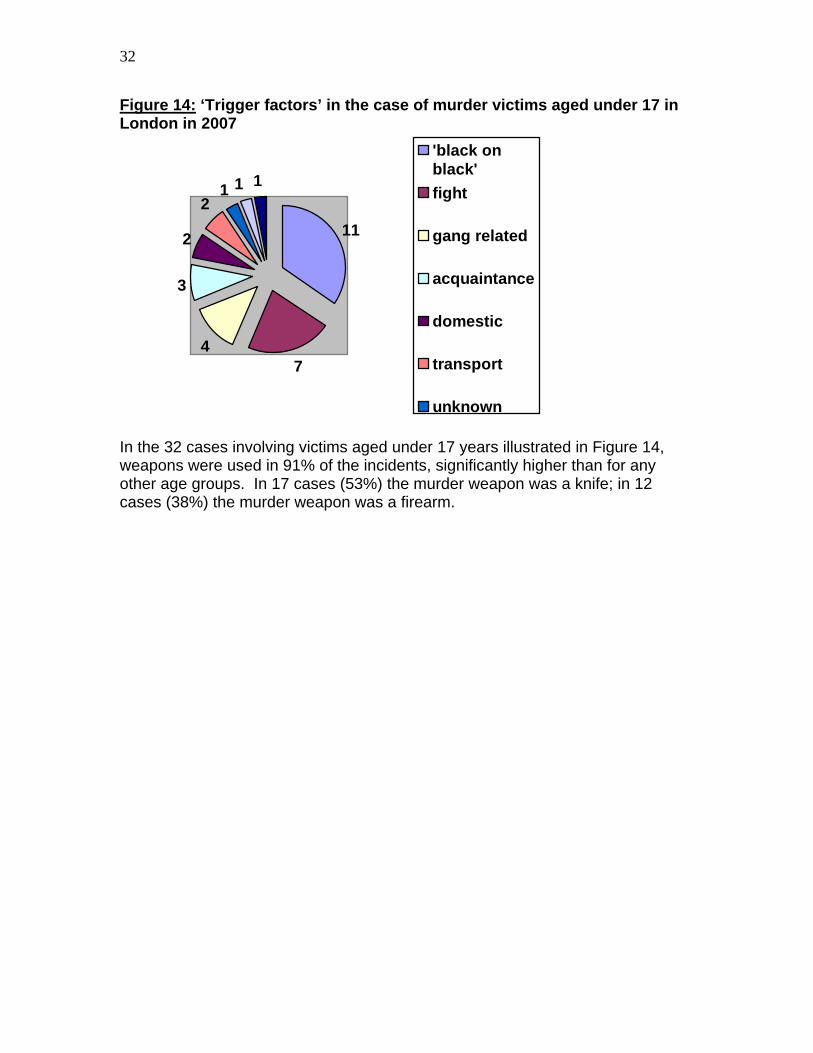
The category ‘white victims’ in London also contains a significant proportion of victims from white European immigrant communities. While concern has always focused upon the murder of young people (e.g. Stephen Lawrence, Damilola Taylor), more recently attention has been drawn to the apparently greater involvement of even younger people in patterns of lethal violence. Figure 16 which details the ages of murder victims in London over the past few years, bears out some of these concerns. The doubling of the number of victims aged under 17 in 2007 is undoubtedly a serious cause for concern but it is a change over only one year. In relation to the growth in numbers of murders involving victims under the age of 17 (32 incidents) and about which recent concerns have arisen, Metropolitan Police data suggest the following ‘triggers’ as the reason for the violence (see Figure 14). Only one factor is identified per case and it is not clear from the data whether only one factor applies: ‘black on black’ cases may also be gang related, for instance.
46 See e.g. Firmin et al (2007), ibid. 47 Home Affairs Select Committee (2007), Young Black People and the Criminal Justice System, London: House of Commons, 15
32
Figure 14: ‘Trigger factors’ in the case of murder victims aged under 17 in London in 2007
11
74
3
2
21 1 1
'black onblack'fight
gang related
acquaintance
domestic
transport
unknown In the 32 cases involving victims aged under 17 years illustrated in Figure 14, weapons were used in 91% of the incidents, significantly higher than for any other age groups. In 17 cases (53%) the murder weapon was a knife; in 12 cases (38%) the murder weapon was a firearm.
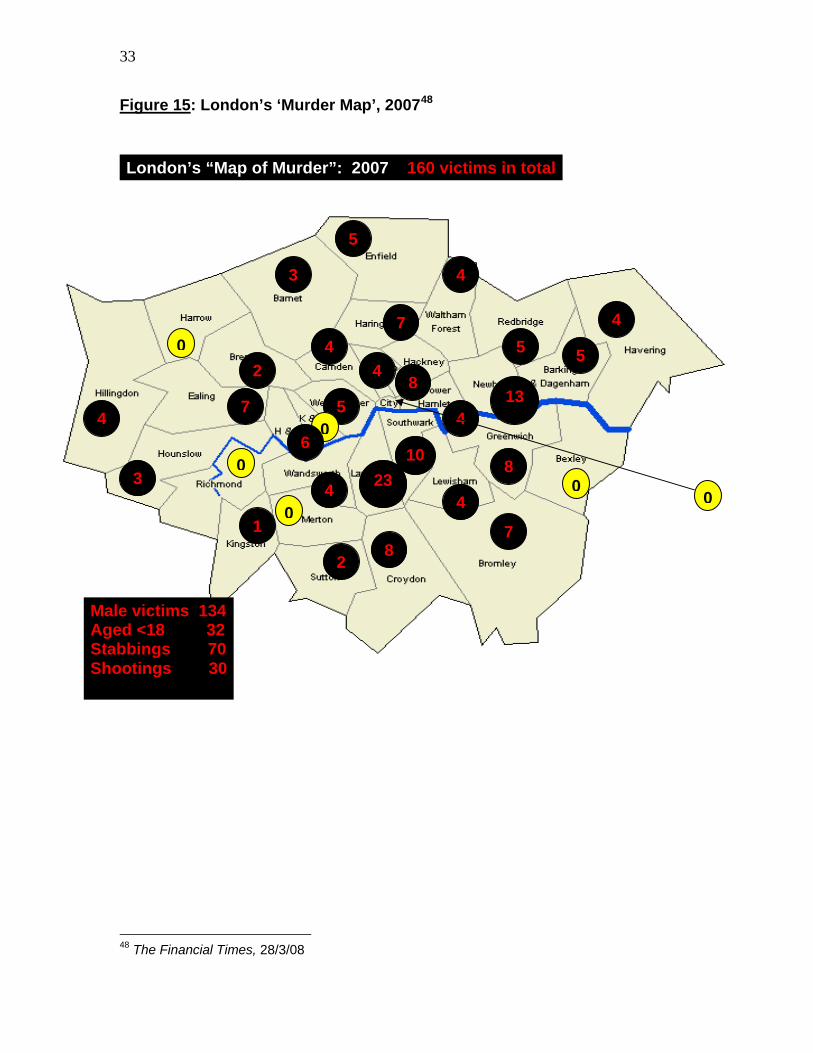
33
Figure 15: London’s ‘Murder Map’, 200748 London’s “Map of Murder”: 2007 160 victims in total
5
48 The Financial Times, 28/3/08
4
4
4 4
4 4 5 5
5
7
7
7
2 13
8
4
8
8
23 10
2
0
0
0
0
0
3
3
4 6
01
Male victims 134 Aged <18 32 Stabbings 70 Shootings 30

34
Figure 16: Ages of murder victims in London, 2005-07
01020304050607080
under 17 18-25 26-34 35 +
200520062007
In Figure 17 the same three years’ data are presented in relation to the means of attack used in the lethal violence (although not all stabbings will involve the use of a knife, but also broken bottles or glass etc). Figure 17: Means of attack: murders in London, 2005-07
01020304050607080
stabbing firearm phys. assault other
200520062007
The preponderance of stabbings in the London murder data also reflect the fact that being stabbed is an especially male dominated form of violent death (in London male victims feature in just under 80% of all murders). By contrast, women are more frequently strangled (Home Office, Homicide Data, 2008). There is an argument to the effect that murder is becoming increasingly ‘weaponised’ (knives and firearms) especially in the younger age groups (see below) (National Audit Office, 2008).

35
Weapon-enabled crime49 in London The number of gun-enabled crimes in London fell from 3,375 in April 2006 to March 2007 to 3,328 the following year (a fall of 1.4%). Knife-enabled crimes fell from 12,124 to 10,220 (a fall of 15.7%) during the same period. There was an 8.8% increase in ‘Trident Gun Crime Incidents’ (‘black on black’ gun crime), rising from 226 to 246 over the same period. The following graph (Figure 18), based on police recorded incidents, charts the annual gun crime trend for London since 1999 and the trend for knife crime from 2003, the first year that these data began to be collected. Police records suggest that knife-enabled crime is approximately three to four times more frequent than gun crime, yet there appears to be a downward trend for both offence types. These incidents do not necessarily involve injuries but also, for example, robberies, where a weapon may have been used to threaten a victim. We discussed earlier in the report the possible reasons for a lack of correspondence between falling police records of gun and knife violence, but evidence of increasing knife carrying and increasing injury rates (see Figures 6, 7 and 8 and related discussion). Figure 18: Gun- and knife-enabled crime in London50
02000
4000
6000
8000
10000
12000
14000
1999 2000 2001 2002 2003 2004 2005 2006 2007
Gun Enabled ViolenceKnife Enabled Violence
Young Londoners’ perceptions of gun and knife crime51 In a poll for BBC London, 500 teenagers aged 13 to 18 living in Croydon, Brent, Hackney, Southwark and Lambeth were questioned over the telephone between 5 and 12 November 2007.
49 Gun- and knife-enabled crimes do not necessarily involve injury, and include incidents where a weapon may have been used to threaten, for example, in a robbery. For a description of the recording issues relating to gun-enabled crime see Squires, P. (2008), Gun Crime: A Review of Evidence and Policy, London Centre for Crime and Justice Sudies. 50 Metropolitan Police Crime Data, 2007 51 Data sourced from a ComRes poll for BBC London, November 2007: http://www.comres.co.uk/page1842453.aspx .
36
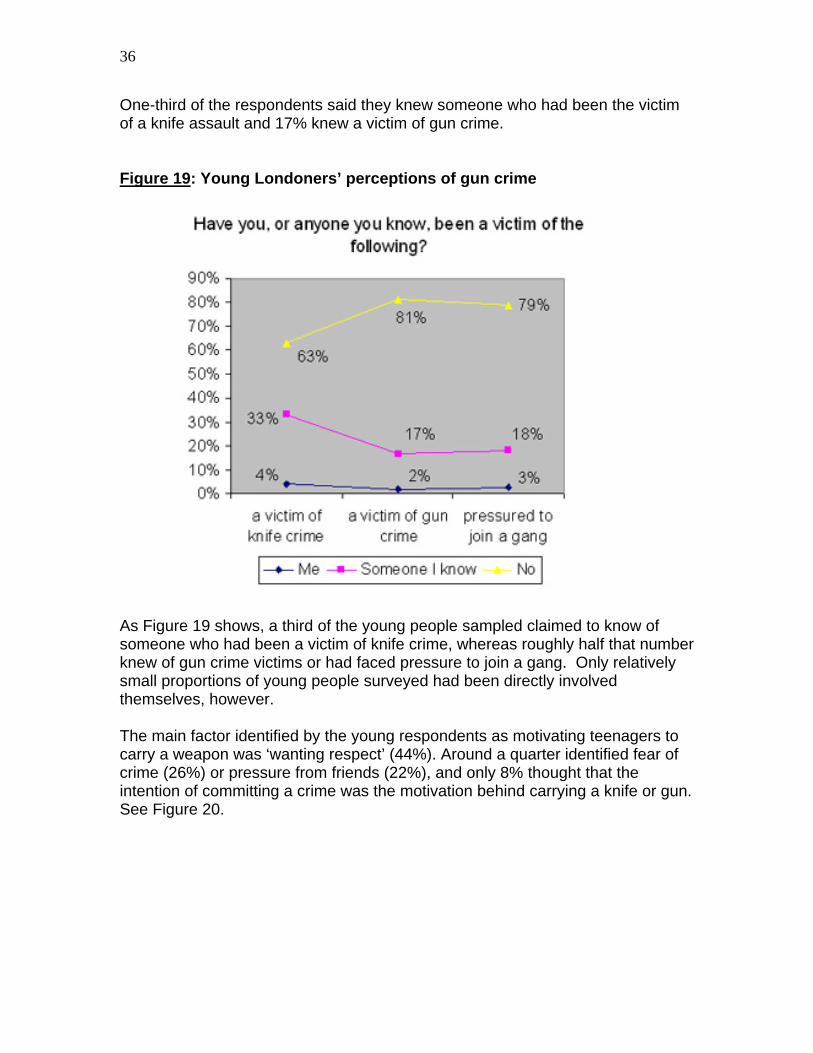
One-third of the respondents said they knew someone who had been the victim of a knife assault and 17% knew a victim of gun crime. Figure 19: Young Londoners’ perceptions of gun crime
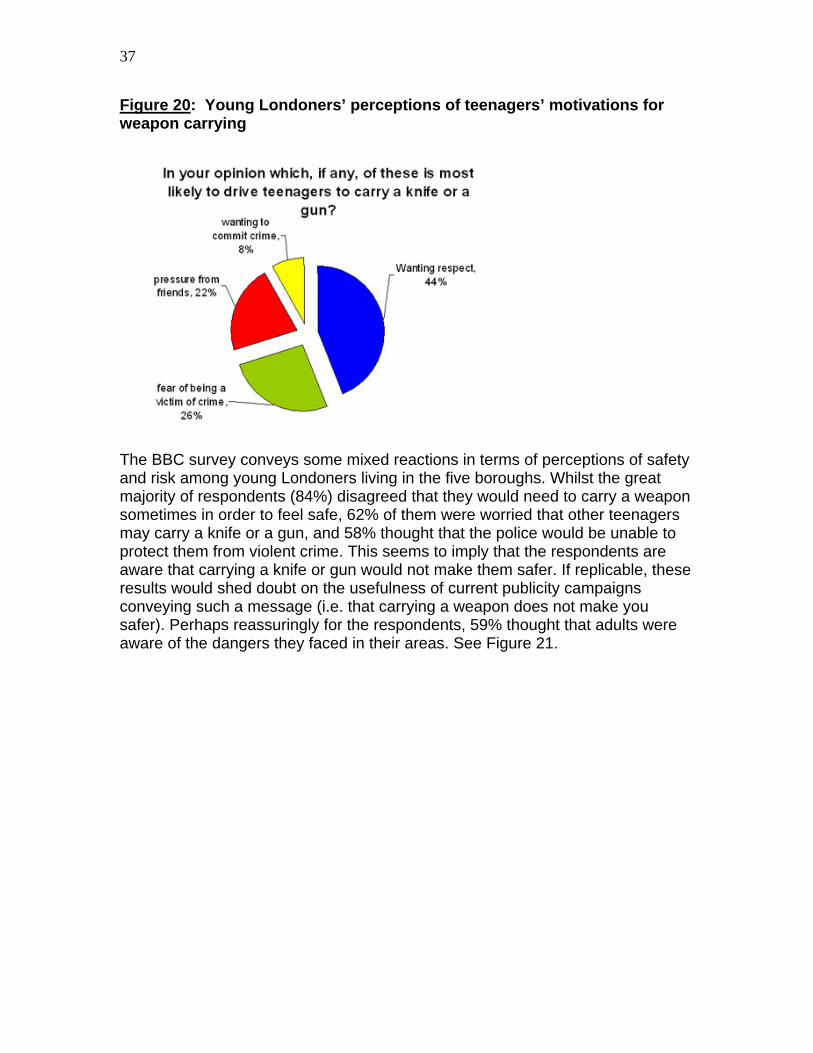
As Figure 19 shows, a third of the young people sampled claimed to know of someone who had been a victim of knife crime, whereas roughly half that number knew of gun crime victims or had faced pressure to join a gang. Only relatively small proportions of young people surveyed had been directly involved themselves, however. The main factor identified by the young respondents as motivating teenagers to carry a weapon was ‘wanting respect’ (44%). Around a quarter identified fear of crime (26%) or pressure from friends (22%), and only 8% thought that the intention of committing a crime was the motivation behind carrying a knife or gun. See Figure 20.
37
Figure 20: Young Londoners’ perceptions of teenagers’ motivations for weapon carrying
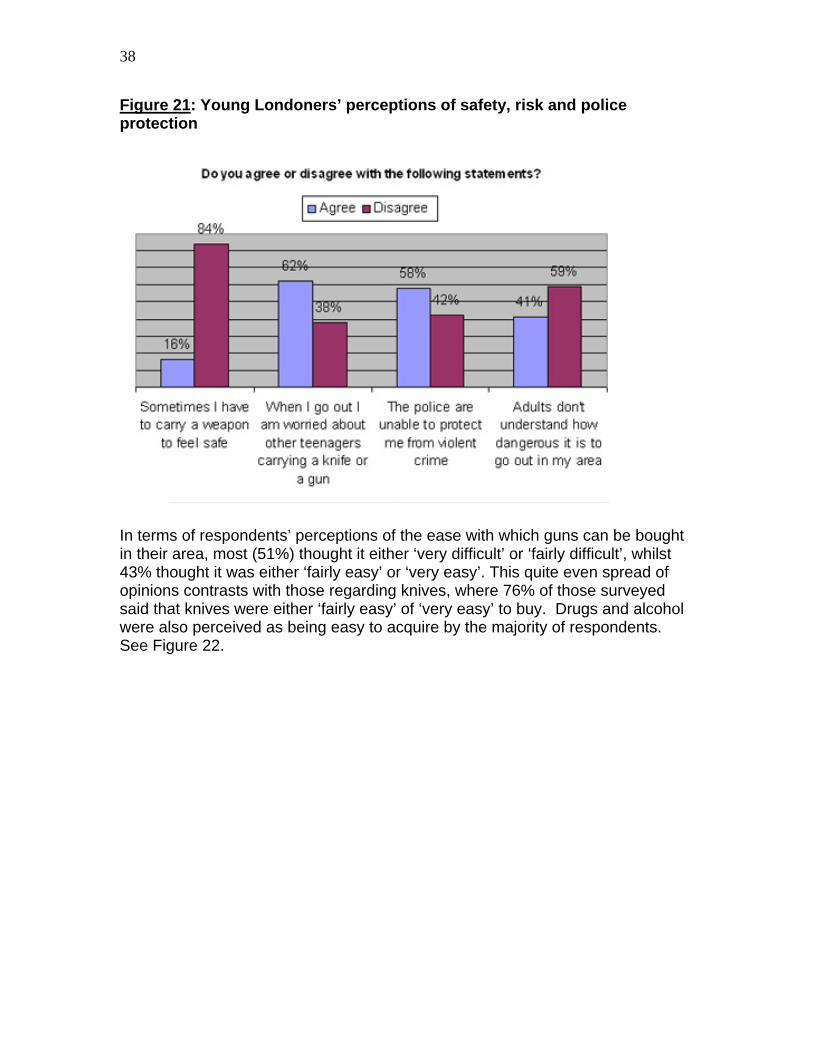
The BBC survey conveys some mixed reactions in terms of perceptions of safety and risk among young Londoners living in the five boroughs. Whilst the great majority of respondents (84%) disagreed that they would need to carry a weapon sometimes in order to feel safe, 62% of them were worried that other teenagers may carry a knife or a gun, and 58% thought that the police would be unable to protect them from violent crime. This seems to imply that the respondents are aware that carrying a knife or gun would not make them safer. If replicable, these results would shed doubt on the usefulness of current publicity campaigns conveying such a message (i.e. that carrying a weapon does not make you safer). Perhaps reassuringly for the respondents, 59% thought that adults were aware of the dangers they faced in their areas. See Figure 21.
38
Figure 21: Young Londoners’ perceptions of safety, risk and police protection
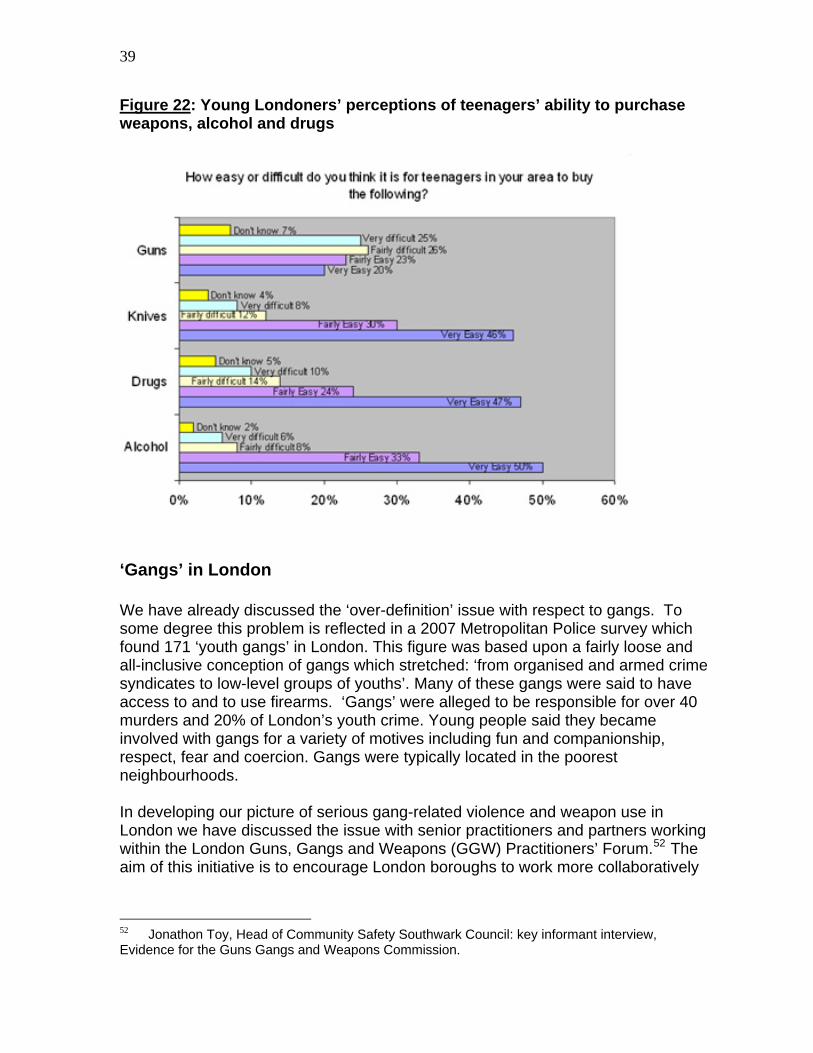
In terms of respondents’ perceptions of the ease with which guns can be bought in their area, most (51%) thought it either ‘very difficult’ or ‘fairly difficult’, whilst 43% thought it was either ‘fairly easy’ or ‘very easy’. This quite even spread of opinions contrasts with those regarding knives, where 76% of those surveyed said that knives were either ‘fairly easy’ of ‘very easy’ to buy. Drugs and alcohol were also perceived as being easy to acquire by the majority of respondents. See Figure 22.
39
Figure 22: Young Londoners’ perceptions of teenagers’ ability to purchase weapons, alcohol and drugs
‘Gangs’ in London We have already discussed the ‘over-definition’ issue with respect to gangs. To some degree this problem is reflected in a 2007 Metropolitan Police survey which found 171 ‘youth gangs’ in London. This figure was based upon a fairly loose and all-inclusive conception of gangs which stretched: ‘from organised and armed crime syndicates to low-level groups of youths’. Many of these gangs were said to have access to and to use firearms. ‘Gangs’ were alleged to be responsible for over 40 murders and 20% of London’s youth crime. Young people said they became involved with gangs for a variety of motives including fun and companionship, respect, fear and coercion. Gangs were typically located in the poorest neighbourhoods. In developing our picture of serious gang-related violence and weapon use in London we have discussed the issue with senior practitioners and partners working within the London Guns, Gangs and Weapons (GGW) Practitioners’ Forum.52 The aim of this initiative is to encourage London boroughs to work more collaboratively
52 Jonathon Toy, Head of Community Safety Southwark Council: key informant interview, Evidence for the Guns Gangs and Weapons Commission.
40
to deliver joint programmes to address gang, gun and weapon violence. The picture of gang-related serious violence is described as follows:
‘Gang, gun and weapon violence, is not a new phenomenon. Indeed the current levels of violence and in particular knife violence has been a building for many decades. It is borne out of a range of risk and protective factors that can have a significant impact on an individual and make that individual more susceptible to committing violence as their personal values and the values they place on society start to erode … Those people involved in serious gun, gang and weapon violence [tend to] have low personal values, both of themselves and those around them. ‘The current levels of serious gun, gang and weapon violence can, in my opinion, be contributed to two key issues - drug markets and respect/retribution …
‘It is clear that the data analysis will indicate that both suspects and victims are becoming younger in their profile. However, our evidence is very clear that a significant proportion of gang and weapon violence is directly connected to the organised criminal business of drug supply and drugs markets … The main players who head up a gang rarely get involved in serious violence, but instead use [and exploit] other young members and “wannabees” to prove their worth by couriering drugs. These members are carrying out criminal and violent acts in order to move up the hierarchy of the gang structure. ‘Young people involved in serious violence, therefore, are often pawns, used by older members (usually 19-25 years of age) to cement their criminal markets and hold fear over others through threats, intimidation and harassment. ‘Territory for the gangs business is often wrongly identified as a geographical area or post code. Gangs can often be formed, or indeed strengthened, by the associations that they build in schools or on estates, however they can equally be formed by family or ethnic connections. ‘Gang structures are fluid and often chaotic. Some individuals retain an allegiance to more than one gang and gangs in London regularly splinter, fighting with others to dominate a drugs or other illegal market. ‘At present the gang structure in London is not as organised at those in America, however there is a risk that they will become so within time … As gangs get more structured … in London [they] will become much more dominant and entrenched. ‘… the current trend of knife violence can be linked to status in the gangs structure. Serious knife and gun enabled incidents are also often a retribution for other incidents that may have happened months, in some cases years before. More recent incidents indicate a deeper social problem, where those committing weapon related violent offences do so to

41
earn ‘respect’ over their social peers, to indicate disrespect towards other individuals or groups and to challenge the boundaries of authority or society. ‘As a result more young people carry a knife or a weapon as ‘protection’, ignoring the increased risk that they cause themselves. ‘We need to tighten up on both legislation and criminal justice outcomes that enforce these boundaries. By long term I mean a programme that lasts a generation or more, and is similar to the programmes that changed attitudes to smoking or wearing a seat belt.’
This ‘experience-led’ analysis of gang development in London corresponds closely with the ‘London gangs problem analysis’ to be found in the Recent Home Office Publication: Tackling Gangs: A Practical Guide for Local Authorities, CDRPs and Other Local Partners.53 Here the gang problem in London is described as:
‘• The numbers of those involved in serious violent offending as part of gangs remains small in comparison with the overall offending population. • A small number of street gangs who have pursued criminal activity for a number of years have progressed into organised criminal networks. • Street gangs tend to comprise young people. In some cases, these young people support organised criminal networks by committing offences and concealing drugs and weapons. • Serious, gang-related violence is concentrated in a limited number of areas and venues where gang members gather. • The degree of organisation, name and membership of each gang is variable and subject to frequent change. • Those involved in gang activities tend to be prolific offenders – responsible for a high volume and wide range of violent offending. • Street-level gangs typically comprise a small number of highly active, violent criminals intent on a criminal career, together with a wider group of vulnerable young people who are attracted to or coerced into active involvement. • Gangs are characterised by frequent internal and external disputes typically involving issues of ‘respect’. A limited number of career criminals seek to enhance their status through criminal offences and serious violence directed towards rival gangs. • Evidence of seizure and intelligence indicates that weaponry for street gangs is dominated by knives and imitation firearms. • The internet is used by some street gangs as a means of enhancing their status.’
The first anti-gangs strategy to have been devised in London was developed by the local strategic partnership Lambeth First: ‘Young and Safe in Lambeth’, which is designed to reduce young people’s involvement in gangs (based on report by the Lambeth Executive Commission on Children, Young People and Violent 53 Home Office (2008), Tackling Gangs: A Practical Guide for Local Authorities, CDRPs and Other Local Partners, www.crimereduction.homeoffice.gov.uk/violentstreet/violentstreet012a.pdf.
42
Crime). The Home Office’s Violent Crime Action Plan54 has cited the X-it Project, also based in Lambeth, as a model initiative to help young people avoid or escape gang involvements. The project is targeted at young gang members who want to change their behaviour. It aims to: ‘• reduce territorialism and postcode hostilities between street gangs from different estates, and support them to change their behaviour and leave gangs; • reduce the number of violent inter-gang incidents by identifying hotspots and working intensively with young people in those hotspots; • support the transformation of gang members, enabling them to leave gangs and engage in more positive activities; and • develop mutually respectful relationships between programme workers and young people, based on clearly outlined boundaries.’ Key issues and key facts: London • Although London appears to lead the city violence ‘league table’, levels of
violence across London as a whole, recorded by the Police, appear to be falling – this seems to be the case for ‘all violence’ and murders (which peaked in 2003 but have fallen, year on year, since then). The latest figures on gun and knife enabled crime also suggest a falling trend, although whilst the latter has declined by almost a third since 2006, gun crime has fallen by less.
• Other sources of data however (social surveys, weapon possession figures and hospital stabbings admissions) suggest that knife-enabled crime and stabbing injuries are increasing.
• Gun and knife violence appear to be concentrated very unevenly in certain areas and in patterns which cluster geographically, temporally and (according to other evidence55) sequentially in patterns of ‘tit-for-tat’ retaliation.
• Black communities, especially their younger members, appear disproportionately victimised by weapon-involved crime. Over half of the murders in London had a victim from a black or minority ethnic group, and black males account for nearly two-thirds of all murders of 10 to 17 year olds.
• Fights and violence amongst acquaintances, between gangs and ‘black on black’ violent crime account for over two-thirds of the murders involving victims aged under 17 in London.
• There are some reservations, despite the successes of the Metropolitan Police’s ‘Operation Trident’, about the implications of naming and targeting ‘black on black’ crime, in that it is sometimes taken to imply that the black community as a whole is responsible for the ‘gang and gun’ problem.
54 HM Government (2008), Saving Lives. Reducing Harm. Protecting the Public. An Action Plan for Tackling Violence 2008-11. 55 McLagan, G. (2005) Guns and Gangs: Inside Black Gun Crime, London: Allison & Busby
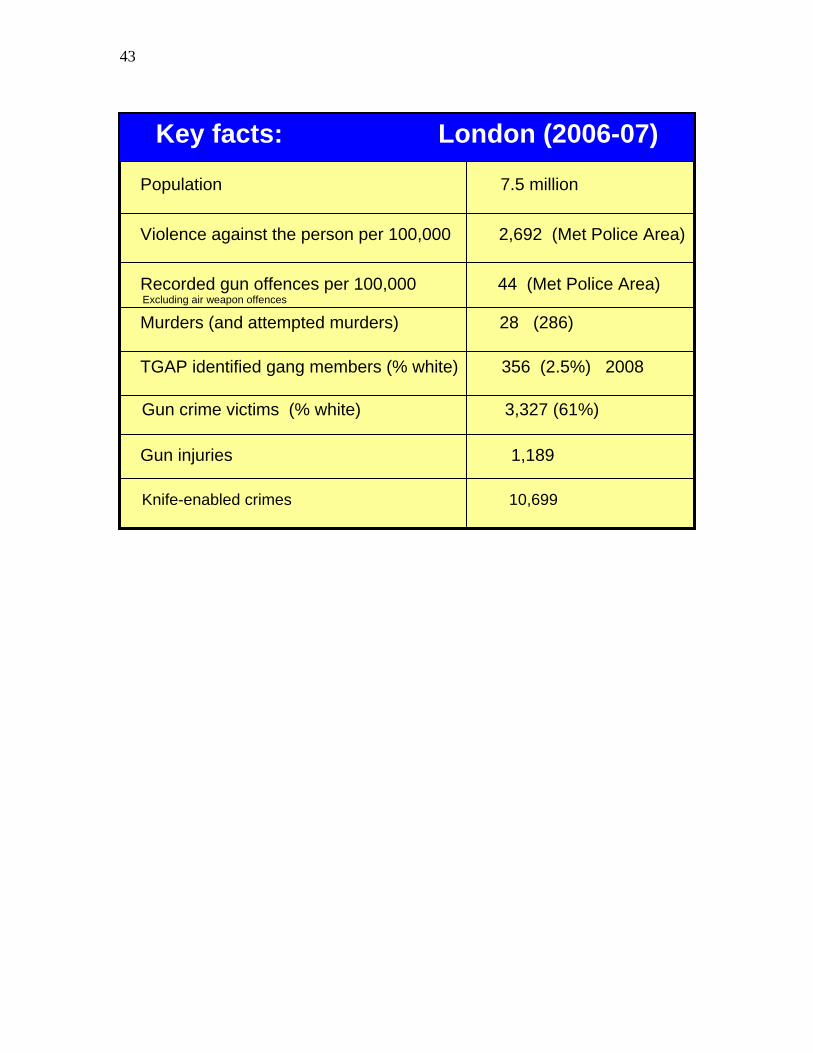
43
Key facts: London (2006-07)
Population 7.5 million
Violence against the person per 100,000 2,692 (Met Police Area)
Recorded gun offences per 100,000 44 (Met Police Area) Excluding air weapon offences Murders (and attempted murders) 28 (286)
TGAP identified gang members (% white) 356 (2.5%) 2008
Gun crime victims (% white) 3,327 (61%)
Knife-enabled crimes 10,699
Gun injuries 1,189
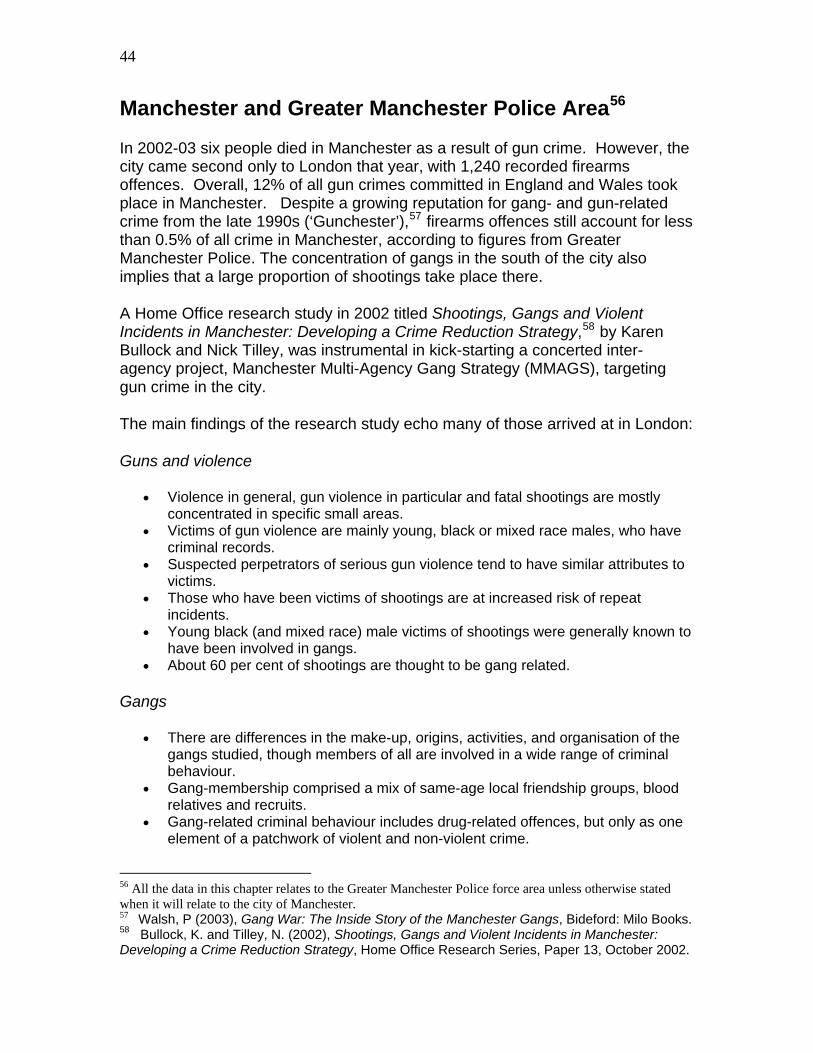
44
Manchester and Greater Manchester Police Area56
In 2002-03 six people died in Manchester as a result of gun crime. However, the city came second only to London that year, with 1,240 recorded firearms offences. Overall, 12% of all gun crimes committed in England and Wales took place in Manchester. Despite a growing reputation for gang- and gun-related crime from the late 1990s (‘Gunchester’),57 firearms offences still account for less than 0.5% of all crime in Manchester, according to figures from Greater Manchester Police. The concentration of gangs in the south of the city also implies that a large proportion of shootings take place there.
A Home Office research study in 2002 titled Shootings, Gangs and Violent Incidents in Manchester: Developing a Crime Reduction Strategy,58 by Karen Bullock and Nick Tilley, was instrumental in kick-starting a concerted inter-agency project, Manchester Multi-Agency Gang Strategy (MMAGS), targeting gun crime in the city.
The main findings of the research study echo many of those arrived at in London:
Guns and violence
• Violence in general, gun violence in particular and fatal shootings are mostly concentrated in specific small areas.
• Victims of gun violence are mainly young, black or mixed race males, who have criminal records.
• Suspected perpetrators of serious gun violence tend to have similar attributes to victims.
• Those who have been victims of shootings are at increased risk of repeat incidents.
• Young black (and mixed race) male victims of shootings were generally known to have been involved in gangs.
• About 60 per cent of shootings are thought to be gang related.
Gangs
• There are differences in the make-up, origins, activities, and organisation of the gangs studied, though members of all are involved in a wide range of criminal behaviour.
• Gang-membership comprised a mix of same-age local friendship groups, blood relatives and recruits.
• Gang-related criminal behaviour includes drug-related offences, but only as one element of a patchwork of violent and non-violent crime.
56 All the data in this chapter relates to the Greater Manchester Police force area unless otherwise stated when it will relate to the city of Manchester. 57 Walsh, P (2003), Gang War: The Inside Story of the Manchester Gangs, Bideford: Milo Books. 58 Bullock, K. and Tilley, N. (2002), Shootings, Gangs and Violent Incidents in Manchester: Developing a Crime Reduction Strategy, Home Office Research Series, Paper 13, October 2002.
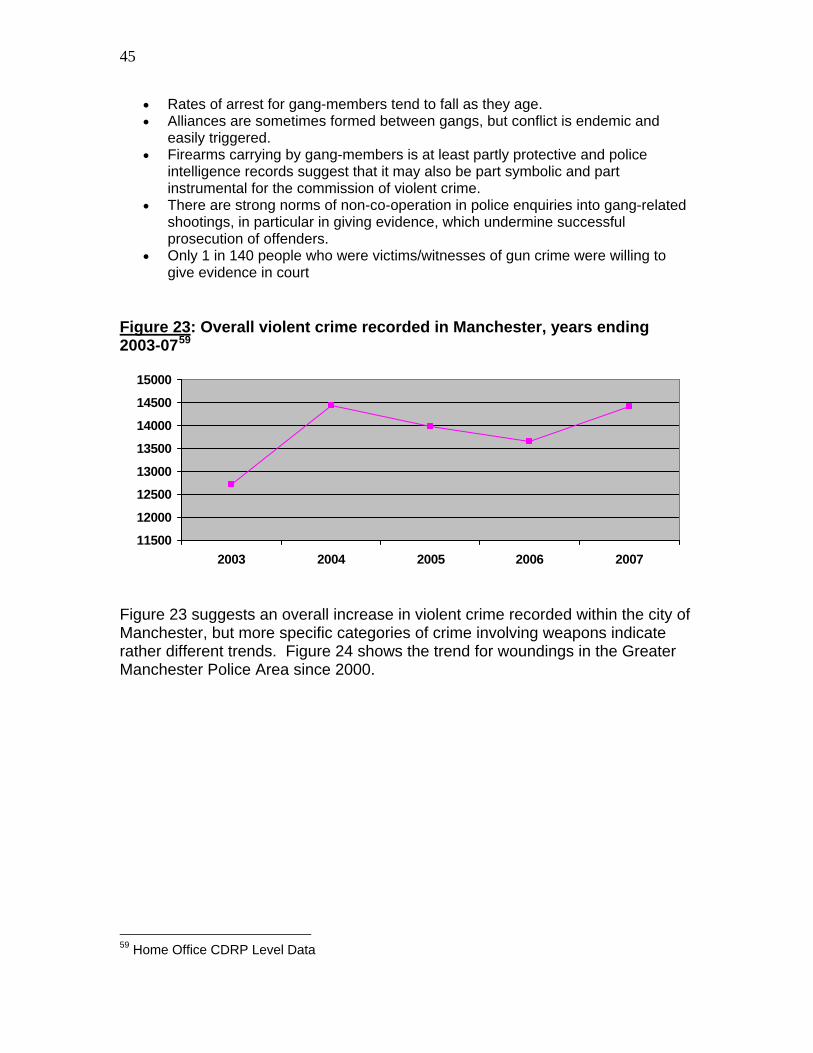
45
• Rates of arrest for gang-members tend to fall as they age. • Alliances are sometimes formed between gangs, but conflict is endemic and
easily triggered. • Firearms carrying by gang-members is at least partly protective and police
intelligence records suggest that it may also be part symbolic and part instrumental for the commission of violent crime.
• There are strong norms of non-co-operation in police enquiries into gang-related shootings, in particular in giving evidence, which undermine successful prosecution of offenders.
• Only 1 in 140 people who were victims/witnesses of gun crime were willing to give evidence in court
Figure 23: Overall violent crime recorded in Manchester, years ending 2003-0759
11500
12000
12500
13000
13500
14000
14500
15000
2003 2004 2005 2006 2007
Figure 23 suggests an overall increase in violent crime recorded within the city of Manchester, but more specific categories of crime involving weapons indicate rather different trends. Figure 24 shows the trend for woundings in the Greater Manchester Police Area since 2000. 59 Home Office CDRP Level Data

46
Figure 24: Woundings recorded in the Greater Manchester Police Area 60
05000
100001500020000250003000035000
2000 2001 2002 2003 2004 2005 2006 2007
Figure 25: Possession of unlawful weapons and firearm-related offending in the Greater Manchester Area61
0
500
1000
1500
2000
2500
1999 2001 2003 2005 2007
Possession ofWeaponsTotal firearminvolved offendingOther firearmviolenceFirearm robbery
Figure 25, again covering the entire Greater Manchester Area, details the trends in a range of weapon-possession and weapon-involved offences. With the exception of armed robberies which peaked in 2001 and have since stabilised at around 500 per year, weapons offences all appear to have peaked in 2005, declining slightly in the two subsequent years. Again, with the exception of armed robberies, weapon-related offending was still higher in 2007 than it had been in 1999. 60 Greater Manchester Police Annual Reports 2001-07 61 Greater Manchester Police Annual Reports 2001-07

47
Figure 26: Firearms discharges recorded in Manchester by GMP’s Operation Xcalibre62
Firearms Discharges in Manchester 2003-2006
05
10152025
J 03 A J O
J 04 A Jy O
J 05 A Jy O
J 06 A Jy
Despite the aforementioned reductions in gun- and weapon-related offending after 2005, the Greater Manchester Police intelligence-led anti-gun crime initiative, Operation Xcalibre, suggests that gun discharges (not necessarily reported in its crimes database) show seasonal variations but overall a relatively stable profile from year to year (Figure 26). Manchester Multi-Agency Gangs Strategy (MMAGS) Launched in 2001-02, the Manchester Multi-Agency Gangs Strategy (MMAGS) operates in south Manchester areas such as Moss Side, Hulme and Longsight, home to the city's most notorious gangs.63 However, as Figure 27 suggests, not all shootings are understood as directly ‘gang related’ – although, in the absence of the gang-led drug economy, and the other illegal economies within the city
62 Data supplied by GMP: Operation Xcalibre 63 The definition of ‘gangs’ and gang-related offending is given a somewhat more restricted definition in Manchester reflecting the issues developed in Bullock and Tilley’s (2002) Home Office Study. The term is used to refer to relatively enduring identifiable groups of young people who see themselves as members of those groups, and who commit crime as part of that membership. A youth gang is said ‘commonly to be thought of as a self-formed association of peers having the following characteristics: a gang name and recognised symbols, identifiable leadership, a geographic territory, a regular meeting pattern, and collective actions to carry out illegal activities’. At the time of the Bullock and Tilley study: ‘There [were] four major South Manchester gangs as defined here for the purposes of this research, and currently known to the police. These are Gooch, Doddington, Pitt Bull Crew and Longsight Crew. It must be remembered, though, that the situation regarding gangs is fluid – groups break up, new groups form, members come and go’ (page 23). Nevertheless, the study identified 187 gang-affiliated individuals, more than double the number of gang members targeted by the TGAP initiative five years later. See also the MMAGS definitions on page 23 of the Tackling Gangs: Practical Guide (Home Office, 2008).

48
with which gangs are frequently involved, whether the guns would be quite so available in the first place, is quite another matter. Figure 27: ‘Gang-related’ and ‘other’ shootings in Manchester, 1999-00 to 2003-04.64
0
1020
3040
5060
70
2000 2001 2002 2003 2004
Gang Related ShootingsOther Shootings
Overall, about 60% of shootings in Manchester were defined as ‘gang-related’ and people in certain areas of the south of the city were 140 times more likely than other Manchester residents to be shot, according to the Bullock and Tilley report.
The gang membership and composition analysis Bullock and Tilley (2002) carried out (see Table 1) shows the relative youth of the overwhelming majority of the gang members, including the fact that the younger members appear to have the higher arrest rates. Whilst only the Doddington (Dd) gang had an entirely black membership, the other gangs all had at least a three-quarters black membership – see Table 2.
64 MMAGS Report (2005),

49
Table 1: Manchester gang membership analysis65
Gang Go Dd LSC PBC Total
Number of known members aged under 25 64 30 67 26 187 Proportion of members under 17 8% 3% 12% 19% 10% Proportion of members 17 to 20 35% 13% 42% 46% 35% Proportion of members 21 to 24 58% 83% 45% 35% 54% Annual arrests per member under 17* 1.9 2 1.8 2.8 2.1 Annual arrests per member 17 to 20* 1.8 1.1 1.7 3.4 1.8 Annual arrests per member 21 to 24* 0.7 0.8 0.5 1.6 0.7 Percentage of known gang members who are black 86% 100% 75% 73% 79% When the researchers compared the use of guns by the gang members they found some striking similarities between the perpetrator and victim groups. Table 2: Manchester gang activity characteristics66 Characteristic Shooter Victim Average age 20 21 Afro-Caribbean 76% 69% White 17% 25% Male 98% 100% Live in ‘C’ division 65% 59% Average number of arrests 11 14 Average number of convictions 5.3 3.4
The Manchester Multi-Agency Gangs Strategy was developed in conjunction with the Bullock and Tilley research project, and features as Case Study 1 in the government’s Violent Crime Action Plan (2008). 65 Bullock and Tilley (2002), 24 66 ibid

50
The objectives of the MMAGS project are to:
• Present young people with opportunities in education • Provide support to victims, witnesses, young people and families who are
most vulnerable • Rehabilitate those convicted of gun crime and gang-involved offending • Present young people with opportunities in education and employment as
positive alternatives to gun and gang crime • Enforce the law through multi-agency targeted action, to secure
convictions and deter people from gang and gun crime • Reduce the impact of gun crime and gang-related activities on the
community • Create an environment for commercial investment in the rehabilitation
process.
Although firearms offences in Manchester remain high, gang-related shootings in the city fell by a third in the three years since MMAGS came into operation.
The MMAGS team claim to have worked with around 200 'targets' and scored some notable successes in turning gang members' lives around. Some have gone on to higher education or employment away from Manchester.
Key issues and key facts: Manchester
• On most criteria Manchester comes second in our violence ‘league table’, but while serious violence levels (Figure 2) appear to be falling, other violence trends (weapon related, woundings and overall violent crime) in the Manchester area appear to be rising. This trend is also true of weapon-related crime, although this appears to be falling slightly after 2005. • Weapon-related violence appears to be concentrated very unevenly in certain areas and in patterns similar to those reported for London.
• Gun violence and fatal shootings in particular are concentrated in specific small areas in south Manchester, and ‘weaknesses in services such as social services, health and education contributed as much to the problem as criminal justice issues’67
• Gangs are responsible for the majority (60%) of gun crime in the city.
• Black, mixed race and minority ethnic groups are disproportionately represented as both perpetrators and victims.
67 Renewal.net case study: Manchester Multi-Agency Gang Strategy, p.3, http://www.renewal.net/Documents/RNET/Case%20Study/Manchestermultiagency.doc.
51
• The carrying of weapons is motivated by similar reasons to those cited in London. Some research68 established in Manchester suggests both ‘instrumental’ and ‘expressive’ motivations for gun carrying, relating to different criminal activity profiles.
• Multi-agency interventions working on a number of dimensions of the gun crime problem (such as MMAGS) can prove effective in addressing the problems of gun violence. Enforcement action is unlikely to be effective on its own. Young people, in particular need opportunities and viable and credible opportunities and alternatives.
68 Hales, G., Lewis, C. and Silverstone, D. (2006), Gun Crime: The Market In and Use of Illegal Firearms, Home Office Research Study, No. 189; Squires, P. (2007), ibid.
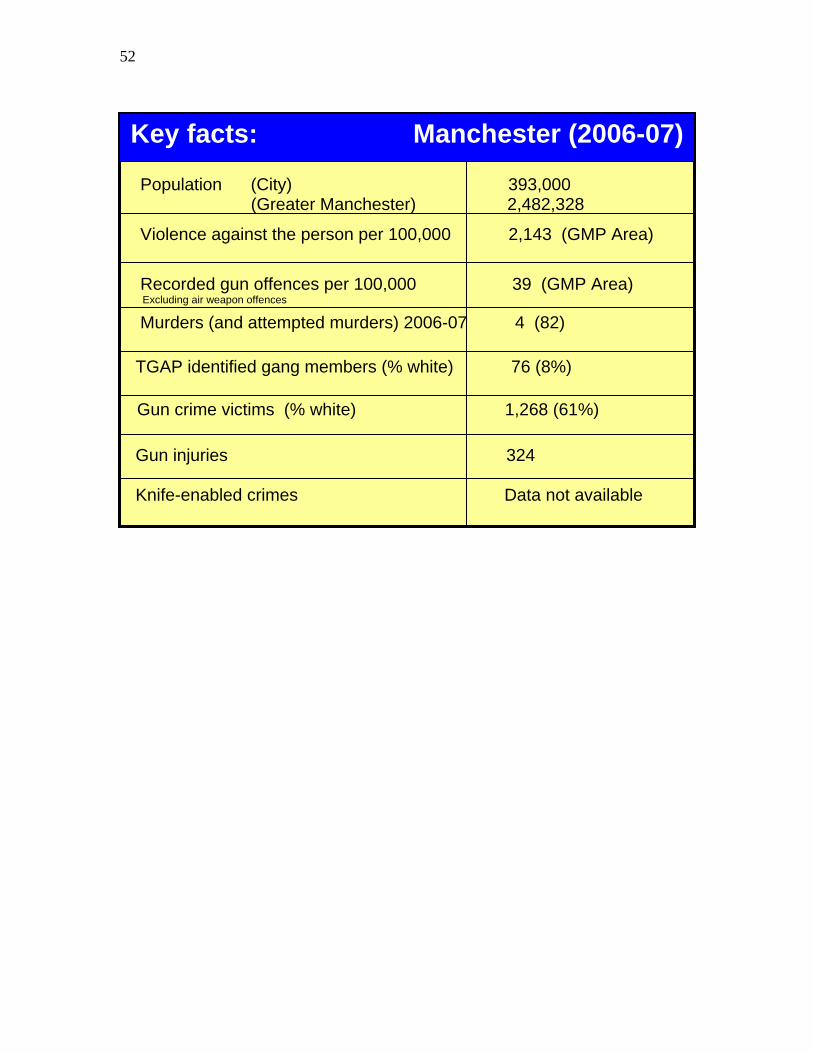
52
Key facts: Manchester (2006-07)
Population (City) 393,000 (Greater Manchester) 2,482,328
Violence against the person per 100,000 2,143 (GMP Area)
Recorded gun offences per 100,000 39 (GMP Area) Excluding air weapon offences Murders (and attempted murders) 2006-07 4 (82)
TGAP identified gang members (% white) 76 (8%)
Gun crime victims (% white) 1,268 (61%)
Gun injuries 324 Knife-enabled crimes Data not available

53
Birmingham and West Midlands Police Area69 Gun crime in Birmingham gained national exposure following the New Year’s Eve 2004 shooting of Charlene Ellis and Letisha Shakespeare. This incident drew attention to the pattern of gang-related violent crime developing in parts of the city. However, while the city’s overall profile of violent crime has risen fairly continuously since 2003 (see Figure 28), Figure 29 indicates a falling pattern of gun crime in the West Midlands until 2006, the figures rising again in 2007. Figure 28: Overall violent crime recorded in Birmingham, years ending 2003-0770
190002000021000220002300024000250002600027000
2003 2004 2005 2006 2007
Figure 29: Firearms offences recorded in the West Midlands, years ending 2002-0771
190019502000205021002150220022502300
2002 2003 2004 2005 2006 2007
69 All data in this section refers to the West Midlands Police area unless otherwise stated. 70 Home Office CDRP Level Data 71 West Midlands Police Annual Reports

54
Data for 2005-06 revealed that the number of offences involving the use of firearms had fallen for the fifth successive year across the West Midlands Police Force Area. The evidence shows a 9.7% reduction in the number of firearm-related offences (559 to 505) compared to the previous year in the Birmingham Community Safety Partnership (CSP) area. The following year, 2006-07, saw a slight upturn in the firearm-related crime trend. Figure 30 shows a significant increase in woundings, more than doubling between 2002 and 2004. At face value this is difficult to account for and suggests some change in recording practices (or other policy changes) by the police themselves. The robbery figure show a slight but steady decline over the six years represented in the graph. Figure 30: Woundings and robbery offences recorded in the West Midlands, years ending 2002-0772
05000
10000150002000025000300003500040000
2002 2003 2004 2005 2006 2007
WoundingRobbery
Figure 31 presents data from Birmingham city hospitals’ accident and emergency departments regarding casualties arriving with gunshot wounds. The years 2003 and 2004 show a marked increase in gun crime victims, although in each year for which the data has been made available, the majority of injuries were not serious or life-threatening.
72 West Midlands Police Annual Reports

55
Figure 31: Birmingham city hospital presentations with firearm injuries, 2002-04
0102030405060708090
2002 2003 2004
Immediate treatmentrequiredNot immediate
Perhaps surprisingly, gang violence and gun crime did not feature in the public priorities identified during public consultation in 2004. However, the extreme nature of the crime and its impact upon Birmingham’s reputation as a ‘safe city’, not least concerning the stigma of ‘gang violence’, have led to these issues being prioritised by Crime and Disorder Partnerships in Birmingham and the West Midlands. Local evaluations for the Birmingham Community Safety Partnership73 have drawn a link between local drug markets – specifically crack cocaine – and weapon-related violence in parts of the city. Key issues and key facts: Birmingham
• Recorded violent crime in the West Midlands has risen fairly continuously from 2003 to 2007.
• The West Midlands area experienced the most significant increase in firearm offending of the four TGAP cities examined.
• Firearms offences recorded in the West Midlands seem to show a falling pattern until 2006, the figures rising again in 2007.
• Wounding offences recorded in the West Midlands show a significant increase from 2002 to 2007 (some of the increase may be due to changes in recording practices).
• Local evaluations show a possible link between drug markets and weapon-related violence in parts of Birmingham and the West Midlands.
73 Birmingham Community Safety Partnership Crime and Disorder Audit (2005), Summary for Consultation.

56
Key facts: Birmingham (2006-07)
Population City 971,000 West Midlands 2,555,592
Violence against the person per 100,000 2,156 (West Midlands)
Recorded gun offences per 100,000 38 (West Midlands) Excluding air weapon offences Murders (and attempted murders) 06-07 3 (90) TGAP identified gang members (% white) 127 (3%)
Gun crime victims (% white) 979 (52%)
Knife-enabled crimes Data not available
Gun injuries 120
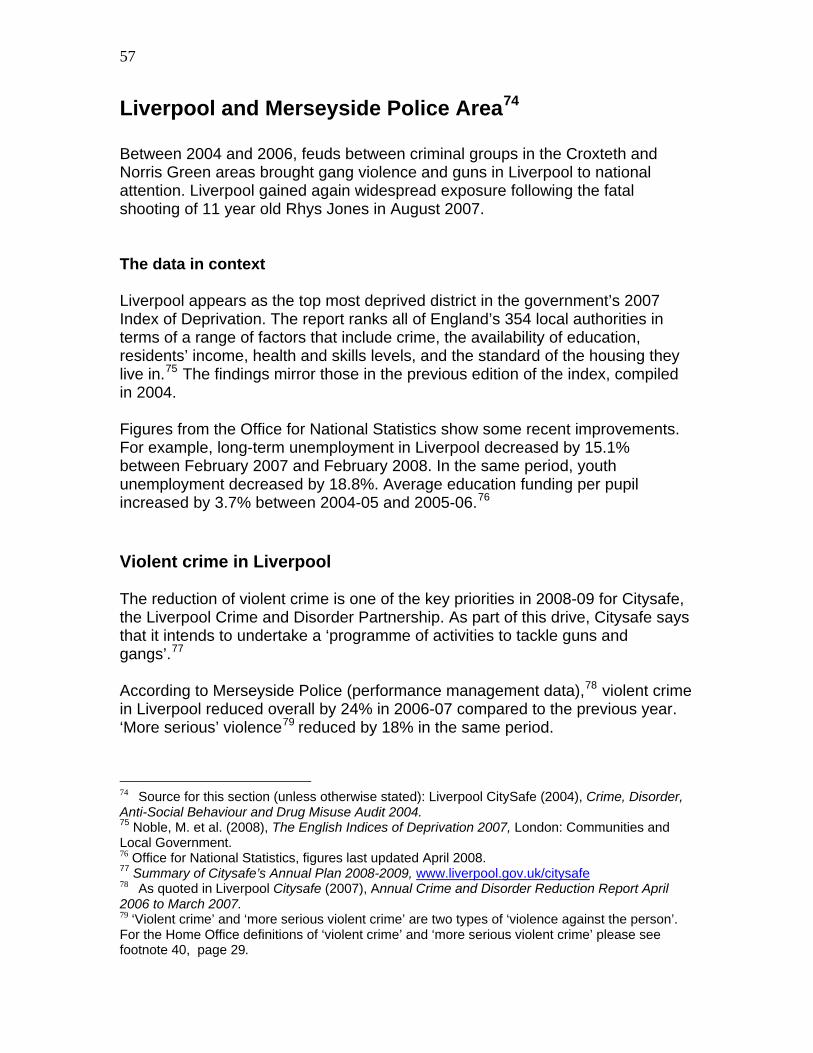
57
Liverpool and Merseyside Police Area74 Between 2004 and 2006, feuds between criminal groups in the Croxteth and Norris Green areas brought gang violence and guns in Liverpool to national attention. Liverpool gained again widespread exposure following the fatal shooting of 11 year old Rhys Jones in August 2007. The data in context Liverpool appears as the top most deprived district in the government’s 2007 Index of Deprivation. The report ranks all of England’s 354 local authorities in terms of a range of factors that include crime, the availability of education, residents’ income, health and skills levels, and the standard of the housing they live in.75 The findings mirror those in the previous edition of the index, compiled in 2004.
Figures from the Office for National Statistics show some recent improvements. For example, long-term unemployment in Liverpool decreased by 15.1% between February 2007 and February 2008. In the same period, youth unemployment decreased by 18.8%. Average education funding per pupil increased by 3.7% between 2004-05 and 2005-06.76 Violent crime in Liverpool The reduction of violent crime is one of the key priorities in 2008-09 for Citysafe, the Liverpool Crime and Disorder Partnership. As part of this drive, Citysafe says that it intends to undertake a ‘programme of activities to tackle guns and gangs’.77 According to Merseyside Police (performance management data),78 violent crime in Liverpool reduced overall by 24% in 2006-07 compared to the previous year. ‘More serious’ violence79 reduced by 18% in the same period.
74 Source for this section (unless otherwise stated): Liverpool CitySafe (2004), Crime, Disorder, Anti-Social Behaviour and Drug Misuse Audit 2004. 75 Noble, M. et al. (2008), The English Indices of Deprivation 2007, London: Communities and Local Government. 76 Office for National Statistics, figures last updated April 2008. 77 Summary of Citysafe’s Annual Plan 2008-2009, www.liverpool.gov.uk/citysafe 78 As quoted in Liverpool Citysafe (2007), Annual Crime and Disorder Reduction Report April 2006 to March 2007. 79 ‘Violent crime’ and ‘more serious violent crime’ are two types of ‘violence against the person’. For the Home Office definitions of ‘violent crime’ and ‘more serious violent crime’ please see footnote 40, page 29.
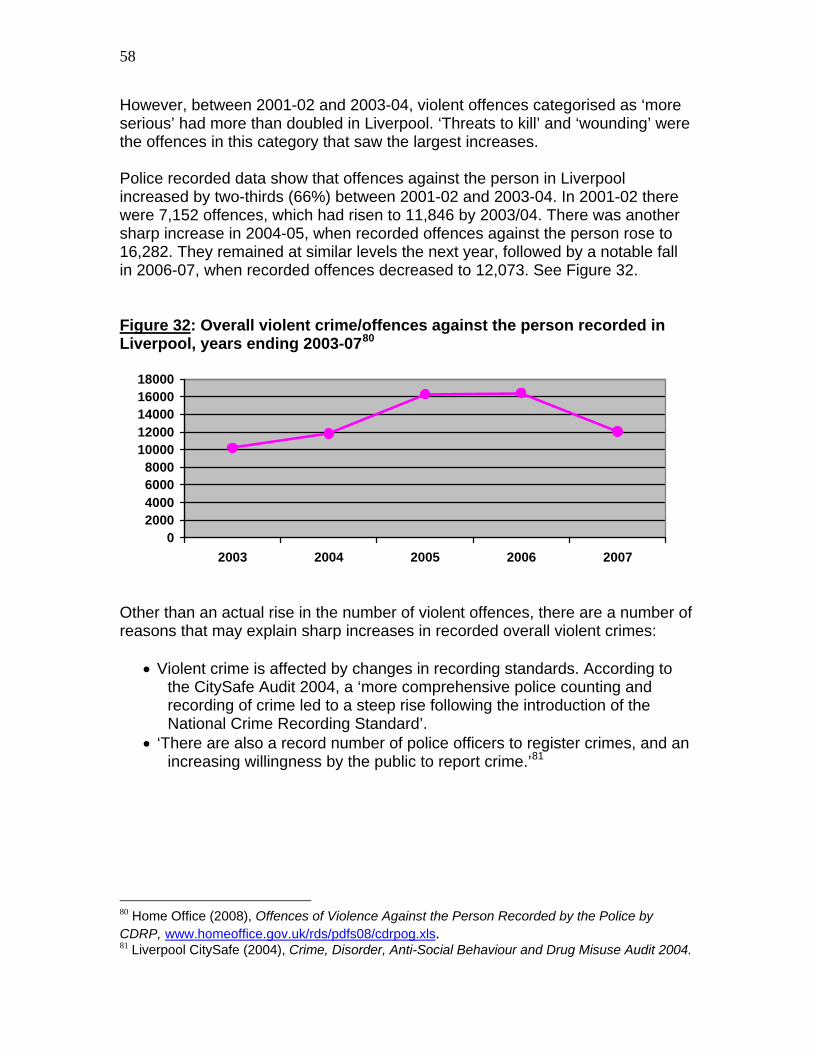
58
However, between 2001-02 and 2003-04, violent offences categorised as ‘more serious’ had more than doubled in Liverpool. ‘Threats to kill’ and ‘wounding’ were the offences in this category that saw the largest increases. Police recorded data show that offences against the person in Liverpool increased by two-thirds (66%) between 2001-02 and 2003-04. In 2001-02 there were 7,152 offences, which had risen to 11,846 by 2003/04. There was another sharp increase in 2004-05, when recorded offences against the person rose to 16,282. They remained at similar levels the next year, followed by a notable fall in 2006-07, when recorded offences decreased to 12,073. See Figure 32. Figure 32: Overall violent crime/offences against the person recorded in Liverpool, years ending 2003-0780
02000400060008000
1000012000140001600018000
2003 2004 2005 2006 2007
Other than an actual rise in the number of violent offences, there are a number of reasons that may explain sharp increases in recorded overall violent crimes:
• Violent crime is affected by changes in recording standards. According to the CitySafe Audit 2004, a ‘more comprehensive police counting and recording of crime led to a steep rise following the introduction of the National Crime Recording Standard’.
• ‘There are also a record number of police officers to register crimes, and an increasing willingness by the public to report crime.’81
80 Home Office (2008), Offences of Violence Against the Person Recorded by the Police by CDRP, www.homeoffice.gov.uk/rds/pdfs08/cdrpog.xls. 81 Liverpool CitySafe (2004), Crime, Disorder, Anti-Social Behaviour and Drug Misuse Audit 2004.

59
Where does violence take place? Violent crime is not spread evenly across Liverpool: see Figures 33 and 34. The city centre has the highest concentrations of violence, with particular hotspots (between Central and Riverside) within this area. The concept of a ‘night-time economy’ - with concentrated numbers of outlets selling alcohol in city centres which lack alternative attractions and social reference points for young people - may help us contextualise such spatial/geographical unevenness of violence.82 Figure 33: Violence against the person in Liverpool83
82 See e.g. Hobbs, D. (2005), Bouncers: Violence and Governance in the Night-time Economy’, Oxford: Oxford University Press. 83 Source: Merseyside Police, recorded crime. Map included in Citysafe (2007), Citysafe’s Strategic Intelligence Assessment Executive Summary September 2006 to August 2007, Liverpool: Liverpool City Council.

60
Figure 34: Violence against the person in Liverpool by ward, 2003-0484
Victims and perpetrators of violence Males are over-represented as victims of violence when compared with the overall population of Liverpool (439,500), of which they constitute 48.4%.85 White people are the largest group of victims of crime generally, although they are under-represented when compared to the general population. Minority ethnic coummunities are ‘consistently over-represented’ as victims.86 Of all victims of violence in 2003-04: • 59% were male and 41% female • 91% were white European • the peak age group was 18-23, with the peak age being 19.87 Under-25s were still the main victims of injury violence by 2006-07.88 However, it is worth bearing in mind that victim profiles can vary greatly, depending on the type of violent offence.
84 Liverpool CitySafe (2004), Crime, Disorder, Anti-Social Behaviour and Drug Misuse Audit 2004. 85 Liverpool had, by a mid-2006 estimate, 436,100 inhabitants. There were an estimated 77,626 young people aged 15 or under, accounting for 17.8% of the population (Office of National Statistics, April 2008). 86 Citysafe (2007), ibid. 87 ibid. 88 Citysafe (2007), Citysafe’s Strategic Intelligence Assessment Executive Summary September 2006 to August 2007, Liverpool: Liverpool City Council.
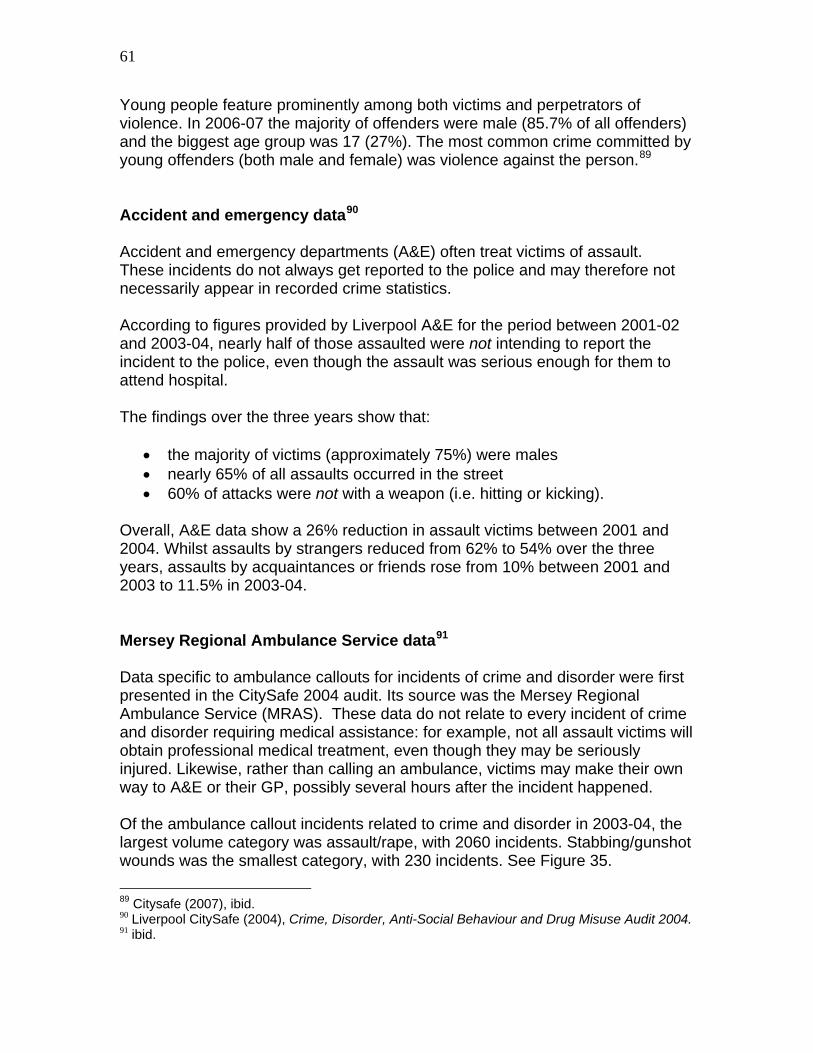
61
Young people feature prominently among both victims and perpetrators of violence. In 2006-07 the majority of offenders were male (85.7% of all offenders) and the biggest age group was 17 (27%). The most common crime committed by young offenders (both male and female) was violence against the person.89 Accident and emergency data90 Accident and emergency departments (A&E) often treat victims of assault. These incidents do not always get reported to the police and may therefore not necessarily appear in recorded crime statistics. According to figures provided by Liverpool A&E for the period between 2001-02 and 2003-04, nearly half of those assaulted were not intending to report the incident to the police, even though the assault was serious enough for them to attend hospital. The findings over the three years show that:
• the majority of victims (approximately 75%) were males • nearly 65% of all assaults occurred in the street • 60% of attacks were not with a weapon (i.e. hitting or kicking).
Overall, A&E data show a 26% reduction in assault victims between 2001 and 2004. Whilst assaults by strangers reduced from 62% to 54% over the three years, assaults by acquaintances or friends rose from 10% between 2001 and 2003 to 11.5% in 2003-04. Mersey Regional Ambulance Service data91 Data specific to ambulance callouts for incidents of crime and disorder were first presented in the CitySafe 2004 audit. Its source was the Mersey Regional Ambulance Service (MRAS). These data do not relate to every incident of crime and disorder requiring medical assistance: for example, not all assault victims will obtain professional medical treatment, even though they may be seriously injured. Likewise, rather than calling an ambulance, victims may make their own way to A&E or their GP, possibly several hours after the incident happened. Of the ambulance callout incidents related to crime and disorder in 2003-04, the largest volume category was assault/rape, with 2060 incidents. Stabbing/gunshot wounds was the smallest category, with 230 incidents. See Figure 35. 89 Citysafe (2007), ibid. 90 Liverpool CitySafe (2004), Crime, Disorder, Anti-Social Behaviour and Drug Misuse Audit 2004. 91 ibid.

62
Figure 35: Ambulance callouts to crime and disorder incidents in Liverpool, 2003-04
0102030405060708090
2002 2003 2004
Immediate treatmentrequiredNot immediate
MRAS data for 2003-04 also shows that the peak time for violent incidents was between 2am and 3am, coinciding with club closing times. The peak day of the week for callouts relating to crime and disorder was Saturday, closely followed by Sunday. Firearm offences in Merseyside Firearm offences92 recorded by Merseyside police for the whole police area show an overall increase in the total offences (excluding air weapons) between 2002-03 and 2006-07. The numbers went up from 318 in 2002-03 to 410 in 2006-07, although the recorded offences peaked in 2004-05 to 491 then fell during the following two years. See Figure 36.
92 Firearms offences include: violence against the person, robbery, burglary and criminal damage.

63
Figure 36: Police recorded firearm offences (excluding air weapons) in Merseyside, 2002-03 to 2006-0793
0
100
200
300
400
500
600
2003 2004 2005 2006 2007
Looked at against the total number of offences recorded in the Merseyside Police area, firearm offences constitute a small proportion: just under 0.3% of all offences, a percentage which has remained largely constant between 2004-05 and 2006-07.94 Looking at the last three years, we can examine how the total police recorded firearm offences break down. Out of the 491 total firearm offences recorded in 2004-05, 294 (60%) were instances of violence against the person (VAP), of which eight were murders and 57 were attempted murders and other acts (the remaining 229 were acts recorded as ‘other violence against the person’).95 In 2005-06, out of 485 recorded firearm offences, 264 (54%) were offences against the person. Of these 264, only one incident was a murder; 63 were attempted murders and other ‘acts endangering life’ and 200 constituted other violence against the person. In 2006-07, firearm-involved violence against the person amounted to 172 incidents, 42% of the total recorded firearm offences (410). Of these 172 incidents, five were murders, 48 were attempted murders and other acts and the remaining 119 were classified as other violence against the person.96 However, it is worth bearing in mind that firearms are used in a small minority of instances of violence against the person. Firearms were used in only 1.4% of all instances of violence against the person recorded in Merseyside both in 2004-05 (when a total of 34,178 offences against the person were recorded) and in 2005-
93 Povey P., Coleman K., Kaiza P., Hoare J. and Jansson K. (2008), ‘Homicides, firearm offences and intimate violence 2006/07, Home Office Statistical Bulletin, p.57. 94 Home Office, City Profiles Data, supplied May 2008. 95 ibid. 96 ibid.
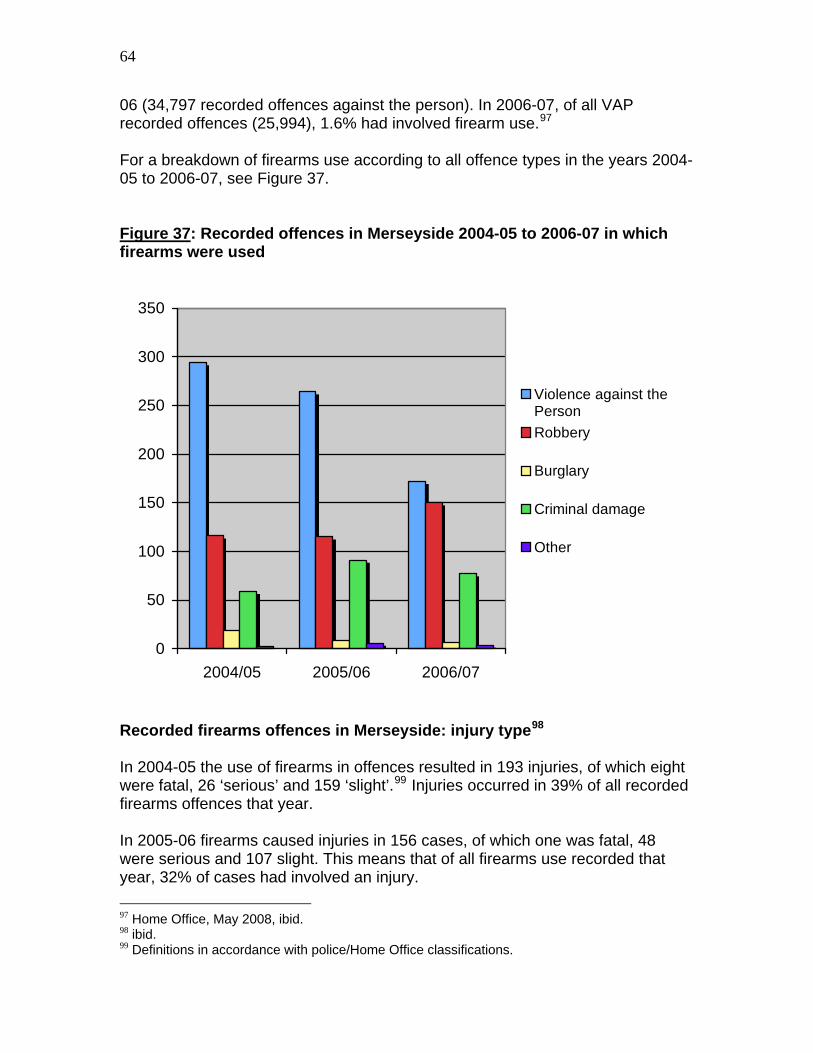
64
06 (34,797 recorded offences against the person). In 2006-07, of all VAP recorded offences (25,994), 1.6% had involved firearm use.97 For a breakdown of firearms use according to all offence types in the years 2004-05 to 2006-07, see Figure 37. Figure 37: Recorded offences in Merseyside 2004-05 to 2006-07 in which firearms were used
0
50
100
150
200
250
300
350
2004/05 2005/06 2006/07
Violence against thePersonRobbery
Burglary
Criminal damage
Other
Recorded firearms offences in Merseyside: injury type98 In 2004-05 the use of firearms in offences resulted in 193 injuries, of which eight were fatal, 26 ‘serious’ and 159 ‘slight’.99 Injuries occurred in 39% of all recorded firearms offences that year. In 2005-06 firearms caused injuries in 156 cases, of which one was fatal, 48 were serious and 107 slight. This means that of all firearms use recorded that year, 32% of cases had involved an injury. 97 Home Office, May 2008, ibid. 98 ibid. 99 Definitions in accordance with police/Home Office classifications.
65
In 2006-07 there were five firearms-related fatalities; 31 injuries were serious and 62 slight. Overall the proportion of injuries in relation to the number of incidents where firearms were used is 24%. Performance results Performance results for Merseyside Police show that the ‘life threatening and gun crime’ rate per 1,000 population in 2006-07 was 1.4, against a target reduction rate of 0.97.100 The previous year, police performance in ‘reducing crime’ for the ‘life threatening and gun crime rate’ is described as ‘poor’ and its direction ‘stable’.101 Victims of firearms offences102 A significant proportion (almost a quarter) of victims’ profiles in Merseyside are not known or not available. With regards to the victims of firearm-related offences whose details are known, the distribution by age has remained stable between 2004-05 and 2006-07. The largest group in 2004-05 was made up of those aged between 11 and under 30 (34%), followed by those aged between 30 and under 50 (23%). Twenty-two per cent of victims were aged between five and under 21; 18% were aged 11 to under 21; 16% were between 21 and under 30. In 2005-06 those in the 11 to under 30 group constituted 35% of all firearms victims and those aged between 30 and under 50 made up 29% of all firearms victims. In 2006-07 the 11 to under 30s remained (in spite of a rise in the proportion of victims whose details were not known or available) the largest group of firearms victims (30%), followed by people aged 30 to under 50 (22%). See Figure 38 for a detailed breakdown of victims by age.
100 Merseyside Police Authority (2007), 2006-07 Performance against Policing Performance Assessment Framework (PPAF) Statutory Indicators (SPI’s). 101 Merseyside Police Performance Assessment for 2005-06, in Merseyside Police Authority (2007), ibid. 102 Home Office, May 2008, unpublished (private correspondence).

66
Figure 38: Victims of firearms offences by age, Merseyside Police Area, 2004-05 to 2006-07
0 20 40 60 80 100 120 140 160
2004/05
2005/06
2006/07
Unknown/not available70 years and over50-under 7030-under 5021-under 3016-under 2111-under 165-11 years
Of the firearms victims whose details are known in Merseyside, most are males: their proportion has been rising, with males constituting 52% of victims in 2004-05, 53% in 2005-06 and 60% in 2006-07. Victims of firearms offences in Merseyside are overwhelmingly white – see Figure 39. Over the three years 2004-05 to 2006-07, 932 victims in total were white; 68 were Chinese or other, 26 were Black or Black British and 24 were Asian/Asian British.

67
Figure 39: Number of victims of recorded firearm offences for the period 2004-05 to 2006-07, by ethnicity, in Merseyside Police Area103
932
2426 68
736
Asian/Asian BritishBlack/Black BritishChinese or otherMixedUnknown/not availableWhite
In terms of percentages, white people constituted 85% of all victims of recorded firearm offences (932 out of 1093) between 2004-05 and 2006-07. In the same period, 6% of all victims were Chinese or other, 2% were Black/Black British and 2% were Asian/Asian British. See figure 40 for a breakdown by ethnicity for each of the last three years.
103 N.B. Data where the victims gender is unknown, is omitted.

68
Figure 40: Number of victims of recorded firearms offences, by ethnicity, in Merseyside Police Area, for each year 2004-05 to 2006-07104
6 8 105 13 81424 30
0 2 525
7 4
309 314 309
0
50
100
150
200
250
300
350
2004/05 2005/06 2006/07
Asian/Asian BritishBlack/Black BritishChinese or otherMixedUnknown/not availableWhite
As we have noted already, a point we return to later in the four cities comparison, violence and gangs in the Liverpool/Merseyside area is a predominantly white issue. Gangs Organised crime activities in the areas of Croxteth and Norris Green came to the attention of the authorities in the early 2000s. By 2002-03, ‘criminal families’ had established themselves in the control of illegal drugs and were involved in ‘criminality at all levels, from burglary to drug dealing’. In early 2004, an individual linked to one of the families was shot and killed. The investigation into this incident revealed that two distinct criminal groups had formed in the area, the ‘Croxteth Crew’ and the ‘Strand’. The two groups were known to exercise violence, including using knives and guns, over dealing rights and debt enforcement. After the 2004 fatality, a number of ‘tit for tat’ shootings and attacks against property and people took place. By 2005, police identified that the two groups had grown in size and had each about 20 known criminals associated with them. In August 2006, a member of the Norris Green faction was shot and 104 N.B. Incomplete data about firearms victims, where the victims gender is unknown, is omitted.
69
killed. The victim was described in the local and national press as a ‘gang leader’. Graffiti and floral tributes left at the spot also referred to gangs.105 The Matrix Firearms Team In January 2005, Merseyside Police created the Matrix Firearms Team, a specialist unit dealing with gun and gang crime. The team uses covert operations, uniformed disruption activity and reactive investigations. It combines prevention and diversion strategies with ‘aggressive tactics to clear gang members from small, priority areas … complemented by the strategic use of partnership powers (evictions, care proceedings, etc.)’.106 Part of such tactics is the targeting of ‘impact players’, defined as individuals involved with firearms and ‘with the potential to cause the most harm’ in crime hotspots. ‘Impact players’ include family members of people involved in gun crime as well as ‘non-cooperative’ victims (intervention on the latter is meant to prevent retaliatory violence). Such individuals are served with a written notice warning them that, unless they cease ‘their involvement in gun-enabled crime’, they are to be subjected a range of ‘enforcement and disruption’ measures, i.e: • ‘The use of named Section 60 orders to allow gang members to be searched for
weapons at any time;
• the seeking of ASBOs to prevent gang members from frequenting geographical locations or contacting named individuals from part of their network;
• eviction if they were causing disorder in the neighbourhood; • implementation of child protection measures if children within their families are at
risk of harm; • enforcement of the law for all offences, however minor; and • the seeking of tight bail conditions for any offences dealt with and robust policing of
those conditions.’107 This ‘zero tolerance’ type of policing is being exercised with the help of civic authorities. The approach raises issues around the civil rights of suspects and of people with no proven involvement in crime, such as families or indeed victims, who seem to be penalised by association. Moreover, it is important to ascertain the impact of such strategies on crime reduction and residents’ fear of crime: this needs to be independently assessed. Characteristics of ‘key gang members’ in Liverpool In an analysis of local intelligence carried out by Merseyside Police as part of the 105 Home Office (2008), Tackling Gangs: A Practical Guide for Local Authorities, CDRPs and Other Local Partners, London: Home Office. 106 Home Office (2008), ibid. 107 ibid, p.76.
70
the Home Office led Tackling Gangs Action Programme, 96 individuals were identified as ‘key gang members’ in Liverpool. The police profiling focused almost entirely on white individuals. Of the 96 identified ‘key gang members’, 96% were white; their mean age was 21. They often had extensive criminal histories: the mean number of convictions was 16, and 94% of the identified gang members had received criminal convictions when underage (under the age of 18). Seventy-six per cent had been convicted of a drug offence, 55% of a violent offence and 58% of theft. Gang members were said to be ‘predominantly male’.108 The ethnic make-up of ‘key gang members’ in Liverpool contrasts with the three other TGAP areas (London, Birmingham and Manchester), where gang members identified by the police were predominantly Black Caribbean.109 Young people’s perceptions A project undertaken in Liverpool 8 (Toxteth), called ‘Include Young Voices’, examined young people’s perceptions of the levels of weapon-related violence in their community. The study showed mixed reactions on the part of young residents in the area. For some, ‘the main concern was fear, fear of guns, gun culture and gangs. The majority of the young people we engaged with had a personal story involving guns, whether it concerned someone close or someone they knew’. Other young participants to the project thought that gun culture was “'cool’ as though they were living in a ghetto’ and weapon carrying was ‘normal’, whereas others simply said they were ‘scared’.110 Key issues and key facts: Liverpool
• Recorded violent crime fell in Liverpool by almost a quarter between 2005-06 and 2006-07. However, before then, it had increased substantially between 2001-02 and 2005-06. There were just over 10,000 recorded violent incidents in 2002-03; these had increased to over 16,000 by 2004-05.
• Violent incidents are concentrated spatially and temporally – mainly in the city centre, occurring especially at weekends in the early hours of the morning, usually around pubs’ and clubs’ closing times.
• The majority of victims of assaults are young, white European males. However, in comparison with the general population of the city, white
108 Dawson, P. (2008), Early Research Findings from the Tackling Gangs Action Programme. 109 ibid. 110 Hunter, R. (2006), ‘Include Young Voices’: Final Report Year 3, St. Helens: Groundwork.
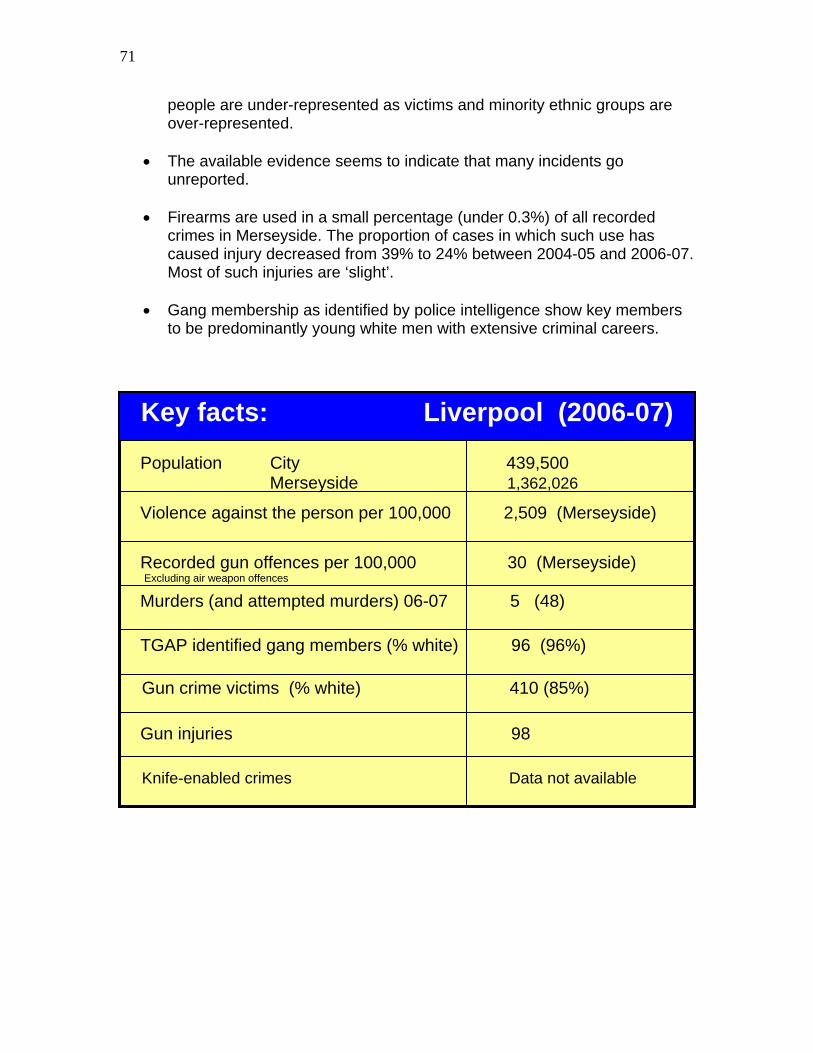
71
people are under-represented as victims and minority ethnic groups are over-represented.
• The available evidence seems to indicate that many incidents go
unreported.
• Firearms are used in a small percentage (under 0.3%) of all recorded crimes in Merseyside. The proportion of cases in which such use has caused injury decreased from 39% to 24% between 2004-05 and 2006-07. Most of such injuries are ‘slight’.
• Gang membership as identified by police intelligence show key members
to be predominantly young white men with extensive criminal careers.
Key facts: Liverpool (2006-07)
Population City 439,500 Merseyside 1,362,026
Violence against the person per 100,000 2,509 (Merseyside)
Recorded gun offences per 100,000 30 (Merseyside) Excluding air weapon offences
Murders (and attempted murders) 06-07 5 (48)
TGAP identified gang members (% white) 96 (96%)
Gun crime victims (% white) 410 (85%)
Knife-enabled crimes Data not available
Gun injuries 98

72
Glasgow and Strathclyde Police Area111 The data in context Glasgow is the largest of Scotland’s cities, with a population of approximately 579,000. ‘Despite positive economic growth, 41 of the city’s 79 wards are among the most deprived in Scotland. This equates to 292,599 people in the city living in an area of deprivation’, with 60% of the population living in areas of multiple deprivation (facing, for example, homelessness, poverty, ill health, unemployment and low education/skills levels).112 The following examples illustrate the scale of deprivation in Glasgow:
• Around 42% of Glasgow’s children under 16 are living in families dependent on Income Support. This rises to 60% in some areas, compared to a Scottish average of approximately 25%.
• Glasgow has the highest percentage in Scotland of pupils entitled to free meals (42.3%). The Scottish average is less than half at 20.3%.
• In the mid 2000s there were almost 2,500 children and young people in Glasgow ‘looked after’ by social services, after causing ‘a range of concerns’. Approximately 500 of them had been the subject of referrals on grounds of an offence.
• The 2001 Census shows that in Great Britain on average 25% of families with children were lone parent families. In Glasgow the average is 46.4% and in ten of the city’s postcode sectors it is almost 70%.
• Almost 25% of Glasgow’s adult population (aged 16-65 years) experience some form of mental health problem that negatively impacts on their capacity to manage their lives. ‘When compared to people living in affluent areas, people in the most deprived areas of Glasgow are: 2.7 times more likely to be admitted to hospital for depression; ten times more likely to be admitted to hospital for an alcohol related problem; 33 times more likely to be admitted to hospital for a drug misuse problem.’113
111 Source for the data in this section, unless otherwise stated: Strathclyde Police Area Violence Reduction Unit (VRU), April 2008. The data therefore covers the police area of Strathclyde unless otherwise stated. It is also important to recognise, when dealing with Glasgow and the Strathclyde Police Area, that we are dealing with a separate legal and political jurisdiction. 112 Glasgow Antisocial Behaviour Strategy Group (n.d.), Glasgow’s Antisocial Behaviour Strategy 2005-08. 113 ibid.

73
Violent crime in Scotland and Strathclyde According to the World Health Organization,114 the murder rate in Scotland for males aged between 10-29 is 5.3 per 100,000 population. The murder rate in England and Wales for the same age group is 1.0. The overall rate in Scotland is 3.1 per 100,000 population, which is similar to Argentina, Costa Rica and Lithuania. The rate of murder committed with a knife in Scotland is 3.5 times higher than that in England and Wales. Forty-two per cent of the prison population in Scotland are incarcerated for non-sexual violent crimes.115 Although overall levels of crime have fallen in the west of Scotland, levels of violent crime, in particular knife crime, have remained relatively constant for the last 40 years. ‘High levels of knife carrying, gang violence and feuds between rival criminal gangs are common features, often fuelled by alcohol.’116 An ‘Offensive Weapons Court’ was set up in Strathclyde in 2005, with Greenock Sheriff Court dedicating a regular slot to deal with offenders arrested in possession of a knife or other offensive weapons. Designed to fast-track such offences, the court has ‘the same sheriff sitting at each session’, and is said to offer ‘a more consistent approach to sentencing’.117 Violent crime in Glasgow In recent years, Glasgow has seen ‘a steady decrease in the overall rate of recorded crime’, including a ‘significant fall’ in housebreaking, theft and shoplifting. However, there has been a ‘rise in violent crime’, and public concerns around crime and anti-social behaviour feature strongly among the issues that trouble Glasgow residents.118 Glasgow has the highest rate of murder (irrespective of weapon used, if any) in Europe per head of population.119 In 2007 there were 25 murders in Glasgow: this amounts to a rate of 4.3 per 100,000 people (the second highest was London
114 World Health Organization (2002), World Report on Violence and Health, Geneva: World Health Organization. 115 VRU (2007), Violence Reduction Unit Strategic Plan, Glasgow: VRU. 116 Strathclyde Police, Public Performance Report 2006/07. 117 ibid. 118 Glasgow Antisocial Behaviour Strategy Group (n.d), Glasgow’s Antisocial Behaviour Strategy 2005-08. 119 World Health Organization (2002), ibid.

74
with 2.3%). The average murder rate per year in the period 2003-05 in Glasgow was 6.17 per 100,000 population.120 Research conducted in three Glasgow hospitals in March 2004121 suggests that violence is significantly under-reported. It is estimated from this study that the police under-record serious assaults ‘by at least 50% and possibly nearer 70%’ (VRU). Knife crime Although some of the information in this section relates to recorded crimes in Strathclyde (an area which spans from Ayrshire and Argyll and Bute in the west to South Lanarkshire in the east), the overwhelming majority of the Strathclyde knife crime relates to the Glasgow area.122 Most knife crime is committed late at night or in the early hours of the morning.123 Carrying of knives Crime recorded figures for Strathclyde over the last three years show a fairly stable picture with regard to the carrying of knives and other offensive weapons. Police collect figures in relation to the offence of having an article with a blade or point in a public place (covered by section 49 of the Criminal Law Consolidation (Scotland) Act 1995). The number of such crimes recorded in Strathclyde in 2004-05 was 2,877. This decreased to 2,679 the following year, and fell again slightly to 2,665 in 2006-07. Knife carrying can also be recorded as an offence under section 47 of the Criminal Law Consolidation (Scotland) Act 1995, which prohibits the carrying of an offensive weapon. However, it is important to bear in mind that not all offensive weapons will be knives. The number of such offences rose from 3,542 in 2004-05 to 3,698 the following year, and remained stable in 2006-07. See Figure 41.
120 Eurostat, Crime and Criminal Justice Statistics, Nov 2007, in Homicide in Scotland 2006-07. 121 Research by Professor A. Ashraf, Glasgow University Dental Hospital and Dr. C. Goodall, Glasgow University Dental School – information supplied by VRU. 122 The Scottish Government (2007), ‘Knife crime policy’, Press Release, 20/3/07. 123 ibid.
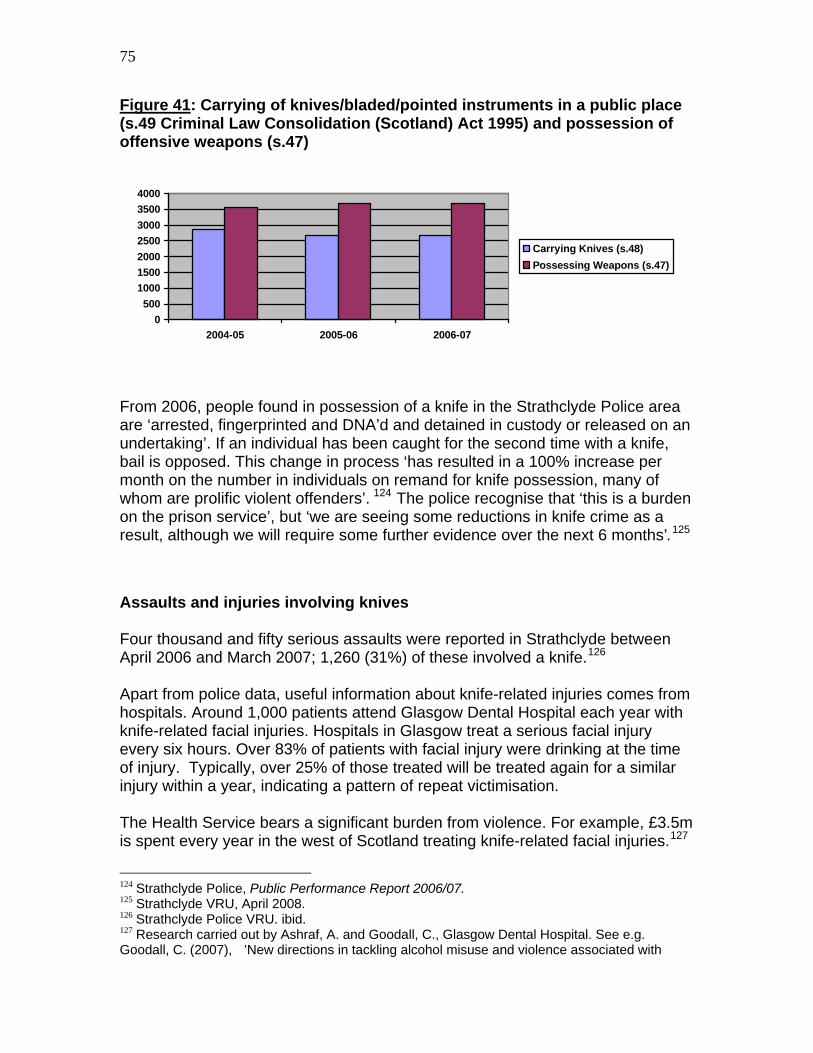
75
Figure 41: Carrying of knives/bladed/pointed instruments in a public place (s.49 Criminal Law Consolidation (Scotland) Act 1995) and possession of offensive weapons (s.47)
0500
1000150020002500300035004000
2004-05 2005-06 2006-07
Carrying Knives (s.48)Possessing Weapons (s.47)
From 2006, people found in possession of a knife in the Strathclyde Police area are ‘arrested, fingerprinted and DNA’d and detained in custody or released on an undertaking’. If an individual has been caught for the second time with a knife, bail is opposed. This change in process ‘has resulted in a 100% increase per month on the number in individuals on remand for knife possession, many of whom are prolific violent offenders’. 124 The police recognise that ‘this is a burden on the prison service’, but ‘we are seeing some reductions in knife crime as a result, although we will require some further evidence over the next 6 months’.125 Assaults and injuries involving knives Four thousand and fifty serious assaults were reported in Strathclyde between April 2006 and March 2007; 1,260 (31%) of these involved a knife.126 Apart from police data, useful information about knife-related injuries comes from hospitals. Around 1,000 patients attend Glasgow Dental Hospital each year with knife-related facial injuries. Hospitals in Glasgow treat a serious facial injury every six hours. Over 83% of patients with facial injury were drinking at the time of injury. Typically, over 25% of those treated will be treated again for a similar injury within a year, indicating a pattern of repeat victimisation. The Health Service bears a significant burden from violence. For example, £3.5m is spent every year in the west of Scotland treating knife-related facial injuries.127
124 Strathclyde Police, Public Performance Report 2006/07. 125 Strathclyde VRU, April 2008. 126 Strathclyde Police VRU. ibid. 127 Research carried out by Ashraf, A. and Goodall, C., Glasgow Dental Hospital. See e.g. Goodall, C. (2007), ’New directions in tackling alcohol misuse and violence associated with

76
Conservative estimates from England and Wales suggest that 3 to 6 per cent of the annual Health Service budget is used in the treatment of outcomes of violence generally. This equates to an annual cost of between £258 million and £517 million in Scotland.128 Murders Of the 73 murders in Strathclyde between April 2006 and March 2007, 40 of them (55%) involved a knife. Of the 380 attempted murders that were reported in Strathclyde in the same period, 208 of them involved a knife (also 55%). Alcohol is a contributory factor in almost half of all murders in Strathclyde (where the drink/drugs status of the accused is known).129 This is also true of Scotland generally: nearly half (47%) of the total of 167 persons accused in murder cases in 2006-07 in Scotland were reported to have been drunk or under the influence of drugs at the time.130 For murders recorded in Scotland between 1995-96 and 2004-05 (see Figure 42), sharp instruments accounted for 48% of all victims.131 Following a very similar pattern as for murders as a whole, the number of people killed by a knife or other bladed weapon in this decade fell from a peak of around 70 in 1995-96 to just under 40 in 1997-98. In 1999-2000 the numbers rose rapidly to just over 70 (54% of all murder victims that year). The number of knife victims fell again the next year before rising to over 70 in 2004-05.
dentofacial trauma’, Presentation at World Health Conference 2007. Information in this report provided by VRU. 128 Information provided by VRU. For England and Wales, see also Home Office (2005), The Economic and Social Costs of Crime against Individuals and Households 2003/04, Home Office Online Report. 129 Strathclyde Police Corporate Database. 130 The Scottish Government (2007), Criminal Justice Series: Homicide in Scotland, 2006-07. 131 Scottish Government (2007a), Key Trends for Scotland 2006.

77
Figure 42: Murder victims in Scotland and proportion killed by a knife or bladed weapon 1995-1996 to 2004-2005132
otal murders T
Killed by knives
132 The Scottish Government (2006), High Level Summary of Statistics: Key Trends for Scotland 2006, www.scotland.gov.uk/Publications/2006/06/20135022/11.
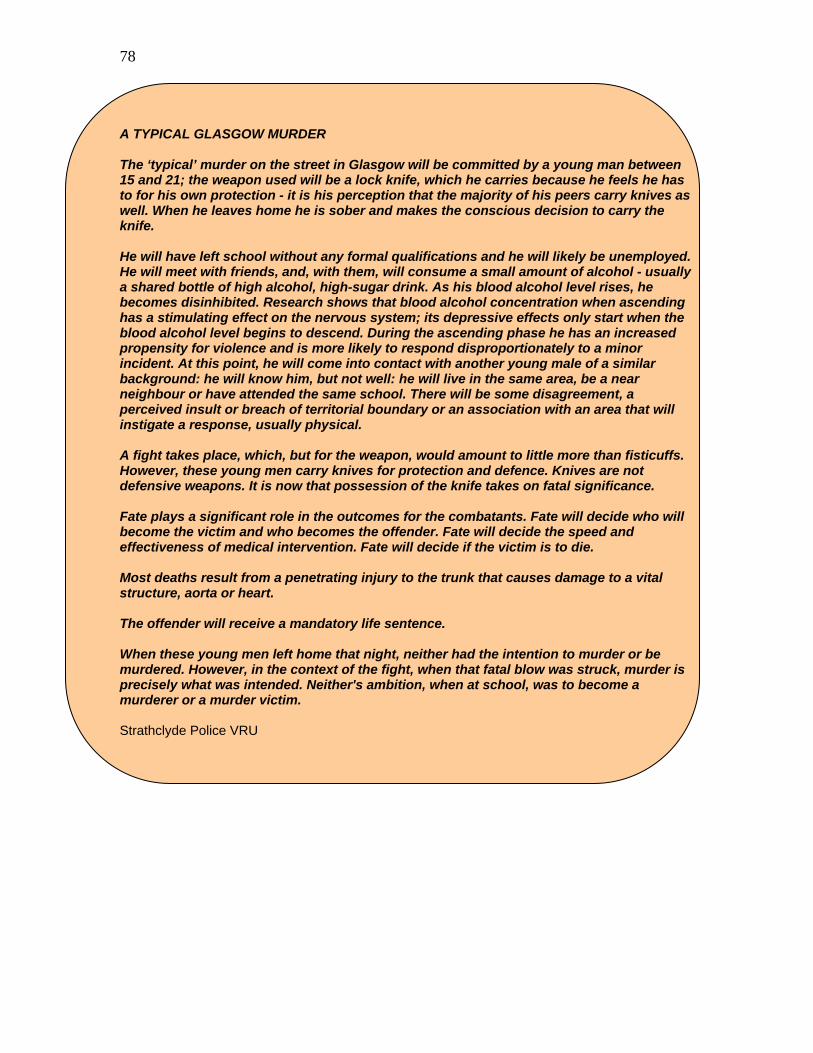
78
A TYPICAL GLASGOW MURDER The ‘typical’ murder on the street in Glasgow will be committed by a young man between 15 and 21; the weapon used will be a lock knife, which he carries because he feels he has to for his own protection - it is his perception that the majority of his peers carry knives as well. When he leaves home he is sober and makes the conscious decision to carry the knife. He will have left school without any formal qualifications and he will likely be unemployed. He will meet with friends, and, with them, will consume a small amount of alcohol - usually a shared bottle of high alcohol, high-sugar drink. As his blood alcohol level rises, he becomes disinhibited. Research shows that blood alcohol concentration when ascending has a stimulating effect on the nervous system; its depressive effects only start when the blood alcohol level begins to descend. During the ascending phase he has an increased propensity for violence and is more likely to respond disproportionately to a minor incident. At this point, he will come into contact with another young male of a similar background: he will know him, but not well: he will live in the same area, be a near neighbour or have attended the same school. There will be some disagreement, a perceived insult or breach of territorial boundary or an association with an area that will instigate a response, usually physical. A fight takes place, which, but for the weapon, would amount to little more than fisticuffs. However, these young men carry knives for protection and defence. Knives are not defensive weapons. It is now that possession of the knife takes on fatal significance. Fate plays a significant role in the outcomes for the combatants. Fate will decide who will become the victim and who becomes the offender. Fate will decide the speed and effectiveness of medical intervention. Fate will decide if the victim is to die. Most deaths result from a penetrating injury to the trunk that causes damage to a vital structure, aorta or heart. The offender will receive a mandatory life sentence. When these young men left home that night, neither had the intention to murder or be murdered. However, in the context of the fight, when that fatal blow was struck, murder is precisely what was intended. Neither's ambition, when at school, was to become a murderer or a murder victim. Strathclyde Police VRU

79
Gun crime133 The use of firearms in criminal activities constitutes a small proportion of the offences recorded by the police in Scotland. In 2006-07, 7% of recorded murders in 2006-07 (eight murders) involved the use of a firearm (see Figure 43). This contrasts with knives being involved in 55% of all murders in the same year. Scotland’s rate for gun-related murder per 100,000 population is 0.6. In England and Wales it is 0.15.134 By comparison, the rate of murder committed with a knife in Scotland is 3.5 times higher than that in England and Wales.135 Figure 43: Crimes and offences recorded by the police in which a firearm was alleged to have been used as a percentage of all crimes and offences recorded for selected crimes, Scotland, 1997-98 to 2006-07
Offences in which a firearm was alleged to have been used in Scotland In 2006-07 there were 1,245 recorded offences in Scotland in which a firearm136 was alleged to have been used, an increase of 17% from the 1,068 recorded in 2005-06, and the highest number in the ten-year period between 1997-08 and
133 Source for this section: Scottish Government (2007b), Recorded Crimes and Offences involving Firearms: Scotland 2007, unless otherwise stated 134 Cukier, W. and Sidel, V. (2006), ‘The global gun epidemic’ in Journal of Peace Research, Vol. 44(3): 368, Jackson: Sage. 135 World Health Organization (2002). 136 The definition of firearms includes not only guns but also replica and air weapons.
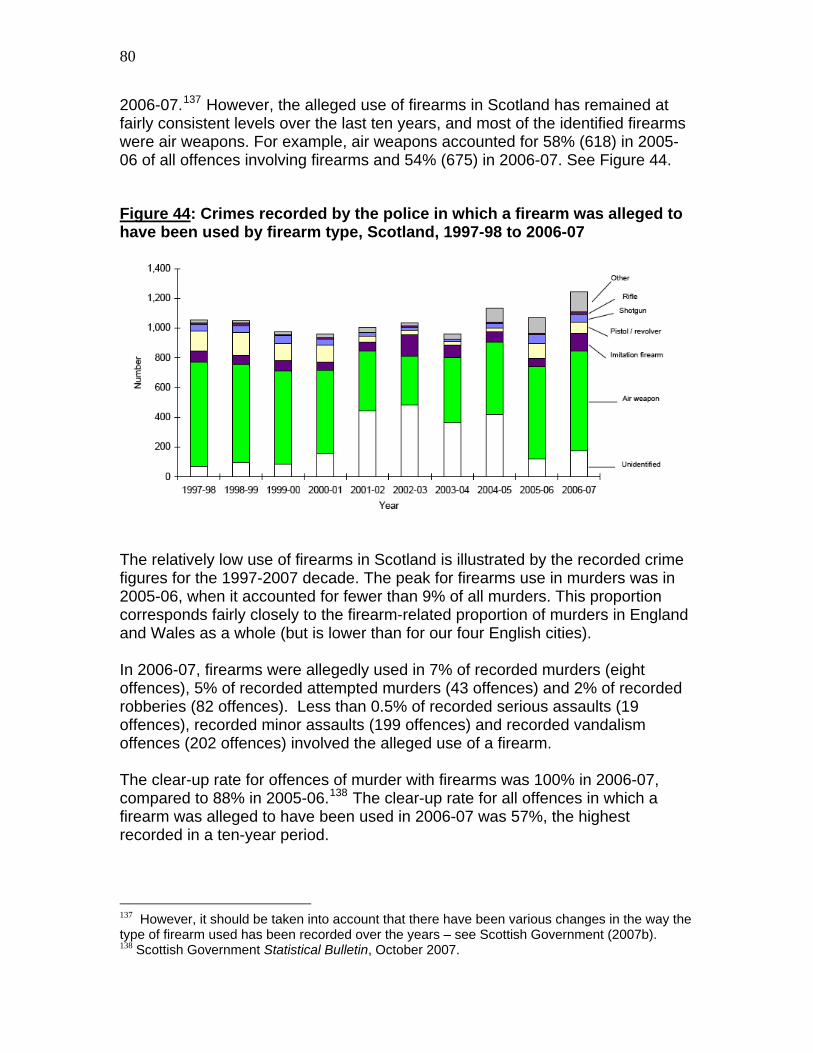
80
2006-07.137 However, the alleged use of firearms in Scotland has remained at fairly consistent levels over the last ten years, and most of the identified firearms were air weapons. For example, air weapons accounted for 58% (618) in 2005-06 of all offences involving firearms and 54% (675) in 2006-07. See Figure 44. Figure 44: Crimes recorded by the police in which a firearm was alleged to have been used by firearm type, Scotland, 1997-98 to 2006-07
The relatively low use of firearms in Scotland is illustrated by the recorded crime figures for the 1997-2007 decade. The peak for firearms use in murders was in 2005-06, when it accounted for fewer than 9% of all murders. This proportion corresponds fairly closely to the firearm-related proportion of murders in England and Wales as a whole (but is lower than for our four English cities). In 2006-07, firearms were allegedly used in 7% of recorded murders (eight offences), 5% of recorded attempted murders (43 offences) and 2% of recorded robberies (82 offences). Less than 0.5% of recorded serious assaults (19 offences), recorded minor assaults (199 offences) and recorded vandalism offences (202 offences) involved the alleged use of a firearm. The clear-up rate for offences of murder with firearms was 100% in 2006-07, compared to 88% in 2005-06.138 The clear-up rate for all offences in which a firearm was alleged to have been used in 2006-07 was 57%, the highest recorded in a ten-year period.
137 However, it should be taken into account that there have been various changes in the way the type of firearm used has been recorded over the years – see Scottish Government (2007b). 138 Scottish Government Statistical Bulletin, October 2007.

81
Result of firearms use Figure 45 outlines the result of the use of firearms in recorded crimes in Scotland. In just over 25% of the crimes firearms were used to threaten. When fired, in 25% of cases there was damage to property, whilst in 20% the use resulted in injury, and in about 19% of cases the firing resulted in no damage or injury. Figure 45: Recorded crimes and offences involving a firearm in Scotland: result of use, 2006-07
Gun crime in Strathclyde Violent recorded offences in which a firearm is alleged to have been used are concentrated in the Strathclyde Police Area. This area, which contains 43% of the entire population in Scotland (as estimated in 2006), accounted for 56% (691) of all offences in which a firearm was alleged to have been used in 2006-07. Seventy-five per cent of murders (six of the eight), 81% (35) of attempted murders, 79% (15) of serious assaults, 76% (62) of recorded robberies, and 57% (114) of minor assaults in which a firearm was alleged to have been used in Scotland in 2006-07 took place in Strathclyde. Although gun crime is not generally perceived as being a major problem, at least in comparison with knife crime, the number of firearms incidents in Strathclyde increased by 28% from 2005-06 to 2006-07, with 3,287 incidents in 2005-06 rising to 4,195 the following year. According to the Violence Reduction Unit (VRU), this can be ‘partly accounted for because the force now includes some offences that were previously excluded, following a clarification in the counting rules’. The number of firearms incidents attended by armed response vehicles

82
equally had a steep rise over the same period, increasing from 377 in 2005-06 to 689 in 2006-07.139 Victimisation In the majority of gun and knife crimes, both victims and perpetrators tend to be white Scottish males, aged 14 to 18. Victims of violent attacks know their attackers ‘in the majority of cases’ (e.g. over 70% in 2004-05).140 The proportion of victims of violence subject to repeated attacks, as gleaned from Glasgow Dental Hospital data relating to knife injuries, seems to be confirmed by police recorded data for Strathclyde. Of those individuals who had experienced a violent offence (assault or robbery) in 2002 in Strathclyde, 30% had been victimised more than once.141 Patterns of repeat victimisation apply nationally. According to the Scottish Crime and Victimization Survey 2006, three in ten victims of violent crime in 2005-06 had experienced two or more incidents, with one in six being the victim of three or more incidents. These figures are similar to those obtained in previous surveys.142 Gangs According to Strathclyde Police, there are around 166 ‘gangs’ across the Strathclyde force area, the majority of which are in Glasgow. Numbers of members will vary, as will their levels of activity – not all are active or ‘high risk’. Demographically, gang members are white Scottish males aged 14 to 18, many of whom will be victims as well as offenders. Strathclyde Police ‘have no definitive description for gangs’ and their database on gangs operates on a rather loose definition of gang membership: it is based on known facts, criminal convictions but also softer intelligence and simply associations. Therefore, a number of the people on the database are likely not be strictly involved in gangs themselves, but may be associated with a gang member i.e. related, partner, etc.
139 Strathclyde Police Public Performance Report 2006-07. 140 Strathclyde Police Corporate Database. 141 ibid. 142 Brown, M. and Bolling, K. (2007), 2006 Scottish Crime and Victimisation Survey: Main Findings, Scottish Government Social Research.

83
The VRU acknowledges the ambiguity implicit in the definition of a ‘gang’. ‘For some individuals a gang is a small group of four or five adolescents loitering on street corners, while for others the word conjures up an intrinsic connection to criminality violence and drugs.’ The unit takes on board various prominent definitions that seek to delineate criteria for identifying what makes up a ‘gang’, including Maxson and Klein’s:
• community recognition of the group • the group's recognition of itself as a distinct entity • the group's involvement in enough illegal activities to get a consistent
negative response from law enforcement and neighbourhood residents.143 The VRU acknowledges the importance of attempting to differentiate ‘young people involved in street gangs from those youths who congregate in areas but who are not involved in established street gang memberships’, but also recognises the practical difficulties of doing so.144 Profiling of Glasgow gang members A piece of research into local gangs was conducted by the Glasgow City Council Youth Justice Research Department in 2005.145 It was a profiling exercise that looked at trends in social work involvement with gang members, using intelligence data from Strathclyde Police and Social Work data. Intelligence from Strathclyde Police (database on gangs) suggested that there were approximately 1,760 people involved with, or alleged to be involved with gangs in Glasgow. A sample of almost one in four (462) of these was profiled. The figures in such study should be interpreted with some caution because the analysis is based only on a sample of cases and is not wholly representative as some areas of Glasgow, e.g. Easterhouse and Castlemilk, were not included. Data were divided into four areas by Strathclyde Police – Central & West, North, East and South. These areas relate to areas where gangs operate, rather than where members live. There was an uneven spread across these areas in terms of the number of people involved in gangs, although some of this may be due to the varying quality of intelligence from different areas.
143 Klein, M. and Maxson, C. (1989), ‘Street gang violence’, in Weiner, N. and Wolfgang, M. (eds.), Violent Crimes, Violent Criminals, Thousand Oaks: Sage. 144 Violence Reduction Unit, in correspondence dated May 2008. 145 Youth Justice Research & Development Team, Glasgow City Council (2006), Glasgow Gangs Profile 2005, Glasgow: Glasgow City Council.

84
The study found that: • approximately 90% of gang members were male • the average age was 18 years, with a range between 11 and 47. Almost one-
third were aged 17 or 18. Only 135 (29%) of the sample were involved with social work (e.g. in care or community care) at the time of the study. This could be taken to indicate, the authors of the study suggested, that more than two-thirds of young people included on the police gangs database may not currently have complex needs and risks other than their gang involvement. (However, involvement with social work can only be but one of the indicators of ‘complex needs’.) Fifty per cent of those people who were known to social work had been involved with the criminal justice system at some point. Of the 74 gang members/associates who were currently (at the time of the study), or had previously been looked after by social services, the most common reason for intervention was ‘offending behaviour’ (22) or ‘non-attendance at school’ (15) followed by ‘out-with parental control’ (12) and ‘lack of parental care’ (eight). The Violence Reduction Unit: violence as a public health issue The Violence Reduction Unit (VRU) was established by Strathclyde Police in 2005 to work closely together with partner agencies in education, health and social work. The aim of the unit, which has since 2006 become Scotland-wide in its remit, is to target all forms of violent behaviour. VRU approaches violence in terms of public health. Today, Scotland is the only country in the world which has adopted such an approach and the VRU are the only police members of the World Health Organization’s Violence Prevention Alliance. To achieve long-term violence reduction the VRU believes it is necessary to address societal and attitudinal aspects, and that closer links with health, education and parenting are needed to change behaviour. The unit views the following as being among key ‘risk factors’:
• Lack of punishment for precursor offences (e.g. knife carrying) • Lack of visible ‘swift justice’

85
• Lack of’ appropriate court disposals’ and of ‘change programmes’ • Cultural norms (acceptance of violence and weapons) • Perceived legitimacy of violence as a means to resolve conflicts • Territorialism • Lack of aspiration • Poor parenting skills • Violent families and friends • Lack of significant adults/positive role models • Lack of communication skills • Poor behavioural control/impulsiveness/aggression, even from an early
age • Lack of skills to deal with conflict – including the ability to identify
threatening situations – and communication/social skills • Exclusion from services/schools • Lack of employment opportunities (because of lack of skills) • Nutrition and health • Alcohol.
The VRU targets ‘violence in all its forms – from violence on the streets and domestic abuse to bullying in schools and the workplace’. A key part of its work is developing early years’ initiatives that support parents and those involved in teaching young children.
The following are examples of initiatives undertaken by the VRU.
In order to increase reporting of violent incidents, the VRU has installed freephones in the A&E departments of Glasgow hospitals. It has also set up surveillance schemes, whereby when a patient attends A&E with a violence-related injury, hospital staff fill in an electronic form giving details of when and where the incident occurred. Although this is done as part of the patient registration process, no personal details are included in the data the VRU receives – ‘it is purely the when and where of the incident, thus enabling us to build a stronger profile of violence and therefore use resources to respond more effectively’. The scheme is currently (2008) being piloted in Glasgow Royal Infirmary A&E and is to be subsequently trialed across an entire health board. If successful, it will be rolled out across Scotland.
Given that 25% of those treated for a serious facial injury by Glasgow Dental Hospital return for treatment for a second injury within a year, the VRU has also set up a project in two maxillofacial units, whereby nurses offer counselling to patients to help them understand how they got the injury in the first place and to help prevent them coming back.
86
To assist parents to limit the threat of violence in their children’s lives the VRU sent leaflets to every Primary One pupil in Scotland (around 400,000) as well as to doctors’ surgeries and libraries.
Key issues and facts: Glasgow
• According to the World Health Organisation, Glasgow has the highest rate of murder of any city in Europe per head of population. In 2007 there were 25 murders in Glasgow: this amounts to a rate of 4.3 per 100,000 people.
• The average murder rate in Glasgow per year in the period 2003-05 was 6.17 per 100,000 population.
• Although overall levels of crime have fallen in the west of Scotland, levels of violent crime, in particular knife crime, have remained relatively constant for the last 40 years.
• Victims and offenders share very similar demographic characteristics: they tend to be very young (mostly in the 14 to 18 age group), male, white and to come from under-privileged backgrounds.
• Victimisation tends to be repeated; in non-lethal instances, the same people will be victims of crime more than once.
• In the majority of violent attacks (over 70% for 2004-05 in Strathclyde) the victim knows their attacker.146
• Most violent crime is related to the use of alcohol or drugs.
• Unlike knives, guns are not such an issue in Scotland and Glasgow as in other parts of the country: the use of firearms in criminal activity constitutes a small proportion of offences recorded by the police. However, there was a noticeable increase in firearms offences in 2006-07 recorded by Strathclyde Police, and in Scotland generally, compared to the previous year.
• Young people who carry knives do so because they feel the need to protect themselves.
146 Strathclyde Police Corporate Database.
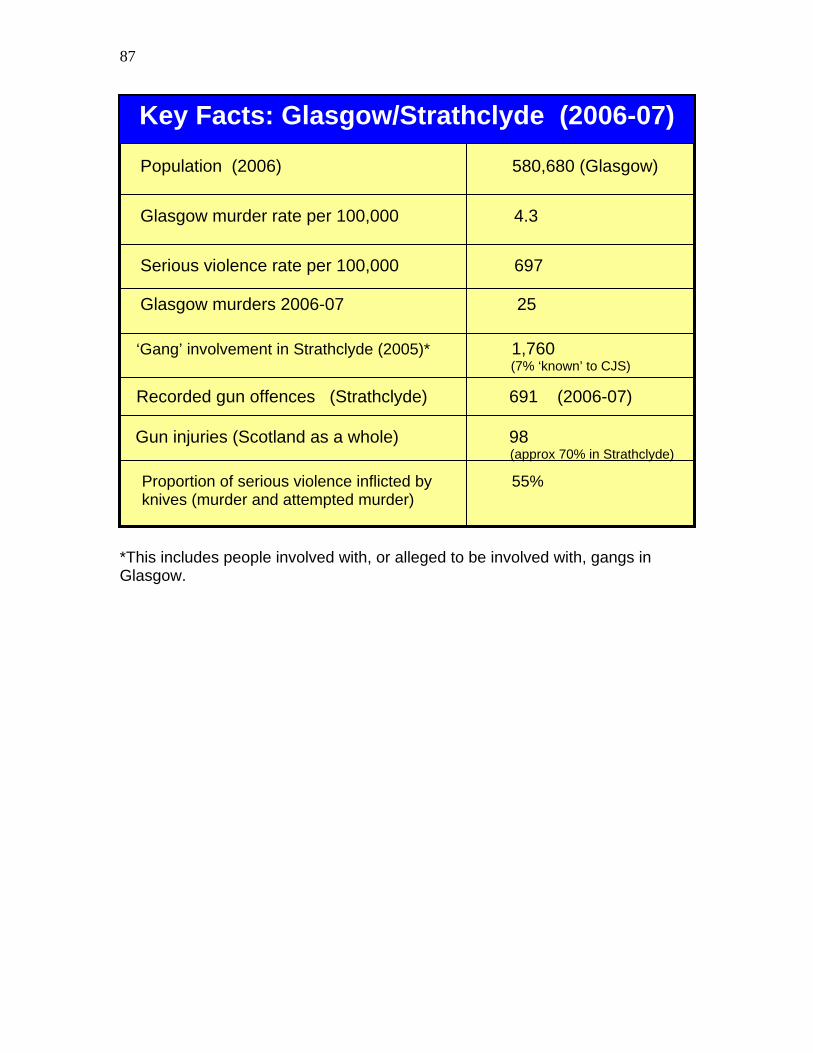
87
Key Facts: Glasgow/Strathclyde (2006-07)
Population (2006) 580,680 (Glasgow)
Glasgow murder rate per 100,000 4.3
Serious violence rate per 100,000 697
Glasgow murders 2006-07 25 ‘Gang’ involvement in Strathclyde (2005)* 1,760 (7% ‘known’ to CJS)
Recorded gun offences (Strathclyde) 691 (2006-07)
Gun injuries (Scotland as a whole) 98 (approx 70% in Strathclyde) Proportion of serious violence inflicted by 55%
knives (murder and attempted murder)
*This includes people involved with, or alleged to be involved with, gangs in Glasgow.
88
Guns and violence in four English cities Having considered each city in more detail we are now in a position to compare and contrast some of the characteristics that differentiate each city’s profile of youth-related and gang-involved violence. The Home Office has been able to provide data relating only to gun violence (as we have noted already, the knife-enabled crime data only began to be collected in 2007). Furthermore, the Home Office is only able to supply data relating to the four English cities. The data provided cover the period 2004-05 to 2006-07 and detail:
o Total recorded violence against the person involving firearms, subdivided into ‘homicides’, ‘attempted homicides (and other acts endangering life)’ and ‘other violence against the person’.
o Information on the firearm types employed in violent crime incidents
(handguns, imitation firearms, long-barreled shotguns, sawn-off shotguns, rifles, ‘other’ firearms and ‘unidentified’ firearms).
o The type and severity of injuries resulting from the firearm-enabled
offences (fatal, serious, slight).
o The age, gender and ethnicity of victims. In this chapter we present the data in both numerical and proportional formats. The chapter also includes a brief review of the results of the government’s Tackling Gangs Action Programme (TGAP) which was implemented between October 2007 and February 2008 in each of the four cities. Monitoring data relating to the intervention were published by the Home Office in May 2008 and allow us to draw conclusions regarding the nature of the gang activity in each city and the impact of the TGAP exercise. Comparisons between English cities147 Figure 46 shows the gun-enabled crime rates for our four English cities over the three most recent years for which data are available. The data are further divided according to the types of weapons (handguns, shotguns, replicas, etc.) employed. The same data are then represented as a proportion of gun-enabled crime attributable to different types of firearms (Figure 47). It should be noted that a proportion of the weapons used in each city in each year are unidentified, typically around 15%. Merseyside is notable for failing to identify over 50% of the firearms misused in 2005-05 but improves thereafter. 147 The data in the graphs and diagrams in this section have all been sourced from data provided specifically to us by the Home Office, unless otherwise stated. We are very grateful for this material.

89
The markedly lower firearm-enabled crime figure in the West Midlands (Birmingham) area (Figure 46) in 2005-06 is something of an anomaly: excluding this year the profile of gun use there more closely resembles that of London and, by comparing Figures 46 and 47, we can see that approximately 55-60% of the gun-enabled crime in these cities was undertaken by offenders using handguns. One caveat to add here is that some proportion of these ‘handgun’-enabled offences is also likely to involve replica handguns. If a gun is neither fired during a robbery but merely brandished to secure a victim’s compliance, nor subsequently recovered by the police, a victim is unlikely to be able to distinguish a real weapon from a replica.148 Figure 46: Firearm-enabled crime in four English police force areas, 2004-05 to 2006-07: firearm types - numbers
0
500
1000
1500
2000
2500
3000
3500
4000
4500
GMP05
GMP06
GMP07
Mers05
Mers06
Mers07
MPS05
MPS06
MPS07
WM 05 WM 06 WM 07
UnidentifiedRifleOther FirearmSawn off SGLB shotgunImitationHandgun
148 See Squires, P. (2000), Gun Culture or Gun Control, London, Routledge. pp.31-54. Evidence ‘suggests that between a third to a half of recorded 'armed robberies' involve only imitation or replica weapons’ (Morrison and O'Donnell, 1994; 1997; Matthews, 1996). Morrison, S. and O'Donnell I. (1994), Armed Robbery: A Study in London, Occasional Paper, No. 15, Oxford: Centre for Criminological Research; Morrison, S. and O'Donnell I. (1997), ‘Armed and dangerous? The use of firearms in robbery’, Howard Journal of Criminal Justice, Volume 36, Number 3; Matthews, R. (1996), Armed Robbery: Two Police Responses, Home Office, Police Research Group, Crime Detection and Prevention Series, Paper 78.
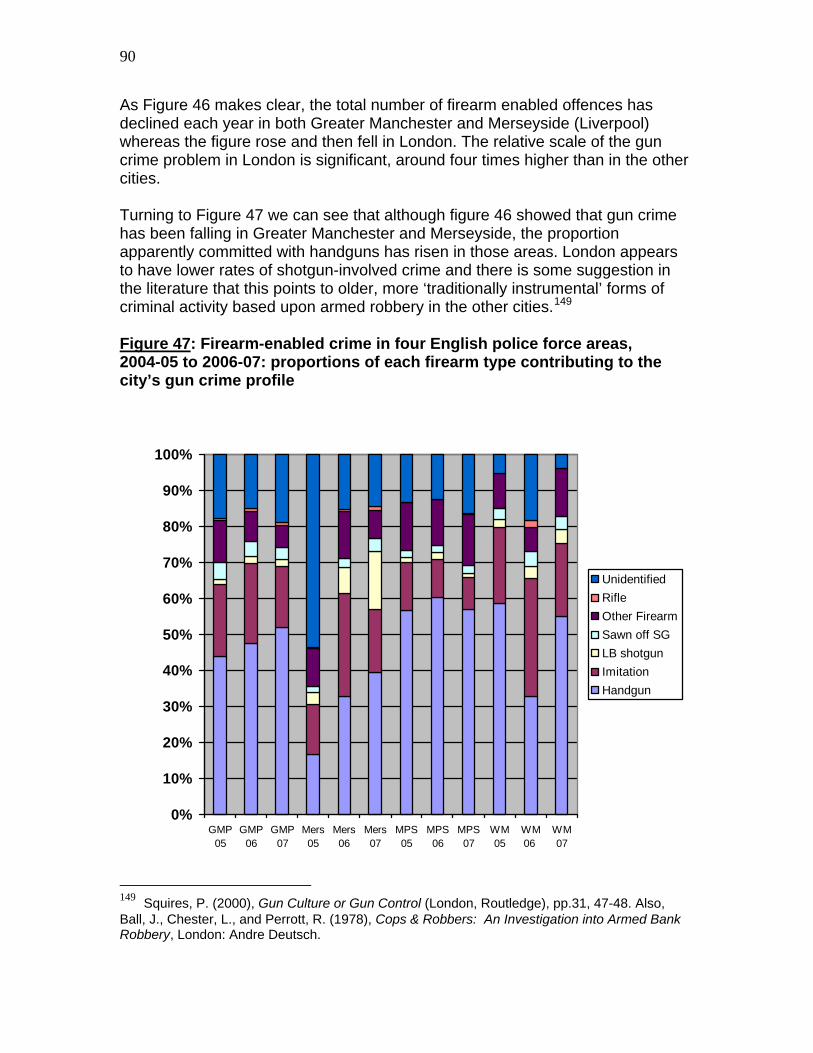
90
As Figure 46 makes clear, the total number of firearm enabled offences has declined each year in both Greater Manchester and Merseyside (Liverpool) whereas the figure rose and then fell in London. The relative scale of the gun crime problem in London is significant, around four times higher than in the other cities. Turning to Figure 47 we can see that although figure 46 showed that gun crime has been falling in Greater Manchester and Merseyside, the proportion apparently committed with handguns has risen in those areas. London appears to have lower rates of shotgun-involved crime and there is some suggestion in the literature that this points to older, more ‘traditionally instrumental’ forms of criminal activity based upon armed robbery in the other cities.149 Figure 47: Firearm-enabled crime in four English police force areas, 2004-05 to 2006-07: proportions of each firearm type contributing to the city’s gun crime profile
0%
10%
20%
30%
40%
50%
60%
70%
80%
90%
100%
GMP05
GMP06
GMP07
Mers05
Mers06
Mers07
MPS05
MPS06
MPS07
WM05
WM06
WM07
UnidentifiedRifleOther FirearmSawn off SGLB shotgunImitationHandgun
149 Squires, P. (2000), Gun Culture or Gun Control (London, Routledge), pp.31, 47-48. Also, Ball, J., Chester, L., and Perrott, R. (1978), Cops & Robbers: An Investigation into Armed Bank Robbery, London: Andre Deutsch.

91
Figures 48, 49 and 50 examine the injury rates resulting from gun-enabled crime in each of our English cities over the past three years, the numbers of injuries (by type) and the types of injury as a percentage of the total recorded by the police. Figure 48: Proportions of gun-enabled offences recorded by the police resulting in any injury in four English police force areas, 2004-05 to 2006-07
05
101520253035404550
2005 2006 2007
GMPMersMPSWmid
Turning to consider victims of gun injuries, Figures 51 and 52 address these. However, the first point to note is that in any given year only a minority of gun-enabled crimes result in an injury. In 2006-07, for instance, gun-enabled crimes totalled 5,709 in the four cities but only 28% of these incidents (1,600) resulted in any injury. Gun-enabled crimes appeared least likely to result in injury in the West Midlands (13% of offences causing injuries), followed by Greater Manchester (20% of offences causing injuries), Merseyside (24%) and finally London, which had the highest gun crime injury rate, at 36%. Notwithstanding these differences, recorded gun crime injuries (as a proportion of gun crimes) appear to have been falling overall, most consistently in Greater Manchester and Merseyside.
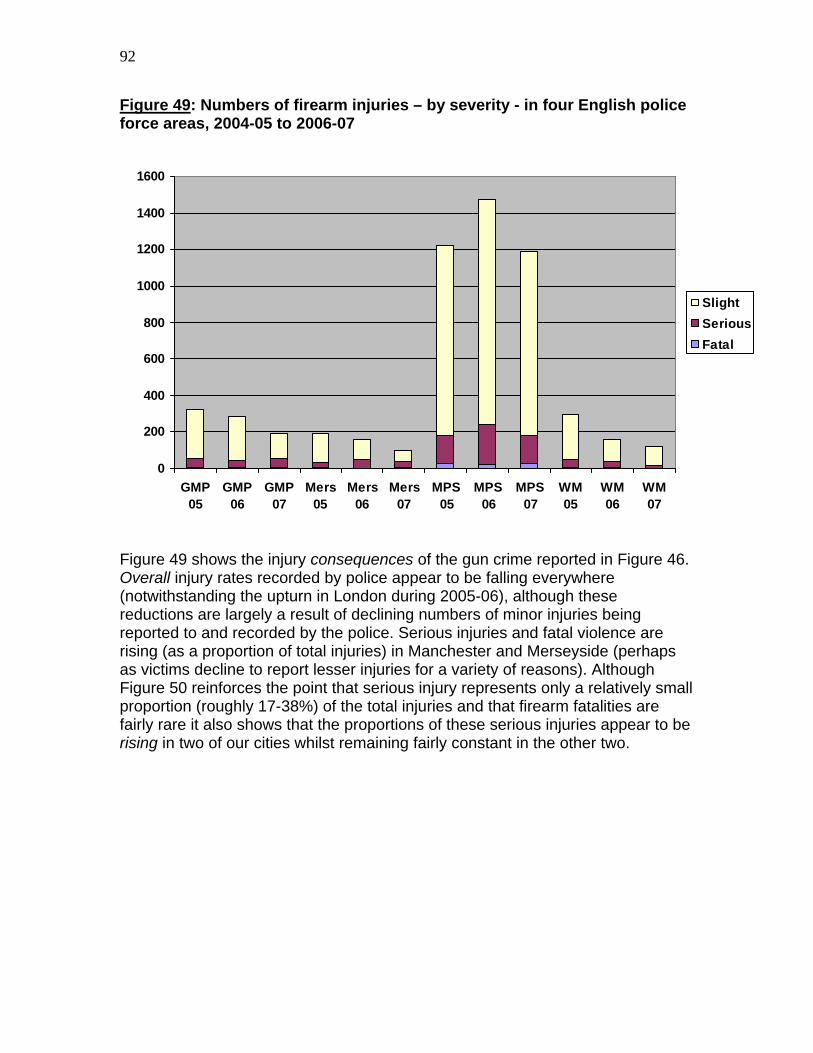
92
Figure 49: Numbers of firearm injuries – by severity - in four English police force areas, 2004-05 to 2006-07
0
200
400
600
800
1000
1200
1400
1600
GMP05
GMP06
GMP07
Mers05
Mers06
Mers07
MPS05
MPS06
MPS07
WM05
WM06
WM07
SlightSeriousFatal
Figure 49 shows the injury consequences of the gun crime reported in Figure 46. Overall injury rates recorded by police appear to be falling everywhere (notwithstanding the upturn in London during 2005-06), although these reductions are largely a result of declining numbers of minor injuries being reported to and recorded by the police. Serious injuries and fatal violence are rising (as a proportion of total injuries) in Manchester and Merseyside (perhaps as victims decline to report lesser injuries for a variety of reasons). Although Figure 50 reinforces the point that serious injury represents only a relatively small proportion (roughly 17-38%) of the total injuries and that firearm fatalities are fairly rare it also shows that the proportions of these serious injuries appear to be rising in two of our cities whilst remaining fairly constant in the other two.
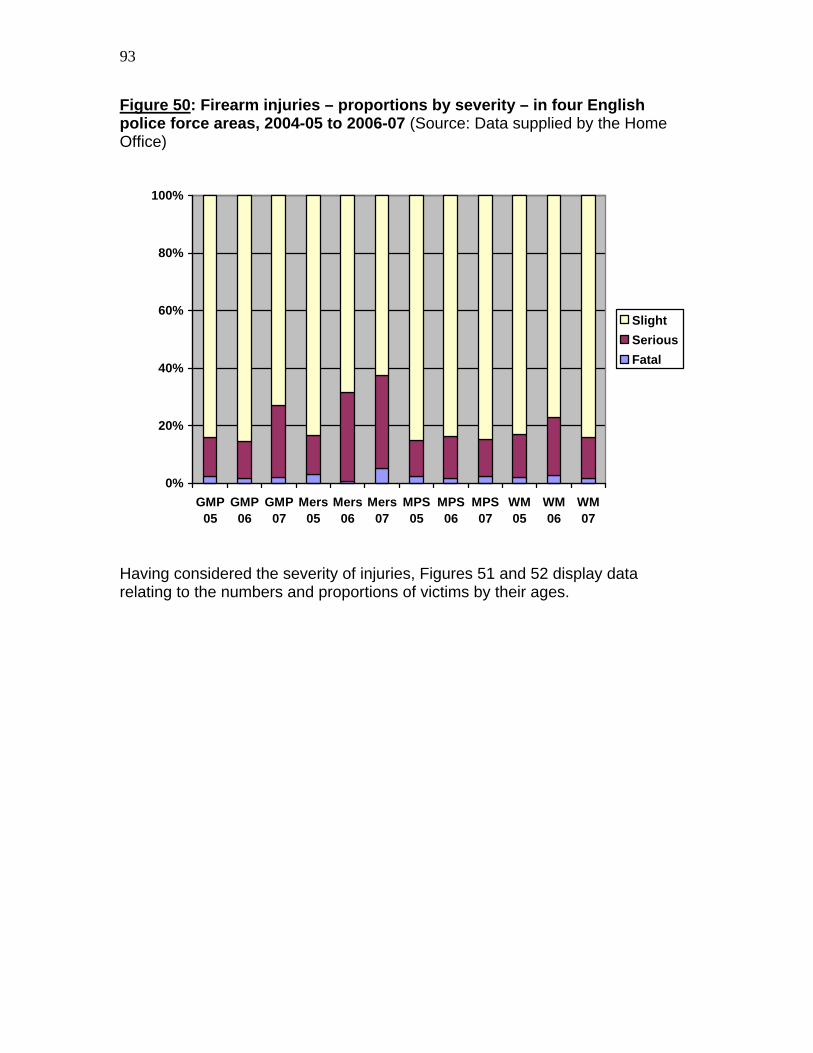
93
Figure 50: Firearm injuries – proportions by severity – in four English police force areas, 2004-05 to 2006-07 (Source: Data supplied by the Home Office)
0%
20%
40%
60%
80%
100%
GMP05
GMP06
GMP07
Mers05
Mers06
Mers07
MPS05
MPS06
MPS07
WM05
WM06
WM07
SlightSeriousFatal
Having considered the severity of injuries, Figures 51 and 52 display data relating to the numbers and proportions of victims by their ages.

94
Figure 51: Gun crime victims (all injuries) by age in four English police force areas, 2004-05 to 2006-07
0
500
1000
1500
2000
2500
3000
3500
4000
4500
GMP05
GMP06
GMP07
Mers05
Mers06
Mers07
MPS05
MPS06
MPS07
WM 05 WM 06 WM 07
not known70 plus50 to 6930 to 4921 to 2916 to 2011 to 155 to 10Under 5
Taking graphs 51 and 52 together we can see that the figures for victims aged under 16 appear to have fallen slightly overall in number and proportion in three of our four cities, the exception being West Midlands (including Birmingham), the trend for which is obscured somewhat by the very low 2005-06 gun crime figure. This seems contrary to public perceptions which have, of late, been preoccupied by reports of apparently growing numbers of younger gun crime victims. Excluding the West Midlands figures for the reason given above, detailed examination of the percentages in Figure 52 reveals the two age cohorts which appear to buck the falling general trend in one city: this concerns victims aged 16 to 20 and 21 to 29 in London.

95
Figure 52: Ages of gun crime victims (all injuries) as a percentage of all victims in four English police force areas: 2004-05 to 2006-07
0%
10%
20%
30%
40%
50%
60%
70%
80%
90%
100%
GM P 05 GM P 06 GM P 07 M ers 05 M ers 06 M ers 07 M PS 05 M PS 06 M PS 07 WM 05 WM 06 WM 07
not known70 plus50 to 6930 to 4921 to 2916 to 2011 to 155 to 10Under 5
The cities do appear to have different victim age profiles (which will reflect a range of social, cultural and criminal relationships specific to each city), Liverpool appears (at first sight) to have proportionately fewer young victims (aged under 30) although in a third to a quarter of all cases the age of the victim is unknown). London has proportionately more older gun victims than the other cities (proportion under age 30, approximately 55%; proportion under age 50, rising from 75 to 80%). Manchester and London have a fairly consistent pattern of around 27-29% of gun crime victims each year aged under 21. Around 15% of Manchester gun victims are aged under 16 but the proportion of victims this age is noticeably lower in the other three cities. The low gun crime figure for Birmingham in 2005-06 makes consistent comparison rather difficult. The following pie diagrams (Figure 53) represent the gender distribution of gun violence in our four cities.

96
Figure 53: Gun victim gender in four police areas, 2004-05 to 2006-07 Greater Manchester Merseyside
2217
888
356
MaleFemaleUnknown
757
337
293
MaleFemaleUnknown
Metropolitan Police Area West Midlands
7921
2643
340
MaleFemaleUnknown
1677
605
11
MaleFemaleUnknown
As we have noted before, Merseyside has significantly more ‘missing’ data. The male/female gun victim proportions are very similar in London and the West Midlands. These ratios, almost 3:1 male/female, may well be very similar in Greater Manchester and Merseyside. The apparent differences here could well be attributable to the ‘missing’ data.
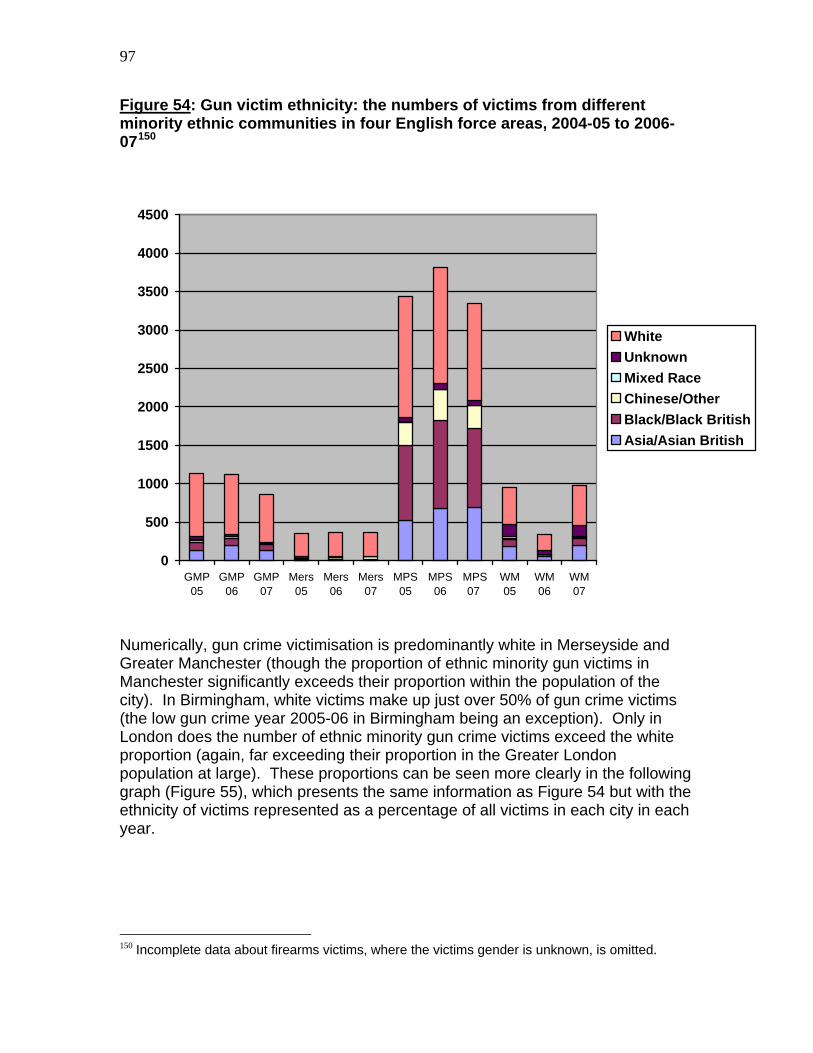
97
Figure 54: Gun victim ethnicity: the numbers of victims from different minority ethnic communities in four English force areas, 2004-05 to 2006-07150
0
500
1000
1500
2000
2500
3000
3500
4000
4500
GMP05
GMP06
GMP07
Mers05
Mers06
Mers07
MPS05
MPS06
MPS07
WM05
WM06
WM07
WhiteUnknownMixed RaceChinese/OtherBlack/Black BritishAsia/Asian British
Numerically, gun crime victimisation is predominantly white in Merseyside and Greater Manchester (though the proportion of ethnic minority gun victims in Manchester significantly exceeds their proportion within the population of the city). In Birmingham, white victims make up just over 50% of gun crime victims (the low gun crime year 2005-06 in Birmingham being an exception). Only in London does the number of ethnic minority gun crime victims exceed the white proportion (again, far exceeding their proportion in the Greater London population at large). These proportions can be seen more clearly in the following graph (Figure 55), which presents the same information as Figure 54 but with the ethnicity of victims represented as a percentage of all victims in each city in each year.
150 Incomplete data about firearms victims, where the victims gender is unknown, is omitted.

98
Figure 55: Ethnicity of gun crime victims: proportions from different minority ethnic communities in four English police force areas, 2004-05 to 2006-07151
0%
20%
40%
60%
80%
100%
GMP05
GMP06
GMP07
Mers05
Mers06
Mers07
MPS05
MPS06
MPS07
WM05
WM06
WM07
WhiteUnknownMixed RaceChinese/OtherBlack/Black BritishAsia/Asian British
Our four cities appear have different racial and ethnic gun victimisation profiles. Gun victims are around 70% white in Manchester, 85% white in Merseyside,152 40% white in London, while the proportion of white gun victims hovers around 55% in the West Midlands. That black and Asian gun crime victims now represent roughly 50% of gun crime victims in London suggests a significant over-representation of these communities as victims of gun crime. Black and Asian victims are also over-represented as gun crime victims in other cities, but less markedly so.
The growth in the minority ethnic proportion of gun victims in London largely reflects the steady, year on year, increase in Asian/Asian British gun victims. Although the notion of ‘black on black’ gun crime has achieved some notoriety, it
151 Incomplete data about firearms victims, where the victims gender is unknown, is omitted. 152 The Tackling Gangs Action Programme Monitoring Report (Dawson, 2008), discussed later in this report similarly notes that the patterns of gang-related weapon violence are different in Liverpool ‘where gang members were predominantly white’.
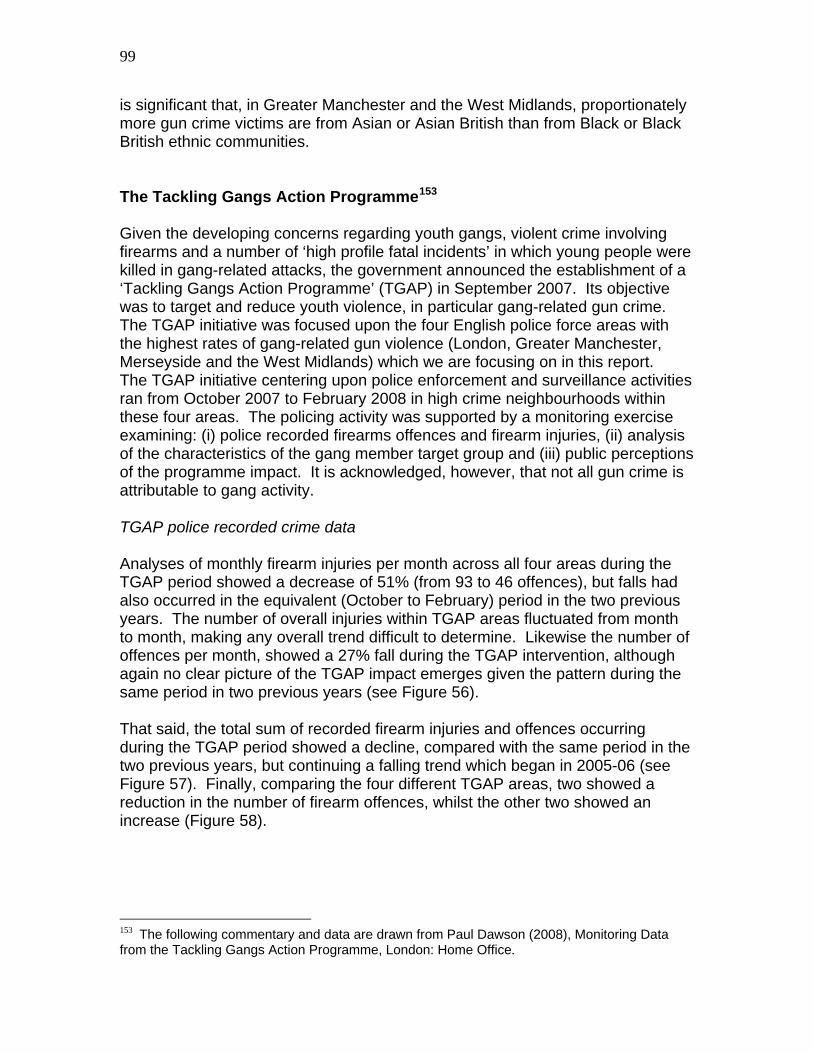
99
is significant that, in Greater Manchester and the West Midlands, proportionately more gun crime victims are from Asian or Asian British than from Black or Black British ethnic communities. The Tackling Gangs Action Programme153 Given the developing concerns regarding youth gangs, violent crime involving firearms and a number of ‘high profile fatal incidents’ in which young people were killed in gang-related attacks, the government announced the establishment of a ‘Tackling Gangs Action Programme’ (TGAP) in September 2007. Its objective was to target and reduce youth violence, in particular gang-related gun crime. The TGAP initiative was focused upon the four English police force areas with the highest rates of gang-related gun violence (London, Greater Manchester, Merseyside and the West Midlands) which we are focusing on in this report. The TGAP initiative centering upon police enforcement and surveillance activities ran from October 2007 to February 2008 in high crime neighbourhoods within these four areas. The policing activity was supported by a monitoring exercise examining: (i) police recorded firearms offences and firearm injuries, (ii) analysis of the characteristics of the gang member target group and (iii) public perceptions of the programme impact. It is acknowledged, however, that not all gun crime is attributable to gang activity. TGAP police recorded crime data Analyses of monthly firearm injuries per month across all four areas during the TGAP period showed a decrease of 51% (from 93 to 46 offences), but falls had also occurred in the equivalent (October to February) period in the two previous years. The number of overall injuries within TGAP areas fluctuated from month to month, making any overall trend difficult to determine. Likewise the number of offences per month, showed a 27% fall during the TGAP intervention, although again no clear picture of the TGAP impact emerges given the pattern during the same period in two previous years (see Figure 56). That said, the total sum of recorded firearm injuries and offences occurring during the TGAP period showed a decline, compared with the same period in the two previous years, but continuing a falling trend which began in 2005-06 (see Figure 57). Finally, comparing the four different TGAP areas, two showed a reduction in the number of firearm offences, whilst the other two showed an increase (Figure 58). 153 The following commentary and data are drawn from Paul Dawson (2008), Monitoring Data from the Tackling Gangs Action Programme, London: Home Office.
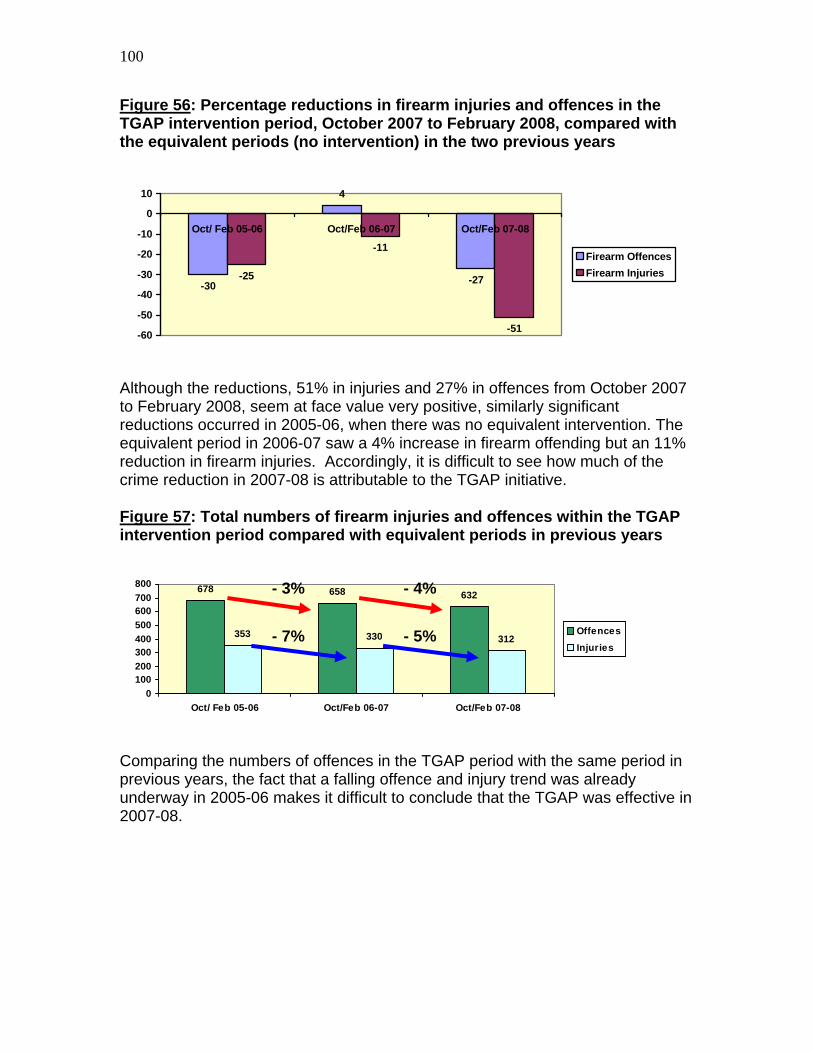
100
Figure 56: Percentage reductions in firearm injuries and offences in the TGAP intervention period, October 2007 to February 2008, compared with the equivalent periods (no intervention) in the two previous years
-30
4
-27-25
-11
-51-60
-50
-40
-30
-20
-10
0
10
Oct/ Feb 05-06 Oct/Feb 06-07 Oct/Feb 07-08
Firearm OffencesFirearm Injuries
Although the reductions, 51% in injuries and 27% in offences from October 2007 to February 2008, seem at face value very positive, similarly significant reductions occurred in 2005-06, when there was no equivalent intervention. The equivalent period in 2006-07 saw a 4% increase in firearm offending but an 11% reduction in firearm injuries. Accordingly, it is difficult to see how much of the crime reduction in 2007-08 is attributable to the TGAP initiative. Figure 57: Total numbers of firearm injuries and offences within the TGAP intervention period compared with equivalent periods in previous years
678 658 632
353 330 312
0100200300400500600700800
Oct/ Feb 05-06 Oct/Feb 06-07 Oct/Feb 07-08
Offences
Injuries
- 3% - 4%
- 7% - 5%
Comparing the numbers of offences in the TGAP period with the same period in previous years, the fact that a falling offence and injury trend was already underway in 2005-06 makes it difficult to conclude that the TGAP was effective in 2007-08.
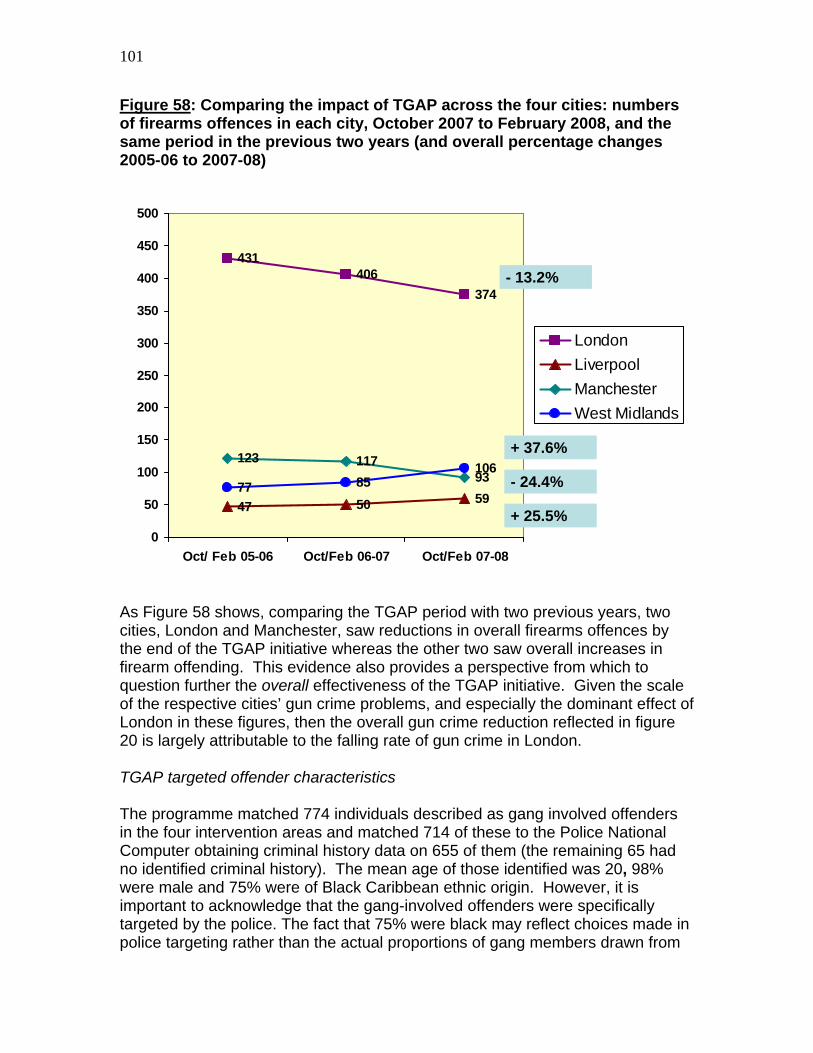
101
Figure 58: Comparing the impact of TGAP across the four cities: numbers of firearms offences in each city, October 2007 to February 2008, and the same period in the previous two years (and overall percentage changes 2005-06 to 2007-08)
431406
374
47 50 59
123 11793
77 85106
0
50
100
150
200
250
300
350
400
450
500
Oct/ Feb 05-06 Oct/Feb 06-07 Oct/Feb 07-08
London LiverpoolManchester West Midlands
- 13.2%
+ 37.6%
- 24.4%
+ 25.5%
As Figure 58 shows, comparing the TGAP period with two previous years, two cities, London and Manchester, saw reductions in overall firearms offences by the end of the TGAP initiative whereas the other two saw overall increases in firearm offending. This evidence also provides a perspective from which to question further the overall effectiveness of the TGAP initiative. Given the scale of the respective cities’ gun crime problems, and especially the dominant effect of London in these figures, then the overall gun crime reduction reflected in figure 20 is largely attributable to the falling rate of gun crime in London. TGAP targeted offender characteristics The programme matched 774 individuals described as gang involved offenders in the four intervention areas and matched 714 of these to the Police National Computer obtaining criminal history data on 655 of them (the remaining 65 had no identified criminal history). The mean age of those identified was 20, 98% were male and 75% were of Black Caribbean ethnic origin. However, it is important to acknowledge that the gang-involved offenders were specifically targeted by the police. The fact that 75% were black may reflect choices made in police targeting rather than the actual proportions of gang members drawn from

102
different communities. As we have already noted, the offender profile in Liverpool differed from that of other areas in that gang members there were predominantly white. The average number of previous convictions for each of those whose criminal histories were ascertained was 11 offences and the mean age across the sample for a first conviction was 15 years. The offences most frequently noted included public order and harassment (63% of the sample), drug offences (62%), violence (62%) and theft offences (52%). Of the overall sample of active gang members, reliable data on the Offender Assessment System (OASys) – available only for adults – was obtained relating to 147 individuals and the key risk factors and problems identified here related to: Education, Training and Employability issues (74% of the sample) Criminal lifestyles and associates (71%) Thinking and behaviour problems (69%) Non-attendance at school (62%) Poor problem-solving skills (86%) Impulsivity (85%) Inability to acknowledge consequences (83%) Easily influenced by offending peers (84%) Regular engagement in risk-taking behaviour (84%). This profile of problems corresponds closely to those produced in respect of other prolific offender groups154 and to the gun crime risk analysis by Hoggarth and Lewis for the Magnet: Modelling Gun Crime project.155 Public perceptions in TGAP areas Surveys were undertaken in TGAP areas suffering from gun and gang crime to test whether residents were aware of greater police activity and their perceptions concerning gun and gang crime risks. Residents from TGAP areas were more likely to have noticed increased police activity than a comparison national sample and were also more satisfied with the police response to crime. Satisfaction rates regarding the police specifically dealing with gangs, however, were no different and the majority of TGAP residents felt that young people in their areas were at the same or even greater risk of being involved in a gang or of committing weapon-involved offences. 154 See Dawson, P. (2005), Early Findings from the Prolific and other Priority Offenders Evaluation, Home Office, DPR 46. 155 Hoggarth, L. and Lewis, C. (2007), Specific Risk Factors for Gun Criminals, Magnet Gun Crime Modelling Project, https://www.york.ac.uk/management/magnet/.

103
Summary This chapter has allowed us to draw comparisons and make contrasts between the four English cities forming the basis of this report. Generally speaking handguns represent around 55-60% (and an increasing proportion) of the misused firearms (although when the firearm is neither fired nor recovered by the police it may be difficult to confirm whether the weapon was genuine – in other words, the imitation firearm figure may under-represent the reality). There are differences between the cities but firearm misuse in Merseyside seems to involve shotguns more frequently than in other cities. Injury rates resulting from recorded firearm misuse appear to be falling across the board and, on average, only around a quarter of firearm misuse results in injury, although the data describes different firearm injury rates for the four cities, with London having the highest overall injury rate, but not the highest rate of serious injury. The cities appear to have different victim age profiles, Liverpool seeming to have proportionately fewer young victims (aged under 30), although in a third to a quarter of all cases the age of the victim is unknown. London has proportionately more older gun victims (up to age 50) than the other cities. The gender distribution of victims is fairly consistent across the four cities, with between two-thirds to three-quarters of victims being male. Significant differences are notable with regard to the ethnicity of gun victims. Gun crime victimisation is overwhelmingly white in Merseyside and predominantly white in Greater Manchester (though the proportion of ethnic minority gun victims in Manchester significantly exceeds their proportion within the overall population of the area). Our four cities appear to have different racial and ethnic gun victimisation profiles. Gun victims are around 70% white in Manchester, 85% white in Merseyside and 40% white in London, while the proportion of white gun victims hovers around 55% in the West Midlands. Turning to the TGAP initiative, an issue that stands out is the proportion of Black Caribbean gang-involved offenders targeted by the police as part of the TGAP initiative. With gang members targeted being 75% black, this proportion does not reflect the level of black victimisation in any of the cities for which we have data. Accordingly, we need to question this targeting. With regard to the overall year on year crime reduction impacts, the TGAP monitoring evidence was fairly inconclusive given the already falling trends in total numbers of offences and total number of injuries. Looking at the crime reduction effect of the initiative within the 6 six months of its operation (October. 2007 to February 2008), and compared to the same period in the previous two years, then two cities, London and Manchester, saw reductions in overall firearms offences by the end of the TGAP initiative whereas the other two saw
104
overall increases in firearm offending. This raises a question about the overall effectiveness of the TGAP initiative. In view of the dominant effect of London within these four-city figures, the overall gun crime reduction reflected during the TGAP exercise is largely attributable to the falling rate of gun crime in London. Finally, the TGAP targeting and public perception data confirmed the kinds of risk and social exclusion factors which we have discussed already regarding the violent crime and gang involvements of young males. In the areas where the TGAP enforcement work of the police was prioritised, residents did appear to notice increased police activity but also appeared not to feel that this had any significant impact on young people’s gang involvements or their propensity to commit violent offences.

105
Concluding issues As we noted at the outset, during the writing of this report, the issues of youth crime, violence, and weapons were seldom out of the news. These debates were often framed in an emotive and highly politicized language: government responses were also emerging thick and fast. When popular concern and political reactions drive the debate along, the danger often is that policy making begins to outrun the available evidence base. This becomes especially problematic when, as we have tried to show in this report, the criminal justice evidence base is not that strong in the first place, riddled with ambiguities and containing a large ‘dark area’ of unknowns. Heat rather than light often prevails. Simple solutions appear to be preferred to analyses that reveal the complexity of the issues and which demand far-reaching policy responses. The problem of youth violence is also popularly constructed as a problem of law and order above all else. This invariably means that criminal justice responses: policing (force and reassurance), enforcement action, risk management, sentencing and punishment (tougher and longer sentences) tend to dictate the range of options available. Alternative conceptions of violence – as a symptom of fragmenting communities; as a sign of a decivilising culture; as a phenomenon flourishing amongst the consequences of disadvantage and social exclusion; and as an assertive resource utilised primarily by those who have few others – get overlooked. As a result, criminal justice interventions tend to address the symptoms, often in a self-defeating and short-term cycle, leaving the underlying social, economic, cultural and also personal problems unaddressed – except, perhaps, as an afterthought. This report has shown the problems of weapon-involved youth violence to be highly concentrated in the most deprived and marginal areas of Britain. After more than two decades in which we have witnessed a significant redistribution/displacement of violence into the poorest areas, compounding the wider inequalities of contemporary British society, the disaffection of young people, feeling increasingly over-controlled and under-protected as they grow up in such areas should not come as a surprise. Just as opportunity for some has come at the expense of others, so has community safety, another dimension of inequality in modern life. Nor should it be a surprise that the most frequently given reason for young people carrying weapons, the one that many young people subscribe to, the one they understand as the ‘difficult’, certainly ‘troubling’ and potentially self-defeating choice made by their peers, concerns self-protection. The same is often said of joining a gang: many young people are looking after themselves, perhaps because they don’t trust others, adults, the authorities, perhaps especially the police, to do so. Until we come to understand the anxieties and the sense of insecurity facing many young people in the poorest parts of UK society, a criminal justice response is likely to prevail and to continue to fail for the reasons we have articulated in this report.
106
Key findings: • By international standards rates of murder and serious violence are
comparable to many similar developed and European societies, although particular concerns have recently focused upon young males and weapon-related violence. Yet despite the urgency of these problems, the evidence upon which to base effective policies is not always available.
• Violent and weapon-related crime are highly localised and concentrated in the poorest and most deprived areas.
• The government has sought to take credit for the declining rates of recorded and reported crime but serious violence seems to be falling least and concerns about violence are politically problematic.
• There are problems with the available data on weapon-related crime. A significant proportion of this victimisation is not reported, nor well researched or understood. We know least about the most frequently victimised groups: young people. However, in three of the cities we examined, violent victimisation was disproportionately focused upon black and minority ethnic communities, especially upon their young males. Even in Liverpool, where victims of violence were predominantly white, victims of minority ethnic origins are over-represented.
• There does appear to be some evidence of a weaponisation of violence in some of the poorer areas of the UK, especially in large conurbations, and amongst some social groups (teenagers and young adults). The concern focused upon young males and urban gangs and the evidence base for this has been developing since the late 1990s. More recent concerns about knives, however, expose some important gaps in the government’s evidence base.
• Violence and weapon carrying choices (made by young people) need to be understood in relation to the contexts in which they occur and the experiences and perceptions of those who make them. This is likely to prove more illuminating than simply classing violence by weapon type. Understanding the process of gang formation and the roles that gangs play in violent crime facilitation seems particularly important.
• There seem to be a number of questions about the compilation, analysis and strategic utilisation of the data that police forces already collect. Sharing data does not seem to be a strong point for the police: evidence and intelligence development do not always appear particularly well ‘joined-up’.
• A considerable flurry of media interest has centred upon the issue of knife crime but the evidence base does not support clear conclusions. This recent panic – sensationalised, politicised, populist and punitive – crystallises many of the problems associated with a self-defeating, short-term ‘crime and response cycle’.
• In the process, potentially more effective and long-term policies to address the underlying conditions sustaining the inequality, poverty, disadvantage and

107
social marginalisation that drive the conflict producing the violence get sidelined and overlooked.
Finally – in sum – there appear to be a number of fundamental structural, social, economic and cultural factors influencing levels of gun and knife crime, where it occurs and who it involves, which cannot be overlooked if the problem is to be meaningfully addressed. Research has highlighted patterns of intergenerational problems associated with social and economic disadvantage: poverty, unemployment, education and parenting, all of which play a part in people’s (deviant/coping/predatory) behaviour, the conflict this engenders and the resultant street crime. Enforcement strategies – ‘gang suppression’ and targeted policing initiatives – are not likely to be effective alone. By the same token it is important not to oversimplify the issues: there is no single, unitary gun or knife or crime ‘culture’. Local contexts and, especially, young people’s experiences and perceptions would seem to be a necessary starting point.
There are many themes raised here, yet the problems they address go to the heart of the question of youth exclusion and the violence and victimisation with which it is associated. At root, the key question essentially concerns the purchase that a criminal justice system, and perhaps especially the police, has upon these issues. Solomon and Garside have recently concluded that the Labour government’s ten-year record on youth justice (and anti-social behaviour management), a decade that began with such bold and ambitious new legislative principles (not to mention performance targets) and which has seen a major increase in expenditure, has had only a relatively marginal impact upon overall levels of youth crime and limited preventive impact.156 And yet we end a decade which began preoccupied by the so-called (and certainly contested) ‘persistent young offender’,157 with a seemingly more acute crisis of weapon-facilitated youth violence which appears to be undermining the government’s otherwise more positive criminal justice trends.
The argument is not that the criminal justice system can, in any meaningful sense, ‘control’ the amount of criminal victimisation in a society. On the contrary, it can merely manage a small percentage of those offenders and victims that stray into its path. The major social problems influencing rates of crime largely lie elsewhere. Our argument is that in managing these groups badly, by fostering and facilitating a demonisation of young people, further ostracising and excluding them, demonstrating a punitive lack of trust and respect, it pushes them to find their own, even more problematic and often dangerous, solutions.
156 Solomon, E and Garside, R. (2008), Ten Years of Labour’s Youth Justice Reforms: An Independent Audit, London: CCJS. See also: Doward, J. (2008), ‘Key report says Labour has failed on youth crime’, The Observer, 1 June 2008.
157 Hagell, A. and Newburn, T. (1994), Persistent Young Offenders
108
A vicious circle is established. Rod Morgan, the former head of the Youth Justice Board, cautioned against the punitive climate of youth justice and its problematic implications – swift enforcement is not the answer, he suggested. Likewise, the children’s commissioners’ recently voiced doubts158 about police-led solutions for problems of youth violence and conflict suggest that, in ten years, the government may have learned relatively little. By contrast, in this report we have sought to provide the Street Weapons Commission with an informed analysis of patterns and significant trends in violence – specifically youth violence and weapon use across the country as a whole alongside specific portraits of ‘gun’ and ’knife ‘crime’ in five major cities - London, Birmingham, Manchester, Liverpool, and Glasgow (although the knife crime data, for reasons we have explained, was particularly elusive). Above all, this work shows that the problems are not the same, that violence has to be understood in context and that local solutions have to be worked out on the ground. A top-down, one size fits all solution is unlikely to be effective. At the same time, the clear connections between lack of opportunities, social exclusion, disadvantage and, in three of our cities at least, a marked racialisation of inequality and illegal drug-based economies seem far too significant to be overlooked. The push and pull that such factors exert in the lives of disaffected and under-educated young men is hard to underestimate.
158 http://news.bbc.co.uk/1/hi/uk/7443104.stm.