stroke outcome outcom - university of oxford · contributors to this report chair: anthony rudd...
TRANSCRIPT

outcome
ome
outcom
outcoutc
ome
Report of a working group to the Department of Health
health
indicators
outcome
STROKE

CONTRIBUTORS TO THIS REPORT
Chair: Anthony Rudd
Working group: David Barer, Susanne Cozgrave, Martin Dennis, Shah Ebrahim, Pam Enderby, Neil Goodwin, Margaret Hastings, Caroline Hill, Marcia Kelson, Nadina Lincoln, Sylvia McClauchlan, Bridgit Penhale, Ian Philp, Vivien Press, Wolfgang Schady, Derick Wade, Colin Waine, Karen Waters.
Support group: Unit of Health- Care Epidemiology, University of Oxford: Michael Goldacre (Project Co-ordinator),John Fletcher, Ewan Wilkinson, Alastair Mason.Royal College of Physicians, L ondon: Anthony Hopkins, Penny Irwin.CASPE Research, London: Moyra Amess, James Coles, Robert Cleary.UK Clearing House on Health Outcomes, Nuffield Institute for Health, University of Le eds:Andrew Long, Gillian Fairfield.NHS Centre for Reviews and Dissemination, University of Yo rk: Alison Eastwood.
Edited by: Anthony Rudd, Michael Goldacre, Moyra Amess, John Fletcher, Ewan Wilkinson, Alastair Mason, Gillian Fairfield, Alison Eastwood, Robert Cleary and James Coles for the Working Group on Outcome Indicators for Stroke.
This report may be referenced as follows:Rudd A, Goldacre M, Amess M, Fletcher J, Wilkinson E, Mason A, Fairfield G, Eastwood A, Cleary R,Coles J (eds). Health Outcome Indicators: Stroke. Report of a working group to the Department ofHealth. Oxford: National Centre for Health Outcomes Development, 1999.
FOREWORD
The Government consultation document “A First Class Service - Quality in the new NHS”, published in 1998, emphasised three essential aspectsof ensuring delivery of high quality of care by the National Health Service: setting, delivering and monitoring standards. It also discussed theimportance of partnership between the Government and the clinical professions and patients in achieving such quality.
This series of 10 reports concerns the third aspect - monitoring standards. It represents the culmination of work that was started several yearsago under the auspices of the Clinical Outcomes Group, chaired jointly by the then Chief Medical Officer, Sir Kenneth Calman, and the ChiefNursing Officer, Dame Yvonne Moores. The work was commissioned by the former Central Health Outcomes Unit of the Department ofHealth. The Unit has since moved and is now called the National Centre for Health Outcomes Development (NCHOD), based jointly at theInstitute of Health Sciences, University of Oxford and the London School of Hygiene and Tropical Medicine, University of London.
The background to the work was the need to ensure that the NHS is driven by considerations of quality and outcome. The Department wantedto build on an earlier set of Population Health Outcome indicators, which had been limited by the constraints of existing routine data. Ittherefore commissioned systematic work on ten clinical topics, to be undertaken by a Working Group on each, tasked to makerecommendations on ‘ideal indicators’ for each condition. ‘Ideal indicators’ were defined as statistical measures of what should be known, andrealistically could be known, about the outcomes of the condition in routine clinical practice. The Groups were asked to consider a widespectrum of possible uses of outcome indicators, from national monitoring of NHS performance by government to the periodic assessment oflocal services by clinicians and users.
The work of the Working Groups was coordinated by Michael Goldacre, University of Oxford. A particular feature of the work is that theGroups have recommended definitions and technical specifications for each indicator. It is hoped that people interested in monitoring thetopic covered by each indicator will use the same definitions so that comparisons can be facilitated. Moreover, the methodology adopted bythe Working Groups is applicable to developing health outcome indicators for many other conditions.
The publication of these reports, however, is only one further step on a long road of quality assessment in health care. The reports present‘menus’ of suggestions for ways in which outcomes might be monitored in a variety of settings, by a variety of organisations and people. Itgoes without saying that NCHOD will welcome feedback on the reports and on the development and use of outcome indicators.
I believe that the work described here shows the value and potential of partnerships between various parties. Each working group had memberswho brought together perspectives of all the relevant clinical professions plus patients, NHS managers, policy makers, researchers and othersas appropriate. The recommendations of the Working groups show quite clearly how these various perspectives may contribute to a broaderand more balanced monitoring of standards. I would personally like to congratulate and thank everyone who has worked so hard and well tobring this initiative to fruition.
Azim Lakhani (Director - National Centre for Health Outcomes Development)
AM1115-Foreword/Contributors 07/01/2000 05:28 pm Page 1
OUTCOME INDICATORS FOR STROKE
CONTENTS OF REPORT Page
Summary of recommendations 1
Sections:
1. Introduction to the Report 3
2. Health outcome model for stroke 5
3. Choice of candidate indicators 13
4. Candidate indicator specifications 17
5. Recommendations 85
Appendices:
A. Background to the work 93
B. Stroke Working Group 99
C. Work commissioned from NHS Centre for 101
Reviews and Dissemination
D. Methods for choosing candidate indicators 109
E. Guidance notes for indicator specifications 113
F. Work commissioned from the UK Clearing 115
House on Health Outcomes
G. References to text and all appendices 135

Category Page
A 18
C 20
A 22
B 24
C 26
B 28
D 30
A 32
C 34
A 37
E 38
1
Using a variety of check lists including a health outcome model, the Group
identified outcome indicators which were fully specified in a standard format and
are included in this Report. Outcome indicators, whose numbers correspond to the
specifications in Section 4, were grouped under four headings relating to the aim of
the intervention.
Recommendations for implementation were made for each indicator using the
following categories:
A. To be implemented generally on a routine basis.
B. To be implemented generally by periodic survey.
C. To be implemented where local circumstances allow on a routine basis.
D. To be implemented where local circumstances allow by periodic survey.
E. To be further developed either because the link with effectiveness is not clear
or the indicator specification is incomplete.
Indicators related to reduction/avoidance of risk of first/subsequent stroke
1A. Incidence of hospitalised stroke.
1B. Population-based incidence of stroke.
2. Percentage of general practice patients who have had their blood pressure
recorded in the previous five years.
3. Median and inter-quartile range of systolic blood pressure within a general
practice population.
4. Percentage of general practice patients, identified as hypertensive, whose
most recent systolic blood pressure measurement is less than 160 mm Hg.
5. Percentage of patients within a general practice population who have a
prescription for aspirin therapy at six months after stroke (without proven
haemorrhage).
6. Percentage of general practice patients with a diagnosis of atrial fibrillation
who have a prescription for anticoagulant therapy.
Indicators related to reduction of death from stroke
7A. Case-fatality rate within 30 days of a hospital admission for stroke.
7B. Case-fatality rate within 30 days of stroke (in-patient or community-based
treatment).
8. Population-based mortality rates.
Indicators related to reduction/avoidance of complications from stroke
9. Percentage of patients within a provider unit population for whom a formal
swallowing assessment was undertaken within 24 hours of a stroke.
SUMMARY OF RECOMMENDATIONS

10. Incidence of pressure sores during the in-patient stay within a hospital
provider unit population with a primary diagnosis of stroke.
11A. Percentage of patients within a community provider population who,
six months following a stroke, have one or more pressure sores.
11B. Percentage of patients in a nursing home population who, six months
following a stroke, have one or more pressure sores.
12. Rate of emergency re-admissions (for any reason) within 30 days of discharge,
per provider unit population with a primary diagnosis of stroke.
Indicators relating to improving function and well-being after stroke
13. Multi-professional involvement in the week following admission within a
provider unit population admitted with a primary diagnosis of stroke.
14. Distribution of the Barthel Index of Activities of Daily Living (ADL), at
discharge from hospital, within a provider unit population with a primary
diagnosis of stroke.
15. Distribution of the Barthel Index of Activities of Daily Living (ADL), within a
population of patients six months following stroke.
16. Assessment of aphasia within a population of patients six months following
stroke.
17. Assessment of outdoor mobility within a population of patients six months
following stroke.
18. Assessment of social functioning within a population of patients six months
following stroke.
19. Assessment of depression within a population of patients six months following
stroke.
20. Summary of changes in the Barthel Index measured at discharge from hospital
and at six months post-stroke, within a provider unit population admitted for
stroke.
21A. Percentage of people admitted with a primary diagnosis of stroke who return
to their pre-admission category of accommodation on discharge from hospital.
21B. Percentage of people admitted with a primary diagnosis of stroke who are
living in their pre-admission category of accommodation six months following
admission to hospital.
21C. Percentage of people with a diagnosis of stroke who were not hospitalised
and are living at their pre-stroke category of accommodation six months after
the stroke.
22. Summary of a measure of patients’ or carers’ knowledge of available health
and social services, six months after stroke.
23. Summary of a measure of patient satisfaction within a population, six months
after stroke.
24. Assessment of carer burden, six months after stroke.
A 40
D 43
B 45
D 48
B 50
A 52
B 55
E 58
E 61
E 63
E 65
D 68
A 70
B 72
D 74
E 76
E 78
E 80
2
Stroke Outcome Indicators

Health outcome indicators
1.1 This Report is one of a series containing the recommendations of working
groups set up to develop ‘ideal’ indicators of the health outcomes of
specific conditions. The background to the work, commissioned by the
Department of Health, is summarised in Appendix A.
1.2 Health outcomes have been defined as changes in health, health related status
or risk factors affecting health, or lack of change when change is expected.
They may be the result of the natural history of the condition or may be the
effect of interventions to prevent or treat it. The particular concern of the
working groups has been to make recommendations about outcomes which
may be attributable to interventions or the lack of them.
1.3 The term indicator has been defined as an aggregated statistical measure,
describing a group of patients or a whole population, compiled from
measures or assessments made on people in the group or the population. An
indicator may not necessarily provide answers to whether care has been
‘good’ or ‘bad’; but well chosen indicators, as the term implies, should at least
provide pointers to circumstances which may be worth further investigation.
1.4 An ‘ideal’ indicator has been taken to mean what should be known, and
realistically could be known, about the outcomes of the prevention and care
of specific conditions. The development of the recommendations has, of
course, been tempered by considerations of the likely cost and availability of
information. However, the working groups have tried to be reasonably far-
sighted in their views about future advances in information systems.
1.5 For each condition the working group has developed a menu of indicators
which can be used by different groups of people for a variety of purposes. In
particular, an attempt has been made to recommend, within each set,
indicators which reflect a population, clinical, patient, and in relevant cases, a
carer perspective.
Stroke Working Group
1.6 The terms of reference and membership of the Group are shown in Appendix
B. The Group included representatives of professional, managerial and patient
groups involved with the prevention and treatment of stroke.
3
1. INTRODUCTION TO THE REPORT

4
1.7 The work of the Group had three main components:
- development of check lists, including a health outcome model for stroke,
to assist members choose candidate indicators, by which is meant potential
indicators worth detailed consideration
- specification of candidate indicators
- recommendations about implementation and further development.
1.8 In this Report:
- the health outcome model is described in Section 2
- work commissioned to support the model is included in Appendix C
- check lists for choosing candidate indicators are outlined in Appendix D
- guidelines for specifying candidate indicators are described in Appendix E
- a review of indicators developed previously is in Appendix F
- candidate indicators chosen for specification are listed in Section 3
- candidate indicator specifications are included in Section 4
- recommendations about implementation and development are made in
Section 5
- references to all sections and appendices are in Appendix G.
Recommendations
1.9 The recommendations made by the Group were categorised as those which:
- can be implemented generally throughout the NHS as there are systems
available which can provide the requisite data
- could be implemented now where local circumstances allow, and more
generally in the near future once expected developments are in place
- will not be possible to implement in the near future but, because of their
desirability, they should be considered in the future development of clinical
and management information systems
- require further work before a recommendation can be made.
1.10 The recommendations have been further categorised as to whether the
requisite indicators should be available:
- routinely on a universal and continuous basis
- from periodic surveys and/or sampling, either at different points in time
nationally or in geographical areas when there is a particular need or
interest.
Stroke Outcome Indicators

Definition and scope of the work
2.1 Stroke is commonly defined as ‘a clinical syndrome typified by rapidly
developing signs of focal or global disturbance of cerebral functions, lasting
more than 24 hours or leading to death, with no apparent causes other than
of vascular origin’.
2.2 It is a clinical diagnosis, usually applied to cerebral infarction or haemorrhage
and includes posterior fossa strokes which may present without hemiplegia.
2.3 The Group decided that, for the purpose of its work, the definition of stroke
should not include:
- subarachnoid haemorrhage without focal signs which has a very different
clinical presentation, cause and natural history
- transient ischaemic attacks which are similar in terms of cause to stroke but
lead to rapid full recovery of function, although these attacks suggest a
liability to a full-blown stroke.
2.4 The Group decided that the scope of the work should exclude the very small
number of strokes in children and adults aged under 20. Where possible, first
strokes should be distinguished from second or subsequent strokes.
Developing a health outcome model
2.5 Although some original work was commissioned by the Group, the greater
part of the input to the development of the stroke outcomes model came from
already published national work including:
- Stroke, an epidemiological overview published in 1994 by the Central
Health Monitoring Unit (Department of Health 1994).
- Health care needs assessment for stroke, one of the 19 reviews
commissioned by the Department of Health (Wade 1994).
2.6 The health outcome model was developed as an aid to help Group members
to identify potential indicators. The model contains four elements:
- an overview of the epidemiology of the disease
- a review of causes and risk factors
- a review of the course, complications and consequences
- a review of relevant interventions.
5
2. HEALTH OUTCOME MODEL FOR STROKE
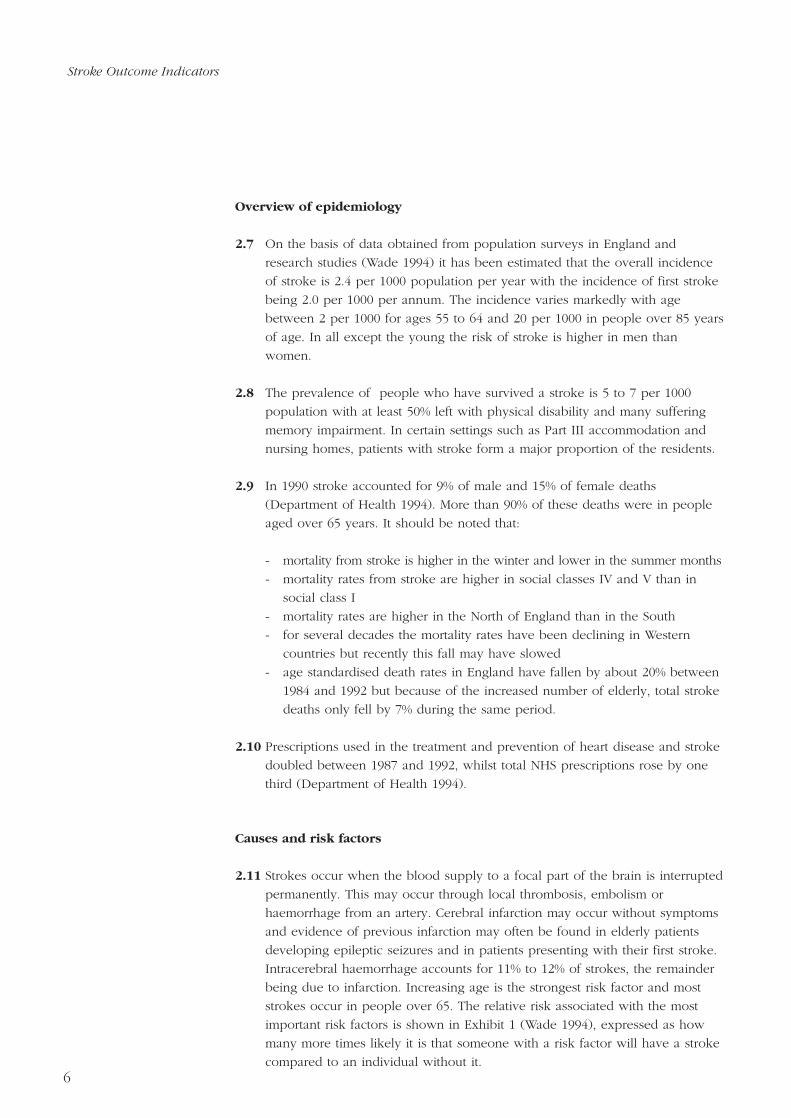
Overview of epidemiology
2.7 On the basis of data obtained from population surveys in England and
research studies (Wade 1994) it has been estimated that the overall incidence
of stroke is 2.4 per 1000 population per year with the incidence of first stroke
being 2.0 per 1000 per annum. The incidence varies markedly with age
between 2 per 1000 for ages 55 to 64 and 20 per 1000 in people over 85 years
of age. In all except the young the risk of stroke is higher in men than
women.
2.8 The prevalence of people who have survived a stroke is 5 to 7 per 1000
population with at least 50% left with physical disability and many suffering
memory impairment. In certain settings such as Part III accommodation and
nursing homes, patients with stroke form a major proportion of the residents.
2.9 In 1990 stroke accounted for 9% of male and 15% of female deaths
(Department of Health 1994). More than 90% of these deaths were in people
aged over 65 years. It should be noted that:
- mortality from stroke is higher in the winter and lower in the summer months
- mortality rates from stroke are higher in social classes IV and V than in
social class I
- mortality rates are higher in the North of England than in the South
- for several decades the mortality rates have been declining in Western
countries but recently this fall may have slowed
- age standardised death rates in England have fallen by about 20% between
1984 and 1992 but because of the increased number of elderly, total stroke
deaths only fell by 7% during the same period.
2.10 Prescriptions used in the treatment and prevention of heart disease and stroke
doubled between 1987 and 1992, whilst total NHS prescriptions rose by one
third (Department of Health 1994).
Causes and risk factors
2.11 Strokes occur when the blood supply to a focal part of the brain is interrupted
permanently. This may occur through local thrombosis, embolism or
haemorrhage from an artery. Cerebral infarction may occur without symptoms
and evidence of previous infarction may often be found in elderly patients
developing epileptic seizures and in patients presenting with their first stroke.
Intracerebral haemorrhage accounts for 11% to 12% of strokes, the remainder
being due to infarction. Increasing age is the strongest risk factor and most
strokes occur in people over 65. The relative risk associated with the most
important risk factors is shown in Exhibit 1 (Wade 1994), expressed as how
many more times likely it is that someone with a risk factor will have a stroke
compared to an individual without it.6
Stroke Outcome Indicators

EXHIBIT 1: SUMMARY OF STROKE RISK FACTORS (Wade 1994)
Risk factors Relative risk
Mild hypertension over 160/95 7
Atrial fibrillation 3-7
Past transient ischaemic attack 5
Heart failure 5
Age 55 to 64 versus 75 and over 5
Smoking 2-5
Alcohol acute intoxication 5
Epilepsy 4
Ischaemic heart disease 3
Snoring 3
Physical inactivity 2.5
Diabetes 2.2
Obesity 1.8
FEV-1 < 3.01 1.8
Social class (I versus V) 1.6
2.12 Since stroke is a complication of cerebrovascular disease it is possible to
classify risk factors into four groups:
- evidence of existing cerebrovascular disease
- evidence of generalised vascular disease
- risk factors for vascular disease where the link is understood
- associations with vascular disease where the mechanism is unclear.
2.13 In one study (Sandercock et al. 1989) 14% of stroke patients had suffered a
previous transient ischaemic attack (TIA) and 14% had a carotid bruit. The
relative risk of stroke associated with a TIA is 5.2. A past history of stroke also
carries an increased risk at about 7% per annum. However, the prevalence of
carotid stenosis (which gives rise to the bruit) is quite high (23% of men age
69 years were found to have it in one study) but the absolute risk associated
with it may be quite low. Even if there were a safe 100% effective treatment
for carotid stenosis, it would only prevent 1.3% of all strokes (Wade 1994).
Consequently identifying these risk factors may be important for individual
patients but will not greatly influence overall stroke incidence.
2.14 Stroke and other vascular disease are often seen together. Of those people
with a diagnosis of stroke 38% have ischaemic heart disease, 25% have
peripheral vascular disease and 13% are in atrial fibrillation (Sandercock et al.
1989).
7
Stroke Outcome Indicators

2.15 Raised arterial blood pressure is the most important avoidable risk factor for
stroke and accounts for a third to a half of the population attributable risk.
Diabetes mellitus carries a relative risk of 2.2. Smoking, obesity and physical
inactivity also carry a slightly increased risk (Wade 1994).
2.16 Other factors may increase the risk of stroke (Wade 1994). Snoring may be
associated with a doubling of the risk of stroke but it is unclear how to
interpret this. There is evidence that maternal health and early fetal and
neonatal nutrition may influence the risk of vascular disease, including stroke,
in later adult life. Social and economic factors may be of importance. Severe
life events are more common in the year preceding a stroke than in controls.
A study of social deprivation in London demonstrated an association between
increased unemployment in an area and increased stroke mortality. Alcohol
taken to excess by either binge drinking or consistent heavy drinking increases
the risk of stroke independently from its association with hypertension. Lastly
there is an association between a low FEV-1 (indicating chest disease) and the
risk of stroke.
Course, complications and consequences
2.17 About 30% of patients with a stroke will die, most of them in the first three
weeks and most as a direct result of the stroke itself. A few die unexpectedly
from other causes such as pulmonary embolism. Patients who survive are at
increased risk of death, another stroke, or a heart attack, at around 10%, 7%
and 10% per annum respectively (Wade 1994).
2.18 Disability from stroke fluctuates markedly over the first week: up to 25%
deteriorate and 25% improve dramatically. Hence early measures of severity
may be of limited use in predicting future outcome. One week after a stroke it
is easier to predict recovery over the next six months. The more severe the
disability at one week the more severe will be the long term disability (Wade
1994).
2.19 Neurological recovery is fastest in the first month although useful recovery
may continue for much longer. Care is still required after the first six months,
particularly to treat hypertension and depression. The best predictor of long
term disability is the presence or absence of urinary incontinence, which can
identify about half of those who will need long term care (Wade 1994).
Exhibit 2 summarises the proportion of people with a stroke who will
experience certain levels of functional deficit.
2.20 In common with other patients with poor mobility, stroke patients are at
increased risk of pressure sores, all or most of which should be preventable.
If there is prolonged limb immobility patients may develop contractures which
further impair function.
8
Stroke Outcome Indicators
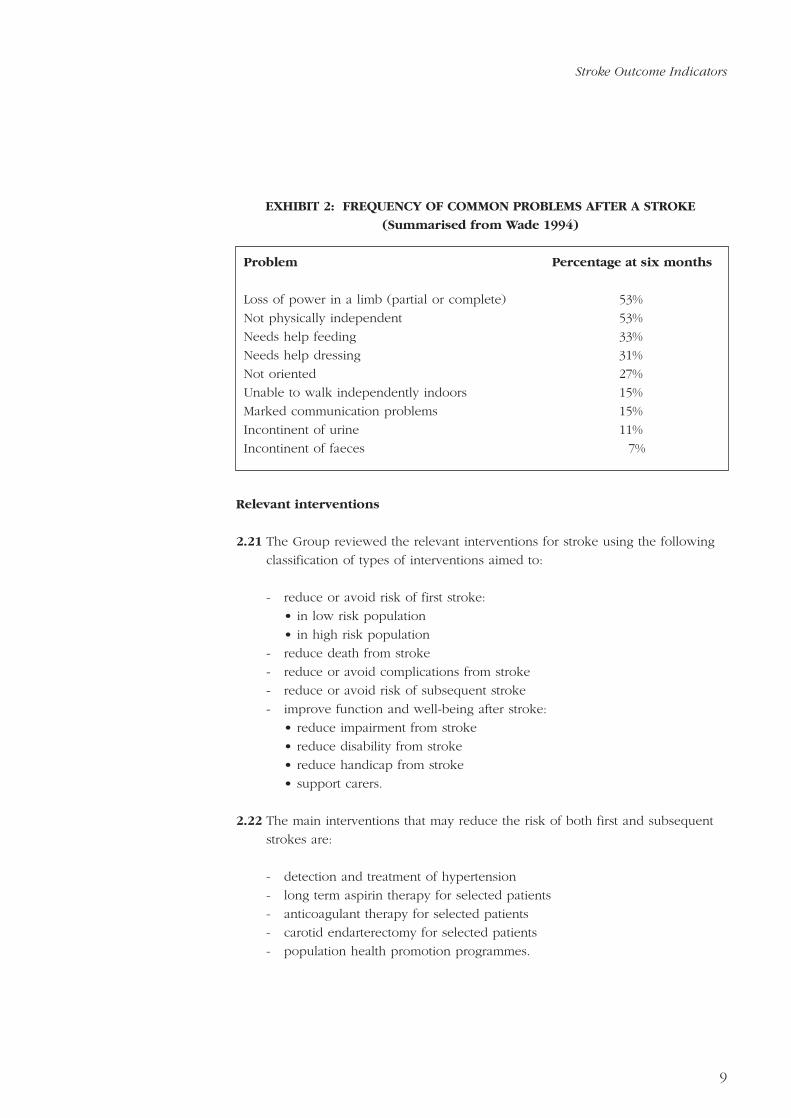
EXHIBIT 2: FREQUENCY OF COMMON PROBLEMS AFTER A STROKE
(Summarised from Wade 1994)
Problem Percentage at six months
Loss of power in a limb (partial or complete) 53%
Not physically independent 53%
Needs help feeding 33%
Needs help dressing 31%
Not oriented 27%
Unable to walk independently indoors 15%
Marked communication problems 15%
Incontinent of urine 11%
Incontinent of faeces 7%
Relevant interventions
2.21 The Group reviewed the relevant interventions for stroke using the following
classification of types of interventions aimed to:
- reduce or avoid risk of first stroke:
• in low risk population
• in high risk population
- reduce death from stroke
- reduce or avoid complications from stroke
- reduce or avoid risk of subsequent stroke
- improve function and well-being after stroke:
• reduce impairment from stroke
• reduce disability from stroke
• reduce handicap from stroke
• support carers.
2.22 The main interventions that may reduce the risk of both first and subsequent
strokes are:
- detection and treatment of hypertension
- long term aspirin therapy for selected patients
- anticoagulant therapy for selected patients
- carotid endarterectomy for selected patients
- population health promotion programmes.
9
Stroke Outcome Indicators
2.23 Raised arterial blood pressure is a major avoidable risk factor for stroke. There
is good evidence from randomised controlled trials that reducing blood
pressure, even from mildly elevated levels, reduces the risk of stroke. The
relative risk reduction is of the order of 30% to 50% (Collins et al. 1990)
though the absolute risk reduction will depend on the pre-existing risk of a
particular patient or group of people. As stroke incidence is ten times higher
in people aged 65 to 74 than in people aged 45 to 54 this similarly alters the
number of people who would need to be treated to prevent one stroke. It
has been estimated that 850 man years of treatment for people aged 35 to 64
with mild hypertension are required to prevent one stroke.
2.24 Treatment with aspirin in a dose of 300 mg per day has been demonstrated to
reduce the risk of vascular death, including stroke, by 15% to 30% in patients
who have had a transient ischaemic attack (Wade 1994). The addition or
substitution of other medications including anticoagulants has not been shown
to be any more effective in this condition except when there is co-existing
mitral valve disease or a trial fibrillation. Patients who have had an ischaemic
stroke should be treated long term with aspirin.
2.25 Anticoagulants in the presence of cardiac disease, especially atrial fibrillation
may reduce the risk of stroke by 50% (Wade 1994). The difficulties of
controlling anticoagulation therapy, its costs and the modest population benefit
make this an area where clinicians still differ as to best policy.
2.26 Carotid arterial surgery is of undoubted benefit for patients with severe carotid
stenosis. However, these patients form a small portion of the whole.
2.27 Population programmes aimed at reducing blood pressure by altering the
national diet to include less salt could theoretically reduce stroke incidence by
20%, but in practice are likely to prove disappointing in their impact (Wade
1994).
2.28 Adequate research has not been completed to identify effective interventions
which modify the early course of stroke although heparin and thrombolytic
agents show some potential.
2.29 Special investigations and scanning may add to the confidence of the diagnosis
but it remains controversial whether the measures influence the final outcome
for the patient. The NHS Centre for Reviews and Dissemination at University of
York carried out a short review of the literature about the use of computer
tomography scanning in stroke. This is at Appendix C and the main findings
are that there is as yet little research which evaluates the use of CT scans in
stroke and none of the current clinical criteria for carrying out routine CT
scans are supported by evidence that this procedure leads to benefits that
outweigh the costs. It was decided not to develop a proxy outcome indicator
related to CT scanning.
10
Stroke Outcome Indicators

2.30 The level of impairment of a patient may vary widely in the first few days
after a stroke. There has been considerable discussion over the setting in
which immediate care should be carried out and the York Centre were
commissioned to complete a short literature review. This is at Appendix C and
the main findings are:
- early and co-ordinated rehabilitation appears to provide benefit without
necessarily increasing the amount of therapy given in total
- there is insufficient evidence to support the superior effectiveness of any
one particular setting, such as a hospital stroke unit, for the provision of
care in the acute phase of the illness
- there is no agreed definition of a stroke unit or what it should entail thus it
is difficult to compare studies
- evidence from trials suggest that ‘stroke units’ may lead to more rapid
recovery in the short term but there is conflicting evidence about sustained
improvement in the long term.
2.31 The available evidence points towards the improved effectiveness of
rehabilitation achieved by a co-ordinated multidisciplinary team and it is also
likely that the process of setting up such co-ordinated approaches will
generate the participation of enthusiastic professionals. The presence of such
individuals may well impact beneficially on the effectiveness of any given
method of organisation.
2.32 Similarly for the long term reduction of impairment from stroke, treatments are
provided by several professional groups working for different agencies. There
is evidence that rehabilitation is more effective when it is part of a co-
ordinated specialist service but at present there is little support to favour any
particular techniques or interventions over another.
2.33 Many patients are left with long term impairment after a stroke which can
have profound consequences for their physical functioning, social and
emotional well-being. Although impairment may be fixed, the degree of
disability and handicap suffered can be influenced by the patient and the care
received. To receive adequate support there must be:
- community support services that are available to people after a stroke
- an assessment process to match individual needs to particular services
- a review mechanism to ensure that a patient is gaining benefit or improved
outcomes from the services provided.
11
Stroke Outcome Indicators

12
2.34 Much of the long term care will take place in the home and involve family
and carers as well as the statutory and voluntary organisations. Carers need:
- recognition of the consequences to them and support in carrying out their
onerous role
- information about the disease, care techniques and the resources available
to them.
Stroke Outcome Indicators

3.1 To assist the Group choose the candidate indicators, literature reviews were
commissioned and a matrix was developed to ensure the coverage of all
relevant aspects of health outcomes.
3.2 The Group commissioned three short literature reviews, which are shown in
Appendix F, from the UK Clearing House on Health Outcomes covering:
- overview of stroke outcome measures
- measurement of long term outcomes of stroke
- measurement of impact of stroke on carers.
3.3 To ensure that all potentially useful aspects of outcomes were considered the
matrix in Exhibit 3 was drawn up using the following dimensions:
- aims of interventions (see paragraph 2.21)
- perspectives of measurement (see paragraph D6).
3.4 For each part of the matrix, consideration was given to possible indicators.
Using the information in the health outcome model, candidate indicators were
identified as shown in the paragraphs which follow. The numbers in the text
relate to the Exhibit and indicator specifications in the next section.
EXHIBIT 3: MATRIX FOR STROKE OUTCOME INDICATORS
Aim of health Primary measurement perspective
intervention Population Clinical Patient Carer
* Reduce or avoid risk of 1A,1B,2,3 4,5,6
first stroke/subsequent
stroke
* Reduce death from stroke 8 7A,7B
* Reduce or avoid 9,10,11A,
complications from stroke 11B,12
* Improve function and 13,14,15, 16,17,18 22,24
well-being after stroke 20 19,21A-C,
22,23
13
3. CHOICE OF CANDIDATE INDICATORS

14
3.5 Factors related to the reduction or avoidance of risk from first or
subsequent stroke were considered to be the detection and treatment of
hypertension, the appropriate use of aspirin and anticoagulant therapy. The
occurrence of stroke can be used to measure the success of risk reduction.
The following candidate indicators were specified:
- Incidence of stroke:
1A: incidence of hospitalised stroke
1B: population-based incidence of stroke.
- Detection and treatment of hypertension as a risk factor for stroke:
2: percentage of general practice patients who have had their blood
pressure recorded in the previous five years
3: median and inter-quartile range of systolic blood pressure within a
general practice population
4: percentage of general practice patients, identified as hypertensive, whose
most recent systolic blood pressure measurement is less than 160 mm Hg.
- Use of aspirin therapy to reduce risk of subsequent stroke:
5: percentage of patients within a general practice population who have a
prescription for aspirin therapy at six months after stroke (without proven
haemorrhage).
- Use of anticoagulant therapy to reduce risk of subsequent stroke:
6: percentage of general practice patients with a diagnosis of atrial
fibrillation who have a prescription for anticoagulant therapy.
3.6 The following indicators which relate to the monitoring of death from stroke
were specified:
7A: case-fatality rate within 30 days of a hospital admission for stroke
7B: case-fatality rate within 30 days of stroke (inpatient or community-based
treatment)
8: population-based mortality rates.
3.7 Key complications following stroke were considered to be difficulty in
swallowing, pressure sores and unplanned re-admission to hospital. The
following indicators were specified:
9: percentage of patients within a provider unit population for whom a
formal swallowing assessment was undertaken within 24 hours of a stroke
Stroke Outcome Indicators

10: incidence of pressure sores during the in-patient stay within a hospital
provider unit population with a primary diagnosis of stroke
11A: percentage of patients within a community provider population who, six
months following a stroke, have one or more pressure sores
11B: percentage of patients in a nursing home population who, six months
following a stroke, have one or more pressure sores
12: rate of emergency re-admissions (for any reason) within 30 days of
discharge, per provider unit population with a primary diagnosis of
stroke.
3.8 The improvement of function and well-being after stroke can be assessed
by measures of the patient’s impairment, disability, handicap, awareness of the
condition and satisfaction. Two indicators related to carers have been
included. The following indicators were specified:
13: multi-professional involvement in the week following admission within a
provider unit population admitted with a primary diagnosis of stroke
14: distribution of the Barthel Index of Activities of Daily Living (ADL), at
discharge from hospital, within a provider unit population with a primary
diagnosis of stroke
15: distribution of the Barthel Index of Activities of Daily Living (ADL),
within a population of patients six months following stroke
16: assessment of aphasia within a population of patients six months
following stroke
17: assessment of outdoor mobility within a population of patients six
months following stroke
18: assessment of social functioning within a population of patients six
months following stroke
19: assessment of depression within a population of patients six months
following stroke
20: summary of changes in the Barthel Index as measured at discharge from
hospital and at six months post-stroke, within a provider unit population
admitted for stroke
21A: percentage of people admitted with a primary diagnosis of stroke who
return to their pre-admission category of accommodation on discharge
from hospital
21B: percentage of people admitted with a primary diagnosis of stroke who
are living in their pre-admission category of accommodation six months
following admission to hospital
21C: percentage of people with a diagnosis of stroke who were not
hospitalised and are living at their pre-stroke category of
accommodation six months after the stroke
22: summary of a measure of patients’ or carers’ knowledge of available
health and social services, six months after stroke
23: summary of a measure of patient satisfaction within a population, six
months after stroke
24: assessment of carer burden, six months after stroke.15
Stroke Outcome Indicators

4.1 This section contains the detailed specifications of the candidate indicators
chosen by the Group. They have been grouped together by the types of
health intervention as shown in Exhibit 3.
4.2 Guidance notes which explain the attributes used in the specifications are
included in Appendix E.
4.3 The detailed work of the specifications was carried out by Moyra Amess,
James Coles and Robert Cleary of CASPE Research.
17
4. CANDIDATE INDICATOR SPECIFICATIONS

Incidence of hospitalised stroke
Reduce or avoid risk of first or subsequent stroke.
For a given resident population, age-group, sex and year: the number of provider
spells containing one or more consultant episodes with stroke as a primary diagnosis
where the episode start date is in the relevant year, divided by the size of the
population of interest. The resulting fraction should be expressed per 10,000
population, and its numerator also reported.
Hospitalised incidence of stroke serves as an indicator for failure to prevent, based
on the assumption that many who suffer a stroke, particularly the more serious
cases, are admitted to hospital. However, in the UK the Oxford Community Stroke
Project (1983), suggests some 40-90% of stroke episodes are managed at home. This
indicator is therefore more useful if considered alongside Indicator 1B (Population-
based incidence of stroke).
National and regional trends over time; geographical comparisons.
Policy makers, clinicians and commissioners.
When making inter-district or regional comparisons the interpretation of this
indicator may be complicated by variable service provision within these areas. This
is particularly relevant as regards the balance of stroke services between primary
and secondary care. It is likely that effective primary and community services would
lead to a reduced number of hospital admissions for stroke. Without specific
knowledge of the services available in any particular area under comparison,
interpretation will be difficult and the value of the indicator limited.
The numerator may be obtained from CMDS data with a primary diagnosis of stroke
(ICD-10 codes I61 (intracerebral haemorrhage), I62 (other non-traumatic intracranial
haemorrhage), I63 (cerebral infarction), I64 (stroke, not specified as haemorrhage or
infarction)), which are held by the relevant commissioner(s) for the relevant year.
The denominator may be obtained from population estimates held by health
authorities and other agencies.
The validity of the indicator will depend on the quality of the CMDS diagnoses
which is unlikely to be uniformly high. It is also possible that some of the hospital
spells identified will be re-admissions for patients who have deteriorated since their
first discharge. Such episodes may be coded with stroke as a primary diagnosis, and
therefore this indicator may over estimate the incidence of stroke. Linkage of
hospital stroke episodes by the NHS number would identify multiple admissions
and allow further scrutiny as to whether the episode should be counted as an
additional stroke incident for that year. Variation will reflect differing levels of
aetiological factors for stroke, as yet largely unknown, as well as reflecting the
Title
Intervention aim
Definition
Rationale
Potential uses
Potential users
Possible confounders
Data sources
Data quality
18
Stroke Outcome Indicators
Candidate indicator 1A Characteristics
Specificity: GenericPerspective: PopulationTimeframe: Cross-sectional
Outcome relationship: Direct
result of programmes to reduce known risk factors. Quantified information about
hospitalised incidence should help decision-making about the local provision and
development of services.
No specific points.
Studies to investigate the diagnostic coding of re-admissions following stroke would
provide some assessment of the reliability of the data source for this indicator.
A - To be implemented generally on a routine basis.
Oxfordshire Community Stroke Project (1983). Incidence of stroke in Oxfordshire:
first year’s experience of a Community Stroke Register. British Medical Journal,
287, 713-717.
Comments
Further work required
Conclusions & priority
References
19
Stroke Outcome Indicators
20
Title
Intervention aim
Definition
Rationale
Potential uses
Potential users
Possible confounders
Data sources
Data quality
Comments
Population-based incidence of stroke
Reduce or avoid risk of first or subsequent stroke.
For a given resident population, age-group, sex and year: the number of cases of
stroke recognised as occurring within the given year, divided by the size of the
population of interest. The resulting fraction should be expressed per 10,000
population, and the numerator should be reported.
Stroke is thought to be potentially avoidable. The incidence could be decreased by
reducing the prevalence of modifiable risk factors, the main treatable risk factor
being hypertension (Havas 1987). Population-based stroke incidence therefore
serves as an indicator of the success or failure to prevent stroke in the population.
National and regional trends over time; geographical comparisons.
Policy makers, clinicians and commissioners.
Risk factors for stroke in the populations being compared are potentially
confounding variables. Some control may be obtained if the results are stratified by
age, sex and recognised risk factors such as smoking.
The numerator may be obtained from GP records. Such records should register both
hospital and community managed episodes of stroke for patients. In general
practices which have computerised patient records, stroke may be identified
through use of Read coding of, for example, stroke (XOOD1) or cerebral infarction,
unspecified (XaOkZ) (NHS Centre for Coding and Classification 1996). The
denominator may be obtained from population estimates held by health authorities
and other agencies.
The validity of the indicator will depend on the quality of the GP practice data
which is unlikely to be uniformly high. The data source relies on correspondence
between primary and secondary care through discharge letters or summaries. There
may, therefore, be patients who were hospitalised as a result of stroke, but without
an identified GP, who would be missed through this approach. Similarly, patients
who die suddenly as a result of stroke and do not present to health services will
also be missed. A pilot study comparing incidence of chronic diseases as recorded
in GP paper records and that recorded on computer records suggests under-
reporting in the latter (Murphy and Jenkins 1995).
It would be useful to undertake validation studies, comparing the recording of
stroke in GP records with that in community stroke registers and that recorded
periodically in the national morbidity surveys. We suggest that the greatest value in
monitoring the community-based incidence of stroke would be in places where
there is a commitment to the establishment and maintenance of stroke registers
Candidate indicator 1B
Stroke Outcome Indicators
Characteristics
Specificity: GenericPerspective: PopulationTimeframe: Cross-sectional
Outcome relationship: Direct

based on multiple sources including hospital and GP records. These could act as
‘marker populations’, to be used as proxies for the population as a whole.
Elsewhere, the community-based incidence of stroke could be monitored through
GP records by periodic survey.
Further investigation of the quality of computerised records within general
practices, particularly in the light of the recent more relaxed data collection
requirements for chronic disease management programmes (NHS Executive 1995).
C - To be implemented where local circumstances allow on a routine basis.
Havas, S. (1987). Prevention of heart disease, cancer and stroke: The scientific
basis. World Health Forum, 8, 344-351.
NHS Executive (1995). GPs’ out of hours services. FHSL (95)68. NHS Executive,
Leeds.
NHS Centre for Coding and Classification (1996). The Read Codes October 1996
Demonstrators. NHS Executive, Leeds.
Murphy, P., and Jenkins A. (1995). Medics: practice feedback report.
Northumberland Health.
Further work required
Conclusions & priority
References
21
Stroke Outcome Indicators

22
Title
Intervention aim
Definition
Rationale
Potential uses
Potential users
Possible confounders
Data sources
Data quality
Percentage of general practice patients who have had their blood pressure
recorded in the previous five years
Reduce or avoid risk of first or subsequent stroke.
For a given general practice and on a specific day: the number of patients who have
had their blood pressure recorded within the last five years divided by the number of
patients currently registered. The resulting fraction should be expressed as a
percentage and reported by patient age-group and sex.
Raised arterial blood pressure is the most important avoidable risk factor for stroke
and accounts for a third to a half of the population attributable risk (Wade 1994).
Raised blood pressure may be present for many years without causing symptoms
and such asymptomatic hypertension could be detected (and subsequently treated)
early by routine measurement of blood pressure in general practice.
Local management of practice; GP provider based comparisons; monitoring of
national targets.
Clinicians, provider management, commissioners.
Comparisons between general practices may be affected by the frequency with
which patients visit their general practitioner. This is determined by a number of
variables other than an episode of illness such as access, appointment times and
availability, transport, and the doctor-patient relationships. Substantial changes in
list size over time may affect the indicator and its interpretation.
Prior to October 1st 1996, the GMSC health promotion programme package (bands
II and III) required the recording of blood pressure of the practice population.
Targets of 90% coverage were achieved after five years of running the programme
(General Medical Services Committee 1993). Although this data collection is no
longer compulsory (NHS Executive 1996), the inclusion of monitoring of this nature
is encouraged within the locally specified programmes which have now replaced it.
Health of the Nation targets include an aim to reduce systolic blood pressures by 5
mm Hg by the year 2005 (Department of Health 1995). For computerised practices,
Read codes exist for BP screening for example, first call (90D1), abnormal BP on
first call (90D9) and check done (901A) (NHS Centre for Coding and Classification
1996). Ninety-five percent of general practitioners in England were providing full
GMSC programmes for primary prevention of stroke in 1995 (Department of Health
1996).
Accuracy of data will depend on the quality of data yielded by the new health
promotion programmes. Although there are no requirements to monitor the quality
of these data, some individual HAs are considering the introduction of local checks
to assess the accuracy and validity of the data.
Candidate indicator 2
Stroke Outcome Indicators
Characteristics
Specificity: Condition-specificPerspective: PopulationTimeframe: Cross-sectional
Outcome relationship: Indirect
There should be local encouragement for general practices to continue to monitor
blood pressure as part of their health promotion programme.
None recommended.
A - To be implemented generally on a routine basis (by an annual priority
audit).
Department of Health (1995). Public Health Common Data Set 1994. Institute of
Public Health, University of Surrey.
Department of Health (1996). Statistical Bulletin: statistics for general medical
practitioners in England: 1985-1995. Department of Health, London.
General Medical Services Committee (1993). The new health promotion package.
BMA, London.
NHS Executive (1996). GP health promotion. FHSL (96) 35. NHS Executive, Leeds.
NHS Centre for Coding and Classification (1996). The Read Codes October 1996
Demonstrators. NHS Executive, Leeds.
Wade, D.T. (1994). Stroke (acute cerebrovascular disease). In Health care needs
assessment. Vol.1, (ed. A. Stevens and J. Rafferty), pp. 111-255. Radcliffe Medical
Press, Oxford.
Comments
Further work required
Conclusions & priority
References
23
Stroke Outcome Indicators

Median and inter-quartile range of systolic blood pressure within a general
practice population
Reduce or avoid risk of first or subsequent stroke.
For a given general practice and year: the median and interquartile range of systolic
blood pressure, measured within the given year. These statistics, with the associated
number of cases, should be reported by patient age-band and sex. To facilitate
comparisons with the Public Health Common Data Set (Department of Health 1995),
corresponding means should also be reported.
Significant public health gains would be expected from reducing the average blood
pressure level of the whole population, and from the detection and appropriate
treatment of raised blood pressure in individuals (Department of Health 1992). For
the majority of individuals, whether conventionally ‘normotensive’ or ‘hypertensive’,
it has been concluded that a lower blood pressure should confer a lower risk of
vascular disease (Department of Health 1992). As well as screening for patients with
raised blood pressure in the local practice populations, this indicator will facilitate
local annual monitoring of, and action towards the Health of the Nation target
which is ‘to reduce mean systolic blood pressure in the adult population by at least
5 mm Hg by the year 2005’ (Department of Health 1995).
National monitoring; GP provider based comparisons; HA comparisons.
Policy makers, clinicians, commissioners.
Because the denominator for this indicator is the whole general practice population,
the indicator will be influenced by the proportion of patients for whom relevant
blood pressure data are available. Indicator 2 may to some extent assist
interpretation of low scores.
Although no longer required by the General Medical Services Committee health
promotion programme package, general practitioners should be encouraged to
undertake regular checks on the blood pressure of their local population (see data
sources, Indicator 2).
Accuracy of data will depend on the quality of records yielded within the health
promotion programmes and GP systems in general. Currently there are no
requirements to monitor the quality of these data, but some individual HAs are
considering the introduction of checks for accuracy and validity.
As well as monitoring change at a population level, data underlying the indicator
could be used to look at changes in blood pressure within individuals.
Title
Intervention aim
Definition
Rationale
Potential uses
Potential users
Possible confounders
Data sources
Data quality
Comments
24
Stroke Outcome Indicators
Candidate indicator 3 Characteristics
Specificity: Condition-specificPerspective: PopulationTimeframe: Cross-sectional
Outcome relationship: Direct

None recommended.
B - To be implemented generally by periodic survey.
Department of Health (1992). The Health of the Nation: a strategy for health in
England. HMSO, London.
Department of Health (1995). Public Health Common Data Set 1994. Institute of
Public Health, University of Surrey.
Further work required
Conclusion & priority
References
25
Stroke Outcome Indicators

Percentage of general practice patients, identified as hypertensive, whose
most recent systolic blood pressure measurement, is less than 160 mm Hg
Reduce or avoid risk of first or subsequent stroke.
For a given general practice and year: the number of patients previously diagnosed
as hypertensive, whose most recent systolic blood pressure measurement in the given
year is less than 160 mm Hg, divided by the number of patients previously diagnosed
as hypertensive. The resulting fraction should be expressed as a percentage and
reported together with its denominator, by patient age-group and sex.
Significant public health gains would be expected from reducing the average blood
pressure level of the whole population and from the detection and appropriate
treatment of raised blood pressure in individuals (Department of Health 1992). It
has been estimated that anti-hypertensive treatment could reduce the incidence of
stroke by 40% (Collins et al. 1990; MacMahon et al. 1990). For the majority of
individuals, whether conventionally ‘normotensive’ or ‘hypertensive’, it has been
concluded that a lower blood pressure should confer a lower risk of vascular
disease (Collins et al. 1990; MacMahon et al. 1990). The indicator is defined as all
patients previously identified (within their GP records) as hypertensive, because
continued blood pressure monitoring is considered appropriate in such cases.
GP audit; national monitoring; GP provider based comparisons; HA comparisons.
Policy makers, clinicians, commissioners.
Compliance with treatment/advice. Hypertension which is intractable to treatment.
Variation in recording blood pressure within individuals. Potential variability in the
definition of hypertension should be considered when interpreting comparisons
across practices.
Denominator data should be obtainable from GP information systems by identifying
patients with a diagnosis of hypertension. For computerised systems, Read codes
are available to identify such patients (G2.. - BP+ hypertension) (NHS Centre for
Coding and Classification 1996). Although no longer required by the General
Medical Services Committee health promotion programme package, general
practitioners should be encouraged to undertake regular checks on the blood
pressure of their local population (see data sources, Indicator 2).
Accuracy of data will depend on the quality of data yielded by the new health
promotion programmes and GP information systems in general.
No specific points.
Title
Intervention aim
Definition
Rationale
Potential uses
Potential users
Possible confounders
Data sources
Data quality
Comments
26
Candidate indicator 4
Stroke Outcome Indicators
Characteristics
Specificity: Condition-specificPerspective: ClinicalTimeframe: Longitudinal
Outcome relationship: Direct
None recommended.
C - To be implemented where local circumstances allow on a routine basis.
Collins, R., Peto, R., MacMahon, S., Hebert, P., Fiebach, N.H., Eberlein, K.A.,
Godwin, J., Qizilbash, M., Taylor, J.O., and Hennekens, C.H. (1990). Blood
pressure, stroke and coronary heart disease. II: short-term reductions in blood
pressure: overview of randomised drug trials in their epidemiological context.
Lancet, 335, 827-838.
Department of Health (1992). The Health of the Nation: a strategy for health in
England. HMSO, London.
MacMahon, S., Peto, R., Cutler, J., Collins, R., Sorlie, P., Neaton, J., Abbott, R.,
Godwin, J., Dyer, A., and Stamler, J. (1990). Blood pressure, stroke and coronary
heart disease. I: prolonged differences in blood pressure: prospective observational
studies corrected for the regression dilution bias. Lancet, 335, 765-774.
NHS Centre for Coding and Classification (1996). The Read Codes October 1996
Demonstrators, NHS Executive, Leeds.
Further work required
Conclusion & priority
References
27
Stroke Outcome Indicators

Percentage of patients within a general practice population who have a
prescription for aspirin therapy at six months after a stroke (without
proven haemorrhage)
Reduce or avoid risk of subsequent stroke.
For a given general practice and year: the number of patients who had a stroke
(without proven haemorrhage) in the given year and who, six months later, had a
current prescription for aspirin, divided by the number of patients who had a stroke
(without proven haemorrhage) in that year. The resulting fraction should be
expressed as a percentage and reported by patient age-group and sex.
For the purposes of this indicator, the patients referred to are those currently under
the care of their general practitioner.
Aspirin is well established as secondary prophylaxis in patients with arterial
thrombotic disorders (British Medical Journal 1988). It has been shown that regular
aspirin reduces the risk of subsequent stroke, myocardial infarction, or vascular
death (Antiplatelet Trialists’ Collaboration 1988). The prescription of aspirin on a
long-term basis following most cases of ischaemic stroke is therefore recommended
and most patients would therefore have a prescription six months after the incident.
Local audit; management of patient groups; GP based comparisons of the
effectiveness of primary care provision in reducing the incidence of subsequent
strokes.
Clinicians, commissioners.
It is possible, due to the costs involved, that rather than using a doctor’s
prescription, patients will obtain their aspirin ‘over-the-counter’. This is likely to vary
with socio-economic and demographic factors associated with eligibility for free
prescriptions.
Denominator data should be obtainable from GP information systems by identifying
cases of stroke in a given year. For computerised systems the required Read codes
to identify strokes without proven haemorrhage are cerebral infarction (XaOKZ) and
stroke of unknown pathology (X00DR). Each of these cases should then be
followed up to six months for a current prescription for aspirin (Read code xO2LX)
(NHS Centre for Coding and Classification 1996).
The maintenance of a stroke register would provide the denominator data for this
indicator (see data sources, Indicator 2).
Title
Intervention aim
Definition
Rationale
Potential uses
Potential users
Possible confounders
Data sources
28
Candidate indicator 5
Stroke Outcome Indicators
Characteristics
Specificity: Condition-specificPerspective: ClinicalTimeframe: Cross-sectional
Outcome relationship: Indirect

The quality of the data relies on the reliability of GP information systems for
identifying diagnoses of stroke and patients’ current prescriptions as well as the
ability to link these. The existence of a stroke register may enhance the access to,
and quality of, this information.
An alternative indicator, addressing the primary prevention of stroke, could look at
the use of aspirin in patients who have had transient ischaemic attacks. However,
difficulties with establishing this diagnosis accurately may cause problems in case
ascertainment.
None recommended.
B - To be implemented generally by periodic survey.
Antiplatelet Trialists’ Collaboration (1988). Secondary prevention of vascular disease
by prolonged anti-platelet therapy. British Medical Journal, 296, 320-31.
British Medical Journal (Editorial) (1988). Aspirin all round. British Medical Journal,
296, 307-308.
NHS Centre for Coding and Classification (1996). The Read Codes October 1996
Demonstrators. NHS Executive, Leeds.
Data quality
Comments
Further work required
Conclusion & priority
References
29
Stroke Outcome Indicators

Percentage of general practice patients with a diagnosis of atrial fibrillation,
who have a prescription for anticoagulant therapy
Reduce or avoid risk of first stroke.
For a given general practice population: the number of patients with a diagnosis of
atrial fibrillation, who have a prescription for anticoagulants, divided by the number
of patients with a diagnosis of atrial fibrillation. The resulting fraction should be
expressed as a percentage, and reported, along with the numerator by age-group
and sex.
Anticoagulants have been described as highly effective for preventing cardioembolic
strokes (Albers 1995). Cardioembolism accounts for approximately 20% of ischaemic
strokes and is the most likely cause of a stroke in patients with atrial fibrillation,
who have suffered a recent anterior myocardial infarction or have prosthetic valves
(Cerebral Embolism Task Force 1989). Atrial fibrillation affects 2% of individuals in
their 60s and 10% of those over 80 (Batstone 1996). The average practice will have
approximately seven patients per 1,000 on warfarin, of which almost half are
receiving their anticoagulation care directly from their local practice (EQUIP Project
1996). An important factor is the availability of anticoagulation monitoring facilities
and the benefit of anticoagulation depends crucially upon the quality of control.
Monitoring may help identify non-availability of such facilities.
Identification of significant variation in the use of anticoagulation therapy for the
prevention of stroke within GP populations with atrial fibrillation.
Clinicians, commissioners, policy makers.
No specific ones identified.
Denominator data should be obtainable from GP information systems identifying
patients with a diagnosis of atrial fibrillation. For computerised systems Read codes
are available to identify such patients (atrial fibrillation - G5730) (NHS Centre for
Coding and Classification 1996). The numerator will be the number of patients
identified with a diagnosis of atrial fibrillation who have a prescription for
anticoagulants (Read code- x01Nx ) at the time of survey.
The quality of the data depends on the reliability of GP information systems for
diagnoses and prescriptions. The data source also relies on a correspondence
between primary and secondary care through discharge letters or summaries. A pilot
study comparing incidence of chronic diseases as recorded in GP paper records and
incidence recorded on computer records suggests under reporting and the need for
improvement in data quality (Murphy and Jenkins 1995).
Title
Intervention aim
Definition
Rationale
Potential uses
Potential users
Possible confounders
Data sources
Data quality
30
Stroke Outcome Indicators
Characteristics
Specificity: Condition-specificPerspective: ClinicalTimeframe: Cross-sectional
Outcome relationship: Indirect
Candidate indicator 6
No specific points.
None recommended.
D - To be implemented where local circumstances allow by periodic survey.
Albers, G.W. (1995). Antithrombotic agents in cerebral ischaemia. The American
Journal of Cardiology, 75, 34B-38B.
Batstone, G. (1996). Digest of evidence: stroke prevention. Journal of Clinical
Effectiveness, 1, 75-76.
Cerebral Embolism Task Force (1989). Cardiogenic brain embolism. Archives of
Neurology, 46, 727-743.
EQUIP (Evaluating Quality in Practice) Project and the FACTS Project (Framework
for Appropriate Care Throughout Sheffield) (1996). Anticoagulation: a city-wide
perspective. Evaluating Quality in Practice Project, University of Sheffield.
NHS Centre for Coding and Classification (1996). The Read Codes October 1996
Demonstrators. NHS Executive, London.
Murphy, P., and Jenkins, A. (1995). Medics: practice feedback report.
Northumberland Health.
Comments
Further work required
Conclusion & priority
References
31
Stroke Outcome Indicators

Case-fatality rate within 30 days of a hospital admission for stroke
Reduce death from stroke.
For a given provider unit population, and year: the number of patients registered as
having died (regardless of certified underlying cause) within 30 days of an
admission (to the given unit in the given year) containing one or more episodes with
a primary diagnosis of stroke, divided by the total number of admissions (to the
given unit in the given year) containing one or more episodes with a primary
diagnosis of stroke. The resulting fraction should be expressed as a percentage and
should be reported with associated numerators as an overall figure and by age-
group and sex.
Mortality following a stroke may in part represent an adverse outcome of
antecedent health care. Comparisons of mortality rates, across local populations will
reflect both the effectiveness of care within individual provider units (both hospitals
and general practices) and the presenting characteristics of patients. Although social
and environmental factors are thought to have a strong influence on the distribution
of stroke mortality in England and Wales, the documentation of such inequalities
provides a strong argument for the strengthening of local health services (both
primary and secondary) in areas of high stroke incidence.
Due to the uncertain quality of diagnosis coding on death certificates, for the
purpose of this indicator, deaths for any reason are used for the numerator.
Changes over time in fatality rates, nationally; clinical audit within provider units.
Commissioners and clinicians.
Comparisons should be made in the context of case-mix information confounders
covering co-morbidities and the severity of patient populations. Secondary
diagnoses on the current admission record provide one source, although
completeness of these data may be variable. Alternatively, with general linkage of
hospital activity and death certificate data, previous admissions for defined groups
of relevant morbidities could be used as a basis for standardisation. This method
was used by the Scottish Clinical Outcomes Group in their report on Clinical
Outcome Indicators (Clinical Outcomes Group 1995). Another possibly relevant
descriptor for the in-patient population would be the discharge Barthel score
provided by Indicator 14.
The numerator would be obtained from death certificates linked by a patient
identifier to previous admissions for stroke (ICD-10 codes I61-4 as listed in
Indicator 1A) with an admission date within the previous 30 days. The denominator
may be obtained from CMDS data with a primary diagnosis of stroke.
Title
Intervention aim
Definition
Rationale
Potential uses
Potential users
Possible confounders
Data sources
32
Stroke Outcome Indicators
Characteristics
Specificity: GenericPerspective: ClinicalTimeframe: Longitudinal
Outcome relationship: Direct
Candidate indicator 7A

Potential problems lie with the accuracy of data with respect to diagnostic
information (especially co-morbidity and severity), and those fields shared with
death certificates and which are required for linkage with them. Linkage of hospital
records to death certificates is feasible (Acheson 1967; Henderson et al. 1992).
No specific points.
None recommended.
A - To be implemented generally on a routine basis.
Acheson, E.D. (1967). Medical Record Linkage. Oxford University Press.
Clinical Outcomes Working Group of the Clinical Resource and Audit Group (1995).
Clinical Outcome Indicators. The Scottish Office, Edinburgh.
Henderson, J., Goldacre, M.J., Griffith, M., and Simmons, H. (1992). Recording of
deaths in hospital information systems: implications for audit and outcome studies.
Journal of Epidemiology and Community Health, 46, 297-299.
Data quality
Comments
Further work required
Conclusion & priority
References
33
Stroke Outcome Indicators

Case-fatality rate within 30 days of stroke (in-patient or community-based
treatment)
Reduce death from stroke.
For a given residential population and year: the number of patients who having had
a stroke, are then registered as having died (regardless of certified underlying cause)
within 30 days of that stroke, divided by the total number of patients who had a
stroke in the given year. The resulting fraction should be expressed as a percentage
and reported by age-group and sex.
The date from which a 30 day period is determined should be the date of the
earliest documentation which refers to the stroke incident (see data sources).
Mortality following a stroke may in part represent an adverse outcome of
antecedent health care. Comparisons of mortality rates, across local populations will
reflect both the effectiveness of care within individual provider units (both hospitals
and general practices) and the presenting characteristics of patients. Although social
and environmental influences are thought to have a strong influence on the
distribution of stroke mortality in England and Wales, the documentation of such
inequalities provides a strong argument for the strengthening of local health services
(both primary and secondary) in areas of high stroke incidence. Indicator 7B
intends to provide a more complete picture of mortality from stroke, in that hospital
data alone (Indicator 7A) are less reliable as they typically only identify stroke cases
which were admitted to hospital and not people who died in accident and
emergency departments or who were certified dead on arrival.
Due to the uncertain quality of diagnosis coding on death certificates, for the
purpose of this indicator, deaths for any reason are used for the numerator.
Changes over time in fatality rates, nationally; clinical audit within provider units.
Commissioners and clinicians.
Comparisons should be made in the context of case-mix information covering co-
morbidities and the severity of patient populations. Secondary diagnoses on the
current admission record provide one source although completeness of these data
may be variable. Alternatively, with general linkage of hospital activity and death
certificate data, previous admissions for defined groups of relevant morbidities
could be used as a basis for standardisation. This method was used by the Scottish
Clinical Outcomes Group in their report on Clinical Outcome Indicators (Clinical
Outcomes Group 1995). Another possibly relevant descriptor for the in-patient
population would be the discharge Barthel score provided by Indicator 14.
Title
Intervention aim
Definition
Rationale
Potential uses
Potential users
Possible confounders
34
Stroke Outcome Indicators
Characteristics
Specificity: GenericPerspective: ClinicalTimeframe: Cross-sectional
Outcome relationship: Direct
Candidate indicator 7B

The denominator data should be obtained from GP records and cases may be
identified by the date the patient presented to the GP or, in the case of immediate
admission to hospital following the stroke, the date of admission, both of which
should be recorded on the GP patient record. Ideally, another source would be a
stroke register. Stroke events on GP information systems could be identified using
Read codes (for example stroke - XOOD1 or cerebral infarction - XaOkZ) (NHS
Centre for Coding and Classification 1996). Such systems also identify any relevant
co-morbidities. Numerator data may be obtained from linked death certificates.
Keeping the indicator as counting all strokes and not solely those which were only
cared for in the community, will reduce the need to ascertain from GP notes a
hospital episode, which may not be reliably recorded.
Potential problems lie with the accuracy of data with respect to diagnostic
information (especially co-morbidity and severity), and those fields shared with
death certificates and which are required for linkage with them. Linkage of hospital
records to death certificates is feasible (Acheson 1967; Henderson et al. 1992).
However, similar general practice record linking has not been attempted to date on
a large scale. There are studies commencing which intend to link death certificate
data with GP records (Oxford Record Linkage System, personal communication).
The indicator can make use of Read codes in general practice which makes it more
difficult in those practices which are non-computerised. The only other method of
yielding these data would be by survey and manual searching through notes. This
would be both time-consuming and also assumes complete documentation of such
events.
If feasible, to compare with hospital figures from Indicator 7A, it may be helpful to
report deaths by whether the patient had a hospital admission or not.
The problems with linking data from general practice should be reduced when
there is a unique identifier such as the new NHS number recorded on the death
certificate. The problems with capturing these data as specified may mean this
indicator needs more information system development before its routine use.
Limiting the indicator to focus on deaths following admission to hospital (Indicator
7A) may be more realistic while relying on current data or data which are likely to
be available in the near future.
Examination of hospital records relating to stroke could be used to check that
general practice records are up-to-date with hospital related deaths.
C - To be implemented where local circumstances allow on a routine basis.
Data sources
Data quality
Comments
Further work required
Conclusion & priority
35
Stroke Outcome Indicators
Acheson, E.D. (1967). Medical record linkage. Oxford University Press.
Clinical Outcomes Working Group of the Clinical Resource and Audit Group.
(1995). Clinical Outcome Indicators. The Scottish Office, Edinburgh.
Henderson, J., Goldacre, M.J., Griffith, M., and Simmons, H. (1992). Recording of
deaths in hospital information systems: implications for audit and outcome studies.
Journal of Epidemiology and Community Health, 46, 297-299.
NHS Centre for Coding and Classification (1996). The Read Codes October 1996
Demonstrators. NHS Executive, Leeds.
References
36
Stroke Outcome Indicators

Population-based mortality rates
Reduce death from stroke.
Adapted from Public Health Common Data Set indicator CDS-C3B (DoH 1993b).
For a given population, age-group and sex: deaths from stroke (ICD-10 codes I61-
I64) per 100,000 resident population.
Mortality following a stroke may in part represent an adverse outcome of
antecedent health care, both in relation to primary prevention health care as well as
effectiveness of treatment and rehabilitation services. Comparisons of mortality rates
across local populations will reflect the effectiveness of care within individual
provider units, the presenting characteristics of patients and the underlying causes
of stroke which are in part unknown. Although social and environmental influences
are thought to have a strong influence on the distribution of stroke mortality in
England and Wales, the documentation of such inequalities provides a strong
argument for the strengthening of local health services (both primary and
secondary) in areas of high stroke incidence.
Population based comparisons.
Local and national policy makers.
The Public Health Common Data Set reports this indicator by age and sex. A wide
range of other patient variables have a potential influence on the indicator.
Office for National Statistics.
The indicator relies on the accuracy of recording the underlying cause of death by
the death certificate.
No specific points.
None recommended.
A - To be implemented generally on a routine basis.
Department of Health (1993b). Public Health Common Data Set 1993. Part 1:
indicator definitions. Institute of Public Health, University of Surrey.
Title
Intervention aim
Definition
Rationale
Potential uses
Potential users
Possible confounders
Data sources
Data quality
Comments
Further work required
Conclusion & priority
References
37
Stroke Outcome Indicators
Candidate indicator 8 Characteristics
Specificity: GenericPerspective: PopulationTimeframe: Cross-sectional
Outcome relationship: Direct

Percentage of patients within a provider unit population for whom a formal
swallowing assessment was undertaken within 24 hours of a stroke
Reduce or avoid complications of stroke.
For a given provider unit population and year: the number of patients for whom a
formal swallowing assessment was undertaken and documented, within 24 hours of
admission for a stroke in the given year, divided by the number of patients admitted
for stroke within the relevant year. The resulting fraction should be expressed as a
percentage and reported in patient age-groups.
Dysphagia has been reported to occur in 28-45% of patients with acute stroke
(Odderson and McKenna 1993). Aspiration has been found in 32-51% of patients
with stroke and dysphagia (Barer 1984 and 1989, Gordon et al. 1987). Pneumonia
is a complication of aspiration (Gordon et al. 1987) and is also the second most
frequent cause of death within the first month after cerebral infarction, accounting
for nearly one third of stroke deaths (Bounds et al. 1981). An immediate assessment
of swallowing is important in treating patients with acute stroke. Careful assessment
and management of dysphagia may dramatically reduce aspiration complications
and the associated increased length of stay (Odderson et al. 1995).
Clinical audit and management of patients.
Clinicians, provider managers, commissioners.
No specific ones identified.
Currently, collection of numerator data would require a survey of patient notes to
identify whether an assessment has been made, i.e. a note of such or by the
presence of an assessment form such as the standardised bedside swallowing
assessment (SSA). Alternatively, where more sophisticated clinical information
systems including multi-professional patient records are available, the data may be
more accessible and their analysis more feasible on a routine basis.
The quality of the data would rely on the legibility and completeness of patient
documentation which will vary. A dedicated field within a computerised system
would increase the reliability and completeness of such data.
The relationship between the assessment and treatment of dysphagia has not been
fully investigated in terms of outcomes of death or avoidable chest infections. It is
recognised that dysphagia is common and associated with a worse outcome
(Gordon et al. 1987), but this may simply be that dysphagia accompanies severe
strokes and therefore interventions to reduce swallowing problems may not effect
morbidity or mortality. In the future measuring of the occurrence of chest infections
alongside this indicator may be valuable.
Title
Intervention aim
Definition
Rationale
Potential uses
Potential users
Possible confounders
Data sources
Data quality
Comments
38
Stroke Outcome Indicators
Candidate indicator 9 Characteristics
Specificity: Condition-specificPerspective: ClinicalTimeframe: Cross-sectional
Outcome relationship: Indirect

Investigation of the reliability of surveys to collect swallowing assessment data from
patient notes and further research to establish whether the identification of
dysphagia leads to a reduction in mortality and morbidity.
E - To be further developed because link with effectiveness is not clear.
Barer, D.H. (1984). Lower cranial motor function in unilateral vascular lesions of the
cerebral hemisphere. British Medical Journal, 289, 1621-1622.
Barer, D.H. (1989). The natural history and functional consequences of dysphagia
after hemispheric stroke. Journal of Neurological and Neurosurgical Psychiatry, 52,
236-241.
Bounds, J.V., Wiebers, D.O., Whisant, J.P., and Okazaki, H. (1981). Mechanisms and
timing of deaths from cerebral infarction. Stroke, 12, 474-477.
Gordon, C., Hewer, R.L., and Wade, D.T. (1987). Dysphagia in acute stroke. British
Medical Journal, 295, 411-414.
Odderson, I.R., and McKenna, B.S. (1993). A model for management of patients
with stroke during the acute phase, outcome and economic implications. Stroke, 24,
1823-1827.
Odderson, I.R., Keaton, J.C., and McKenna, B.S. (1995). Swallow management in
patients on an acute stroke pathway: quality is cost effective. Archives of Physical
Medicine and Rehabilitation, 76, 1130-1133.
Further work required
Conclusion & priority
References
39
Stroke Outcome Indicators

Incidence of pressure sores during the in-patient stay within a hospital
provider unit population with a primary diagnosis of stroke
Reduce or avoid complications from stroke.
For a given provider unit population and year: the number of patients admitted with
a stroke who acquire one or more pressure sores during a hospital provider spell
which ends in the given year, divided by the total number of patients admitted with
a stroke who were discharged in the given year. For the purposes of this indicator,
only pressure sores of grade two or above should be counted. The resulting fraction
should be expressed as a percentage and reported as an overall figure and by age-
group and sex.
Pressure sores are common in hospital settings, represent a significant burden of
suffering for patients and their carers and are costly to the NHS (Effective Health
Care 1995). New pressure sores occurred in 4-10% of patients admitted to a UK
district general hospital, depending on the case-mix (Clark and Watts 1994). Health
authorities received guidance from the NHS Management Executive encouraging
them to set targets for an overall reduction in prevalence of at least 5% (NHS
Executive 1993). Evidence and experience suggest that prevalence rates, because
they are affected by incidence rates, healing rates, admission and discharge policies,
are very difficult to interpret (Effective Health Care 1995). Comparison of incidence
rates are therefore proposed but will only reflect the effect of prevention policies if
suitable adjustment is made for differences in the risk status of patients admitted
(Effective Health Care 1995).
The indicator is specified as the incidence of acquired pressure sores of grade two
and above so as to avoid the difficulties of reliable assessment of grade one
pressure sores, consisting of non-blanchable erythema with intact skin.
Clinical management of patients and clinical audit. Provider comparisons.
Clinicians, commissioners, provider management.
To control for relevant patient risk factors, the indicator data should ideally be
analysed per ‘at risk’ group.
Many provider units are monitoring pressure sore rates. Most do it by weekly data
collection of assessment proforma completed by ward staff. Where facilities are in
place, some are entering data onto a ward nursing system alongside other patient
details. Whether a paper or computerised data collection system is in place, the
minimum information required would be patient’s identification details, patient
diagnosis, and an assessment of pressure sore status on admission (to identify
pressure sores acquired during the in-patient stay). Several pressure sore grading
systems are in use (Healey 1996) although four ulcer gradings are generally used
(Smith 1995).
Title
Intervention aim
Definition
Rationale
Potential uses
Potential users
Possible confounders
Data sources
40
Stroke Outcome Indicators
Candidate indicator 10 Characteristics
Specificity: GenericPerspective: ClinicalTimeframe: Cross-sectional
Outcome relationship: Direct
To allow data comparison, grading systems which define a grade/stage two
pressure sore as ‘partial thickness skin loss or damage involving epidermis and/or
dermis’ (Smith 1995) should be used. This staging is from a ulcer scale developed
and generally used for reporting the prevalence of pressure sores, and guiding
therapy (National Pressure Ulcer Advisory Panel 1989).
Currently, retrospective monitoring of CMDS data, would allow identification of
pressure sores (decubitus ulcer, ICD-10 code L89) within patients who also had a
primary diagnosis of stroke (ICD-10 codes I61-I64 as listed in indicator 1A) for any
episode within any hospital spell. This would allow calculation of prevalence rates.
ICD-10 coding does not identify acquired sores or the grading of sores. The
introduction of an additional sub-division of L89 would allow this discrimination.
Optional use of Read codes would allow some additional information to be
recorded in relation to grade of sore.
The quality of the data would depend on the system in place and the existence of
quality control checks on data entry. The data quality may also be affected by poor
inter-rater reliability. This may be addressed by suitable training for all ward staff in
the use of both risk and pressure sore assessment tools.
The prevalence of pressures sores can be recorded now in line with the NHSME
targets. An adjustment to current clinical coding would allow newly acquired
pressure sores to be recorded. Supporting information on the risk factors of
individuals with pressure sores would require more sophisticated systems.
An additional code to distinguish acquired pressure sores within the ICD-10 coding
structure is recommended. To aid interpretation, the development of ‘at risk’
assessment tools should be undertaken, such as the Waterlow or Norton scales
(Smith 1989).
A - To be implemented generally on a routine basis.
Clark, M., and Watts, S. (1994). The incidence of pressure sores with a National
Health Service trust hospital during 1991. Journal of Advanced Nursing, 20, 33-36.
Effective Health Care (1995). The prevention and treatment of pressure
sores. University of Leeds, University of York.
Healey, F. (1996). Using incidence data to improve risk assessment. Journal of
Tissue Viability, 6, 3-9.
NHS Management Executive (1993). Priorities and planning guidance 1994-95
EL(93)54. Department of Health, Leeds.
Data quality
Comments
Further work required
Conclusion & priority
References
41
Stroke Outcome Indicators

National Pressure Ulcer Advisory Panel (1989). Pressure ulcer prevalence, cost and
risk assessment: consensus statement. Decubitus, 2, 24-28.
Smith, D.M. (1995). Pressure ulcers in the nursing home. Annals of Internal
Medicine, 123, 433-442.
Smith, I. (1989). Waterlow/Norton scoring system: a ward view. CARE - Science and
Practice, 7, 93-95.
42
Stroke Outcome Indicators

Percentage of patients within a community provider population who, six
months following a stroke, have one or more pressure sores
Reduce or avoid complications from stroke.
For a given community provider population, and year: the number of patients who
have had a stroke in the given year, and who six months (± 21 days) later have one
or more pressure sores, divided by the number of patients who have had a stroke in
the given population and year. For the purposes of this indicator, only pressure
sores of grade two or above should be counted (see data sources). The resulting
fraction should be expressed as a percentage and reported as an overall figure and
by age-group and sex.
Pressure sores which occur in hospital and community settings, represent a
significant burden of suffering for patients and their carers, and are costly to the
NHS (Effective Health Care 1995). Health authorities received guidance from the
NHS Management Executive encouraging them to set targets for an overall
reduction in prevalence of at least 5% (NHS Executive 1993). This indicator will
offer a reflection on the quality of care for stroke patients. The prevalence of
pressure sores should be relatively small and variations should be examined in light
of case-mix factors. Interpretation of the indicator with respect to the quality of care
will require additional information about the length of time each patient has been
under the current care arrangements.
The indicator specifies the prevalence of pressure sores of grade two and above so
as to avoid the difficulties of reliable assessment of stage one pressure sores,
consisting of non-blanchable erythema with intact skin.
Clinical management of patients and clinical audit.
Clinicians, commissioners.
To control for severity of stroke and other risk factors for pressure sore
development, the indicator data would ideally be analysed per ‘at risk’ group.
As a result of the NHSME guidance, commissioners are required to collect
prevalence data on pressures sores. There appear to be few specified standards as
to how these data are reported, so the value of using commissioner data to obtain
this indicator is unclear. The primary data on individual sores may be collected by
district nurses employed by a community trust or GP practice. Ideally, community
providers would operate a central stroke register allowing easy identification of
patients who have a stroke in the given year. These data could then be used to
identify patients due for a six months follow-up after their stroke, to assess if any
have developed any pressure sores. Alternatively, if a central register is not in use,
Title
Intervention aim
Definition
Rationale
Potential uses
Potential users
Possible confounders
Data sources
43
Stroke Outcome Indicators
Candidate indicator 11A Characteristics
Specificity: GenericPerspective: ClinicalTimeframe: Cross-sectional
Outcome relationship: Direct

individual district nurses could be responsible for collecting this information,
knowing from their patient records who had a stroke and when, and following
them up at six months.
To collect the numerator data a proforma for the identification of pressure sores
should, at the least, provide information on the number of pressure sores above
grade two as well as the patients’ history, the equipment in use, and an ‘at risk’
score. To allow data comparison, grading systems which define a grade/stage two
pressure sore as ‘partial thickness skin loss or damage involving epidermis and/or
dermis’ (Smith 1995) should be used. This staging is from a ulcer scale developed
and generally used for reporting the prevalence of pressure sores and guiding
therapy (National Pressure Ulcer Advisory Panel 1989).
The quality of the data would depend on the system in place and the existence of
quality control checks on data entry. The data quality may also be affected by poor
inter-rater reliability. This may be addressed by suitable training for staff in the use
of both risk and pressure sores assessment tools. Completeness of the stroke
register if in use will also affect the validity of the denominator.
The occurrence of pressure sores could also be regarded as a ‘sentinel event’ and a
topic for audit of the circumstances of care of the individual patient.
To aid interpretation, the development of ‘at risk’ assessment tools should be
undertaken, such as the Waterlow or Norton scales (Smith 1989).
D - To be implemented where local circumstances allow by by periodic
survey.
Effective Health Care (1995). The prevention and treatment of pressure sores.
University of Leeds, University of York.
NHS Management Executive (1993). Priorities and planning guidance 1994-95.
EL(93)54. Department of Health, Leeds
National Pressure Ulcer Advisory Panel (1989). Pressure ulcer prevalence, cost and
risk assessment: consensus statement. Decubitus, 2, 24-28.
Smith, D.M. (1995). Pressure ulcers in the nursing home. Annals of Internal
Medicine, 123, 433-442.
Smith, I. (1989). Waterlow/Norton scoring system: a ward view. CARE - Science and
Practice, 7, 93-95.
Data quality
Comments
Further work required
Conclusion & priority
References
44
Stroke Outcome Indicators

Percentage of patients in a nursing home population who, six months
following a stroke, have one or more pressure sores
Reduce or avoid complications from stroke.
For a given nursing home population and year: the number of patients who have
had a stroke in the given year, and who six months (± 21 days) later have one or
more pressure sores, divided by the number of patients who have had a stroke in the
given population and year. For the purposes of this indicator, only pressure sores
of grade two or above should be counted. If possible, pressure sores should be
reported as acquired or present on admission. The resulting fraction should be
expressed as a percentage and reported as an overall figure and by age-group and
sex.
Indicator 11A assesses the number of pressure sores suffered by those cared for by
district nurses, and thus does not consider residents of nursing homes. The
indicator specified here focuses on pressure sores among people in local authority
and private nursing homes. The NHS Executive set a target in 1994 for all service
purchasers and providers, to reduce pressure sores by 5% from existing pressure
sores prevalence levels (NHS Executive 1993). Studies have estimated pressure sore
prevalence rates in general within nursing homes of 7% (Department of Health
Care for Elderly People 1996) to 23% (Smith 1995). This indicator, by measuring the
number of patients who have had a stroke and who have one or more pressure
sores six months later, will in part reflect the quality of care delivered to this
vulnerable group. The prevalence of pressure sores should be relatively small and
variations should be examined in light of case-mix factors. Interpretation of the
indicator with respect to the quality of care will require additional information
about the length of time each patient had had a stroke before admission to the
nursing home.
The indicator is specified as the prevalence of pressure sores of grade two and
above so as to avoid the difficulties of reliable assessment of stage one pressure
sores, consisting of non-blanchable erythema with intact skin.
Clinical management of patients and clinical audit.
Clinicians, commissioners.
To control for the severity of stroke and other risk factors for pressure sore
development, the indicator data would ideally be analysed per ‘at risk’ group.
The quality of information systems within nursing homes is likely to vary from the
use of basic manual patient records containing administrative, medical and nursing
information to more sophisticated computerised systems. Ideally, to facilitate use of
this indicator, a centralised stroke register is required to identify patients in the
Title
Intervention aim
Definition
Rationale
Potential uses
Potential users
Possible confounders
Data sources
45
Stroke Outcome Indicators
Candidate indicator 11B Characteristics
Specificity: GenericPerspective: ClinicalTimeframe: Cross-sectional
Outcome relationship: Direct

home who have had a stroke. When using the register, a system which identifies
patients who are six months post-stroke could then be used to prompt when an
assessment of their pressure sore status was due. The register would also easily
identify the patients who had had a stroke in the given year to provide the
denominator.
The Royal College of Physicians Continuous Assessment Review and Evaluation
(CARE) scheme is an audit tool devised to enable staff to undertake clinical audit in
long-term care. Such a scheme provides a structured data collection system on
various aspects of long-term care including pressure sores. The survey tool guides
collection of data regarding the presence of pressure sores, their grade(s), patient’s
‘at risk’ status, equipment in use and whether the information is documented.
Information is also collected on whether the sore was acquired before or since
admission to the facility. This information would require an assessment of pressure
sore status ‘on admission’ which is likely to be common practice. Use of such an
instrument would provide a formal structure for the regular collection and review of
pressure sore rates within the indicator.
Nursing homes are required to have twice yearly inspections, but currently this does
not include a requirement to capture information such as pressure sore data.
Commissioners may wish to consider augmenting these inspections to include
aspects of pressure area care such as monitoring of pressure sores.
To allow data comparison, grading systems which describe a grade/stage two
pressure sore as ‘partial thickness skin loss or damage involving epidermis and/or
dermis’ (Smith 1995) should be used. This staging is from a ulcer scale developed
and generally used for reporting the prevalence of pressure sores and guiding
therapy (National Pressure Ulcer Advisory Panel 1989).
The quality of the data would depend on the system in place and the existence of
quality control checks on data entry. The data quality may also be affected by poor
inter-rater reliability. This may be addressed by suitable training for staff in the use
of both risk and pressure sores assessment tools. Inclusion of pressure sore data as
a requirement for nursing home inspections may improve the availability and
quality of data.
The occurrence of pressure sores could also be regarded as a ‘sentinel event’ and a
topic for audit of the circumstances of care of the individual patient.
To aid interpretation, the development of ‘at risk’ assessment tools should be
undertaken, such as the Waterlow or Norton scales (Smith 1989).
B - To be implemented generally by periodic survey.
Data quality
Comments
Further work required
Conclusion & priority
46
Stroke Outcome Indicators
Department of Health Care for Elderly People (1996). Nature and extent of pressure
sores and their prevention in nursing homes in Sheffield. University of Sheffield.
NHS Management Executive (1993). Priorities and planning guidance 1994-95.
EL(93)54. Department of Health, Leeds.
National Pressure Ulcer Advisory Panel (1989). Pressure ulcer prevalence, cost and
risk assessment: consensus statement. Decubitus, 2, 24-28.
Smith, D.M. (1995). Pressure ulcers in the nursing home. Annals of Internal
Medicine, 123, 433-442.
Smith, I. (1989). Waterlow/Norton scoring system: a ward view. CARE - Science
and Practice, 7, 93-95.
References
47
Stroke Outcome Indicators

Rate of emergency re-admissions (for any reason) within 30 days of
discharge, per provider unit population with a primary diagnosis of stroke
Reduce or avoid complications from stroke.
For a given provider unit and year: the number of emergency in-patient admissions
(to any unit and for any reason) not more than 30 days after discharge from
hospital following admission for stroke to the given unit in the given year, divided by
the total number of admissions for stroke to the given unit, in the given year. This
fraction, expressed as a percentage, should be reported with its numerator both as
an overall figure and by patient age-group and sex.
Unplanned re-admissions may reflect an adverse outcome of antecedent health care,
and failures in post-stroke care in both hospital and community settings, have been
documented (Smith et al. 1981, Ebrahim et al. 1987). With appropriate consideration
of patient risk factors, re-admission rates may draw attention to aspects of the
planning, organisation and delivery of care which may require review.
Clinical audit; provider based comparisons.
Clinicians, provider management, commissioners.
Comparisons should be made in the context of case-mix information covering the
severity and co-morbidity of the patient populations. In this context, Indicator 14,
giving discharge Barthel scores may also be useful as a case-mix descriptor.
Within a given unit, CMDS data on emergency admissions could be used to identify
re-admissions by matching episodes with the same local patient identifiers that
occur within the reference period. Capture of re-admissions to other hospitals
would rely on routine use of the new NHS number.
The validity of the indicator would rely on the quality of the CMDS diagnoses
which are unlikely to be uniformly high. Interpretation of the results of this
indicator should be undertaken with some consideration of the potential perverse
incentives to score well on this indicator (Milne and Clarke 1990). Key
methodological issues relating to re-admission rates are discussed in Henderson et
al. (1989).
As specified, this indicator does not exclude in-patient deaths or those patients who
died within the 30 day follow-up period. In view of this, the indicator should be
considered alongside the 30 day case fatality rate supplied by Indicator 7A. At best,
it should be compiled excluding the deaths within 30 days. This could be done
with systems linking hospital and death records.
Title
Intervention aim
Definition
Rationale
Potential uses
Potential users
Possible confounders
Data sources
Data quality
Comments
48
Stroke Outcome Indicators
Candidate indicator 12 Characteristics
Specificity: GenericPerspective: ClinicalTimeframe: Longitudinal
Outcome relationship: Direct
None recommended.
D - To be implemented where local circumstances allow by periodic survey.
Ebrahim, S., Barer, D., and Nouri, F. (1987). An audit of follow up services for
stroke patients after discharge from hospital. International Disability Studies, 9,
103-105.
Henderson, J., Goldacre, M.J., Graveney, M.J., and Simmons, H.M. (1989). Use of
medical record linkage to study re-admission rates. British Medical Journal, 299,
709-713.
Milne, R., and Clarke, A. (1990). Can re-admission rates be used as an outcome
indicator? British Medical Journal, 301, 1139-1140.
Smith, M.E., Walton, M.S., and Garraway, W.M. (1981). The use of aids and
adaptations in a study of stroke rehabilitation. Health Bulletin, 39, 98-106.
Further work required
Conclusion & priority
References
49
Stroke Outcome Indicators

Multi-professional involvement in the week following admission within a
provider unit population admitted with a primary diagnosis of stroke
Improve function and well-being after stroke.
For a given provider unit and year: the proportions of patients admitted for stroke in
the given year who are assessed within one week of admission by each of a set of
potentially relevant professions. The categorisation of professions (shown below) is
taken from the Royal College of Physicians stroke minimum data set proforma. Use
of this categorisation would be used to present nine percentage scores.
Which professionals assessed the patient during the first week of admission?
1. Doctor 6. Speech and language therapist
2. Nurse 7. Clinical psychologist
3. Physiotherapist 8. Social worker
4. Occupational therapist 9. Other
5. Dietician
Well organised multi-disciplinary rehabilitation increases the rate of improvement in
stroke patients, although the long term effectiveness is unclear (Effective Health
Care 1995). Stroke patients managed within specialist units (where a key
characteristic was specialist multi-disciplinary team care) compared to general
medical wards were more likely to be alive and living at home a year after stroke
(Stroke Unit Trialists’ Collaboration 1995). This indicator will measure the level of
multi-professional input within stroke care. It is recognised however, that this may
reflect the availability of necessary resources as much as it reflects on the
organisation of the care.
Clinical audit; management of patients.
Clinicians, commissioners.
No specific ones identified.
The numerator information may be obtained from a survey of the notes (probably
nursing notes in combination with medical notes) to identify a documented
reference to an assessment made by each profession, using the list as the survey
tool. Alternatively, this information will be available if used routinely within the
Royal College of Physicians stroke minimum data set. This is a two-sided proforma
designed to collect a set of information on each patient admitted with a stroke.
Question 12 asks the health care staff to tick which of nine types of professionals
have assessed the patient during the first week of the admission. Use of this
indicator could advance data collection standards. The denominator data may be
Title
Intervention aim
Definition
Rationale
Potential uses
Potential users
Possible confounders
Data sources
50
Stroke Outcome Indicators
Candidate indicator 13 Characteristics
Specificity: Condition-specificPerspective: ClinicalTimeframe: Cross-sectional
Outcome relationship: Direct

obtained from CMDS data with a primary diagnosis of stroke for an admission
episode (ICD-10 codes I61, I62, I63, I64 as listed in Indicator 1A)
The quality of the data may rely on the patient notes or the quality of CMDS data
which are not uniformly reliable.
As well as presenting the scores as nine separate percentages, other, composite,
scores could be used, e.g. ‘percentage of patients assessed by three or more
professional groups’. As specified, the indicator captures the range of professional
involvement in a given case. Ideally, multi-professional care additionally implies co-
operation between the professionals. An indicator reflecting the extent to which the
individuals work as a multi-professional team would be valuable. However, the
difficulty of defining an operational measure of this co-operation has led to the
more limited approach as specified here.
None recommended.
B - To be implemented generally by periodic survey.
Effective Health Care (1995). The prevention and treatment of pressure sores.
University of Leeds.
Stroke Unit Trialists’ Collaboration (1995). A systematic review of specialist multi-
disciplinary team (stroke unit) care for stroke in patients. In The Cochrane
Database of Systematic Reviews - Stroke Module, (ed. C. Warlow, J. Van Gijn, P.
Sandercock). BMJ Publishing Group.
Data quality
Comments
Further work required
Conclusion & priority
References
51
Stroke Outcome Indicators

Distribution of the Barthel Index of Activities of Daily Living (ADL), at
discharge from hospital, within a provider unit population with a primary
diagnosis of stroke
Improve function and well-being after stroke.
For a given provider unit and year: a summary of the distribution of Barthel ADL
scores, as assessed at discharge, for patients who, having been admitted for stroke,
were discharged in the given year. The indicator should be reported by patient age-
band and sex as well for the whole population. The size of the relevant population
together with the number of cases for which an assessment was available should
also be reported.
A suitable summary of the distribution would include a measure of both central
tendency and dispersion. Both means (and standard deviations) and medians (and
interquartiles ranges) are used widely in the literature. Alternatively, the distribution
could be summarised by using categories such as those suggested by Stone et al.
(1994):
- independent (Barthel 20)
- mild dependence (Barthel 15-19)
- moderate dependence (Barthel 10-14)
- severe dependence (Barthel 5-9)
- very severe dependence (Barthel 0-4).
While the total Barthel score provides an assessment of overall disability, it would
also be valuable to know about the underlying pattern of specific disabilities. In
view of this, the distribution of scores for the individual component items of the
Barthel should also be reported.
Stroke is a major cause of functional impairment. Rehabilitation following stroke
aims to minimise disability and handicap. Assessment of functional ability to
evaluate the resulting impact of rehabilitation services may be a useful indicator of
successful care. Measurement of the functional status of patients at discharge will in
part reflect the effectiveness of stroke management and rehabilitation. In addition,
this indicator provides a baseline for longitudinal follow-up of patients’ functioning
(see Indicator 20).
Clinical audit; provider based comparisons.
Clinicians, commissioners, provider management.
Comparisons between populations should be made in the context of case-mix
information covering severity, co-morbidity and length of stay.
Title
Intervention aim
Definition
Rationale
Potential uses
Potential users
Possible confounders
52
Stroke Outcome Indicators
Candidate indicator 14 Characteristics
Specificity: Condition-specificPerspective: ClinicalTimeframe: Cross-sectional
Outcome relationship: Direct

The assessment could be made by ward staff and documented in patient notes. To
facilitate aggregation of individual assessments, the information could form part of
a stroke data base. The Royal College of Physicians stroke minimum data set
includes the Barthel Index. When there are practical difficulties in performing a
full Barthel assessment at the time of discharge, it has been shown that the total
Barthel score can be accurately predicted from the scores on three easily
remembered items: mobility, bed transfers and urinary continence (Ellul et al.
1997).
The Barthel Index has been shown to be reliable with different observers in a wide
variety of situations (Gompertz et al. 1993), and it is a valid measure of physical
disability (Wade and Hewer 1987). The value of the indicator would be
compromised by low rates of completion - a danger where the data are not derived
from information systems which support operational activities.
The Working Group suggested that additional useful information may be obtained if
the dimensions assessing ‘bowels’ and ‘bladder’ are augmented. If the assessment
score is 0 in terms of their dependency within these two sections, an additional
question as to whether ‘faecal soiling’ is present could be added for the bowels
sub-section, and an additional question to identify those who are ‘catheterised’ and
those who are ‘incontinent’ for the bladder section. Inclusion of this additional
information does not affect the calculation of the total Barthel score.
A pre-morbid assessment of function is essential to assess the true benefits of the
care received. Information currently recorded is often unreliable (Benbow et al.
1994) and could be improved by using standardised assessments such as the
Barthel, though this information may be difficult to verify. Where only limited
information is available, a hierarchical version of the Barthel Index may be used to
estimate the total score (Barer and Murphy 1993).
Further refinements to augment the Index as noted above.
A - To be implemented generally on a routine basis.
Barer, D., and Murphy, J. (1993). Scaling the Barthel: a 10-point hierarchical
version of the activities of daily living index for use with stroke patients. Clinical
Rehabilitation, 7, 221-277.
Benbow, S., J, Watkins, C., Sangster, G., Ellul, J., and Barer, D. (1994). The
availability and reliability of information on the pre-morbid functional status of
stroke patients in hospital. Clinical Rehabilitation, 8, 281-285.
Ellul, J., Watkins, C., and Barer, D. (1996). Estimating total Barthel scores from just
three items: The European Stroke Database minimum dataset for assessing
functional status at discharge from hospital. In press.
Data sources
Data quality
Comments
Further work required
Conclusion & priority
References
53
Stroke Outcome Indicators

Gompertz, P., Pound, P., and Ebrahim, S. (1993). The reliability of stroke outcome
measures. Clinical Rehabilitation, 7, 290-296.
Stone, S.P., Ali, B., Auberleek, I., Thompsell, A., and Young, A. (1994). The Barthel
Index in clinical practice: use on a rehabilitation ward for elderly people. Journal of
the Royal College of Physicians of London, 28, 419-423.
Wade, D.T., and Hewer, R.L. (1987). Functional abilities after stroke: measurement,
natural history and prognosis. Journal of Neurological and Neurosurgical Psychiatry,
50, 177-182.
54
Stroke Outcome Indicators
Distribution of the Barthel Index of Activities of Daily Living (ADL), within a
population of patients six months following stroke
Improve function and well-being after stroke.
For a population of patients suffering a stroke occurring within a given period of
time: a summary of the distribution of Barthel ADL scores for patients, as assessed at
six months (± 21 days) post-stroke. The indicator should be reported by patient age-
band and sex as well for the whole population. The size of the relevant patient
population together with the number of cases for which an assessment was
available should also be reported.
A suitable summary of the distribution would include a measure of both central
tendency and dispersion. Both means (with standard deviations) and medians (with
interquartiles ranges) are used widely in the literature. Alternatively, the distribution
could be summarised by using categories such as those suggested by Stone et al.
(1994):
- independent (Barthel 20)
- mild dependence (Barthel 15-19)
- moderate dependence (Barthel 10-14)
- severe dependence (Barthel 5-9)
- very severe dependence (Barthel 0-4).
While the total Barthel score provides an assessment of overall disability, it would
also be valuable to know about the underlying pattern of specific disabilities. In
view of this, the distribution of scores for the individual component items of the
Barthel should also be reported.
Indicators 15 to 19 are designed to capture various aspects of physical and psycho-
social functioning, six months following a stroke. This indicator uses the same
instrument as described in Indicator 14, but administered six months after stroke.
While ADL at six months post-stroke will in part be determined by levels of pre-
morbid functioning, it is also likely to be influenced by the effectiveness of the care
received. Given the difficulty of measuring pre-stroke functioning (see comments
below) the cross-sectional approach proposed here is suggested as a basis for
comparing the outcome of care for different populations where assumptions about
their underlying similarity can be made (e.g. within time-trend comparisons).
The indicator might be used to follow-up a group of patients who were admitted to
a given unit’s hospital as a result of their stroke, or to assess the disability in a
resident or GP population of stroke patients.
Clinical audit; monitoring trends over time.
Title
Intervention aim
Definition
Rationale
Potential uses
55
Stroke Outcome Indicators
Candidate indicator 15 Characteristics
Specificity: Condition-specificPerspective: ClinicalTimeframe: Cross-sectional
Outcome relationship: Direct

Clinicians, commissioners, and provider management.
As noted above comparisons between populations should be made in the context
of case-mix information covering severity and co-morbidity, although some
adjustment is being made by reporting the results by age and sex.
The identification and follow-up of stroke patients is best achieved through the use
of a stroke register. Such a register may be general practice based - allowing GPs to
follow-up their patients, through either a postal survey or during a consultation.
Patients who have had a stroke in the given year (and who are still living) could be
identified, and forms generated for an assessment of their Barthel Index score at six
months after the date of their stroke. Alternatively, a register might be based at a
hospital stroke unit so allowing follow-up of patients admitted for stroke within a
given year, although particular consideration would need to be given as to whether
patients have died since their discharge from hospital. To avoid duplicate
assessments by both a GP and a hospital following up their population of patients,
the use of a resident population-based stroke register to identify and follow-up all
stroke patients would be desirable.
The Barthel index has been shown to be reliable with different observers in a wide
variety of situations (Gompertz et al. 1993), and it is a valid measure of physical
disability (Wade and Hewer 1987). The Barthel Index has been successfully used
within a postal survey, achieving good response rates (Gompertz et al. 1995;
Harwood et al. 1994b). The value of the indicator would be compromised by low
rates of completion - a danger where the data are not derived from information
systems which support operational activities. Identification of who completed the
form, i.e. patient or carer, should also be obtained to assist interpretation of
comparisons.
The reliability of a stroke register relies on ensuring it is maintained and updated by
the various sources, e.g. GPs and hospital consultants. The quality of the data may
also be affected by variation in diagnostic tendencies.
Efforts have been made to collect data about the patients’ pre-stroke health state.
The TyPE (Technology of Patient Experience) specification for stroke developed by
the Health Outcomes Institute, includes a Health Status Questionnaire to be
administered during the acute hospitalisation period which asks the patients about
their function and disability in the time frame ‘during the four weeks immediately
prior to the stroke (Matchar et al. 1994). Pre-stroke residence is also collected as an
indicator of pre-stroke function and health status.
None recommended.
Potential users
Possible confounders
Data sources
Data quality
Comments
Further work required
56
Stroke Outcome Indicators

B - To be implemented generally by periodic survey.
Gompertz, P., Pound, P., and Ebrahim, S. (1993). The reliability of stroke outcome
measures. Clinical Rehabilitation, 7, 290-296.
Gompertz, P., Pound, P., Briffa, J., and Ebrahim, S. (1995). How useful are non-
random comparisons of outcomes and quality of care in purchasing hospital stroke
services? Age and Ageing, 24, 137-141.
Harwood, R.H., Gompertz, P., and Ebrahim, S. (1994). Handicap one year after a
stroke: validity of a new scale. Journal of Neurology, Neurosurgery and Psychiatry,
57, 825-829.
Matchar, D.B., Goldstein, L.B., and Heyman, A. (1994). The Stroke TyPE
Specification. Health Outcomes Institute, Bloomington, US.
Stone, S.P., Ali, B., Auberleek, I., Thompsell, A., and Young, A. (1994). The Barthel
Index in clinical practice: use on a rehabilitation ward for elderly people. Journal
of the Royal College of Physicians of London, 28, 419-423.
Wade, D.T., and Hewer, R.L. (1987). Functional abilities after stroke: measurement,
natural history and prognosis. Journal of Neurological and Neurosurgical
Psychiatry, 50, 177-182.
Conclusion & priority
References
57
Stroke Outcome Indicators

Assessment of aphasia within a population of patients six months following
stroke
Improve function and well-being after stroke.
For a population of patients suffering a stroke occurring within a given period of
time: a summary of patients’ responses to an assessment of aphasia (to be specified),
as administered six months (± 21 days) post-stroke. The summary statistics will
describe the distribution of scores, broken down by patient age-band and sex. The
size of the relevant patient population together with the number of cases for which
an assessment was available should also be reported.
As referred to in Indicator 15, this indicator is one of a series of indicators which
intend to capture various aspects of physical and psycho-social functioning six
months after stroke. Assessment of aphasia at six months after the stroke incident,
will reflect in part the quality of rehabilitation and community service provision.
The ability to communicate is an important component of everyday activities. A
recent review concluded that speech and language therapy is effective if targeted to
patients with specific deficits and needs and is provided intensively (Enderby and
Emerson 1996). It is important to identify patients with a speech and language
problem so the appropriate therapy is provided.
For the purposes of this indicator, the required instrument to assess aphasia should
meet practical considerations relating to its administration. Secondly, the metrical
properties of the instrument (in terms of validity, reliability and sensitivity to clinical
intervention) should have been demonstrated in the population of interest. The
selection of a single standard instrument to measure aphasia would be helpful to
facilitate comparisons across provider units or districts. However, further work is
required to determine an appropriate tool.
One example of such an instrument is the Frenchay Aphasia Screening Test (FAST)
(Enderby and Crow 1996). This is a short, simple and standardised method of
identifying and gauging language deficit so identifying those who require further
assessment and therapy. An alternative approach is to ask a simple question to
either the carer or patient as to whether they (following the stroke) can make
themselves understood to people outside the family. This was used in the OPCS
survey of disability in GB (Martin et al. 1988).
Clinical audit; monitoring trends over time.
Clinicians, and provider management.
Title
Intervention aim
Definition
Rationale
Potential uses
Potential users
58
Stroke Outcome Indicators
Candidate indicator 16 Characteristics
Specificity: Condition-specificPerspective: PatientTimeframe: Cross-sectional
Outcome relationship: Direct

Comparisons between populations should be made in the context of case-mix
information covering severity and co-morbidity.
The identification and follow-up of stroke patients is best achieved through the use
of a stroke register. Such a register may be general practice based - allowing a GP
to follow-up their patients, through either a postal survey or during a consultation.
Patients who have had a stroke in the given year (and who are still living) could be
identified, and forms generated for an assessment of their aphasia at six months
after the date of their stroke. Alternatively, a register might be based at a hospital
stroke unit so allowing follow-up of patients admitted for stroke within a given
year, although particular consideration would need to be given as to whether
patients have died since their discharge from hospital. To avoid duplicate
assessments by both a GP and a hospital following up their population of patients,
the use of a resident population-based stroke register to identify and follow-up all
stroke patients would be desirable.
The FAST tool has reliability and validity in the relevant population and is usable
by non-specialists as a screening instrument (Enderby et al. 1987; Enderby and
Crow 1996). The FAST has been used successfully at a six month follow-up and
considered appropriate for community use. The quality of the data will also depend
on the methods of data collection employed. Further investigation and study would
be required. The value of the indicator would be compromised by low rates of
completion - a danger where the data are not derived from information systems
which support operational activities.
The reliability of a stroke register relies on ensuring it is maintained and updated
by the various sources, e.g. GPs and hospital consultants. The quality of the data
may also be affected by variation in diagnostic tendencies.
This indicator is also relevant to the follow-up of groups of stroke patients in long
term care populations, e.g. those in long-stay wards, residential care and nursing
homes.
In the case of those in residential care, systematic data collection may be
particularly difficult to establish. Local authority owned homes may be more readily
influenced by commissioners with respect to quality initiatives, but private homes
are under no obligation to undertake this type of activity.
The Working Group considered that this assessment should be by periodic survey,
but were unable to make definitive recommendations about which measure to use.
This should be left to local decisions, pending results of further investigation of
measurement instruments. Further work is also required to determine the
appropriateness of six months after stroke as a time interval for such assessments.
59
Stroke Outcome Indicators
Possible confounders
Data sources
Data quality
Comments
Further work required

60
Conclusion & priority
References
E - To be further developed because the indicator specification is
incomplete in that further work is needed to identify a measurement tool.
Once completed, the resulting indicator would be implemented by means of
periodic survey where local circumstances allowed.
Enderby, P., and Crow, E. (1996). Frenchay Aphasia Screening Test: validity and
comparability. Disability and Rehabilitation, 18, 238-240.
Enderby, P., and Emerson, J. (1996). Speech and language therapy: does it work?
British Medical Journal, 312, 1655-58.
Enderby, P., Wood, V., Wade, D., and Langton-Hewer, R. (1987). Aphasia after
stroke: a detailed study of recovery in the first three months. International Journal
of Rehabilitation Medicine, 8, 166-170.
Martin, J., Meltzer, H., and Elliot, D. (1988). The prevalence of disability among
adults. OPCS surveys of disability in GB, Report 1. HMSO, London.
Stroke Outcome Indicators

Assessment of outdoor mobility within a population of patients six months
following stroke
Improve function and well-being after stroke.
For a population of patients suffering a stroke occurring within a given period of
time: a summary of patients’ responses to an assessment of outdoor mobility (to be
specified), as administered six months (± 21 days) post-stroke. The summary
statistics will describe the distribution of scores, broken down by patient age-band
and sex. The size of the relevant patient population together with the number of
cases for which an assessment was available should also be reported.
Indicators 15 to 19 are a series of indicators which, used either independently or
together, will capture various aspects of physical and psycho-social functioning, six
months after stroke (see rationale in Indicator 15 for more comment).
Assessment of outdoor mobility at six months after the stroke incident, will reflect
the extent of recovery, and in part the effectiveness of a rehabilitation process.
Mobility questions have also been found helpful especially for assessment among
patients discharged to the community. Such an assessment complements the
indicators (15 to 19) developed to assess outcome from a patient’s perspective. The
type of measure should meet both practical, and measurement criteria outlined in
the rationale of Indicator 15.
An example of an outdoor mobility assessment is the mobility section from the
Extended ADL scale (Nouri et al. 1987). The extended ADL is a 22-item postal self-
report questionnaire which is designed to measure the more complex tasks
required to live in the community, i.e. those beyond basic care. One sub-scale
includes six questions assessing mobility over uneven ground, on stairs, in and out
of the car, walking outside and travelling on public transport. Patients are asked to
score whether they can do any of these ‘with help’, ‘on their own with difficulty’ or
‘on their own’. The scale is suggested as appropriate for studies evaluating
rehabilitation outcome after stroke and is suitable for postal surveys (Lincoln and
Gladman 1992).
An alternative option is to use a single question from EASY (Elderly Assessment
System) (Philp 1997). The question asked ‘are you able to walk outside?’ would
allow the proportion of patients responding a) as much as fifty yards or more
without help; b) a few yards or more, but not as far as fifty yards and c) unable to
walk outside house to be reported.
Clinical audit; monitoring trends over time.
Clinicians, commissioners, and provider management.
Title
Intervention aim
Definition
Rationale
Potential uses
Potential users
61
Candidate indicator 17
Stroke Outcome Indicators
Characteristics
Specificity: Condition-specificPerspective: PatientTimeframe: Cross-sectional
Outcome relationship: Direct

62
Comparisons between populations should be made in the context of case-mix
information covering severity and co-morbidity.
See Indicator 15.
The Extended Activities of Daily Living scale has been tested for validity as both a
total index score as well as independent reporting of the four subsections (Lincoln
and Gladman 1992). The quality of the data will also depend on the methods of
data collection employed. Further investigation and study would be required. The
value of the indicator would be compromised by low rates of completion - a
danger where the data are not derived from information systems which support
operational activities.
See Indicator 15.
The Working Group considered that this assessment should be by periodic survey,
but were unable to make definitive recommendations about which measure to use.
This should be left to local decisions, pending results of further investigation of
measurement instruments. Further work is also required to determine the
appropriateness of six months after stroke as a time interval for such assessments.
E - To be further developed because the indicator specification is
incomplete, in that further work is needed to identify a measurement tool.
Once completed, the resulting indicator would be implemented by means of
periodic survey where local circumstances allowed.
Lincoln, N.B., and Gladman, J.R. (1992). The extended Activities of Daily Living
scale: a further validation. Disability and Rehabilitation, 14, 41-43.
Nouri, F.M., and Lincoln, N.B. (1987). An extended activities of daily living scale for
stroke patients. Clinical Rehabilitation, 1, 301-305.
Philp, I. (1997). Can a medical and social assessment be combined? Journal of
Royal Society of Medicine, 90, S11-13.
Possible confounders
Data sources
Data quality
Comments
Further work required
Conclusion & priority
References
Stroke Outcome Indicators

Assessment of social functioning within a population of patients six months
following stroke
Improve function and well-being after stroke.
For a population of patients suffering a stroke occurring within a given period of
time: a summary of patients’ responses to an assessment of social functioning (to be
specified), as administered six months (± 21 days) post-stroke. The summary
statistics will describe the distribution of scores, broken down by patient age-band
and sex. The size of the relevant patient population together with the number of
cases for which an assessment was available should also be reported.
Indicators 15 to 19 are a series of indicators which, used either independently or
together, will capture various aspects of physical and psycho-social functioning six
months after stroke (see rationale in Indicator 15 for more comment).
As well as a return to full physical functioning, an important outcome following a
stroke is the extent to which patients are able to participate in social activities as
before. Assessment of social functioning at six months after the stroke incident
complements the indicators (15 to 19) developed to assess outcome from a
patient’s perspective. The type of measure chosen should meet both the practical
and measurement criteria outlined in the rationale of Indicator 15.
The Frenchay Activities Index (FAI) questionnaire assesses the frequency of a
variety of domestic, leisure, work and outdoor activities (Bowling 1995). It was
developed as an objective measure of actual activities undertaken by a person with
a stroke in the recent past (Holbrook and Skilbeck 1983), and has been used as an
outcome assessment in one year survivors of stroke (Dijkerman et al. 1996). The
scale was developed using a UK population and the activities require more
decision making and organisation on the part of the subject than most of the
activities in the ADL scales. The scale is a 15-item questionnaire designed for
interviewer-administration and asks about time periods of three or six months. The
index can be assessed by questionnaire rather than observation and therefore it is
possible to use it in a survey (Cockburn et al. 1990). Further work to investigate its
use as a self-completion postal questionnaire would be required.
Clinical audit; monitoring trends over time.
Clinicians, commissioners, and provider management.
Comparisons between populations should be made in the context of case-mix
information covering severity and co-morbidity.
See Indicator 15.
Title
Intervention aim
Definition
Rationale
Potential uses
Potential users
Possible confounders
Data sources
63
Stroke Outcome Indicators
Candidate indicator 18 Characteristics
Specificity: Condition-specificPerspective: PatientTimeframe: Cross-sectional
Outcome relationship: Direct

The Frenchay Activities Index (FAI) has been tested on patients with acute stroke
and has acceptable construct validity and reliability (Bowling 1995). It has also been
found to be a valid measure for stroke survivors over 70 years of age (Cockburn et
al. 1990). The value of the indicator would be compromised by low rates of
completion - a danger where the data are not derived from information systems
which support operational activities.
See Indicator 15.
Further studies investigating the use of the Frenchay Index as a postal questionnaire
tool and in stroke patients who have not necessarily received care in a hospital
setting. Further work is also required to determine the appropriateness of six
months after stroke as a time interval for such assessments.
E - To be further developed because the indicator specification is incomplete,
in that further work is needed to identify a measurement tool. Once
completed, the resulting indicator would be implemented by means of
periodic survey where local circumstances allowed.
Bowling, A. (1995). Measuring disease. Open University Press, Buckingham.
Cockburn, J., Wade, D., and Smith, P. (1990). The influence of cognitive function on
social, domestic and leisure activities of community-dwelling old people.
International Journal of Disability Studies, 12, 169-172.
Dijkerman, H.C.,Wood, V.A., and Langton-Hewer, R. (1996). Long-term outcome
after discharge from a stroke rehabilitation unit. Journal of the Royal College of
Physicians of London, 30, 538-546.
Holbrook, M., and Skilbeck, C.E. (1983). An activities index for use with stroke
patients. Age and Ageing, 12, 166-70.
Data quality
Comments
Further work required
Conclusion & priority
References
64
Stroke Outcome Indicators

Assessment of depression within a population of patients six months
following stroke
Improve function and well-being after stroke.
For a population of patients suffering a stroke occurring within a given period of
time: a summary of patients’ responses to a single item well-being measure (to be
specified), as administered six months (± 21 days) post-stroke. The summary
statistics (to be specified) will describe the distribution of scores broken down by
age-group and sex. The size of the relevant patient population together with the
number of cases for which an assessment was available should also be reported.
Indicators 15 to 19 are a series of indicators which, used either independently or
together, will capture various aspects of physical and psycho-social functioning, six
months after stroke (see rationale in Indicator 15 for more comment).
Emotional consequences of stroke are well documented (Robinson and Price 1982;
Angeleri et al. 1992). Depression is associated with decreased physical functional
ability in stroke patients and depression in old age carries a poor prognosis, with
increased use of health and social services facilities (D’Ath et al. 1994).
Several brief measures of general well-being or quality of life are available. One
such single question is in the Psychological General Well-being Schedule (Bowling
1991), which asks:
How happy, satisfied, or pleased have you been with your personal life (during the
past month)? The permitted responses to this question are:
- very dissatisfied or unhappy most or all of the time
- generally dissatisfied, unhappy
- sometimes fairly happy, sometimes fairly unhappy
- generally satisfied
- very happy most of the time
- extremely happy - could not have been more satisfied or pleased.
This single item well-being question is currently being tested as a screen for
depression among the elderly aged 75 and over (Philp, personal communication).
Alternatively, the 15-item Geriatric Depression Scale (GDS15) (Sheikh and Yesavage
1986) has been tested as a reduced scale of four questions and been found to
provide an encouraging combination of brevity, sensitivity and specificity among
elderly patients (D’Ath et al. 1994). The ‘COOP chart - feelings’ question also
provides another single item example (Scholten and Weel 1992) providing visual
cues of happy/sad faces and has been tested in a number of settings (Bruusgaard
et al. 1993; McHorney et al. 1992).
Title
Intervention aim
Definition
Rationale
65
Stroke Outcome Indicators
Candidate indicator 19 Characteristics
Specificity: Condition-specificPerspective: PatientTimeframe: Cross-sectional
Outcome relationship: Direct

While this is of necessity a cross-sectional measure, it is suggested that comparisons
between populations and over time may yield useful information about the
effectiveness of support and rehabilitation offered to stroke sufferers.
Clinical audit.
Clinicians; commissioners; provider management.
Population-based comparisons may be effected by other socio-economic factors
which predispose patients to depression.
The screening could take place as part of the annual over 75 check for those in that
age-group or opportunistically when the patient attends surgery. Alternatively, it is
suggested that the question may be attached to a series of other questions being
put to the patient at a six month review of the long term impact of stroke
(Indicators 15 to 19). The value of the indicator would be compromised by low
rates of completion - a danger where the data are not derived from information
systems which support operational activities.
The quality of the data yielded through this type of assessment is currently being
investigated (Philp, unpublished).
See Indicator 15.
The Working Group considered that this assessment should be by periodic survey,
but were unable to make definitive recommendations about which measure to use.
This should be left to local decisions, pending results of further investigation of
measurement instruments. Further work is also required to determine the
appropriateness of six months after stroke as a time interval for such assessments.
E - To be further developed because the indicator specification is incomplete,
in that further work is needed to identify a measurement tool. Once
completed, the resulting indicator would be implemented by means of
periodic survey where local circumstances allowed.
Angeleri, F., Angeleri, V.A., Foschi, N., Giaquinto, S., and Nolte, G. (1993). The
influence of depression, social activity, and family stress on functional outcome after
stroke. Stroke, 24, 1468-1483.
Bowling, A. (1991). Measuring health. Open University Press, Buckingham.
Bruusgaard, D., Nessioy, I., Rutle, O., Furuseth, K., and Natvig, B. (1993). Measuring
functional status in a population survey. The Dartmouth COOP functional health
assessment charts/WONCA used in an epidemiology study. Family Practice, 10,
212-218.
Potential uses
Potential users
Possible confounders
Data sources
Data quality
Comments
Further work required
Conclusion & priority
References
66
Stroke Outcome Indicators

D’Ath, P., Katona, P., Mullan, E., Evans, S., and Katona, C. (1994). Screening,
detection and management of depression in elderly primary care attenders. I: the
acceptability and performance of the 15 item Geriatric Depression Scale (GDS15)
and the development of short versions. Family Practice, 11, 260-266.
McHorney, A.C., Ware, J.E., Rogers, W., Raczek, A.E., and Lu, T.F. (1992). The
validity and relative precision of MOS short form and long form health status scales
and Dartmouth COOP charts: results from medical outcomes study. Medical Care,
30 Suppl, 253-265
Robinson, R.G., and Price, T.R.(1982). Post-stroke depressive disorders: a follow-up
study of 103 patients. Stroke, 13, 635-641.
Scholten, J.H.G., and Van Weel, C. (1992). The Dartmouth COOP Functional Health
Assessment Charts/WONCA. MEDITekst, Lelystad.
Sheikh, J.A., and Yesavage, J.A. (1986). Geriatric Depression Scale (GDS): recent
findings and development of a shorter version. In Clinical Gerontology: a guide to
assessment and intervention (ed. T. Brink). Howarth Press, New York.
67
Stroke Outcome Indicators

68
Title
Intervention aim
Definition
Rationale
Potential uses
Potential users
Possible confounders
Data sources
Summary of changes in the Barthel Index as measured at discharge from
hospital and at six months post-stroke, within a provider unit population
admitted for stroke
Improve function and well-being after stroke.
For a population of patients having been admitted for stroke at a given provider
unit in a given year: a summary of the changes observed in individual patients,
from a baseline at discharge to a follow-up at six months (± 21 days) post-stroke,
with respect to the Barthel Index score. The summary statistics, broken down by age
and sex, should describe the distribution of the observed changes in terms of the
proportion of scores which ‘go up’, i.e. improve, go down or remain the same. The
size of the relevant population together with the number of cases for which an
assessment was available should also be reported.
While the total Barthel score provides an assessment of overall disability, it would
also be valuable to know about the changes in the underlying pattern of specific
disabilities. In view of this, the observed changes for the individual component
items of the Barthel should also be reported.
While cross-sectional indicators can provide some indication of rehabilitative
success, longitudinal measures allow a better assessment of the benefits of
rehabilitation as they take into account the severity of disability at the outset of
rehabilitation. The comments on the selection of the Barthel Index, given in the
rationale of Indicator 14, apply here also.
Comparisons between different rehabilitation programmes; evaluation of
rehabilitation programmes.
Clinicians, commissioners, and provider management.
Comparisons between populations should be made in the context of case-mix
information covering severity and co-morbidity.
The indicator relies on the assessment of the Barthel Index score at discharge (see
Indicator 14) and a further assessment at six months after discharge. Denominator
data to identify your patient group would be available from the CMDS for the
relevant year (ICD-10 codes I61, I62, I63, I64 as listed in Indicator 1A).
This indicator requires follow-up at six months after discharge, which is feasible
using similar methods to those described for Indicators 15-19. An alternative to
additional data collection may be to use data from Indicator 15, identifying from the
stroke patient population those who had been admitted to hospital as a result of
their stroke.
Stroke Outcome Indicators
Candidate indicator 20 Characteristics
Specificity: Condition-specificPerspective: ClinicalTimeframe: Longitudinal
Outcome relationship: Direct
The Barthel Index has been shown to be reliable with different observers in a wide
variety of situations (Gompertz et al. 1993), and it is a valid measure of physical
disability (Wade and Hewer 1987). The Barthel Index has been successfully used
within a postal survey, achieving good response rates (Gompertz et al. 1995;
Harwood et al. 1994b). The value of the indicator would be compromised by low
rates of completion - a danger where the data are not derived from information
systems which support operational activities.
Such a longitudinal indicator may also be used for those patients who were not
admitted as a result of their stroke if it is possible to record the Barthel scores at an
appropriate time in the community setting.
None recommended.
D - To be implemented where local circumstances allow by by periodic
survey.
Gompertz, P., Pound, P., and Ebrahim, S. (1993). The reliability of stroke outcome
measures. Clinical Rehabilitation, 7, 290-296.
Gompertz, P., Pound, P., Briffa, J., and Ebrahim, S. (1995). How useful are non-
random comparisons of outcomes and quality of care in purchasing hospital stroke
services? Age and Ageing, 24, 137-141.
Harwood, R.H., Gompertz, P., and Ebrahim, S. (1994b). Handicap one year after a
stroke: validity of a new scale. Journal of Neurology, Neurosurgery and Psychiatry,
57, 825-829.
Wade, D.T., and Hewer, R.L. (1987). Functional abilities after stroke: measurement,
natural history and prognosis. Journal of Neurological and Neurosurgical
Psychiatry, 50, 177-182.
Data quality
Comments
Further work required
Conclusion & priority
References
69
Stroke Outcome Indicators

Percentage of people admitted with a primary diagnosis of stroke who
return to their pre-admission category of accommodation on discharge from
hospital
Improve function and well-being after stroke.
For a hospital provider unit, and year: the number of patients admitted with a
primary diagnosis of stroke in the given year, who are discharged to their pre-
admission category of accommodation, divided by the total number of admissions
with a primary diagnosis of stroke within the given unit and year. This fraction,
expressed as a percentage, should be reported with its numerator both as an overall
figure and by patient age-group and sex. The indicator should also be accompanied
by the frequency distribution of both the admission source and the discharge
destination.
A return home following stroke is assumed to be a successful outcome of
rehabilitation, that reflects the level of dependency following rehabilitation
(Indredavik et al. 1991). This indicator focuses on those patients who were admitted
to hospital as a result of their stroke and are well enough to return to similar
accommodation following their hospital care.
Clinical audit; provider based comparisons.
Clinicians, provider management, commissioners.
Comparisons should be made in the context of information on the relative
severities of the patient populations. A Barthel Index score may be useful in this
role. It is recognised that some changes of address will not reflect an increased
dependency following stroke. The occurrence of irrelevant moves may vary
between populations as a function of, for example, socio-economic factors.
The denominator may be obtained from CMDS in-patient episode data with a
primary diagnosis of stroke (ICD-10 codes I61, I62, I63, I64 as listed in Indicator 1A)
and an admission date in the given year. The numerator, also available from the
provider unit CMDS, will be those cases whose ‘source of admission’ and ‘discharge
destination’ match. Possible categories of accommodation coded by the CMDS are
for example, 19 - usual place of residence, 54 - NHS run nursing home, residential
home or group home, 65 - local authority Part 3 residential care home, 85 - non-
NHS (other than local authority) run residential care.
The validity of the indicator will depend on the quality of the CMDS diagnoses
which are unlikely to be uniformly high.
A limitation of this indicator is that it does not distinguish between wardened and
unwardened accommodation.
Title
Intervention aim
Definition
Rationale
Potential uses
Potential users
Possible confounders
Data sources
Data quality
Comments
70
Stroke Outcome Indicators
Candidate indicator 21A Characteristics
Specificity: Condition-specificPerspective: PatientTimeframe: Cross-sectional
Outcome relationship: Direct

None recommended. .
A - To be implemented generally on a routine basis.
Indredavik, B., Bakke, F., Solberg, R., Rokseth, R., Haaheim, L., and Hilme I. (1991).
Benefit of a stroke unit: a randomised controlled trial. Stroke, 10, 5-8.
Further work required
Conclusion & priority
References
71
Stroke Outcome Indicators

72
Title
Intervention aim
Definition
Rationale
Potential uses
Potential users
Possible confounders
Data sources
Percentage of people admitted with a primary diagnosis of stroke who are
living in their pre-admission category of accommodation six months
following admission to hospital
Improve function and well-being after stroke.
For a provider unit, and year: the number of patients admitted with a primary
diagnosis of stroke who six months following their admission are in their pre-
admission category of accommodation divided by the total number of admissions
with a primary diagnosis of stroke within the given unit and year. This fraction,
expressed as a percentage, should be reported with its numerator both as an overall
figure and by patient age-group and sex.
A return home following stroke is assumed to be a successful outcome of
rehabilitation, that reflects the level of dependency following rehabilitation
(Indredavik et al. 1991). This indicator focuses on those patients who were admitted
to hospital as a result of their stroke. Indicator 21C provides comparable figures for
those strokes which were not hospitalised.
Clinical audit; provider based comparisons.
Clinicians, provider management, commissioners.
Comparisons should be made in the context of information on the relative severities
of the patient populations. A Barthel Index score may be useful in this role. It is
recognised that some changes of addresswill not reflect an increased dependency
following stroke. The occurrence of irrelevant moves may vary between
populations, as a function of, for example, socio-economic factors.
The denominator may be obtained from CMDS data with a primary diagnosis of
stroke (ICD-10 codes I61, I62, I63, I64 as listed in indicator 1A), admission source
data, e.g. 19 - usual place of residence, 54 - NHS run nursing home, residential
home or group home, 65 - local authority Part 3 residential care home, 85 - non-
NHS (other than local authority) run residential care, and the admission date. The
numerator would need to be obtained from GP records indicating the residential
category six months after the stroke to identify if it is different to the pre-admission
category. A range of Read codes exist to code such categories of accommodation,
e.g. lives in a nursing home (13F61), lives in an old peoples home (13F72) (NHS
Centre for Coding and Classification 1996). Where a GP register is capable of
identifying admissions to hospital with a diagnosis of stroke, it could act as an
alternative source for denominator data. The availability of such records is more
likely if the GP holds a stroke register. Prior to October 1st 1996, a stroke register
was required as part of the GMSC health promotion programme (GMSC 1993). In
Stroke Outcome Indicators
Candidate indicator 21B Characteristics
Specificity: Condition-specificPerspective: PatientTimeframe: Cross-sectional
Outcome relationship: Direct

Data quality
Comments
Further work required
Conclusion & priority
References
73
1995, 95% of doctors were running this programme (Department of Health 1996).
For computerised systems and if using denominator data obtained from CMDS data,
record linkage via the NHS number would be required.
The validity of the indicator will depend on the quality of the CMDS diagnoses
which are unlikely to be uniformly high. Deriving the denominator from GP data
may be hampered by incomplete recording of admissions for stroke, although a
dedicated stroke register may reduce this likelihood. The value of the indicator
would be compromised by low rates of completion - a danger where the data are
not derived from information systems which support operational activities.
A limitation of this indicator is that it does not distinguish between wardened and
unwardened accommodation. Lengths of stay may be useful additional information
in the interpretation of this indicator.
None recommended.
B - To be implemented generally by periodic survey.
Department of Health (1996). Statistical Bulletin: statistics for general medical
practitioners in England: 1985-1995. Department of Health, London.
General Medical Services Committee (GMSC) (1993). The new health promotion
package. BMA, London.
Indredavik, B., Bakke, F., Solberg, R., Rokseth, R., Haaheim, L., and Hilme I. (1991).
Benefit of a stroke unit: a randomised controlled trial. Stroke, 10, 5-8
NHS Centre for Coding and Classification (1996). The Read Codes October 1996
Demonstrators. NHS Executive, Leeds.
Stroke Outcome Indicators

74
Title
Intervention aim
Definition
Rationale
Potential uses
Potential users
Possible confounders
Data sources
Data quality
Comments
Percentage of people with a diagnosis of stroke who were not hospitalised
and are living at their pre-stroke category of accommodation six months
after the stroke
Improve function and well-being after stroke.
For a given GP and year: the number of patients registered as having had a non-
hospitalised stroke in the given year who are living at their pre-stroke category of
accommodation six months after their stroke, divided by the total number of patients
registered as having had a non-hospitalised stroke within the given year. This
fraction, expressed as a percentage, should be reported with its numerator both as
an overall figure and by patient age-group and sex.
See Indicator 21B. Unlike 21B, this indicator looks at only those cases of stroke
which did not involve an admission to hospital.
Local audit; comparisons between different rehabilitation programmes; evaluation of
rehabilitation programmes.
Clinicians, provider management, commissioners.
Comparisons should be made in the context of information on the relative
severities of the patient populations. It is recognised that some some changes of
address will not reflect an increased dependency following stroke. The occurrence
of irrelevant moves may vary between populations, as a function of, for example,
socio-economic factors.
Both numerator and denominator data would be obtained from GP records
identifying any change in category of accommodation since the stroke incident. The
availability of such records is more likely if the GP holds a stroke register. Prior to
October 1st 1996, a stroke register was required as part of the GMSC health
promotion programme (GMSC 1993). In 1995, 95% of doctors were running this
programme (Department of Health 1996). A range of Read codes exist to identify
both stroke diagnoses, accommodation status (see indicator 20B) and discharged
from hospital (8HE.) (NHS Centre for Coding and Classification 1996).
The validity of the indicator will depend on the quality of the GP records which is
unlikely to be uniformly high. A dedicated stroke register may provide better data
and 95% of practices were running the GMSC programme in October 1995
(Department of Health 1996). The value of the indicator would be compromised by
low rates of completion - a danger where the data are not derived from
information systems which support operational activities.
No specific points.
Stroke Outcome Indicators
Candidate indicator 21C Characteristics
Specificity: Condition-specificPerspective: PatientTimeframe: Cross-sectional
Outcome relationship: Direct

Further work required
Conclusion & priority
References
75
None recommended.
D - To be implemented where local circumstances allow by a periodic survey.
Department of Health (1996). Statistical Bulletin: statistics for general medical
practitioners in England: 1985-1995. Department of Health, London.
General Services Medical Committee (GMSC). (1993). The new health promotion
package. BMA, London.
NHS Centre for Coding and Classification (1996). The Read Codes October 1996
Demonstrators. NHS Executive, Leeds.
Stroke Outcome Indicators

76
Title
Intervention aim
Definition
Rationale
Potential uses
Potential users
Possible confounders
Data sources
Data quality
Comments
Further work required
Conclusion & priority
Summary of a measure of patients’ or carers’ knowledge of available health
and social services, six months after stroke
Improve function and well-being after stroke.
For a GP population of patients having had a stroke in a given year: a summary of
patients’ (or carers’) responses to a questionnaire measuring patient
knowledge/awareness of available health and social services for stroke (to be
specified), administered six months after the stroke. The summary statistics (which
have not been specified), will describe the distribution of scores from the
instrument, broken down by patient age-group and sex.
Following a stroke, patients are likely to need significant input from health and
social services during the immediate rehabilitation period. However, a significant
number will also need continued support over a much longer period, and often for
the rest of their lives. A range of services may be available, for example home help,
social worker, a continence service, a laundry service, and financial support. The
level of awareness of different stroke services among individuals who had a stroke
six months previously, will in part, reflect whether the range of services were
offered and an appropriate needs assessments for individual care packages
undertaken.
Clinical audit; trends over time.
Clinicians; provider management, commissioners.
It is recognised that different configurations of services are available in different
places and it is therefore recommended that any data collection methods should
reflect local service provision (see for example, Philp and Young 1988).
No existing measures to support this indicator were identified. Specification of a
suitable data collection method will have to consider the role of carers as
informants, in those cases where direct data collection is impractical.
No particular points.
No specific points.
Development and testing of appropriate data collection methods.
E - To be further developed because the indicator specification is
incomplete, in that further work is needed to identify a measurement tool.
Candidate indicator 22 Characteristics
Specificity: Condition-specificPerspective: Patient/carerTimeframe: Cross-sectional
Outcome relationship: Indirect
Stroke Outcome Indicators

Philp, I., and Young, J. (1988). Audit of support given to lay carers of the demented
elderly by a primary care team. Journal of the Royal College of General
Practitioners, 38, 153-155.
References
77
Stroke Outcome Indicators

Title
Intervention aim
Definition
Rationale
Potential uses
Potential users
Possible confounders
Data sources
Data quality
Comments
Summary of a measure of patient satisfaction within a population six
months after stroke
Improve function and well-being after stroke.
For a GP population of patients having had a stroke in a given year: a summary of
patients’ responses to a questionnaire measuring satisfaction with in-patient care
and/or community care (to be specified) administered six months after the stroke.
The summary statistics (which have not been specified), will describe the
distribution of scores from the instrument, broken down by patient age-group and
sex.
While satisfaction is itself a desirable outcome, there is also evidence that care
which is less satisfactory to the patient is also less effective (Kaplan et al. 1989). It
has also been shown that patients’ reported levels of satisfaction can reflect doctor’s
technical competence as judged by independent, professional assessors (Dimmatteo
and Hays 1980). In 1988, the King’s Fund Consensus Statement (1988) on the
treatment of stroke recommended the involvement of stroke patients and their
carers in the setting and subsequent monitoring of standards with a view to
improving stroke care.
Clinical audit; trends over time.
Clinicians, provider management, commissioners, public.
A range of social and demographic variables have been shown to be confounders
which influence patient satisfaction (Fitzpatrick 1990). As a minimum, comparative
analyses of satisfaction would be informed by knowledge of the age/sex of patients
at different units.
Two promising instruments were identified which are validated specifically for the
evaluation of patient satisfaction in patients following a stroke (Wellwood et al.
1995b; Pound et al. 1994). The London Stroke Satisfaction Score (Pound et al. 1994)
has also been used as part of a postal survey at six months (Gompertz et al. 1995).
Both the instruments were developed specifically for in-patient hospital care.
Further work is needed to develop an appropriate assessment tool for the
community aspects of stroke care.
There is a potential for bias resulting from the selecting out of patients unable to
participate in the survey, the influence of the presence of carers or patients at the
time of participation and the lack of a well established, valid and reliable measure
of satisfaction (Wellwood et al. 1995b).
Needs validation against objective measures of quality.
Stroke Outcome Indicators
78
Candidate indicator 23 Characteristics
Specificity: Condition-specificPerspective: PatientTimeframe: Cross-sectional
Outcome relationship: Direct
Further work required
Conclusion & priority
References
79
Selection of a generic measure, or development of condition specific questionnaire,
on the basis of pilot data collection experience with stroke patients.
E - To be further developed because the indicator specification is
incomplete, in that further work is needed to identify a measurement tool.
Dimatteo, M.R., and Hays, R. (1980). The significance of patients’ perceptions of
physician conduct: a study of patient satisfaction in a family practice centre.
Journal of Community Health, 6, 18-34.
Fitzpatrick, R. (1990). Measurement of patient satisfaction. In Measuring the
outcomes of medical care, (ed. A. Hopkins, D. Costain). Royal College of
Physicians, London.
Gompertz, P., Pound, P., Briffa, J., and Ebrahim, E. (1995). How useful are non-
random comparisons of outcomes and quality of care in purchasing hospital stroke
services. Age and Ageing, 24, 137-141.
Kaplan, S., Greenfield, S., and Ware, J. (1989). Assessing the effects of physician-
patient interactions on the outcomes of chronic disease. Medical Care, 27, S110-
S127.
King’s Fund Consensus Statement (1988). Treatment of stroke. British Medical
Journal, 297, 126-128.
Pound, P., Gompertz, P., and Ebrahim, S. (1994). Patient satisfaction with stroke
services. Clinical Rehabilitation, 8, 7-17.
Wellwood, I., Dennis, M.S., and Warlow, C.P. (1995b). Patients’ and carers’
satisfaction with acute stroke management. Age and Ageing, 24, 519-524.
Stroke Outcome Indicators

Assessment of carer burden, six months after stroke
Support carers.
Three alternative approaches to the assessment of carer burden were considered.
1. One approach is to undertake an assessment across the various causative
factors thought to underlie carer burden; see Appendix F (F35-59) of this report.
The seven dimensions of carer burden identifed are:
- information and skills
- depression, anxiety and stress
- satisfaction with care and with caring
- social support and networks
- services
- financial outcome
- physical health status.
2. A second method is to undertake a more direct assessment of the burden or
stress of caring by using a questionnaire based index. A number of such measures
exist, such as the Care-Giver Strain Index (Robinson 1983) and the Relatives’ Stress
Score (Greene et al. 1982). These instruments are also discussed in Appendix F.
Other simpler tools exist which assess carer burden, such as the Critical Interval
method of assessing need, where the carer indicates the length of time a person can
be left without needing attention (Issacs and Neville 1976).
3. Thirdly, an alternative option would be to augment the postal assessment of
disability (see Indicator 15). Each item of the functional ability assessment would be
extended with an additional question. For example, for “Do you climb stairs?” the
additional question “If you cannot, who is there to help you?” would be added. In
order to get the carer’s perspective, this may be used in addition to a carer burden
assessment tool.
Whichever method or approach is used, it will be necessary to define the carer
population. Some definitions of carers are available from the literature, for example,
a ‘carer’ may be defined as either:
Anyone who looks after or cares for a handicapped person to any extent in their
own home or elsewhere (Equal Opportunities Commission 1982).
OR
A person looking after or providing some form of regular service for a sick,
handicapped or elderly person living in their own or another household (Green
1988).
However, such definitions may be difficult to operationalise.
Title
Intervention aim
Definition
80
Stroke Outcome Indicators
Candidate indicator 24 Characteristics
Specificity: Condition-specificPerspective: CarerTimeframe: Cross-sectional
Outcome relationship: Direct

Carer burden is multidimensional incorporating issues of support, help, protection,
and social dynamics as well as the physical and behavioural aspects (Quereshi
1986, Pearlin et al. 1990). More recently the burden upon carers has to some extent
been acknowledged with the introduction of the Carers Act 1996. A population of
250,000 people will have about 1,500 survivors of stroke living in the community
with over half being dependent in at least one activity of daily living (Langton-
Hewer 1990). Substantial numbers of people care for stroke patients nationally.
Assessments of burden may provide useful information to identify the needs of the
carer and the person being cared for, assess the adequacy of existing services or
the impact of specific interventions which aim to reduce carer burden.
Clinical audit; trends over time.
Providers, clinicians, commissioners, public.
Carers’ perception of burden may be related to their own physical, social and
mental state as well as other factors. It is suggested that a more general assessment
using a multi-factorial assessment instrument such as the General Health
Questionnaire (Goldberg 1972) may be appropriate in addition to a specific
assessment of burden (Philp 1994).
Currently, little information is documented about carers on a routine basis. New
data sources would be required to collect relevant data. If the carer were to be the
source of the information, a self-administered questionnaire may be suitable.
Personal or telephone interviews may be a preferred alternative. It is unlikely that
information is readily available in a standard form and direct communication with
the carer may be the more reliable source, despite the inherent bias and
interpretation issues.
If postal questionnaires are used these could be distributed six months after a
stroke from the general practice. Such a task would be facilitated if the practice
maintained a stroke register. However, even where stroke sufferers have been
identified, identification of an associated carer may not be straightforward and an
incomplete survey may be inevitable.
While some of the practical difficulties of data collection can be addressed, it must
be recognised that carer burden is a particularly sensitive issue. Individuals
receiving questionnaires may not identify themselves as a carer or may feel
uncomfortable about the care of a loved one being addressed in terms of burden
or strain. Equally some carers may not be in sympathy with the person for whom
they are caring, as they are often forced into the role. Additionally, routine
measurement of burden may raise expectations of additional assistance under
circumstances that may not be met.
Rationale
Potential uses
Potential users
Possible confounders
Data sources
81
Stroke Outcome Indicators
Data quality
Comments
Further work required
Conclusion & priority
References
The quality of the data would depend on the source. Any questionnaires designed
and developed to be completed by the carer would need field testing for validity
and reliability. Alternative systems for capturing this information either within a
hospital or general practice would also need evaluation to determine the nature of
the data and the likely availability.
Both the Care-Giver Strain Index and Relatives’ Stress Score have been used in
several research studies and are brief, and found to be practical. The Care-Giver
Strain Index has been used and was developed to detect strain among carers of
physically-impaired elderly people living at home in the United States. Encouraging
results with respect to validity and reliability have been obtained in this population.
The Relatives’ Stress Score was developed to assess the amount of stress and upset
experienced by relatives as a result of caring for an elderly mentally impaired
person living at home. Both scales, although requiring further testing in stroke
populations with higher physical needs, are judged as valuable instruments which
could be incorporated into clinical practice (Philp 1994).
In some cases where a carer’s perception of burden is influenced by her own
physical health, mental health and morale a more general assessment has been
suggested as appropriate, using a multi-factorial assessment instrument such as the
General Health Questionnaire (Goldberg 1972).
Further research is required before any recommendations can be made regarding
the capture of information about carer burden in relation to stroke. In particular,
further consideration should be given to the possibility of augmenting the disability
assessment as noted above.
E - To be further developed because the indicator specification is incomplete
in that further work is needed to identify a measurement tool.
Equal Opportunities Commission (1982). Who cares for the carers: opportunities for
those caring for the elderly and handicapped. Equal Opportunities Commission,
Manchester.
Green, H. (1988). Informal Carers. General Household Survey 1985 series. GHS
No15, Supplement 16. HMSO, London.
Greene, J.G., Smith, R., Gardiner, M., and Timbury G.C. (1982). Measuring
behavioural disturbance of elderly demented patients in the community and its
effects on relatives: a factor analytic study. Age and Ageing, 11, 121-126.
Goldberg, D.P. (1972). The detection of psychiatric illness by questionnaire. Oxford
University Press.
82
Stroke Outcome Indicators

Issacs, B., and Neville, Y. (1976). The needs of older people: the ‘interval’ as a
method of measurement. British Journal of Preventative & Social Medicine, 30, 79-
85.
Langton-Hewer, R. (1990). Rehabilitation after stroke. Quarterly Journal of Medicine,
76, 650-674.
Pearlin, L., Mullan, J.T., Semple, S.J., and Skaff, M.M. (1990). Care giving and the
stress process: an overview of concepts and their measures. Gerontologist, 30, 583-
594.
Philp, I. (1994). In Assessing elderly people in hospital and community care (ed. I.
Philp). Farrand Press, London.
Quereshi, H. (1986). Responses to dependency: reciprocity, affect and power in
family relationships. In Dependency and interdependency in old age: theoretical
perspectives and policy alternatives (ed. C. Phillipson, M. Barnard and R. Strang R).
Croom Helm, London.
Robinson, B.C. (1983). Validation of a caregiver strain index. Journal of
Gerontology, 38, 344-348.
83
Stroke Outcome Indicators

To be implemented generally on a routine basis
5.1 It is recommended that the following indicators be implemented generally
on a routine basis (the numbers for the indicators refer to those used in
Section 4):
1A: incidence of hospitalised stroke
2: percentage of general practice patients who have had their blood
pressure recorded in the previous five years
7A: case-fatality rate within 30 days of a hospital admission for stroke
8: population-based mortality rates
10: incidence of pressure sores during the in-patient stay within a
provider unit population with a primary diagnosis of stroke
14: distribution of the Barthel Index of Activities of Daily Living, at
discharge from hospital, within a provider unit population with a
primary diagnosis of stroke
21A: percentage of people admitted with a primary diagnosis of stroke
who return to their pre-admission category of accommodation on
discharge from hospital.
5.2 Data on hospitalised stroke are routinely collected and can be used now to
calculate incidence rates of strokes requiring hospital admission. They can be
used within a district or region to show trends over time and provide
information for service planning.
5.3 The percentage of patients in a general practice who have had their blood
pressure recorded in the previous five years will indicate the extent to
which general practitioners use opportunities for prevention of stroke in their
patients by measuring blood pressure. Where the percentage is low, the
indicator would show geographical areas where more attention could be given
to stroke prevention.
5.4 The case-fatality rate of hospitalised patients within 30 days of a stroke may
reflect the quality of care given to patients but will also be influenced by case
mix. The proposed measure is that of 30 day case-fatality including patients
who die after discharge from the first admission episode. This would require
linkage to death certificates. Without linkage, case-fatality rates could be
calculated using currently available data for those deaths which occur in the
hospital admission for the stroke.
5.5 The population based mortality rate reflects in part the failure to prevent
stroke and in part the adverse outcome of the occurrence of stroke. It can be
used to study the trends nationally and locally. This rate is already being
monitored as part of the Health of the Nation targets. Its reliability depends on
the accuracy of death certification for stroke.
85
5. RECOMMENDATIONS

86
5.6 The acquisition of pressure sores in hospital is an indicator of care although
it may be influenced by factors preceding admission. Length of stay (the
period of time at risk) may need to be considered when looking at hospital-
acquired pressure sores, but they should be avoidable even in long-stay
patients. The ICD-10 code does not allow pressure sores present on
admission to be distinguished from those acquired in hospital. The Group
recommend that the diagnostic code be subdivided to distinguish pressure
sores present on admission to hospital from those acquired in hospital. The
Read code does distinguish these and could be used. For pressure sores
present on admission it would be helpful to code whether they improved,
deteriorated or remained the same while in hospital.
5.7 The distribution of the Barthel Index of Activities of Daily Living at
discharge from hospital is useful in clinical audit. We also recommend its use
for monitoring trends over time and geographical variation on a large
population level. It is a reflection both of case-mix and of the effectiveness of
the hospital care and it should be used with caution, if at all, as an outcome
indicator for comparison of provider units. However, it would be a valuable
measure of case-mix to use in interpreting other indicators and as a baseline
measurement to compare with the Barthel Index at six months.
5.8 Discharge of patients to their previous accommodation is an indication of
successful rehabilitation but is also dependent on case-mix. Destination at
discharge is more easily collected than that several months after discharge as it
does not require linking of records. This information is available and could be
analysed at little additional expense. The percentage of patients returned to
their pre-admission category of accommodation at six months is a more useful
figure as some patients are discharged to another unit for rehabilitation but it
is less readily collected.
To be implemented generally by periodic survey.
5.9 It is recommended that the following indicators be implemented generally by
periodic survey:
3: median and inter-quartile range of systolic blood pressure within
a general practice population
5: percentage of patients within a general practice population who
have a prescription for aspirin therapy at six months after stroke
(without proven haemorrhage)
11B: percentage of patients in a nursing home population who, six
months following a stroke, have one or more pressure sores
Stroke Outcome Indicators

13: multi-professional involvement in the week following admission
within a provider unit population admitted with a primary
diagnosis of stroke
15: distribution of the Barthel Index of Activities of Daily Living
(ADL), within a population of patients six months following
stroke
21B: percentage of people admitted with a primary diagnosis of stroke
who are living in their pre-admission category of accommodation
six months following admission to hospital.
5.10 A measure of the distribution of systolic blood pressure in a general
practice population is useful for monitoring changes over time. This indicator
relates to the Health of the Nation target of reducing the population blood
pressure.
5.11 The percentage of patients receiving a prescription for aspirin therapy at
six months after a stroke (without proven haemorrhage) is a process indicator
of the quality of care they are receiving. It may reflect either hospital or GP
care as GPs may be reluctant to initiate aspirin therapy if a patient is
discharged without it. We acknowledge that there is no way of readily
assessing if the patients are complying with the therapy.
5.12 Patients with reduced mobility are at increased risk of pressure sores.
Preventing the development of pressure sores in patients following a stroke,
in long-term care, is in part a reflection of the standard of care they are
receiving. This information could be collected as part of the annual
inspection of nursing homes and residential homes and used to monitor
different providers of such care.
5.13 Co-ordinated care of patients with stroke should be started soon after
admission to hospital so as to obtain the best outcome. Multi-professional
involvement is a proxy measure of co-ordinated care and is taken to reflect
the standard of care patients receive. It may be useful locally to validate the
measure on a sample basis to ensure that recorded involvement reflects true
co-ordination.
5.14 The distribution of the Barthel Index Activities of Daily Living (ADL)
scores at six months after a stroke shows the range of outcomes in the
population. The population in our recommended indicator includes both those
admitted to hospital and those cared for in the community and is therefore
not directly comparable with the ADL scores at discharge from hospital.
87
Stroke Outcome Indicators
5.15 For many patients successful rehabilitation should result in their living in their
pre-admission category of accommodation six months following
admission. This aim may be influenced by the availability of home support
and/or lack of preferred alternative accommodation. It should be considered
with other indicators assessing avoidance of complications and of improved
function following stroke.
To be implemented where local circumstances allow on a routine basis
5.16 It is recommended that the following indicators be implemented where local
circumstances allow on a routine basis:
1B: population-based incidence of stroke
4: percentage of general practice patients, identified as hypertensive,
whose most recent systolic blood pressure measurement is less
than 160 mm Hg
7B: case-fatality rate within 30 days of a stroke (in-patient or
community-based treatment).
5.17 The population-based incidence of stroke is important in measuring the
true incidence of the condition, to assess trends, review the effects of
interventions and plan services. However, the data are not readily available.
They could be collected from GP computer systems or from a well maintained
community based stroke register. The latter requires resources and local
commitment. It would be preferable to focus resources on a few well
organised stroke registers, as example populations, rather than to seek
population based data more widely if data are of doubtful quality in the
absence of stroke registers.
5.18 The proportion of patients with diagnosed hypertension with a current
systolic blood pressure less than 160 mm Hg gives an indication of the
control of their hypertension. This can be used to assess the effectiveness of
the local treatment of hypertension.
5.19 The case-fatality rate within 30 days for all patients with stroke gives a
more reliable picture of the mortality associated with stroke than that for only
those admitted to hospital. It can only be compiled where all strokes are
accurately recorded and it needs identification of all deaths (e.g. by linkage of
death certification medical records).
88
Stroke Outcome Indicators

To be implemented by periodic survey where local circumstances allow
5.20 It is recommended that the following indicators be implemented where local
circumstances allow by periodic survey:
6: percentage of general practice patients with a diagnosis of atrial
fibrillation who have a prescription for anticoagulant therapy
11A: percentage of patients within a community provider population
who, six months following a stroke, have one or more pressure
sores
12: rate of emergency re-admissions (for any reason) within 30 days
of discharge, per provider unit population with a primary
diagnosis of stroke
20: summary of changes in Barthel Index as measured at discharge
from hospital and at six months post-stroke, within a provider
unit population admitted for stroke
21C: percentage of people with a diagnosis of stroke who were not
hospitalised and are living at their pre-stroke category of
accommodation six months after the stroke.
5.21 Anticoagulation therapy is not of proven benefit in everyone with atrial
fibrillation. Benefit depends on age and other risk factors, but the indicator
would allow comparisons to be made between practices and districts, and
trends over time could be monitored.
5.22 Preventing the development of pressure sores in patients with reduced
mobility is in part a reflection of the standard of care they receive. It may
also be affected by case-mix.
5.23 The rate of emergency re-admissions within 30 days of discharge reflects
to some extent the adequacy of discharge planning and community support.
Some admissions will be unavoidable but the indicator can be used to
determine whether local rates are in line with those found generally.
Comparisons could be made between different provider units and trends over
time could be monitored.
5.24 A summary of changes in Barthel dependency between discharge and six
months after a stroke would be an appropriate time frame for assessment of
recovery. It will reflect both the quality of care received and the natural
history of recovery.
89
Stroke Outcome Indicators

5.25 The percentage of patients who were not hospitalised and are living in
their pre-stroke category of accommodation six months following
admission should indicate successful rehabilitation. It may be influenced by
the availability of home support and/or lack of preferred alternative
accommodation. It should be considered with other indicators assessing
avoidance of complications and of improved function following stroke.
To be further developed
5.26 It is recommended that the following indicators require further work on the
methods of measurement. If development is successful the following indicators
should be implemented by periodic surveys where local circumstances allow:
16: assessment of aphasia within a population of patients six months
following stroke
17: assessment of outdoor mobility within a population of patients six
months following stroke
18: assessment of social functioning within a population of patients
six months following stroke
19: assessment of depression within a population of patients six
months after a stroke.
5.27 It is recommended that the following indicators require further development
before implementation is considered either because the link with effectiveness
is not clear, the indicator specification is incomplete, or the practical value of
the indicator is uncertain:
9: percentage of patients within a provider unit population for whom
a formal swallowing assessment was undertaken within 24 hours
of a stroke
22: summary of a measure of patients’ or carers’ knowledge of
available health and social services, six months after stroke
23: summary of a measure of patient satisfaction within a population,
six months after a stroke
24: assessment of carer burden, six months after stroke.
5.28 Aphasia following stroke is a devastating condition. At present there is no
one short, widely accepted instrument for assessing it. The extent to which
this outcome can be influenced by care is uncertain.
5.29 Outdoor mobility is particularly important to those living in the community
following a stroke but no instrument has been validated in stroke patients.
The extent to which this outcome can be influenced by care is uncertain.
90
Stroke Outcome Indicators

91
Stroke Outcome Indicators
5.30 Social functioning is of importance to patients who have had a stroke and
would reflect the outcome of rehabilitation. No measure has been validated
in this group of patients and so further work is required.
5.31 Depression in patients with stroke may decrease their functional ability and
may be related to their rehabilitation and social support. Further work is
require to validate a measure in this group of patients.
5.32 Assessment of swallowing following a stroke is important to reduce the risk
of aspiration and its assessment is part of quality hospital care. This could be
collected by systematic prospective recording and computerisation or by an
audit of patient notes and therefore may require some additional resources to
collect. The relationship between the results of the assessment and eventual
outcome is not yet clear.
5.33 Patients and their carers need to have knowledge of the health and social
services available if they are to gain maximum benefit from them. There are
no existing measures to assess this but, if one was developed and shown to
be useful, it could be used for clinical audit and the comparison of provider
units.
5.34 Patient satisfaction with services is important but there is no brief measure
for use in day-to-day practice which has been shown to be valid and sensitive
to variation in service provision.
5.35 Impact of care on carers is recognised as an important problem and work
on ways of measuring this for the carers of people with stroke has been the
subject of research. Further work is required to develop a brief valid
instrument for use in routine service settings.
Conclusions
5.36 As described in the indicator specifications, indicators collected routinely may
be used to highlight differences:
- over time
- between providers
- between groups of patients.
5.37 The main use of such indicators is to make broad comparisons to identify
significant differences or anomalies that require further detailed examination.
Small differences in routine indicators may be attributable to a wide range of
factors, many of which will probably not reflect differences in health
outcomes which can be attributed to the process of care.
92
Stroke Outcome Indicators
5.38 Some indicators may best be used in combination to gain additional
information. For example:
- if the case-fatality rate following stroke is high the indicators relating to the
‘process proxy indicators for outcome’ should be examined
- if pressure sore rates are high other indicators of adverse outcome should
be examined
- if the population based incidence of stroke in a particular population is
high the indicators relating to prevention of first or subsequent strokes
should be examined in more detail.
5.39 There are a number of indicators which are suggested based on data
collection at six months after a stroke. These could be collected at a single
contact at this time and would enable a fairly comprehensive assessment of
the outcome of a stroke to be made. This would probably be most
appropriately carried out in general practice but could be done at an out-
patient visit.

93
Summary
A1. Over the last few years a major component of the Department of Health’s and
NHS Executive’s strategy has been to promote the development and use of
measures of health outcome. In July 1993 the Central Health Outcome Unit
(CHOU) was set up within the Department of Health (DoH). Commissioned
by the DoH, in 1993 a feasibility study of potential outcome indicators was
published by the Faculty of Public Health Medicine and a package of
indicators was published by the University of Surrey for consultation.
Following these two phases of development, a third phase of work was
initiated by the CHOU. Its remit is to report on ‘ideal’ health outcome
indicators.
Central Health Outcome Unit
A2. The CHOU is an internal DoH unit whose goal is ‘to help secure continuing
improvement in the health of the people of England through cost-effective
and efficient use of resources’ (Lakhani 1994). The objectives of the Unit are
to:
- encourage and co-ordinate the development of health outcome assessment,
particularly in respect of the development of appropriate methods,
appropriate data collection systems, expertise, analytical skills, and
interpretation
- encourage and support the use of health outcome assessment and
information in making policy about health interventions and in the
planning, delivery and monitoring of services.
A3. Several national committees have a special interest in outcomes and are kept
informed of progress:
- Clinical Outcomes Group
- Public Health Network
- CMO Working Group on Information Management and Technology.
APPENDIX A: BACKGROUND TO THE WORK

Phases 1 and 2
A4. The Faculty of Public Health Medicine was commissioned to undertake a
feasibility study of potential indicators which reflect health end-points for
health services and which cover topics in which health care has an important
contribution to make. This work, (McColl and Gulliford 1993) was constrained
in that the set of indicators were to:
- be based on reliable routinely collected data
- reflect health service interventions rather than the wider influences on
health.
A5. The University of Surrey was commissioned to produce a package of
comparative statistics based on the outcome measures recommended in the
feasibility study. Forty indicators were chosen, 18 for maternal and child
health, three for mental health and the rest for other topics in adult health.
The publication (Department of Health 1993a) contained indicator definitions,
maps and scatter plots showing geographical variations, and tables presenting
the rates, with corresponding observed numbers and confidence intervals
when appropriate.
The Phase 3 work: ideal indicators of health outcome
A6. In the third and current phase of the work on health outcomes a number of
research institutions were commissioned to assist in developing a structured
approach to identify indicators to cover a number of clinical topics. The prime
contractor is the Unit of Health-Care Epidemiology, Department of Public
Health and Primary Care, University of Oxford.
A7. The respective roles of the supporting organisations are as follows:
- Unit of Health-Care Epidemiology, University of Oxford, to provide
epidemiological and managerial support to the Group and co-ordinate the
input of the other agencies.
- CASPE Research, in London, to provide technical advice with regard to
the indicators and their data sources, and prepare the detailed indicator
specifications.
- NHS Centre for Reviews and Dissemination, University of York, to produce
reviews of the literature on the effectiveness and cost-effectiveness of
relevant interventions.
- UK Clearing House on Health Outcomes, Nuffield Institute of Health,
University of Leeds, to provide support in identifying measures and
instruments to be used for assessing outcomes.
- Royal College of Physicians’ Research Unit, in London, to co-ordinate the
clinical input.
94
Stroke Outcome Indicators

A8. In the previous work a key criterion for selection of indicators was the
requirement for the work to be based on routinely available data. This
practical constraint has meant that the recommended indicators were selected
and opportunistic rather than an ideal set. This inevitably led, as the DoH
acknowledged, to a bias towards outcomes which may be measurable now
but which may not necessarily be those which are most appropriate and most
needed. The aim of the third phase is to advise on and develop ‘ideal’
outcome indicators without confining recommendations to data which have
been routinely available in the past.
A9. The initial task of the third phase of the work was to select clinical topics for
detailed study. In order to ensure that the work would be manageable, and
that the NHS would have the capacity to absorb the output, the CHOU
decided to limit the activity to five clinical topics a year.
A10. A workshop to initiate the work which was attended by over 70 individuals
representing a wide range of interests was held in January 1995. A report of
the proceedings has been published (Goldacre and Ferguson 1995). The main
aims of the workshop were:
- to identify the criteria which should be used to choose clinical topics for
the Phase 3 work
- to suggest a list of potential clinical topics which workshop participants
would like to be included in the Phase 3 work.
Stroke scored highly against all the criteria and appeared on all the shortlists
of topics to be addressed which were developed at the workshop.
A11. Following further consultation within and outside the DoH, the CHOU
decided in June 1995 to include the following topics in the first two years of
Phase 3 work:
- Asthma
- Breast cancer
- Cataract
- Diabetes mellitus
- Fracture of neck of femur
- Myocardial infarction
- Pregnancy and childbirth
- Severe mental illness
- Stroke.
95
Stroke Outcome Indicators

Health outcome information
A12. The Group was influenced in its work by considering the potential uses of
outcome information, as follows:
- for clinical decision-making and audit of clinical work, including:
• audit and management of health professionals’ practice
• research
- for informing decisions about the strategic and operational development of
services
- for comparisons of organisations in the delivery of services which may be:
• provider based
• population based
- for assessing progress towards standards or targets for health outcomes,
agreed nationally or locally, which may be:
• identified from the research literature
• set by clinical and managerial decisions.
A13. Current managerial interests which are relevant to the use of health outcome
information include:
- The NHS goal ‘to secure, through the resources available, the greatest
improvement in the physical and mental health of people in England’
- clinical audit
- evidence-based commissioning.
A14. An important purpose of this work has been to recommend indicators which,
if possible, would allow ‘health gain’ to be assessed alongside information
used to measure health service input. Our particular focus has been to make
recommendations about aggregated statistical information about people with
stroke which can be used to:
- enable providers of care to review outcomes of the care of their patients
- make comparisons, where appropriate, of health outcomes against locally
agreed targets and/or between different places and/or over time.
A15. The information may be obtained from continuous data collection systems but,
when having continuously collected information is unnecessary, or when the
cost or complexity of this is high, use should be made of sample survey
techniques or periodic surveys.
96
Stroke Outcome Indicators

A16. Health indicators are more likely to be successful if they fit naturally into the
everyday work of health care professionals than when they have to be
collected as a separate activity. The aim is to have indicators that are:
- Relevant because professionals use them everyday in treating their patients
and will record them accurately.
- Reliable because they can be validated or cross checked from other
sources.
- Responsive because they readily identify changes in the patient’s state of
health.
- Research-based because there is a plausible link between processes of care
and outcome.
A17. In common with the approach taken to other types of indicators by the NHS,
the Group recognise that useful outcome indicators should be capable of
identifying circumstances worthy of investigation but that, in themselves, they
may not necessarily provide answers to whether care has been ‘good’ or
‘bad’. In particular it is recognised that there may be difficulties in drawing
causal conclusions - say, that a particular aspect of care caused a particular
outcome - from indicators derived from non-experimental clinical settings.
Nonetheless the vast majority of clinical care is delivered in routine than
experimental practice. The assessment of its outcomes entails, by definition,
the use of observational rather than experimental data.
A18. To be useful, work on ‘ideal’ outcome aspects needs to incorporate
considerations of practicability. It is a time of rapid change in information
technology. What may be feasible now in some places may not be feasible
everywhere. What may not be practical today may become so in a year or
two.
97
Stroke Outcome Indicators

The Stroke Working Group
B1. The Stroke Working Group was formally constituted in December 1995 and
met three times, completing its work in September 1996. The Report was
completed in May 1997. The terms of reference were:
- To advise on indicators of health outcomes for the prevention, treatment
and care of stroke including its effect on carers.
- To make recommendations about the practicalities of the compilation and
interpretation of the indicators, and to advise if further work is needed to
refine the indicators and/or make them more useful.
B2. The membership of the Working Group and the staff of the supporting
organisations are shown below. The composition of the Group included the
major professional and managerial groups and representatives of patients and
carers involved with the care of stroke.
Chairman and members
Physicians Anthony Rudd, St. Thomas’s Hospital (Chairman)
Martin Dennis, Edinburgh
David Barer, Newcastle
Derick Wade, Oxford
GP Colin Waine, Durham
Nurse Karen Waters, Manchester
Psychologist Nadina Lincoln, Nottingham
Social worker Bridgit Penhale, Hull
Physiotherapist Margaret Hastings, Dumbartonshire
Occupational therapist Caroline Hill, Southampton
Speech/language therapist Pam Enderby, Sheffield
Researchers Shah Ebrahim, Royal Free Hospital
Ian Philp, Sheffield
Wolfgang Schady, Manchester
CEOs Neil Goodwin, Manchester
Suzanne Cosgrave, Worthing
DoH Vivien Press
Stroke Association Sylvia McClauchlan
College of Health Marcia Kelson
Academic support and secretariat
Michael Goldacre, Alastair Mason, John Fletcher, University of Oxford
Moyra Amess, James Coles & Robert Cleary, CASPE Research, London
Anthony Hopkins & Penny Irwin, Royal College of Physicians, London
Alison Eastwood, NHS Centre for Reviews and Dissemination, University of York
Andrew Long & Gillian Fairfield, UK Clearing House on Health Outcomes,
Nuffield Institute of Health, University of Leeds.99
APPENDIX B: STROKE WORKING GROUP
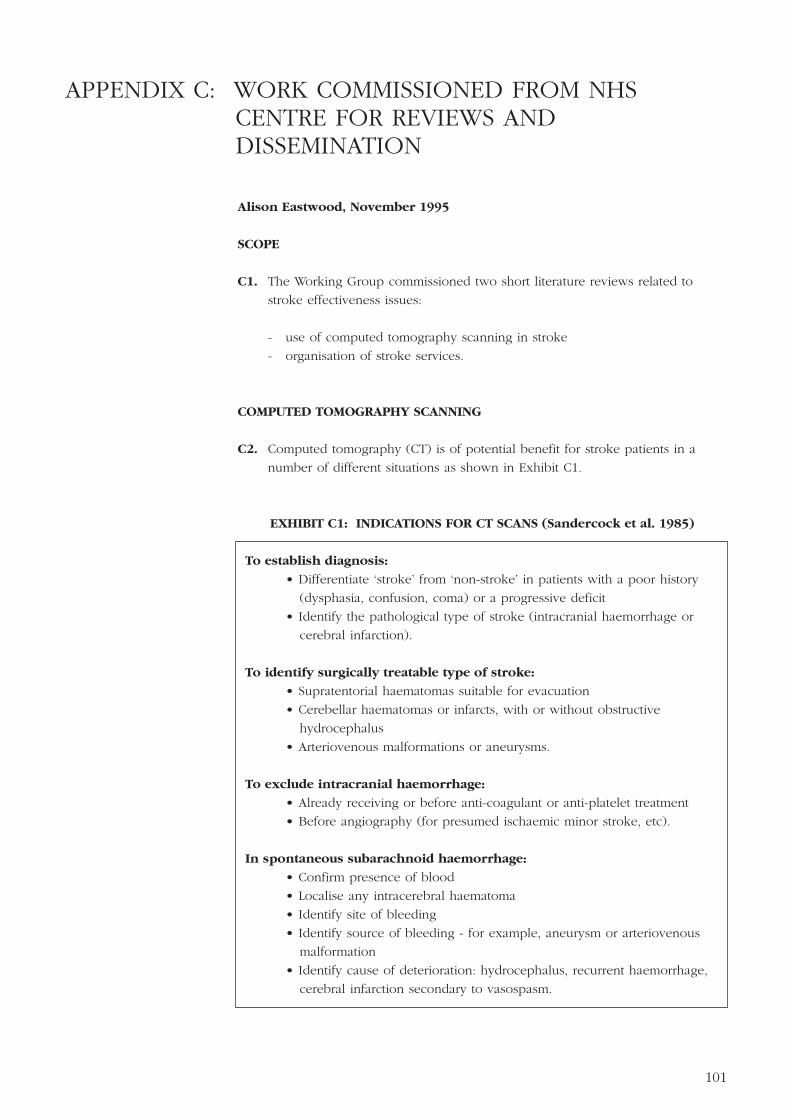
Alison Eastwood, November 1995
SCOPE
C1. The Working Group commissioned two short literature reviews related to
stroke effectiveness issues:
- use of computed tomography scanning in stroke
- organisation of stroke services.
COMPUTED TOMOGRAPHY SCANNING
C2. Computed tomography (CT) is of potential benefit for stroke patients in a
number of different situations as shown in Exhibit C1.
EXHIBIT C1: INDICATIONS FOR CT SCANS (Sandercock et al. 1985)
To establish diagnosis:
• Differentiate ‘stroke’ from ‘non-stroke’ in patients with a poor history
(dysphasia, confusion, coma) or a progressive deficit
• Identify the pathological type of stroke (intracranial haemorrhage or
cerebral infarction).
To identify surgically treatable type of stroke:
• Supratentorial haematomas suitable for evacuation
• Cerebellar haematomas or infarcts, with or without obstructive
hydrocephalus
• Arteriovenous malformations or aneurysms.
To exclude intracranial haemorrhage:
• Already receiving or before anti-coagulant or anti-platelet treatment
• Before angiography (for presumed ischaemic minor stroke, etc).
In spontaneous subarachnoid haemorrhage:
• Confirm presence of blood
• Localise any intracerebral haematoma
• Identify site of bleeding
• Identify source of bleeding - for example, aneurysm or arteriovenous
malformation
• Identify cause of deterioration: hydrocephalus, recurrent haemorrhage,
cerebral infarction secondary to vasospasm.
101
APPENDIX C: WORK COMMISSIONED FROM NHS CENTRE FOR REVIEWS AND DISSEMINATION

C3. It has been argued that for CT scanning to be useful, it needs to take place
about 7-10 days after the onset of acute stroke (Donnan 1992; Wardlaw 1994).
Subtle differences are observable within four hours but are difficult to
interpret, and some infarcts pass through a period of iso-density around day
three hindering CT detection (Donnan 1992). On the other hand, after longer
periods haemorrhages may have resolved, thus appearing identical to infarcts
(Wardlaw 1994). Scans carried out at a later stage may rarely change
management of stroke (Blais 1994).
C4. There are some arguments as to the accuracy of CT scans, regarding false-
negative readings, lesion size, timing of scan and variations in interpretation
(Ebrahim 1990), but the main issue appears to be whether the routine use of
CT scans in stroke is warranted. It is considered to be a safe, straightforward,
repeatable, non-invasive procedure for patients (Blais 1994), with only a small
radiation risk to patients (Wessex Institute of Public Health Medicine 1994).
Estimates of the cost of a CT scan range from £80 (Allison 1994) to £100
(Wardlaw 1994) up to £250 (Ebrahim 1990), excluding capital investment.
Effectiveness
C5. Unfortunately, there is little evidence evaluating the use of CT scans in stroke.
As Ebrahim (1990) noted about the possible indications: ‘The currently
recommended criteria for performing a CT scan are for patients with an
atypical clinical course, young patients, where there is diagnostic doubt, and
when anti-platelet or anti-coagulant therapy is to be started. None of these
criteria are supported by evidence that they lead to benefits that outweigh
costs.’
C6. In her review of stroke, Blais (1994) examined the literature on the use of CT
scanning to confirm diagnosis and found contradictory evidence. Although
some reports emphasised the importance of scanning, others questioned the
cost of acquiring and maintaining equipment to give detailed images when
differentiation between broad stroke causes to define appropriate therapies has
not been shown to influence outcome. Studies which evaluated the benefit of
CT scanning also report varying results. Sandercock and colleagues (1985)
estimated that only in up to 28% of patients with a first stroke did a CT scan
provide useful information. Blais also identified two studies, one of which
(the SEPIVAC Project) reported a high reliability for clinical diagnosis of stroke
with about 1% of cases clinically diagnosed as first-ever strokes having some
other lesion on CT (Ricci et al. 1991). The second study showed no significant
difference in mortality between patients given heparin with CT, confirmed
cerebral infarction, and those given heparin without CT (Sandercock and
Lindley 1993). She concludes that ‘the proportion of stroke patients for which
CT scanning may be required is unclear, the exact proportion depending to a
large extent on whether clinicians plan to use anti-haemostatic agents for
either acute treatment or long-term secondary prevention’ (Blais 1994).102
Stroke Outcome Indicators

Cost-effectiveness
C7. The arguments for the cost-effectiveness of routine CT scanning rests on the
belief that by scanning, bed days and mortality will be avoided. However,
there is conflicting evidence as to whether any such beneficial effects
outweigh the additional costs of introducing routine scanning.
C8. Ebrahim (1990) evaluated the costs and benefits of two policies. One policy
involved CT scanning every patient with a stroke in the United Kingdom, the
other involved giving aspirin to every stroke patient surviving the first month
without using CT scanning. The second policy proves to be more attractive,
both in terms of standard cost appraisal and cost per utility, as the large
scanning costs are avoided and despite the increase in misdiagnosis, a
proportion of the misdiagnosed patients with tumours and subdural
haematomas will be diagnosed eventually without CT. He emphasises the
need to evaluate the impact of CT scanning on the number of lives saved or
disability prevented, as well as the proportion of altered diagnoses or patients
whose management is changed. ‘As a major emphasis in medicine is the art of
diagnosis, it is easy to over-value the importance of altered diagnoses. CT
scanning makes only a small contribution to the diagnosis of stroke from
other conditions that mimic it.’.
C9. Lees (1993) estimates that if aspirin were given indiscriminately without CT
scanning, then 15% of patients would receive aspirin following haemorrhagic
stroke. If aspirin increases the risk of recurrent haemorrhage by 25% in these
patients, this would result in 11 unnecessary strokes per 100,000 population
per year, with an average cost of 30 bed days. This would cover the cost of
performing a CT scan in all patients. However, no references to the source of
his estimates are given. A similar argument is provided elsewhere (Wardlaw
1994). In contrast, Allison (1994) suggests that the costs of CT scanning
outweigh the benefits and advocates the continued use of selective rather than
routine CT scanning in stroke patients.
C10. In a recent costing study (Wessex Institute of Public Health Medicine 1994),
the authors concluded that there was no proof to recommend the routine use
of CT scans in the management of stroke. They attempted to model different
scenarios for scanning patients, and identified the need for further research to
determine the effect of a number of different factors. In particular these
include the increase in risk of cerebral haemorrhage from anti-platelet therapy
in those patients who have had haemorrhagic stroke, and the difference in
benefit of anti-platelet therapy in patients with haemorrhagic or ischaemic
strokes. Until more evidence is available, they suggest the vague
recommendation that CT scans should only be undertaken in patients ‘in
whom the diagnosis of stroke is not certain and in those patients who would
benefit most from intervention with anti-platelet therapy.’
103
Stroke Outcome Indicators

C11. Blais (1994) concludes that: ‘Clinical history and examination are the most
cost-effective investigations of all. Data on the cost-effectiveness of
investigations, including CT scanning and its impact on management of stroke
patients, are scarce.’
ORGANISATION OF STROKE SERVICES
C12. Stroke patients may be treated either in the community or in hospital. Based
on studies throughout the UK from 1970 to 1990, hospital admission rates for
stroke patients vary between 40% and 78% (Blais 1994). There is continued
discussion about the need to admit stroke patients to hospital, but little
evidence exists to aid this debate. The decision to admit will be dependent
on a number of factors, including the severity of the stroke, diagnostic
uncertainty, the need for acute medical treatment and the availability of home
care and domiciliary rehabilitation services. The aim of this section is to assess
the availability of research on the effectiveness and cost-effectiveness of
differing methods of organising stroke services, both in hospital and in the
community.
Hospital based stroke services
C13. In recent years, attention has been focused on the delivery of hospital based
stroke services through a ‘stroke unit’. In a paper describing the development
of stroke units, O’Connor (1994) distinguishes between stroke intensive care
units (SICUs), rehabilitation stroke units (RSUs), and comprehensive stroke
units (CSUs). SICUs ‘were modelled on the existing intensive care and
coronary care units; therefore, as many stroke patients as possible are either
admitted directly or quickly transferred to such units depending on the
availability of beds’. CSUs are aimed towards rehabilitation rather than the
intensive care of a SICU, although patients would be directly admitted to such
units provided their condition was stable. RSUs are units where patients are
transferred after the acute phase. Only those patients likely to benefit from
rehabilitation will be admitted to RSUs thus excluding patients with mild stroke
likely to recover without treatment and those with severe stroke. SICUs were
established in the US, but have not been repeated in this country. When the
first survey of stroke units was undertaken in 1984, 11 units were identified.
In a survey undertaken in 1991, 42 operational stroke units were identified
(excluding five in planning stage and four which were day units only) and
seven units had closed. All of the 34 units that responded to the survey were
RSUs and 16 units were part of another ward or unit while 18 were
administratively separate discrete units.
104
Stroke Outcome Indicators

C14. Ebrahim (1990) notes that plans to develop stroke units were proposed in
1974 by the Royal College of Physicians, but that stroke units have not been
universally established and provide only a fraction of stroke care. However,
they have become a main thrust of research, although their ‘contribution to
improved standards of care for stroke patients is not assessed in any of the
trials established to measure their effects.’
C15. Wade (1994) considered the organisation of services, identifying the difficulty
in disentangling “...the effects of a different organisation from the effects of
different types or amounts of treatment. A further problem is the absence of
any agreement about the meanings of words such as ‘stroke unit’, ‘stroke
ward’, and ‘stroke team’.”
C16. In evaluations of stroke services, there is no clear definition of a stroke unit as
Blais (1994) noted : ‘The definition of a stroke unit ranges from a specialised
multidisciplinary team who provide services wherever a patient is situated to a
geographically defined ward of variable size (10-20 beds) on which care is
provided by a mobile stroke team. Some stroke units care only for patients in
the early stage after a stroke whereas others only accept patients for
rehabilitation. Such models neglect patients who are not admitted to hospital.
A multidisciplinary approach and a well-organised mode of delivery of
services are common features of stroke units.’
C17. In the Cochrane Collaboration systematic review of stroke units (Stroke Unit
Trialists’ Collaboration 1995), the definition developed by Garraway (1985) is
used: ‘a multidisciplinary team of specialists who are knowledgeable about the
care of the stroke patient and provide care for such patients’. These criteria
are applied to either a mobile stroke team or a geographically defined stroke
ward.
C18. Six reviews have looked at stroke unit evaluations. Ebrahim (1990) identified
four trials evaluating stroke units in comparison with usual medical ward care.
He combined the studies and found that stroke unit care produced a 1.6 times
better early outcome than medical unit care. Late outcomes were also
improved in stroke units, but the result was not statistically significant,
probably due to the small sample size of most trials. The author notes that
‘stroke units may have only a limited impact on motor impairment and
disability, the bulk of improvement being due to spontaneous recovery, but
might be expected to have a major effect on handicap, quality of life of
partner and family, and adjustment to disability. No recent studies have
examined such possibilities’. Ebrahim (1990) also noted that ‘the educational
and research benefits of stroke units have not received any formal evaluation’.
105
Stroke Outcome Indicators

C19. Langhorne et al. (1993) undertook a meta-analysis of 10 randomised controlled
trials (1586 patients) treated in stroke units or general wards. They found a
28% reduction in mortality within the first four months which persisted to 12
months, and concluded that the management of patients in a stroke unit is
associated with a reduction in mortality. This was not accompanied by an
increase in morbidity, but analysis of functional outcomes was limited by the
lack of consistent data between studies.
C20. This review has subsequently been expanded by a systematic review of
specialist multidisciplinary team care for stroke inpatients (Stroke Unit Trialists’
Collaboration 1995). Twelve published and six unpublished randomised
controlled trials were identified which compared a treatment group receiving
specialist care compared with controls receiving routine care in general wards.
Specialist in-patient care was associated with a reduction in both the odds of
death and of poor outcome at final review compared with routine care. The
authors concluded that stroke patients managed within specialist units
compared to general medical wards are more likely to be alive and living at
home a year after stroke. There is no evidence that stroke unit care increases
the time spent in hospital.
C21. As part of the Stroke Unit Trialists’ Collaboration, Langhorne (1995) surveyed
the characteristics of the stroke units in the randomised controlled trials
identified in the meta-analysis. A number of characteristics were found which
were significantly more frequent in stroke units compared to general wards:
- multidisciplinary team care with regular team meetings
- nursing expertise in rehabilitation
- the routine participation of carers in the rehabilitation process
- regular stroke education for both staff and carers.
C22. As part of an overview of stroke for Northamptonshire Health Authority, Blais
(1994) evaluated models of health care for delivering stroke services. She
concluded that ‘...Stroke units could achieve an earlier start to rehabilitation
therapy, a more rapid recovery, and in some cases improve function and
survival, but there is conflicting evidence about the long-term effects. No firm
conclusions can be made at this stage as it is still unclear whether it is the
overall organisation or certain components that improve patients’ outcomes.’
C23. In a systematic review of the literature on stroke rehabilitation (Effective
Health Care 1992), studies evaluating stroke units of various descriptions were
examined. Conflicting results were found, although some studies were less
reliable than others. They concluded that well organised multidisciplinary
rehabilitation yields a more rapid rate of recovery, but the evidence of long-
term effects is unclear.
106
Stroke Outcome Indicators

C24. Wade (1994) reports on studies evaluating stroke units and wards, identifying
the problems of comparability of studies and the conflicting evidence. He also
examined the US literature on stroke intensive care units (SICUs), but found
no evidence to justify their introduction. O’Connor (1994) describing the
development of stroke units in the UK found that SICUs which evolved in the
US have not been developed in this country.
C25. Ottenbacher and Jannell (1993) carried out a meta-analysis of 36 trials of
various design (3,717 patients) evaluating the effectiveness of stroke
rehabilitation programmes. They found that the average patient receiving
focused stroke rehabilitation performed better than about two thirds of
comparison group patients. Importantly, they also found that there was a
significant interaction between research design and the blinding of outcome
measures, and identified the need to ensure blind reporting of outcome
measures, particularly for non-randomised comparisons. They conclude that
the improvement in functional performance appeared to be related to early
initiation of treatment, but not to the duration of intervention. Improvement
was also associated with patient’s age (with younger patients doing better than
older), as well as study design (with less rigorous studies reporting greater
improvement). This study highlights the need to ensure good quality research
design, including blinding and outcome measurement. However, it is now
problematic to consider the use of a randomised controlled trial to evaluate
the effectiveness of a stroke unit against standard care, due to ethical
considerations. Although there is insufficient evidence to support the
widespread introduction of stroke units, there would appear to be a general
consensus that an organised multidisciplinary approach to care is beneficial.
C26. There is little evidence on the costs of stroke units and Blais (1994) concluded
that ‘cost-benefit analyses of stroke units are not easy to perform and have
not been done. At present, we are unable to compare the relative benefits of
stroke units with other forms of care because we lack a useful common
measure of health and an adequate knowledge of the costs of the services.’
In his overview, Wade (1994) identifies a randomised controlled trial of a
Norwegian stroke ward which was cost-effective in comparison with general
medical ward care. There is also evidence that rehabilitation costs may not
differ significantly for a stroke unit compared to a general medical ward
(Effective Health Care 1992).
Community based services
C27. There are two aspects to community services, firstly the care of stroke patients
in the acute phase and secondly the provision of community based
rehabilitation services. For both aspects there is limited evidence on
effectiveness. Blais (1994) was unable to discover any studies assessing the
effectiveness of acute home care for stroke patients and their families. She
107
Stroke Outcome Indicators

identified two randomised trials looking at domiciliary and hospital-based
rehabilitation for stroke patients, which found domiciliary-based care to be as
effective or lead to better functional outcome than hospital-based care. There
is some evidence that community provision of rehabilitation is effective,
although such provision is not necessarily associated with a reduction in
hospital use, and can be an emotional burden on carers (Effective Health Care
1992). Observational studies have reported equivalent or improved physical
independence for patients treated at home. However, a controlled trial
evaluating additional home care services found no reduction in hospital
admission rates, length of stay, or increased independence. A comparison of
domiciliary care and out-patient attendance found domiciliary therapy more
effective at improving mobility (Wade 1994).
C28. Blais (1994) identified two Scottish schemes co-ordinating services for
discharged patients through a member of the hospital stroke team working in
the community. These schemes are currently being evaluated. There are a
couple of on-going randomised trials which will provide evidence on the
comparison of stroke units, hospital and community stroke teams, and also on
the effectiveness of normal discharge compared to community team or hospital
outreach (Langhorne, personal communication).
Conclusion
C29. There is insufficient evidence to support the effectiveness of any one specific
organisational method of stroke care. There is no agreed definition of a stroke
unit, or what it should entail, and consequently studies evaluating specific
interventions are difficult to compare in detail as the components of the
interventions vary. Despite these limitations, evidence from trials suggests that
‘stroke units’ lead to more rapid recovery in the short-term. However, there is
conflicting evidence for sustained improvement in the long-term. Early and
co-ordinated rehabilitation appears to provide benefit, without necessarily
increasing the amount of therapy given in total.
C30. In summary, the available evidence points towards the improved
effectiveness of a co-ordinated multidisciplinary team to deliver stroke care. It
is also likely that the process of setting up such co-ordinated approaches to
care will require the participation of enthusiastic professionals with expertise
in the area, and it may well be the presence of such individuals which will
produce the greatest impact on the effectiveness of any given method of
organisation.
108
Stroke Outcome Indicators

D1. Candidate outcome indicators were identified by the Group with the help of
the following:
- the health outcome model for stroke (see Section 2)
- various classifications of the characteristics of outcome indicators.
D2. The Group noted that indicators may be related to:
i. environmental factors in the general population or relating to the
individual
ii. knowledge, attitudes, behaviour in the general population
iii. knowledge, attitudes including satisfaction with service delivery,
behaviour of individual patients with stroke
iv. patients’ symptoms, function, health status, well-being
v. patients’ clinical state
vi. patients’ pathological/physiological state
vii. events occurring to patients as the endpoints of earlier occurrence of
disease and/or interventions such as contacts with general practitioners,
issuing of prescriptions, out-patient visits, in-patient admissions and death
viii. knowledge, satisfaction with services delivery, emotional and physical
well-being of carers.
D3. The data sources for the indicator entities noted in paragraph D2 will differ.
It is likely that:
- indicators for (i) and (ii) would come from population surveys
- indicators for (iii), (iv) and (viii) would come from patients and carers
either opportunistically or when specifically called
- indicators for (v) and (vi) would come from doctors and other health
professionals
- indicators for (vii) would come from administrative information systems.
D4. The Group recognised the high cost and complexity of obtaining information
from continuous data collection systems. Particular consideration was given to
obtaining outcome indicator data from sample survey techniques such as a
periodic survey when it is not essential to have continuously collected
information.
D5 Four characteristics of an outcome indicator have been identified and each has
been classified. They are:
- measurement perspective, relating to whose perspective the indicator is
most relevant (see paragraph D6)
- specificity (see paragraph D7)
- measurement timeframe (see paragraph D8)
- outcome relationship, in that the indicator is either a direct or an indirect,
proxy measurement of outcome (see paragraph D9).109
APPENDIX D: METHODS FOR CHOOSING CANDIDATE INDICATORS

D6. For the Group’s purposes measurement perspective was classified as that from
the patient’s, the carer’s, the clinical, or the population’s viewpoint. In the
treatment of stroke, for example, a measure of quality of life may be most
relevant to the patient’s perspective while clinical concerns may properly focus
on measures of urodynamics. The population perspective has a broader view,
best addressed by measures able to assess the burden of the condition as a
whole. Of course, these perspectives are not necessarily in opposition and will
often be associated with shared goals. Where possible, a set of indicators
should be developed which satisfies all of these measurement perspectives.
D7. The specificity of an indicator relates to whether it is specific or generic in
application. For example, mapping of neurological impairment is specific to
neurological function. The measurement of blood pressure is much less
specific and would be influenced by a number of conditions. Condition-
specific indicators have the advantage that their relative insensitivity to other
conditions is likely to increase their sensitivity to changes in the condition of
interest. Generic measures provide outcomes relevant to a wide range of
conditions. A comprehensive indicator set might contain examples of both
generic and specific indicators.
D8. The measurement timeframe relates to whether the indicator is:
- cross-sectional and thus an indicator at a single point in time for any one
individual
- a longitudinal measure of progression over time for any one individual.
D9. The Group’s main task has been to develop direct indicators of health
outcome although in many areas it may be difficult to identify or obtain such
information. However, it is recognised that some care processes are so closely
related to the production of benefits that the successful completion of the
intervention might be used as a proxy measure of the actual outcome. In the
absence of direct outcomes, proxy indicators have therefore been developed.
D10.There is increasing recognition of the importance of outcome measures
derived from data generated by patients and carers. For the purposes of our
work, three main areas of interest have been identified:
- impact of the condition on the patient and/or carer
- satisfaction of the patient and/or carer with the care provided and/or
outcomes achieved
- awareness of the patient and/or carer of the management of the condition.
110
Stroke Outcome Indicators

D11.The condition may impact on the patient in terms of:
- general health
- specific impairments associated with the condition
- disabilities
- handicaps.
D12.The condition may impact on carers in terms of their:
- physical health
- psychological health
- social functioning.
D13.With the assistance of the check-lists and a knowledge of the disease
supplemented by commissioned work, the Group addressed the following key
questions:
- What are health professionals trying to achieve for each patient?
- What can each patient realistically expect will be achieved for him/herself?
- What should be achieved for the population as a whole in respect of the
prevention, care or cure of the disease?
111
Stroke Outcome Indicators

A short title to identify the indicator
Distinguishes the level of intervention for which the indicator is primarily
developed. It is assumed that, for a given condition, an ideal set of indicators
would be reasonably balanced across the spectrum of health intervention stages.
For stroke these stages are:
- reduce or avoid risk of first stroke
- reduce death from stroke
- reduce/avoid complications from stroke
- reduce or avoid risk of subsequent stroke
- improve function and well-being after stroke:
• reduce impairment
• reduce disability
• reduce handicap
• support carers.
Classifies the indicator on four dimensions:
- Specificity: condition specific or generic.
- Perspective: population, clinical or patient.
- Timeframe: cross-sectional measure or longitudinal assessment of change.
- Outcome relationship: whether it is a direct measure of outcome or an indirect
measure of structure or process, used as a proxy for outcome.
In addition to a definition of the variable of interest, the description specifies:
- how the variable is to be aggregated across cases, e.g. definitions of both a
numerator and a denominator
- if a variable is to be reported with respect to a set of denominators, e.g.
mortality broken down by age and sex
- if appropriate, how longitudinal change in the variable is to be
represented, e.g. over what time interval and whether absolute difference or
proportional change.
A brief statement of the reasons and objectives behind the indicator, both in terms
of the issues it addresses and its selection from a range of potential alternatives.
A single definition of stroke has been used as identified in paragraphs 2.1 to 2.4. Its
application is affected by the rationale, location of incidence and data sources used
and these factors are addressed in each indicator definition.
The following classification has been used:
- local management of practice
- local audit
Indicator title
Intervention aim
Characteristics
Indicator definition
Rationale
Stroke definition
Potential uses
113
APPENDIX E: GUIDANCE NOTES FOR INDICATOR SPECIFICATIONS

- provider based comparisons
- population based comparisons
- assessment of regional/national trends or progress towards targets.
It is recognised that a given indicator may serve several purposes. Indicators that
are valuable for the management of individual patients are likely to have practical
advantages with respect to data collection in a clinical setting. However, in order for
such indicators to be useful for other purposes, a method of aggregation across
cases must be specified for the variable of interest.
The following classification has been used:
- national/regional policy makers
- provider management
- commissioners
- clinicians
- consumers/public.
This section has attempted to identify the population risk factors likely to influence
the outcome indicator, and therefore useful in its interpretation. Where such factors
are well defined and have a clear or potential association with the outcome of
interest, they may be used to specify denominators to be included in the indicator
definition itself.
Where possible, existing sources of data have been identified for deriving the
indicator and the degree to which complete coverage of the population of interest
would be obtained has been noted. Where data are not widely available from
existing systems, suggestions for new methods of data collection, capable of wide
implementation have been made.
While the theoretical capabilities of existing and proposed information systems are
outlined above, the actual or expected limitations of those systems - in terms of
their completeness and accuracy etc. - are noted in this section.
General comments regarding the indicator’s definition, validity, practicality etc.
Suggestions about the additional research and development work required to
complete the indicator’s specification to a level appropriate for large scale piloting.
A statement indicating the Working Group’s assessment of the priority for
implementation.
Appropriate references used in the construction of the indicators.
Potential users
Possible confounders
Data sources
Data quality
Comments
Further work required
Conclusions & priority
References
114
Stroke Outcome Indicators

Gillian Fairfield and Andrew Long, May 1996
SCOPE
F1. The Working Group commissioned three short literature reviews related to
stroke health outcome measures:
- overview of stroke outcome measures
- measurement of longer term outcomes of stroke
- measurement of impact of stroke on carers.
OVERVIEW OF STROKE OUTCOME MEASURES
Introduction
F2. The range of outcome measures available were identified from three main
sources:
- Measurement in Neurological Rehabilitation (Wade 1992)
- Literature from UK Clearing House on Health Outcomes
- Literature searches of the Medline (1991-5) and Cinahl (1982-95) data bases
searching for key words, CEREBROVASCULAR DISEASE, OUTCOMES,
MEASURES, INSTRUMENTS, QUALITY OF LIFE. The search was confined
to abstracts only in the English language.
F3. The review covered published literature only. It did not include measures:
- used in routine practice
- under development
- not mentioned in abstracts.
F4. The outcome measures identified were classified primarily according to the
WHO model of impairment (ICIDH model) as related to:
- impairment
- disability
- handicap
- multidimensional.
F5. In addition outcomes were included which are related to:
- prognosis
- adverse reactions or complications
- patient/carer satisfaction and expectations
- clinical processes.
115
APPENDIX F: WORK COMMISSIONED FROM UK CLEARING HOUSE ON HEALTH OUTCOMES

Available measures
F6. A summary of available outcome measures is shown in Exhibit F1.
F7. The main outcome measures used in published controlled trials of
rehabilitation effectiveness are shown in Exhibit F2.
F8. The most commonly noted outcome measures used in research are
summarised in Exhibit F3.
Summary of main points
F9. In reviewing the types of measures available it should be noted that:
- measures of impairment and disability predominate as they are relatively
easy to measure
- handicap is a complex concept relevant to individuals with no absolute
against which to measure
- although disability and handicap are more relevant to outcome, measures of
impairment which are usually disease specific, such as the severity of a
stroke, may be required to interpret them
- some measures of disability also measure handicap
- proxy measures of outcome are often used but more work is needed to
determine the link between process and outcome.
116
Stroke Outcome Indicators

EXHIBIT F1 : AVAILABLE OUTCOME MEASURES
Outcome Classification Examples
IMPAIRMENT Arousal Glasgow Coma Scale
Motor Ashworth scale, MRC grades, Motricity Index, Motor club assessment, Fugl-Myer assessment
Sensory Clinical
Cranial nerves Swallowing, visual acuity, hemianopia
Cognition PASAT (attention and information processing), BIT (neglect), FAST (aphasia), PICA (communication), RPAB, RBMT (new memory), MMSE (orientation language), CAPE (orientation and learning), BDEA (communication), Weschler Adult Intelligence scale.
Psychological GHQ, HAD, Wakefield self assessment depression inventory, Beck inventory, Hamilton inventory
Severity NIH, Canadian, Orgogozo, Scandinavian stroke scales, Hemispheric scale
DISABILITY Physical ADL Activities of daily living (in excess of 40 interaction identified), Barthel ADL Index, Gait speed,(mobility and Functional Ambulation Categories, FAT (proximal personal care) control and dexterity), NHPT (manual dexterity)
Psychological Hodgkinson Mental test, RBMT, FASTinteraction
Global disability Extended ADL e.g. Nottingham. ADL, Rivermead ADL (RMI), Frenchay Activities Index, OPCS disability scales, FIM
HANDICAP Orientation, NHP, Rankin Score, Life Satisfaction Index, FAI, mobility, Nottingham EADL, Jeffrey’s measurement, Edinburghdependence, Rehabilitation Status Scale, Functional Autonomyself sufficiency, Measurement, London Handicap Scale, Oxford occupation, Handicap Scale, WHO handicap scalessocial integration
MULTI-DIMENSIONAL Global outcome NHP, Quality of life well being scale, SF-36,Quality of life Life satisfaction index, HOI-Type Stroke scale, SIP
OTHER Prognostic Incontinence, conscious level, Allen Scoreoutcomes
Negative Mortality, complicationsoutcomes
Patient carer Pound questionnaire, Caregiver strain index,satisfaction, CHIPS, Kellner’s Questionnaireexpectations etc.
Process (proxy) Key worker, stroke register, re-admissions,
outcomes Discharge destination, number of patients on aspirin
BDEA Boston Diagnostic Aphasia Examination BIT Behavioural Inattention TestCAPE Clifton Assessment Procedures for Elderly CHIPS Cohen, Hoberman Inventory EADL Extended Activities of Daily Living FAI Frenchay Activities IndexFAST Frenchay Aphasia Screening Test FAT Frenchay Arm TestFIM Functional Independence Measure GHQ General Health QuestionnaireHAD Hospital Anxiety and Depression Scale MMSE Mini Mental State ExaminationNHP Nottingham Health Profile NHPT Nine Hole Peg TestPASAT Paced Auditory Serial Addition Test PICA Porch Index or Communicative AbilityRBMT Rivermead Behavioural Memory Test RPAB Rivermead Perceptual Assessment BatterySIP Sickness Impact Profile
117
Stroke Outcome Indicators

EXHIBIT F2 : MAIN OUTCOME MEASURES USED IN RANDOMISED
CONTROLLED TRIALS OF ACUTE STROKE AND REHABILITATION
UNITS (n=18).
Impairment Disability Handicap Generic Othermulti-
dimensional health
profiles
Neuromuscular deficit (n=2) ADL n=6 NHP n=1 NHP n=1 DischargeNeurological deficit score n=1 Barthel ADL n=9 Rankin disability destinationMotor function n=1 Rankin disability n=1 n=5Wakefield depression inventory scale n=1 FAI n=3 Mortality =5n=1 FAI n=3 Onset ofGHQ for carers n=2 FAC n=2 therapy n=1Sensory loss n=1 Motor club ComplicationsDepression n=1 assessment n=1 n=1Dysphagia n=1 Motricity index Length of stayGait speed n=1 n=2 n=4HAD scale n=1 FAT n=1 Follow upFunctional communication NHPT n=2 appointmentprofile n=2 Rivermead motor given n=1PICA porch index of assessment n=1 Use of hospitalcommunicative ability n=3 Rivermead mobility services n=1BDEA n=1 index n=1Hodgkinsons Mental test n=1
With the exception of the BDEA and PICA the outcome measures were only used up to one year.
EXHIBIT F3 : COMMONLY USED OUTCOME MEASURES IN RESEARCH
Mortality Geriatric Depression ScaleBarthel index Mental Test ScoreOther ADL Motricity IndexFunctional Independence Measure NIH stroke scaleNottingham Health Profile Hamilton Depression ScaleRankin Scale General Health QuestionnaireFrenchay Activities Index Sickness Impact ProfileScandinavian Stroke Scale Discharge destination
118
Stroke Outcome Indicators

MEASUREMENT OF LONGER TERM OUTCOMES OF STROKE
F10. Stroke illustrates well the complexity of monitoring outcomes for a condition
that runs a chronic course. For many patients stroke is a permanent feature of
their life from which they cannot escape. ‘For a patient, the most important
aspect of his disease is not the grade of hemiparesis as such but his ability to
perform daily activities and to fulfil social roles’ (Haan et al. 1993b). Long-
term outcomes of psychological well-being, quality of life and handicap must
be considered. Yet there is no consensus on the best way to do this. In
addition, the longer term effects of multidisciplinary rehabilitation versus
medical care have not been demonstrated. Evans et al. (1995) in their meta-
analysis of the long-term benefit of short term rehabilitation on survival or
functional ability showed that without continuation of therapy the initial
benefits of rehabilitation were not sustained.
F11. The aims of this section are to:
- clarify the nature of quality of life, long-term disability and handicap in
relation to stroke
- suggest which of these areas are most relevant to measure
- outline and review the available measures
- suggest a range of possible outcome indicators for the long term outcomes
of stroke.
Defining terms
F12. Within the WHO ICIDH classification, disability is defined as a restriction or
limitation in the ability to perform a normal activity, and handicap as a
disadvantage resulting from impairment or a disability that limits or prevents
the fulfilment of a social role that is normal for that individual. Long-term
disability may or may not result in handicap, depending on the formal (health
and social care) and informal (carer) support available to the individual. It is
not only the presence or absence of disability and/or handicap that matters,
but also its magnitude and perceived significance. The latter depends on the
physical, social and economic setting and available resources (Cole et al.
1995).
F13. While the notion of health related quality of life (HRQL) has emerged as a key
concern for policy makers, health professionals and researchers, confusion
remains over its definition, dimensions, ways to arrive at an overall quality of
life, and its relationship with other health and life experiences (Ebrahim 1995).
Patrick and Erickson’s (1993) definition illustrates its possible scope: ‘Health
related quality of life is the value assigned to duration of life as modified by
the impairments, functional states, perceptions and social opportunities that
are influenced by disease, injury, treatment or policy.’
119
Stroke Outcome Indicators

F14. In this way, HRQL can be perceived as the final effect of impairment, disability
and handicap, with health perceived three dimensionally as physical, social
and mental well-being. Common dimensions explored include: physical
functioning, psychological functioning, social interaction, sexual functioning
and spiritual and economic aspects.
Deciding what to measure
F15. In considering the long-term outcomes of stroke, or indeed for any chronic
condition, the question to be addressed is: is it more appropriate to measure
quality of life, or handicap, or both? In addition, long-term disability, in terms
of its consequences and impact on the user, can usefully be perceived as
inextricably intertwined with handicap, and a necessary part of the
measurement of handicap.
F16. Six basic ‘survival roles’ are outlined in the ICIDH classification in its handicap
section (Harwood et al. 1994a). These define disadvantage in terms of:
- orientation including sight, hearing and cognition
- physical independence
- mobility, the distance one can move from one’s bed
- occupation including employment, house work and recreation
- social integration and economic self-sufficiency including the ability to earn
an income and the possession of resources to enable problems to be
overcome.
F17. These roles complement the seven dimensions for the assessment of elderly
people (Royal College of Physicians and British Geriatric Society 1992),
namely:
- activities of daily living
- mental health functioning
- psychological functioning
- physical health functioning
- social resources
- economic resources
- environmental resources.
All are important, related to handicap and are constituents of quality of life.
F18. There are three possible approaches to measuring long-term outcomes of
stroke relating to:
- overall quality of life
- global handicap
- the individual components of handicap.
120
Stroke Outcome Indicators

Measuring quality of life
F19. In a recent review, Gill and Feinstein (1994) identified 159 different
instruments of quality of life. Despite recognition of the subjective and
personal nature of quality of life, the measures had varying bases in a user’s
perspective. As the authors comment, quality of life can be suitably measured
only by determining the opinions of users, and “supplementing or replacing
the authoritative opinions contained in statistically ‘approved’ instruments.”
The schedule for the evaluation of individual quality of life (SEIQoL) (McGee
et al. 1991) and the patient generated index (PGI) (Ruta et al. 1994) are
examples of such an approach. An alternative, although somewhat crude and
simplistic, is to ask the question: ‘how would you rate your present quality of
life?’ (Haan et al. 1993b).
F20. Much recent interest has lain in the potential of multi-dimensional health
profiles (MDHPs) such as the SF-36, the Nottingham Health Profile or the
EuroQol. They are properly described as profiles in that they:
- collect information on several aspects or dimensions of health status and
health related behaviour in a single instrument
- are intended to cover a range of topics which is not specific to any one
patient or population group
- present the results for each aspect separately, not as some overall index of
health.
F21. A list of those in common use are shown in Exhibit F4. MDHPs differ in both
the dimensions they cover and the way these are defined. For example, the
NHP asks people whether they have any of 38 problems, irrespective of
whether or not these are due to ill-health. The SF-36 takes different
approaches to different topics. While self-reported general health and mental
health are measured directly, the bulk of the questionnaire is concerned with
the impact of health and illness on physical function, mobility and social
activities. The EuroQol is predominantly designed to return a single value
for health, but can be used as a six-dimensional profile.
F22. In the context of stroke, Haan et al. (1993a) reviewed 10 ‘quality of life’
instruments (in fact, MDHPs). They note the wide range of domains explored
(a valued aspect) and the length of the instruments (a problem, raising the
question of their impracticality for use within routine practice, and even within
clinical trials). Furthermore, more information is needed on the
responsiveness of the instruments to patient and clinically significant change
over time.
121
Stroke Outcome Indicators

EXHIBIT F4 : MULTI-DIMENSIONAL HEALTH PROFILES:
ITEMS AND DIMENSIONS
Name of instrument No. of No. of scoreditems dimensions
Duke - UNC Health Profile 63 4
Duke Health Profile (17 item selection 17 4from Duke-UNC Profile) (6)
Nottingham Health Profile Part I 38 6
Sickness Impact Profile and Functional 136 12Limitations Profile (UK version of SIP) (2)
Dartmouth Co-op Function Charts 9 9
McMaster Health Index Questionnaire 68 3
Medical Outcomes Survey (MOS) 149 35Full 149 item “Functioning (8)and well being profile”(FWBP)
MOS FWBP - C (Condensed version 113 20of full instrument) (4)
MOS Short Form - 36 item instrument 36 8/9
MOS Short Form - 20 item instrument 20 6
MOS Short Form - 6 item instrument 6 6
EuroQol (6 item profile) 6 5/6
122
Stroke Outcome Indicators

Measuring global handicap
F23. Five measurement scales are available and they are shown in Exhibit F5. As
Harwood et al. (1994a) comment, the SMAF approach, identifying disabilities
which are not compensated for by aids or assistance, is attractive. Care must
however be taken in interpreting its results across settings and populations to
allow for variations in the availability, acceptability and accessibility of services
to alleviate disabilities. In general, it is important to describe individuals’
own situation, as they or their carers perceive it, and assess their satisfaction
with this state of affairs (thus, for example, the London Handicap scale).
EXHIBIT F5 : MEASURES OF HANDICAP (Harwood et al. 1994a)
Measures Key features
Modified Rankin scale Derived from the Rankin disability scale;
many descriptors are still of disability
rather than handicap; focus on physical
independence
Jeffreys measure Used in community surveys
Functional Autonomy Measurement Estimates handicap by identifying
System (SMAF) disabilities which are not compensated
for by aids or assistance
Edinburgh Rehabilitation Status scale A measure of medico-social dysfunction;
focus on dependency, activity, social
integration, and effect of symptoms on
lifestyle
London Handicap scale Based on the 6 ICIDH survival roles;
weightings derived from a sample and
applied to the six dimensions to obtain an
overall value
Measuring the individual components of handicap
F24. The individual components of handicap include:
- long-term disability
- mental health and psychological functioning
- physical functioning
- social functioning
- economic functioning and environmental support.
123
Stroke Outcome Indicators

F25. Measures of disability emphasise the functional dimension of health. The
Index of Independence in Activities of Daily Living (ADL), the full name of
what is now commonly called Activities of Daily Living scales, and functional
assessments are primary criteria used to determine eligibility for services whilst
bearing little relationship to actual need.
F26. ADL scales have been widely reviewed and are in common use, the most
frequent being the Barthel Index or derivatives. Wade and Collin (1988) found
the Barthel Index to be valid, reliable, responsive to change and as good as
any other single index as a measure of physical disability. However,
Wellwood et al. (1995a) found that it may underestimate patient and carer
problems by up to 30%. For measuring long-term disability, it is important to
address not only the personal activities of daily living (washing, dressing etc.)
but also the more complex activities required to live in the community (walk
outdoors, cook, manage a household, do the shopping). This suggests the
need to use an extended ADL scale (Gladman et al. 1993).
F27. Mood disorder, in particular depression, may be a specific complication of
stroke (Folstein and Maiberger 1977). In the early weeks following a stroke
depression may be as high as 22-27% (Robinson et al. 1983). The prevalence
falls only slightly over the next six months (Robinson and Price 1982).
Problems in defining depression make it difficult to identify who is depressed
and depression is also under-diagnosed. Carers’ mental and psychological
function is related to stroke patients’ mental health. Depression is also related
to the patient’s perception of support from key relationships.
F28. There are many available measures for mental health and psychological
functioning. In the Perth community stroke study, the General Health
Questionnaire (GHQ) was found to be the best screening instrument (Johnson
and Buevill 1995). However, use of the GHQ as part of routine practice for
stroke patients may be too time consuming. An alternative is to ask a single
question such as ‘have you felt depressed over the last two weeks?’ This may
provide a simple initial indicator, followed up as appropriate by use of a
standardised measure.
F29. In addition to measuring long-term disability, it may be appropriate to assess
physical functioning, building on the approach adopted in the health checks
for people over 75 (Williams and Wallace 1993).
F30. It is well recognised that social networks have beneficial effects (Wenger
1992). There are available measures but it is unclear which parts of the
network are important for the user. Access to support and services is an
essential element.
124
Stroke Outcome Indicators

F31. Receiving services and benefits that patients require and are entitled to is
essential to reduce handicap and improve quality of life. No measures are
available. A process measure - assessment of need for and receipt of
information and services - may be used.
Case-mix confounders
F32. Care must be taken in interpreting measures and indicators on long-term
disability and handicap. Possible case-mix variables include:
- initial severity following the stroke
- initial incontinence
- patient and carer attitudes and beliefs about the condition, disabilities and
recovery potential
- other co-morbidities.
Conclusion
F33. Measuring the long-term outcomes of stroke in terms of quality of life,
disability and handicap is a complex issue. Use of the ICIDH classification
provides an appropriate way to explore and measure quality of life rather than
the use of available MDHPs. Global measures of handicap may be difficult to
interpret, confusing the relative importance of their individual components.
Measuring each separately has the advantage of clarity. It is essential to
uncover the users’ and carers’ perceptions and assess their satisfaction with
the processes of care, information provision, services and support.
F34. Measuring long-term disability and handicap provides an indication of genuine
attention to the patients’ experience of illness and on how it affects their
everyday activities and social role. A service focused on preventing and
caring for those with long-term disability and handicap represents a service
focused on long-term patient/carer outcomes.
MEASUREMENT OF IMPACT OF STROKE ON CARERS
Introduction
F35. The role of the informal carers of stroke patients is poorly recognised.
At present there is no framework to assess the outcomes of caring for carers
in a way that is sensitive, systematic and effective. Most importantly there is
no framework in place to do anything with the information if and when it is
obtained.
125
Stroke Outcome Indicators

F36. The aims of this section are to:
- explore the nature of caring and carers
- summarise the literature on the impact on carers of caring for someone
with a chronic illness, with particular reference to stroke
- suggest areas of carer outcome for closer consideration
- outline available outcome measures for assessing the impact of caring
- suggest a range of possible outcome indicators for the carers of stroke
patients.
What is a carer?
F37. There are several definitions of a carer:
- ‘Anyone who looks after or cares for a handicapped person to any extent
in their own home or elsewhere’ (Equal Opportunities Commission 1982).
- ‘A person looking after or providing some form of regular service for a sick,
handicapped or elderly person living in their own or another household’
(Green 1988).
F38. Both the quoted definitions belie the complexity of caring. In their valuable
paper Nolan et al. (1995) outline multiple definitions and models for the
meaning of caring. These try to separate out the different components of
caring such as issues of support, help, protection, social dynamics, the
complex emotional/affective components and the physical and behavioural
aspects (Quereshi 1986; Pearlin et al. 1990). What emerges is that caring
comprises all of these dimensions as well as the practical day to day care
giving. Attention in any measurement process should not be given solely to
the physical aspects of caring at the expense of these other aspects.
F39. Bowers (1987) has proposed that caring should be purpose orientated rather
than task orientated and suggested that there are five types of care:
- anticipatory care, based on anticipated future need
- preventive care, monitoring at a distance
- supervisory care, direct help with activities
- instrumental care, doing activities for the cared for
- protective care, maintaining the self esteem of the cared for person by
minimising their awareness of failing abilities and maximising the extent to
which they perceive themselves independent.
126
Stroke Outcome Indicators

F40. Nolan et al. (1995) add three further types:
- preservative care, preserving the cared for persons sense of ‘self’
- (re)constructive care, developing new and valued roles
- reciprocal care, receiving help from the cared for at the financial, material
and psychological levels and including the satisfaction of caring.
F41. Much of a carer’s role is invisible, which has implications for the latent needs
and outcomes of carers. Anticipatory and preventive care do not involve direct
help and as such may not come to the attention of the health and social
services. However, both have a considerable effect on the carer’s life. Recent
research on carer stress (Nolan et al. 1994) has shown that physical caring
tasks are poor predictors of carer stress, and that relationship and social issues
are more important. Instrumental and supervisory care are also perceived by
carers as the least stressful aspects of caring with protective care being most
stressful. Any examination of the carer’s perspective on outcome must
therefore, recognise the different types of caring role, its (in)visibility and
associated impact on the carers.
F42. The manner in which someone becomes a carer is of importance and depends
on the type of illness the patient suffers. Some carers, for example those
caring for the terminally ill, become carers slowly while others, as in the case
of stroke, may become carers overnight with no time for preparation. With the
tendency to early discharge or home care a carer may have little or no time to
prepare for their new role. They may have little understanding or knowledge
of the illness and their ability to assimilate information at a time of crisis is
likely to be diminished. Both the ability and willingness of a carer to care is
important to establish at an early stage. Carers may have to make important
decisions while learning new skills and must be supported both
psychologically and practically. It has been noted that professional
consultation with carers is very often lacking and that the carers often lack
knowledge about both the illness and services available (Norman 1987).
F43. Carers need (sufficient) information about the illness, its progress and
prognosis, together with information about appropriate services and voluntary
agencies. They may also need practical skills training. For example, the carer
of a stroke patient may need instruction on lifting techniques, ways to
communicate with the stroke patient and exercises to do with the patient. As
Nolan et al. (1994) point out, establishing the ground rules from the outset
should be seen as an investment in the future and adopted as minimal good
practice. It must be remembered that carers needs are ongoing and
continually evolving, hence their information and skill requirement must be
reviewed. Whilst the emphasis of community care is on sustaining carers
rather than relieving them of the caring role (Silvey 1991) carers have a right
not to care if they so wish.
127
Stroke Outcome Indicators

Caring for patients with stroke
F44. A population of 250,000 people will have about 1,500 survivors of stroke
living in the community with over half being dependent in at least one activity
of daily living (Langton-Hewer 1990). There are therefore substantial numbers
of people caring for stroke patients nationally. These carers are likely to be
elderly and have needs of their own.
F45. The majority of those providing care are likely to be close family. One study
has shown that 66% of carers are spouses and 20% children of the stroke
patient (Greveson and James 1990). A Northern Ireland study (Evason and
Whittington 1993) of carers and elderly patients revealed that 91% of carers
estimated their input as in excess of 50 hours per week and that the majority
of care was provided by one person. In general an array of social networks
and support were lacking. This study found that only 26% of carers received
advice on caring while 77% received advice on services and 64% on benefits.
Carers cared at the cost of loss of employment, relationships and reduced
financial opportunities.
F46. A survey of patients and carers three years after stroke revealed that few
patients and carers were in contact with hospital services (Greveson and James
1990) Thirty per cent of these carers were under strain and 50% had problems
with social adjustment. Many patients were unaware of available sources of
help or how to obtain advice. Few patients received advice regarding financial
help. Most patients felt they were unable to assimilate information early on
and many felt abandoned and would have liked a named person to provide
ongoing support. Suggestions by the patients and carers involved in this
survey for improved services and support after stroke included better post-
discharge support (22%), more information about stroke and resources (21%),
more practical help (21%), access to stroke clubs (8%) and more rehabilitation
(5%).
F47. Similar results regarding carers’ lack of awareness of services and voluntary
agencies for stroke have been found in other studies (Anderson 1988). A pilot
study in Birmingham showed a requirement for more information on stroke
(McLean and Roper-Hall 1991). However, there is little real evidence that
increasing information or input will increase the overall well-being or social
functioning of carers. Provision of information in booklets has been reported
to be useful but there was no measurable effect on physical or social outcome
(Pain and McLellan 1990). Attendance at a day hospital or home
physiotherapy in Bradford still left patients and carers emotionally distressed
and socially restricted (Young and Forster 1992).
F48. Many carers suffer emotional stress, frustration and depression (Wade et
al. 1986; Carnwath and Johnson 1987). A study of carers of stroke patients
showed that increased anxiety in carers was the most commonly reported
128
Stroke Outcome Indicators

symptom six months after stroke and significant depression was seen in 11 to
13% of carers over the first two years after stroke (Pain and McLellan 1990).
This depression was only partly related to the extent of physical disability of
the patient; as a carer’s level of depression was related to the patient’s level of
depression and general activities. These findings have been confirmed by a
recent study in Perth where 55% of carers showed emotional distress at one
year, unrelated to patient’s physical illness, but related to social functioning
(Anderson et al. 1995). Increased physical illness and health problems have
also been noted in carers (Williams 1993).
F49. Studies of carers’ satisfaction with services have found that carers while
satisfied with care in hospital were dissatisfied with services after hospital
discharge (Pound et al. 1993). It has been suggested that those carers able to
identify satisfactions of caring are likely to have a greater well-being (Nolan et
al. 1994).
The impact of caring
F50. When considering the impact of caring for carers it is essential that all the
aspects of caring are considered and that a wide definition of carer is
assumed. Since caring has physical, psychological, social and economic
aspects, the consequences of caring must be considered in these terms.
Although the majority of work on the impact and consequence of caring on
the carer has focused on negative outcomes it must be remembered that there
are also positive, rewarding and satisfying outcomes to caring.
F51. There has been much work on carer burden and stress. Carer burden refers to
the load or responsibilities carried, or to the time and effort required for one
person to attend to the needs of another (Montgomery et al. 1985). Much of
the research has taken place in the context of psychiatric illness, with
increasing interest in recent years in those caring for people with physical
disabilities.
F52. Burden can be thought of as encompassing the health related status and
behaviour of the patient, the tasks required of the carer and the impact of
these tasks on the carer’s life (Poulshock and Deimling 1984). Carer burden
can be divided into objective (external) burden and subjective (as experienced
by the carer) burden. Additionally, burden can be directly attributable to the
patient or to other sources. Increasing burden may affect the carer’s
subjective well-being leading to ‘stress’. Precipitating factors (Nolan et al.
1994) include:
- carers feeling out of control of events
- caring for a person who is unappreciative, demanding and manipulative
- not receiving sufficient support from the family and lack of adequate
finances.129
Stroke Outcome Indicators

F53. Although burden and stress are useful concepts they rely on a simple cause
and effect model suggesting that exposure to certain situations caused stress.
Individuals react to events in different ways. All events are not necessarily
stressful all of the time and not all events are equally stress provoking to all
people. Stress and burden are multidimensional concepts with social,
psychological, physical and economic components. It may be valuable to
consider these various dimensions separately.
F54. The literature on caring for a person with stroke, combined with the more
general literature on carers and carer burden, highlights a number of areas of
relevance in considering the outcomes for carers:
- Information and skills (see paragraph F55).
- Depression, anxiety and stress which can be features of caring and may
have a considerable impact on the carer.
- Satisfaction with care and with caring as there is growing evidence that
satisfaction of caring can be used as a risk assessment tool and that in the
absence of satisfaction even small tasks become a burden (Nolan, personal
communication).
- Social support and networks are valuable to carers but it is not certain
which components are most valuable although they are likely to be:
• provision of information about support agencies
• named contact person.
- Receipt of appropriate services by patient and carer is essential to
maintaining patient and carer in their home.
- Financial outcome as many carers are not aware of financial benefits or do
not receive them.
- Physical health status as maintenance of physical health is an essential to
the carer.
F55. Carers need prompt advice and information on stroke, what it means to be a
carer, on services and benefits available and voluntary agencies. Provision of
this information should occur prior to discharge. The usefulness of the
information depends on the perspective adopted. Therefore carers should be
asked what they think they need to know. Carers also need training in skills
required for caring (e.g. lifting, help with transfers). It should be noted that
carers needs are ongoing and will change. Even an experienced carer should
not be assumed to have up to date knowledge and skills. In addition it is
recognised that carers may not be able to assimilate information early in the
130
Stroke Outcome Indicators

caring process. The information and skill requirements of carers should be
re-assessed in the medium and long term. A good outcome for carers could
be having their informational and skill needs assessed and being in receipt of
appropriate information and training.
Outcome measures
F56. A number of specific measures have been developed to measure the impact
of caring. These and other measures that have been used in the context of
stroke are listed in Exhibit F6.
EXHIBIT F6 : MEASURES OF CARER OUTCOME
Type of measure Examples
Burden The Care Giver Strain Index
Relatives Stress Score
The Burden Interview
Carers Assessment of Difficulties Index (CADI)
*Carers Assessment of Managing Index (CAMI)
Stress Relatives Stress Score
General Health Questionnaire (GHQ)
Depression, anxiety GHQ
Wakefield Depression Scale
Satisfaction Carers Assessment of Satisfaction Index (CASI)
Carers Satisfaction Questionnaire (Homesat,
Hopsat)
Multidimensional Nottingham Health Profile (NHP)
GHQ
SF-36
Social networks and support Interview Schedule for Social Interaction (ISSI)
* A measure of coping rather than burden.
131
Stroke Outcome Indicators
F57. Challis et al. (1994) reviewed measures of carer burden and suggested that
either the Relatives Stress Score or Care Giver Strain Index could be
incorporated into routine clinical practice although both measures would
require further testing of their psychometric properties in particular construct
validity. They further suggested that either of these measures could be used in
conjunction with a more general measure of stress such as the General Health
Questionnaire. However, Nolan et al. (1995) felt that the use of such measures
was too simplistic and have developed their own range of measures (CADI,
CAMI, CASI). These measures require further testing of their psychometric
properties.
F58. It should be noted:
- There are two approaches to measuring the impact of caring on carers; the
use of a global measure such as the Care Giver Strain Index, or the
measurement of the individual components of burden and stress. Some of
the measures in the latter approach will be relevant to patient outcomes,
namely depression, anxiety and satisfaction and could form the basis of an
assessment of both patient and carer.
- Carers’ perception of burden may be related to their own physical, social
and mental state and other factors. An assessment of these dimensions may
be more appropriate than measures of burden or stress.
- There are several measures of social support available. Carers do not live in
isolation they have a range of social networks. Although it is accepted that
informal social networks are highly valuable there is no consensus on
which dimensions of social support networks are essential to the well-being
of carers. In addition not all support is useful (Rook 1992). Measuring
outcome in terms of social support alone will therefore not be sufficient.
- Measures of finance, receipt of services, information and training are
lacking.
- The measures listed are largely those used in research as opposed to
everyday practice. Some measures may be impractical and costly to use in
routine practice.
Conclusion
F59. Exploring the impact of caring on informal carers is important. In view of the
complexity of caring and its impact on carers it may be more meaningful to
adopt the approach of measuring the individual components of burden and
stress rather than the global approach. However, whichever approach is
ultimately adopted it is important to recognise that the outcomes of carers and
132
Stroke Outcome Indicators

those that they care for are interdependent. The outcomes for carers must
therefore form an integral part of assessing and monitoring outcomes for
stroke patients. Carers’ outcomes should be assessed at the same stages that
patient outcomes are assessed i.e. at discharge, at six months and in the
longer term.
133
Stroke Outcome Indicators

Acheson, E.D. (1967). Medical Record Linkage. Oxford University Press.
Albers, G.W. (1995). Antithrombotic agents in cerebral ischaemia. The American
Journal of Cardiology, 75, 34B-38B.
Allison, S. P. (1994). Is routine computed tomography in strokes unnecessary: costs
outweigh benefits. British Medical Journal, 309, 1499-1500.
Anderson, C. S., Linto, J., and Stewart-Wynne, E. G. (1995). A population based
assessment of the impact and burden of caregiving for long term stroke survivors.
Stroke, 26, 843-849.
Anderson, R. (1988). The contribution of informal care to the management of stroke.
International Disability Studies, 10, 107-112.
Angeleri, F., Angeleri, V.A., Foschi, N., Giaquinto, S., and Nolfe, G. (1993). The
influence of depression, social activity, and family stress on functional outcome after
stroke. Stroke, 24, 1468-1483.
Antiplatelet Trialists’ Collaboration (1988). Secondary prevention of vascular disease
by prolonged anti-platelet therapy. British Medical Journal, 296, 320-331.
Barer, D.H. (1984). Lower cranial motor function in unilateral vascular lesions of the
cerebral hemisphere. British Medical Journal, 289, 1621-1622.
Barer, D.H. (1989). The natural history and functional consequences of dysphagia
after hemispheric stroke. Journal of Neurological and Neurosurgical Psychiatry, 52,
236-241.
Barer, D.H., and Murphy, J. (1993). Scaling the Barthel: a 10-point hierarchical
version of the activities of daily living index for use with stroke patients. Clinical
Rehabilitation, 7, 221-277.
Batstone, G. (1996). Digest of evidence: stroke prevention. Journal of Clinical
Effectiveness, 1, 75-76.
Benbow, S. J., Watkins, C., Sangster, G., Ellul, J., and Barer, D.H. (1994). The
availability and reliability of information on the premorbid functional status of stroke
patients in hospital. Clinical Rehabilitation, 8, 281-285.
Blais, M-J. (1994). Stroke: literature review. Directorate of Public Health Medicine,
Northamptonshire Health Authority.
Bounds, J.V., Wiebers, D.O., Whisant, J.P., and Okazaki, H. (1981). Mechanisms and
timing of deaths from cerebral infarction. Stroke, 12, 474-477.
135
APPENDIX G: REFERENCES TO TEXT AND OTHER APPENDICES

Bowers, B. J. (1987). Intergenerational caregiving: adult caregivers and their ageing
parents. Advances in Nursing Science, 9, 20-21.
Bowling, A. (1991). Measuring health. Open University Press, Buckingham.
Bowling, A. (1995). Measuring disease. Open University Press, Buckingham.
British Medical Journal Editorial (1988). Aspirin all round. British Medical Journal,
296, 307-308.
Bruusgaard, D., Nessioy, I., Rutle, O., Furuseth, K., and Natvig, B. (1993). Measuring
functional status in a population survey. The Dartmouth COOP functional health
assessment charts/WONCA used in an epidemiology study. Family Practice, 10, 212-
218.
Carnwath, T. C. M., and Johnson, D. A. W. (1987). Psychiatric morbidity among
spouses of patients with stroke. British Medical Journal, 294, 409-411.
Cerebral Embolism Task Force (1989). Cardiogenic brain embolism. Archives of
Neurology, 46, 727-743.
Challis, D., Dunleavey, J., Philp, I., and Roberts, H. (1994). Social functioning and the
elderly. In Assessing elderly people in hospital and community care (ed. I. Philp).
Farrand Press, London.
Clark, M., and Watts, S. (1994). The incidence of pressure sores within a National
Health Service trust hospital during 1991. Journal of Advanced Nursing, 20, 33-36.
Clinical Outcomes Working Group of the Clinical Resource and Audit Group (1995).
Clinical Outcome Indicators. The Scottish Office, Edinburgh.
Cockburn, J., Wade, D., and Smith, P. (1990). The influence of cognitive function on
social, domestic and leisure activities of community-dwelling old people.
International Journal of Disability Studies, 12, 169-172.
Cole, B., Finch, E., Gowland, C., and Mayo, N. (1995). Physical rehabilitation
outcome measures. Canadian Psychotherapy Association, Toronto.
Collins, R., Peto, R., MacMahon, S., Herbert, P., Fiebach, N. H., Eberlein, K. A.,
Godwin, J., Qizilbash, N., Taylor, J. O., and Hennekens, C. H. (1990). Blood pressure,
stroke and coronary heart disease. II: short term reductions in blood pressure:
overview of randomised drug trials in their epidemiological context. Lancet, 335, 827-
838.
136
Stroke Outcome Indicators

D’Ath, P., Katona, P., Mullan, E., Evans, S., and Katona, C. (1994). Screening, detection
and management of depression in elderly primary care attenders. I: the acceptability
and performance of the 15 item Geriatric Depression Scale (GDS15) and the
development of short versions. Family Practice, 11, 260-266.
Department of Health (1992). The Health of the Nation: a strategy for health in
England. HMSO, London.
Department of Health (1993a). Population health outcome indicators for the NHS: a
consultation document. Department of Health, London.
Department of Health (1993b). Public health common data set. Part 1: indicator
definitions. Institute of Public Health, University of Surrey.
Department of Health (1994). Stroke : an epidemiological overview. HMSO, London.
Department of Health (1995). Public Health Common Data Set 1994. Institute of
Public Health, University of Surrey.
Department of Health (1996). Statistical Bulletin: statistics for general medical
practitioners in England: 1985-1995. Department of Health, London.
Department of Health Care for Elderly People (1996). Nature and extent of pressure
sores and their prevention in nursing homes in Sheffield. University of Sheffield.
Dijkerman, H.C., Wood, V.A., and Langton-Hewer, R. (1996). Long-term outcome after
discharge from a stroke rehabilitation unit. Journal of the Royal College of Physicians
of London, 30, 538-546.
Dimatteo, M.R., and Hays, R. (1980). The significance of patients’ perceptions of
physician conduct: a study of patient satisfaction in a family practice centre. Journal
of Community Health, 6, 18-34.
Donnan, G. A. (1992). Investigation of patients with stroke and transient ischaemic
attacks. Lancet, 339, 473-477.
Ebrahim, S. (1990). Clinical epidemiology of stroke. Oxford University Press.
Ebrahim, S. (1995). Clinical and public health perspectives and applications of health-
related quality of life measurement. Social Science and Medicine, 41, 1383-1394.
Ebrahim, S., Barer, D., and Nouri, F. (1987). An audit of follow up services for stroke
patients after discharge from hospital. International Disability Studies, 9, 103-105.
Effective Health Care (1992). Stroke rehabilitation. University of Leeds.
137
Stroke Outcome Indicators

Effective Health Care (1995). The prevention and treatment of pressure sores.
University of Leeds and University of York.
Ellul, J., Watkins, C., and Barer, D. (1996). Estimating total Barthel scores from just
three items: the European stroke database ‘minimum dataset’ for assessing functional
status at discharge from hospital. In press.
Enderby, P., and Crow, E. (1996). Frenchay Aphasia Screening Test: validity and
comparability. Disability and Rehabilitation, 18, 238-240.
Enderby, P., and Emerson, J. (1996). Speech and language therapy: does it work?
British Medical Journal, 312, 1655-1658.
Enderby, P., Wood, V., Wade, D., and Langton-Hewer, R. (1987). Aphasia after stroke:
a detailed study of recovery in the first three months. International Journal of
Rehabilitation Medicine, 8, 166-170.
Equal Opportunities Commission (1982). Who cares for the carers: opportunities for
those caring for the elderly and handicapped. Equal Opportunities Commission,
Manchester.
EQUIP (Evaluating Quality in Practice) Project and FACTS (Framework for
Appropriate Care Throughout Sheffield) Project (1996). Anticoagulation: a city-wide
perspective. University of Sheffield.
Evans, R. L., Connis, R. T., Hendricks, R. D., and Haselkorn, J. K. (1995).
Multidisciplinary rehabilitation versus medical care: a meta-analysis. Social Science
and Medicine, 40, 1699-1706.
Evason, E., and Whittington, D. (1993). Community care: the quality issue explored.
International Journal of Health Care Quality Assurance, 6, 18-24.
Fitzpatrick R. (1990). Measurement of patient satisfaction. In Measuring the outcomes
of medical care (ed. A. Hopkins, D. Costain). Royal College of Physicians, London.
Folstein, M., F., and Maiberger, R. (1977). Mood disorder as a specific complication of
stroke. Journal of Neurology, Neurosurgery and Psychiatry, 40, 1018-1022.
Garraway, M. (1985). Stroke rehabilitation units: concepts, evaluation, and unresolved
issues. Stroke, 16, 178-181.
General Medical Services Committee (1993). The new health promotion package. BMA,
London.
Gill, T. M., and Feinstein, A. R. (1994). A critical appraisal of the quality of quality-of-
life measurements. Journal of the American Medical Association, 272, 619-626.
138
Stroke Outcome Indicators

Gladman, J. R. F., Lincoln, N. B., and Adams, S. A. (1993). Use of the extended ADL
scale with stroke patients. Age and Ageing, 22, 419-424.
Goldacre, M., and Ferguson, J. (1995). Health outcome indicators for the NHS: report
of a workshop held at the Royal Society of Medicine. Unit of Health-Care
Epidemiology, University of Oxford.
Goldberg, D. P. (1972). The detection of psychiatric illness by questionnaire. Oxford
University Press.
Gompertz, P., Pound, P., and Ebrahim, S. (1993). The reliability of stroke outcome
measures. Clinical Rehabilitation, 7, 290-296.
Gompertz, P., Pound, P., Briffa, J., and Ebrahim, E. (1995). How useful are non-
random comparisons of outcomes and quality of care in purchasing hospital stroke
services. Age and Ageing, 24, 137-141.
Gordon, C., Hewer, R.L., and Wade, D.T. (1987). Dysphagia in acute stroke. British
Medical Journal, 295, 411-414.
Green, H. (1988). Informal carers. General Household Survey 1985 series GHS No15,
Supplement 16. HSMO, London.
Greene, J. G., Smith, R., Gardiner, M., and Timbury, G. C. (1982). Measuring
behavioural disturbance of elderly demented patients in the community and its effects
on relatives: a factor analytic study. Age and Ageing, 11, 121-126.
Greveson, G., and James, O. (1990). Improving long term outcomes after stroke: the
views of patients and carers. Health Trends, 23, 161-162..
Haan, R. de, Aaronson, N., Limburg, M., Langton-Hewer, R., and Crevel, H. van
(1993a). Measuring quality of life in stroke. Stroke, 24, 320-327.
Haan, R. de, Horn, J., Limburg, M., Meulen, J. van der, and Bossuyt, P. (1993b). A
comparison of five stroke scales with measures of disability, handicap and quality of
life. Stroke, 24, 1178-1181.
Harwood , R. H., Jitapunkul, S., Dickinson, E., and Ebrahim, S. (1994a). Measuring
handicap: motives, methods, and a model. Quality in Health Care, 3, 53-57.
Harwood, R.H., Gompertz, P., and Ebrahim, S. (1994b). Handicap one year after a
stroke: validity of a new scale. Journal of Neurology, Neurosurgery and Psychiatry,
57, 825-829.
Havas, S. (1987). Prevention of heart disease, cancer and stroke: the scientific basis.
World Health Forum, 8, 344-351.
139
Stroke Outcome Indicators
Healey, F. (1996). Using incidence data to improve risk assessment. Journal of Tissue
Viability, 6 , 3-9.
Henderson, J., Goldacre, M.J., Graveney, M.J., and Simmons, H.M. (1989). Use of
medical record linkage to study re-admission rates. British Medical Journal, 299, 709-
713.
Henderson, J., Goldacre, M.J., Griffith, M., and Simmons, H.(1992). Recording of
deaths in hospital information systems: implications for audit and outcome studies.
Journal of Epidemiology and Community Health, 46, 297-299.
Holbrook, M., and Skilbeck, C.E. (1983). An activities index for use with stroke
patients. Age and Ageing, 12, 166-170.
Indredavik, B., Bakke, F., Solberg, R., Rokseth, R., Haaheim, L., and Hilme, I. (1991).
Benefit of a stroke unit: a randomised controlled trial. Stroke, 10, 5-8.
Issacs, B., and Neville, Y. (1976). The needs of older people. The ‘interval’ as a
method of measurement. British Journal of Preventative & Social Medicine, 30, 79-85.
Johnson, G., and Buevill, P. W. (1995). Screening instruments for depression and
anxiety following stroke: experience in the Perth community study. Acta Psychiatrica
Scandinavia, 91, 252-257.
Kaplan, S., Greenfield, S., and Ware, J. (1989). Assessing the effects of physician-
patient interactions on the outcomes of chronic disease. Medical Care, 27, S110-S127.
King’s Fund Consensus Statement (1988). Treatment of stroke. British Medical
Journal, 297, 126-128.
Lakhani, A. (1994). Central Health Outcome Unit. Department of Health, London.
Langhorne, P. (1995). What is a stroke unit? A survey of the randomised trials.
Cerebrovascular Disease, 5, 228-230.
Langhorne, P., Williams, B. O., Gilchrist, W., and Howie, K. (1993). Do stroke units
save lives? Lancet, 342, 395-398.
Langton-Hewer, R. (1990). Rehabilitation after stroke. Quarterly Journal of Medicine,
76, 650-674.
Lees, K. R. (1993). Developments in acute stroke care. Scottish Medical Journal, 38,
Supplement S8-89.
Lincoln, N.B., and Gladman, J.R. (1992). The extended activities of daily living scale:
a further validation. Disability and Rehabilitation, 14, 41-43.
140
Stroke Outcome Indicators

MacMahon, S., Peto, R., Cutler, J., Collins, R., Sorlie, P., Neaton, J., Abbott, R., Godwin,
J., Dyer, A., and Stamler, J. (1990). Blood pressure, stroke and coronary heart disease.
Part I: prolonged differences in blood pressure: prospective observational studies
corrected for the regression dilution bias. Lancet, 335, 765-774.
Martin, J., Meltzer, H., and Elliot, D. (1988). The prevalence of disability among adults.
OPCS surveys of disability in GB, Report 1. HMSO, London.
Matchar, D. B., Goldstein, L. B., and Heyman, A. (1994). The stroke TyPE specification.
Health Outcomes Institute, Bloomington, USA.
McColl, A., and Gulliford, M. C. (1993). Population health outcome indicators for the
NHS: a feasibility study. Faculty of Public Health Medicine of the Royal College of
Physicians, London.
McGee, H. M., O`Boyle, C. A., Hickey, A., O’Malley, K., and Joyce, C. R. (1991).
Assessing the quality of life of the individual: the SEIQoL with a healthy and a
gastroenterology unit population. Psychological Medicine, 21, 749-759.
McHorney, A.C., Ware, J.E., Rogers, W., Raczek, A.E., and Lu, J. F. (1992). The validity
and relative precision of MOS short form and long form health status scales and
Dartmouth COOP charts: results from medical outcomes study. Medical Care, 30
Suppl, 253-265.
McLean, J., and Roper-Hall, A. (1991). Service needs of stroke survivors and their
informal carers. Journal of Advanced Nursing, 16, 559-564.
Milne, R., and Clarke, A. (1990). Can re-admission rates be used as an outcome
indicator? British Medical Journal, 301, 1139-1140.
Montgomery, R. J. V., Stull, D. E., and Borgatta, E. F. (1985). Measurement and the
analysis of burden. Research on Ageing, 7, 137-152.
Morris, J.N., Hawes, C., Fries, B.E., Phillips, C.D., Mor, V., Katz, S., Murphy, K.,
Drugovich, M. L., and Friedlob, A. S. (1990). Designing the national resident
assessment instrument for nursing homes. Gerontologist, 30, 293-307.
Murphy, P., and Jenkins, A. (1995). Medics: practice feedback report. Northumberland
Health.
NHS Centre for Coding and Classification (1996). The Read Codes October 1996
Demonstrators. NHS Executive, Leeds.
NHS Management Executive (1993). Priorities and planning guidance 1994-95.
EL(93)54. Department of Health, Leeds.
141
Stroke Outcome Indicators

NHS Management Executive (1995). GPs’ out of hours services. FHSL (95) 68.
Department of Health, Leeds.
NHS Management Executive (1996). GP health promotion. FHSL (96) 35. Department
of Health, Leeds.
National Pressure Ulcer Advisory Panel (1989). Pressure ulcer prevalence, cost and
risk assessment: consensus statement. Decubitus, 2, 24-28.
Nolan, M. Outcomes in long term care: time to open Pandora’s box. In press.
Nolan, M., Grant, G., Caldock, K., and Keady, J. (1994). A framework for assessing the
needs of family carers: a multidisciplinary guide. Base Publications.
Nolan, M., Keady, J., and Grant, G. (1995). Developing a typology of family care:
implications for nurses and other service providers. Journal of Advanced Nursing, 21,
256-265.
Norman, A. (1987). Aspects of ageism: a discussion paper. Centre for Policy on Ageing,
London.
Nouri, F.M., and Lincoln, N.B. (1987). An extended activities of daily living scale for
stroke patients. Clinical Rehabilitation, 1, 301-305.
O’Connor, S. E., (1994). The development of stroke units: the British experience.
Rehabilitation Nursing, 19, 244-247.
Odderson, I.R., and McKenna, B.S. (1993). A model for management of patients with
stroke during the acute phase, outcome and economic implications. Stroke, 24, 1823-
1827.
Odderson, I.R., Keaton, J.C., and McKenna, B.S. (1995). Swallow management in
patients on an acute stroke pathway: quality is cost effective. Archives of Physical
Medicine and Rehabilitation, 76, 1130-1133.
Ottenbacher, K. J., and Jannell, S. (1993). The results of clinical trials in stroke
rehabilitation research. Archives of Neurology, 50, 37-44.
Oxfordshire Community Stroke Project (1983). Incidence of stroke in Oxfordshire: first
year’s experience of a community stroke register. British Medical Journal, 287, 713-
717.
Pain, H. S. B., and McLellan, D. L. (1990). The use of individualised booklets after
stroke. Clinical Rehabilitation, 4, 265-272.
Patrick, D. L., and Erickson, P. (1993). Health status and health policy: allocating
resources to health care. Oxford University Press.142
Stroke Outcome Indicators

Pearlin, L., Mullan, J. T., Semple, S. J., and Skaff, M. M. (1990). Caregiving and the
stress process: an overview of concepts and their measures. Gerontologist, 30, 583-
594.
Philp, I. (1994). In Assessing elderly people in hospital and community care (ed. I.
Philp). Farrand Press, London.
Philp, I. (1997). Can a medical and social assessment be combined? Journal of Royal
Society of Medicine, 90, S11-13.
Philp, I., and Young, J. (1988). Audit of support given to lay carers of the demented
elderly by a primary care team. Journal of the Royal College of General Practitioners,
38, 153-155.
Poulshock, S. W., and Deimling, G. T. (1984). Families caring for elders in residence:
issues in the measurement of burden. Journal of Gerontology, 39, 230-239.
Pound, P., Gompertz, P., and Ebrahim, S. (1993). Development and results of a
questionnaire to measure carer satisfaction after stroke. Journal of Epidemiology and
Community Health, 47, 500-505.
Pound, P., Gompertz, P., and Ebrahim, S. (1994). Patient satisfaction with stroke
services. Clinical Rehabilitation, 8, 7-17.
Quereshi, H. (1986). Responses to dependency: reciprocity, affect and power in
family relationships. In Dependency and interdependency in old age: theoretical
perspectives and policy alternatives (ed. C. Phillipson, M. Barnard and R. Strang).
Croom Helm, London.
Ricci, S., Celani, M. G., La-Rosa, F., Vitali, R., Duca, E., Ferraguzzi, R., Paolotti, M.,
Seppoloni, D., Caputo, N., Chiurulla, C., Scaroni, R., and Signorini, E. (1991).
SEPIVAC: a community-based study of stroke incidence in Umbria, Italy. Journal of
Neurology, Neurosurgery, and Psychiatry, 54, 695-698.
Robinson, B. C. (1983). Validation of a caregiver strain index. Journal of Gerontology,
38, 344-348.
Robinson, R. G., and Price, T. R. (1982). Post stroke depressive disorder: a follow-up
of 103 patients. Stroke, 13, 635-640.
Robinson, R. G., Starr, L. B., Kubos, K. L., and Price, T. R. (1983). A two year study
of post stroke mood disorder: findings during the initial examination. Stroke, 14, 736-
741.
143
Stroke Outcome Indicators

Rook, K. S. (1992). Detrimental aspects of social relationships; taking stock of an
emerging literature. In The meaning and measurement of social support (ed. H. Veiel
and U. Baumann). Hemisphere, New York.
Royal College of Physicians and British Geriatric Society (1992). Standardised
assessment scales for elderly people. Royal College of Physicians and British Geriatric
Society, London.
Ruta, D. A., Garratt, A. M., Leng, M., Russell, I. T., and MacDonald, L. M. (1994). A
new approach to the measurement of quality of life: the patient-generated index.
Medical Care, 32, 1109-1126.
Sandercock, P.A.G., and Lindley, R. I. (1993). Management of acute stroke. Prescriber’s
Journal, 33, 196-205.
Sandercock, P.A.G., Molyneux, A., and Warlow, C. (1985). Value of computed
tomography in patients with stroke: Oxfordshire Community Stroke Project. British
Medical Journal, 290, 193-197.
Sandercock, P.A.G., Warlow, C., Jones, L., and Starkey, I. (1989). Predisposing factors
for cerebral infarction: the Oxford Community Stroke Project. British Medical Journal,
298, 75-79.
Scholten, J.H.G., and Van Weel, C. (1992). The Dartmouth COOP Functional Health
Assessment Charts/WONCA. MEDITekst, Lelystad.
Sheikh, J.A., and Yesavage, J.A. (1986). Geriatric Depression Scale (GDS): recent
findings and development of a shorter version. In Clinical Gerontology: a guide to
assessment and intervention. (ed. T.L. Brink). Howarth Press, New York.
Silvey, J. (1991). Co-operation in community care: interprofessional issues in the
assessment of old people. Centre for Interprofessional Studies, University of
Nottingham.
Smith, D.M. (1995). Pressure ulcers in the nursing home. Annals of Internal Medicine,
123, 433-442.
Smith, I. (1989). Waterlow/Norton scoring system: a ward view. CARE - Science and
Practice, 7, 93-95.
Smith, M.E., Walton, M.S., and Garraway, W.M. (1981). The use of aids and
adaptations in a study of stroke rehabilitation. Health Bulletin, 39, 98-106.
Stone, S.P., Ali, B., Auberleek, I., Thompsell, A., and Young, A. (1994). The Barthel
index in clinical practice: use on a rehabilitation ward for elderly people. Journal of
the Royal College of Physicians of London, 28, 419-423.
144
Stroke Outcome Indicators

Stroke Unit Trialists’ Collaboration (1995). A systematic review of specialist
multidisciplinary team (stroke unit) care for stroke in patients. In The Cochrane
Database of Systematic Reviews (ed. C. Warlow, J. Van Gijn, P. Sandercock). BMJ
Publishing Group.
Wade, D. T. (1992). Measurement in neurological rehabilitation. Oxford University
Press.
Wade, D. T. (1994). Stroke (acute cerebrovascular disease). In Health care needs
assessment Vol.1, (ed. A. Stevens and J. Raftery). Radcliffe Medical Press, Oxford.
Wade, D. T., and Collin, C. (1988). The Barthel ADL index: a standard measure of
physical disability? International Disability Studies, 10, 64-67.
Wade, D.T., and Hewer, R.L. (1987). Functional abilities after stroke: measurement,
natural history and prognosis. Journal of Neurological and Neurosurgical Psychiatry,
50, 177-182.
Wade, D. T., Leigh-Smith, J., and Langton-Hewer, R. (1986). Effects of living with and
looking after the survivors of stroke. British Medical Journal, 293, 418-420.
Wardlaw, J. M. (1994). Is routine computed tomography in strokes unnecessary?
British Medical Journal, 309, 498-499.
Wellwood, I., Dennis, M. S., and Warlow, C. P. (1995a). A comparison of the Barthel
index and the OPCS disability instrument used to measure outcome after acute stroke.
Age and Ageing, 24, 54-57.
Wellwood, I., Dennis, M. S., and Warlow, C. P. (1995b). Patients’ and carers’
satisfaction with stroke services. Age and Ageing, 24, 519-524.
Wenger, G.C. (1992). Help in old age - facing up to change: a longitudinal network
study. Liverpool University Press.
Wessex Institute of Public Health Medicine (1994). The routine use of CT scans in the
management of stroke. Wessex Institute of Public Health Medicine, Southampton.
Williams, A. M. (1993). Caregivers of persons with stroke: their physical and
emotional well being. Quality of Life Research, 2, 213-220.
Williams, E. I., and Wallace, P. (1993). Health checks for people aged 75 and over:
Occasional Paper 59. Royal College of General Practitioners, London.
Young, L. B., and Forster, A. (1992). The Bradford community stroke trial: results at
six months. British Medical Journal, 304, 1085-1089.
145
Stroke Outcome Indicators
ISBN 1840750162
Reports in the Series on Health Outcome IndicatorsAsthma ISBN 1840750073
Breast Cancer ISBN 1840750081
Cataract ISBN 18407509X
Diabetes Mellitus ISBN 1840750103
Fractured Proximal Femur ISBN 1840750111
Myocardial Infarction ISBN 1840750138
Normal Pregnancy and Childbirth ISBN 1840750146
Severe Mental Illness ISBN 1840750154
Stroke ISBN 1840750162
Urinary Incontinence ISBN 1840750170
Additional copies of the reports listed above are available from
P.O. Box 777, London SE1 6XH.
Fax: 01623 724 524