structural analysis of charge transfer salts from … analysis of charge transfer salts from...
TRANSCRIPT

Structural Analysis of Charge Transfer Salts from Synchrotron
X-ray and Neutron Powder Diffraction Data
A thesis submitted in partial fulfillment of the requirements for the degree of Bachelor of Science in
Physics from the College of William and Mary
by
Sahnun Hassan Mohamud
Advisor: Dr. Silvina Pagola
Senior Research Coordinator: Dr. Gina Hoatson
Date: May 11, 2015

Table of Contents:
1. Introduction
2. Theory
3. Methods and Materials
4. Results
5. Discussion
Abstract
This research work has been motivated by my interest in the chemical synthesis and study
of the solid state properties of new materials. More specifically, two charge transfer salts of the
electron donor tetrathiafulvalene (TTF) and chemical derivatives of benzoquinones (electron
acceptors), have been studied. The materials were synthesized by mechanochemistry, grinding
the powders of the reactants in presence of small quantities of different solvents. This synthesis
method leads to different crystal structures (or polymorphs) of the products, which show
different physical properties. The charge transfer salts under study were TTF-o-CA (o-CA is o-
chloranil) and TTF-2,5-dichloro-p-benzoquinone. The refined lattice parameters of the latter
compound are a = 6.8418(2) Å, b = 7.21331(17) Å, c = 7.9348(2) Å, = 93.618(2)˚, =
97.6267(19)˚ and = 106.9407(19)˚. The unit cell volume is 369.147(17) Å3 and the space group
is 1P (triclinic). TTF-2,5-dichloro-p-benzoquinone is made of columnar stacks of alternating
TTF and 2,5-dichloro-p-benzoquinone molecules running along a direction parallel to the
crystallographic b-axis. The combined analysis of the synchrotron X-ray and neutron powder
diffraction data of this material resulted in a set of bond distances and bond angles for the TTF
molecules, which gave rise to an estimated charge transferred () between donors and acceptors
of ~0.36 e-.
1
1. Introduction
The Greek philosopher Democritus has been credited as having the earliest recorded
speculation of the atom’s existence, which he believed to be an indivisible unit and therefore a
fundamental basis of all matter in the universe.1 Democritus did very well for someone who did
not have access to modern scientific tools for “seeing” deeply into the nature of matter, and
clever scientists after him have worked enormously hard to find ways to probe deeper into the
fundamental nature of matter beyond the naked eye, which has a resolution suitable for viewing
objects which scatter visible light wavelengths (4000-7000 Å). Atomic radii are in the order of 1
Å (10-10 m), thus to be able to similarly “see” atoms, wavelengths much shorter than those of
visible light are required. The discovery of the diffraction of X-rays from solids by
the German
physicist Max Von Laue in 1912 represented an extraordinary step forward in this aim.2 Laue
hypothesized that by passing an X-ray beam through a
crystalline solid, the X-rays would interfere and this
would result in a diffraction pattern due to the periodic
arrangement of atoms within crystalline solids, thereby
providing proof of both, the wave nature of X-rays and
the spatial arrangement of atoms at regular intervals in
crystals.
Figure 1: The apparatus used for the discovery of X-ray diffraction
in crystals, exhibited at Deutsches Museum in Munich, Germany.
Figure reproduced from citation 2.
X-ray diffraction from single crystals has since become a leading method in determining
the crystal structures for a vast range of materials. A defined “structure” means different things
2
to different people, and in crystallography it simply means having knowledge of the atomic
arrangement (e.g., relative positions, bond distances, bond angles) in the most basic building
block of a crystal (formally known as the unit cell) which can be translated in space to form a
complete crystal. Thanks to technological advances over the past two decades, chiefly the
widespread availability of computers and open source crystallography software, even for crystal
structure determination from powders, 3 structures are typically completed in a matter of hours or
days! Moreover, through the use of databases containing powder diffraction patterns and detailed
structural information of thousands of organic and inorganic compounds, solid state chemists and
physicists are able to rapidly identify crystalline materials by comparing their diffraction patterns
to the collection of powder diffraction patterns in the database. Knowledge of the structures of
materials is among the primary objectives of chemistry and the material sciences, since it allows
the study of the chemical bonding in solids and the formulation of structure-properties
relationships. Finally, it is worth noting that crystallography is routinely applied in many vital
and economically significant industries today, such as pharmaceuticals, minerals, computers,
aeronautical, automobile, agricultural and food industries.
The main objective of this project has been to characterize the crystal structures of two
newly synthesized charge transfer salts, TTF-2,5-dichloro-p-benzoquinone and TTF-o-CA. The
structure of TTF-2,5-dichloro-p-benzoquinone has been used to calculate the bond lengths in
tetrathiafulvalene and infer features of its chemical bonding. The use of empirical formulas
afforded the calculation of the charge transferred () among tetrathiafulvalene and the 2,5-
dichloro-p-benzoquinone electron acceptor.
3
The Powder Diffraction Method
The question of how we can ”see” individual atoms and molecules, either directly or
indirectly, has been answered by the diffraction methods. As mentioned earlier, the naked human eye
which operates by detecting scattered visible light waves is incapable of viewing atoms due to
visible light wavelengths are much longer than atomic radii. X-rays are able to diffract from crystals
since their wavelengths are on the order of 0.1 Å – 100 Å. Thus, a suitable detector to measure the
X-rays scattered from atoms in crystals and a way of interpreting the resultant diffraction pattern, is
in principle all one needs to characterize the structure of any crystalline solid.
The fundamental aspects of the powder diffraction method are illustrated in figure 2.
Incident radiation on a powder sample results in the formation of cones of diffracted X-rays,
schematically represented in figure 2(a). In a powder diffractometer, the X-ray source (or the sample
stage) rotates at an angle as shown in figure 2(b). The diffracted X-ray intensities are recorded by
the detector as a set of peaks of diffracted radiation (X-ray counts) vs. 2 angles (in degrees) as
shown in figure 2(c).
The powder diffraction method was independently developed by Debye and Scherrer in
Germany in 1916, and in the USA by Hull in 1917.3 Over the course of the next 50 years, the
“traditional” applications, which include crystal phase identification, determination of accurate lattice
parameters, and the analysis of structural imperfections, were well established.3 In 1967 the power of
the method was significantly augmented with the introduction by Hugo Rietveld of a method for
refining crystal structures from neutron powder diffraction data. Since then, the Rietveld method has
been used extensively in deriving structural information from powder data, thus entering the once
exclusive domain of single crystal diffraction methods.

4
Figure 2: (a) X-ray radiation incident on a powder produces Debye-Scherrer diffraction cones of diffracted radiation
at 2 angles from the incident beam direction. (b) Schematic arrangement of the X-ray source, the sample holder and
the X-ray detector in a powder diffraction experiment. (c) A typical X-ray powder diffraction data showing peaks of
diffracted X-ray radiation vs. the 2 angle. The peaks are measured when the detector intercepts the cones.
X-rays and neutrons can both serve as a radiation source for the powder diffraction method.
Synchrotron powder diffraction is often referred to as high resolution X-ray powder diffraction due
to the smaller instrumental contribution to the peak widths, than that from conventional X-ray
diffractometers. The advantages, disadvantages and generation technique for each radiation source
are summarized in table 1.

5
Table 1: Comparison of radiation sources in powder diffraction, their generation technique,
strengths and limitations.
Radiation
Source
Strengths Limitations Generation
technique
Neutron * The location of light atoms
in presence of heavier atoms.
* Differentiation between
adjacent elements in the
periodic table.
* Determination of the spin
arrangements in magnetically
ordered materials.
* Diffraction data measurable
up to relatively large
diffraction angles.
* In-situ studies varying
temperature or pressure are
possible.
* Neutron sources are
expensive to maintain.
* A relatively large
amount of sample is
required (in the order
of 1 gram), which is
an obstacle for costly
or difficult to obtain
specimens.
* Nuclear reactors
(most common).
* Spallation from
metal targets
bombarded with high
energy (approximately
500 MeV) protons.

6
Synchrotron * The instrumental
contribution to peak
broadening is minimal.
* High incident X-ray
intensity.
* The wavelength is tunable,
affording studies close to the
X-ray absorption borders, or
far from them minimizing X-
ray absorption or
fluorescence.
* In-situ studies varying
temperature or pressure and
time-dependent studies are
possible.
* Poor signal to noise
ratio at high
diffraction angles due
to fall-off of the X-ray
atomic scattering
factors.
* From electrons
travelling at
relativistic velocities
deflected by magnetic
fields in a
synchrotron.
Conventional
(sealed X-ray
tube and
rotating anode
sources).
* Simple and relatively
maintenance free assembly.
* The overall
efficiency of the X-ray
source is low
(approximately 1%).
* X-ray tubes, where
electromagnetic
radiation is generated
from the impact of
high energy electrons
with a metal target,
typically Cu and Mo.
7
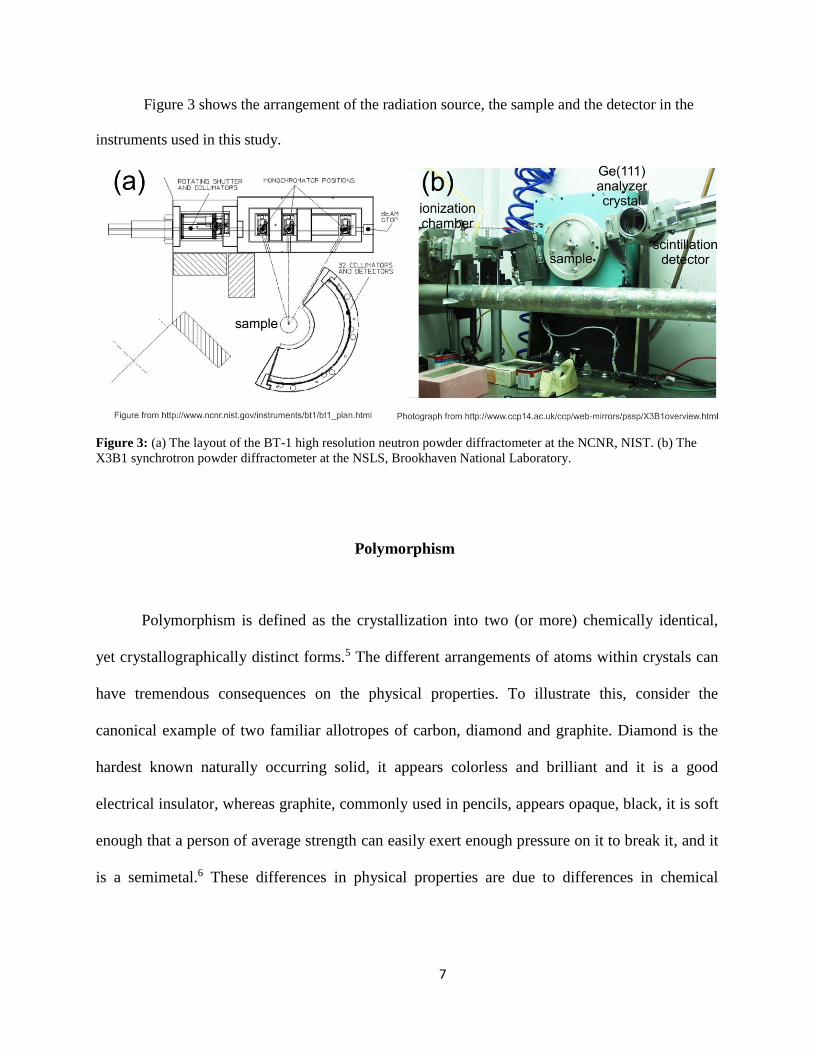
Figure 3 shows the arrangement of the radiation source, the sample and the detector in the
instruments used in this study.
Figure 3: (a) The layout of the BT-1 high resolution neutron powder diffractometer at the NCNR, NIST. (b) The
X3B1 synchrotron powder diffractometer at the NSLS, Brookhaven National Laboratory.
Polymorphism
Polymorphism is defined as the crystallization into two (or more) chemically identical,
yet crystallographically distinct forms.5 The different arrangements of atoms within crystals can
have tremendous consequences on the physical properties. To illustrate this, consider the
canonical example of two familiar allotropes of carbon, diamond and graphite. Diamond is the
hardest known naturally occurring solid, it appears colorless and brilliant and it is a good
electrical insulator, whereas graphite, commonly used in pencils, appears opaque, black, it is soft
enough that a person of average strength can easily exert enough pressure on it to break it, and it
is a semimetal.6 These differences in physical properties are due to differences in chemical
8
bonding of the carbon atoms within each material, which leads to different spatial arrangements
of atoms in the solids.
It is often the case that charge transfer salts, such as the ones studied in this work, exhibit
polymorphism. Different polymorphs showing different physical properties can be synthesized
by applying the technique of liquid assisted grinding (LAG), and this will be further explained in
the Methods and Materials section.
Charge Transfer Salts
Oxford condensed matter physicist John Singleton authored an article in 2002, entitled
“Why do physicists love charge transfer salts?”, extolling the virtues of using charge transfer
salts (CTS) to understand aspects of magnetism and superconductivity.7 He argues that
condensed matter physicists have ignored the potential uses of organic small molecules in
experimentation due to the false assumption that fundamental physicists should study chemically
simple materials.7 In reality, despite being chemically complex, CTS often have beautifully
simple electronic properties, with charge transferred anisotropically in one or two dimensions, as
opposed to isotropic inorganic conductors.7 Furthermore, CTS are being employed by physicists
in an attempt to understand many-body effects, such as electron-electron and electron-phonon
interactions, due to the experimental effective masses being (roughly) five times as large in CTS
than in inorganic materials.7
Both compounds under study are organic charge transfer salts. This type of material is
formed when electron donor molecules transfer electrons to electron acceptor molecules.7 The
charge transferred serves to keep the salt chemically bonded and also as a “dopant”, by leaving

9
behind an empty electron state shared by the donor molecules.7 The typical crystal packing
motifs of tetrathiafulvalene donors in ionic and mixed-valence CTS are well known.8 The
knowledge of the crystal structure of a given compound often can be enough to deduce whether
or not charge has been transferred.
This project sought to elucidate the crystal structure of two distinct CTS, TTF-2,5-
dichloro-p-benzoquinone and TTF-o-CA, made of the components represented below.
Figure 4: Molecular structures of the donor and acceptors in the TTF-2,5-dichloro-p-benzoquinone and TTF-o-CA
charge transfer salts.
Specifically, the project focused on the crystal structure determination from powders of
TTF-o-CA and the refinement of the crystal structure of TTF-2,5-dichloro-p-benzoquinone from
their combined X-ray synchrotron and neutron powder diffraction data. For the latter, our work
focused on the calculation of very accurate bond lengths in TTF to estimate the charge
transferred, , using empirical formulas.9 A further objective of this project has been to better
understand two new compounds, which may be used for purposes ranging from condensed
matter physics studies to understanding aspects of mechanochemistry and crystal engineering.

10
2. Theory
This section aims to highlight the theoretical basis upon which powder diffraction relies,
while highlighting the specific techniques and models that the data analysis section is based on.
The Crystalline State
Solids can be amorphous or crystalline. A crystal exhibits a long range periodic repetition
of atoms (ions or molecules) with certain symmetry relations, and a periodic electron density
distribution.6 The unit cell is the “building block” of any crystal that repeats along the three
spatial dimensions, and it has the same empirical formula and symmetry than the crystal. A unit
cell (in three dimensions) is described by six lattice parameters: a, b, c, α, β, γ and the crystal
system. The first three parameters describe the length of the unit cell edges, and the last three
describe the angles between them. There are seven possible crystal systems: triclinic,
monoclinic, orthorhombic, tetragonal, trigonal, hexagonal and cubic. Those are defined by
minimum characteristic rotational symmetry elements of the crystal.10
A crystal lattice is an infinite array of points, each one surrounded equally by its
neighbors,10 and it can be generated by translations of three basis vectors a, b, c. A total of 14
types of unit cells, called Bravais lattices, describe all lattices used in crystallography. To
understand how crystal structures are described, we imagine that the Bravais lattice is an abstract
scaffold of lattice points, and that there is a set of atoms called the “asymmetric unit” (or “basis”)
associated with each lattice point. Once a Bravais lattice, the crystal symmetry and the
11
asymmetric unit are known, the crystal can be generated by simply translating the unit cell and
its contents through the three spatial dimensions.
In the same way as individual molecules or other finite objects, crystals possess symmetry
elements and a symmetry operation defined by each symmetry element. In crystals, symmetry
elements with a translational component produce an infinite number of symmetrically equivalent
objects, and they are called “infinite” symmetry elements. Examples of those are lattice
translations, screw axes and glide planes.4 The remaining symmetry elements which do not
involve translations are called “finite” symmetry elements, such as inversion centers, mirror
planes, rotation and roto-inversion axes.4 Those elements can also be used to describe the
symmetry of discrete objects such as molecules.
The complete set of symmetry elements of a crystal is called a “space group of
symmetry”, consistently with the mathematical theory of groups. A group is a set of elements for
which a binary combination law is defined, and which together satisfy the four fundamental
properties of closure, associativity, identity and inversion.4 A total of 32 point groups exist if
only finite symmetry elements and all their combinations are taken into account, whereas a total
of 230 three-dimensional crystallographic space groups can be defined.4
Diffraction
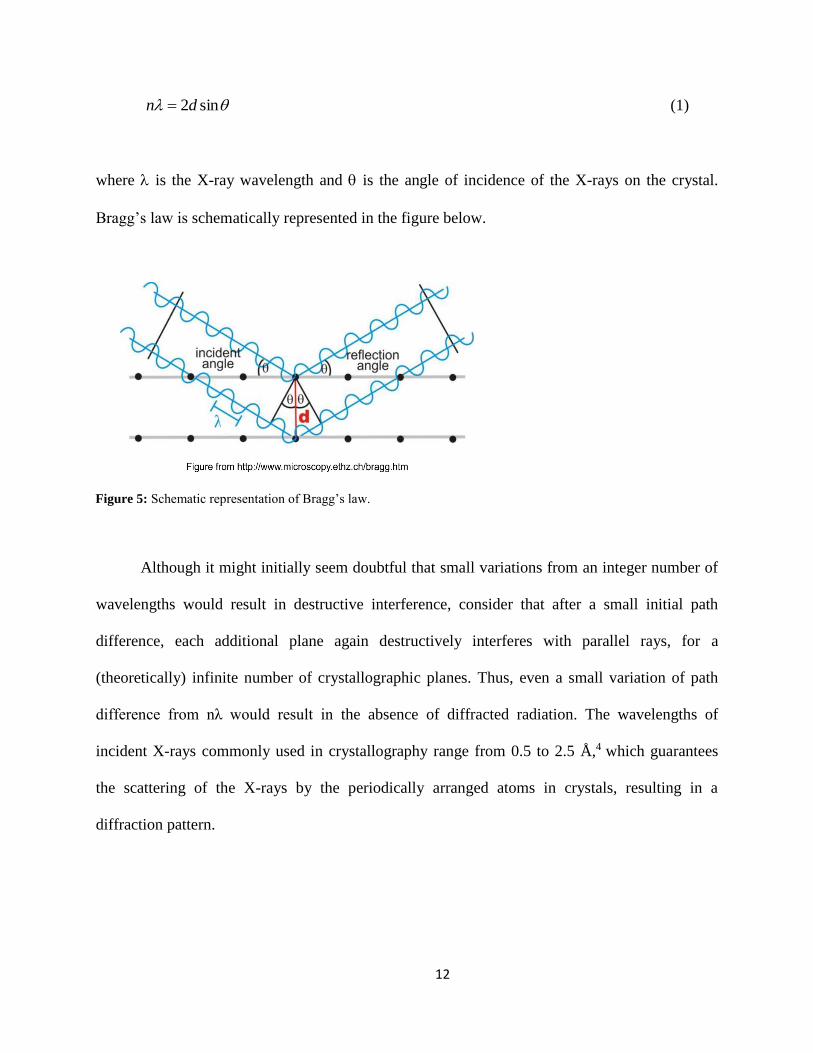
Bragg’s law expresses the necessary condition to observe diffracted radiation from a
crystal. It states that constructive interference only occurs when the path difference (2 sind )
between X-rays scattered by parallel lattice planes separated by an interplanar distance ‘d’, is an
integer number of wavelengths, n:
12
sin2dn (1)
where is the X-ray wavelength and is the angle of incidence of the X-rays on the crystal.
Bragg’s law is schematically represented in the figure below.
Figure 5: Schematic representation of Bragg’s law.
Although it might initially seem doubtful that small variations from an integer number of
wavelengths would result in destructive interference, consider that after a small initial path
difference, each additional plane again destructively interferes with parallel rays, for a
(theoretically) infinite number of crystallographic planes. Thus, even a small variation of path
difference from nλ would result in the absence of diffracted radiation. The wavelengths of
incident X-rays commonly used in crystallography range from 0.5 to 2.5 Å,4 which guarantees
the scattering of the X-rays by the periodically arranged atoms in crystals, resulting in a
diffraction pattern.

13
Reciprocal Space
Understanding the reciprocal space is essential to interpreting the diffraction pattern of a
crystal. This is because each diffraction spot observed on a data collection plate (varies
depending on the instrumentation used, can be photographic film or image plates) corresponds to
the diffracted intensity from a lattice plane with interplanar spacing ‘d’ as described above,
labeled with particular Miller indices (h,k,l). In general several thousands spots will be measured
within “frames” of data.11 The reciprocal lattice can be understood by rearranging Bragg’s law,
and noticing the inverse relationship of the interplanar spacing, d, with sin. From this equation,
we can infer that when a lattice has large d values the diffraction pattern will compress, while
small d values will result in a wider spread.11 Experimentally, when a lattice has long axes the
diffraction spots tend to appear very close together, with the converse true for short axes.11 If we
assume that for each set of lattice planes in real space there is a point in the reciprocal space, then
the collection of those points can be referred to as the reciprocal lattice.
We use the diffraction data which exists in the reciprocal space in order to define the
crystal structure which exists, of course, in real space.11 The data are ultimately used to calculate
an electron density distribution map for the unit cell in real space.11
The Fourier Transform
In order to solve a crystal structure and to identify the positions of the atoms within the
crystal, it is necessary to calculate the phases of the diffracted X-ray beams, also called structure
factors. The “phase problem” as it is commonly referred to in crystallography, refers to the loss

14
of information about the phases of the diffracted X-rays, which intensities can be experimentally
determined.
Returning to the process of ‘seeing’ things around us, the retina in the eyes is a lens that
physically recombines the radiation scattered by visible objects so that an image of them can be
formed. For X-rays diffracted by crystals, that recombination is not done by an X-ray lens but
rather mathematically, using a method called Fourier synthesis.11
The structure factors for any reflection with Miller indices (h, k, l) are represented by h,
have an amplitude |Fh| and a phase h, so each structure factor is:
Fh = |Fh| exp(ih) (2)
The periodic electron density distribution at any position r in a unit cell of volume V, is
expressed in electrons per cubic Angstrom (e-/Å3), and it can be rebuilt by Fourier transform
from the experimentally determined amplitudes of the structure factors and their calculated
phases, through the following summation in h:
(r) = hV
1Fh exp[-2i(h.r)] (3)
Using equation (2) in the above formula gives:
(r) = hV
1|Fh| exp(ih) exp[-2i(h.r)] (4)
15
In single crystal diffraction only the phases h of the structure factors remain to be
calculated. This is routinely done in the case of small organic molecules using the “direct
methods” for crystal structure determination,12 which use probability relations originating in
properties of the electron density distribution function, its ‘positivity’ and the fact that it is
centered around the atomic positions in the crystal. In other words, among all possible
combinations of amplitudes and phases for the structure factors, a restricted number of them can
generate an electron density distribution that is always positive and maximized at the atomic
positions. This generates probabilistic relationships for the phase angles h of triplets of
reflections with arithmetically related Miller indices,12 from which the phases can be calculated.
However, these methods are considerably less successful for the determination of small organic
structures from powder diffraction data due to peak overlap.
In powder diffraction, the specimen studied is a powder made of a large number of
microcrystallites oriented at random. As a consequence of this, the three-dimensional
information of the reciprocal lattice is lost, and the powder diffraction data only provides the ‘d’
spacings (or 2θhkl diffraction peak positions) of the Bragg reflections. In other words, only the
magnitudes of the reciprocal lattice vectors. Consequently, in order to determine a crystal
structure from powders, not only the phases of the reflections must be calculated, but the powder
diffraction data does not provide individual measurements of the |Fh| due to the overlap of the
diffraction peaks along the 2θ angle. Due to crystal symmetry, there are groups of reflections
whose intensities can be independently measured in single crystal diffraction, but that are exactly
overlapped at the same 2θhkl angle. Though often those reflections have equal intensities, this is
not always true. In addition, the diffraction peaks of reflections with close 2θhkl angles partially
overlap, and this problem is particularly severe at high diffraction angles.
16
The powder diffraction pattern is collected at small 2θ steps (typically 0.005o – 0.02o),
and each observed diffracted intensity (called yi,obs) at the Bragg angle 2θi has contributions of
various exactly and partially overlapped Bragg reflections.13 Modern whole pattern
decomposition methods14 generate a set of calculated ‘single crystal-like’ integrated intensities
for the reflections (sometimes called “pseudo-observed” integrated intensities) and structure
factor amplitudes, that can later be used in crystal structure determination from powders to find
the structure factor phases.
Direct Space Methods
Direct space methods refer to modern crystal structure determination techniques for powder
samples, wherein the solution is found from a large number of trial models generated in the direct (or
real) space. In 1989, Newsam and Deem16 published a breakthrough crystal structure solution of a
zeolite using the simulated annealing global optimization algorithm.17 At present, direct space
methods are implemented in various computer programs and have made use of other algorithms such
as Monte Carlo, genetic algorithms and parallel tempering.18-22
In this work we have used the computer program PSSP (powder structure solution
program).22 The simulated annealing algorithm operates by minimizing a cost function ‘S’, which
evaluates the difference between the integrated intensities calculated from each trial model with those
generated in the Le Bail fit.22
17
Whole Powder Pattern Decomposition by the Le Bail method
Whole pattern decomposition is utilized in order to extract a set of integrated intensities
for the Bragg reflections from the powder diffraction data, regardless of diffraction peak overlap.
There are essentially two algorithms, the Le Bail method and the Pauli method.14 In the Le Bail
method, the unit cell parameters and the peak profile function are simultaneously refined and a
set of the integrated intensities of the Bragg reflections is calculated from the measured powder
diffractogram.14
The Le Bail method is based on iterating the Rietveld decomposition formula,13 that has
been initially used to partition each experimental powder diffraction intensity yi,(obs) at each
position 2i of the powder diffraction pattern, into contributions to the several exactly overlapped
and partially overlapped Bragg reflections centered at various 2hkl close to 2i.
In the Rietveld method, the calculated powder diffraction intensity at each point of the
powder pattern yi,(calc), is the product of the scale factor and a sum of the contributed intensities
from the various overlapped Bragg reflections with peak maxima at 2hkl close to the position
2i, plus the background intensity at that position:
ibhklhklihkl
hkl
hklcalci yAPFLsy ,
2
)(, )22( (5)
where s is the scale factor, Lhkl is the product of the Lorentz factor, polarization factor, and
multiplicity factor of the Bragg reflection of Miller indices h,k,l; |Fhkl|2 is the structure factor
amplitude square of each contributing reflection; is the peak shape function, that depends on
the difference between 2θi and 2θhkl and it has integral equal to 1; Phkl is the preferred orientation

18
correction for each reflection; A is the absorption correction for the specimen, and yb,i is the
background intensity at that point of the powder pattern. The calculated intensity above the
background can be written from equation (5) as:
2
),(,)(, hklcalchkl
hklicalci Swy (6)
where wi,hkl is a measure of the contribution of the Bragg reflection at 2hkl to the
diffraction intensity yi,(calc) at the position 2i including the various factors detailed in (5), and
22
),( hklhklcalc FS .
In the Rieveld method,13 a partition of the the yi,(obs) for the calculation of ‘observed’
integrated intensities of the Bragg reflections, I(obs),hkl, is done using the square of the structure
factor amplitudes calculated from the structural model. In the equation of the Rietveld
decomposition formula shown below, 2
2
),( hklhklcalc FS
)(,)(,
2
),(,),( )/( obsicalcihklcalci
hklihklobs yySwI (7)
where wi,hkl has the meaning above described for equation (6). The sum is over all i steps at
angles 2i with yi,(obs) which can theoretically contribute to the integrated intensity I(obs),hkl of the
diffraction peak at 2hkl.
In other words, the observed intensities yi,(obs) at each point of the powder pattern are
partitioned into contributions for the integrated intensities of the overlapped Bragg reflections (or

19
peaks) with Miller indices h,k,l, according to the partition (or ‘construction’ from the
contributing Bragg reflections) of the calculated intensity at that point in the pattern, yi,(calc).
In the Le Bail method,14 the 2
),( hklcalcS are initially set to all equal arbitrary numbers, since
the 2
hklF are not known, the scale factor is kept at a fixed value, and the Rietveld decomposition
formula in (7) is iterated, so that the resulting I(obs),hkl are re-injected in subsequent iterations as
the new 2
),( hklcalcS .
Figure 6 shows schematically the partition of the observed powder intensities yi,(obs)
according to the fractional contributions to the calculated intensity yi,(calc) at each 2i step.
Figure 6: The experimental powder diffraction intensity at each step yi,(obs) is partitioned between the two
overlapped diffraction peaks (1), (blue), and (2) (green) in this figure in particular, using the ratios yi(1)(calc)/yi,(calc)
and yi(2)(calc)/yi,(calc) at each 2i step. In addition, yi,(calc)=yi(1)(calc) + yi(2)(calc); yi(1)(calc) = wi,12
1),(calcS and yi(2)(calc) =
wi,22
2),(calcS .
20
This project made extensive use of the Le Bail method. In order to utilize this method, it
is important to have a good starting unit cell and profile parameters as in the Rietveld method
itself.4
Rietveld Refinement
The Rietveld method relies upon a model for the crystal structure, in other words, a
crystal structure solution containing atomic coordinates, lattice parameters, and space group
symmetry. It allows us to establish structural details still missing from the ab-initio structure
solution process.4 Least squares refinements are carried out varying selected parameters until the
best fit is obtained between the observed and calculated diffraction intensities at each point yi at
2i of the powder profile. The crystallographic model (including atomic positions and lattice
parameters), scale factor, background intensities, peak profile parameters, preferred orientation
parameters, instrumental factors and diffraction optics effects (2 zero error in the position of the
detector, sample holder shift, transparency, X-ray absorption) can be refined from initially
approximate models.15
3. Methods and Materials
Diffraction data collection
The study of the crystal structure of TTF-o-CA was conducted through X-ray powder
diffraction. The high resolution X-ray powder diffraction data of TTF-o-CA and TTF-2,5-
dichloro-p-benzoquinone were collected at room temperature in the beamline X16C of the

21
National Synchrotron Light Source, Brookhaven National Laboratory, NY, USA. The samples
were loaded into 1 mm and 1.5 mm glass capillaries, respectively. The wavelength = 0.669711
Å was selected with a Si(111) double monochromator and the incident beam was monitored with
an ion chamber. A Ge(111) analyzer crystal was placed after the sample and before the detector
to obtain good angular resolution, whereas the out-of-plane resolution was given by slits. A
NaI(Tl) scintillation detector was used to measure the diffracted radiation.
The study of the crystal structure and charge transfer of TTF-2,5-dichloro-p-
benzoquinone was conducted through X-ray synchrotron and neutron diffraction from powders.
The neutron powder diffraction data at constant wavelength was collected from the BT1 High
Resolution neutron powder diffractometer at the NIST Center for Neutron Research,
Gaithersburg, MD. The sample was loaded under He atmosphere into a vanadium can and the
data was collected at room temperature over the range of 21.3-166.3° at constant 2 steps of
0.05o. The 2.0787(2) Å wavelength was selected using a Ge (311) monochromator with a 75°
take-off angle. The diffracted radiation was measured with 32 3He detectors at 5o intervals.
Synthesis
The synthesis conditions for the preparation of samples of the materials studied are
summarized in the following paragraphs.
TTF-2,5-dichloro-p-benzoquinone:
0.9650 g of TTF were ground with 0.8357 g of 2,5-dichloro-p-benzoquinone and 7.20
mL of acetonitrile (MeCN) for 40 minutes in a glass mortar with pestle, under air and at room

22
temperature. The ratio of solvent to reactant mass was 4 L per mg. The color of the resulting
product was green.
TTF-o-CA
0.0113 g of TTF (orange, monoclinic polymorph) were ground with 0.0136 g of o-CA
(ortho-chloranil) and 25 L of toluene in an agate mortar with pestle, under air and at room
temperature for 30 minutes total. After the first 15 minutes of grinding, an additional volume of
25 L of toluene was added and the grinding continued for additional 15 minutes. The color of
the resulting product was pink.
Diffraction data analysis
The table below offers a rough outline of the process of analyzing X-ray powder
diffraction data.
Table 2: Outline of the procedure for the Crystal Structure Determination from Powders
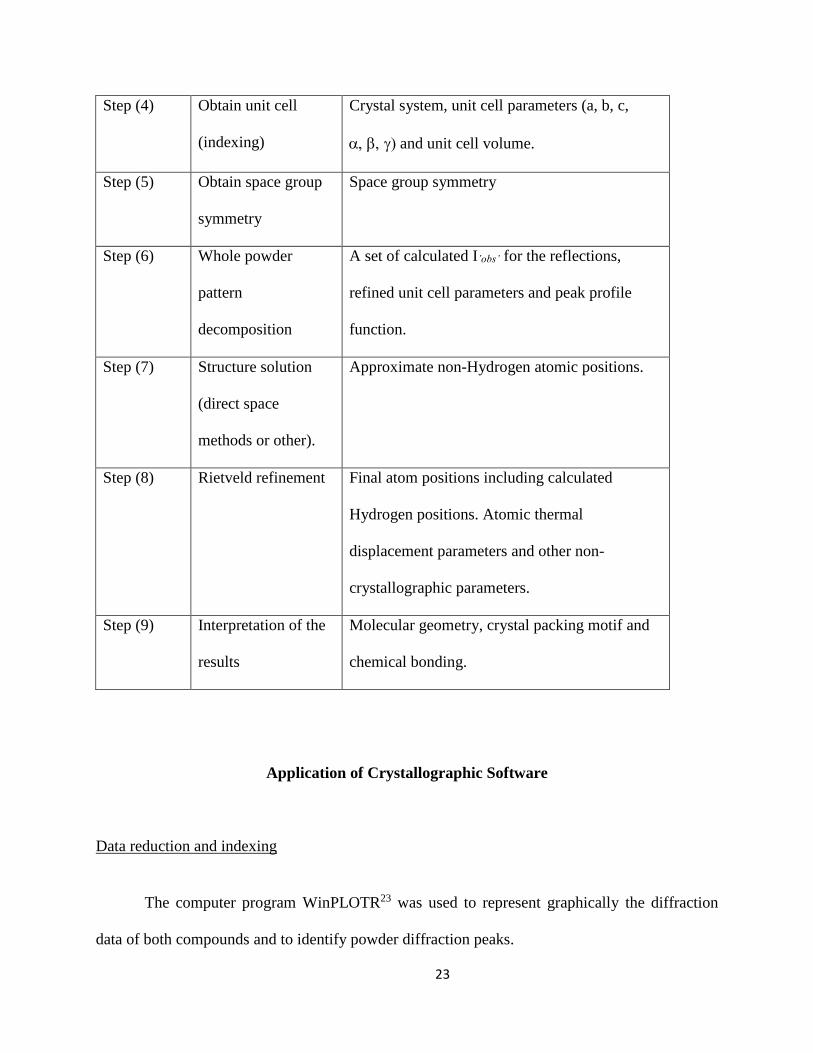
Step (#) Operation Information gained
Step (1) Preparation of a
powder specimen
X-ray absorption, sample transparency and
preferred orientation effects must be minimized.
Step (2) Data collection Powder diffraction data, as a list of yi,obs vs. 2i
Step (3) Data reduction Estimation of background intensities and 2hkl
peak positions.
23
Step (4) Obtain unit cell
(indexing)
Crystal system, unit cell parameters (a, b, c,
and unit cell volume.
Step (5) Obtain space group
symmetry
Space group symmetry
Step (6) Whole powder
pattern
decomposition
A set of calculated I’obs’ for the reflections,
refined unit cell parameters and peak profile
function.
Step (7) Structure solution
(direct space
methods or other).
Approximate non-Hydrogen atomic positions.
Step (8) Rietveld refinement Final atom positions including calculated
Hydrogen positions. Atomic thermal
displacement parameters and other non-
crystallographic parameters.
Step (9) Interpretation of the
results
Molecular geometry, crystal packing motif and
chemical bonding.
Application of Crystallographic Software
Data reduction and indexing
The computer program WinPLOTR23 was used to represent graphically the diffraction
data of both compounds and to identify powder diffraction peaks.
24
DICVOL24 is an indexing program working through an exhaustive search of lattice
parameters by the successive dichotomy method.4 In addition to DICVOL, the programs ITO25
and TREOR26 were also used. ITO utilizes a zone search indexing method combined with the
Delaunay-Ito technique in order to determine the most probable unit cell.4 TREOR26 is a semi-
exhaustive trial and error indexing program, based on the permutation of Miller indices in a basis
set of low angle reflections.26 These programs allow the optional input of information about the
formula weight and density in order to estimate the number of formula units expected in the unit
cell found. This process is called ab-initio indexing, since the lattice parameters are not known a-
priori. Other program used is McMAILLE.27 At this point, it may be possible to determine the
space group symmetry by noting that certain subsets of reflections have zero intensity, which is
an effect of the presence of symmetry elements with a translational component.4
Space Group Symmetry Determination
The computer program EXPO28 was utilized to determine the space group symmetry. The
program reads the raw diffraction data file, the X-ray source (e.g., synchrotron), with the option
of including known lattice parameters or finding them from peak positions as well. The program
produces a list of most likely space groups of symmetry for the material, with figures of merit
(FOM) attached to each of them. The lattice parameters and space group symmetry are used to
extract a set of integrated intensities for the reflections through the Le Bail algorithm,
implemented in the computer programs GSAS29 or FULLPROF.30
25
Crystal Structure Solution
The refined lattice parameters, space group symmetry and a file with the integrated
intensities of the reflections, are utilized by the Powder Structure Solution Program (PSSP)22 to
find the crystal structure solution (approximate atomic coordinates). PSSP uses the simulated
annealing global optimization algorithm17 to sort the structure solution from thousands or
millions of possible atomic arrangements calculated. The algorithm works by minimizing a cost
function, which mathematically expresses the difference between the integrated intensities
calculated from any trial model, and correlated integrated intensities extracted in the Le Bail fit
of the experimental pattern.22 Each simulated annealing run results in a set of approximate
atomic coordinates, which then must be refined by the Rietveld method in order to reach a
publishable crystal structure solution.
Rietveld Refinement
The knowledge of the approximate atomic positions allows us to perform a Rietveld
refinement on the atomic positions defining the structural model.13,15 In the Rietveld method the
integrated intensities of the reflections are calculated from the structure factors (which contain
the atomic positions), thus they are biased by the structural model. The program GSAS29 allows
to include bond distance and bond angle restraints in the Rietveld refinement process, which
affords the calculation of chemically meaningful structures.
26
Statistical Significance and Data Presentation of the results
Three agreement factor values are most commonly utilized in order to test the validity of
the crystallographic data obtained from the structure solution process from powders: Rwp (R-
weighted pattern), RI (R-Bragg factor) and 2 or goodness of fit (GOOF) squared. During the
Rietveld refinement process, the Rwp factor and 2 are often used as a monitor of the progress of
the refinement cycles.
2/1
2
,
2
,,
)(
)(
iobsii
icalciobsii
wpyw
yyw
R ; where wi = 1/yi, obs (8)
The goodness of fit is defined as:
expR
Rwp (9)
and R-expected (Rexp) is defined as:
2/1
2
,exp /)(
iobsii ywPNR (10)
where N is the number of profile points (i) and P is number of Rietveld parameters.
The RI (or R-Bragg factor) is defined as:
hklhklobs
hklhklcalchklobs
II
II
R),(
),(),(
(11)
where I(obs), hkl and I(calc), hkl are the ‘observed’ and calculated integrated intensities of the Bragg
reflections (peaks) with Miller indices h,k,l.
The agreement factors above provide a better overall view of the convergence of the
refinement and they are useful in determining whether a model is correct.

27
4. Results
TTF-o-CA
The crystallographic data of TTF-o-CA is shown in table 3. The unit cell parameters were
found with DICVOL24 and the most likely space group symmetry P21/n was determined with the
program EXPO.28 A set of integrated intensities for the reflections was extracted with the
program GSAS.29 The Cartesian coordinates utilized for crystal structure solution were taken
from another polymorph of TTF-o-CA.31 The program PSSP22 was run using the integrated
intensities of the first 225 reflections and 250,000 models per temperature (1.225 107 total trial
models). However, the analysis of the crystallographic models obtained did not provide a
conclusive result for the crystal structure solution.
28
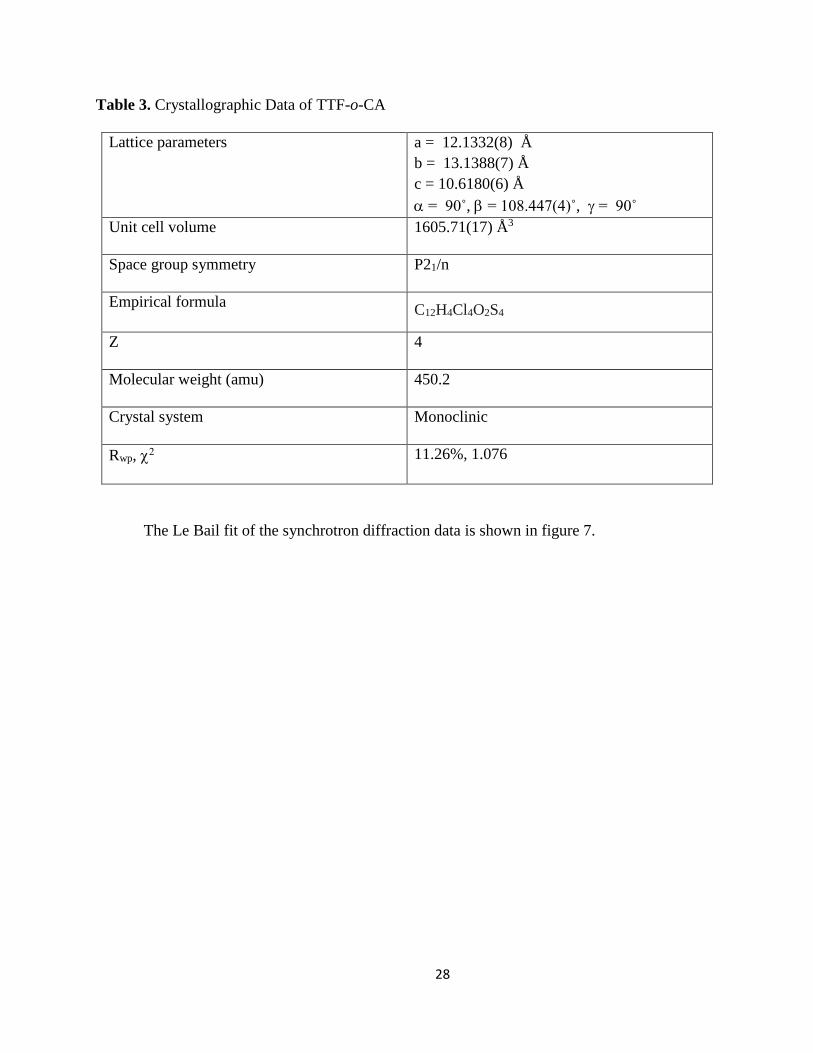
Table 3. Crystallographic Data of TTF-o-CA
Lattice parameters a = 12.1332(8) Å
b = 13.1388(7) Å
c = 10.6180(6) Å
= 90˚, = 108.447(4)˚, = 90˚
Unit cell volume 1605.71(17) Å3
Space group symmetry P21/n
Empirical formula C12H4Cl4O2S4
Z 4
Molecular weight (amu) 450.2
Crystal system Monoclinic
Rwp, 11.26%, 1.076
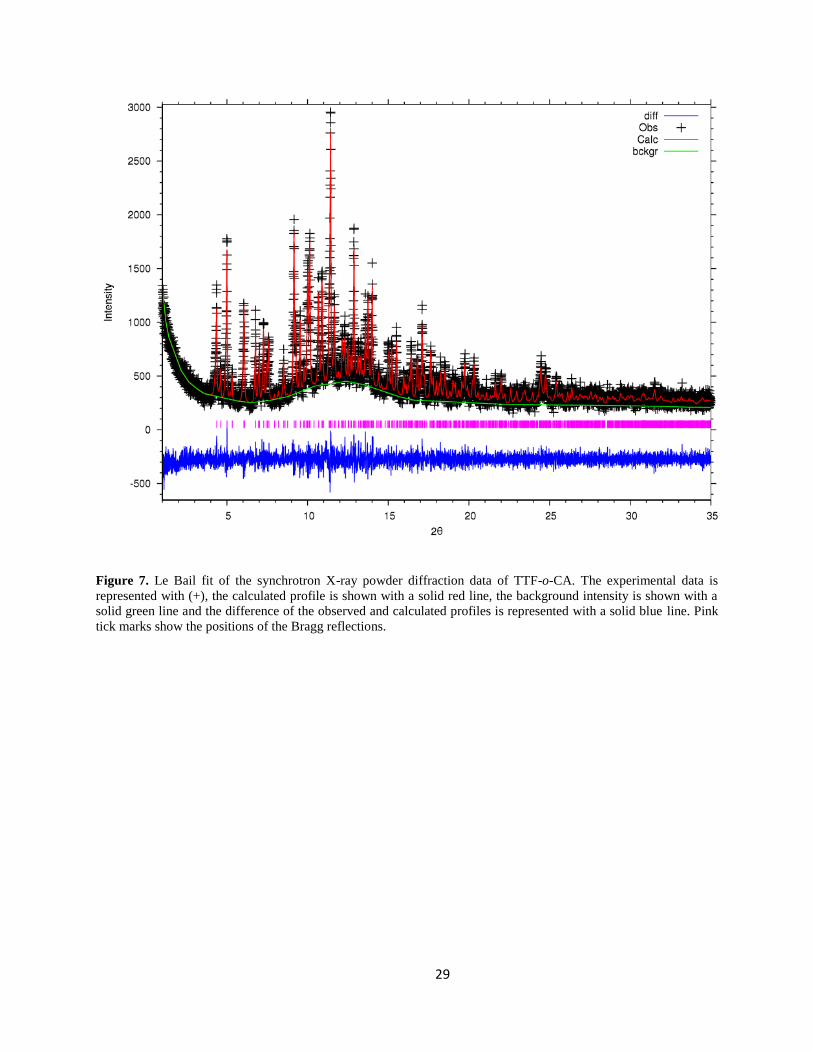
The Le Bail fit of the synchrotron diffraction data is shown in figure 7.
29
Figure 7. Le Bail fit of the synchrotron X-ray powder diffraction data of TTF-o-CA. The experimental data is
represented with (+), the calculated profile is shown with a solid red line, the background intensity is shown with a
solid green line and the difference of the observed and calculated profiles is represented with a solid blue line. Pink
tick marks show the positions of the Bragg reflections.

30
TTF-2, 5-dichloro-p-benzoquinone
The crystallographic data of TTF-2,5-dichloro-p-benzoquinone is summarized in table 4.
The Rietveld fits of the neutron powder diffraction data and the synchrotron X-ray powder
diffraction data are shown in the figures 8 and 9, respectively. Both datasets were simultaneously
fitted by the crystallographic model refined. In the final Rietveld cycles the following parameters
were refined: unit cell parameters, thermal displacement parameters, background coefficients
(both datasets), zero point error in the detector (both datasets), and scale factors. Other
parameters previously refined have been the peak profile parameters and preferred orientation
parameters (both datasets).
The molecular geometries of TTF and 2,5-dichloro-p-benzoquinone were refined
subjected to bond length, bond angle restraints and planarity restraints using GSAS.29 The values
for the restraints were obtained from Le Cointe et al.9 for the room temperature structure of TTF-
CA from single crystal neutron diffraction data.
31
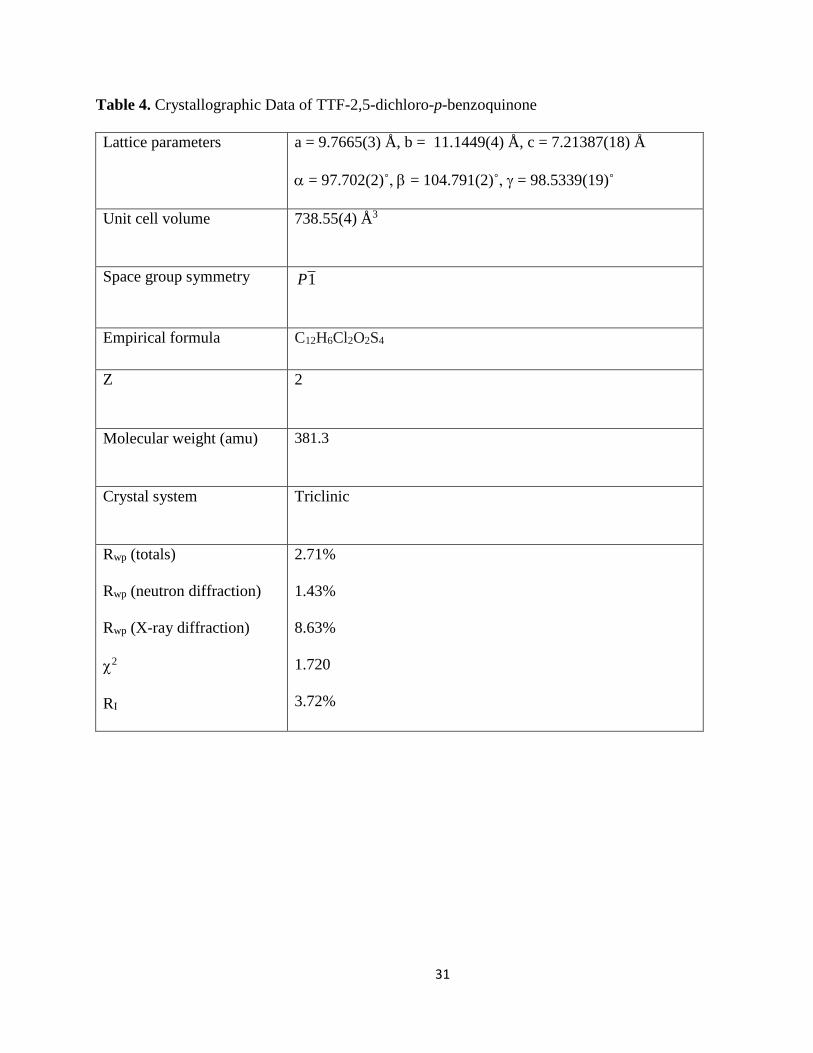
Table 4. Crystallographic Data of TTF-2,5-dichloro-p-benzoquinone
Lattice parameters a = 9.7665(3) Å, b = 11.1449(4) Å, c = 7.21387(18) Å
= 97.702(2)˚, = 104.791(2)˚, = 98.5339(19)˚
Unit cell volume 738.55(4) Å3
Space group symmetry 1P
Empirical formula C12H6Cl2O2S4
Z 2
Molecular weight (amu) 381.3
Crystal system Triclinic
Rwp (totals)
Rwp (neutron diffraction)
Rwp (X-ray diffraction)
2
RI
2.71%
1.43%
8.63%
1.720
3.72%
32
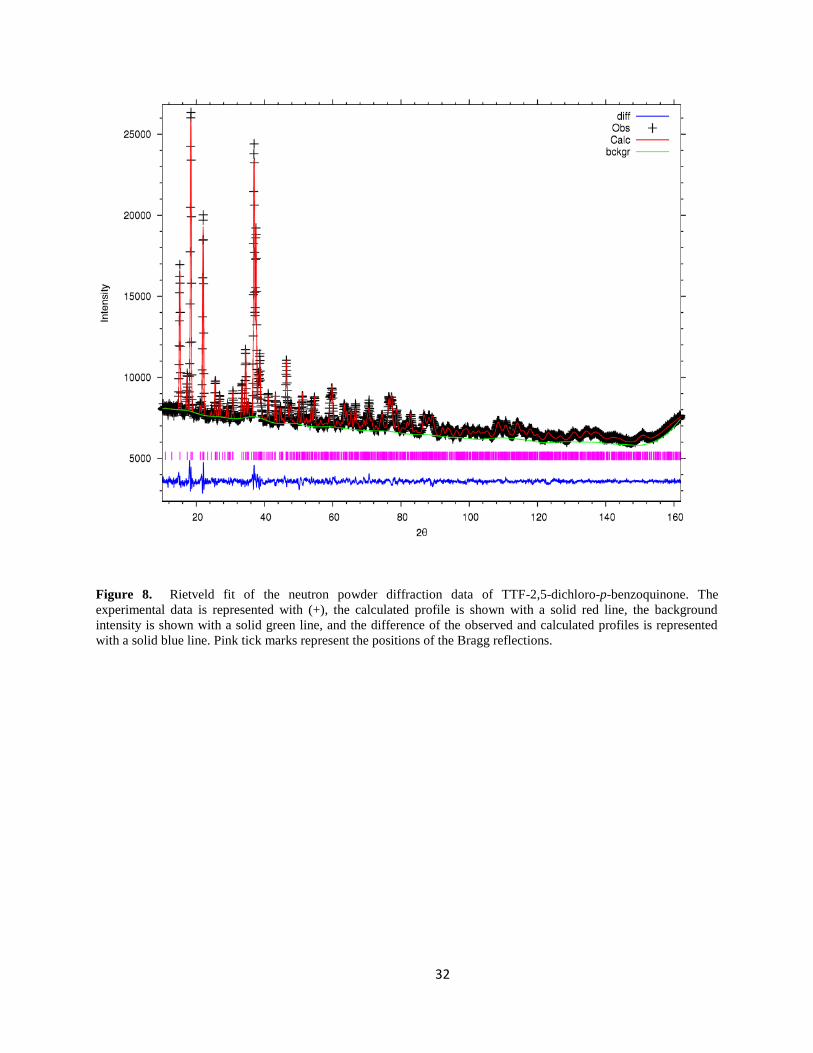
Figure 8. Rietveld fit of the neutron powder diffraction data of TTF-2,5-dichloro-p-benzoquinone. The
experimental data is represented with (+), the calculated profile is shown with a solid red line, the background
intensity is shown with a solid green line, and the difference of the observed and calculated profiles is represented
with a solid blue line. Pink tick marks represent the positions of the Bragg reflections.
33
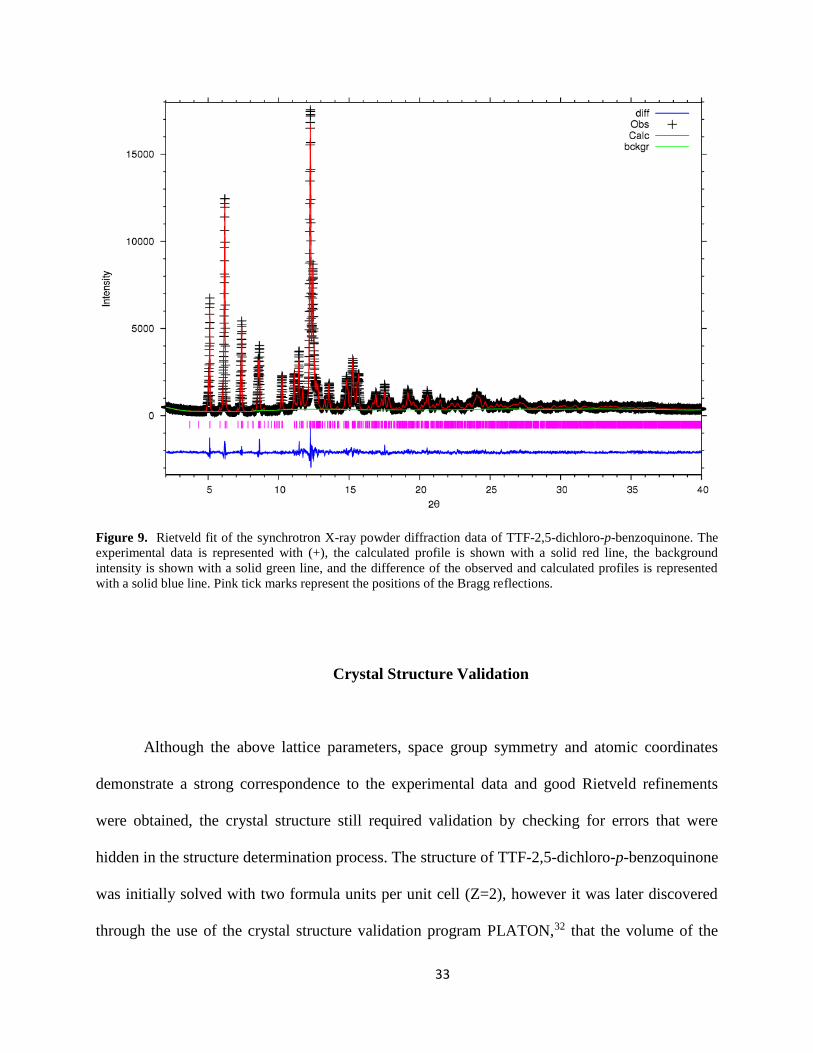
Figure 9. Rietveld fit of the synchrotron X-ray powder diffraction data of TTF-2,5-dichloro-p-benzoquinone. The
experimental data is represented with (+), the calculated profile is shown with a solid red line, the background
intensity is shown with a solid green line, and the difference of the observed and calculated profiles is represented
with a solid blue line. Pink tick marks represent the positions of the Bragg reflections.
Crystal Structure Validation
Although the above lattice parameters, space group symmetry and atomic coordinates
demonstrate a strong correspondence to the experimental data and good Rietveld refinements
were obtained, the crystal structure still required validation by checking for errors that were
hidden in the structure determination process. The structure of TTF-2,5-dichloro-p-benzoquinone
was initially solved with two formula units per unit cell (Z=2), however it was later discovered
through the use of the crystal structure validation program PLATON,32 that the volume of the

34
initial unit cell found at the indexing step was unnecessarily duplicated, and there is one formula
unit per unit cell (Z=1) and inversion symmetry in the TTF and 2,5-dichloro-p-benzoquinone
molecules. PLATON32 checks for missing symmetry - often difficult to find at the initial stages
of a structure solution. The corrected structural description is summarized in the table 5.
Table 5. Validated Crystallographic Data of TTF-2,5-dichloro-p-benzoquinone
Lattice parameters a = 6.841764(2) Å, b = 7.213306(17) Å, c = 7.934819(2) Å
= 93.618(17)˚, = 97.627(19)˚, = 106.941(19)˚
Unit cell volume 369.147(17) Å3
Space group symmetry 1P
Empirical formula C12H6Cl2O2S4
Z 1
Molecular weight (amu) 381.3
Crystal system Triclinic
Rwp (totals)
Rwp (neutron diffraction)
Rwp (X-ray diffraction)
2
RI
2.58%
1.37%
7.8%
1.441
2.1%

35
The validated structure is now used to describe the packing of the molecules in the
crystal. TTF-2,5-dichloro-p-benzoquinone is made of columnar stacks of alternating TTF and
2,5-dichloro-p-benzoquinone molecules, which extend along the direction of the b-axis. This
packing motif is represented in the figure 10 (a). Adjacent columns are bonded in the crystal
through weak hydrogen bonds and non-covalent interactions between pairs of sulfur atoms,
forming layers. This can be seen from a direction parallel to the b-axis shown in the figure 10
(b).
(a)
Figure 10. (a) A column of alternating TTF and 2,5-dichloro-p-benzoquinone molecules in the crystal structure of
TTF-2,5-dichloro-p-benzoquinone, extending along the direction of the b-axis (shown in green). (b) Layers of TTF
and 2,5-dichloro-p-benzoquinone with weak hydrogen bond formation and sulfur-sulfur non covalent interactions,
viewed from a direction parallel to the b-axis. Representations generated by the program Mercury.33 S=yellow,
C=grey, Cl=green, O=red and H=light grey.
Charge Transferred in TTF-2,5-dichloro-p-benzoquinone
M. Le Cointe et al.9 cite two empirical formulas to calculate charge transferred for
organic CTS. The first formula is more reliable than the second one.
(a) (b)
36
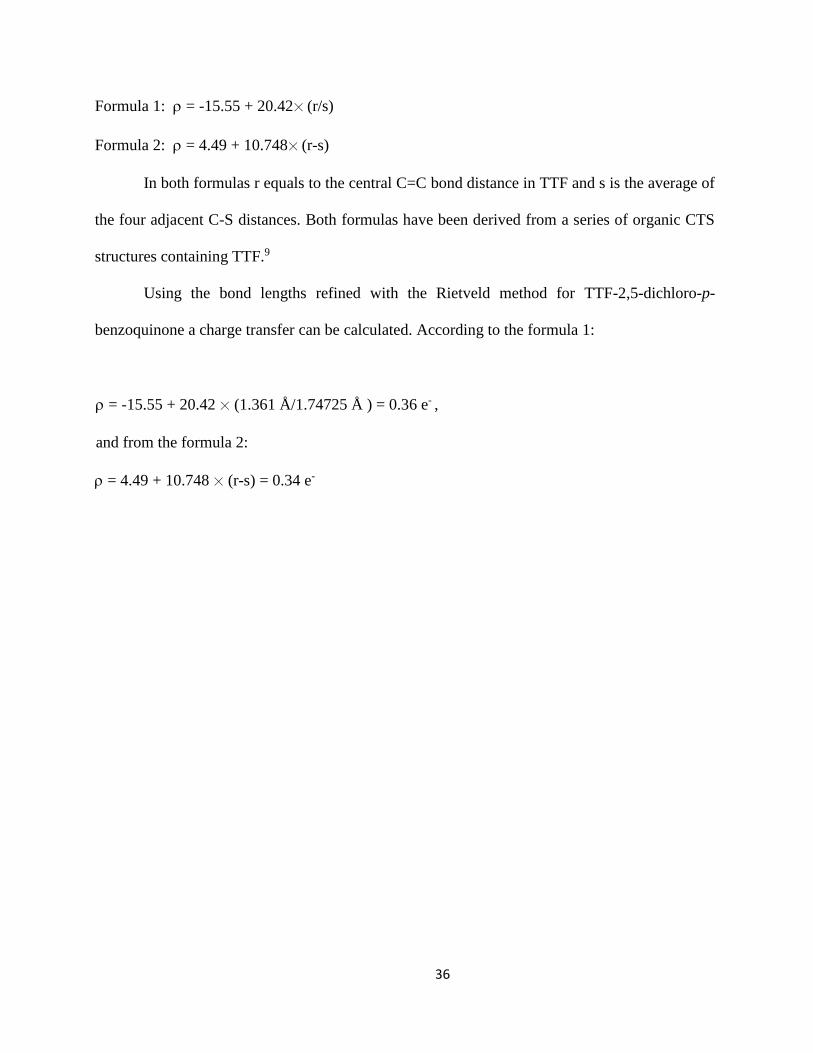
Formula 1: = -15.55 + 20.42 (r/s)
Formula 2: = 4.49 + 10.748 (r-s)
In both formulas r equals to the central C=C bond distance in TTF and s is the average of
the four adjacent C-S distances. Both formulas have been derived from a series of organic CTS
structures containing TTF.9
Using the bond lengths refined with the Rietveld method for TTF-2,5-dichloro-p-
benzoquinone a charge transfer can be calculated. According to the formula 1:
= -15.55 + 20.42 (1.361 Å/1.74725 Å ) = 0.36 e- ,
and from the formula 2:
= 4.49 + 10.748 (r-s) = 0.34 e-
37
5. Discussion
The Rietveld fit of the synchrotron and neutron powder diffraction data of TTF-2,5-
dichloro-p-benzoquinone has acceptable agreement factors of Rwp = 2.58%, RI = 2.1 % and 2 =
1.441. The charge transferred () was calculated to be approximately ~0.36 e-. It is important to
note that these values may be biased by the bond length restraints and another experimental
technique should be used to further validate them (e.g. infrared spectroscopy). Based on the
packing motif of the compound, as shown in figure 10, the compound cannot be an organic
metal since it has columns made of alternating TTF and 2,5-dichloro-p-benzoquinone, which are
typical of semiconductors/insulators. Moreover, the space group 1P is not compatible with
ferroelectricity.
For TTF-o-CA, the from the Le Bail fit obtained is acceptable (as shown in figure 7),
which indicates the correctness of the lattice parameters. However, the results from the structural
solution runs are inconclusive due to the lack of repetition of a crystal packing motif that is
chemically plausible within the solution set with the best agreement factors. There are a few
likely causes for this, such as incorrect space group symmetry or wrong parameterization of the
structure. In order to solve this structure, the next steps that should be taken include re-
examination of the space group symmetry, and a new parameterization of the structure with
more than one crystallographically independent TTF, o-CA or both fragments.

38
Acknowledgements
We acknowledge the support of the National Institute of Standards and Technology, U. S.
Department of Commerce, in providing the neutron research facilities used in this work.
We acknowledge synchrotron powder diffraction data collected at the beamline X16C of
the National Synchrotron Light Source. Use of the National Synchrotron Light Source,
Brookhaven National Laboratory, is supported by the U.S. Department of Energy, Office of
Science, Office of Basic Energy Sciences, under Contract No. DE-AC02-98CH10886.
Funding from the International Center for Diffraction Data (ICDD) GIA 08-04 is
gratefully acknowledged.
Finally, SHM is profoundly grateful for the untiring guidance and support of Dr. Silvina
Pagola throughout the thesis process, who shared her deep love of chemistry and science with a
contagious enthusiasm.
References
1. (a) "Democritus on the Atom." Scientific American (1949), 181(5), 48-49. (b) Russell, B.
“A History of Western Philosophy.” Simon and Schuster, New York, 1972.
2. Eckert, M. “Max von Laue and the discovery of X-ray diffraction in 1912”. Ann. Phys.
(Berlin) (2012), 524, A83–A85.
3. Louër, D. "Advances in Powder Diffraction Analysis." Acta Cryst. (1998) A54, 922-933.
4. Pecharsky, V. K. and Zavalij, P. Y. “Fundamentals of Powder Diffraction and the
Structural Characterization of Materials”. Kluwer Academic, Boston, 2003.
39
5. Gavezzotti, A. and Filippini, G., “Polymorphic Forms of Organic Crystals at Room
Conditions: Thermodynamic and Structural Implications”, J. Am. Chem. Soc. (1995), 117,
12299-12307.
6. Kittel, C. “Introduction to Solid State Physics”. 7th edition, John Wiley & Sons, New
York, 1996.
7. Singleton, J. "Why Do Physicists Love Charge Transfer Salts?" J. Solid State Chem.
(2012), 168, 675-689.
8. Fourmigué, M. and Batail, P. “Activation of Hydrogen- and Halogen-Bonding
Interactions in Tetrathiafulvalene-Based Crystalline Molecular Conductors,” Chem. Rev.
(2004), 104, 5379−5418.
9. Le Cointe, M., Lemée Cailleau, M. H., Cailleau, H., Toudic, B., Toupet, L., Heger, G.,
Moussa, F., Schweiss, P., Kraft, K. H. and Karl, N. "Symmetry Breaking and Structural
Changes at the Neutral-to-ionic Transition in Tetrathiafulvalene-p-chloranil." Phys. Rev.
(1995), B51, 3374-3386.
10. Atkins, P. W. “Physical Chemistry”, 4th edition, W. H. Freeman and Co., New York,
1990.
11. Clegg, W., “Crystal structure determination”, Oxford Chemistry Primers No. 60, Oxford
University Press, UK, 1998.
12. Massa W., “Crystal structure determination”, Springer-Verlag, Germany, 2000.
13. Rietveld, H. M. "A Profile Refinement Method for Nuclear and Magnetic Structures." J.
Appl. Cryst. (1969), 2, 65-71.
14. Le Bail, A. “Whole powder pattern decomposition methods and applications: a
retrospection,” Powder Diffraction (2005), 20, 316-326.
40
15. Young, R. A., “The Rietveld Method”, IUCr Monographs on Crystallography, Oxford
Science Publications, Oxford, UK, 1993.
16. Deem M. W. and Newsam, J. M.. Nature (1989), 342, 260-262.
17. Kirkpatrick, S., Gelatt, C. D. and Vecchi, M. P. "Optimization by Simulated Annealing".
Science (1983), 220, 671-680.
18. David, W. I. F. and Shankland, K. "Structure Determination from Powder Diffraction
Data”. Acta Cryst. (2008), A64, 52-64.
19. Harris, K. D. M. and Tremayne, M. "Crystal Structure Determination from Powder
Diffraction Data." Chem. Mater. (1996), 8, 2554-2570.
20. Chernyshev, V. V., “Structure determination from powder diffraction”, Russ. Chem.
Bull., Int. Ed., (2001), 50, 2273-2292.
21. Černý, R. and Favre-Nicolin, V., “Direct space methods of structure determination from
powder diffraction: principles, guidelines and perspectives”, Z. Kristallogr. (2007), 222,
105-113.
22. Pagola S. and Stephens, P. W., J. Appl. Cryst. (2010), 43, 370-376.
23. Roisnel, T., and Rodriguez-Carvajal, J.. Program WinPLOTR (2011). Downloadable
from http://www.cdifx.univ‐rennes1.fr/winplotr/winplotr.htm.
24. Boultif, A. and Loüer, D. J. Appl. Cryst. (2004), 37, 724-731.
25. Visser, J.. J. Appl. Cryst. (1969), 2, 89-95.
26. Werner, P. E., Eriksson, L. and Westdahl, M.. J. Appl. Cryst. (1985), 18, 367-370.
27. Le Bail, A.. Powder Diffraction (2004), 19, 249-254.
28. Altomare A., Caliandro, R., Camalli, M., Cuocci, C., Giacovazzo, C., Moliterni, A. G. G.
and Rizzi, R.. J. Appl. Cryst. (2009), 42, 1197-1202.
41
29. Larson, A. C. and Von Dreele, R. B.. Program GSAS (2004). Los Alamos National
Laboratory report LAUR 86-748.
30. Rodriguez-Carvajal, J. Physica B (1993), 192, 55.
31. Rosokha, S. V., Dibrov, S. M., Rosokha T. Y. and Kochi, J. K.. Photochem. Photobiol.
Sci., (2006), 5, 914–924.
32. Spek, A. L., Acta Cryst. (2009), D65, 148-155.
33. Macrae, C. F., Edgington, P. R., McCabe, P., Pidcock, E., Shields, G. P., Taylor, R.,
Towler, M. and van De Streek, J. J. Appl. Cryst. (2006), 39, 453-457.