structure and properties of reactively extruded opaque
TRANSCRIPT

polymers
Article
Structure and Properties of Reactively Extruded OpaquePost-Consumer Recycled PET
María Virginia Candal 1,†, Maryam Safari 1,†, Mercedes Fernández 1 , Itziar Otaegi 1 , Agurtzane Múgica 1,Manuela Zubitur 2 , Gonzalo Gerrica-echevarria 1 , Víctor Sebastián 3,4 , Silvia Irusta 3,4 , David Loaeza 5 ,Maria Lluisa Maspoch 5 , Orlando O. Santana 5 and Alejandro J. Müller 1,6,*
�����������������
Citation: Candal, M.V.; Safari, M.;
Fernández, M.; Otaegi, I.; Múgica, A.;
Zubitur, M.; Gerrica-echevarria, G.;
Sebastián, V.; Irusta, S.; Loaeza, D.;
et al. Structure and Properties of
Reactively Extruded Opaque
Post-Consumer Recycled PET.
Polymers 2021, 13, 3531. https://
doi.org/10.3390/polym13203531
Academic Editor: Sheila Devasahayam
Received: 13 September 2021
Accepted: 10 October 2021
Published: 14 October 2021
Publisher’s Note: MDPI stays neutral
with regard to jurisdictional claims in
published maps and institutional affil-
iations.
Copyright: © 2021 by the authors.
Licensee MDPI, Basel, Switzerland.
This article is an open access article
distributed under the terms and
conditions of the Creative Commons
Attribution (CC BY) license (https://
creativecommons.org/licenses/by/
4.0/).
1 POLYMAT and Department of Polymers and Advanced Materials: Physics, Chemistry and Technology,Faculty of Chemistry, University of the Basque Country UPV/EHU, Paseo Manuel de Lardizabal 3,20018 Donostia-San Sebastián, Spain; [email protected] (M.V.C.);[email protected] (M.S.); [email protected] (M.F.); [email protected] (I.O.);[email protected] (A.M.); [email protected] (G.G.-e.)
2 Chemical and Environmental Engineering Department, Polytechnic School, University of the Basque CountryUPV/EHU, 20018 Donostia-San Sebastián, Spain; [email protected]
3 Department of Chemical and Environmental Engineering & Instituto de Nanociencia y Materiales de AragónINMA, University of Zaragoza, Pedro Cerbuna 12, 50009 Zaragoza, Spain; [email protected] (V.S.);[email protected] (S.I.)
4 Networking Research Center CIBER-BBN, 28029 Madrid, Spain5 Centre Català del Plàstic—Universitat Politècnica de Catalunya Barcelona Tech (EEBE-UPC)-ePLASCOM
Research Group, Av. d’Eduard Maristany, 16, 08019 Barcelona, Spain; [email protected] (D.L.);[email protected] (M.L.M.); [email protected] (O.O.S.)
6 IKERBASQUE, Basque Foundation for Science, Plaza Euskadi 5, 48009 Bilbao, Spain* Correspondence: [email protected]; Tel.: +34-9431-8191† These authors contributed equally to this work.
Abstract: The recyclability of opaque PET, which contains TiO2 nanoparticles, has not been aswell-studied as that of transparent PET. The objective of this work is to recycle post-consumeropaque PET through reactive extrusion with Joncryl. The effect of the reactive extrusion process onthe molecular structure and on the thermal/mechanical/rheological properties of recycling post-consumer opaque PET (r-PET) has been analyzed. A 1% w/w Joncryl addition caused a moderateincrease in the molecular weight. A moderate increase in chain length could not explain a decrease inthe overall crystallization rate. This result is probably due to the presence of branches interruptingthe crystallizable sequences in reactive extruded r-PET (REX-r-PET). A rheological investigationperformed by SAOS/LAOS/elongational studies detected important structural modifications inREX-r-PET with respect to linear r-PET or a reference virgin PET. REX-r-PET is characterized by a slowrelaxation process with enlarged elastic behaviors that are characteristic of a long-chain branchedmaterial. The mechanical properties of REX-r-PET increased because of the addition of the chainextender without a significant loss of elongation at the break. The reactive extrusion process is asuitable way to recycle opaque PET into a material with enhanced rheological properties (thanks tothe production of a chain extension and long-chain branches) with mechanical properties that arecomparable to those of a typical virgin PET sample.
Keywords: recycled opaque PET; reactive extrusion; chain extension; long-chain branching
1. Introduction
Plastics are a remarkable family of materials that improve the quality of life for peopleworldwide, because they make life easier, more comfortable, and safer. However, wastedisposal is one of the major problems faced by the environment in the plastics industry. Inaddition, people have become used to single-use or disposable plastic. In 2018, 29.1 milliontons of plastic post-consumer waste were collected in Europe to be treated. From 2006 to
Polymers 2021, 13, 3531. https://doi.org/10.3390/polym13203531 https://www.mdpi.com/journal/polymers

Polymers 2021, 13, 3531 2 of 30
2018, the volume of plastic product waste collected for recycling increased by 32.5%, theenergy recovery increased by 42.6%, and landfills decreased by 24.9% [1].
Recycling plastics is one of the many initiatives launched in Europe to turn wasteinto resources to create a circular economy for plastics [2–5]. The majority of plastic wasteis thermoplastic polymers, which can be recycled through remelting and reforming intonew objects, a process which is known as mechanical recycling. The mechanical recyclingof plastics is by far the most common recycling method that prevents different environ-mental contamination problems: the destruction of marine life and ocean biodiversity;accumulation in landfills; and harm to humans, animals, and plants, amongst others. Inthe last decades, increasing interest has been focused on recycling plastic wastes, especiallypolyethylene terephthalate (PET).
PET is one of the most widely used thermoplastic polymers, because it is a lightweightplastic with excellent mechanical, chemical, thermal, and permeability (oxygen and carbondioxide) properties and good dimensional stability and impact resistance [6–9]. PET ismainly used for bottles (soft drinks, juices, water, carbonated soft drinks, milk, sportsand energy drinks, pharmaceutical products, cooking oils, vinegar, detergents, householdchemicals, dairy products, cosmetics, salad dressings, peanut butter, mouthwash, shampoo,liquid hand soap, window cleaner, even tennis balls, etc.); packaging films; and textilefibers. However, PET is not biodegradable, but it is recyclable. The PET recycling termrefers to operations that aim to recover PET that can be converted into plastics items as asubstituted version of virgin PET.
On the other hand, opaque (white) PET was recently introduced as UHT (Ultra-HighTemperature)-treated milk packaging (bottles). Opaque PET bottles are gradually replacingcoextruded and high-density polyethylene milk bottles. The use of monolayer white PETbottles is increasing, because it provides the functionality and light protection that UHTmilk requires, an advantage that other packaging options do not offer. In addition, it hasthe potential to achieve the sustainability aspects demanded by consumers and required byregulations. Opaque PET is a PET filled with mineral nanoparticles (titanium dioxide TiO2nanoparticles) that allows reducing the bottle thickness while improving the UV stability.
Today, the recyclability of opaque PET is a problem, because recycling companiesare not well-prepared to separate and recycle it, unlike what happens with transparentPET [10]. Even though there are available infrastructures for collecting and sorting PETproducts globally, only 20−30% of transparent PET is recycled (r-PET), mostly by mechani-cal recycling methods. Degradation of the molecular weight during extrusion and injectionmolding is one of the main problems in PET recycling [11–13].
Chemical recycling includes various techniques that depolymerize plastic waste withsome combination of solvents, heat, pressure, and catalysts into their monomers. There-fore, chemical recycling leads to consuming more solvent, time, and energy and is onlyeconomically and environmentally sound in a few cases. Mechanical recycling is an envi-ronmentally friendly and relatively straightforward process, and for this, it is a valuabletechnique to recycle PET. Moreover, the process conditions used are easy to control. Someauthors studied several aspects of PET mechanical recycling [14]: the maximum numberof extrusion cycles of PET that can reduce its mechanical properties [15], blends withvirgin PET [16–18], the use of chain extenders that reverse some of the damage caused bypolymer chain degradation [19–22], blends with other virgin polymers [23–25], blends withclays [26], liquid-state polycondensation (LSP), and so on.
An exciting point is the use of chain extenders to join polymer chain segments brokenduring the processing and balancing of molar mass reduction due to the degradationsuffered, promoting increases in the molar mass [27]. In this way, a recovery of themechanical properties of the r-PET could be obtained. PET is chemically and thermallydegraded during its processing due to its high melting temperature, sensitivity to humidity,and number of times of reprocessing. Different types of chain extenders have been used toimprove the mechanical properties that PET loses during the processing.
Polymers 2021, 13, 3531 3 of 30
For example, Cavalcanti et al. [19] used triphenyl phosphite (TPP) as a chain extenderof virgin PET and r-PET. They observed that virgin PET could react more easily with TPPin comparison with r-PET. Moreover, Raffa et al. [20] studied the effect of two difunctionalchain extenders: namely, 1,6-diisocyanatohexane (NCO) and 1,4-butanediol diglyc-idylether (EPOX), in the melting properties of a r-PET. These chain extenders affected thecrystallization behavior and the mechanical properties of r-PET.
Other authors used an epoxidic multifunctional oligomer (Joncryl) recommendedfor processing with condensation polymers, such as PET. It is one of the most used chainextenders with the highest industrial relevance [28,29]. For example, Duarte et al. [27]explained that the molar mass is modified, depending on the additive content. They useda PET with a 1.5% concentration of Joncryl, and it preserves chain extension capabilities tosustain reprocessing without a molar mass decrease.
Recycling opaque PET (r-PET) bottles is more challenging. Few authors have in-vestigated this problem. Tramis et al. [30] studied the increase of the mechanical prop-erties (tensile and fatigue life) of recycled polypropylene (rPP) by the incorporation ofuncompatibilized blends with r-PET. These blends could be used to substitute r-PP forsimilar applications.
This work aims to recycle opaque PET, employing reactive extrusion with Joncryl (anepoxy-based chain extender).
2. Materials and Methods2.1. Materials
The PET obtained from opaque bottles was supplied by Suez RV Plastiques Atlantique,Bayonne, France, under the trade name of Floreal. Post-consumer recycled PET fromopaque UHT milk bottles was processed to obtain two types of materials: a homogenizedrecycled post-consumer opaque PET (denoted r-PET) and a reactive (modified) recycledpost-consumer opaque PET (denoted REX-r-PET). Prior to each processing step, r-PETmaterials were dried for 4h at 120 ◦C in a PIOVAN hopper-dryer (DSN506HE, Venice,Italy) with a dew point of −40 ◦C. To obtain regular geometry pellets that allow a constantfeeding condition in the subsequent manufacture processes, the original heterogeneouspost-consumer PET flakes were homogenized (r-PET) by a single-screw extrusion process.In this case, an extruder with L/D = 25 (IQAP-LAP E30/25, Spain) was employed with fourheating zones along the profile of the screw. The temperature profile was set to 175 (hopperzone)/195/225/245 ◦C (die zone) and a screw rotation speed of 50 rpm. The processwas performed in a N2-controlled atmosphere to minimize thermooxidative degradation.The r-PET filament obtained was quenched in two room temperature water baths, dried,and then cut into pellets. Then, this material was recrystallized in an oven at 120 ◦C forfour hours to increase the crystallinity up to 20–30%. These pellets were used to preparethe REX-r-PET.
The reactive extrusion of r-PET was performed using a corotating twin-screw extruderwith L/D = 36 (KNETER-25X24D, Collin GmbH, Germany). As a reactive (chain extender)reagent, a multifunctional epoxide agent (Joncryl ADR-4400®BASF, Germany) with anepoxy equivalent weight of 485 g/mol and functionality of 14 was added (1 wt%). The tem-perature profile of the extruder was set to 175 (hopper zone)/215/230/235/240/245/245◦C (die zone), and the screw speed was 40 rpm, leading to residence times of 4.1 min. Theprocess was performed in vacuum to avoid further degradation. Then, the REX-r-PETproduct was water-cooled, dried, and pelletized; after which, the acquired material wasonce again recrystallized at 120 ◦C for 4 h.
Unprocessed PET (virgin PET) that was used for comparison purposes was supplied byNovapet (Novapet CR) with an intrinsic viscosity of 0.80 dL/g in m-cresol. For comparisonpurposes, it is important to note that, contrary to r-PET and REX-r-PET, virgin PET doesnot contain TiO2 particles.

Polymers 2021, 13, 3531 4 of 30
2.2. Intrinsic Viscosity
The intrinsic viscosity measurements were performed using an Ubbelohde Type 1Bglass capillary viscometer and the ASTM D4603-03 standard method. The samples weredried 5 hours at 100 ◦C under vacuum, and then, they were placed in a constant tem-perature bath at 30 ± 0.2 ◦C. They were dissolved in a phenol/1,1,2,2-tetrachloroethane(60/40 (w/w)) solution at 110 ◦C and 50 rpm for 30 min. When the dissolution was com-plete, the solutions were cooled to 30 ◦C, filtered, and tested. According to the solvent andtemperature used in this study, the Bercowitz equation can be found in the literature [31,32]in order to calculate the number-average molecular weight, Mn, and the weight-averagemolecular weight, Mw, from the solution intrinsic viscosity [η]:
[η] = 11.66 ∗ 10−4(Mn)0.648 (1)
[η] = 7.44 ∗ 10−4(Mw)0.648 (2)
2.3. Thermogravimetry Analysis (TGA)
A thermogravimetry analysis (TGA) was performed with a PerkinElmer Thermogravi-metric Analyzer TGA-8000 (Waltham, MA, USA) under air atmosphere flow. The samplewas heated from 40 ◦C up to 800 ◦C at a rate of 20 ◦C/min. All materials were dried at100 ◦C for 5 h using a vacuum-oven before TGA measurement.
2.4. Transmission Electron Microscopy (TEM)
The distribution of TiO2 nanoparticles was determined by Transmission Electron Mi-croscopy (TEM) analysis. The samples were first cut at room temperature with a diamondknife on a Leica EMFC 6 ultramicrotome device (Leica Geosystems AG, Unterentfelden,Switzerlan). The ultra-thin sections of 90 nm thick were mounted on 200-mesh copper grids.The samples were examined using two TEM equipments: (a) TECNAI G2-20 TWIN TEMequipped with LaB6 filament operating at an accelerating voltage of 120 kV (ThermoFisherScientific, Waltham, MA, USA) and (b) FEI Tecnai T20 thermionic LaB6 filament (FEI,Hillsboro, OR, USA) at 200 kV. To image the lamellar morphology, a RuO4 solution wasemployed for staining; then, the samples were cut and analyzed.
2.5. DSC Analysis
DSC measurements were performed using a PerkinElmer 8500 Pyris model (Waltham,MA, USA) calorimeter equipped with a cooling system (Intracooler 2P), under a nitro-gen atmosphere flow. The DSC was calibrated with indium (Tm, onset = 156.61 ◦C and∆Hm = 28.71 J/g). Around 5 mg of the samples were sealed in aluminum pans. Thepolymers were dried for 5 h under vacuum at 100 ◦C to remove moisture before anymeasurements. For nonisothermal measurements, two types of samples were studied:(1) the original pellets of virgin PET (as received), r-PET, and REX-r-PET materials (ex-truded only one time) were extruded a second time (at 270 ◦C and 80 rpm) and repelletized(results presented in Section 3.4) and (2) the samples obtained directly from the injectionmolded specimens (results presented in Section 3.9); see below the conditions of injectionmolding. For isothermal DSC measurements, only the former samples were studied.
Nonisothermal DSC measurements were performed following this sequence: (1) Afirst heating was performed from 25 ◦C up to 290 ◦C. (2) The previous thermal history waserased by keeping the samples at 290 ◦C for 3 min. (3) Cooling down the molten sample to−20 ◦C at a controlled rate of 20 ◦C/min. (4) Holding the sample at −20 ◦C for 1 min toequilibrate the temperature. (5) Heating up from −20 ◦C to 290 ◦C at 20 ◦C/min. Fromthese measurements, all relevant transition temperatures and enthalpies were obtained.
Isothermal measurements were performed using the procedure recommended byLorenzo et al. [33] in extruded pellets, as mentioned before: (1) Erasing the thermal historyat 265 ◦C (a temperature of approximately 30 ◦C above the peak melting temperature of thesample) for 3 min. (2) Fast cooling to the chosen crystallization temperature at 60 ◦C/min.

Polymers 2021, 13, 3531 5 of 30
(3) Holding under an isothermal state at the chosen Tc for a sufficient time to completecrystallization until saturation (typically, the peak time × 3). (4) Heating from Tc to 265 ◦Cat a rate of 20 ◦C /min. The polymers were dried for 5 h under vacuum at 100 ◦C to removethe moisture before the isothermal experiments. The minimum isothermal crystallizationtemperature (Tc) employed was the lowest temperature, which did not show any meltingenthalpy during the immediate subsequent heating (see the details in Reference [33]).
2.6. Wide Angle X-ray Diffraction (WAXS)
WAXS data were collected with a Bruker D8 Advance diffractometer (Bruker, San Jose,CA, USA) operating at 30 kV and 20 mA, equipped with a Cu tube (λ = 1.5418 Å) and aVantec-1 PSD detector. The patterns were recorded in 2θ steps of 0.033◦ in the 5 ≤ 2θ ≤ 38range. For this experiment, the samples were nonisothermally crystallized from the melt(280 ◦C) at a rate of 20 ◦C/min. Then, the samples were kept at room temperature duringthe WAXS experiment.
2.7. Rheology
The rheological properties were investigated by small-amplitude oscillatory shear(SAOS), large-amplitude oscillatory shear (LAOS), and uniaxial extensional measurementsperformed on a strain-controlled rotational rheometer ARES-G2 (TA Instruments, NewCastle, DE, USA). The SAOS experiments were conducted at strain amplitudes in the linearviscoelastic region covering the frequency range fromω = 100 to 0.1 Hz at the temperaturesT = 260, 270, and 280 ◦C. The LAOS experiments were performed at T = 260 ◦C, and theapplied range of the deformation amplitude was 10–1000% at an excitation frequency ofω = 0.1 Hz. The SAOS and LAOS experiments were conducted using a parallel plategeometry with diameter d = 12 mm and gap h ≈ 1 mm.
Extensional experiments were conducted using an EVF fixture at extensional ratesbetween
.ε = 1 and 5 s−1 and a maximum Hencky strain of εH = 4. The rectangular sample
dimensions were: thickness T = 0.6 ± 0.1 mm, width W = 10 ± 0.05 mm, and lengthL = 17 ± 0.5 mm. The sample was quickly loaded onto the preheated drums of the EVFfixture in the convection oven at 260 ◦C.
Each experiment was performed under a nitrogen environment to prevent the oxida-tive degradation of samples. The disk-shaped samples for the SAOS and LAOS measure-ments and the rectangular-shaped films for the extensional experiments were compression-molded under vacuum at 260 ◦C for 5 min.
2.8. Injection Molding of Samples
Injection molding was carried out using the original pellets of virgin PET, r-PET,and REX-r-PET (extruded only one time during their production) in a Battenfeld BA-230E (Wittman, Wien, Germany) reciprocating screw injection molding machine to obtaintensile (ASTM D638, type IV, thickness 2 mm) and impact (ASTM D256, thickness 3.2 mm)specimens. The screw of the plasticization unit was a standard screw with a diameter of18 mm, L/D ratio of 17.8, and a compression ratio of 4. The melt and mold temperature,injection velocity, and cooling time were set at 270 ◦C, 25 ◦C, 10.2 cm3·s−1, and 20 s,respectively. The specimens were left to condition for 24 h in a desiccator before analysis ortesting. Materials were dried in an oven for 48–72 h at 70 ◦C.
2.9. Mechanical Properties
Tensile tests were performed in a universal testing machine (Instron 5569, Norwood,MA, USA). Young modulus (E), tensile strength (σt), and strain at break (εb) were obtainedfrom the load–displacement curves using a crosshead speed of 10 mm/min. A minimumof five tensile specimens were tested for each reported value.
Impact tests were performed (Ceast pendulum, ASTM D-256) on the injection-moldedspecimens with a cross-section of 12.7 × 3.2 mm. Notches were machined in the injection-

Polymers 2021, 13, 3531 6 of 30
molded bars with a depth of 2.54 mm and a radius of 0.25 mm. At least eight samples weretested to determine the average impact strength.
3. Results3.1. Intrinsic Viscosity
In Table 1, the values of intrinsic viscosity [η], weight-averaged molecular weight (Mw),and number averaged molecular weight (Mn) are reported. Virgin PET displays an intrinsicviscosity, η, of 0.702 dL/g that is somewhat lower than the value reported by NOVAPET(0.80 dL/g), the virgin PET provider. The intrinsic viscosity of the homogeneized post-consumer recycled opaque PET is substantially lower than that of virgin PET, as expected.
Table 1. Intrinsic viscosity values of the PET samples.
Material [η] *(dL/g)
Mw(kDa)
Mn(kDa)
Virgin PET 0.702 45.0 22.5r-PET 0.526 27.1 13.6
REX-r-PET 0.626 37.3 18.7
* Where to = 42.3 s, K(Mn) = 1.166 × 10⁻³, K(Mw) = 7.44 × 10⁻⁴, and α = 0.648.
Hydrolytic and thermal degradation during the recycling of PET are responsible for itsreduction in molecular weight. The presence of water in the PET promotes chain scissionduring extrusion processing [34], resulting in shorter chains with acid and hydroxyl-esterend groups. For this reason, the material was dried (see the Experimental section) atthe recommended conditions to reduce the hydrolytic degradation during processing.Thermal degradation during PET recycling also results in shorter PET chains with acidand vinyl ester end groups, which contribute to the decrease of molecular weight [35]. Thereduction in intrinsic viscosity of the post-consumer recycled r-PET probably arises froma combination of thermal and mechanical degradation that can occur during extrusion.Tavares et al. [36] obtained similar results for recycled PET.
However, our REX-r-PET exhibits a higher intrinsic viscosity value (0.626 dL/g) incomparison to that of the r-PET sample (0.526 dL/g). The Joncryl chain extender can reactwith r-PET through its epoxy groups. Both chain extension reactions and the generation oflong-chain branching are possible (as reported in [20,27,36]). As a result, an increase in themolecular weight is expected after reactive extrusion of the r-PET/Joncryl blend that leadsto REX-r-PET.
3.2. Thermal Stability
The thermal stability of virgin PET, r-PET, and REX-r-PET was studied by a ther-mogravimetry analysis (TGA) performed under an air atmosphere. The TGA traces arerepresented in Figure 1 and include two enlarged areas in order to illustrate clearly thedifferences between the samples in that temperature range.
The Virgin PET starts to decompose at around 326 ◦C (at 2% weight loss, Td,2%),whereas r-PET starts to decompose at 311 ◦C and is less stable than virgin PET (see Table 2and Figure 1). The data in Table 2 show that the initial degradation temperatures, Td,2%, ofr-PET were lower than that of REX-r-PET. Once again, the results are consistent with thefact that a reactive extrusion increases the molecular weight of recycled PET induced by aJoncryl addition.
All the PET samples decompose in a two-step process, a behavior that has beenreported previously [37–40]. In the first weight loss step (Td1) with a sharp slope, at around300–350 ◦C, PET chains are degraded into smaller fragments, and in the second step (Td2),at around 560 ◦C, the thermo-oxidative degradation of the small fragments occurs [41].The remaining weight after heating to 800 ◦C is about 0, 2.40 ± 0.08 and 2.62 ± 0.21%for the virgin PET, r-PET, and REX-r-PET samples, respectively. This remaining weightcorresponds to the percentage of TiO2 that is present in r-PET. Figure S1 shows that the

Polymers 2021, 13, 3531 7 of 30
temperatures at the maximum mass loss rate (Td1) for virgin PET, r-PET, and REX-r-PETare 432, 430, and 432 ◦C, respectively. The second step of the thermal degradation values,Td2, are similar for all the PET samples, at around 560 ◦C.
3.3. TEM Observations of TiO2 Nanoparticle Dispersion
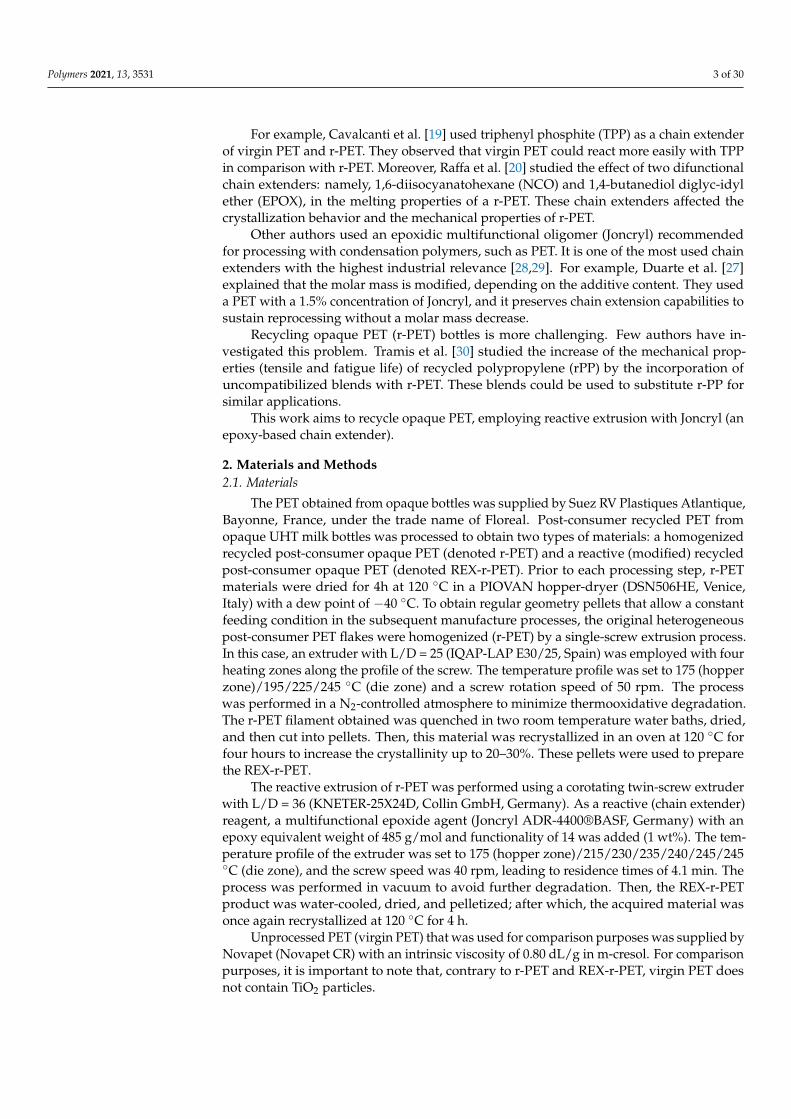
The size and dispersion of TiO2 nanoparticles inside the recycled PET matrix wereobserved by TEM. Figure 2a,b and Figure 2d,e are TEM images of r-PET and REX-r-PET, respectively. For both samples, Figure 2 shows that TiO2 nanoparticles clustersare uniformly distributed inside the matrix. Particle aggregation into clusters can beappreciated at the higher magnification images. Figures 2c and 2f shows the dispersion ofTiO2 particles within r-PET and REX-r-PET samples. The particle size histograms (in fact,cluster sizes) in both samples were determined by ImageJ software (Version 1.48f, NIH,Bethesda, MD, USA); the mean particle size and standard deviation results are insertedin the plots. The r-PET sample shows a wider TiO2 cluster size distribution as comparedto REX-r-PET. This is probably due to the fact that REX-r-PET is prepared by a reactiveextrusion of r-PET. Therefore, it undergoes an additional extrusion step that allows breakingaggregates clusters, thereby reducing the dispersion of the cluster distribution in the matrix.However, the final average TiO2 cluster diameter is very similar when the errors involvedin the measurements are taken into account: 190 ± 12 nm for r-PET and 128 ± 52 nmfor REX-r-PET.
Polymers 2021, 13, 3531 7 of 31
100 200 300 400 500 600 700 800
0
20
40
60
80
100
500 600
0
5
10
15
20
25
Virgin PET
r-PET
REX-r-PET
Weig
ht
(%)
Temperature (ºC)
Figure 1. TGA traces of the indicated the PET samples recorded under air atmosphere, including
an enlarged area at the 450–650 °C temperature range.
The Virgin PET starts to decompose at around 326 °C (at 2% weight loss, Td,2%),
whereas r-PET starts to decompose at 311 °C and is less stable than virgin PET (see Table
2 and Figure 1). The data in Table 2 show that the initial degradation temperatures, Td,2%,
of r-PET were lower than that of REX-r-PET. Once again, the results are consistent with
the fact that a reactive extrusion increases the molecular weight of recycled PET induced
by a Joncryl addition.
Table 2. Thermal parameters obtained by DTGA.
Sample Td,2% Td1
(°C)
Td2
(°C)
Residue at 800 °C
(%)
Virgin PET 326 432 560.9 0
r-PET 311 430 561.0 2.40 ± 0.08
REX-r-PET 324 432 561.0 2.62 ± 0.21
All the PET samples decompose in a two-step process, a behavior that has been re-
ported previously [37–40]. In the first weight loss step (Td1) with a sharp slope, at around
300–350 °C, PET chains are degraded into smaller fragments, and in the second step (Td2),
at around 560 °C, the thermo-oxidative degradation of the small fragments occurs [41].
The remaining weight after heating to 800 °C is about 0, 2.40 ± 0.08 and 2.62 ± 0.21% for
the virgin PET, r-PET, and REX-r-PET samples, respectively. This remaining weight cor-
responds to the percentage of TiO2 that is present in r-PET. Figure S1 shows that the tem-
peratures at the maximum mass loss rate (Td1) for virgin PET, r-PET, and REX-r-PET are
432, 430, and 432 °C, respectively. The second step of the thermal degradation values, Td2,
are similar for all the PET samples, at around 560 ºC.
3.3. TEM Observations of TiO2 Nanoparticle Dispersion
The size and dispersion of TiO2 nanoparticles inside the recycled PET matrix were
observed by TEM. Figure 2a,b and Figure 2d,e are TEM images of r-PET and REX-r-PET,
respectively. For both samples, Figure 2 shows that TiO2 nanoparticles clusters are uni-
formly distributed inside the matrix. Particle aggregation into clusters can be appreciated
at the higher magnification images. Figure 2c and Figure 2f shows the dispersion of TiO2
particles within r-PET and REX-r-PET samples. The particle size histograms (in fact, clus-
ter sizes) in both samples were determined by ImageJ software (Version 1.48f, NIH, Be-
thesda, MD, USA); the mean particle size and standard deviation results are inserted in
Figure 1. TGA traces of the indicated the PET samples recorded under air atmosphere, including anenlarged area at the 450–650 ◦C temperature range.
Table 2. Thermal parameters obtained by DTGA.
Sample Td,2%Td1(◦C)
Td2(◦C)
Residue at 800 ◦C(%)
Virgin PET 326 432 560.9 0r-PET 311 430 561.0 2.40 ± 0.08
REX-r-PET 324 432 561.0 2.62 ± 0.21
Polymers 2021, 13, 3531 8 of 30
Polymers 2021, 13, 3531 8 of 31
the plots. The r-PET sample shows a wider TiO2 cluster size distribution as compared to
REX-r-PET. This is probably due to the fact that REX-r-PET is prepared by a reactive ex-
trusion of r-PET. Therefore, it undergoes an additional extrusion step that allows breaking
aggregates clusters, thereby reducing the dispersion of the cluster distribution in the ma-
trix. However, the final average TiO2 cluster diameter is very similar when the errors in-
volved in the measurements are taken into account: 190 ± 12 nm for r-PET and 128 ± 52 nm
for REX-r-PET.
0 100 200 300 400 500 600 7000
20
40
60
80
Fre
qu
ency
Size (nm)
190±12nm(c)
0 100 200 300 400 500 600 7000
20
40
60
80
Size (nm)
128±52 nm
Fre
qu
ency
(f)
Figure 2. TEM images of r-PET (a,b) and REX-r-PET (d,e) samples and corresponding TiO2 sizes of particle distributed in
the PET matrix for r-PET (c) and REX-r-PET (f). N > 200 particles.
3.4. Nonisothermal Crystallization by DSC
The nonisothermal crystallization and melting behavior of virgin PET and the recy-
cled PET samples (recrystallized pellets) are presented in Figures 3a and 3b. The related
thermal transition data, measured from the cooling and second heating scans, including
the melting temperature (Tm), crystallization temperature (Tc), melting enthalpy (ΔHm),
and crystallization enthalpy (ΔHc), are reported in Table 3.
Table 3. Thermal properties of the PET samples. All values were obtained from the DSC scans
shown in Figure 3.
First Heating Cooling Second Heating
Tm
(°C)
ΔHm
(J/g)
Xc
(%)
Tc
(°C)
ΔHc
(J/g)
Tm
(°C)
ΔHm
(J/g)
Xc
(%)
Virgin PET 241.0 34 24 - - 243.5
179.8 (Tcc)
31
14 (Hcc) 11
r-PET 242.9 41 30 183.6 35 239.9 36 27
REX-r-PET 241.5 40 29 178.3 30 237.9 32 23
1 um
(a)
200 nm
(b)
1 um
(d)
200 nm
(e)
Figure 2. TEM images of r-PET (a,b) and REX-r-PET (d,e) samples and corresponding TiO2 sizes of particle distributed inthe PET matrix for r-PET (c) and REX-r-PET (f). N > 200 particles.
3.4. Nonisothermal Crystallization by DSC
The nonisothermal crystallization and melting behavior of virgin PET and the recy-cled PET samples (recrystallized pellets) are presented in Figure 3a,b. The related thermaltransition data, measured from the cooling and second heating scans, including the meltingtemperature (Tm), crystallization temperature (Tc), melting enthalpy (∆Hm), and crystal-lization enthalpy (∆Hc), are reported in Table 3.
The virgin PET is used as a reference in this work, and it does not contain TiO2. How-ever, r-PET is a post-consumer material that contains PET from different sources and tita-nium dioxide particles. Therefore, a direct comparison is not possible in quantitative terms.
Figure 3a shows that all samples melt at different temperatures, reflecting their thermalhistories, in a range of 241–243 ◦C. After the thermal history is erased, the crystallizationof virgin PET cannot be appreciated during cooling from the melt, as shown in Figure 3b,as expected from its well-known slow crystallization kinetics. On the other hand, bothrecycled PET samples are able to crystallize during cooling from the melt (Figure 3b). Thiscould be connected to the decrease in the molecular weight and, also, to a nucleating actionof titanium dioxide [28].
The second heating scans, in Figure 3c, show the melting endotherms for all thesamples. As can be seen in Figure 3c, the r-PET and REX-r-PET samples show a slightbimodality in their melting peaks. A similar behavior was reported for PET samplescontaining more than 1 wt% nanoparticles [42,43].
The melting enthalpy values (∆Hm) of the recycled PETs in the second heating runsare higher as compared to virgin PET. The relative crystallinity Xc was calculated using thefollowing equation:
Xc =∆Hm − ∆Hcc
(1− n)∆H0m× 100 (3)
where ∆Hm0 is the melting enthalpy of 100% crystalline PET, which is reported in theliterature as 140 J/g [44], ∆Hcc is the cold crystallization enthalpy (detected only in virginPET; see Figure 3c), and n is the quantity (%) of TiO2 nanoparticles [45].

Polymers 2021, 13, 3531 9 of 30
3.5. WAXS
Figure 4 shows the WAXS patterns of the selected PET samples that were nonisother-mally crystallized from the melt by cooling at 20 ◦C/min. The WAXS patterns of the threesamples examined revealed a semicrystalline structure with reflections characteristic ofthe crystallographic planes (011), (010), (110), and (100) for scattering angles at 2θ = 16.59◦,17.81◦, 23.04◦, and 26.25◦, respectively [46]. The unit cell of PET is triclinic with a = 4.56A,b = 5.94A, c = 10.75A, α = 98.5◦, β = 118◦, and γ = 112◦ [47]. A detailed comparison ofthe WAXS patterns of the virgin PET, r-PET, and REX-r-PET samples indicates that themain reflections of the above-mentioned crystallographic planes do not shift in the angularposition. The crystal unit cell of PET remains identical for all the samples.
Polymers 2021, 13, 3531 9 of 31
50 100 150 200 250
Hea
t fl
ow
en
do
up
1 W
/g
Temperature (ºC)
Virgin PET
r-PET
REX-r-PET
(a)
50 100 150 200 250
Hea
t fl
ow
en
do
up
1 W
/g
Temperature (ºC)
Virgin PET
r-PET
REX-r-PET
(b)
50 100 150 200 250
Hea
t fl
ow
en
do
up
1 W
/g
Temperature (ºC)
Virgin PET
r-PET
REX-r-PET
(c)
Figure 3. DSC scans of the PET samples: (a) first heating runs, (b) cooling runs from the melt, and
(c) subsequent heating runs. Cooling and heating rates were 20 °C/min in all cases.
The virgin PET is used as a reference in this work, and it does not contain TiO2. How-
ever, r-PET is a post-consumer material that contains PET from different sources and tita-
nium dioxide particles. Therefore, a direct comparison is not possible in quantitative
terms.
Figure 3a shows that all samples melt at different temperatures, reflecting their ther-
mal histories, in a range of 241–243 °C. After the thermal history is erased, the crystalliza-
tion of virgin PET cannot be appreciated during cooling from the melt, as shown in Figure
3b, as expected from its well-known slow crystallization kinetics. On the other hand, both
recycled PET samples are able to crystallize during cooling from the melt (Figure 3b). This
could be connected to the decrease in the molecular weight and, also, to a nucleating ac-
tion of titanium dioxide [28].
The second heating scans, in Figure 3c, show the melting endotherms for all the sam-
ples. As can be seen in Figure 3c, the r-PET and REX-r-PET samples show a slight bimo-
dality in their melting peaks. A similar behavior was reported for PET samples containing
more than 1 wt% nanoparticles [42,43].
The melting enthalpy values (ΔHm) of the recycled PETs in the second heating runs
are higher as compared to virgin PET. The relative crystallinity Xc was calculated using
the following equation:
Figure 3. DSC scans of the PET samples: (a) first heating runs, (b) cooling runs from the melt, and(c) subsequent heating runs. Cooling and heating rates were 20 ◦C/min in all cases.

Polymers 2021, 13, 3531 10 of 30
Polymers 2021, 13, 3531 10 of 31
𝑋𝑐 =Δ𝐻𝑚 − ∆𝐻𝑐𝑐
(1 − 𝑛)Δ𝐻𝑚0 × 100 (3)
where ΔHm0 is the melting enthalpy of 100% crystalline PET, which is reported in the lit-
erature as 140 J/g [44], ΔHcc is the cold crystallization enthalpy (detected only in virgin
PET; see Figure 3c), and n is the quantity (%) of TiO2 nanoparticles [45].
3.5. WAXS
Figure 4 shows the WAXS patterns of the selected PET samples that were nonisother-
mally crystallized from the melt by cooling at 20 °C/min. The WAXS patterns of the three
samples examined revealed a semicrystalline structure with reflections characteristic of
the crystallographic planes (011), (010), (110), and (100) for scattering angles at 2θ = 16.59°,
17.81°, 23.04°, and 26.25°, respectively [46]. The unit cell of PET is triclinic with a = 4.56A,
b = 5.94A, c = 10.75A, α = 98.5°, β = 118°, and γ = 112° [47]. A detailed comparison of the
WAXS patterns of the virgin PET, r-PET, and REX-r-PET samples indicates that the main
reflections of the above-mentioned crystallographic planes do not shift in the angular po-
sition. The crystal unit cell of PET remains identical for all the samples.
Figure 4. WAXS patterns of the PET samples at 25 °C after nonisothermal crystallization from the
melt at a rate of 20 °C/min.
WAXS patterns of r-PET and REX-r-PET show the presence of TiO2 nanoparticles
within the PET matrix. The characteristic peaks of the anatase (101) and rutile (110) crys-
talline phases of TiO2 are located at 2θ = 25.47° and 27.59°, respectively.
3.6. Overall Isothermal Crystallization by DSC
Isothermal crystallization experiments performed by DSC are used to determine the
overall crystallization kinetics (that comprises nucleation and growth). The inverse of the
crystallization half-time (1/τ50%), which represents the overall crystallization rate as a func-
tion of Tc, is shown for all the samples in Figure 5a. The overall crystallization rate de-
creases with the crystallization temperature (Tc), indicating that, in this Tc range, the over-
all crystallization rate is dominated by nucleation (both primary and secondary nuclea-
tion) [48].
According to Figure 5a, the order of the crystallization rate at any constant tempera-
ture is: r-PET > virgin PET > REX-r-PET, as illustrated in Figure 5b for a constant crystal-
lization temperature of 195 °C. It is interesting to note that the results cannot be explained
in terms of a simple difference in the molecular weights between the samples. It would be
expected that, as the molecular weight decreases, the overall crystallization kinetics would
increase in this molecular weight range. Comparing virgin PET with the homogenized
20 30 40 50 60
Inte
nsi
ty (
a. u
. )
2q()
Virgin PET
r-PET
REX-r-PET
Figure 4. WAXS patterns of the PET samples at 25 ◦C after nonisothermal crystallization from themelt at a rate of 20 ◦C/min.
Table 3. Thermal properties of the PET samples. All values were obtained from the DSC scans shownin Figure 3.
First Heating Cooling Second Heating
Tm(◦C)
∆Hm(J/g)
Xc(%)
Tc(◦C)
∆Hc(J/g)
Tm(◦C)
∆Hm(J/g)
Xc(%)
Virgin PET 241.0 34 24 - -243.5179.8(Tcc)
3114
(∆Hcc)11
r-PET 242.9 41 30 183.6 35 239.9 36 27
REX-r-PET 241.5 40 29 178.3 30 237.9 32 23
WAXS patterns of r-PET and REX-r-PET show the presence of TiO2 nanoparticleswithin the PET matrix. The characteristic peaks of the anatase (101) and rutile (110)crystalline phases of TiO2 are located at 2θ = 25.47◦ and 27.59◦, respectively.
3.6. Overall Isothermal Crystallization by DSC
Isothermal crystallization experiments performed by DSC are used to determine theoverall crystallization kinetics (that comprises nucleation and growth). The inverse of thecrystallization half-time (1/τ50%), which represents the overall crystallization rate as a func-tion of Tc, is shown for all the samples in Figure 5a. The overall crystallization rate decreaseswith the crystallization temperature (Tc), indicating that, in this Tc range, the overall crys-tallization rate is dominated by nucleation (both primary and secondary nucleation) [48].
According to Figure 5a, the order of the crystallization rate at any constant temperatureis: r-PET > virgin PET > REX-r-PET, as illustrated in Figure 5b for a constant crystallizationtemperature of 195 ◦C. It is interesting to note that the results cannot be explained interms of a simple difference in the molecular weights between the samples. It would beexpected that, as the molecular weight decreases, the overall crystallization kinetics wouldincrease in this molecular weight range. Comparing virgin PET with the homogenizedpost-consumer PET sample (r-PET), the expected behaviour is observed, as the recycledmaterial has a lower molecular weight, which enhances its overall crystallization rate.
If the REX-r-PET sample would be constituted just by linear chains, then its overallcrystallization rate should have been between virgin PET and r-PET, according to theirmolecular weight differences (Table 1). However, as it will be shown by the rheologicalmeasurements, the reactive extrusion of PET/Joncryl leads not only to chain extensionbut, also, to the production of long-chain branching. Branching interrupts the linear

Polymers 2021, 13, 3531 11 of 30
crystallizable sequences of the PET chains, acting as defects (which are normally forced outof the crystals and into the amorphous regions), thereby reducing the crystallization rate,as shown in Figure 5a. In this way, even though the molecular weight of the virgin PETused here is higher than that of REX-r-PET, it has a higher crystallization rate because ofthe differences in the chain structure between the two samples.
Polymers 2021, 13, 3531 11 of 31
post-consumer PET sample (r-PET), the expected behaviour is observed, as the recycled
material has a lower molecular weight, which enhances its overall crystallization rate.
Figure 5. (a) Overall crystallization rate (1/t50%) as a function of the crystallization temperature Tc.
The solid lines represent fits to the Lauritzen and Hoffman theory. (b) Crystallization temperature
values for the samples at a constant crystallization temperature of 195 °C.
If the REX-r-PET sample would be constituted just by linear chains, then its overall
crystallization rate should have been between virgin PET and r-PET, according to their
molecular weight differences (Table 1). However, as it will be shown by the rheological
measurements, the reactive extrusion of PET/Joncryl leads not only to chain extension but,
also, to the production of long-chain branching. Branching interrupts the linear crystalliz-
able sequences of the PET chains, acting as defects (which are normally forced out of the
crystals and into the amorphous regions), thereby reducing the crystallization rate, as
shown in Figure 5a. In this way, even though the molecular weight of the virgin PET used
here is higher than that of REX-r-PET, it has a higher crystallization rate because of the
differences in the chain structure between the two samples.
In the previous analysis, the presence of the TiO2 nanoparticles has been ignored. As
they are both present in r-PET and REX-r-PET, their influence should be identical in these
two materials, as their amount is approximately the same (about 2.5%; Table 2), and their
small clusters are well-distributed in the PET matrix.
The Lauritzen and Hoffman model can be applied to fit the overall crystallization
data obtained by DSC experiments using the following equation [49,50]:
1𝜏50%⁄ = 1 𝜏0⁄ 𝑒𝑥𝑝 [
𝑈
𝑅(𝑇𝑐 − 𝑇0)] [
−𝐾𝑔𝜏
𝑓𝑇(𝑇𝑚0 − 𝑇𝑐)
] (4)
where 1/τ0 is a growth rate constant, and U* is the transport activation energy that char-
acterizes molecular diffusion across the interfacial boundary between melt and crystals
(that, in this work, is taken as a constant value of 1500 cal/mol). Tc is the crystallization
temperature, and T0 is a hypothetical temperature at which all chain movements freeze
(T0 = Tg −30 °C). Tm0 is the equilibrium melting temperature of the polymer, and R is a gas
constant. 𝐾𝑔𝜏 is a constant proportional to the energy barrier for both primary and sec-
ondary nucleation. 𝐾𝑔𝜏 is given by:
𝐾𝑔𝜏 =
𝑗𝑏0𝜎𝜎𝑒𝑇𝑚0
𝑘∆𝐻𝑓 (5)
where j is assumed to be equal to 2 for crystallization in the so-called Regime II, a regime
where both secondary nucleation at the growth front and the rate of spread along the
growing crystal face are comparable. The other terms in the equation are: the width of the
chain b0, the lateral surface-free energy σ, the fold surface-free energy σe, the Boltzman constant k, and the latent equilibrium heat of fusion, Δ𝐻𝑓
[51–54].
185 190 195 200 205 210 2150
0.5
1
1.5
2
2.5
3
3.5
Virgin PET
r-PET
REX-r-PET
LH fits
1/t
50
% (
exp
) (1
/min
)
Tc (ºC)
(a)
0.6
0.8
1
1.2
1.4
1.6
1.8
2
Virgin PET
1/t
50
% (
exp
) (1
/min
)Samples
REX-r-PET
r-PET
(b)
Figure 5. (a) Overall crystallization rate (1/t50%) as a function of the crystallization temperature Tc. The solid lines representfits to the Lauritzen and Hoffman theory. (b) Crystallization temperature values for the samples at a constant crystallizationtemperature of 195 ◦C.
In the previous analysis, the presence of the TiO2 nanoparticles has been ignored. Asthey are both present in r-PET and REX-r-PET, their influence should be identical in thesetwo materials, as their amount is approximately the same (about 2.5%; Table 2), and theirsmall clusters are well-distributed in the PET matrix.
The Lauritzen and Hoffman model can be applied to fit the overall crystallization dataobtained by DSC experiments using the following equation [49,50]:
1τ50%
=1τ0
exp[
UR(Tc − T0)
][ −Kτg
f T(T0
m − Tc)] (4)
where 1/τ0 is a growth rate constant, and U* is the transport activation energy thatcharacterizes molecular diffusion across the interfacial boundary between melt and crystals(that, in this work, is taken as a constant value of 1500 cal/mol). Tc is the crystallizationtemperature, and T0 is a hypothetical temperature at which all chain movements freeze(T0 = Tg −30 ◦C). Tm0 is the equilibrium melting temperature of the polymer, and R isa gas constant. Kτ
g is a constant proportional to the energy barrier for both primary andsecondary nucleation. Kτ
g is given by:
Kτg =
jb0σσeT0m
k∆H f(5)
where j is assumed to be equal to 2 for crystallization in the so-called Regime II, a regimewhere both secondary nucleation at the growth front and the rate of spread along thegrowing crystal face are comparable. The other terms in the equation are: the width of thechain b0, the lateral surface-free energy σ, the fold surface-free energy σe, the Boltzmanconstant k, and the latent equilibrium heat of fusion, ∆H f [51–54].
The solid lines in Figure 5a represent fits to the Lauritzen–Hoffman theory, accordingto Equation (2). All the relevant parameters obtained from the L–H equation are listedin Table 4, and they are similar to those previously reported in the literature [51–54]. Theobtained Kτ
g values were found to be equal to 3.81 × 10⁵ for virgin PET, 3.84 × 10⁵ forr-PET, and 5.91 × 10⁵ for the REX-r-PET sample. Therefore, as Kτ
g characterizes the energybarrier for secondary nucleation, there is a significant increase of the energy barrier for
Polymers 2021, 13, 3531 12 of 30
nucleation (both primary and secondary nucleation) in the case of the reactively extrudedsample, REX-r-PET, as expected. Therefore, the L–H theory correctly predicts that theenergy barrier to crystallize the REX-r-PET sample is the highest in comparison with theother PET samples employed here. Both the fold surface-free energy and the work to foldchains follow the same trend as Kτ
g , as observed in Table 4, because these parameters aredirectly related through Equation (5).
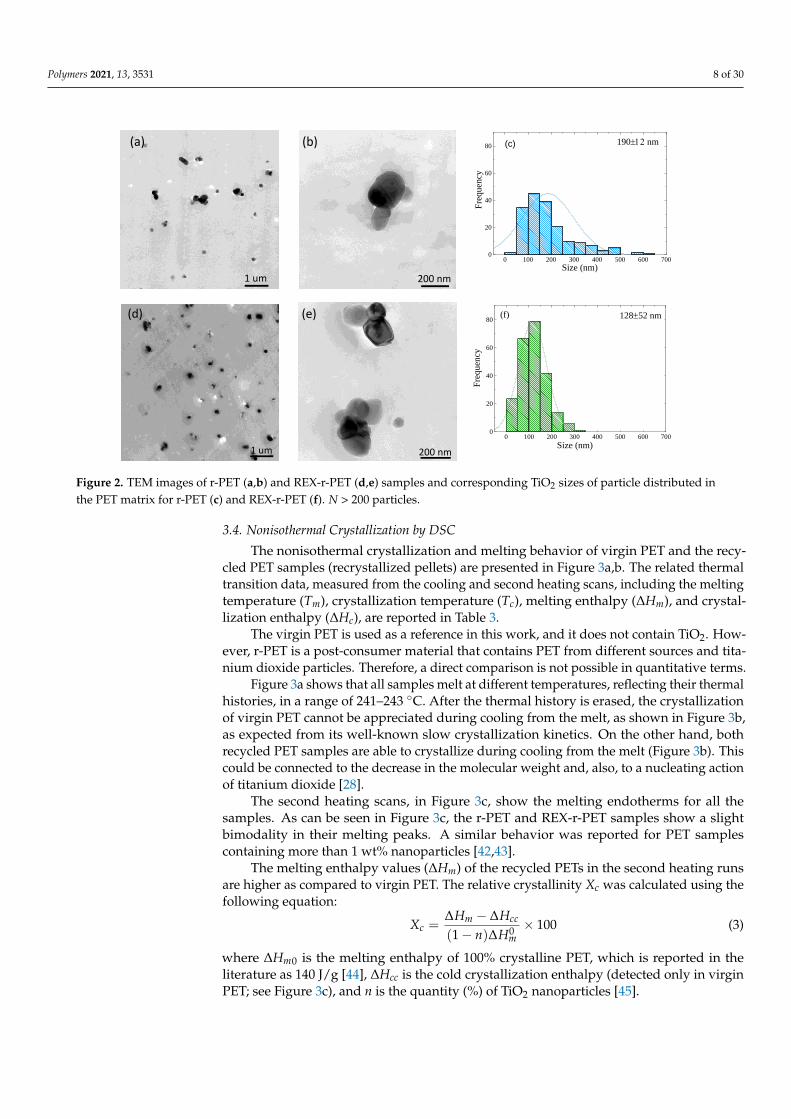
Table 4. Values obtained by fitting the L–H theory to the experimental DSC overall crystallizationdata. Parameter proportional to the energy barrier for the secondary nucleation (Kτ
g ), fold surfaceenergy (σe), and work done by the chain to perform a fold (q). R2 is the correlation coefficient for thefitting of the L–H model Equation (4).
SampleName
Kτg
(K2)σ
(erg/cm2)σe
(erg/cm2)q
(erg) R2
Virgin PET 3.81E+05 9.03 275 1.01E−12 0.992r-PET 3.84E+05 9.03 276 1.02E−12 0.978
REX-r-PET 5.91E+05 9.03 426 1.57E−12 0.991
Values obtained by fitting the L–H theory to the experimental DSC overall crystal-lization data. Parameter proportional to the energy barrier for the secondary nucleation(Kτ
g), fold surface energy (σe), and work done by the chain to perform a fold (q). R2 is thecorrelation coefficient for the fitting of the L–H model Equation (4).
Fitting the DSC Isothermal Crystallization Data to the Avrami Theory
The Avrami Equation (6) can describe the overall crystallization process in poly-mers [33] as:
1−Vc(t− t0) = exp(−k(t− t0)
n) (6)
where Vc is the relative volumetric transformed fraction (as a function of time), t is theexperimental time of crystallization, t0 is the induction or incubation time, k is an overallcrystallization rate constant, and n is the Avrami index. The Origin plug-in (developedby Lorenzo et al.) was employed [33] to fit the Avrami equation to the experimental data.Figure S2 shows a representative fit of the Avrami theory for the crystallization of the r-PETsample at 200 ◦C (Table S1).
Figure S2a shows the Avrami plot derived from Eq. 6 that is linearized by the loga-rithmic scale of the axis, within a 3–20% conversion range that corresponds to the earlystage of primary crystallization, before any spherulitic impingement takes place. TheAvrami parameters are included in the plot for the indicated example. The normalizedexperimental heat flow data is well-modeled by the Avrami fit using the obtained valuesfrom Equation (6), and a comparison between experimental data and predictions from theAvrami equation is plotted in Figure S2b.
Figure 6 shows the inverse of the induction or incubation time for the primary nucle-ation (1/t0) from the melt state before any crystallization has started, as a function of Tc. Thevalue 1/t0 is proportional to the primary nucleation rate. As seen in Figure 6, in general,for all the samples, the nucleation rate decreases with the crystallization temperature,as in the temperature range explored, where the primary nucleation is not affected bydiffusion contributions. When a constant crystallization temperature is fixed, the order ofthe nucleation rate is similar to that observed for the overall crystallization rate (1/t50%)presented above. This is an indication of the importance of the primary nucleation rate asa determining factor in the final overall crystallization rate, which includes both primarynucleation and growth. The REX-r-PET sample shows a lower nucleation rate value thanr-PET. This is related to the differences in both the molecular weight and chain structure.

Polymers 2021, 13, 3531 13 of 30Polymers 2021, 13, 3531 13 of 31
185 190 195 200 205 210 2150
1
2
3
4
5
1/t
0 (
1/m
in)
Tc (ºC)
Virgin PET
r-PET
Rex-r-PET
Figure 6. Primary nucleation rate obtained by DSC for the samples isothermally crystallized from
the melt as a function of Tc.
Figure 7 summarizes the kinetic parameters of the overall crystallization as a function
of the crystallization temperature for the three PET samples examined here. In Figure 7a,
the inverse of the experimental half-crystallization (1/τ50%) data is plotted versus Tc. The
solid lines in Figure 7a correspond to the Lauritzen–Hoffman (L–H) fitting. The k1/n values
were calculated from the Avrami theory parameter by elevating the k (isothermal overall
crystallization rate constant) to 1/n (1/Avrami index), so that consistent units are obtained
(min−1) and their values compared. The k1/n values are plotted versus Tc in Figure 7b. The
solid lines in Figure 7b correspond to the fit of the Lauritzen–Hoffman (L–H) theory. The
similarity between Figure 7a,b is a consequence of the Avrami equation fitting to the ex-
perimental overall crystallization rate data, which works reasonably well up to approxi-
mately 50% conversion. The fastest crystallization of the lowest molecular weight sample
(r-PET) can be clearly appreciated, as already discussed above.
Figure 7c presents the values of the Avrami index n as a function of Tc. The values
fluctuate between 2.5 and 3.5, which are characteristic of instantaneously nucleated (n ap-
proximately equal to 3) and sporadically nucleated (n approximately equal to 4) spheru-
lites, respectively.
Figure 6. Primary nucleation rate obtained by DSC for the samples isothermally crystallized fromthe melt as a function of Tc.
Figure 7 summarizes the kinetic parameters of the overall crystallization as a functionof the crystallization temperature for the three PET samples examined here. In Figure 7a,the inverse of the experimental half-crystallization (1/τ50%) data is plotted versus Tc. Thesolid lines in Figure 7a correspond to the Lauritzen–Hoffman (L–H) fitting. The k1/n valueswere calculated from the Avrami theory parameter by elevating the k (isothermal overallcrystallization rate constant) to 1/n (1/Avrami index), so that consistent units are obtained(min−1) and their values compared. The k1/n values are plotted versus Tc in Figure 7b.The solid lines in Figure 7b correspond to the fit of the Lauritzen–Hoffman (L–H) theory.The similarity between Figure 7a,b is a consequence of the Avrami equation fitting tothe experimental overall crystallization rate data, which works reasonably well up toapproximately 50% conversion. The fastest crystallization of the lowest molecular weightsample (r-PET) can be clearly appreciated, as already discussed above.
Figure 7c presents the values of the Avrami index n as a function of Tc. The valuesfluctuate between 2.5 and 3.5, which are characteristic of instantaneously nucleated (n ap-proximately equal to 3) and sporadically nucleated (n approximately equal to 4) spherulites,respectively.
3.7. Lamellar Thickness Distribution and TEM Observations
A ruthenium tetroxide (RuO4) solution was used to stain the samples. The RuO4atoms penetrate and stain the amorphous regions of PET, while the crystalline regionsremained practically unstained. Due to this, the lamellae inside the spherulites can beclearly seen in white color in contrast with the dark amorphous interlamellar regions.
Figure 8a, 8c and 8e are the corresponding TEM micrographs for the films crystallizedat 200 ◦C for 2 h and then immediately quenched to room temperature for virgin PET,r-PET, and REX-r-PET, respectively. These TEM micrographs present well-defined stackedlamellar morphology within spherulites.

Polymers 2021, 13, 3531 14 of 30Polymers 2021, 13, 3531 14 of 31
185 190 195 200 205 210 2151
1.5
2
2.5
3
3.5
0.0010.01
0.11
10100
1000
0.0010.01
0.11
10100
1000
1
Virgin PET r-PET Rex-r-PET
Avra
mi
ind
ex,
n
Tc (ºC)
Axialites (n~2)
Spherulites (n~3)
K1
/n (
min
-1) (b)
(c)
1/t
50
% (
1/m
in) (a)
Figure 7. (a) Overall crystallization rates, indicated as the inverse of the experimentally deter-
mined half-crystallization times presented on a logarithmic scale, (b) normalized crystallisation
constant obtained from the Avrami model presented on a logarithmic scale, and (c) Avrami index
for the indicated PET samples as a function of the crystallization temperature, Tc. Solid lines in (a)
and (b) correspond to the fit of the Lauritzen–Hoffman (L–H) theory.
3.7. Lamellar Thickness Distribution and TEM Observations
A ruthenium tetroxide (RuO4) solution was used to stain the samples. The RuO4 at-
oms penetrate and stain the amorphous regions of PET, while the crystalline regions re-
mained practically unstained. Due to this, the lamellae inside the spherulites can be clearly
seen in white color in contrast with the dark amorphous interlamellar regions.
Figure 8a, 8c and 8e are the corresponding TEM micrographs for the films crystal-
lized at 200 °C for 2 h and then immediately quenched to room temperature for virgin
PET, r-PET, and REX-r-PET, respectively. These TEM micrographs present well-defined
stacked lamellar morphology within spherulites.
Figure 7. (a) Overall crystallization rates, indicated as the inverse of the experimentally determinedhalf-crystallization times presented on a logarithmic scale, (b) normalized crystallisation constantobtained from the Avrami model presented on a logarithmic scale, and (c) Avrami index for theindicated PET samples as a function of the crystallization temperature, Tc. Solid lines in (a) and (b)correspond to the fit of the Lauritzen–Hoffman (L–H) theory.
Lamellar thickness distributions were calculated from TEM observations using Digimizersoftware and are presented in Figure 8b,d,f for virgin PET, r-PET, and REX-r-PET, respec-tively. The average lamellar thickness, lc,ave, was calculated for all the studied samples, andthe values were inserted in the plots. The average lamellar thicknesses for virgin PET andREX-r-PET are bigger than that of the r-PET sample. In addition, there are two populationsof lamellar thickness distribution in virgin PET and REX-r-PET, one in the range of 2–6 nmand the other one around 6–10 nm. That means the frequency distribution of the lamellarthickness has a bimodal shape in these samples. However, the r-PET sample shows only asingle lamellar thickness distribution in the range of 2–6 nm.
As described before in the experimental section, the samples were isothermally crystal-lized at 200 ◦C for 2 h. Then, the samples were quenched from 200 ◦C to room temperatureand kept at this temperature to perform the TEM observations. Probably, this bimodaldistribution of lamellar thickness comes from the crystallization of the samples at 200◦C and during cooling from that temperature. First, the isothermal crystallization of thesamples at 200 ◦C (a high crystallization temperature) produced the largest lamellae of sizesaround 6-10 nm. During the quenching of the sample to room temperature, smaller-sizedlamellae were formed (2–6 nm). Modified PET with the reactive recycling (REX-r-PET)method shows a similar bimodal lamellar distribution as virgin PET. However, the homog-enized PET (r-PET) with a lower molecular weight shows only one population of lamellaewith an average of 4.16 nm. This means that the majority of the lamellae were probablyformed during cooling from 200 ◦C at lower temperatures. This effect can be attributed

Polymers 2021, 13, 3531 15 of 30
to the molecular segregation processes during crystallization that are proportional to themolecular weight. Therefore, the average lamellar size distribution curves are sensitive toPET processing (i.e., cooling conditions) and molecular weight.
3.8. Rheology3.8.1. Linear Viscoelastic Data under SAOS (Small Amplitude Oscillatory Shear)
The small amplitude oscillatory shear tests, SAOS, assume that the response of the ma-terial is in the linear viscoelastic regime, and the functions of the material, storage modulus,G′, and loss modulus, G” (as well as the derived viscoelastic parameters), determined as afunction of the frequency, fully describe the material response. Since linear viscoelasticityis based on a rigorous theoretical basis [55–57], SAOS tests provide a very useful and con-venient rheological characterization of polymers of different molecular architectures. Thelinear viscoelastic parameters of the three PET samples: virgin PET, r-PET, and REX-r-PET,are presented in Figure 9.
Polymers 2021, 13, 3531 15 of 31
0 1 2 3 4 5 6 7 8 9 10
0
1
2
3
4
5
6
7lc,avr = 4.2 ± 1.1
Fre
qu
ency
Thickness (nm)
(b)
0 1 2 3 4 5 6 7 8 9 10
0
1
2
3
4
5
6
7
Fre
quen
cy
Thickness (nm)
(d) lc,avr = 4.16 ± 1.09
0 1 2 3 4 5 6 7 8 9 100
1
2
3
4
5
6
7
Fre
qu
ency
Thickness (nm)
(f) lc,avr = 4.5 ± 1.0
Figure 8. TEM micrographs of RuO4-stained PET samples: (a) virgin PET, (c) r-PET, and (e) REX-r-
PET samples. Frequency distribution of lamellar thickness for (b) virgin PET, (d) r-PET, and (f)
REX-r-PET.
Lamellar thickness distributions were calculated from TEM observations using
Digimizer software and are presented in Figure 8b,d,f for virgin PET, r-PET, and REX-r-
PET, respectively. The average lamellar thickness, lc,ave, was calculated for all the studied
samples, and the values were inserted in the plots. The average lamellar thicknesses for
virgin PET and REX-r-PET are bigger than that of the r-PET sample. In addition, there are
two populations of lamellar thickness distribution in virgin PET and REX-r-PET, one in
the range of 2–6 nm and the other one around 6–10 nm. That means the frequency distri-
bution of the lamellar thickness has a bimodal shape in these samples. However, the r-
PET sample shows only a single lamellar thickness distribution in the range of 2–6 nm.
As described before in the experimental section, the samples were isothermally crys-
tallized at 200 C for 2 h. Then, the samples were quenched from 200 C to room temper-
ature and kept at this temperature to perform the TEM observations. Probably, this bi-
modal distribution of lamellar thickness comes from the crystallization of the samples at
200 C and during cooling from that temperature. First, the isothermal crystallization of
the samples at 200 C (a high crystallization temperature) produced the largest lamellae
of sizes around 6-10 nm. During the quenching of the sample to room temperature,
Figure 8. TEM micrographs of RuO4-stained PET samples: (a) virgin PET, (c) r-PET, and (e) REX-r-PET samples. Frequencydistribution of lamellar thickness for (b) virgin PET, (d) r-PET, and (f) REX-r-PET.
Polymers 2021, 13, 3531 16 of 30
Polymers 2021, 13, 3531 16 of 31
smaller-sized lamellae were formed (2–6 nm). Modified PET with the reactive recycling
(REX-r-PET) method shows a similar bimodal lamellar distribution as virgin PET. How-
ever, the homogenized PET (r-PET) with a lower molecular weight shows only one pop-
ulation of lamellae with an average of 4.16 nm. This means that the majority of the lamel-
lae were probably formed during cooling from 200 C at lower temperatures. This effect
can be attributed to the molecular segregation processes during crystallization that are
proportional to the molecular weight. Therefore, the average lamellar size distribution
curves are sensitive to PET processing (i.e., cooling conditions) and molecular weight.
3.8. Rheology
3.8.1. Linear Viscoelastic Data under SAOS (Small Amplitude Oscillatory Shear)
The small amplitude oscillatory shear tests, SAOS, assume that the response of the
material is in the linear viscoelastic regime, and the functions of the material, storage mod-
ulus, G', and loss modulus, G’’ (as well as the derived viscoelastic parameters), deter-
mined as a function of the frequency, fully describe the material response. Since linear
viscoelasticity is based on a rigorous theoretical basis [55–57], SAOS tests provide a very
useful and convenient rheological characterization of polymers of different molecular ar-
chitectures. The linear viscoelastic parameters of the three PET samples: virgin PET, r-
PET, and REX-r-PET, are presented in Figure 9.
0.1 1 10 100 1000
100
1000
Co
mp
lex
Vis
cosi
ty (
Pa.
s)
(rad/s)
Virgin PET, 260 ºC
Virgin PET, 270 ºC
Virgin PET, 280 ºC
r-PET, 260 ºC
r-PET, 270 ºC
r-PET, 280 ºC
REX-r-PET, 260 ºC
REX-r-PET, 270 ºC
REX-r-PET, 280 ºC
(a)
0.1 1 10 100 100010-1
100
101
102
103
104
105
G ́G
´́(P
a)
(rad/s)
Model G` Virgin PET
Model G´́ Virgin PET
Experimental G` Virgin PET
Experimental G´́ Virgin PET
Model G ́REX-r-PET
Model G´́ REX-r-PET
Experimental G ́REX-r-PET
Experimental G´́ REX-r-PET
(b)
Model G ́r-PET
Model G´́ r-PET
Experimental G` r-PET
Experimental G´́ r-PET
0.001 0.01 0.1 1 101
10
100
1000
H (
Pa)
l (s)
Virgin PET
REX-r-PET
r-PET
(c)
101 102 103 104 105
15
30
45
60
75
90
DE
LT
A (
deg
ree)
G* (Pa)
Virgin PET, 260 ºC
Virgin PET, 270 ºC
Virgin PET, 280 ºC
r-PET, 260 ºC
r-PET, 270 ºC
r-PET, 280 ºC
REX-r-PET, 260 ºC
REX-r-PET, 270 ºC
REX-r-PET, 280 ºC
(d)
Figure 9. Linear viscoelastic data for virgin PET, r-PET, and REX-r-PET. (a) Complex viscosity at
three temperatures: T = 260 C, T = 270 C, and T = 280 C. (b) Moduli data obtained at T = 270 C
fitted to the Maxwell model. (c) Relaxation time spectra for virgin PET and REX-r-PET, and (d)
van Gurp Palmen plot at temperatures T = 260, 270, and 280 C for virgin PET, r-PET, and REX-r-
PET.
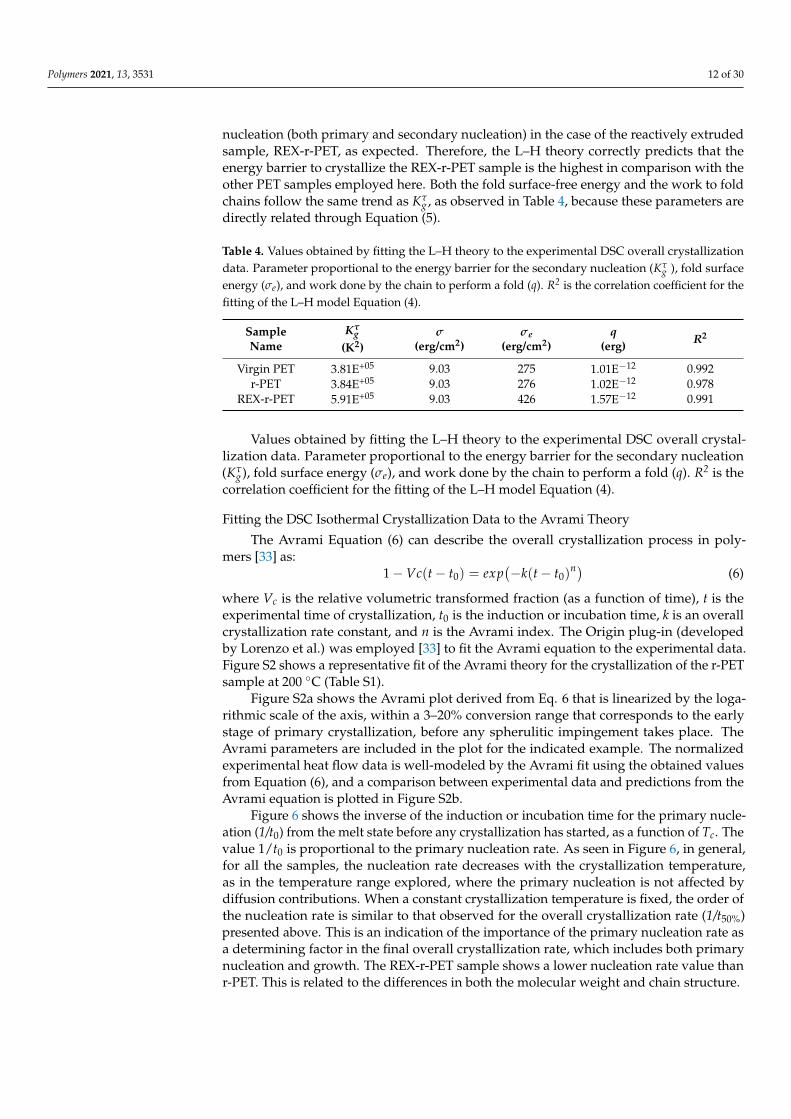
Figure 9. Linear viscoelastic data for virgin PET, r-PET, and REX-r-PET. (a) Complex viscosity at three temperatures:T = 260 ◦C, T = 270 ◦C, and T = 280 ◦C. (b) Moduli data obtained at T = 270 ◦C fitted to the Maxwell model. (c) Relaxationtime spectra for virgin PET and REX-r-PET, and (d) van Gurp Palmen plot at temperatures T = 260, 270, and 280 ◦C forvirgin PET, r-PET, and REX-r-PET.
The modified REX-r-PET sample compared to virgin PET and r-PET shows a pro-nounced increase in both the complex viscosity (Figure 9a) and elasticity (Figure 9b). VirginPET and r-PET display terminal behavior and Newtonian viscosity in the studied frequencyrange, whereas REX-r-PET is characterized by displaying the onset of the terminal regime,which is shifted to frequencies lower than those accessible experimentally. The correspond-ing moduli of REX-r-PET slowly decrease with the frequency so that the quasiparallelmoduli response indicates a gel-like behavior. The Newtonian plateau was not reachedwithin the measured frequency–temperature window because of the slow relaxation, and apronounced shear-thinning behavior was observed.
Therefore, the viscoelasticity and chain relaxation were greatly affected by the reactiveextrusion treatment. The rapid relaxation of the virgin and homogenized PET (r-PET)would be related to their linear structure that led to a Newtonian plateau and a very weakelastic response, while the slower relaxation process of REX-r-PET is probably related to theformation of larger chains (the increase of the intrinsic viscosity is reported in Section 3.1)and/or by long-chain branches (LCB) during reactive extrusion with Joncryl [58,59]. Tostudy this behavior in more depth, the viscoelastic parameters G′ and G” were evaluatedin terms of a discrete relaxation spectrum modeled from the mechanical spectrum of thevirgin PET and REX-r-PET samples using TA Instruments TRIOS®software by applyingthe following equations:
G′(ω) =∫ ∞
0H(λ)
(ωλ)2
1 + (ωλ)2dλ
λ(7)

Polymers 2021, 13, 3531 17 of 30
G′′ (ω) =∫ ∞
0H(λ)
ωλ
1 + (ωλ)2dλ
λ(8)
The calculated average relaxation times, defined as λ =∑i Giλ
2i
∑i Giλi, were very different
for both samples: λ Virgin PET = 0.015 s, λ r-PET = 0.010 s, and λREX-r-PET = 7 s.Figure 9c shows the comparison of the relaxation spectrum H(λ) of each PET, where λ
represents the relaxation time. The main relaxation motion of Virgin PET and r-PET wasless than one second, which would be attributed to a reptation mechanism. That is, themain relaxation mechanism is not influenced by the homogenization extrusion process orthe presence of TiO2 particles that characterize the r-PET sample. On the contrary, the REX-r-PET spectrum distinguishes the contribution of a rubbery state at times longer than onesecond, where strong entanglements would block the motion and enlarge the spectrum. Therubbery state, which is very similar to that recently reported by Ge et al. [60] for LCB-PET,would indicate the simultaneous relaxation processes given by short, long, and LCB (longchain-branched) chains and could be understood in terms of a branched-chain backbone.
Branched polymers are particularly thermorheologically sensitive. For example,branched polymers exhibit higher activation energies than linear ones of similar weight-average molecular weights, Mw [57]. A value for Ea of 50–70 kJ/mol has been reportedfor linear PET, whereas a drastic increase to a fivefold higher activation energy, Ea, isreported for long-chain branched PET [56]. In general, it is well-established that LCBpolymers have higher values for Ea compared to linear polymers [61–63]. The calculatedflow activation energy of the investigated samples, Ea, showed a similar trend to that ofzero shear viscosity, η0. The activation energy of virgin PET was 80 KJ/mol, r-PET Ea was100 KJ/mol, and REX-r-PET Ea was 350 KJ/mol. The increase of up to four times higher Eais probably due to the presence of LCB.
Furthermore, the thermorheological behavior provides us with additional insightsinto the molecular structures of these samples. Figure 9d shows the van Gurp Palmenplot, which is the phase shift, δ, as a function of the complex modulus, G*, for virgin PET,r-PET, and REX-r-PET. A thermorheologically simple behavior was observed for virginPET and r-PET as G*-dependent phase shift values superimposed at different temperatures,meaning that all the relaxation times have the same temperature dependence [64], whileREX-r-PET exhibits a systematic split between the curves with the temperature, whichidentifies the thermorheological complex response.
The thermorheological complexity of REX-r-PET could also be due to the presenceof long-chain branches. A branched structure is assumed to be related with a more pro-nounced flattening and will eventually lead to an extra bump in the delta versus G* plot, incase the LCB character dominates the behavior [65]. The present result for REX-r-PET doesnot allow a distinction between different structures, but the minimum observed clearlyindicated a second dominating relaxation process that could be attributed to the presenceof long-chain branching. In terms of the concentration of LCB, it is reported that LCB-PEmetallocene with a sparsely branched structure showed high thermorheological complexity,while LDPE with hyperbranched structures did not [66]. The findings are quite similar tothose found for grafted comb and grafted bottlebrush-like LCB-PS [67], where the absenceof thermorheological complexity in the PS bottlebrush (number of branches greater than 60)is consistent with the results of LDPE, both having branches statistically distributed alongthe backbone and, therefore, a similar density of branching points. Considering the highlevel of thermorheological complexity of REX-r-PET, one could expect that hyperbranchedstructures are not present.
3.8.2. The Analysis of the Elongational Rheological Behavior
Elongation rheology tests were also performed to explore the viscoelastic propertiesof PET. The extensional viscosity curves of virgin and recycled PETs at different elongationrates are represented in Figure 10. For virgin PET (Figure 10a) and r-PET (Figure 10b), thetensile tests were very difficult to perform, because the samples tended to drop duringmeasurements due to their low viscosity. The results confirmed the Newtonian behavior

Polymers 2021, 13, 3531 18 of 30
of both samples, as the curves fit the predicted Trouton relationship of three times thecomplex viscosity data.
Polymers 2021, 13, 3531 18 of 31
meaning that all the relaxation times have the same temperature dependence [64], while
REX-r-PET exhibits a systematic split between the curves with the temperature, which
identifies the thermorheological complex response.
The thermorheological complexity of REX-r-PET could also be due to the presence of
long-chain branches. A branched structure is assumed to be related with a more pro-
nounced flattening and will eventually lead to an extra bump in the delta versus G* plot,
in case the LCB character dominates the behavior [65]. The present result for REX-r-PET
does not allow a distinction between different structures, but the minimum observed
clearly indicated a second dominating relaxation process that could be attributed to the
presence of long-chain branching. In terms of the concentration of LCB, it is reported that
LCB-PE metallocene with a sparsely branched structure showed high thermorheological
complexity, while LDPE with hyperbranched structures did not [66]. The findings are
quite similar to those found for grafted comb and grafted bottlebrush-like LCB-PS [67],
where the absence of thermorheological complexity in the PS bottlebrush (number of
branches greater than 60) is consistent with the results of LDPE, both having branches
statistically distributed along the backbone and, therefore, a similar density of branching
points. Considering the high level of thermorheological complexity of REX-r-PET, one
could expect that hyperbranched structures are not present.
3.8.2. The Analysis of the Elongational Rheological Behavior
Elongation rheology tests were also performed to explore the viscoelastic properties
of PET. The extensional viscosity curves of virgin and recycled PETs at different elonga-
tion rates are represented in Figure 10. For virgin PET (Figure 10a) and r-PET (Figure 10b),
the tensile tests were very difficult to perform, because the samples tended to drop during
measurements due to their low viscosity. The results confirmed the Newtonian behavior
of both samples, as the curves fit the predicted Trouton relationship of three times the
complex viscosity data.
The REX-r-PET elongational behavior reflected the molecular structure modification
as linear behavior was no longer observed, and strain hardening appeared in the range of
the imposed extension rates. This behavior is well-known in typical long-chain branched-
dominated rheology, including the response of polymers with architectures ranging from
star- and H-shaped polymers to comb and pom-pom structures [68–77] and has also been
reported for LCB Poly (ethylene terephthalate) subjected to reactive treatment with the
combination of pyromellitic dianhydride and triglycidyl isocyanurate.
1E-4 0.001 0.01 0.1 1 10
101
102
103
104
105
Virgin PET, 2.5 s−1
E (
Pa
s)
Time (s)
(a)
1E-4 0.001 0.01 0.1 1 10101
102
103
104
105
r-PET, 2.5 s−1
r-PET, 1 s−1
E
(P
a s)
Time (s)
(b)
Polymers 2021, 13, 3531 19 of 31
1E-4 0.001 0.01 0.1 1 10101
102
103
104
105
REX-r-PET, 5 s−1
REX-r-PET, 2.5 s−1
REX-r-PET, 1 s−1
E
(P
a s)
Time (s)
(c)
Figure 10. Elongational viscosities for the three PET samples: (a) virgin PET, (b) r-PET, and (c)
REX-r-PET.
3.8.3. The study of Large Deformation Oscillatory Shear Measurements (LAOS)
Oscillatory shear tests can be divided into two regimes. One regime is a linear visco-
elastic response (SAOS) that was addressed in Section 3.8.1, and the second regime is the
nonlinear material response (large amplitude oscillatory shear, LAOS)) that will be dis-
cussed here. From an experimental point of view, the objective of these nonlinear oscilla-
tory experiments is to investigate the evolution of the nonlinear response with increasing
deformation and to quantify the nonlinear material functions. Furthermore, a great effort
has been made in the last decades to establish sound relationships between these nonlin-
earities and the molecular structures of polymers. For that purpose, several quantitative
methods have been described for analyzing nonsinusoidal waveforms of shear stresses.
Fundamentally, LAOS analytical methods are based upon the principle of Fourier Trans-
form Rheology (FTR). Under shear strain 𝛾(𝑡) = 𝛾0 𝑠𝑖𝑛 (𝜔𝑡) and a strain rate �̇�(𝑡) =
𝛾0 𝜔 𝑐𝑜𝑠 (𝜔𝑡), shear stress can be expressed as a Fourier series of elastic and viscous stress.
𝜎(𝑡; 𝜔, 𝛾0) = 𝛾0∑ 𝐺𝑛′
𝑛 𝑜𝑑𝑑(𝜔, 𝛾0) sin 𝑛𝜔𝑡 + 𝐺𝑛
′′ (𝜔, 𝛾0) cos 𝑛𝜔𝑡 (9)
where 𝐺𝑛′ and 𝐺𝑛
′′ are nth-order harmonic coefficients. The linear response reduces to the
first–order harmonics (n = 1), and higher–order harmonic coefficients or phase differences
accounts for the nonlinearities, where the relative harmonic intensity ratios 𝐼𝑛/1 ≡𝐼(𝑛𝜔)
𝐼(𝜔) or phase angles ∅′𝑛 ≡ ∅𝑛 − 𝑛∅1 are widely used as indicators of nonlinearity.
Additionally, for every harmonic, an intrinsic nonlinear parameter, 𝑄(𝛾0, 𝜔) 𝑛 can be
defined in the limit of small-strain amplitudes 𝑄0(𝜔) 𝑛 . The parameter, which is only fre-
quency dependent, can be defined for every harmonic through the following equation
Equation (10):
𝑄 𝑛 (𝛾0, 𝜔) =
𝐼𝑛/1
𝛾0𝑛−1 with 𝑄0(𝜔) =
𝑛 lim𝛾0→0
𝑄 𝑛 (𝜔) (10)
𝑄0(𝜔) 𝑛 gives information about the inherent nonlinear material properties of a sample as
the trivial scaling 𝐼𝑛/1 𝛾0𝑛−1 is eliminated.
The intrinsic nonlinearity parameter 3Q, or simply Q, that is derived from the third
harmonic, written as in Equation (5), has been reported to be useful in evaluating struc-
tural features such as the topology of polymer melts [78–80], the droplet size distribution
of emulsions [81], and recently, the morphology of polymer blends [82,83].
𝑄 ≡ 𝐼3/1 𝛾02⁄ with lim
𝛾→0𝑄 ≡ 𝑄0 (11)
Figure 10. Elongational viscosities for the three PET samples: (a) virgin PET, (b) r-PET, and (c) REX-r-PET.
The REX-r-PET elongational behavior reflected the molecular structure modificationas linear behavior was no longer observed, and strain hardening appeared in the range ofthe imposed extension rates. This behavior is well-known in typical long-chain branched-dominated rheology, including the response of polymers with architectures ranging fromstar- and H-shaped polymers to comb and pom-pom structures [68–77] and has also beenreported for LCB Poly (ethylene terephthalate) subjected to reactive treatment with thecombination of pyromellitic dianhydride and triglycidyl isocyanurate.
3.8.3. The study of Large Deformation Oscillatory Shear Measurements (LAOS)
Oscillatory shear tests can be divided into two regimes. One regime is a linearviscoelastic response (SAOS) that was addressed in Section 3.8.1, and the second regimeis the nonlinear material response (large amplitude oscillatory shear, LAOS)) that willbe discussed here. From an experimental point of view, the objective of these nonlinearoscillatory experiments is to investigate the evolution of the nonlinear response withincreasing deformation and to quantify the nonlinear material functions. Furthermore, agreat effort has been made in the last decades to establish sound relationships betweenthese nonlinearities and the molecular structures of polymers. For that purpose, severalquantitative methods have been described for analyzing nonsinusoidal waveforms ofshear stresses. Fundamentally, LAOS analytical methods are based upon the principle ofFourier Transform Rheology (FTR). Under shear strain γ(t) = γ0 sin (ωt) and a strain

Polymers 2021, 13, 3531 19 of 30
rate.γ(t) = γ0 ω cos (ωt), shear stress can be expressed as a Fourier series of elastic and
viscous stress.
σ(t; ω, γ0) = γ0 ∑n odd
G′n(ω, γ0) sin nωt + G′′n (ω, γ0) cos nωt (9)
where G′n and G′′n are nth-order harmonic coefficients. The linear response reduces tothe first–order harmonics (n = 1), and higher–order harmonic coefficients or phase dif-ferences accounts for the nonlinearities, where the relative harmonic intensity ratiosIn/1 ≡
I(nω)I(ω)
or phase angles ∅′n ≡ ∅n−n∅1 are widely used as indicators of nonlinearity.Additionally, for every harmonic, an intrinsic nonlinear parameter, nQ(γ0, ω) can
be defined in the limit of small-strain amplitudes nQ0(ω). The parameter, which is onlyfrequency dependent, can be defined for every harmonic through the following equationEquation (10):
nQ(γ0, ω) =In/1
γn−10
with nQ0(ω) = limγ0→0
nQ(ω) (10)
nQ0(ω) gives information about the inherent nonlinear material properties of a sample asthe trivial scaling In/1α γn−1
0 is eliminated.The intrinsic nonlinearity parameter 3Q, or simply Q, that is derived from the third
harmonic, written as in Equation (5), has been reported to be useful in evaluating structuralfeatures such as the topology of polymer melts [78–80], the droplet size distribution ofemulsions [81], and recently, the morphology of polymer blends [82,83].
Q ≡ I3/1/γ20 with lim
γ→0Q ≡ Q0 (11)
To interpret the higher harmonics of a FT rheological series [84], orthogonal stressdecomposition is used to separate the nonlinear stress into elastic and viscous contributionsbased on the symmetry of stress with respect to γ(t) and
.γ(t). Ewoldt et al. [85] extended
this method with the Chebysev polynomials of the first type (Tn), expressing elastic andviscous stresses as:
σ′(γ/γ0) = γ0 ∑n,odd
en(ω, γ0)Tn (γ/γ0) (12)
σ′′( .γ/
.γ0)=
.γ0 ∑
n,oddνn(ω, γ0)Tn (
.γ/
.γ0) (13)
The first-order Chebyshev coefficients (e1 and v1) defined the viscoelastic propertiesin the linear region (i.e., e1 = G′ and v1 = G”/ω). Any deviation from linearity, i.e., then = 3 harmonic, is interpreted depending on the signs of e3 and v3. A positive third-ordercontribution results in higher elastic (or viscous) stress at the maximum strain (or strainrate) than is represented by the first-order contribution alone. Thus, depending on the signof the third-order coefficients, the following physical interpretation can be suggested (seeEwoldt et al. [85] for further details):
e3 = −G′3
> 0 strain-stiffening
= 0 linear elastic
< 0 strain-softening
v3 = −G′′3ω
> 0 shear-thickening
= 0 linear viscous
< 0 shear-thinning
(14)
Nonlinear responses obtained at a constant frequency of 0.1 Hz and T = 260 ◦C ofvirgin PET and REX-r-PET are shown in Figure 11a. At a small γ0, in the linear region, G′
and G′ ′ remain constant values, but, as the applied amplitude of strain is increased fromsmall to large, a transition between the linear and nonlinear regime is observed so that inthe nonlinear regime, both virgin PET and REX-r-PET, display moduli that decrease withthe increasing strain (Figure 11a). It is interesting to note that the stress patterns of the

Polymers 2021, 13, 3531 20 of 30
molten virgin PET and r-PET differ from that of the REX-r-PET (see insert in Figure 11a,which corresponds to the stress signals at 200% of the strain; r-PET data are not includedfor clarity).
Polymers 2021, 13, 3531 21 of 31
REX-r-PET, G´́
r-PET, G´
r-PET, G´́
Virgin PET, G´
Virgin PET, G´́
REX-r-PET, G´
0.1 1 10 100 100010-1
100
101
102
103
104
Time (s)
G,́
G´́
(P
a)
Strain (%)
(a)
backwardforward
200 400 600 800 10001E-4
0.001
0.01
0.1
Q
Strain (%)
Virgin PET Model
Virgin PET Experimental
r-PET Model
r-PET Experimental
REX-r-PET Model
REX-r-PET Experimental
(b)
10 100 1000-0.4
-0.3
-0.2
-0.1
0
0.1
0.2
0.3
0.4
Thic
ken
ing r
atio
Strain (%)
Virgin PET
r-PET
REX-r-PET
(c)
= 0.1 Hz
10 100 1000-0.4
-0.3
-0.2
-0.1
0
0.1
0.2
0.3
0.4
Sti
ffen
ing r
atio
Strain (%)
Virgin PET
r-PET
REX-r-PET
(d)
= 5 Hz
Figure 11. Results for the LAOS nonlinear oscillatory test. (a) Evolution of the storage modulus,G1′ and G1′′, as a function of the strain obtained at a constant frequency of 0.1 Hz. We focus on thestress curve, which corresponds to 200% of the applied strain for virgin PET and REX-r-PET. (b) Theintrinsic nonlinearity Q0 of three investigated samples obtained in the MAOS regime. (c) Evolutionof the shear-thickening ratio with strain at 0.1 Hz. (d) Evolution of the shear-stiffening ratio withstrain at 5 Hz.

Polymers 2021, 13, 3531 21 of 30
As observed (in the Figure 11a inset), the unmodified virgin PET displays a weakdistortion, whereas REX-r-PET displays a “backward-tilted” shape stress. The distorteddirections are considered to be related to specific polymer structures. Previous studiesrevealed that “forward-tilted stress” tends to appear in the case of polymer melts andsolutions with a linear chain structure [86,87], whereas “backward-tilted stress” was re-ported for suspensions and polymer melts with branched chains. This behavior is generallyattributed to the effect of branched structures during the flow alignment of polymer chainsoccurring at the larger strains. Branching is considered an obstacle and leads to an extraresistance to the flow. As a result, a stress shoulder appears at higher times—that is, thestress tilts backwards, delayed with respect to the symmetry axis. Interestingly enough,the distorted directions were reported to be related to the relative magnitudes of e3/e1and v3/v1 in the nonlinear responses in the case of filled and vulcanized polyisoprene,respectively [88]. Therefore, as a first approach, nonlinearity is very sensitive to the differ-ent structures of these materials. To further distinguish the differences in the topologicalstructure of the PET samples, the analysis of the nonlinear region is divided in terms ofthe MAOS (medium amplitudes oscillatory shear) and LAOS (large amplitudes oscillatoryshear) regimes.
Under MAOS, using the FT rheology method, the third-harmonic intensity normalizedby the first-harmonic intensity (I3/1) can be used as a representative nonlinear parameter,helpful to detect the boundary of linear-to-nonlinear transition. In this regime (50–300%),the third-harmonic intensity is the only higher harmonic contribution, and the parameterI3/1 scaled quadratically with the strain amplitude as expected [89]. According to theexperimental and theoretical findings, Hyun and Wilhelm [90] suggested that the intrinsicnonlinearity Q0 in the MAOS regime can be applied to detect different polymer archi-tectures, e.g., linear, 3-arm star, comb with many branches, and long-chain branchingarchitectures. Figure 11b clearly differentiates the evolution of the Q parameter with thestrain amplitude for the three samples: virgin PET, r-PET, and REX-r-PET. Q has a con-stant value (Q0) at relatively small strain amplitudes, while it becomes a function of thestrain at larger strain amplitudes. At the investigated frequency of 0.1 Hz, the Q0 valuefor REX-r-PET is much higher than the values of virgin PET and r-PET, for which Q0 isvery similar. Ahirwal et al. [91] obtained results for the branched PP and branched PEcomparable to those obtained for the PET samples here. They found that the Q0 parameterincreased monotonically as a function of the long-chain branched PP weight fraction in thePP blends.
The structural differences of PET samples can be more evidently characterized underLAOS (in our case, from 300 to 900%). By decomposing the nonlinear stress waveformsbased on symmetry arguments and using a Chebyshev polynomial analysis, the contri-bution of higher-order harmonics can be useful to gain advanced understanding in termsof the elastic and viscous nonlinearities described, respectively, by the intracycle strainstiffening (or softening) and intracycle strain rate thickening (or thinning) indices. Theanalysis could find application in the evaluation of molecular architecture and branchingcharacteristics of polymer melts.
Figure 11c,d shows the comparisons among intracycle nonlinear coefficients of theinvestigated samples. The viscous nonlinear thickening ratio (Figure 11c), ν3, and theelastic nonlinear stiffening ratio (Figure 11d), ε3, defined by Equation (11), are plotted as afunction of the applied strain. On the one hand, viscous nonlinearity between the sampleswas found to differ especially at the lower frequencies.
Figure 11c shows the strain dependence of the thickening ratio obtained at 0.1 Hz forthe three samples. The virgin PET and r-PET samples were characterized by quasilinearbehavior, whereas REX-r-PET was characterized by strong strain rate thinning (ν3 < 0). Onthe other hand, elastic nonlinearity was found to be more sensitive to high frequencies,because REX-r-PET showed the strain thickening (e3 > 0) increasing with the frequency(frequency effect not shown to avoid data overlapping).

Polymers 2021, 13, 3531 22 of 30
Figure 11d shows the different stiffening ratios obtained at 5 Hz for the three samples.As a general trend, viscous and elastic nonlinear behavior were analogous to the responsepreviously described in shear and elongational rheological tests. Under shear, REX-r-PETshowed pseudoplastic behavior in contrast to the quasi-Newtonian response obtainedfor virgin PET and r-PET. Additionally, under melt elongational experiments, REX-r-PETshowed typical strain hardening, as the sample hardens when the strain increases at aconstant strain rate, a behavior not present in virgin PET and r-PET. Similarly, during theLAOS test, the stiffening behavior of PET REX can be understood when considering theability of the branched structure to stretch during the oscillatory flow and re-stretch in thereverse direction.
3.9. Mechanical Properties
One of these disadvantages of the mechanical recycling of PET is that chain scissiondecreases the molecular weight and intrinsic viscosity, as observed in the previous section.These results could affect the mechanical properties.
Figure 12 shows typical stress–strain curves of virgin PET, r-PET, and REX-r-PET. TheYoung’s modulus, yield strength, and strain-at-break values obtained from these curvesare shown in Figure 13. As can be seen in Figure 12, recycling does not significantlyaffect the overall tensile behavior of the material, as both r-PET and REX-r-PET showedvery ductile behaviors, similar to that of virgin PET, as well as similar cold-drawing andstrain-hardening behaviors.
With respect to the Young’s modulus, as can be observed in Figure 13a, recycledmaterials showed higher values than virgin PET. Among the usual factors affecting theYoung’s modulus of polymeric materials, three of them must be considered in this case:(1) changes in the molecular weight of the polymeric matrix, (2) changes in the crystallinityas a result of the different molecular weights or the presence of inorganic fillers, and (3) thestiffening effect of the TiO2 particles in both recycled materials.
Figure 14 and Table 5 show the DSC results of as-molded virgin PET, r-PET, andREX-r-PET both at the surface and the core of the injection-molded specimens. As usual,in these kinds of semicrystalline materials with slow crystallization rates, an increasinggradient of crystallinity from the surface to the core was observed. However, when the threematerials were compared, the differences in Xc were not far from the experimental error ofthe measurements, which, in these cases, was approximately 10–20%. Thus, crystallinitymust be ruled out as the reason for the changes observed in the Young’s modulus. Withrespect to the other two effects, on the one hand, it is well-known that molecular weightdecreases may lead or not to lower Young’s modulus values, depending on the range ofthe decrease [20,92]. On the other hand, it is also well-known that nanofillers improvethe low-strain mechanical properties of most polymeric matrices [93] and, specifically, ofPET [50,94]. Thus, the significantly higher Young’s modulus value of the two recycledmaterials, given their lower molecular weight with respect to the virgin PET, must berelated to the presence of the rigid TiO2 particles, this effect prevailing over that, if any,of the reduction in the molecular weight. The small differences observed between thetwo recycled materials agree with the changes in the molecular weight, but the values arewithin the experimental error of the measurement, and thus, the differences are hardlysignificant. The higher molecular weight of REX-r-PET with respect to r-PET is the result ofchain extension reactions caused by reactive extrusion carried out in the presence of a chainextender [19,20,34]. REX-r-PET is characterized not only by a higher molecular weight thanr-PET but, also, by the presence of long-chain branches, as demonstrated above by both theSAOS and LAOS measurements.

Polymers 2021, 13, 3531 23 of 30
Polymers 2021, 13, 3531 23 of 31
One of these disadvantages of the mechanical recycling of PET is that chain scission
decreases the molecular weight and intrinsic viscosity, as observed in the previous sec-
tion. These results could affect the mechanical properties.
Figure 12 shows typical stress–strain curves of virgin PET, r-PET, and REX-r-PET.
The Young’s modulus, yield strength, and strain-at-break values obtained from these
curves are shown in Figure 13. As can be seen in Figure 12, recycling does not significantly
affect the overall tensile behavior of the material, as both r-PET and REX-r-PET showed
very ductile behaviors, similar to that of virgin PET, as well as similar cold-drawing and
strain-hardening behaviors.
0 50 100 150 200 250 300 3500
10
20
30
40
50
60
70
80
s (
MP
a)
(%)
Virgin PET
r-PET
REX-r-PET
Figure 12. Stress–strain curves for virgin PET, r-PET, and REX-r-PET.
With respect to the Young’s modulus, as can be observed in Figure 13a, recycled ma-
terials showed higher values than virgin PET. Among the usual factors affecting the
Young’s modulus of polymeric materials, three of them must be considered in this case:
(1) changes in the molecular weight of the polymeric matrix, (2) changes in the crystallin-
ity as a result of the different molecular weights or the presence of inorganic fillers, and
(3) the stiffening effect of the TiO2 particles in both recycled materials.
Figure 14 and Table 5 show the DSC results of as-molded virgin PET, r-PET, and
REX-r-PET both at the surface and the core of the injection-molded specimens. As usual,
in these kinds of semicrystalline materials with slow crystallization rates, an increasing
gradient of crystallinity from the surface to the core was observed. However, when the
three materials were compared, the differences in Xc were not far from the experimental
error of the measurements, which, in these cases, was approximately 10–20%. Thus, crys-
tallinity must be ruled out as the reason for the changes observed in the Young’s modulus.
With respect to the other two effects, on the one hand, it is well-known that molecular
weight decreases may lead or not to lower Young’s modulus values, depending on the
range of the decrease [20,92]. On the other hand, it is also well-known that nanofillers
improve the low-strain mechanical properties of most polymeric matrices [93] and, spe-
cifically, of PET [50,94]. Thus, the significantly higher Young’s modulus value of the two
recycled materials, given their lower molecular weight with respect to the virgin PET,
must be related to the presence of the rigid TiO2 particles, this effect prevailing over that,
if any, of the reduction in the molecular weight. The small differences observed between
the two recycled materials agree with the changes in the molecular weight, but the values
are within the experimental error of the measurement, and thus, the differences are hardly
significant. The higher molecular weight of REX-r-PET with respect to r-PET is the result
of chain extension reactions caused by reactive extrusion carried out in the presence of a
chain extender [19,20,34]. REX-r-PET is characterized not only by a higher molecular
Figure 12. Stress–strain curves for virgin PET, r-PET, and REX-r-PET.
Polymers 2021, 13, 3531 24 of 31
weight than r-PET but, also, by the presence of long-chain branches, as demonstrated
above by both the SAOS and LAOS measurements.
2360
2770 2810
Virgin PET r-PET REX-r-PET0
500
1000
1500
2000
2500
3000 (a)
E (
MP
a)
51.0
54.256.0
Virgin PET r-PET REX-r-PET
0
10
20
30
40
50
60 (b)
σy
(MP
a)
292 285
230
Virgin PET r-PET REX-r-PET0
50
100
150
200
250
300 (c)
b (
%)
Figure 13. (a) Young’s modulus, (b) yield stress, and (c) strain-at-break values of virgin PET, r-
PET, and REX-r-PET.
50 100 150 200 250
Hea
t fl
ow
end
o u
p1
W/g
Temperature (ºC)
Virgin PET-i
r-PET-i
REX-r-PET-i
(a)
50 100 150 200 250
Hea
t fl
ow
end
o u
p1
W/g
Temperature (ºC)
Virgin PET-i
r-PET-i
REX-r-PET-i
(b)
Figure 14. DSC scans of PET-injected samples: first heating runs from (a) the surface and from (b)
the core of the injected specimens. Heating rates were 20 ºC/min in both cases.
Figure 13. (a) Young’s modulus, (b) yield stress, and (c) strain-at-break values of virgin PET, r-PET, and REX-r-PET.

Polymers 2021, 13, 3531 24 of 30
Polymers 2021, 13, 3531 24 of 31
weight than r-PET but, also, by the presence of long-chain branches, as demonstrated
above by both the SAOS and LAOS measurements.
2360
2770 2810
Virgin PET r-PET REX-r-PET0
500
1000
1500
2000
2500
3000 (a)
E (
MP
a)
51.0
54.256.0
Virgin PET r-PET REX-r-PET
0
10
20
30
40
50
60 (b)
σy
(MP
a)
292 285
230
Virgin PET r-PET REX-r-PET0
50
100
150
200
250
300 (c)
b (
%)
Figure 13. (a) Young’s modulus, (b) yield stress, and (c) strain-at-break values of virgin PET, r-
PET, and REX-r-PET.
50 100 150 200 250
Hea
t fl
ow
en
do
up
1 W
/g
Temperature (ºC)
Virgin PET-i
r-PET-i
REX-r-PET-i
(a)
50 100 150 200 250
Hea
t fl
ow
en
do
up
1 W
/g
Temperature (ºC)
Virgin PET-i
r-PET-i
REX-r-PET-i
(b)
Figure 14. DSC scans of PET-injected samples: first heating runs from (a) the surface and from (b)
the core of the injected specimens. Heating rates were 20 ºC/min in both cases.
Figure 14. DSC scans of PET-injected samples: first heating runs from (a) the surface and from(b) the core of the injected specimens. Heating rates were 20 ◦C/min in both cases.
Table 5. Thermal properties of the PET-injected samples. All values were obtained from the DSC firstheating scans shown in Figure 14.
Surface Core
Materials Tm(◦C)
∆Hm(J/g)
Tcc(◦C)
∆Hcc(J/g)
Xc(%)
Tm(◦C)
∆Hm(J/g)
Xc(%)
Virgin PET-i 240.9 29 117.1 3.5 18 240.2 39 29r-PET-i 239.4 24 123.0 9.4 11 244.2 32 23
REX-r-PET-i 239.2 27 129.1 10.3 12 245.9 41 30
As shown in Figure 13b, the behavior of the yield stress was similar to that of Young’smodulus: the recycled materials showed higher yield stress values compared to the virginPET, and the highest value corresponded to REX-r-PET. In previous works, it has been ob-served that the yield stress usually follows the same trend as the Young’s modulus [95–100]as it does in the present work.
Figure 13c shows the strain at break values of virgin PET, r-PET, and REX-r-PET. Asmentioned above, it is remarkable that both recycled materials show very high elongationat break values, with the strain at break values over 200%. Still, virgin PET is the onethat shows the highest elongation at break values. The above-mentioned gradient ofcrystallinity degree from the surface to the core in the three materials can help to explainthis high deformation ability. When the three materials are compared, again, the two mainfactors that are expected to have a negative effect on ductility are, on the one hand, thepresence of nanoparticles in the matrix and, on the other hand, the decrease in molecularweight [101–103]. A lower ductility of the recycled materials is, indeed, to be expectedas a consequence of the presence of nanoparticles, which is attributed to restrictions inthe mobility of the matrix chains caused by the nanoparticles that promote a fracture.Furthermore, lower molecular weights lead to a poorer strain at the break values. Whenthe two recycled materials are compared, it is observed that the ductility of REX-r-PETis significantly lower than that of r-PET. In this case, given that the TiO2 nanoparticleconcentration is the same in both recycled materials and the molecular weight is lower inr-PET, the branched chain structure of REX-r-PET could be the reason for the observed

Polymers 2021, 13, 3531 25 of 30
ductility decrease in REX-r-PET in comparison with the other samples, according to thepreviously shown rheological results.
With respect to the toughness, Table 6 shows the impact strength values of virginPET, r-PET, and REX-r-PET. It is observed that the impact strength is lower in the recycledmaterials when compared to the virgin material. As in the case of ductility, the presenceof nanoparticles [104–107] and the lowered molecular weight [108] of both r-PET andREX-r-PET with respect to virgin PET have a negative effect on its impact properties. Thedifference observed between r-PET and REX-r-PET is not significant, as it is within theexperimental error of the measurements. In any case, the impact resistance values are, ingeneral, low, as usually happens with notch-sensitive materials [109–111].
Table 6. The impact strength values of virgin PET, r-PET, and REX-r-PET.
Sample Impact Strength(J/m)
Virgin PET 27.6 ± 0.7r-PET 21.5 ± 3.1
REX-r-PET 24.3 ± 0.4
4. Conclusions
In this work, post-consumer recycled opaque PET was homogenized by extrusion(r-PET) and, also, modified by reactively extruding the material with Joncryl (REX-r-PET).The reactive extrusion changed the molecular structure of the originally linear r-PET byintroducing long-chain branches in the material and increasing the average molecularweight of the material.
Isothermal crystallization studies demonstrated that the introduction of long-chainbranches decreased both the nucleation and growth rates of REX-r-PET in comparisonwith r-PET.
According to the rheological characterization, the linear and nonlinear viscoelasticity,as well as the elongational behavior, were profoundly affected by the reactive extrusionprocess. Virgin PET and r-PET showed a rapid relaxation (relaxation time less than onesecond) related to its linear structure, and a Newtonian response was found under shear andelongational deformation. REX-r-PET was characterized by a slower relaxation process withenhanced pseudoplasticity, thermorheology, and elongational strain-hardening behavior,which indicated the formation of longer molecules and, most probably, long-chain branchesduring reactive extrusion. Correspondingly, the nonlinear viscoelastic response was alsoclearly enlarged. It is shown that both the increase in the intrinsic nonlinearity Q0 valuedetermined in the MAOS regime, as well as the viscous and elastic nonlinearity in termsof strain-thinning and strain-stiffening behaviours analyzed in the LAOS regime, couldserve as sensitive indicators of the structural changes induced by the addition of anextender/branching Joncryl additive.
The main factors affecting the mechanical properties of the recycled materials with re-spect to virgin PET are the decrease in molecular weight, the presence of TiO2 nanoparticles,and in the case of REX-r-PET, the presence of long-chain branching. As a consequence ofthe presence of TiO2 nanoparticles, low-strain mechanical properties (i.e., Young’s modulusand yield stress) increase with respect to the virgin PET both in r-PET and REX-r-PET,which are even higher in the latter, likely due to the long-chain branched matrix. On thecontrary, high-strain mechanical properties (i.e., ductility and impact strength) decreasein the recycled materials with respect to the virgin PET for the same reasons (i.e., lowermolecular weights, presence of nanoparticles, and long-chain branching in REX-r-PET).However, it is remarkable that, even after undergoing a recycling process (either reactiveof nonreactive), the materials remain very ductile.
The reactive extrusion process is a suitable way to recycle opaque PET into a materialwith enhanced rheological properties (thanks to the production of chain extension and

Polymers 2021, 13, 3531 26 of 30
long-chain branches) with mechanical properties that are comparable to those of a typicalcommercially available PET sample employed for bottle manufacturing.
Supplementary Materials: The following are available online at https://www.mdpi.com/article/10.3390/polym13203531/s1: Figure S1: DTGA. Figure S2. An example of Avrami plots of the dataobtained during the crystallization of r-PET-O at 200 ◦C. (a) Avrami plot of the experimental dataobtained during crystallization. (b) Normalized heat flow experimental data during crystallizationcompared to the data predicted data by the Avrami model. Table S1: Parameters obtained from fittingthe DSC data presented in Figure S1 to the Avrami model.
Author Contributions: A.J.M. contributed to the conceptualization of this study; A.J.M. and O.O.S.contributed to the funding acquisition; M.V.C., M.S. and A.J.M. wrote the original draft; M.V.C.and M.S. contributed to the methodology and data curation; M.V.C., M.S., M.F., I.O., D.L., V.S. andS.I. contributed to the experimental part; A.J.M., A.M., M.Z., G.G.-e., V.S., S.I., O.O.S. and M.L.M.reviewed the manuscript; and M.V.C. and M.S. edited the manuscript. All authors have read andagreed to the published version of the manuscript.
Funding: We would like to acknowledge funding by the EU Interreg H2020 program throughproject POCTEFA EFA329/19. This work also received funding from the Basque Government,grant IT1309-19.
Institutional Review Board Statement: Not applicable.
Informed Consent Statement: Not applicable.
Data Availability Statement: The data presented in this study are available on request from thecorresponding author.
Conflicts of Interest: The authors declare no conflict of interest.
References1. Plastics Europe. Plastics—the Facts 2020. Available online: https://www.plasticseurope.org/ (accessed on 10 August 2021).2. Lonca, G.; Lesage, P.; Majeau-Bettez, G.; Bernard, S.; Margni, M. Assessing scaling effects of circular economy strategies: A case
study on plastic bottle closed-loop recycling in the USA PET market. Resour. Conserv. Recycl. 2020, 162, 105013. [CrossRef]3. Nisticò, R. Polyethylene terephthalate (PET) in the packaging industry. Polym. Test. 2020, 90, 106707. [CrossRef]4. Provin, A.P.; de Aguiar, A.R.; Aguiar, I.C.; Gouveia, S.; Vieira, A. Circular economy for fashion industry: Use of waste from the
food industry for the production of biotextiles. Technol. Forecast. Soc. Chang. 2021, 169, 120858. [CrossRef]5. Meys, R.; Frick, F.; Westhues, S.; Sternberg, A.; Klankermayer, J.; Bardow, A. Towards a circular economy for plastic packaging
wastes—The environmental potential of chemical recycling. Resour. Conserv. Recycl. 2020, 162, 105010. [CrossRef]6. Cladman, W.; Scheffer, S.; Goodrich, N.; Griffiths, M.W. Shelf-life of milkpackaged in plastic containers with and without
treatment to reduce light transmission. Int. Dairy J. 1998, 8, 629–636. [CrossRef]7. Karaman, A.D.; Özer, B.; Pascall, M.A.; Álvarez, V. Recent Advances in Dairy Packaging. Food Rev. Int. 2015, 31, 295–318.
[CrossRef]8. Welle, F. Twenty years of PET bottle to bottle recycling—An overview. Resour. Conserv. Recycl. 2011, 55, 865–875. [CrossRef]9. Awaja, F.; Pavel, D. Recycling of PET. Eur. Polym. J. 2005, 41, 1453–1477. [CrossRef]10. Miller, C. Polyethylene terephthalate. Waste Age 2002, 33, 102–106.11. Wu, H.; Lv, S.; He, Y.; Qu, J. The study of the thermomechanical degradation and mechanical properties of PET recycled by
industrial-scale elongational processing. Polym. Test. 2018, 77, 105882. [CrossRef]12. Fann, D.M.; Huang, S.K.; Lee, L.Y. Kinetics and thermal crystallinity of recycled PET. II. Topographic study on thermal crystallinity
of the injection-molded recycled PET. J. Appl. Polym. Sci. 1996, 61, 261–271. [CrossRef]13. Abu-isa, I.; Jaynes, C.B.; Ogara, J.F. High-impact-strength poly(ethylene terephthalate) (PET) from virgin and recycled resins. J.
Appl. Polym. Sci. 1996, 59, 1957–2105. [CrossRef]14. Schyns, Z.; Shaver, M.P. Mechanical Recycling of Packaging Plastics: A Review. Macromol. Rapid Commun. 2020, 42, 2000415.
[CrossRef]15. La Mantia, F.P.; Vinci, M. Recycling poly(ethyleneterephthalate). Polym. Degrad. Stab. 1994, 45, 121–125. [CrossRef]16. Alvarado Chacon, F.; Brouwer, M.T.; Thoden van Velzen, E.U. Effect of recycled content and rPET quality on the properties of
PET bottles, part I: Optical and mechanical properties. Packaging Technology and Science. Am. J. Nano Res. Appl. 2020, 3, 11–16.[CrossRef]
17. Elamri, A.; Abid, K.; Harzallah, O.; Lallam, A. Characterization of Recycled/ Virgin PET Polymers and their Composites. Am. J.Nano Res. Appl. Spec. Issue Nanocompos. Coat. Manuf. 2015, 3, 11–16. [CrossRef]

Polymers 2021, 13, 3531 27 of 30
18. Asensio, M.; Nuñez, K.; Guerrero, J.; Herrero, M.; Merino, J.C.; Pastor, J.M. Rheological modification of recycled poly(ethyleneterephthalate): Blending and reactive extrusion. Polym. Degrad. Stab. 2020, 179, 109258. [CrossRef]
19. Cavalcanti, N.; Teofilo, E.T.; Rabello, M.S.; Silva, S.M.L. Chain extension and degradation during reactive processing of PET in thepresence of triphenyl phosphite. Polym. Eng. Sci. 2007, 47, 2155–2163. [CrossRef]
20. Raffa, P.; Coltelli, M.B.; Savi, S.; Bianchi, S.; Castelvetro, V. Chain extension and branching of poly(ethylene terephthalate) (PET)with di- and multifunctional epoxy or isocyanate additives: An experimental and modelling study. React. Funct. Polym. 2012, 72,50–60. [CrossRef]
21. Benvenuta Tapia, J.J.; Hernández Valdez, M.; Cerna Cortez, J.; Díaz García, V.M. Ultraviolet-induced chain extension ofpoly(ethylene terephthalate) based on radical reaction with the aid of trimethylolpropane triacrylate and glycidyl methacrylateduring extrusion. J. Polym. Environ. 2018, 26, 4221. [CrossRef]
22. Wang, K.; Qian, J.; Lou, F.; Yan, W.; Wu, G.; Guo, W. The effects of two-step reactive processing on the properties of recycledpoly(ethylene terephthalate). Polym. Bull. 2017, 74, 2479. [CrossRef]
23. González, J.; Rosales, C.; Luis, A.; Candal, M.; Albano, C. Morphological, Thermal and Mechanical Behavior of Pet/Pp-G-Demand Nylon 6/Pp-G-Dem Blends. In Proceedings of the ANTEC’98, Atlanta, GA, USA, 26–30 April 1998.
24. Zhang, Z.; Wang, C.; Mai, K. Reinforcement of Recycled PET for Mechanical Properties of Isotactic Polypropylene. Adv. Ind. Eng.Polym. Res. 2019, 2, 69–76. [CrossRef]
25. Ávila, A.F.; Duarte, M.V. A mechanical analysis on recycled PET/HDPE composites. Polym. Degrad. Stab. 2003, 80, 373–382.[CrossRef]
26. Velásquez, E.J.; Garrido, L.; Guarda, A.; Galotto, M.J.; López de Dicastillo, C. Increasing the incorporation of recycled PET onpolymeric blends through the reinforcement with commercial nanoclays. Appl. Clay Sci. 2019, 180, 105185. [CrossRef]
27. Duarte, I.S.; Tavares, A.A.; Lima, P.S.; Andrade, D.L.; Carvalho, L.H.; Canedo, E.L.; Silva, S.M. Chain extension of virgin andrecycled poly(ethylene terephthalate): Effect of processing conditions and reprocessing. Polym. Degrad. Stab. 2016, 124, 26–34.[CrossRef]
28. Awaja, F.; Daver, F.; Kosior, E. Recycled poly (ethylene terephthalate) chain extension by a reactive extrusion process. Polym. Eng.Sci. 2004, 44, 1579–1587. [CrossRef]
29. Incarnato, L.; Scarfato, P.; Di Maio, L.; Acierno, D. Structure and rheology of recycled PET modified by reactive extrusion. Polymer2000, 41, 6825–6831. [CrossRef]
30. Tramis, C.; Garnier, C.; Yus, S.; Irusta, F.; Chaberta, F. Enhancement of the fatigue life of recycled PP by incorporation of recycledopaque PET collected from household milk bottle wastes. Waste Manag. 2021, 125, 49–57. [CrossRef]
31. American Society for Testing and Materials. ASTM D 4603: Standard Test Method for Determining Inherent Viscosity of Poly(EthyleneTerephthalate) (PET) by Glass Capillary Viscometer; American Society for Testing and Materials: West Conshohocken, PA, USA, 1993.
32. Karayannidis, G.P.; Kokkalas, D.E.; Bikiaris, D.N. Solid-state polycondensation of poly(ethylene terephthalate) recycled frompost-consumer soft-drink bottles. I. J. Appl. Polym. Sci. 1993, 50, 2135–2142. [CrossRef]
33. Lorenzo, A.T.; Arnal, M.L.; Albuerne, J.; Müller, A.J. DSC isothermal polymer crystallization kinetics measurements and the useof the Avrami equation to fit the data: Guidelines to avoid common problems. Polym. Test. 2007, 26, 222–231. [CrossRef]
34. Karsl, N.G. A study on the fracture, mechanical and thermal properties of chain extended recycled poly(ethylene terephthalate).J. Thermoplast. Compos. Mater. 2017, 30, 1157–1172. [CrossRef]
35. Zhang, Y.; Zhang, C.; Li, H.; Du, Z.; Li, C. Chain extension of poly (ethylene terephthalate) with bisphenol-A dicyanate. J. Appl.Polym. Sci. 2010, 117, 2003–2008. [CrossRef]
36. Tavares, E.; Silva, A.A.; Lima, D.F.A.; Andrade, P.S.; Silva, D.L.A.C.S.; Canedo, S.M.L. Chain extension of virgin and recycledpolyethylene terephthalate. Polym. Test. 2016, 50, 26–32. [CrossRef]
37. Wang, Y.; Gao, J.; Ma, Y.; Agarwal, U.S. Study on mechanical properties, thermal stability and crystallization behavior ofPET/MMT nanocomposites. Compos. Part B Eng. 2006, 37, 399–407. [CrossRef]
38. Hu, G.; Zhao, C.; Zhang, S.; Yang, M.; Wang, Z. Low percolation thresholds of electrical conductivity and rheology in poly(ethyleneterephthalate) through the networks of multi-walled carbon nanotubes. Polymer 2006, 47, 480–488. [CrossRef]
39. Das, P.; Tiwari, P. Thermal degradation study of waste polyethylene terephthalate (PET) under inert and oxidative environments.Thermochim. Acta 2019, 679, 178340. [CrossRef]
40. Liu, H.; Wang, R.; Xu, X. Thermal stability and flame retardancy of PET/magnesium salt composites. Polym. Degrad. Stab. 2010,95, 1466–1470. [CrossRef]
41. Alongi, J.; Ciobanu, M.; Tata, J.; Carosio, F.; Malucelli, G. Thermal stability and flame retardancy of polyester, cotton, and relativeblend textile fabrics subjected to sol–gel treatments. J. Appl. Polym. Sci. 2011, 119, 1961–1969. [CrossRef]
42. Antoniadis, G.; Paraskevopoulos, K.M.; Vassiliou, A.A.; Papageorgiou, G.Z.; Bikiaris, D.; Chrissafis, K. Nonisothermal melt-crystallization kinetics for in situ prepared poly (ethylene terephthalate)/monmorilonite (PET/OMMT). Thermochim. Acta 2011,521, 161–169. [CrossRef]
43. Antoniadis, G.; Paraskevopoulos, K.M.; Bikiaris, D.; Chrissafis, K. Non-isothermal crystallization kinetic of poly (ethyleneterephthalate)/fumed silica (PET/SiO2) prepared by in situ polymerization. Thermochim. Acta 2010, 510, 103–112. [CrossRef]
44. Brandrup, J.; Immergut, E.H.; Grulke, E.A. Bloch Polymer Handbook, 4th ed.; Wiley: New York, NY, USA, 1999.45. Varma, P.; Lofgren, E.A.; Jabarin, S. A Properties and kinetics of thermally crystallized orientated poly(ethylene terephthalate)
(PET) I: Kinetics of crystallization. Polym. Eng. Sci. 1998, 38, 237–244. [CrossRef]

Polymers 2021, 13, 3531 28 of 30
46. Wang, Z.G.; Hsiao, B.S.; Fu, B.X.; Liu, L.; Yeh, F.; Sauer, B.B.; Chang, H.; Schultz, J.M. Correct determination of crystal lamellarthickness in semi crystalline poly (ethylene terephthalate) by small-angle X-ray scattering. Polymer 2000, 41, 1791–1797. [CrossRef]
47. Daubeny, R.D.P.; Bunn, C.W.; Brown, C.J. The crystal structure of polyethylene terephthalate. Proc. R. Soc. 1956, A226, 531.[CrossRef]
48. Lu, X.F.; Hay, J.N. Isothermal crystallization kinetics and melting behaviour of poly (ethylene terephthalate). Polymer 2001, 42,9423–9431. [CrossRef]
49. Müller, A.J.; Michell, R.M.; Lorenzo, A.T. Chapter 11. Isothermal Crystallization Kinetics of Polymers. In Polymer Morphology:Principles, Characterization, and Processing; Guo, Q., Ed.; John Wiley & Sons, Inc.: Hoboken, NJ, USA, 2016; pp. 181–203. [CrossRef]
50. Lorenzo, A.T.; Müller, A.J. Estimation of the nucleation and crystal growth contributions to the overall crystallization energybarrier. J. Polym. Sci. Part B Polym. Phys. 2008, 46, 1478–1487. [CrossRef]
51. Gaonkar, A.A.; Murudkar, V.V.; Deshpande, V.D. Comparison of crystallization kinetics of polyethylene terephthalate (PET) andreorganized PET. Thermochim. Acta 2020, 683, 178472. [CrossRef]
52. Sorrentino, L.; Iannace, S.; Di Maio, E.; Acierno, D. Isothermal crystallization kinetics of chain-extended PET. J. Polym. Sci. Part BPolym. Phys. 2005, 43, 1966–1972. [CrossRef]
53. Vyazovkin, S.; Stone, J.; Sbirrazzuoli, N. Hoffman-Lauritzen parameters for non-isothermal crystallization of poly (ethyleneterephthalate) and poly (ethylene oxide) melts. J. Therm. Anal. Calorim. 2005, 80, 177–180. [CrossRef]
54. Jiang, X.L.; Luo, S.J.; Sun, K.; Chen, X.D. Effect of nucleating agents on crystallization kinetics of PET. Express Polym. Lett. 2007, 1,245–251. [CrossRef]
55. Ferry, J.D. Viscoelastic Properties of Polymers; Wiley: New York, NY, USA, 1980.56. Tschoegl, N.W. The Phenomenological Theory of Linear Viscoelastic Behavior: An Introduction; Springer: New York, NY, USA, 1989.57. Bird, R.B.; Armstrong, R.C.; Hassager, O. Dynamics of Polymeric Liquids; Wiley: New York, NY, USA, 1987; Volume 1.58. Kruse, M.; Wagner, M. Rheological and molecular characterization of long-chaing branched poly(ethylene terphthalate). Rheol.
Acta 2017, 56, 887–904. [CrossRef]59. Kil, S.B.; Augros, T.; Leterrier, Y.; Manson, J.A.E.; Christel, A.; Borer, C. Rheological properties of hyperbranched poly-
mer/poly(ethylene terephthalate) reactive blends. Polym. Eng. Sci. 2003, 43, 329–343. [CrossRef]60. Ge, Y.; Yao, S.; Xu, M.; Gao, L.; Fang, Z.; Zhao, L.; Liu, T. Improvement of Poly(ethylene terephthalate) Melt-Foamability by
Long-Chain Branching with the Combination of Pyromellitic Dianhydride and Triglycidyl Isocyanurate. Ind. Eng. Chem. Res.2019, 58, 3666–3678. [CrossRef]
61. Keßner, U.; Kaschta, J.; Münstedt, H. Determination of method-invariant activation energies of long-chain branched low-densitypolyethylenes. J. Rheol. 2009, 53, 1001–1016. [CrossRef]
62. Van Gurp, M.; Palmen, J. Time-temperature superposition for polymeric blends. Rheol. Bull 1998, 67, 5–8.63. Lohse, D.J.; Milner, S.T.; Fetters, L.J.; Xenidou, M.; Hadjichristidis, N.; Mendelson, R.A.; García-Franco, C.A.; Lyon, M.K.
Well-defined model long chain branched polyethylene. 2. Melt rheological behavior. Macromolecules 2002, 35, 3066–3075.[CrossRef]
64. Wood-Adams, P.; Costeux, S. Thermorheological Behavior of Polyethylene: Effects of Microstructure and Long Chain Branching.Macromolecules 2001, 34, 6281–6290. [CrossRef]
65. Trinkle, S.; Walter, P.; Friedrich, C. Van Gurp-Palmen plot II—Classification of long chain branched polymers by their topology.Rheol. Acta 2002, 41, 103–113. [CrossRef]
66. Stadler, F.J.; Kaschta, J.; Munstedt, H. Thermorheological behavior of various long-chain branched polyethylene. Macromolecules2008, 41, 1328–1333. [CrossRef]
67. Abbasi, M.; Faust, L.; Riazi, K.; Wilhelm, M. Linear and Extensional Rheology of Model Branched Polystyrenes: From LooselyGrafted Combs to Bottlebrushes. Macromolecules 2017, 50, 5964–5977. [CrossRef]
68. Lee, L.H.; Orfanou, K.; Driva, P.; Iatrou, H.; Hadjichristidis, N.; Lohse, D.J. Linear and Nonlinear Rheology of Dendritic StarPolymers: Experiment. Macromolecules 2008, 41, 9165–9178. [CrossRef]
69. Nielsen, J.K.; Rasmussen, H.K.; Denberg, M.; Almdal, K.; Hassager, O. Nonlinear Branch-Point Dynamics of Multiarm Polystyrene.Macromolecules 2006, 39, 8844–8853. [CrossRef]
70. Chen, X.; Rahman, M.S.; Lee, H.; Mays, J.; Chang, T.; Larson, R. Combined Synthesis, TGIC Characterization, and RheologicalMeasurement and Prediction of Symmetric H Polybutadienes and Their Blends with Linear and Star-Shaped Polybutadienes.Macromolecules 2011, 44, 7799–7809. [CrossRef]
71. Kapnistos, M.; Vlassopoulos, D.; Roovers, J.; Leal, L.G. Linear Rheology of Architecturally Complex Macromolecules: CombPolymers with Linear Backbones. Macromolecules 2005, 38, 7852–7862. [CrossRef]
72. Lentzakis, H.; Vlassopoulos, D.; Read, D.J.; Lee, H.; Chang, T.; Driva, P.; Hadjichristidis, N. Uniaxial extensional rheology of wellcharacterized comb polymers. J. Rheol. 2013, 57, 605–625. [CrossRef]
73. Van Ruymbeke, E.; Kapnistos, M.; Vlassopoulos, D.; Huang, T.; Knauss, D.M. Linear Melt Rheology of Pom-Pom Polystyreneswith Unentangled Branches. Macromolecules 2007, 40, 1713–1719. [CrossRef]
74. Lentzakis, H.; Das, C.; Vlassopoulos, D.; Read, D.J. Pom-pom like constitutive equations for comb polymers. J. Rheol. 2014, 58,1855–1875. [CrossRef]

Polymers 2021, 13, 3531 29 of 30
75. Kempf, M.; Barroso, V.C.; Wilhelm, M. Anionic Synthesis and Rheological Characterization of Poly(p-methylstyrene) Model CombArchitectures with a Defined and Very Low Degree of Long Chain Branching. Macromol. Rapid Commun. 2010, 31, 2140–2145.[CrossRef]
76. Liu, G.; Ma, H.; Lee, H.; De Xua, H.; Cheng, S.; Sun, H.; Chang, T.; Quirk, R.P.; Wang, S. Long-chain branched polymers to prolonghomogeneous stretching and to resist melt breakup. Polymer 2013, 54, 6608–6616. [CrossRef]
77. Dealy, J.M.; Larson, R.G. Structure and Rheology of Molten Polymers: From Structure to Flow Behavior and Back Again, 1st ed.; CarlHanser Verlag: Munich, Germany, 2006.
78. Hyun, K.; Kim, W. A new non-linear parameter Q from FT-Rheology under non-linear dynamic oscillatory shear for polymermelts system. Korea Aust. Rheol. J. 2011, 23, 227–235. [CrossRef]
79. Hoyle, D.M.; Auhl, D.; Harlen, O.G.; Barroso, V.C.; Wilhelm, M.; McLeish, T.C.B. Large amplitude oscillatory shear and Fouriertransform rheology analysis of branched polymer melts. J. Rheol. 2014, 58, 969–997. [CrossRef]
80. Hyun, K.; Kim, W.; Park, S.; Wilhelm, M. Numerical simulation results of the non-linear coefficient Q from ft-rheology using asingle mode pompom model. J. Rheol. 2013, 57, 1–25. [CrossRef]
81. Reinheimer, K.; Grosso, M.; Hetzel, F.; Kübel, J.; Wilhelm, M. Fourier Transform Rheology as an innovative morphologicalcharacterization technique for the emulsion volume average radius and its distribution. J. Colloid Interface Sci. 2012, 380, 201–212.[CrossRef] [PubMed]
82. Salehiyan, R.; Song, H.Y.; Hyun, K. Non-linear behavior of PP / PS blends with and without clay under large amplitude oscillatoryshear (LAOS) flow. Korea-Aust. Rheol. J. 2015, 27, 95–103. [CrossRef]
83. Sangroniz, L.; Palacios, J.K.; Fernández, M.; Ignacio, J.; Santamaria, A.; Müller, A.J. Linear and non-linear rheological behavior ofpolypropylene/polyamide blends modified with a compatibilizer agent and nanosilica and its relationship with the morphology.Eur. Polym. J. 2016, 83, 10–21. [CrossRef]
84. Cho, K.; Hyun, K.; Kyung, L.; Seung, A. Geometrical interpretation of large amplitude oscillatory shear response. J. Rheol. 2005,45, 747–758. [CrossRef]
85. Ewoldt, R.H.; Hosoi, A.E.; McKinley, G.H. New measures for characterizing non-linear viscoelasticity in large amplitudeoscillatory shear. J. Rheol. 2008, 52, 1427–1458. [CrossRef]
86. Hyun, K.; Wilhelm, M.; Klein, C.O.; Soo Cho, K.; Gun Nam, J.; Hyun Ahn, H.; Jong Lee, S.; Ewoldt, R.H.; McKinley, G.H. Areview of non-linear oscillatory shear tests: Analysis and application of large amplitude oscillatory shear (LAOS). Prog. Polym.Sci. 2011, 36, 1697–1753. [CrossRef]
87. Sugimoto, M.; Suzuki, Y.; Hyun, K.; Ahn, K.H.; Ushioda, T.; Nishioka, A.; Taniguchi, T.; Koyama, K. Melt rheology of long-chain-branched polypropylenes. Rheol. Acta 2006, 46, 33–44. [CrossRef]
88. Fan, X.; Xu, X.; Wu, C.; Song, Y.; Zheng, Q. Influences of chemical crosslinking, physical associating, and filler filling on non-linearrheological responses of polyisoprene. J. Rheol. 2020, 64, 775–784. [CrossRef]
89. Hyun, K.; Baik, E.S.; Ahn, K.H.; Lee, S.J.; Sugimoto, M.; Koyama, K. Fourier-transform rheology under medium amplitudeoscillatory shear for linear and branched polymer melts. J. Rheol. 2007, 51, 1319–1342. [CrossRef]
90. Hyun, K.; Wilhelm, M. Establishing a new mechanical non-linear coefficient Q from FT-rheology: First investigation of entangledlinear and comb polymer model systems. Macromolecules 2009, 42, 411–422. [CrossRef]
91. Ahirwal, D.; Filipe, S.; Neuhaus, I.; Busch, M.; Schlatter, G.; Wilhelm, M. Large amplitude oscillatory shear and uniaxialextensional rheology of blends from linear and long-chain branched polyethylene and polypropylene. J. Rheol. 2014, 58, 635–658.[CrossRef]
92. Botta, L.; Scaffaro, R.; Sutera, F.; Mistretta, M.C. Reprocessing of PLA/graphene nanoplatelets nanocomposites. Polymers 2018, 10,18. [CrossRef]
93. Selvin, T.P.; Kuruvilla, J.; Sabú, T. Mechanical properties of titanium dioxide-filled polystyrene microcomposites. Mater. Lett. 2004,58, 281–289. [CrossRef]
94. Aoyama, S.; Ismail, I.; Tae Park, Y.; Yoshida, Y.; Macosko, C.Y.; Ougizawa, T. Applied Nano Materials Polyethylene Terephtha-late/Trimellitic Anhydride Modified Graphene Nanocomposites. ACS Appl. Nano Mater. 2018, 1, 6301–6311. [CrossRef]
95. Fernandez-Menéndez, T.; García-López, D.; Argüelles, A.; Fernandez, A.; Viña, J. Industrially produced PET nanocompositeswith enhanced properties for food packaging applications. Polym. Test. 2020, 90, 106729. [CrossRef]
96. Nikam, P.N.; Deshpande, V.D. Thermal and tensile properties of alumina filled PET nanocomposites. AIP Conf. Proc. 2018, 1953,090058.
97. Kim, J.Y.; Park, H.S.; Kim, S.H. Multiwall-carbon-nanotube-reinforced poly(ethylene terephthalate) nanocomposites by meltcompounding. J. Appl. Polym. Sci. 2007, 103, 1450–1457. [CrossRef]
98. Rodríguez, J.L.; Equiazabal, J.I.; Nazaba, J. Phase Behavior and Interchange Reactions in Poly(butylene terephthalate)/Poly(ester-carbonate) Blends. Polym. J. 1996, 28, 501–506. [CrossRef]
99. Vallejo, F.J.; Eguiazabal, J.L.; Nazabal, J. Solid-state features and mechanical properties of PEI/PBT blends. J. Appl. Polym. Sci.2001, 80, 885–892. [CrossRef]
100. Brostow, W.; Corneliussen, R.D. Failure of Plastics. Hanser Pub.: Munich, Germany, 1986.101. Yeh, C.C.; Chen, C.N.; Li, Y.T.; Chang, C.W.; Cheng, M.Y.; Chang, H.I. The Effect of Polymer Molecular Weight and UV Radiation
on Physical Properties and Bioactivities of PCL Films. Cell. Polym. 2011, 30, 261–276. [CrossRef]

Polymers 2021, 13, 3531 30 of 30
102. Andrady, A.L.; Pegram, J.E.; Trpsha, Y. Changes in carbonyl index and average molecular weight on embrittlement of enhanced-photodegradable polyethylenes. J. Environ. Polym. Degrad. 1993, 1, 171–179. [CrossRef]
103. Spinacé, M.A.S.; De Paoli, M.A. Characterization of poly(ethylene terephtalate) after multiple processing cycles. J. Appl. Polym.Sci. 2001, 80, 20–25. [CrossRef]
104. Bao, R.Y. Balanced strength and ductility improvement of in situ crosslinked polylactide/poly(ethylene terephthalate glycol)blends. RSC Adv. 2015, 5, 34821–34830. [CrossRef]
105. Lozano-González, M.J.; Rodriguez-Hernandez, M.T.; Gonzalez-De Los Santos, E.A.; Villalpando-Olmos, J. Physical-mechanicalproperties and morphological study on nylon-6 recycling by injection molding. J. Appl. Polym. Sci. 2000, 76, 851–858. [CrossRef]
106. Ronkay, F.; Molnár, B.; Szalay, F.; Nagy, D.; Bodsay, B.; Sajó, I.; Bocz, K. Development of Flame-Retarded Nanocomposites fromRecycled PET Bottles for the Electronics Industry. Polymers 2019, 11, 233. [CrossRef]
107. Li, W.; Schlarb, A.K.; Evstatiev, M. Study of PET/PP/TiO2 microfibrillar-structured composites, Part 2: Morphology andmechanical properties. J. Appl. Polym. Sci. 2009, 113, 3300–3306. [CrossRef]
108. Ronkay, F.; Molnar, B.; Gere, D.; Czigany, T. Plastic waste from marine environment: Demonstration of possible routes forrecycling by different manufacturing technologies. Waste Manag. 2021, 119, 101–110. [CrossRef] [PubMed]
109. Takano, M.; Nielsen, L.E. The notch sensitivity of polymeric materials. J. Appl. Polym. Sci. 1976, 20, 2193–2207. [CrossRef]110. Ogazi-Onyemaechi, B.C.; Leong, Y.W.; Hamada, H. Crack propagation behavior and toughness of V-notched polyethylene
terephthalate injection moldings. J. Appl. Polym. Sci. 2010, 116, 132–141. [CrossRef]111. Chukwuemeka, B.; Wei, Y.; Hamada, H. Dependence of polyethylene terephthalate crack-tip temperature on stress intensity and
notch sensitivity. Polym. J. 2010, 42, 592–599. [CrossRef]