study of farm level impact of the barai irrigation system of farm level impact... · study of farm...
TRANSCRIPT
1
Study of Farm Level Impact of the Barai Irrigation System
Introduction
The Labour Based Rehabilitation Programme (LBRP) executed by the International
Labour Organization (ILO) has been part of an employment generation programme
since the early 1990s. This programme generated employment for displaced persons,
demobilized persons through the development and implementation of labour-based
infrastructure and irrigation rehabilitation works. Through this programme ILO has been
engaged in the development of roads and irrigation schemes in various provinces of the
kingdom of Cambodia, which includes Siem Reap, Battambang, Banteay Meanchey,
Takeo, Pursat and Kandal provinces. The Barai Irrigation Scheme in Siem Reap is one
of the important projects in this programme.
Since 1993 the International Labour Organisation (ILO) through three consecutive
technical cooperation projects has been assisting the construction, the rehabilitation and
the maintenance of the Barai Irrigation System (BIS) in Siem Reap Province. The
Department of Hydrology within the Ministry of Agriculture, Forestry and Fisheries
(and later of the Ministry of Water Resources and Metrology) was the counterpart of the
ILO projects for these activities. The ILO Upstream Project has terminated its technical
support to the Barai Irrigation System (BIS) at the end of the year 2000. Although the
achievements of the ILO Upstream Projects assistance to the Barai Irrigation System are
well known, the impact at the farmers•f level has not been well documented.
The Center for Advanced Study (CAS) was asked by ILO to conduct a study on impact
of the ILO support to the irrigation rehabilitation schemes on the farmers. This study
aims to assess the actual impact of the improvements made in the irrigation scheme on
the farmers. The study is also to provide information on the results of the ILO support to
the Barai Irrigation System to others who are investing in the irrigation sector and to
those who intend to provide similar support to the Barai Irrigation System.
The study is aimed to assess the following issues:
- Land utilization before and after ILO assiatance;
- Production, consumption and surplus before and after the ILO intervention;
- Impact on expenditure and income patterns before and after the ILO intervention;
- Economic benefits (increase in surplus/diversification, etc);
- Social aspects (relation to community/Water Users Group);
- Technical capacity;
- Institutional support;
- Overall economic situation
The terms of reference emphasize a focus on changes in land use, crop production, and
productivity; as well as on the overall change in the farmers' economy. The main focus
of the study is the direct impact at the farmers•f level. The survey was based on the
command area of secondary canal number 5 (SC-5) of the Barai Irrigation System.
The center for Advanced Study (CAS) was asked to carry out the study by taking small
representative samples of different farming zones.
2
Methodology
An analysis of a complex irrigation system, such as the Barai, could involve very
detailed and time-consuming survey work. The most practical approach to an impact
assessment would be to confine it to a study area formed by the command area of just
one canal. For this study the Sub-Project Canal, SC-5 was chosen. This area was subject
of the 1994 baseline survey and is covered by regular water measurements. The entire
SC-5 was maintained and rehabilitated in 1993 by ILO. The impact survey samples for
SC-5 stretches to two districts (Pouk and Seam Riep), five communes and nine villages.
Representative samples were taken at tertiary canal level, where the impact of ILO
irrigation assistance to the farmers since 1993 could be studied. As the survey teams
could not visit all farms, it was necessary to use farm level microanalysis to understand
the changes that have occurred as a result of ILO support.
The samples were taken from 11 tertiary canals on average six samples for each tertiary
canal. Eleven tertiary canals within the secondary canal 5 (SC-5) were selected. Each
tertiary canal into was divided three irrigation-farming zones: upstream, center and
downstream. Those farmers who had irrigated land within the radius of half a kilometer
from the SC-5 were categorized as part of the upstream irrigation-farming zone. Farmers
who had cultivable irrigated land between half and one kilometer from SC-5 were
classified within the central irrigation-farming zone and those who have land beyond
one kilometer from SC-5 are classified in the downstream irrigation-farming zone. The
number of interviewees for the upstream farming-zone, central farming-zone and
downstream farming-zone were 25, 23and 21, respectively. In total, 69 interviewees
were conducted with farmers. Ten more interviews were conducted with the chiefs of
Water User Group (WUG), which makes a total of 79 interviews for this study (see,
Appendix, Table 1).
The study used both semi-structured interviews and a formal survey. Semei-structured
interviews were used to assess the management of irrigation water at the farm level. The survey
was used to obtain estimates of the efficiency of irrigation service, land utilization, cropping
patterns, crop productions, consumption, surplus and deficits in order to measure
impact. During the first week of the fieldwork the questionnaire was tasted and adapted.
In the process of testing the questionnaire, the researchers were trained on how to obtain
the basic data from the farmers, and how to document those data.
The survey was carried out by two teams of two researchers each, one interviewer and
the other one recorder. The first team consisted of Ms. Nguan Sokunthea (B.A) and Mr.
Kim Van (B.A) and the second team consisted of Mr. Khat Sokha (B.A) and Ms. Mak
Sophea (B.A.). The interview took 3-4 hours each depending on the interviewee's
capacity to provide the required data. Considerable time was reserved during this
interview period to help the farmers concentrate and complete the task with accuracy. In
the absence of baseline information on the situation prior to the ILO activities (i.e. 1993)
part of the questions required memory recall of the interviewees.
On arrival at the tertiary canals, Water User Group (WUG) chiefs of tertiary canals were
first approached and interviewed in order to get basic information on the management of
irrigation. The farmer interviewees were selected with the help of the WUG chief. With
the permission of the interviewees, interviews were recorded on tape, which are
available from the Center for Advanced Study office. Survey forms were completed in
Khmer and translated into English.
3
All data were entered into the Integrated Microsoft Processing System (IMPS) and then
processed in Microsoft Excel by CAS researchers. Dummy tables were developed to
facilitate the analysis and a comparison was made between the baseline, 1993 (before
the ILO support) and the present day, 1999 (the impact of ILO support). The year 1999
was taken as present day because it was the latest crop year that enables us to determine
the impact of ILO support on the farmers in order to compare it with the baseline
(1993), the year that ILO started to provide service to the Barai Irrigation System.
In the course of the field survey several government and non-government organizations
were contacted. The following government organizations were visited: Siem Reap
Provincial Ministry of Agriculture (PMA); Provincial Department of Agronomy (PDA);
Ministry of Water Resources and Meteorology; Provincial Department of Hydrology,
and Tukville Research Center. The following non-governmental organizations were
visited: FAO- Siem Reap Office, Adventist Development and Relief Service (ADRA);
Agrisiod, a French Agricultural Development Assistance Organization; and CARERE
Siem Reap Office. Interviews with some of the village, commune and district chiefs
was, unfortunately, not possible due to time constraints.
1. Background to ILO Assistance, Geographical and External
Attributes
1.1. Background to the ILO Involvement in the Barai Irrigation
System
The Barai Irrigation System (BIS) is located approximately 8 kilometers from Siem
Reap town. Agriculture based on irrigation has taken place in the Siem Reap area since
the days of the Angkor Empire in the 11th century. However, the present scheme was
designed and built by the French during the 1930's with some modifications being
carried out by the Americans in the 1960's. A diversion weir (Prast Keo) that was
constructed in the 1930s on the Stung Siem Reap River presently serves the Barai. The
diverted Water runs to the Barai Occidental reservoir (storage capacity 40 Million m3)
with full supply level of 25 meters1.
The system ran efficiently up until the early 1970's. It was regulated and maintained by
the Provincial Department of Hydrology (DoH) with technical input and decision
making from the central DoH. The whole scheme was used for wet season
supplementary rice irrigation and some dry season rice irrigation in the more fertile soils
adjacent to the Tonle Sap Lake. Irrigation water for dry season fruit and vegetable
production was also provided.
Due to the civil war during the early 1970's the scheme's condition began to deteriorate.
During the reign of the Khmer Rouge from 1975 to 1979 some changes were made to
the scheme. From 1979 to 1989 the Barai irrigation system was working on a greatly
reduced area due to the deterioration in the condition of the canals. In 1989 the
Adventist Development Relief agency (ADRA) in conjunction with Siem Reap
Provincial department of Hydrology (DoH) began a series of structural repair works to
the Barai scheme. Renovation of secondary canals (SCs) 2, 4 & 5 was carried out.
ADRA completed these repair works in 1991.
4
The ILO activities in the Barai started in 1992 with an emergency rehabilitation project.
The main ILO assistance program started in 1993. It largely concentrated on the clearing
and repair of the main canal system, secondary canals, including bank restoration, and
the re-building and replacing of control structures. At the start of the works, the levels of
the canal banks were below design level, 30 per cent of the banks were washed away
and all the existing structures were damaged or destroyed.
Subsequently, the ILO was involved with the establishment and operation of Water
Users Associations (WUA). ILO's assisted in the setting up of Water Users'
Associations based on Tertiary Canals (TC). They instigated maintenance of the TC's by
the WUA's secured agreement for a water management plan (water schedule), drafted
and implemented a WUA agreement Bye Laws for the scheme through the Provincial
Governors office and secured an agreement for water charges.
The agricultural area, covering around 12,000 hectares has an irrigated command area of
around 4,000 hectares of double-cropped rice land served by gravity distribution system.
Three kilometers main canal and eight secondary canals serve the irrigated area with a
total length of 50 kilometers. The beneficiaries•f population of the Barai Irrigation
System in the early 1990s was 5,465 households.
1.2. Soil Type
Research by the Cambodia-IRRI-Australia Project has so far identified eleven main soils
in the country. The Barai Irrigation System (BIS) soil is one of them, known as Group 0
- Prey Khmer Soil (Plate 6) that is estimated to exist in 10 to 12 % of the rice-growing
area of all Cambodia. [1] It is also widely known that the quality of the soil in the
command area of the Barai Irrigation system is very poor, sandy, lacking organic matter,
which is easily being washed out by the rains. Moreover, it coagulates in the dry season
forming a hard layer 50 centimeters below ground level.
An increased use of fertilizer is recommended for the soil of the Barai area. However,
with poor water supply and low rice prices it is recommended not to apply fertilizer.
Water standing on the surface only occurs for a short period during the height of the
rainy season when the entire surface profile is saturated.3 The character of the Barai
area soil requires both natural and artificial fertilizers to increase production. This
implies that the availability of water alone could not affect yield and production; there
must be sufficient fertilizer application.
Since the Barai Irrigation System soil is sandy, its water holding capacity is very poor
and makes it difficult to estimate of irrigation scheduling and irrigation water
requirements, particularly for rice. No intensive study on the Barai's soil mapping and
land capacity has been undertaken, so far.
1.2. Metrology
Presently, rainfall, temperature, sunshine, wind, and water gauges at the Tonle Sap and
Siem Reap River are recorded by the Department of Hydrology. The Siem Reap region
has a tropical monsoon climate, which is warm and humid during May to November and
almost dry during the rest of the year. Maximum day temperatures of 40.80C and a
minimum night temperatures of 13.6 0C were recorded at the meteorological office,
Siem Reap. There has been an average annual rainfall of 1438.5 mm during the last 10
years record, 1990 – 1999, (see, appendix).

5
The total rainfall recorded in the baseline year (1993) was 142 days. This was 193 days
for the year 1999. The total rainfall for 1993 was 1524.4 mm and for 1999, 1468.3 mm.
The number of rainy days per year and the total amount of rainfall per year in the area
determines the demand and the supply of irrigation water.
1.3. External Influence
There have been several other external factors that obviously have played a role in the
yield of crop and that have to be taken into account in any assessment of impact. Among
those factors are activities from other (inter)national organisations in the area such as
agricultural extension service as well as negative effects due to natural causes. But the
services provided by the INGOs were mostly for short period as compared to ILO's
assistance, which was provided for more than six years to the BIS farmers. Besides in
the irrigation sector, ILO has been rehabilitating and maintaining the road of the BIS
with the objectives of improving the infrastructure rural Cambodia and in order to
promote employment.4
Activities of other organisations in the area
Besides ILO, other development organisations have been working in the area. Most
organisations worked for only one or two and even some of them less than one year in
the area of secondary canal 5 (SC-5).
The Hydrology Department has been involved in maintenance of the canal and has
provided training on maintenance.
ADRA has been involved in activities of animal raising, gardening and pond/well
digging, and has provided seeds and (natural) fertilizer.
AGRISIOD had been involved in animal raising, extension service and the
construction of pump wells, and has provided seeds and natural fertilizer.
FAO/IPM has been involved in fishing and animal husbandry, and has provided
extension on agricultural techniques and pest management.
UNICEF and ACLEDA have been involved in credit activities.
WFP and ILO have been involved in road construction.
CARERE has set up health care activities.
ADHOC has provided trainings about human rights.
The organisations ADRA and AGRISUD were most often mentioned, and seem to have
worked in all the tertiary canals under study. But, ADRA was active in providing
irrigation service before ILO intervention in the Barai Irrigation System (BIS) and
AGRIZIOD has been providing service after 1999. That means ILO has been the major
service provider to the Barai irrigation scheme. The respondents confirmed that ILO's
service to the barai has been effective and sustainable than the other organizations'
assistance.
One important issue here is that the service input of ILO to the Barai Irrigation System
was not appropriately integrated with other inputs such as extension service, training
progromme on basic agricultural technique, provision of fertilizers with subsidy,
pesticide provision, soil survey and agricultural research. This has undoubtedly
obstructed the expected yield and productivity.
The local authorities such as the district, commune, and village chiefs were playing an
important role to the BIS. There was distinction between the organization of WUGs in
Siem Reap and Peuk districts. Those WUGs in the Peuk district are better organized
6
than the WUGs of Siem Reap district. According to the information of Department of
Hydrology, this was because the of the of the Peuk district chief, which usually gives
enough attention to the WUGs by providing advice and organizing meetings.
Natural damage to crops
Problems of flood, drought, mice, rats and worms, storm, and cattle diseases were all
reported for both the baseline year (1993) and 1999. Floods seemed to have been a more
serious problem in 1993 (with 6 of the 10 canals reporting floods) than in 1999 (floods
reported by only 2 canals). In 1993 the floods mainly occurred in the first part of the
canal (TC 1-15). Droughts were reported by many WUGs, both for 1993 and 1999.
However, most WUGs stated that droughts are no serious problem, as the farmers can
get water from the canal and ponds. Plagues of mice, rats and worms had occurred
equally in 1993 and 1999, and took place in both years in the same tertiary canals (i.e.
TC 1,15,18,20 and 21).
2. Demography, Access for Irrigation, and Ownership of
Farm Animals
2.1. Demographic Data
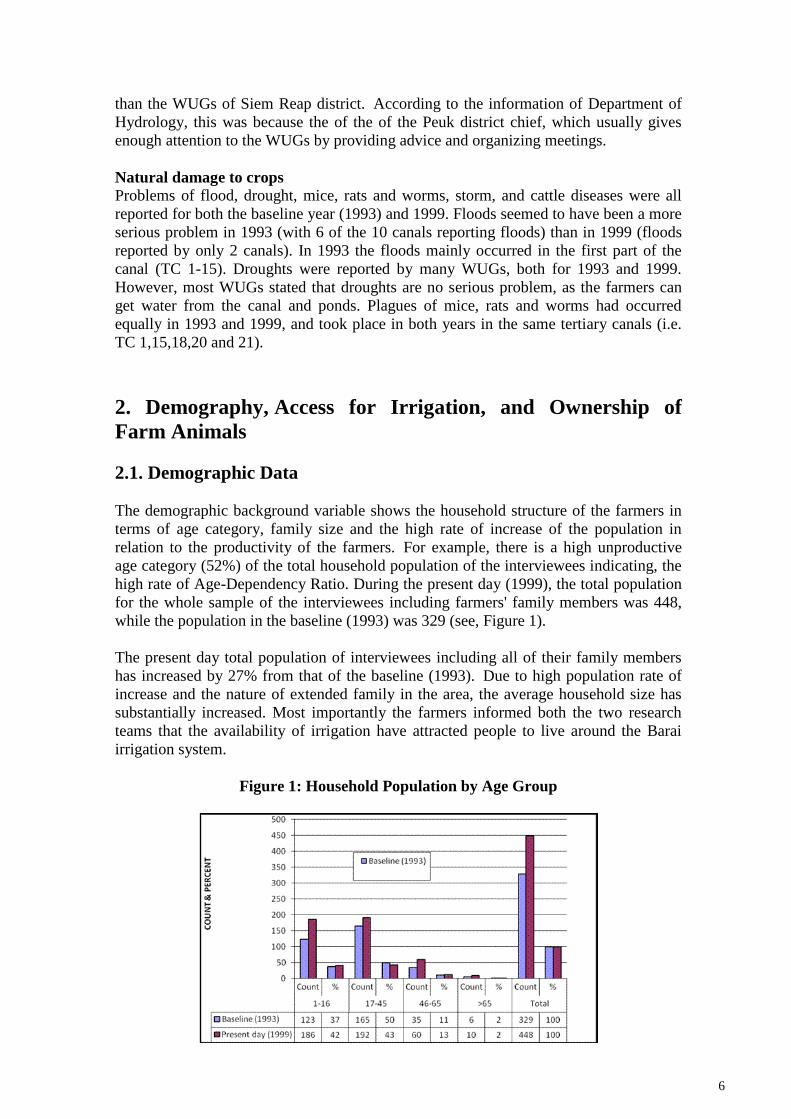
The demographic background variable shows the household structure of the farmers in
terms of age category, family size and the high rate of increase of the population in
relation to the productivity of the farmers. For example, there is a high unproductive
age category (52%) of the total household population of the interviewees indicating, the
high rate of Age-Dependency Ratio. During the present day (1999), the total population
for the whole sample of the interviewees including farmers' family members was 448,
while the population in the baseline (1993) was 329 (see, Figure 1).
The present day total population of interviewees including all of their family members
has increased by 27% from that of the baseline (1993). Due to high population rate of
increase and the nature of extended family in the area, the average household size has
substantially increased. Most importantly the farmers informed both the two research
teams that the availability of irrigation have attracted people to live around the Barai
irrigation system.
Figure 1: Household Population by Age Group
7
For instance, the average household size in the baseline (1993) was 4.8 whereas the
average household size of the present day (1999) is 6.6. Thus the average household size
of the present day is higher than the average baseline household size by 27%. This
suggests the increase in the size of the family causing shortage of food especially for
those farmers who are poor possessing small plot of land. The other issue is the 1-16 age
group was less in the baseline (37%) than in the present day (42%). Whereas the
productive age group 17-45 is higher in the baseline (50%) than in the present day
(43%). Those people in the age group of 1-16 and above the age of 65 are considered as
dependent with the other age groups. When we consider Age-Dependency Percentage of
the baseline, for instance, 39% of the total population was dependant, which is in fact
less than the present day being 44%.
2.2. Farmers' access for irrigation
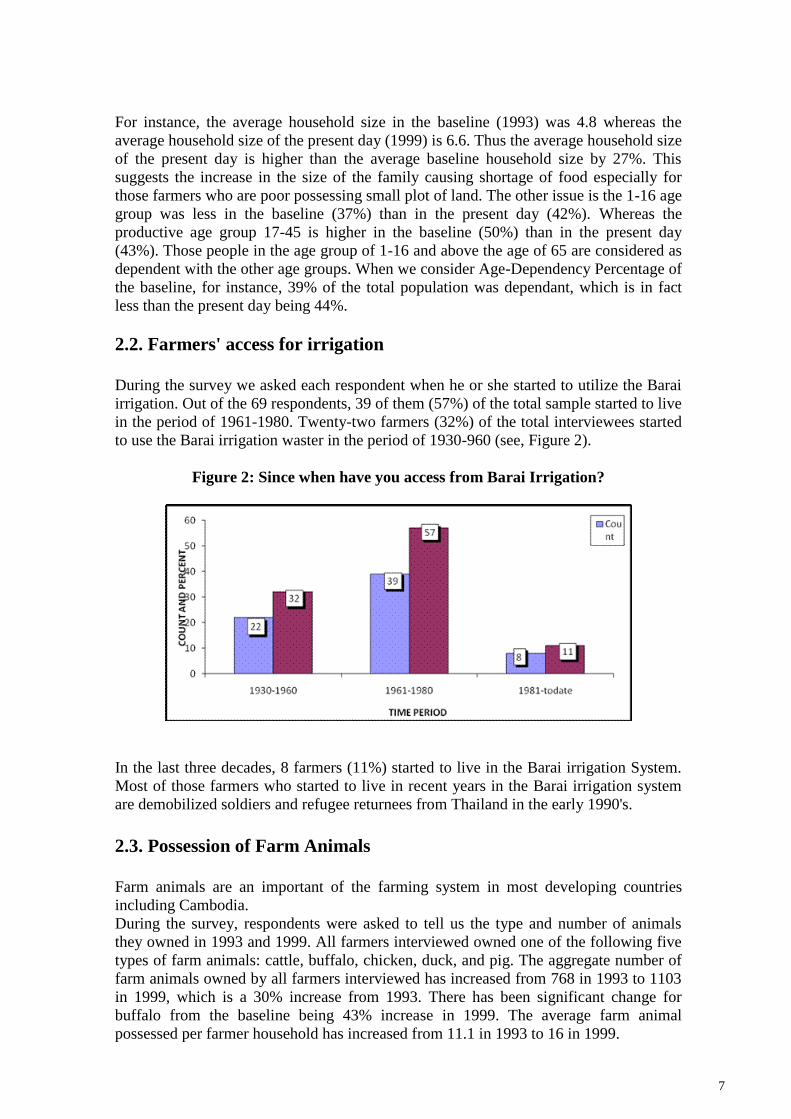
During the survey we asked each respondent when he or she started to utilize the Barai
irrigation. Out of the 69 respondents, 39 of them (57%) of the total sample started to live
in the period of 1961-1980. Twenty-two farmers (32%) of the total interviewees started
to use the Barai irrigation waster in the period of 1930-960 (see, Figure 2).
Figure 2: Since when have you access from Barai Irrigation?
In the last three decades, 8 farmers (11%) started to live in the Barai irrigation System.
Most of those farmers who started to live in recent years in the Barai irrigation system
are demobilized soldiers and refugee returnees from Thailand in the early 1990's.
2.3. Possession of Farm Animals
Farm animals are an important of the farming system in most developing countries
including Cambodia.
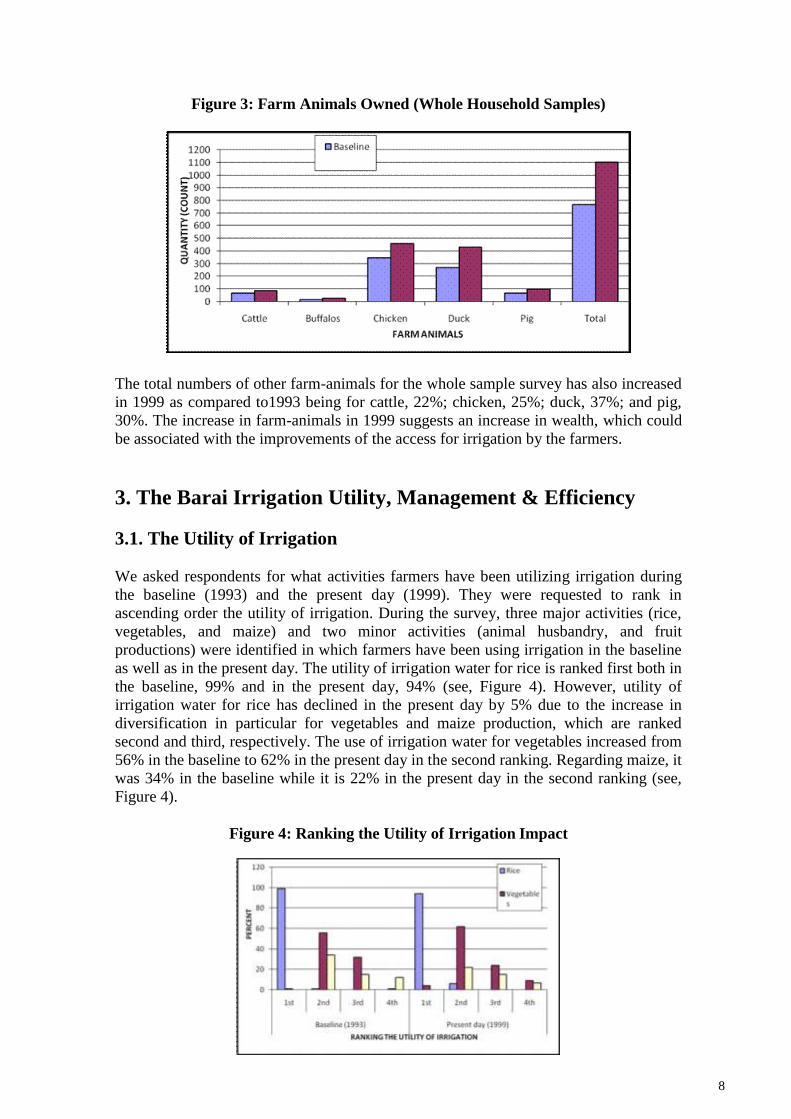
During the survey, respondents were asked to tell us the type and number of animals
they owned in 1993 and 1999. All farmers interviewed owned one of the following five
types of farm animals: cattle, buffalo, chicken, duck, and pig. The aggregate number of
farm animals owned by all farmers interviewed has increased from 768 in 1993 to 1103
in 1999, which is a 30% increase from 1993. There has been significant change for
buffalo from the baseline being 43% increase in 1999. The average farm animal
possessed per farmer household has increased from 11.1 in 1993 to 16 in 1999.
8
Figure 3: Farm Animals Owned (Whole Household Samples)
The total numbers of other farm-animals for the whole sample survey has also increased
in 1999 as compared to1993 being for cattle, 22%; chicken, 25%; duck, 37%; and pig,
30%. The increase in farm-animals in 1999 suggests an increase in wealth, which could
be associated with the improvements of the access for irrigation by the farmers.
3. The Barai Irrigation Utility, Management & Efficiency
3.1. The Utility of Irrigation
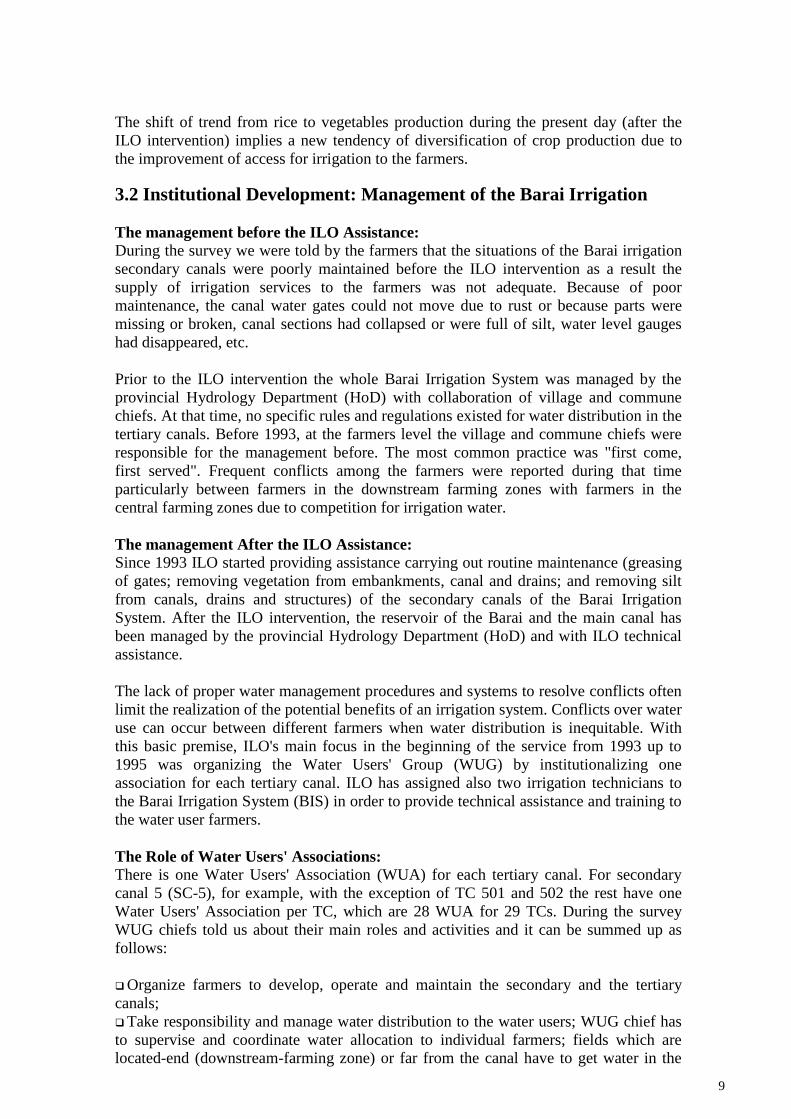
We asked respondents for what activities farmers have been utilizing irrigation during
the baseline (1993) and the present day (1999). They were requested to rank in
ascending order the utility of irrigation. During the survey, three major activities (rice,
vegetables, and maize) and two minor activities (animal husbandry, and fruit
productions) were identified in which farmers have been using irrigation in the baseline
as well as in the present day. The utility of irrigation water for rice is ranked first both in
the baseline, 99% and in the present day, 94% (see, Figure 4). However, utility of
irrigation water for rice has declined in the present day by 5% due to the increase in
diversification in particular for vegetables and maize production, which are ranked
second and third, respectively. The use of irrigation water for vegetables increased from
56% in the baseline to 62% in the present day in the second ranking. Regarding maize, it
was 34% in the baseline while it is 22% in the present day in the second ranking (see,
Figure 4).
Figure 4: Ranking the Utility of Irrigation Impact
9
The shift of trend from rice to vegetables production during the present day (after the
ILO intervention) implies a new tendency of diversification of crop production due to
the improvement of access for irrigation to the farmers.
3.2 Institutional Development: Management of the Barai Irrigation
The management before the ILO Assistance:
During the survey we were told by the farmers that the situations of the Barai irrigation
secondary canals were poorly maintained before the ILO intervention as a result the
supply of irrigation services to the farmers was not adequate. Because of poor
maintenance, the canal water gates could not move due to rust or because parts were
missing or broken, canal sections had collapsed or were full of silt, water level gauges
had disappeared, etc.
Prior to the ILO intervention the whole Barai Irrigation System was managed by the
provincial Hydrology Department (HoD) with collaboration of village and commune
chiefs. At that time, no specific rules and regulations existed for water distribution in the
tertiary canals. Before 1993, at the farmers level the village and commune chiefs were
responsible for the management before. The most common practice was "first come,
first served". Frequent conflicts among the farmers were reported during that time
particularly between farmers in the downstream farming zones with farmers in the
central farming zones due to competition for irrigation water.
The management After the ILO Assistance:
Since 1993 ILO started providing assistance carrying out routine maintenance (greasing
of gates; removing vegetation from embankments, canal and drains; and removing silt
from canals, drains and structures) of the secondary canals of the Barai Irrigation
System. After the ILO intervention, the reservoir of the Barai and the main canal has
been managed by the provincial Hydrology Department (HoD) and with ILO technical
assistance.
The lack of proper water management procedures and systems to resolve conflicts often
limit the realization of the potential benefits of an irrigation system. Conflicts over water
use can occur between different farmers when water distribution is inequitable. With
this basic premise, ILO's main focus in the beginning of the service from 1993 up to
1995 was organizing the Water Users' Group (WUG) by institutionalizing one
association for each tertiary canal. ILO has assigned also two irrigation technicians to
the Barai Irrigation System (BIS) in order to provide technical assistance and training to
the water user farmers.
The Role of Water Users' Associations:
There is one Water Users' Association (WUA) for each tertiary canal. For secondary
canal 5 (SC-5), for example, with the exception of TC 501 and 502 the rest have one
Water Users' Association per TC, which are 28 WUA for 29 TCs. During the survey
WUG chiefs told us about their main roles and activities and it can be summed up as
follows:
Organize farmers to develop, operate and maintain the secondary and the tertiary
canals;
Take responsibility and manage water distribution to the water users; WUG chief has
to supervise and coordinate water allocation to individual farmers; fields which are
located-end (downstream-farming zone) or far from the canal have to get water in the
10
first place while farmers who have land in the head or near the canal (upstream-farming
zone), would receive water afterwards;
Responsible for collecting irrigation fees from its users;5
Delegate the water users to present any issue or problem to concerned body;
Resolve conflicts that are usually arise between different water users;
In general, the WUA chiefs were either village chiefs or commune chiefs. Some of them
still serve as village chief and WUA chief.
Members of WUAs are all beneficiaries who own land or share crop in the command
area of the same irrigation tertiary canal. One individual known as WUA chief
represents the WUA, which means there is no committee that could work as a team.
WUA chief is responsible for the day-to-day management of the tertiary canal for
development and O & M.
The WUAs are responsible for maintaining, rehabilitating and managing of the tertiary
canal. The WUAs are also responsible for settling disputes between the beneficiaries.
When farmers need irrigation water they request the WUG chief to ask the HoD to open
the main gate and get sufficient flow rate for one or two days depending on the actual
irrigation demand of the farmers.
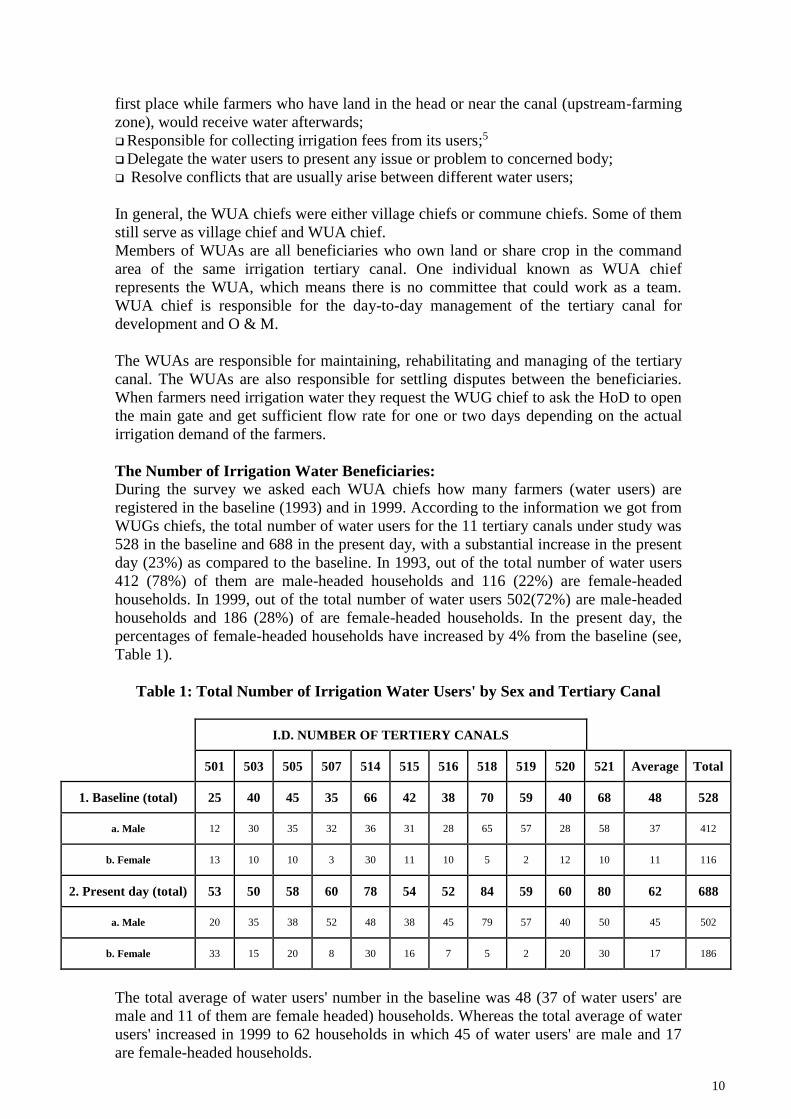
The Number of Irrigation Water Beneficiaries:
During the survey we asked each WUA chiefs how many farmers (water users) are
registered in the baseline (1993) and in 1999. According to the information we got from
WUGs chiefs, the total number of water users for the 11 tertiary canals under study was
528 in the baseline and 688 in the present day, with a substantial increase in the present
day (23%) as compared to the baseline. In 1993, out of the total number of water users
412 (78%) of them are male-headed households and 116 (22%) are female-headed
households. In 1999, out of the total number of water users 502(72%) are male-headed
households and 186 (28%) of are female-headed households. In the present day, the
percentages of female-headed households have increased by 4% from the baseline (see,
Table 1).
Table 1: Total Number of Irrigation Water Users' by Sex and Tertiary Canal
I.D. NUMBER OF TERTIERY CANALS
501 503 505 507 514 515 516 518 519 520 521 Average Total
1. Baseline (total) 25 40 45 35 66 42 38 70 59 40 68 48 528
a. Male 12 30 35 32 36 31 28 65 57 28 58 37 412
b. Female 13 10 10 3 30 11 10 5 2 12 10 11 116
2. Present day (total) 53 50 58 60 78 54 52 84 59 60 80 62 688
a. Male 20 35 38 52 48 38 45 79 57 40 50 45 502
b. Female 33 15 20 8 30 16 7 5 2 20 30 17 186
The total average of water users' number in the baseline was 48 (37 of water users' are
male and 11 of them are female headed) households. Whereas the total average of water
users' increased in 1999 to 62 households in which 45 of water users' are male and 17
are female-headed households.
11
3.3. Impact on the efficiency of irrigation service
The most important service that the irrigation system operators (managers) provide to
farmers is the delivery of irrigation water in an efficient management. Ideal from a
farmer's point of view is freedom in terms of:
Timing
Flow-rate, and
Farmers participation in scheduling (planning)
Duration of irrigation applications.
During the survey, we asked each farmer interviewee whether irrigation supply by the
central management were efficient in relation to: Timing, flow rate, participation in the
planning (scheduling) and duration of irrigation application in the baseline and in the
present day.
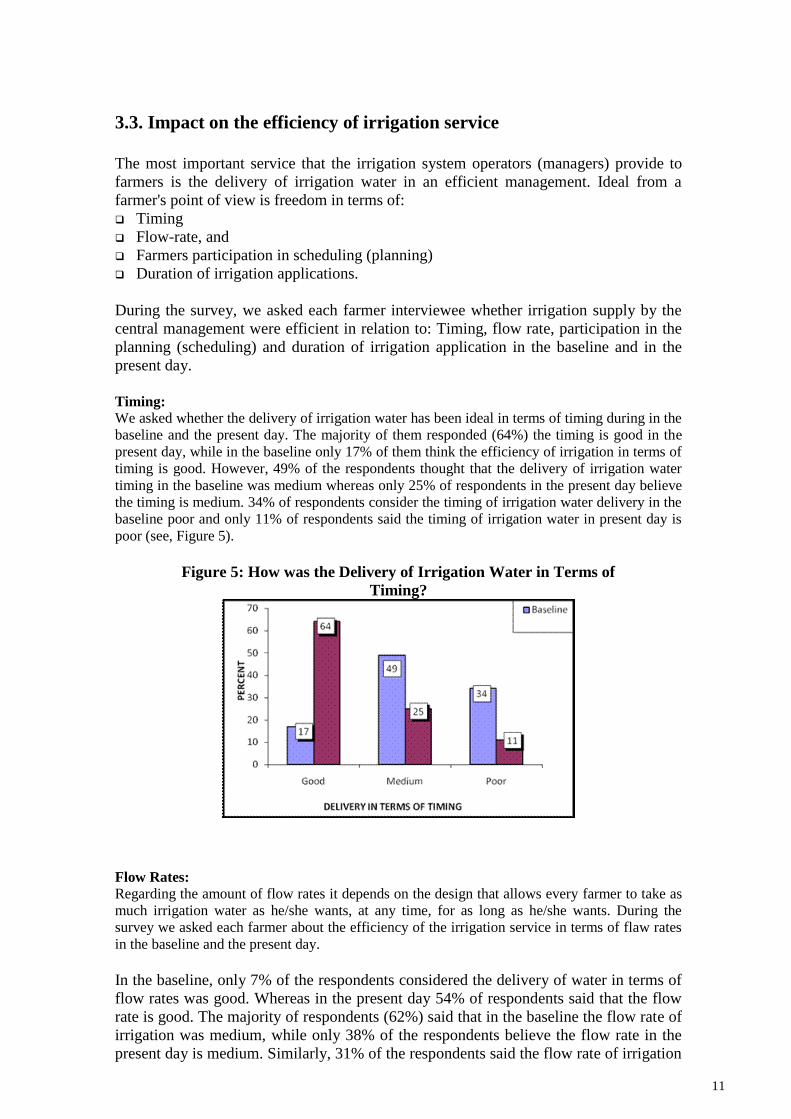
Timing: We asked whether the delivery of irrigation water has been ideal in terms of timing during in the
baseline and the present day. The majority of them responded (64%) the timing is good in the
present day, while in the baseline only 17% of them think the efficiency of irrigation in terms of
timing is good. However, 49% of the respondents thought that the delivery of irrigation water
timing in the baseline was medium whereas only 25% of respondents in the present day believe
the timing is medium. 34% of respondents consider the timing of irrigation water delivery in the
baseline poor and only 11% of respondents said the timing of irrigation water in present day is
poor (see, Figure 5).
Figure 5: How was the Delivery of Irrigation Water in Terms of
Timing?
Flow Rates: Regarding the amount of flow rates it depends on the design that allows every farmer to take as
much irrigation water as he/she wants, at any time, for as long as he/she wants. During the
survey we asked each farmer about the efficiency of the irrigation service in terms of flaw rates
in the baseline and the present day.
In the baseline, only 7% of the respondents considered the delivery of water in terms of
flow rates was good. Whereas in the present day 54% of respondents said that the flow
rate is good. The majority of respondents (62%) said that in the baseline the flow rate of
irrigation was medium, while only 38% of the respondents believe the flow rate in the
present day is medium. Similarly, 31% of the respondents said the flow rate of irrigation
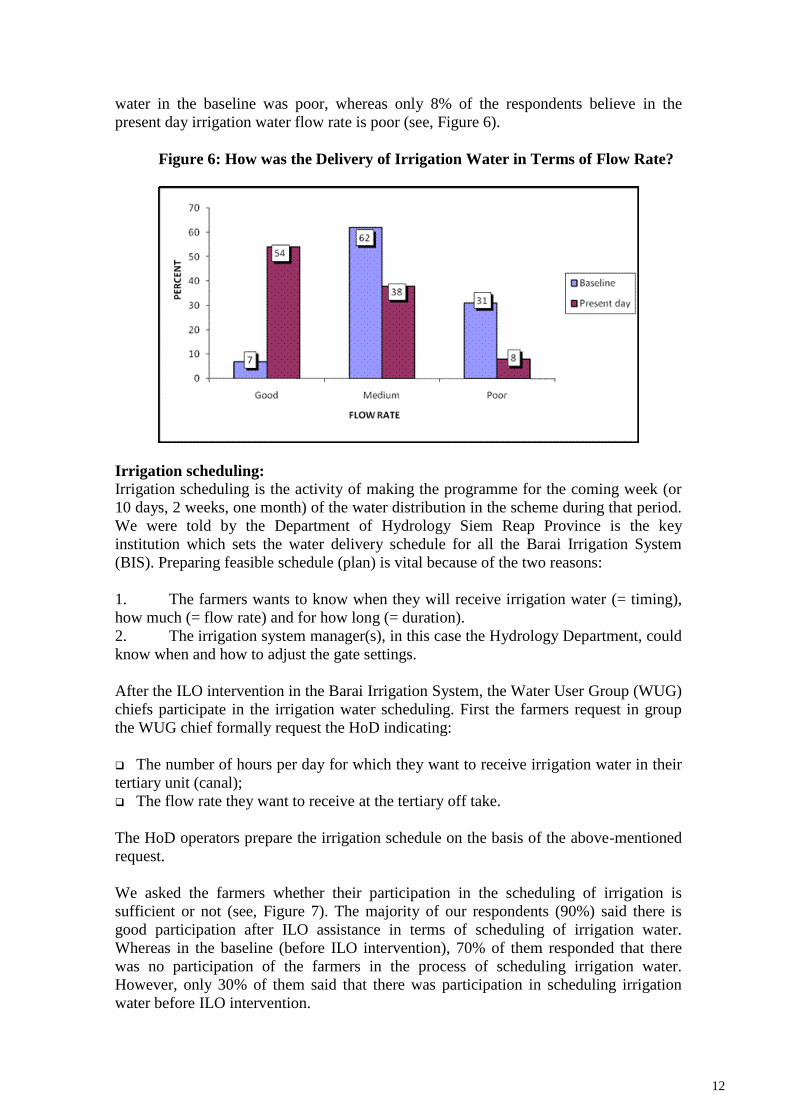
12
water in the baseline was poor, whereas only 8% of the respondents believe in the
present day irrigation water flow rate is poor (see, Figure 6).
Figure 6: How was the Delivery of Irrigation Water in Terms of Flow Rate?
Irrigation scheduling:
Irrigation scheduling is the activity of making the programme for the coming week (or
10 days, 2 weeks, one month) of the water distribution in the scheme during that period.
We were told by the Department of Hydrology Siem Reap Province is the key
institution which sets the water delivery schedule for all the Barai Irrigation System
(BIS). Preparing feasible schedule (plan) is vital because of the two reasons:
1. The farmers wants to know when they will receive irrigation water (= timing),
how much (= flow rate) and for how long (= duration).
2. The irrigation system manager(s), in this case the Hydrology Department, could
know when and how to adjust the gate settings.
After the ILO intervention in the Barai Irrigation System, the Water User Group (WUG)
chiefs participate in the irrigation water scheduling. First the farmers request in group
the WUG chief formally request the HoD indicating:
The number of hours per day for which they want to receive irrigation water in their
tertiary unit (canal);
The flow rate they want to receive at the tertiary off take.
The HoD operators prepare the irrigation schedule on the basis of the above-mentioned
request.
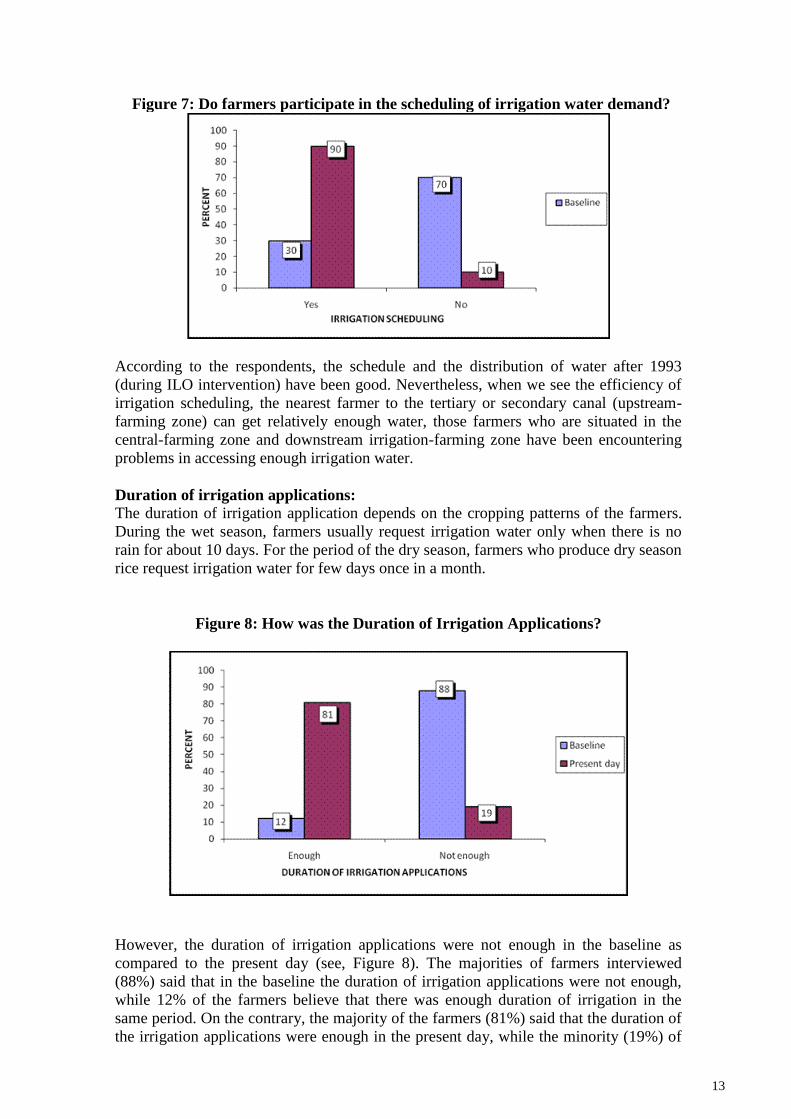
We asked the farmers whether their participation in the scheduling of irrigation is
sufficient or not (see, Figure 7). The majority of our respondents (90%) said there is
good participation after ILO assistance in terms of scheduling of irrigation water.
Whereas in the baseline (before ILO intervention), 70% of them responded that there
was no participation of the farmers in the process of scheduling irrigation water.
However, only 30% of them said that there was participation in scheduling irrigation
water before ILO intervention.
13
Figure 7: Do farmers participate in the scheduling of irrigation water demand?
According to the respondents, the schedule and the distribution of water after 1993
(during ILO intervention) have been good. Nevertheless, when we see the efficiency of
irrigation scheduling, the nearest farmer to the tertiary or secondary canal (upstream-
farming zone) can get relatively enough water, those farmers who are situated in the
central-farming zone and downstream irrigation-farming zone have been encountering
problems in accessing enough irrigation water.
Duration of irrigation applications:
The duration of irrigation application depends on the cropping patterns of the farmers.
During the wet season, farmers usually request irrigation water only when there is no
rain for about 10 days. For the period of the dry season, farmers who produce dry season
rice request irrigation water for few days once in a month.
Figure 8: How was the Duration of Irrigation Applications?
However, the duration of irrigation applications were not enough in the baseline as
compared to the present day (see, Figure 8). The majorities of farmers interviewed
(88%) said that in the baseline the duration of irrigation applications were not enough,
while 12% of the farmers believe that there was enough duration of irrigation in the
same period. On the contrary, the majority of the farmers (81%) said that the duration of
the irrigation applications were enough in the present day, while the minority (19%) of

14
the respondents reported the duration of irrigation application in the present day has
been insufficient.
Some constraints for the efficiency of irrigation service:
Four major problems were mentioned by almost all WUG chiefs regarding the
inefficiency of the irrigation water (poor) flow rate: (1) the low water level; (2) farmers
at the tail end of tertiary canals; (3) farmers at the tail end of the secondary canal and (4)
the informal tertiary canals.
(1) One of the problems reported by the farmer interviewees and the WUGs chiefs
is the low level of irrigation water due to poor maintenance of the canal particularly it
was an important problem before 1993. This low water level issue still exists in some
tertiary canals (TCs). For instance, farmers who have land in the TCs such as 501, 502,
507, and 514 could not get enough water because the flow rate is not good due to the
low level of water and the high level of farm land.
(2) Farmers who have farm at the head of the TC (near the SC-upstream-farming
zone) have clearly more advantage than people living at the middle. Farmers who have
at the tail end (downstream-farming zone) are worst off: they get the least water, and
often have to make use of the most important problems.
(3) The biggest problems occur at the tail end (downstream) part of the secondary
canals. The WUGs chiefs of the tertiary canal 520 and 521 were both complaining that
the water flows first to the territories of the head part (or the TC at the upstream part) of
the secondary canals. However, according to the chiefs of TC 520 and 521, the gates of
the other TCs are often left open during nighttime, which means that very little water is
left for TC 520 and 521. WUG 21 has completely stopped functioning and farmers no
longer request water, because they could not get water even if they ask.
(4) The most important problem regarding the problem in flow rate is the existence
of informal tertiary canals. Farmers who live at the head (upstream-farming zone) of the
TCs make small holes from the secondary canals in order to get water outside the formal
TC.
According to respondent farmers and WUGs chiefs, they make informal TCs for two
reasons: (a) since the level of the water is low they can not get enough water from the
formal TC that is why they have to make a hole by digging at lower level where they
can easily get the water; (b) Since the distance between the two TCs is half kilometer
(500 miters) and farmers who have farmland far from TCs could not get enough water.
So, they have to dig a hole from the secondary canals to get water directly to their farms.
Thus, the informal tertiary canals affects the flow rates of the irrigation water as most of
the water is distributed without the proper canal. In addition, these informal canals
created problems of drainage and water logging.
4. Land Use and Cropping Patterns
In the Barai irrigation command area, all of the land is privately owned. But there is,
however, a wide gap in the land holdings, ranging from half hectare up to eight hectares
for the whole sample survey. Most female-headed households have smaller area of land
and in most cases they live in the middle or in the tail section of the tertiary canal.
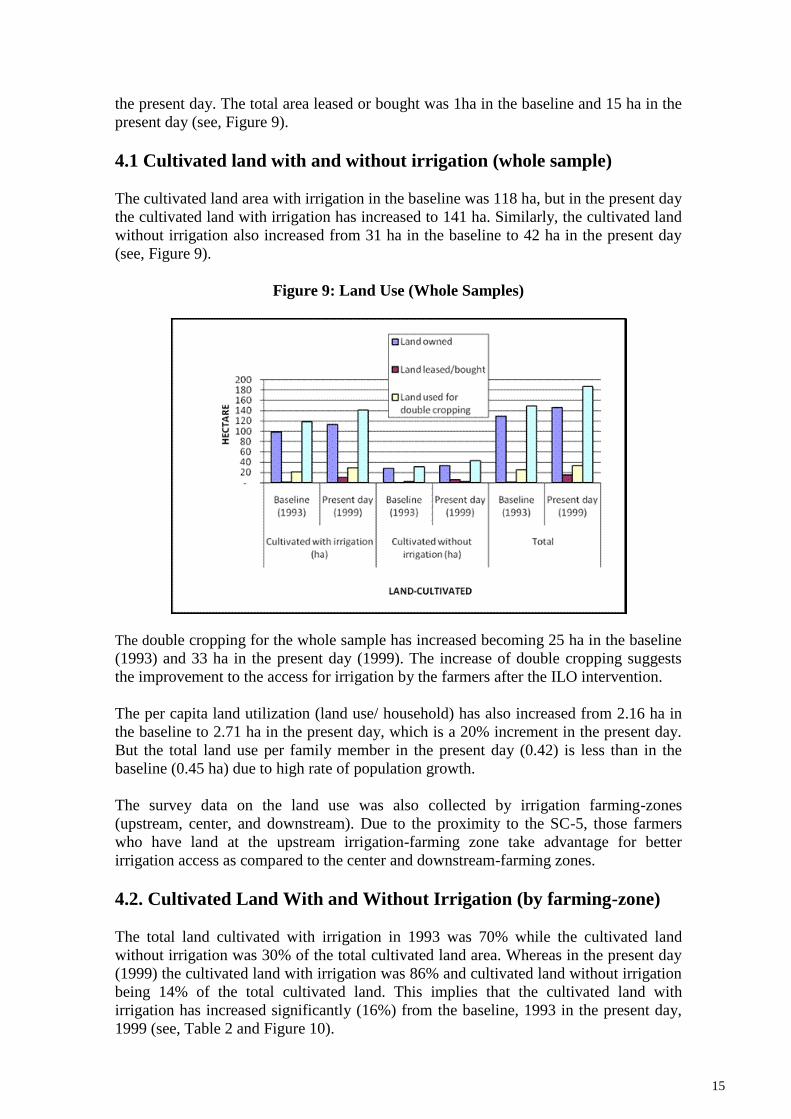
The total land cultivated with and without irrigation has increased from 149 hectares in
the baseline to 187 hectare in the present day. This includes the double cropping and
land leased/ bought. The area of double cropping was 25 ha in the baseline and 33 ha in
15
the present day. The total area leased or bought was 1ha in the baseline and 15 ha in the
present day (see, Figure 9).
4.1 Cultivated land with and without irrigation (whole sample)
The cultivated land area with irrigation in the baseline was 118 ha, but in the present day
the cultivated land with irrigation has increased to 141 ha. Similarly, the cultivated land
without irrigation also increased from 31 ha in the baseline to 42 ha in the present day
(see, Figure 9).
Figure 9: Land Use (Whole Samples)
The double cropping for the whole sample has increased becoming 25 ha in the baseline
(1993) and 33 ha in the present day (1999). The increase of double cropping suggests
the improvement to the access for irrigation by the farmers after the ILO intervention.
The per capita land utilization (land use/ household) has also increased from 2.16 ha in
the baseline to 2.71 ha in the present day, which is a 20% increment in the present day.
But the total land use per family member in the present day (0.42) is less than in the
baseline (0.45 ha) due to high rate of population growth.
The survey data on the land use was also collected by irrigation farming-zones
(upstream, center, and downstream). Due to the proximity to the SC-5, those farmers
who have land at the upstream irrigation-farming zone take advantage for better
irrigation access as compared to the center and downstream-farming zones.
4.2. Cultivated Land With and Without Irrigation (by farming-zone)
The total land cultivated with irrigation in 1993 was 70% while the cultivated land
without irrigation was 30% of the total cultivated land area. Whereas in the present day
(1999) the cultivated land with irrigation was 86% and cultivated land without irrigation
being 14% of the total cultivated land. This implies that the cultivated land with
irrigation has increased significantly (16%) from the baseline, 1993 in the present day,
1999 (see, Table 2 and Figure 10).

16
Table 2: Area of Land Cultivated With and Without Irrigation by
Farming-Zones (%)
Baseline
(1993)
Present day
(1999)
Baseline
(1993)
Present day
(1999)
With irrigation With irrigation Without
irrigation Without
irrigation
Upstream– zone 65 92 35 8
Central – zone 68 83 32 17
Down-stream-
zone 78 82 22 18
Average 70 86 30 14
The land area cultivated land with irrigation in the baseline (1993) for the upstream
irrigation-farming zone was 65% of the total land cultivated, while the cultivated land
without irrigation was 35% of the total land cultivated in this zone. Whereas land area
cultivated with irrigation in the present day (1999) for upstream-farming zone was 92%
and the land cultivated without irrigation was only 14% of the total cultivated land in
this upstream zone.
Figure 10: Cultivated Land With and Without Irrigation (by Farming-zone)
In the case of central irrigation-farming zone, during the baseline the cultivated land
with irrigation were 68% and the land cultivated without irrigation was 32% of the total
area of land cultivated. During the present day (1999) the cultivated land with irrigation
for central farming zone was 83% and cultivated land without irrigation was 17% of the
total cultivated land in the central zone.
The cultivated land with irrigation for downstream farming zone was 78% and
cultivated land without irrigation being 22% of the total cultivated land of the farming
zone. Whereas the cultivated land with irrigation in 1999 for the down-stream zone was
82% and cultivated land without irrigation being 18% of the aggregate cultivated land of
the downstream-farming zone.
One important development was that during the baseline the total cultivated land with
irrigation for the downstream-farming zone was higher (78%) than the central and
upstream farming zone, being 68% and 65% of the total cultivated land of its own zone,
17
respectively. However, in 1999 the upstream farming zone's cultivated land with
irrigation has increased substantially as compared to the other zones. According WUG
chief this development occurred because after 1993 the water flow has been improved
and the upstream farming zones take advantage of this while the central and downstream
farming zones receive inadequate irrigation water their far proximity from the TCs.
4.3. Cropping Patterns
The key determinants of cropping patters under irrigated conditions are water
availability, land suitability and the farmers' willingness to adopt alternative cropping
patterns, which is determined in part by profitability considerations. These suitable
physical and market conditions leads to diversification into non-rice crops.
Rice cultivation is the most important agricultural practice carried out in the Barai
irrigation area. Recently, vegetables (lettuce, cabbage, cauliflower, tomato, eggplant,
etc) are widely grown using irrigation water. Other cropping practices on much reduced
scale to that of rice and vegetables includes, fruits (coconut, papaya, watermelon,
pineapples, etc), maize and sugarcane.
Data collected during the course of the survey provides the baseline and the present day
cropping patterns (see, Table 4) for the whole sample survey. During the baseline and
present day the main crops and area of land cultivated in the area under study, excluding
vegetables were: Wet season rice: 68 ha in the baseline and 76 ha in the present day; dry
season rice: 45 ha in the baseline and 58 ha in the present day; beans: 1.31 ha in the
baseline and 1.28 ha in the present day; maize: 6 ha in the baseline and 6.5 ha in the
present day and sugarcane: 2 ha in the baseline and 1.66 ha in the present day. The total
area cultivated for those main crops being 122 ha in the baseline and 143 ha in the
present day, which is 15% increase from the baseline.
There is a considerable increase in cultivated land for wet season rice land and dry
season rice land for production year, 1999 as it is compared with the baseline production
year, 1993 being 11% increase for wet season rice land and 23% increase for dry season
rice land. The increment in the cultivation of dry season rice land in the present day as
compared to the baseline implies the improvement for the access of irrigation water after
the ILO intervention.
In the case of other crops: bean, maize and sugarcane there is no significant change in
terms of cropping pattern between the baseline and the present day. In the case of bean
and sugarcane we see even a decreasing pattern in the cultivated land in the present day
as compared to the baseline. This is because of increased popularity of vegetable
production after the ILO intervention due to improvement to the access of irrigation
water and the increasing need of farmers using vegetables as a means of cash income.
Cropping Pattern by Irrigation-Farming Zone: In the three farming zones: upstream, central and downstream-cultivated land has
increased in aggregate terms. But the cultivated land for maize, beans and sugarcanes
did not increase, because vegetables and other high value production are substituting
them.
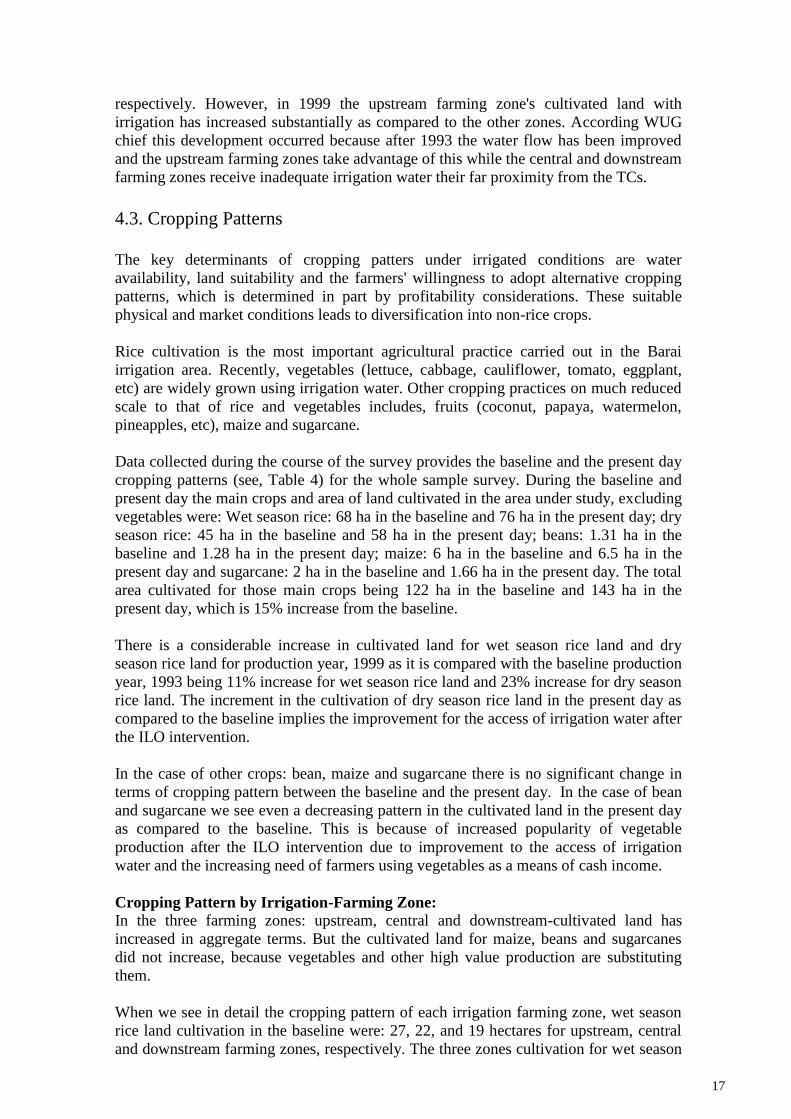
When we see in detail the cropping pattern of each irrigation farming zone, wet season
rice land cultivation in the baseline were: 27, 22, and 19 hectares for upstream, central
and downstream farming zones, respectively. The three zones cultivation for wet season
18
rice in the present day were recorded: 30, 25, and 20 hectares, respectively (see, Figure
11).
Figure 11: Cropping Patterns by Farming Zone
On the other hand, the cropping pattern for dry season rice land has increased much
more than the wet season rice cultivation particularly for upstream and down stream
farming zones. The recorded cultivation of dry season rice in the baseline (1993) was 12
ha for upstream zone, 17 ha for central zone and 16 ha for downstream zone; and the
cultivated land for dry season rice land during the present day (1999) was: 19, 16, 22
hectares, respectively. For the central farming zone the cultivation for dry season rice
land has decreased by one hectare.
The land that has been used for baseline and present day for maize, beans and
sugarcanes are also utilized for cultivating vegetables and other high value cash crops
through double cropping. Since this cropping trend is increasing with the improvement
of the irrigation service, the cultivated land of maize, beans and sugarcanes are either
constant or it has decreased over time.
5. Crop Productions, Yield, Consumption and Surplus/deficit Irrigation development, rehabilitation and maintenance programs are primarily
concerned with the improvement of food production to meet the demand of an
increasing population. Higher food production may result from various factors: an
expansion in the area planted to a food crop; an intensification of use of currently
cultivated area, and an increase in the productivity of the land. Irrigation development,
rehabilitation and maintenance provide critical support both for effectively increasing
food crop area and for creating an environment wherein yield-enhancing technologies
can be utilized profitably.
In this section we will see how food production, yield, consumption and surplus were
improved after the ILO assistance by comparing the situation of the baseline (1993) and
present day (1999) for the whole samples and by irrigation farming zone.
19
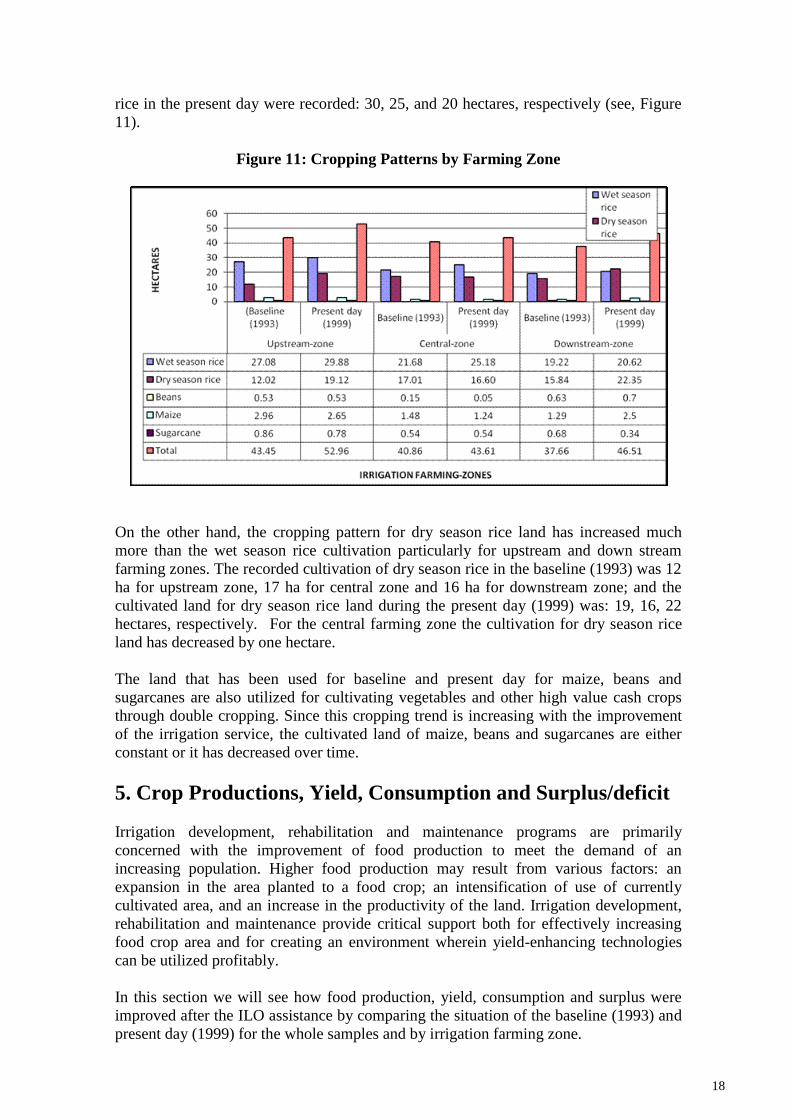
5.2. Cultivated Land, Crop production and Yield
The cultivated land prior the ILO assistance, the total cultivated land for the whole
sample was 122 ha (wet season rice 68 ha; dry season rice 45 ha; Soya beans 1 ha;
maize 6 ha and sugarcane 2ha). But after 6 years of ILO assistance, the cultivated land
in the present day (1999) has increased to 143 ha (wet season rice 76 ha; dry season rice
58 ha; Soya beans 1 ha; maize 6 ha, and sugarcane 2 ha). The total land cultivated in
1999 has increased by 15% from the total cultivated land of 1993. The percentage
change of cultivated land in 1999 from 1993 was recorded as follows: wet season rice
10%; dry season rice 23%; Soya beans 0%; sugarcane –25% and maize 10%.
Table 3: Cultivated Land, Production and Yield (1993 and 1999)
Type of
crops
Cultivated land (ha) Productions (Kg) Yields (ha)
1993
1999
%age chan
ge
1993
1999
%age
chang
e 1993 1999
%age
chang
e Wet season rice 67.98 75.68 10 66,883 73,018 8 984 965 -2
Dry season rice 44.87 58.07 23 71,048 95,874 26 1,583 1,651 4
Soya beans 1.31 1.28 0 1,185 1,560 24 905 1,219 26
Maize 5.73 6.39 10 16,279 23,027 29 2,841 3,604 21
Sugarcane 2.08 1.66 -25 20,370 22,760 11 9,793 13,711 29
Total 121.97 143.08 15 175,765 216,239 19 1,441 1,511 5
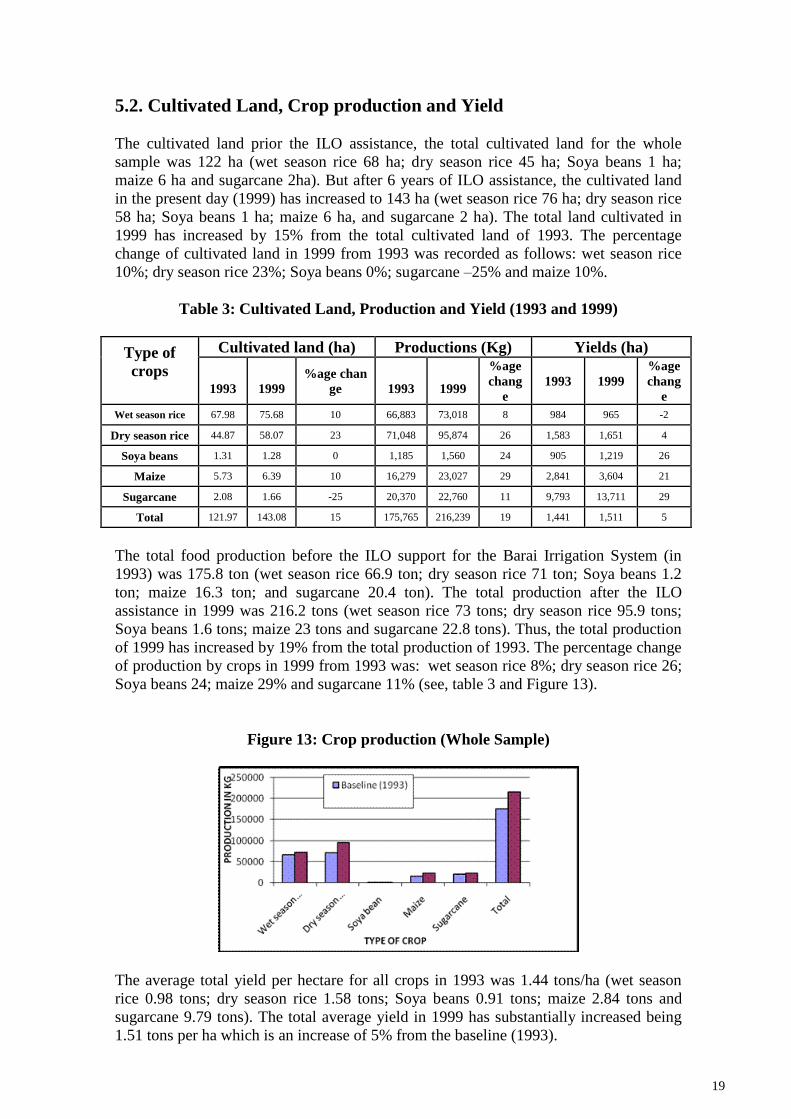
The total food production before the ILO support for the Barai Irrigation System (in
1993) was 175.8 ton (wet season rice 66.9 ton; dry season rice 71 ton; Soya beans 1.2
ton; maize 16.3 ton; and sugarcane 20.4 ton). The total production after the ILO
assistance in 1999 was 216.2 tons (wet season rice 73 tons; dry season rice 95.9 tons;
Soya beans 1.6 tons; maize 23 tons and sugarcane 22.8 tons). Thus, the total production
of 1999 has increased by 19% from the total production of 1993. The percentage change
of production by crops in 1999 from 1993 was: wet season rice 8%; dry season rice 26;
Soya beans 24; maize 29% and sugarcane 11% (see, table 3 and Figure 13).
Figure 13: Crop production (Whole Sample)
The average total yield per hectare for all crops in 1993 was 1.44 tons/ha (wet season
rice 0.98 tons; dry season rice 1.58 tons; Soya beans 0.91 tons; maize 2.84 tons and
sugarcane 9.79 tons). The total average yield in 1999 has substantially increased being
1.51 tons per ha which is an increase of 5% from the baseline (1993).
20
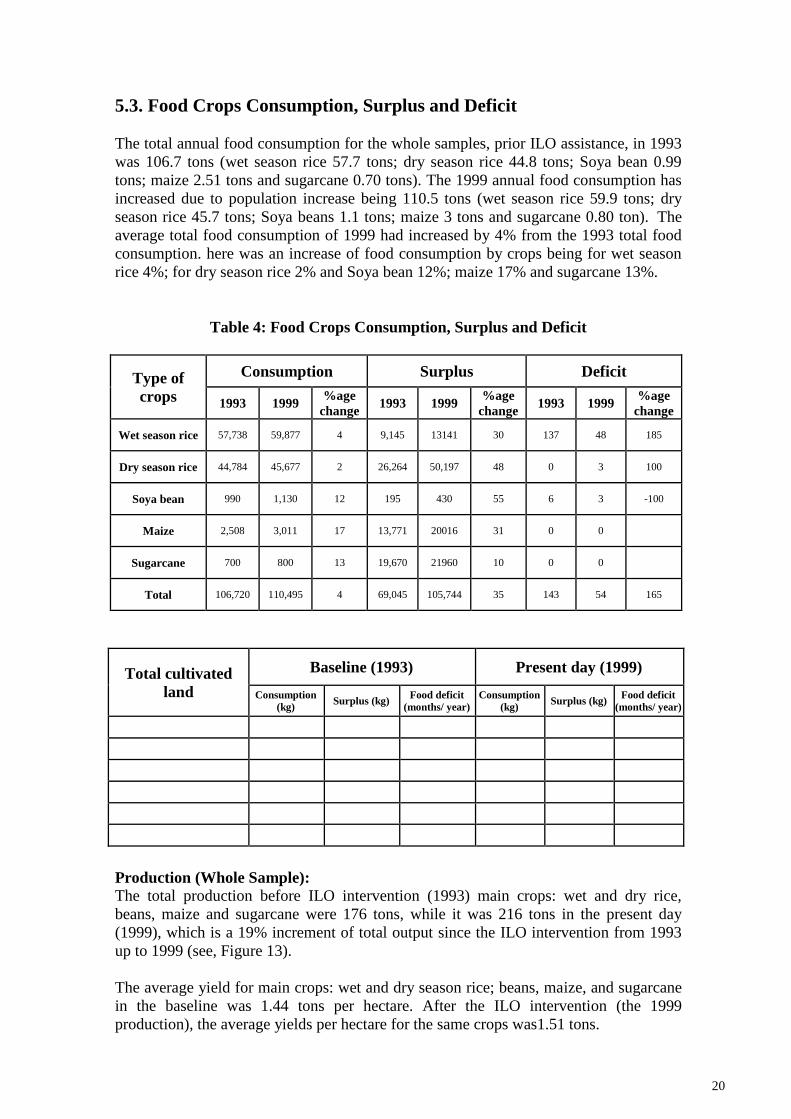
5.3. Food Crops Consumption, Surplus and Deficit
The total annual food consumption for the whole samples, prior ILO assistance, in 1993
was 106.7 tons (wet season rice 57.7 tons; dry season rice 44.8 tons; Soya bean 0.99
tons; maize 2.51 tons and sugarcane 0.70 tons). The 1999 annual food consumption has
increased due to population increase being 110.5 tons (wet season rice 59.9 tons; dry
season rice 45.7 tons; Soya beans 1.1 tons; maize 3 tons and sugarcane 0.80 ton). The
average total food consumption of 1999 had increased by 4% from the 1993 total food
consumption. here was an increase of food consumption by crops being for wet season
rice 4%; for dry season rice 2% and Soya bean 12%; maize 17% and sugarcane 13%.
Table 4: Food Crops Consumption, Surplus and Deficit
Type of
crops
Consumption Surplus Deficit
1993 1999 %age
change 1993 1999
%age
change 1993 1999
%age
change
Wet season rice 57,738 59,877 4 9,145 13141 30 137 48 185
Dry season rice 44,784 45,677 2 26,264 50,197 48 0 3 100
Soya bean 990 1,130 12 195 430 55 6 3 -100
Maize 2,508 3,011 17 13,771 20016 31 0 0
Sugarcane 700 800 13 19,670 21960 10 0 0
Total 106,720 110,495 4 69,045 105,744 35 143 54 165
Total cultivated
land
Baseline (1993) Present day (1999)
Consumption
(kg) Surplus (kg) Food deficit
(months/ year) Consumption
(kg) Surplus (kg) Food deficit
(months/ year)
Production (Whole Sample): The total production before ILO intervention (1993) main crops: wet and dry rice,
beans, maize and sugarcane were 176 tons, while it was 216 tons in the present day
(1999), which is a 19% increment of total output since the ILO intervention from 1993
up to 1999 (see, Figure 13).
The average yield for main crops: wet and dry season rice; beans, maize, and sugarcane
in the baseline was 1.44 tons per hectare. After the ILO intervention (the 1999
production), the average yields per hectare for the same crops was1.51 tons.
21
The yield by crop type is presented as follows: wet season rice, 0.98 ton/ha in the
baseline (1993) and 0.97 tons/ha in the present day; dry season rice, 1.6 tons/ha in the
baseline (1993) and 1.7 ton/ha in the present day; beans, 0.91 ton/ha in the baseline
(1993) and 1.2 ton/ha in the present day (1999); maize, 2.8 ton/ha in the baseline (1993)
and 3.6 ton/ha in the present day (1999) and Sugarcane, 9.8 ton/ha in the baseline and
13.7 ton/ha in the present day (1999). All of the crops have increased in absolute terms
and in productivity except for the wet season rice (see, Table 2).
The reason for the decrease for wet season rice yield/ha is because of the quality of the
soil becoming poor quality over time. Due to the high opportunity cost of applying
fertilizer for the wet season rice field, all farmers do not use fertilizer and as a result the
yield of the wet season rice production ultimately has declined.
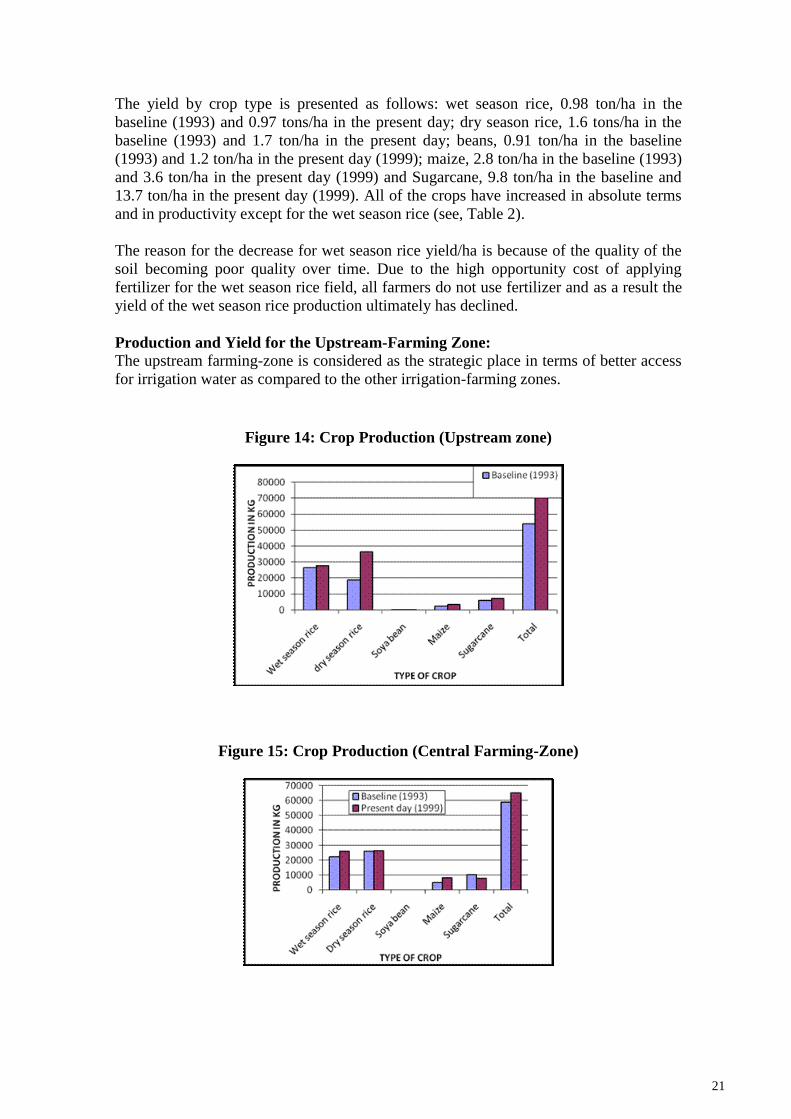
Production and Yield for the Upstream-Farming Zone: The upstream farming-zone is considered as the strategic place in terms of better access
for irrigation water as compared to the other irrigation-farming zones.
Figure 14: Crop Production (Upstream zone)
Figure 15: Crop Production (Central Farming-Zone)

22
Figure 16: Crop Production (Downstream Farming-Zone)
6. Socio-Economic Patterns: Impact on Employment
Opportunity, Expenditure and Income
According the CDRI's recent study, the active labour force in 1996 was estimated at 4.5
million people, of which 75% worked in agriculture (including farming, fishing and
forestry), 20.5% in services (trade, transport, hotels, public administration, etc) and
4.5% in industry.6
The Barai Irrigation System economic pattern cannot be different from the Cambodia's
agricultural economy in which it remains a subsistence economy. However, while rice
production predominates farmers are engaged in a range of both non-cash and cash
income-generating activities, particularly after the harvest of the wet season crop, i.e.
during the dry season.
6.1. Employment Opportunity
During both in the baseline (1993) and in the present day (1999), the most important
farm activities in the SC-5 area are rice production. In the present day (1999), most
farmers are busy with their own farm activities more than doing out side their farm
activity, in which the improvement of irrigation service have played an important role
for a better access for irrigation and increase the double cropping to some extent .7
The farmers in the command area of the Barai Irrigation System have two major types
of activities:
On-farm and off-farm activities, and the list include:
1. On-farm activities
Rice cultivation;
Livestock and animal husbandry;
Cultivation of cash crops such as Soya bean, sugarcanes, watermelon, etc.
Cultivation of vegetables
23
1. Off-farm activities
Fishing;
Small business;
Wage worker;
a. Construction worker
b. Service sector
c. Manual labour
This list is not at all exhaustive and is just an illustration of the wide array of activities
in which a household in the Barai Irrigation System might be engaged during the dry
season and wet season. Most of the on-farm activities are wet season activities while
most of the off-farm activities are a dry season activities. If there is no any opportunities
are available in the Barai areas, farmers temporarily migrate to Siem Reap to find
unskilled labour jobs. One important trend we observed during the survey is that unlike
the baseline in 1999 the off-farm activities are decreasing over time due to the farmers'
engagement on their own farm activities, which reduced their off-farm activities.
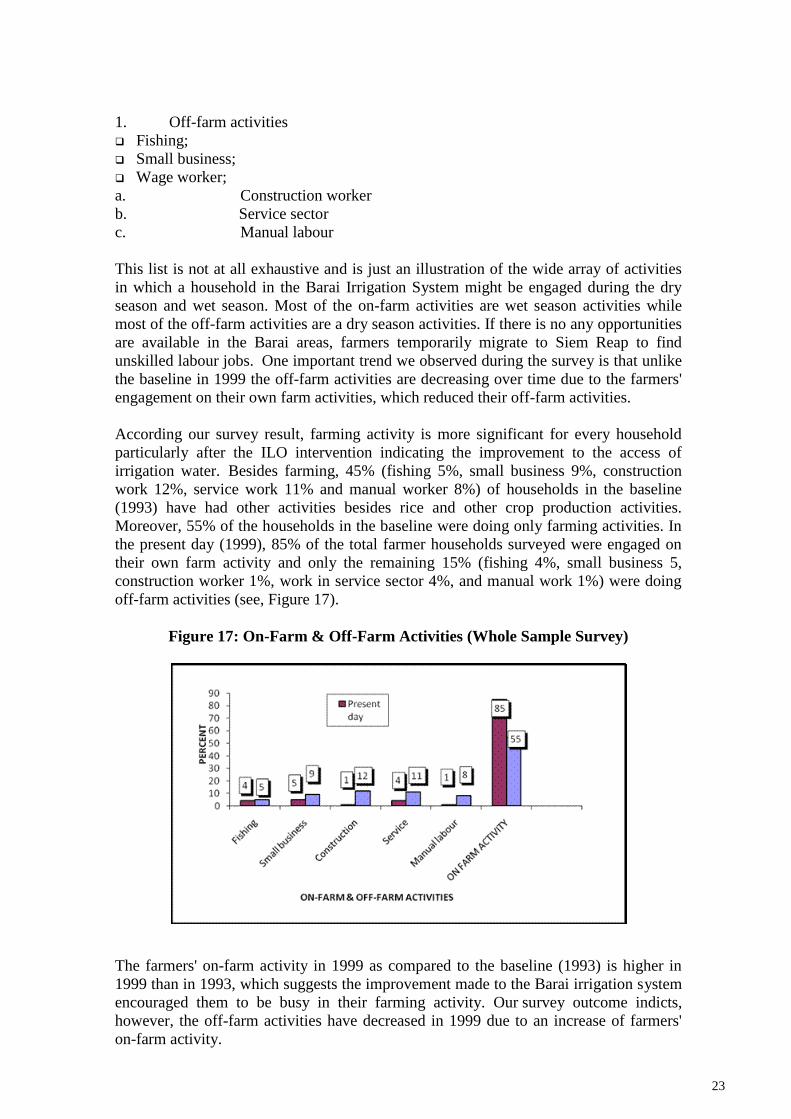
According our survey result, farming activity is more significant for every household
particularly after the ILO intervention indicating the improvement to the access of
irrigation water. Besides farming, 45% (fishing 5%, small business 9%, construction
work 12%, service work 11% and manual worker 8%) of households in the baseline
(1993) have had other activities besides rice and other crop production activities.
Moreover, 55% of the households in the baseline were doing only farming activities. In
the present day (1999), 85% of the total farmer households surveyed were engaged on
their own farm activity and only the remaining 15% (fishing 4%, small business 5,
construction worker 1%, work in service sector 4%, and manual work 1%) were doing
off-farm activities (see, Figure 17).
Figure 17: On-Farm & Off-Farm Activities (Whole Sample Survey)
The farmers' on-farm activity in 1999 as compared to the baseline (1993) is higher in
1999 than in 1993, which suggests the improvement made to the Barai irrigation system
encouraged them to be busy in their farming activity. Our survey outcome indicts,
however, the off-farm activities have decreased in 1999 due to an increase of farmers'
on-farm activity.

24
The short-term off-farm activities are diverse but three major patterns were apparent
during the survey:
Cultivation of vegetables has increased in the present day, which has substituted off-
farm activities.
Throughout the year, whenever paddy field work is over, fishing and producing
household equipments for sale as means of small cash income generation has been very
popular during the baseline. However, the off-farm activities have been reduced during
the present day since many farmers are busy with their farm activity.
Work migration of the adult male and female household member to Seam Riep for
short-periods (2-3 months) as construction workers, hotel receptionist, motorcycle
drivers and more generally as unskilled labour. Even though those activities still exist,
compared to the baseline the off-farm activities are increasingly becoming less
significant in 1999.
The research teams observed that a few poor families with limited land area could get on-farm
employment as hired labour in the present day more than in the baseline, which implies the
increase in the employment opportunity of the poor farmers after the ILO assistance to the Barai
Irrigation System. However, disabled households and female-headed families could not earn
income from off-farm activity, because labour is scarce and they can only do on-farm activity.
6.2. Income Trend of the Farmers (1993 and 1999)
During the survey each interviewee was asked to rank their annual income of 1993 and
1999 by recollection approach in order to look into whether the farmers' income trends
has changed or not. We asked respondents to rank all incomes (cash and non-cash)
including rice and other crops production. The list of income items to be ranked by each
respondent is 17, but we present in this discussion only five major incomes (i.e., rice,
pig &animals, vegetables, small business and off-farm employment) can be shown (in
Figure 18), while all the rest are summed up and ranked them as others.
Figure 18: Income Trends
The income trend in the first ranking
Rice Pig & animals Vegetables Small business Off-farm
employment Others
1st
Ranking 2nd
Ranking 1st
Ranking 2nd
Ranking 1st
Ranking 2nd
Ranking 1st
Ranking 2nd
Ranking 1st
Ranking 2nd
Ranking 1st
Ranking 2nd
Ranking
Baseline 67 24 4 23 6 14 4 6 8 10 11 23
Present day
52 26 16 12 4 24 9 10 10 5 9 23
25
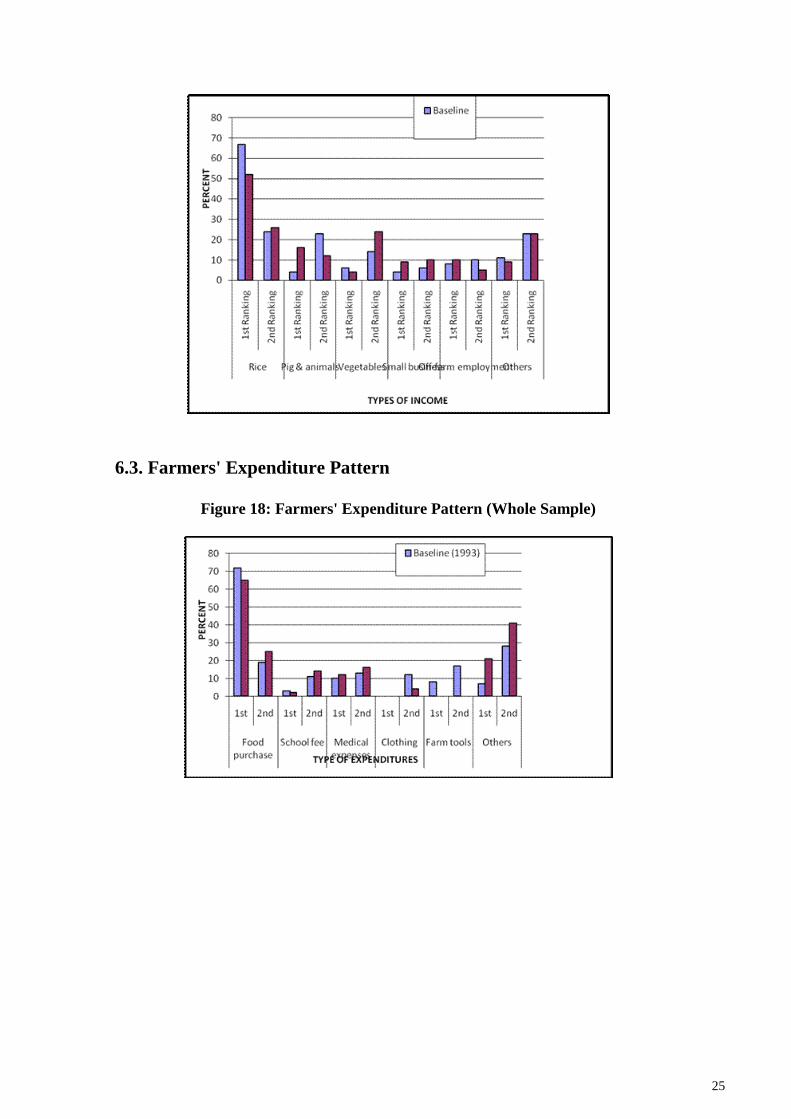
6.3. Farmers' Expenditure Pattern
Figure 18: Farmers' Expenditure Pattern (Whole Sample)

26
REFERENCES
Asian Development Bank, 2000, Memorandum of Understanding Between the Royal
Government of Cambodia and Asian Development Bank for the Stung Chint Irrigation
and Rural Infrastructure Project, 18 May 2000.
Bottrall Anthony, 1985, Managing Large Irrigation Schemes: a Problem of Political
Economy, Agricultural Administration Unit Occasional Paper 5, Overseas Development
Institute (ODI), 1985.
FAO, 1993, Integrated Rural Water Management, Proceedings of the Technical
Consultation on Integrated Rural Water Management, 15-19 March 1993, Rome.
FAO, 1995, Irrigation Management Transfer in Asia, Papers from the Expert
Consultation on Irrigation Management Transfer in Asia, Bangkok and Chiang Mai,
RAP Publication, 25-29 September 1995.
FAO, 1996, Irrigation Scheme Operation and Maintenance, By Bart Snellen,
International Institute for Land Reclamation and Improvement, Irrigation Water
Management Training Manual No. 10, Rome, 1996.
FAO, 1996, Guidelines for Planning Irrigation and Drainage Investment Projects, FAO
Investment Center Technical Paper 11.
FAO, 2000, Participatory Evaluation of the First Phase of the Special Programme for
Food Security in Cambodia, Prepared by the National Team of the Special Programme
for Food Security, Phnom Penh, May 2000.
FAO, 2000, Impact Assessment Analysis of the Special Programme for Food Security
in Cambodia, A Comparison between 1997 and 1998, Prepared by the National Team of
the Special Programme for Food Security, Phnom Penh, May 2000.
ILO, Project Evaluation: Pemba Small Scale Irrigation Project, Draft Main Report, and
September 1993.
ILO, 1996, Irrigation an Entry Point for Poverty Alleviation and Mountain
Development? Experiences of Dhaulagiri Irrigation Development Project Perspectives
and Debate on Future Strategies, Proceedings of Seminar held in Kathmandu, Nepal 6
August, 1996.
ILO, 1994, Rapid Appraisal of Six Rice Production Areas, (Bovel, Battambang and
Barai, Siem Reap), ILO Project CMB/92/008, Phnom Penh, Cambodia, January 1994.
ILO, 1998, ILO CMB/95/011, Labour Based Rural Infrastructure Rehabilitation and
Maintenance Project, Barai Irrigation System Canal Inventory, Siem Reap Province,
1998.
ILO, 1991, The Impact of SPWP Nepal: The Cases of Kalyan Majuwa and Goyang
Shantipur – Two Terrace Irrigation Projects, ILO•fs Special Public Works Programme,
Nepal, Kathmandu 1991.
Mekong Secretariat, 1994, Irrigation Rehabilitation Study in Cambodia, Final Report,
June 1994.
27
Murshid, K.A.S., 1998, Food Security in an Asian Transitional Economy: The
Cambodian Expenditure, Working Paper 6, Cambodia development Resource Institute,
Phnom Penh, December 1998
T. Oberthor, P.F. White, & R.T. Reyes, 1996, CARDI, Major Soils of the Rice –
Growing Areas.
Zweers, G., and Kassie, 2000, Employment in ILO supported Road Construction and
maintenance: The Impact of Wage Earning on Workers, Center for Advanced study, August
2000.
1 ILO, Barai Irrigation System Socio-Economic Studies, unpublished monograph.
[1] These are described in the soil manual named the 'Soils Used For Rice Production in Cambodia' (White et al 1997).
3 See for example, T. Oberthor, P.F. White, & R.T. Reyes; CARDI, Major Soils of the Rice – Growing Areas, 1996. 4 See Zweers, G., and Kassie, Employment in ILO supported Road Construction and maintenance: The Impact of Wage
Earning on Workers, Center for Advanced study, August 2000. 5 Each water user has to pay 30 Kg of rice or 15,000 Riel per year as an irrigation water charge. In the early 1990s farmers
were paying their water charge in kind (30 Kg rice), but due to logistical and management problem they are asked to pay in
Riel. 6 See, Murshid, K.A.S., 1998, Food Security in an Asian Transitional Economy: The Cambodian Expenditure, Working
Paper 6, Cambodia development Resource Institute, Phnom Penh, December 1998, P. 2.
7 The availability of irrigation encourages farmers to spend more labour in the production of rice, vegetable, other crops
and livestock. Double cropping, for instance, increase on-farm activities. In general, a successful irrigation project
generates a higher demand for on-farm labour, which is likely to be met with an increased demand for hired labour.