study on a stepped eco-filter for treating ... - core.ac.uk · 3 college of environmental science...
TRANSCRIPT

ORIGINAL ARTICLE
Study on a stepped eco-filter for treating greywater from singlefarm household
Jianjun Chen1 • Zaiyi Liao1 • Shaoyong Lu2 • Guangcai Hu1 • Yaoxin Liu3 •
Cilai Tang1
Received: 4 November 2016 / Accepted: 23 January 2017
� The Author(s) 2017. This article is published with open access at Springerlink.com
Abstract A stepped eco-filter based greywater treating
facility was built on-site in a typical farm house of China.
This study was aimed to investigate the hydraulic loading
rate (HLR) for the optimal removal efficiency and to ana-
lyze the processing performance throughout an entire year.
The results showed that, the average value of TP from the
influent was much lower while the linear alkylbenzene
sulfonate was a little higher compared with other related
studies. The removal rates of the indexes were all showed a
distinct decline and dropped to a low level while the HLR
was raised from 0.2 m3/(m2 day) to 0.4 m3/(m2 day).
Therefore, the optimal HLR of the process ought to be in
the range of 0.2–0.4 m3/(m2 day). The average system
removal rates in summer were all higher than that in
winter, but the facility still performed well in winter.
Clogging has never occurred in the facility during the
operation over an entire year. Together with the good
performance, advantaged of lower cost and easier mainte-
nance, this process has shown good applicability for
greywater treatment in rural area.
Keywords Greywater � Eco-filter � Farm household �Hydraulic loading rate � Linear alkylbenzene sulfonate
Introduction
Pollutions resulting from the domestic liquid waste have
largely increased in current China due to the intensified use
of chemical products driven by the rapid economic devel-
opment. The large amount of untreated domestic sewage
caused serious degradation of the natural water quality and
led to serious environmental damage (Wang et al. 2011);
thus, it is urgent to develop suitable technologies for
treating domestic wastewater in China’s rural regions. The
rural domestic sewages can be segregated into greywater
(GW) and black-water (BW), the GW is generated from
washing basin, bathroom, kitchen, laundry and black-water
is mainly from toilet and farm life stock (Halalsheh et al.
2008). Our previous field survey showed that BW gener-
ated from the most peasant households has been already
collected by septic tanks and reused for fertilization in the
region, but the GW was normally discharged directly into
the drainage ditch and then flowed into the streams.
Therefore, this study is aimed to investigate the process for
the treatment of rural GW and to build a practical system
on-site.
In comparison with the traditional centralized urban
wastewater treatment, the decentralized process is likely to
be low in both operating and initial cost because no large
sewage pipe system is needed. Currently, the decentralized
techniques adopted for GW treatment can be categorized
into three groups: physical, chemical, and biological sys-
tems. Physical methods include sand and membrane fil-
tration, and the chemical methods include coagulation and
ion exchange (Marc et al. 2007; Huelgas and Funamizu
2009). The biological system mainly include membrane
bioreactors (MBR), anaerobic sludge blanket (UASB),
constructed wetland (CW), and vermifiltration (VF) (Li
et al. 2009; Wang et al. 2010). When treating the GW from
& Jianjun Chen
1 College of Hydraulic and Environment Engineering, China
Three Gorges University, Yichang 443002, China
2 State Key Laboratory of Environmental Criteria and Risk
Assessment, Chinese Research Academy of Environmental
Sciences, Beijing 100012, China
3 College of Environmental Science and Engineering, Fujian
Key Laboratory of Pollution Control and Resource Reuse,
Fujian Normal University, Fuzhou 350007, Fujian, China
123
Appl Water Sci
DOI 10.1007/s13201-017-0536-2

households, more and more studies focus on the bio-eco-
logical technology due to the potentially low cost, high
efficiency and easy maintenance desired by potential users.
A recycled vertical flow constructed wetland showed an
overall removal rate of 81% for COD and 70% for TN and
TP, and the treated GW sufficiently to meet current stan-
dards for unlimited irrigation except for the complete
removal of Fecal coliforms (Gross et al. 2007). An com-
parative study showed that shallow beds led to higher
BOD5 and COD removals, wherever the presence of plants
in the vertical flow constructed wetland (VFCW) caused
higher removal rate of the linear alkylbenzene sulfonate
(LAS) (Kadewa et al. 2010). A low cost and simple slanted
soil system has been reported to perform high removal rate
in both PCOD (94–97%) and BDOC (88–89%), whilst the
LAS removal rates were more than 90% and final con-
centrations (2.3–3.3 mg/L) were sufficiently lower than the
level for irrigation use (Ushijima et al. 2013). Adugna et al.
(2014) reported that the vermifilter was better than the filter
without earthworms in removing BOD5, COD, TSS and
coliforms, and higher removal rates were achieved with the
HLR of 0.064 m3/(m2 day) compare to 0.19 m3/(m2 day)
in all parameters.
In recent years, more and more research focus on the
characteristics of domestic GW and the GW treatment
process (Ghaitidak and Yadav 2013; Jabornig 2014; Edwin
et al. 2014). However, many of the stimulated tests were
carried out in the lab for a relatively short period of time.
The correlative changes between the pollutants removal
efficiency and the process parameters, such as the hydraulic
loading rate (HLR) have been rarely interpreted. In addi-
tion, our field survey showed that the trenching process
such as the conventional CW was out of the question
because of a thin soil cover (15–25 cm) on the ground
around the farm house. In light of what have been men-
tioned above, a set of improved stepped eco-filter (EF)
process based on the CW and the VF was designed above
the ground to treat the GW from a farm household in
mountainous rural regions. The aim of this study was to
investigate the operating parameters for the maximum
removal rate of an on-site EF process constructed accord-
ing to the local conditions while treating the GW from a
single farm house, as well as its general performance
during the operating period of an entire year.
Materials and methods
Pilot plant setup
The pilot facility was built in a typical farm house located
in the Three Gorges Reservoir region of China, which were
composed of influent collecting pipes, one settling tank,
and two ecological tanks. These units were connected
sequentially and positioned from high to low elevation to
allow for gravity driven fluid flow. This way, the facility
could operate without energy consumption (Fig. 1a). All
the tanks were handled by PVC frame, which measures
80 cm long, 60 cm wide and 65 cm high, respectively. The
water distributors were made of a row of PVC pipes that
each was drilled with six small holes (2 mm diameter).
These distributors were placed 20–30 cm above the surface
soil of the tanks. Cock taps were inserted near the bottom
of the tanks for the sampling of the effluent.
From the bottom to the top, the ecological tanks were
designed as catchments layer (0–10 cm), board supporting
layer (10–12 cm), slag layer (12–22 cm), gravel layer
(22–32 cm), soil layer (32–60 cm) and vegetation layer. The
slag and gravel were solid waste collected in the village, the
physical characteristics of the slag and gravel was shown in the
Table 1. The soils were collected from the mountains near the
farm house, which was evenly mixed with sands by volume
ratio of 3:1. Earthworms were collected from the veg-
etable garden nearby and were put into the soil layer with
the density of 40 worms per square meter of soil. In the vege-
tation layer, ornamental and evergreen plants were planted
usingOphiopogon japonicus andRhododendron simsiiPlanch;
a good long-term stability of landscape of the EFwas formed as
these plants live a normal life all year around (Fig. 1b).
Experimental design
In regular sequence, this experiment was divided into three
stages including the set-up phase, the HLR optimization
test and the continuous operation test. The set-up phase was
designed for the acclimatization of the microorganism,
earthworms and plants. Influent GW was collected by PVC
pipes from the typical single household. Operating period
of the process was set from 9:00 to 15:00 everyday, and
this was automatically controlled by a relay and a peri-
staltic pump; so the wet-to-dry time ratio was maintained at
1:3. The duration of the set-up phase was 60 days, and the
influent flow rate was designed as slow as 65 mL/min, or a
HLR of 0.05 m3/(m2 day). The period of the HLR opti-
mization test was planned as 100 days, the HLR was
designed four stages as 0.05 m3/(m2 day) (stage 1), 0.1 m3/
(m2 day) (stage 2), 0.2 m3/(m2 day) (stage 3), 0.4 m3/
(m2 day) (stage 4) with the operating time of 20, 20, 20,
30 days, respectively. To investigate the long-term per-
formance of the process under the HLR of 0.2 m3/
(m2 day), the continuous operation test was operated con-
tinuously over an entire year. The adjustable valve was
used to maintain the HLR condition instead of using the
peristaltic pump; thus, the GW was flowing by gravity and
the process operating without energy consumption in this
period.
Appl Water Sci
123
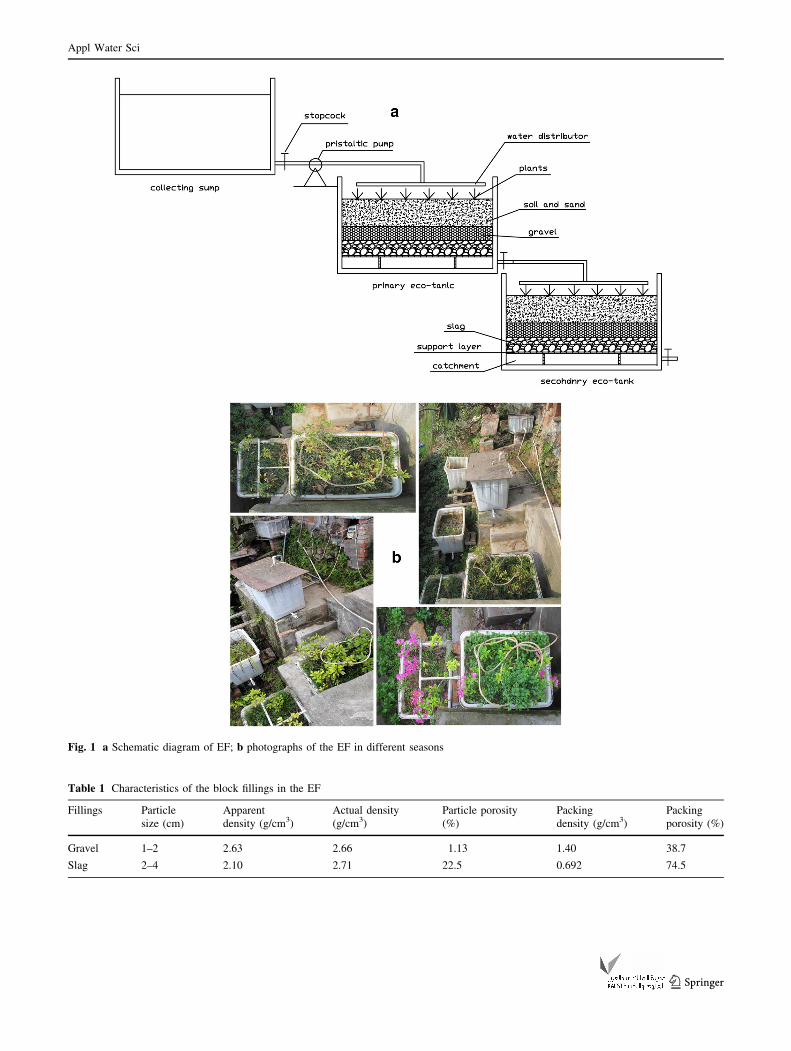
Fig. 1 a Schematic diagram of EF; b photographs of the EF in different seasons
Table 1 Characteristics of the block fillings in the EF
Fillings Particle
size (cm)
Apparent
density (g/cm3)
Actual density
(g/cm3)
Particle porosity
(%)
Packing
density (g/cm3)
Packing
porosity (%)
Gravel 1–2 2.63 2.66 1.13 1.40 38.7
Slag 2–4 2.10 2.71 22.5 0.692 74.5
Appl Water Sci
123

Sampling and analytical methods
Influent and effluent of the system were sampled and
monitored continuously during the experiment period. The
COD, NH4?-N, TP, and the LAS were measured according
to the Standard Methods for the examination of water and
wastewater (APHA 1998). The removal efficiency was
calculated as the percent removal for each parameter:
R = (1 - Ce/Ci) 9 100%, where the Ce and Ci are the
influent and effluent concentrations in mg/L, respectively.
The pH and temperature were determined in situ by the
portable pH meter (OHAUS STARTER 300, USA), and
the moisture content in the soil was measured on-site by
portable soil moisture tester (TRIME-P, Germany).
Statistical analysis
Analysis of the experiments data was performed by the
software of SPSS 16.0 and Surfer 8.0, and the p value less
than 0.05 (p\ 0.05) was interpreted to declare the differ-
ences of significant level. The one-way analysis of variance
(ANOVA) and the least significant difference (LSD) was
performed to analyze the differences between average
values of the effluent for each physicochemical parameter.
Results and discussion
Effect of the HLR on the removal rates of
the process
The set-up phase lasted about 60 days, which was mainly
aimed to observe the adaptation of the earthworms and
plants in the ecological tank. The effect of the GW distri-
bution was tested in the wet and dry period separately, 20
sampling points for moisture measurement were set in the
horizontal plane at the depth of 15 cm under the soil sur-
face in each tank. The test results showed that the moisture
Fig. 2 Contour of the soil moisture content in the two tanks: a the first tank in the wet period; b the first tank in the dry period; c the second tank
in the wet period; d the second tank in the dry period. The results are represented in percentage (%)
Appl Water Sci
123

was evenly distributed in the soil layer of the two ecology
tanks (Fig. 2).
In the 30th day of this period, the plants thrived well and
earthworms could be found alive after scooping up hand-
fuls of soil. Then, the COD, TN, NH4?-N, TP of the
influent and effluent of the first ecological tank was mon-
itored for a month. The average removal efficiency of
COD, TN, NH4?-N, TP during the set-up phase was 63, 64,
77 and 59%, respectively. All the indexes of the influent
gradually decreased, but the removal rates of COD, TN,
NH4?-N showed comparatively stable except for TP, this
may attributed to the rather low content of TP in the
influent. Moreover, the frequent rains in that period caused
the decline of all the indexes of the influent.
Thus, covers and GW collecting pipes were designed to
eliminate the effect of the rainfall after the start-up experi-
ment. The removal rate changes of COD, NH4?-N, TP, tur-
bidity during the HLR optimization test are presented in
Fig. 3, and the HLR was designed four stages from stage 1 to
stage 4 with the value was 0.05 m3/(m2 day), 0.1 m3/
(m2 day), 0.2 m3/(m2 day), and 0.4 m3/(m2 day), respec-
tively. From the change regulations of the removal rates in
Fig. 3, it can be concluded that the optimalHLRof the process
will located in the range of 0.2–0.4 m3/(m2 day). Compare to
the similar processes, the optimal HLR of this process was a
little higher as the HLR reported in the related studies were
0.06–0.25 m3/(m2 day) (Luederitz et al. 2001; Kantawa-
nichkul et al. 2013). It may attribute to the reason that the
fillings mode and the operation condition of this process were
different from the VFCW, although it was more similar to the
VFCW compared to the other ecological process.
The removal rates of COD, TN, NH4?-N, and TP changed
differently with the increasing of HLR from 0.05 to 0.4 m3/
(m2 day), as was shown in the Fig. 3. The removal rate of
COD, TN, NH4?-N, and TP were all gradually declining
with the increasing of HLR, while the further decline was
observed under the HLR of 0.4 m3/(m2 day). The hydraulic
retention time (HRT) was shorter when the HLR was up-
regulated; therefore, the interception and the absorption
functions of the EFwere degraded at the same time.With the
increasing of the HLR, the removal rates of the most indexes
represented the trends of reduction; this is also consistent
with the most of the previous works.
Unlike the other related works, the removal rate of TP
increased as the HLR elevated from 0.1 to 0.2 m3/(m2 day)
before decreasing during the HLR increased from 0.2 to
0.4 m3/(m2 day). The removal of the TP in the EF system
mainly due to the absorption and precipitation of phos-
phorus on the packing, and the maximum adsorptive
capacity could be enhanced with the increment of the TP
Fig. 3 Effect of HLR on the removal efficiency of the process
Appl Water Sci
123

content in a certain range (Cheol et al. 2005). In this study,
the concentration of TP in the influent was much lower
compared to other reports, which is the reason for the low
removal rate. In similar, it explains why the TP removal
rate was increasing as the HLR was up-regulated from 0.1
to 0.2 m3/(m2 day) (Fig. 3).
Treatment performance of the process
in the continuous operation test
Based on the conclusions of the HLR optimization tests,
the process was operating continuously under the HLR of
0.2 m3/(m2 day) over one entire year. The COD, NH4?-N,
TP, turbidity and LAS of the influent and the effluent
Water from the influent, effluent (including the first tank
and the entire system) were sampled and monitored 3–4
times every month during the year. The average values and
the removal rates was calculated and listed in Table 2.
Compared to the general characteristics of GW data
collected by previous studies (Donner et al. 2010; Ghaiti-
dak and Yadav 2013), the means of COD, TP, turbidity and
pH in this study were within the same rang. However, the
data from this examine were all in a comparatively lower
range. This is because the GW was mainly from the
bathroom and the wash basin in this experiment, a much
lower percentage of sources from laundry and kitchen
considerably reduces the organic load and total solid con-
tent of the GW. Furthermore, the characteristics of COD,
TP, turbidity in GW from this farmer household were more
consistent with the water quality from bathroom (Ghaitidak
and Yadav 2013; Assayed et al. 2015). These results sup-
port the conclusion that the characteristics of greywater are
mainly determined by the source, lifestyle, and daily
activities of the household (Eriksson et al. 2009). Varia-
tions of the LAS in GW had rarely been elucidated in the
related research, and the data of which from our study were
in the range but in a comparably high level than that from
the other investigations. It may attribute to the fact that the
GW in this experiment are mainly composed of washing
dishes and laundry water from farmer household, which
contains a large amounts of LAS because of the exces-
sively use of detergent and soap by the family members.
In this study, concentration of the TN, NH4?-N and TP in
the effluent satisfied the need of ‘‘Urban Sewage Treatment
Plant Pollutant Discharge Standard’’ (GB18918-2002) pri-
mary standard Class A, and the content of the COD met the
secondary standard. The GW output of a household within a
day varies considerably in different seasons through out a
year. On the whole, the average amount of the greywater
generated from the household was in the range of
0.1–0.4 m3/day in the rural area. Initially, we did not intend
to treat all the greywater discharged from the peasant
household in this experiment. Our purpose is to investigate a
range value of the optimal HLR of this process by treating
part of the discharged greywater. The results showed that, the
optimal HLR of the process was ought to be in the range of
0.2–0.4 m3/(m2 day). Based on this result, it can be con-
cluded that whenwe set out to treat all the greywater from the
peasant household in future practical application, we only
need to increase the surface area of our EF tank to some value
of 1–2 m2 based on the data of this experiment.
In addition, the removal efficiency of the COD, TN,
NH4?-N, TP, turbidity, LAS averaged to be 67, 55, 64, 43,
68, 71%, respectively (Table 2). The removal rates of COD
and TP in this examine was obviously lower than the most
related facility (Wang et al. 2011; Zhao et al. 2012), it is
due to the fact that only two EF tanks (the first tank and the
second tank) were concatenated in this study but three
tanks were designed in their experiment, added with the big
fluctuations of the influent character during the entire year.
As can be deduced from our data, the removal efficiency of
COD and LAS could be enhanced to satisfaction if the third
EF tanks or recycling measures are in further connected to
the process. The removal rate of LAS was averaged as
71%, which mainly attribute to the living plants and the
depth of the packing (Huang et al. 2004; Kadewa et al.
2010). Despite the removal rate of LAS was not so good by
the this EF process, the content of LAS in the influent was
Table 2 The concentration and the removal efficiency of the process in the continuous test during an entire year
Items Sample size (n) Influenta Effluenta Removal rate (%)a
The first tank The entire system The first tank (%) The entire system (%)
COD (mg/L) 58 302 ± 110 151 ± 82.7 98.5 ± 49.4 50.6 ± 12.7 67.2 ± 15.3
TN (mg/L) 48 12.2 ± 5.59 7.36 ± 2.35 5.67 ± 2.37 35.1 ± 17.5 54.5 ± 12.8
NH4?-N (mg/L) 58 7.04 ± 2.25 3.59 ± 2.51 2.59 ± 2.00 50.4 ± 21.1 63.5 ± 16.6
TP (mg/L) 58 0.922 ± 0.319 0.551 ± 0.139 0.480 ± 0.115 35.2 ± 16.2 43.3 ± 12.8
Turbidity (NTU) 53 106 ± 49.1 62.9 ± 32.9 34.5 ± 20.3 40.5 ± 19.0 67.6 ± 14.4
LAS (mg/L) 32 55.3 ± 15.7 31.8 ± 6.79 15.82 ± 4.90 42.6 ± 3.52 71.4 ± 5.24
pH 58 7.58 ± 0.261 7.79 ± 0.204 7.86 ± 0.198 – –
a Mean concentration ± standard deviation of the physicochemical parameters
Appl Water Sci
123

near to the discharge standard, and predictably the content
of LAS in the influent will lower than the discharge stan-
dard if a third similar tank was added and connected to this
process.
Technologies including physical, chemical, and biolog-
ical systems were already applied for GW treatment. Up to
date, the technologies of membrane filtration, such as
membrane bioreactor (MBR) or direct UF/MF filtration,
are more frequently used for the single households GW
treatment by the water-treatment companies, however, the
investment of MBR for single household is still too high
when the payback time is almost 15 years (Jabornig and
Favero 2013; Jabornig 2014). Householders’ poll showed
that about 23% respondents were reluctant to pay any
money on the sewage treatment facility, which means that
the cost of the facility must be extremely low so that the
rural villages could accept it (Wu et al. 2011). In this study,
the sum construction cost including the experimental
expense of the process is very low as 160 US dollars
(Table 3). Since a large proportion of the cost is from the
frame structure and the installation, a big reduction of the
sum cost can be acquired by directing the farmer to build
and install the frame structure using cheap raw material
such as concrete.
Clogging is the biggest problem to the most bio-eco-
logical processes such as the Constructed Wetland and the
Filtration. However, clogging was not experienced in this
study, probably because the trapped solids in the soil were
preyed by the earthworms or degraded by the microor-
ganisms promptly. In addition, the packing porosity in the
gravel layer and the slag layer are both in a comparably
high level (Table 1), which may have reduced the chance
of clogging happening. The EF is easy maintaining because
of the following reasons: (1) it was designed according to
the terrain conditions of hilly areas, which run by gravity
and do not need additional equipment such as pumps; (2)
the process has showed stable treatment effect during an
entire year and no clogging was observed during the per-
iod, the only required maintenance was pruning the plants
and pulling the weeds in the tanks. From what have been
discussed above, it could be concluded that with the
advantage of lower cost and easier maintenance, the EF
technology with its improvements for GW treatment has
high applicability in the rural areas of developing country.
Impacts of the environment temperature on
the process
The effect of the air temperature on the performance of the
EF was examined based on the comparison of the data from
the summer and winter in a year, with the temperature
21–30 �C in summer and 5–12 �C in winter. In the summer,
the system removal rate of COD, TN, TP, LAS was 77, 65,
45, 76% and the corresponding value in the winter was 60,
48, 41, 68%, respectively. All the removal rates from sum-
mer were observed higher than those from winter, and this
was in agreement with the previous study (Zhao et al. 2012).
In contrast, the removal rate of TP in winter was in close
proximity to that in summer, and the significant different
(p\ 0.05) of removal rate between the summer and winter
was only detected in COD (Fig. 4). Probably, the very low
concentration of TP in the influent has limited the increase of
the removal rate to phosphorous in summer. Due to a similar
reason, the significant difference of removal rates between
summer and winter could only be detected in the index of
COD, for the COD content in the influent was moderate
according to the GW quality reported previously.
While treating the GW, the mechanisms of the EF
included the filtering absorption in the layer of soil and
packing, and the bio-chemical retention of the plant root
and microorganism. Moreover, the existing of the earth-
worm was proved effectively in enhancing the physical and
the bio-chemical reactions by Edwards and Fletcher
(1988). Thus, it explains that the higher temperature in
summer enhances the life activity of the plant, microor-
ganism and earthworm as well as the synergistic effect
among them; this was the reason for the higher removal
efficiency. It is worth noting that the process still per-
formed well in the winter, this may be attributed to the
living of the Ophiopogon japonicus and Rhododendron
simsii Planch in the soil. Furthermore, the covering of the
Ophiopogon japonicus above the tanks could offer a heat
preservation function, which enabled the continuing bio-
logical activity inside the soil.
Conclusions
A set of gravity flow stepped eco-filter process was con-
ducted to treat GW generated from a single farm house
over an entire year, and the impacts of HLR and environ-
ment temperature were investigated in this experiment. The
average values of the most indexes in the influent GW were
Table 3 Construction and experimental cost of the household
ecofilter
Items Cost (US dollars)
Precast frame structure 30
Gravel, slag and soil 0–5
Installation 100
Pipes and joints 20
Plants 0–5
Excavation 0
Sum 160
Appl Water Sci
123

relatively low but in the range of the previous study, except
for that of the LAS. The removal rates changed differently
with the increase of HLR, and the optimal HLR is in the
range of 0.2–0.4 m3/(m2 day) for this facility. The facility
was operating all year round; the average removal rate of
the COD, TN, NH4?-N, TP, turbidity and LAS was 67, 55,
64, 43, 68 and 71%, respectively.
The average removal rates in summer were all higher
than those in winter. However, the process still performed
well in winter. The difference of the COD removal rate was
significant (p\ 0.05) between the summer and winter and,
however, that of TP was hardly observed. Clogging has
never occurred in the process while it was operating over
one entire year. Overall, the facility demonstrated high
performance, low cost and easy maintaining.
Acknowledgements This research was financially supported by the
National Natural Science Fundation of China (41401586, 21407091).
Thank Prof Zaiyi Liao (Hubei Chutian Scholar) for language help and
proof reading the article, also thank Guangcai Hu, Xifeng Chen for
assistance with sampling collection and analysis. The authors would
like to thank the anonymous reviewers for useful suggestions, too.
Open Access This article is distributed under the terms of the
Creative Commons Attribution 4.0 International License (http://
creativecommons.org/licenses/by/4.0/), which permits unrestricted
use, distribution, and reproduction in any medium, provided you give
appropriate credit to the original author(s) and the source, provide a
link to the Creative Commons license, and indicate if changes were
made.
References
Adugna AT, Andrianisa HA, Konate Y et al (2014) Greywater
treatment by vermifiltration for sub-Saharan urban poor. J Water
Sanit Hyg Dev 4:625–632
APHA (1998) Standard methods for the examination of water and
wastewater, 20th edn. American Public Health Association,
Washington
Assayed A, Chenoweth J, Pedley S (2015) Assessing the efficiency of
an innovative method for on-site greywater treatment: drawer
Fig. 4 Effect of seasonal temperature change on the removal rates of the process
Appl Water Sci
123
compacted sand filter—a case study in Jordan. Ecol Eng
81:525–533
Cheol SD, Sik CJ, Jae LH, Soo HJ (2005) Phosphorous retention
capacity of filter media for estimating the longevity of
constructed wetland. Water Res 39:2445–2457
Donner E, Eriksson E, Revitt DM et al (2010) Presence and fate of
priority substances in domestic greywater treatment and reuse
systems. Sci Total Environ 408:2444–2451
Edwards CA, Fletcher KE (1988) Interactions between earthworms
and microorganisms in organic-matter breakdown. Agric Ecosyst
Environ 24:235–247
Edwin GA, Gopalsamy P, Muthu N (2014) Characterization of
domestic gray water from point source to determine the potential
for urban residential reuse: a short review. Appl Water Sci
4:39–49
Eriksson E, Andersen HR, Madsen TS et al (2009) Greywater
pollution variability and loadings. Ecol Eng 35:661–669
Ghaitidak DM, Yadav KD (2013) Characteristics and treatment of
greywater—a review. Environ Sci Pollut Res 20:2795–2809
Gross A, Shmueli O, Ronen Z et al (2007) Recycled vertical flow
constructed wetland (RVFCW)—a novel method of recycling
greywater for irrigation in small communities and households.
Chemosphere 66:916–923
Halalsheh M, Dalahmeh S, Sayed M et al (2008) Grey water
characteristics and treatment options for rural areas in Jordan.
Bioresour Technol 99:6635–6641
Huang YM, Ana L, Damia B et al (2004) Factors affecting linear
alkylbenzene sulfonates removal in subsurface flow constructed
wetlands. Environ Sci Technol 38:2657–2663
Huelgas A, Funamizu N (2009) Flat-plate submerged membrane
bioreactor for the treatment of higher-load graywater. Desalina-
tion 250:162–166
Jabornig S (2014) Overview and feasibility of advanced grey water
treatment systems for single households. Urban Water J
11:361–369
Jabornig S, Favero E (2013) Single household greywater treatment
with a moving bed biofilm membrane reactor (MBBMR).
J Membr Sci 446:277–285
Kadewa WW, Le Corre K, Pidou M et al (2010) Comparison of grey
water treatment performance by a cascading sand filter and a
constructed wetland. Water Sci Technol 62:1471–1478
Kantawanichkul S, Sattayapanich S, Dien FV (2013) Treatment of
domestic wastewater by vertical flow constructed wetland
planted with umbrella sedge and Vetiver grass. Water Sci
Technol 68:1345–1351
Li FY, Wichmann K, Otterpohl R (2009) Review of the technological
approaches for grey water treatment and reuses. Sci Total
Environ 407:3439–3449
Luederitz V, Eckert E, Lange-Weber M et al (2001) Nutrient removal
efficiency and resource economics of vertical flow and horizon-
tal flow constructed wetlands. Ecol Eng 18:157–171
Marc P, Lisa A, Tom S et al (2007) Chemical solutions for greywater
recycling. Chemosphere 71:147–155
Ushijima K, Ito K, Ito R et al (2013) Greywater treatment by slanted
soil system. Ecol Eng 50:62–68
Wang S, Yang J, Lou SJ (2010) Wastewater treatment performance of
a vermifilter enhancement by a converter slag–coal cinder filter.
Ecol Eng 36:489–494
Wang LM, Zheng Z, Luo XZ et al (2011) Performance and
mechanisms of a microbial-earthworm ecofilter for removing
organic matter and nitrogen from synthetic domestic wastewater.
J Hazard Mater 195:245–253
Wu SB, Austin D, Liu L et al (2011) Performance of integrated
household constructed wetland for domestic wastewater treat-
ment in rural areas. Ecol Eng 37:948–954
Zhao YJ, Cheng Y, Li YL et al (2012) Effect of C/N ratios on the
performance of earthworm eco-filter for treatment of synthetics
domestic sewage. Environ Sci Pollut Res 19:4049–4059
Appl Water Sci
123