study on brainwave responses from ears: the event-related
TRANSCRIPT

www.ccsenet.org/cis Computer and Information Science Vol. 4, No. 3; May 2011
ISSN 1913-8989 E-ISSN 1913-8997 18
Study on Brainwave Responses from Ears: the Event-related Synchronization under the Auditory Stimulus
Huiran Zhang
Graduate School of Innovative Life Science, University of Toyama
Toyama, Japan
Tel: 81-090-8261-8208 E-mail: [email protected]
Yantao Li
School of Computer Engineering and Science, Shanghai University
Shanghai, China
E-mail: [email protected]
Zheng Tang
Faculty of Engineering, University of Toyama
Toyama, Japan
E-mail: [email protected]
Received: February 5, 2011 Accepted: March 14, 2011 doi:10.5539/cis.v4n3p18
Abstract
The event-related synchronization (ERS) is one of the most important functions of brain activities (G. Pfurtscheller, et al. 1992). In order to observe the brain activity of the subjects heard the 40 Hz acoustic stimuli, the event-related potential (ERP) and electroencephalogram (EEG) images of the brain are used to analyze the auditory cortex area. In the present work, observation and exploring study on the brain activities under 40 Hz acoustic stimulus were systemically done by experimental and spectrum analysis technology. And several modes of data visualization are also used. All the data in this experiment suggest that the results of auditory simultaneous stimuli for both ears are present and the brainwave frequency synchronization in the phase with the stimuli is further proved.
Keywords: Event-related synchronization (ERS), Acoustic stimuli, Event-related potential (ERP), Electroencephalogram (EEG), 40 Hz acoustic stimuli
1. Introduction
The brain activity is considered "spontaneous activity" because this activity goes on continuously in the living individual. Spontaneous activity is measured on the scalp or on the brain, which can be used to understand the activity state of brain. Electroencephalography (EEG) is a study of changing electrical potential of the brain. The amplitude of the EEG is about 100 µV when measured on the scalp, and about 1- 2 mV when measured on the surface of the brain. The EEG also arises in response to an exterior stimulus (which may be electric, auditory, visual, etc.). Several kinds of events, the most notably being sensory stimuli, can induce time-locked changes in the activity of neuronal populations that are generally called event-related potentials (ERPs). In order to detect such ERPs, averaging techniques are commonly used (G. Pfurtscheller, F.H. Lopes da Silva, 1999). Because these signals are usually below the noise level and cannot be readily distinguished, one must use a train of stimulus and signal averaging to improve the signal-to-noise ratio. Different brainwave frequencies show synchronies related to different perceptual, motor or cognitive states (event-related synchronization, ERS). Brainwaves have also been shown to synchronize with external stimuli with repetition rates of ca. 10–40 Hz (Udo Will. 2007).
Generally speaking, brainwave synchronization also referred to as brainwave entrainment, which is concerned with frequency following response, a naturally occurring phenomenon where the human brain has a tendency to change towards the familiar frequency of the dominant external stimulus applied it. Here, frequency is the

www.ccsenet.org/cis Computer and Information Science Vol. 4, No. 3; May 2011
Published by Canadian Center of Science and Education 19
number of complete repetitive waves that occur in a given unit of time. Frequency is measured in Hertz (Hz) or cycles per second (cps). According to the frequency, brainwaves are divided into 4 main groups above, also referred to as "brain states". When the brain is highly lateralized (one side of the brain is significantly more dominant than the other), the frequency of the brainwaves also increases. In the other words, the more lateralized and out-of-phase the brainwaves are the faster the frequency of the brainwaves (Udo Will. 2007) (Ulman Lindenberger and Shu-chen Li. 2009).
From the mechanism of resonance process, the sound and its response by the human ear, exactly the brain, could be used to study the brainwave by creating rhythmic patterns which would stimulate altered states of consciousness. Here, primary auditory cortex (figure 1) should be the first region of cerebral cortex to receive auditory input. Perception of sound is associated with the right posterior superior temporal gyrus (STG) (Radua, Joaquim, Phillips, Mary L, et al. 2010). The STG contains several important structures of the brain, including Brodmann area 41 and 42, which mark the location of the primary auditory cortex and the cortical region responsible for the sensation of basic characteristics of sound, such as pitch and rhythm. The auditory association area is located within the temporal lobe of the brain, in an area called the Wernicke’s area, or area 22, near the lateral cerebral sulcus. It is such an important region for the processing of acoustic signals that they can be distinguished as speech, music, or noise from them.
On the basis of four kinds of brainwave, it is known that fully awake and alert generally associated with brain thinking activity with a typical frequency of 14-40 Hz (Beta-type brainwave). Thus, in order to study the brain activity, we selected a typical frequency of 40 Hz as a sound stimulus for the auditory conscious mind in present work. The purposes of this study were as following: 1) to help human to control the machines using the brainwave, such as the robot’s behavior, computer operation and auto-control technology et al; 2) to provide some experimental explorations on the human physiology and medicine, medical jurisprudence, and pattern recognition, safety science and terror against and so on; 3) to obtain some experimental data for the study on brain science, especially the brain activity of the human, in order to find out what happened at the auditory area of brain when the person was stimulated by the exterior sounds.
In this study, in order to get the information of brain activity during the subjects heard the 40 Hz acoustic stimuli, the ERP and EEG images of the brain are used to analyze the auditory cortex area. The results showed that a distinguishing response between right and left ears was observed by ERS experiment under the auditory stimuli.
2. Experimental principle and methods
Early in the history of human brain physiology it was demonstrated that brain activities could synchronize to external stimuli (E.D. Adrian, B.H.C. Matthews. 1934) (W.G. Walter, V.J. Dovey, H. Shipton. 1946). Most of studies showed that brainwaves were synchronizing the periodic auditory stimuli with repetition rates in the gamma range from 30 to 50 Hz (C. Drake, M.R. Jones, C. Baruch.2000) (R. Galambos, S. Makeig. 1988) (T.W. Picton, J. Vajsar, R. Rodriguez, K.B. Campbell. 1987). Some previous study reported a driving response of the EEG amplitude to acoustic stimuli with repetition rates from 1 to 8 Hz (Udo Will. 2007) (A. Neher. 1961). Stimulation with repetition rates of 1–8 Hz leads to increased phase synchronization in all EEG frequency bands and three distinct components can be distinguished (T.W. Picton, J. Vajsar, R. Rodriguez, et al. 1987) which included a tonic inter-trial coherence (ITC) response ( stimulus rates between 1 and 5 Hz , the response has an absolute maximum at around 2 Hz in the delta range), aphasic response (centered in the theta range, large than 2Hz) and the synchronization responses (in the 14–44 Hz EEG bands consist of an evoked (ITC modulation by the stimuli periodicity) and an induced (increased 20–26Hz ITC modulation) ). However, all the results of their researches were come from both of the right and left ears at the same time. In the present work, we used the 40Hz sine sound wave stimulus. The ERP and EEG images are used to analyze the auditory cortex area with the sound wave stimulus of a frequency of 40Hz by using Active Two equipment. The Active Two system produced by BioSemi Inc. with 64 channels is used for measure the signals come from the activity of the brain. The data, come from the system is analyzed by the EEGLAB which is the toolbox under Matlab interface environment. EEGLAB is an interactive Matlab toolbox for processing continuous and event-related EEG, MEG and other electrophysiological data using independent component analysis (ICA), time/frequency analysis, artifact rejection, and several modes of data visualization.
The experimental data were achieved from 6 persons above 20 times per person and make sure the useable events in every data are more than 20 times. The details are as following: we recorded EEGs from 6 subjects (2 females; 4 males; age between 25 and 30) who had been asked to listen to sound stimulus passively. Subjects were seated in an upright chair, wearing an EEG cap and listening to the stimulus via headphones with eyes closed, keeping the body relaxing. Here, Periodic acoustic stimuli consisted of 20 times alternation of sine sound

www.ccsenet.org/cis Computer and Information Science Vol. 4, No. 3; May 2011
ISSN 1913-8989 E-ISSN 1913-8997 20
wave stimulus for the left and right ears; the distance between two stimuli’s was 1 second. Then both the ears received 5 times of stimulus at the same time after the separated stimulus and the distances were also 1 second. It had no distance between these two types. We also use the left and right stimulus, both ears stimulus to compare with the periodic acoustic stimuli. In the experimental condition, the laboratory is completely closed and no noise. The participants took the closed type earphone connected to a computer which the auditory stimulus came from. Then put on the electrodes-cap, which connecting to the ActiveTwo system. Continuous EEG recordings were made while subjects listened to 98-s stimulus. We used the ears as the grounding electrodes. In our experiments, from using the 40Hz sine sound wave stimulus, the response of the stimulus is very close to normal adult thresholds for the audiometric frequencies, a fact that could have application in clinical hearing testing (Robert Galambos, Scott Makeig, and Peter J. 1981) . We use the independent component analysis (ICA) which applied to the single-trial data identified at least eight classes of contributing components, including those producing central and lateral posterior alpha, left and right mu, and frontal midline theta rhythms. The experiments are well repeated for the all results and spectrum properties.
3. Results and discussions
Based on the correlation between the brain thinking activity and beta-type brainwave, we measured specially the auditory stimulus with a frequency of 40 Hz. The previous researches suggested that the brain activity under sound stimulus is a kind of very complex physiologic phenomenon (K.E. Crowley and I.M. Colrain. 2004) (J.J. Eggermont. 1988) (A. Gutschalk, C. Micheyl, J.R. Melcher, A. Rupp, M. Scherg and A.J. Oxenham. 2005) (E. Sussman, M. Steinschneider, V. Gumenyuk, J. Grushko, K. Lawson. 2008). So far, there has not been a clear pattern and law for brain activity under sound stimuli. In order to explore the activity of the human brain stimulated by auditory wave, four kinds of the stimulus were studied by EEG experiment and analyzed by ICA method separately.
3.1 Time and pallium area dependence of brain activities
Figure 2 show the integrated pattern of brainwave spectrum of the left ear under stimulus of 50 - 60sec from the response of 64 channels. Here, an occipital area and parietal area of brain are also given. The coordinate and scale were marked below the right corner with a power range of ±14.2 μV. When the subjects received the stimulus, it can be seen that there exists a large difference in the response of brainwave between the left and the right hemisphere. In auditory areas, i.e. temporal bone areas (left AF7 electrode and right AF8 electrode), the amplifier of brainwave is higher than the rest areas, which indicated that the brain is in thinking activity state of conscious mind. And from wave shape, the amplifier in the right is higher than the left. This shows that the left ear stimulus reflects to cause in right brain to more activity than the left brain in the auditory areas. In the other hand, it can be also seen that there are many short periods change behind brain marked by electrode points PO3, PO4, PO7, PO8, POz, O3, O4, Oz, Iz and so on. This shows that the hindbrain should possibly be more active than the forebrain for the left ear stimulus for a frequency of 40 Hz. However, the points corresponding in electrode line F, FC, C and CP are almost unchanged within the recording time, about 2000ms. It could show that the midbrain will be more lack of activity for the left ear under stimulus with a frequency of 40 Hz. And the forebrain and circumjacent area show the characteristics of longer periods change (electrode line FP, AF and points F7, FT7, T7, F8, FT8, T8 et al.). This may prove that these areas provide more stable thinking or slower responding than the rest areas.
In order to make clear the response of brainwave for the left ear stimulus, we studies the changes of ERPS within 60 seconds for the left ear stimulus under a frequency of 40Hz. Figure 3 and figure 4 give the record of the interval spectra per 10sec extending 60 seconds for both left and right hemispheres after the auditory stimulus happens. Here, the change of the EEG brainwave was expressed by ERP for the sound stimulus received. The average ERPs of both left and right hemisphere in every time-slice-time scale are almost same. From the present ERP spectrum of extending 60sec for the left ear in figure 3, it can be seen that, the brain is fallow before 20sec and after 50sec. Its time of excellent activity should be from 30sec to 50sec and last for 30seconds long after the stimulus was received. And the activity of the right hemisphere is stronger than the left, which is consistent with the results shown in figure 2. For the right ear under stimulus in figure 4, the ERP spectrum indicates that the time of most activity occurs in the pattern of 40-50 second. Contrarily, the active of the left hemisphere is stronger than the right under the stimulus with a frequency of 40 Hz.
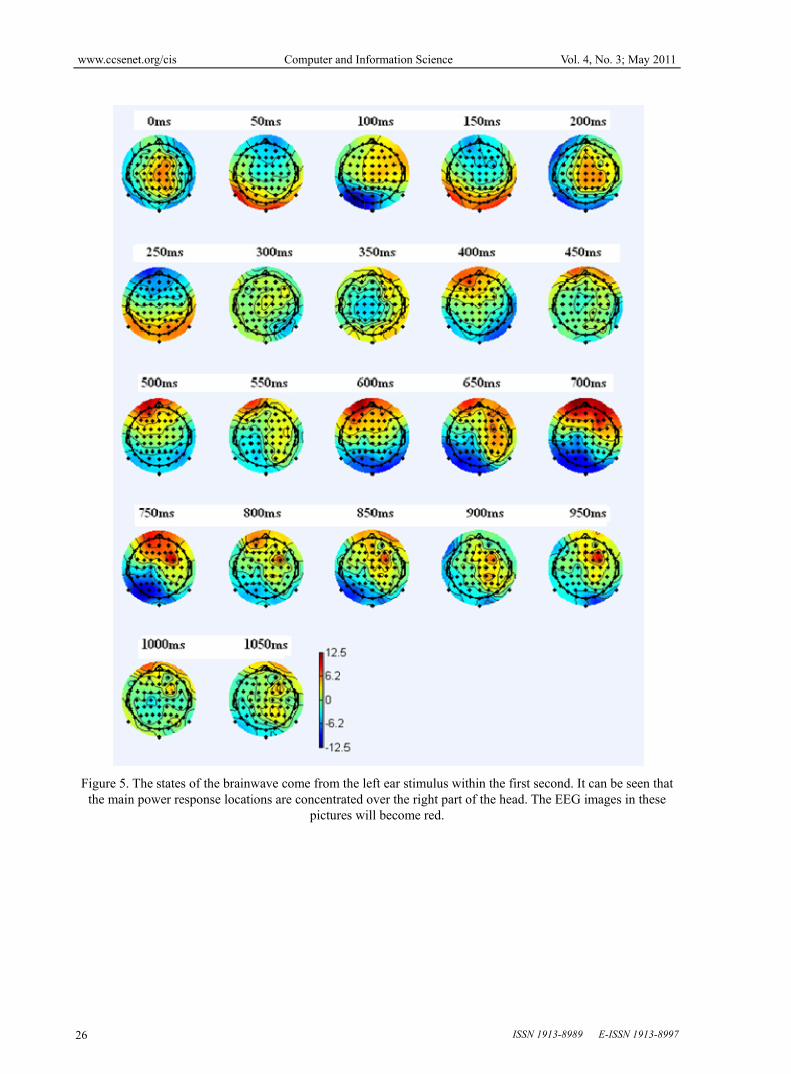
Above the 60 seconds should be a long period activity for human brain. The information and mechanism under 40 Hz auditory stimuli for a quick reflection less than one second will be important for the activity of human brain. For these, we measured the details of EPR spectrum within one second as shown in figure 5. The spectra were recorded in an interval time of 50ms within extending one second after the auditory stimulus happened. The

www.ccsenet.org/cis Computer and Information Science Vol. 4, No. 3; May 2011
Published by Canadian Center of Science and Education 21
states of the brainwave come from the left ear stimulus. On the one hand, it can be seen that the different color between the deep red and heavy blue appears after 500s, with the difference strongest after 600s, stands extending to 750s, large difference disappears after 900s. It indicated that, within the first second, the strong brain activity appears after 500ms and the strongest activity appears from 600s to 750s. The strong activity keeps a standing time about 150 s. After 900 s, the brain activity is at low and stable power tide. On the other hand, we should notice that there are some circle regions and complex change in right hemisphere for several patterns of ERP spectra, such as 450s, 750s, 800s, 900s et al. These might show that, for the left ear stimulus, the main power response locations are concentrated over the right hemisphere. This result accords with the decisions in figure 2. However, it should be mentioned that, the actives of the brain are not symmetry entirely in our results. This should be caused from other activities in the brain besides the responses of acoustic stimulus.
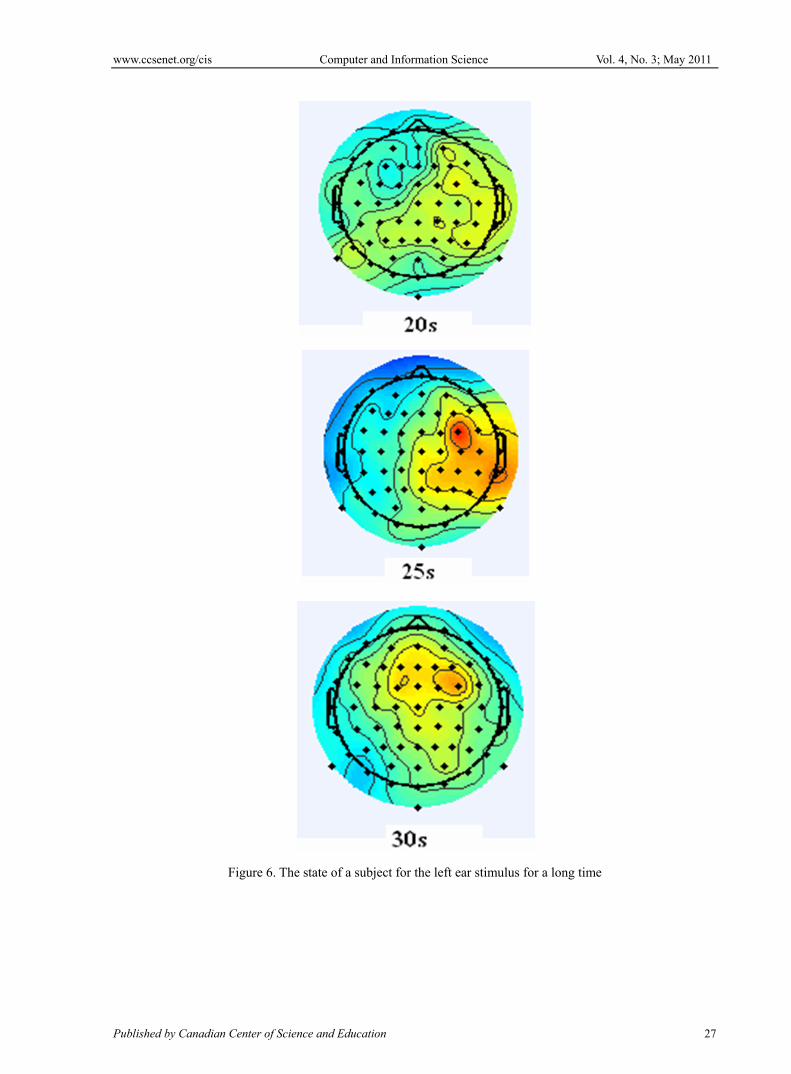
Comparing with the change for long time as shown in figure 3 and figure 4, the behavior of brain activity has a period or intermission-like characteristic. In order to prove it, we measured several brainwave spectra for long standing time till 30 seconds. The results are given in figure 6 which is the state of the brain activity for the left ears stimulus at the end of 20th, 25th and 30th second are shown in figure 6. It can be seen that, for the left ear stimulus 1) the brain activity exists still after extending 20 seconds; 2) these activities still concentrate in the area of the right hemisphere as shown by some circle regions; 3) this proves the existence of an intermission-like characteristic for brain activity by the change of ERP spectrum from 20sec to 30sec under left ear stimulus of 40Hz frequency; 4) the electrode point FC4 should be a strong power central ( corresponding to a deep red circle in 25sec pattern ) for brain activity under left auditory stimulus with a frequency of 40Hz. The areas of the head where the brain is most activity concentrate to the expected locations start after about 25th second from figure 6. In the end, after the last 30sec, the activities of the brain become stable.
It is very meaning that the point FC4 should be the primary auditory cortex of right hemisphere. Thus, we specially measured the EEG spectrum of primary auditory cortex FC4 and F3 for the right and left hemisphere respectively, where the results are shown in figure 7. The spectrum was recorded from the starting of the left stimulus (corresponding to point FC4 in right hemisphere) and right stimulus (corresponding to point F3 in left hemisphere). We can see that the response of the stimulus starts at the time of about 160ms at the electrode of FC4 (figure 7A). There are some analogies between responses of the right and left ear stimulus. The starting response time of right hemisphere which have the same area corresponding to the left is also about 130ms (figure 7B). The continuing time for both stimuli is almost same in a time range of 500ms or so. It is seen that the FC4 spectrum has many changes of peaks and vales between 160ms and 630ms from figure 7A. It shows that the primary auditory cortex FC4 of right hemisphere is more active than the primary auditory cortex F3 of left hemisphere. And it is very interesting that the response of the FC4 spectrum has a stable period of about 100ms between 160ms and 630ms in right hemisphere for left ear stimulus. The same has not been observed in the response of F3 spectrum in left hemisphere for right ear stimulus. The detail of mechanism has been unclear and will await clarification in the near future research. Just for an event, these also prove the variation of brain state is also depending on the time.
3.2 stimuli frequency dependence of brain activity
Brainwaves have been shown to synchronize with the external stimulus of 40Hz. In order to determine differences between the right and left stimulus, we compared the EEG epochs and the ERPs. The frequency dependence and the scalp topography of the mean power in the single-subject average-ERP waveforms resembled that of the unaverage EEG. In figure 7 and 8, we give the dependency of power spectra on stimulus frequency for unaverage EEG and average ERP topographies under the left ear stimulus and right ear stimulus, respectively. The experimental frequency of stimulus signal has a range of 30-45Hz and three ERP topographies are given at selecting frequency, 35Hz, 38Hz and 40Hz. It can be seen that both the temporal and the parietal areas of the head are correlative with the auditory and become red (high power) near the 40Hz frequency. And from these spectrum, we can also see the right part of the head is more intense then the left. Because the right cerebral have the superiority to manage the sensation of non-verbal characteristics of the sound, the left cortical region processes the information of acoustic language signals.
3.3 Response of simultaneity stimuli of both ears
In the above, we only discussed the separate EEG spectrum of research results for single left or right stimulus at frequency of 40Hz in the before. In general, both ears for everyone would receive sound or stimulus simultaneously. We present the results of auditory simultaneous stimulus for both ears in this section. Figure 10 shows the power spectra of unaverage EEG and average ERP data for both ears’ stimulus. It can be seen that there are similar topographies in long time exterior stimulus of 40Hz, which shows that the brainwave

www.ccsenet.org/cis Computer and Information Science Vol. 4, No. 3; May 2011
ISSN 1913-8989 E-ISSN 1913-8997 22
frequencies synchronized with the stimulus. For the response of the both ears stimulus, the brainwaves have been shown to synchronize with external stimulus with repetition rates of about 40Hz. The power spectra of EEG and ERP data have similar topographies of 40Hz which have the same high power (red areas) at the same place of the head (figure 10). In fact, the red places of the head are the areas of the auditory cortex. The power regions of the 40Hz are more concentrated than the 35Hz.
In order to study the activity of the channels at the locations of the auditory cortexes, we can view their activity in the trials in the forms of ERP-image plot (seeing figure 11). In the ERP-image figures, the trials were imaged in order of the occurrence during the experiment. And the latency of responses is shorter than the single ear stimulus. These show that the responses of the both ears stimulus are earlier than the singles when the subjects received the 40Hz exterior stimulus. The synchronized waves appeared near the 40Hz.
4. Conclusions
In order to explore the activity of the human brain stimulated by auditory wave, four modes of the stimulus are used by EEG experiment and analyzed by ICA method separately. The brainwave spectra are systemically studied by the auditory stimulus with a frequency of 40 Hz for single ear reception and both ears reception simultaneously. The full EEG spectra with time dependency are given under the left ear stimulus of 50-60sec from the response of 64 channels. The results show that there exists a large difference in the response of brainwave between the left and the right hemisphere under the left ear stimulus. In thinking activity state of conscious mind, the amplifier of brainwave in auditory areas is higher than the rest of areas. The left ear stimulus reflects to cause in right brain more activity in the auditory areas. And the existence of many short periods change in hindbrain area shows that the hindbrain should be more active than the forebrain for the left stimulus at a frequency of 40 Hz. But the wave form unchanged in the midbrain area might tell us lack of activity. In the forebrain and circumjacent area, the characteristics of longer periods demonstrates the existence of some more stable thinking or slower responding than the rest for the left ear stimulus. Dependency of brain activity on time shows that the strong brain activity appears after 500ms and the strongest activity is between 600-750ms. The strong activity keeps a standing time of 150ms or so. After 900ms, the brain activity is at low and stable power tide. By the change of ERP spectrum, the results prove that the behavior of brain activity has a period or intermission-like characteristic until extending to 30 second. For the left ear stimulus, the main power response locations are concentrated over the right hemisphere. And by the response of the FC4 spectrum, a stable period of about 100ms is found between 160ms and 630ms in right hemisphere for left ear stimulus. At the same time, the results of auditory simultaneous stimulus for both ears and the brainwave frequency synchronization in the phase with the stimulus are also given and discussed
Acknowledgements
The authors are indebted to the colleagues at my research laboratory for help with the experiment. Special thanks are due Dr. Wu Zhang, who is a professor of Shanghai University, for his insightful counsel and suggestions on various aspects of this work.
References
A. Gutschalk, C. Micheyl, J.R. Melcher, A. Rupp, M. Scherg and A.J. Oxenham. (2005). Neuromagnetic correlates of streaming in human auditory cortex. J. Neurosci. 25 (22), 5382–5388.
A. Neher. (1961). Auditory driving observed with scalp electrodes in normal subjects. Electroenceph. Clin. Neurophysiol. 13, 449–451.
C. Drake, M.R. Jones, C. Baruch. (2000). The development of rhythmic attending in auditory sequences: attunement, referent period, focal attending. Cognition. 77, 251–288.
E. Sussman, M. Steinschneider, V. Gumenyuk, J. Grushko, K. Lawson. (2008) The maturation of human evoked brain potentials to sounds presented at different stimulus rates. Hearing Research. 236: 1-2, 61-79
E.D. Adrian, B.H.C. Matthews. (1934). The Berger rhythm: potential changes from the occipital lobes in man. Brain. 57, 355–384.
G. Pfurtscheller, et al. (1992). Event-related synchronization (ERS): an electrophysiological correlate of cortical areas at rest. Electroenceph clin Neurophysiol. 83, 62-69.
G. Pfurtscheller, F.H. Lopes da Silva. (1999). Event-related EEG/MEG synchronization and desynchronization: basic principles. Clinical Neurophysiology. 110, 1842-1857.
J.J. Eggermont. (1988). On the rate of maturation of sensory evoked potentials. Electroencephalogr. Clin. Neurophysiol. 70 (4), 293–305.

www.ccsenet.org/cis Computer and Information Science Vol. 4, No. 3; May 2011
Published by Canadian Center of Science and Education 23
K.E. Crowley and I.M. Colrain. (2004). A review of the evidence for P2 being an independent component process: age, sleep and modality. Clin. Neurophysiol. 115 (4), 732–744.
R. Galambos, S. Makeig. (1988). Dynamic changes in steady state potentials, in: E.Basar (Ed.), Dynamics of Sensory and Cognitive Processing of the Brain. Springer, Berlin. 102–122.
Radua, Joaquim, Phillips, Mary L, et al. (2010). Neural response to specific components of fearful faces in healthy and schizophrenic adults. NeuroImage. 49, 939–946.
Robert Galambos, Scott Makeig, AND Peter J. (1981). Talmachoff, A 40-Hz auditory potential recorded from the human scalp. Proc. Natl. Acad. Sci. USA. 78, 2643-2647
T.W. Picton, J. Vajsar, R. Rodriguez, K.B. Campbell. (1987). Reliability estimates for steady-state evoked potentials. Electroencephalogr. Clin. Neurophysiol. 68, 119–131.
Udo Will. (2007). Eric Berg: Brainwave synchronization and entrainment to periodic acoustic stimuli. Neuroscience Letters. 424, 55–60.
Ulman Lindenberger, Shu-chen Li. (2009). Brains swinging in concert: cortical phase synchronization while playing guitar. BMC Neuroscience. 10, 22.
W.G. Walter, V.J. Dovey, H. Shipton. (1946). Analysis of electrical response of human cortex to photic stimulation. Nature. 158, 340–541.
Figure 1. The area of the primary auditory cortex
Figure 2. EEG spectra from 50 to 60 sec for the left ear stimulus

www.ccsenet.org/cis Computer and Information Science Vol. 4, No. 3; May 2011
ISSN 1913-8989 E-ISSN 1913-8997 24
Figure 3. The changes of ERPs in every 10 seconds for the left ear stimulus under a frequency of 40Hz

www.ccsenet.org/cis Computer and Information Science Vol. 4, No. 3; May 2011
Published by Canadian Center of Science and Education 25
Figure 4. The changes of ERPs in every 10 seconds for the right ear received the stimulus of 40Hz
www.ccsenet.org/cis Computer and Information Science Vol. 4, No. 3; May 2011
ISSN 1913-8989 E-ISSN 1913-8997 26
Figure 5. The states of the brainwave come from the left ear stimulus within the first second. It can be seen that the main power response locations are concentrated over the right part of the head. The EEG images in these
pictures will become red.
www.ccsenet.org/cis Computer and Information Science Vol. 4, No. 3; May 2011
Published by Canadian Center of Science and Education 27
Figure 6. The state of a subject for the left ear stimulus for a long time

www.ccsenet.org/cis Computer and Information Science Vol. 4, No. 3; May 2011
ISSN 1913-8989 E-ISSN 1913-8997 28
Figure 7. The ERP images of the electrodes which are at the Primary auditory cortex areas during the left and right stimulus started

www.ccsenet.org/cis Computer and Information Science Vol. 4, No. 3; May 2011
Published by Canadian Center of Science and Education 29
Figure 8. The power spectra of unaverage EEG and average ERP data have similar topographies of the left stimulus

www.ccsenet.org/cis Computer and Information Science Vol. 4, No. 3; May 2011
ISSN 1913-8989 E-ISSN 1913-8997 30
Figure 9. The power spectra of unaverage EEG and average ERP data have similar topographies of the right
stimulus

www.ccsenet.org/cis Computer and Information Science Vol. 4, No. 3; May 2011
Published by Canadian Center of Science and Education 31
Figure 10. The power spectra of unaverage EEG and average ERP data have similar topographies in long time
exterior stimulus of 40Hz, show that the brainwave frequencies synchronized with the stimulus

www.ccsenet.org/cis Computer and Information Science Vol. 4, No. 3; May 2011
ISSN 1913-8989 E-ISSN 1913-8997 32
Figure 11. The first second of FC4, Fz and FC3 response wave forms, the start of the response appearing while the exterior stimulus happened