study purpose - montgomery planning purpose 1. to analyze the feasibility of redeveloping the...
TRANSCRIPT
STUDY PURPOSE
1. To analyze the feasibility of redeveloping the Glenmont Shopping center as envisioned in the
Glenmont Sector Plan Vision.
2. To develop an implementation strategy that is realistic from a market and economic
perspective.
STUDY PROCESS
W‐ZHA estimated the cost to develop the Glenmont Town Center applying industry standards for the
Washington, DC region. W‐ZHA identified and analyzed existing residential and commercial projects in
Glenmont and nearby areas to understand current market rents. Assumptions were made on
supportable rents in the Glenmont Town Center given its competitive position in the marketplace. An
investment yield analysis was conducted to determine development feasibility. The level of subsidy
necessary to make the project feasible from the private investor’s perspective is presented as well as a
description of various land assembly approaches.
DRAFT VISION FOR GLENMONT SHOPPING CENTER
The Glenmont Shopping Center is envisioned as Glenmont Town Center, a mixed‐use, pedestrian‐
oriented hub. New transit‐oriented development is envisioned that establishes a new image and
identity for Glenmont. The Town Center will include retail, commercial and residential land uses. The
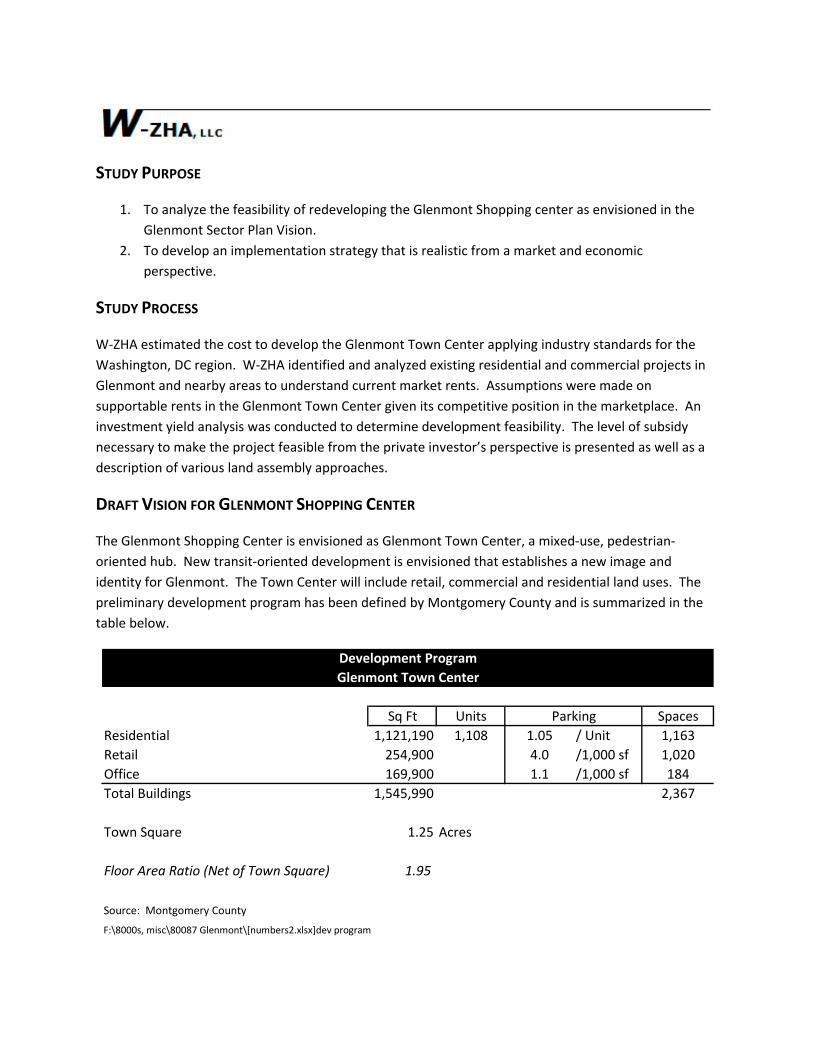
preliminary development program has been defined by Montgomery County and is summarized in the
table below.
Sq Ft Units Spaces
Residential 1,121,190 1,108 1.05 / Unit 1,163
Retail 254,900 4.0 /1,000 sf 1,020
Office 169,900 1.1 /1,000 sf 184
Total Buildings 1,545,990 2,367
Town Square 1.25 Acres
Floor Area Ratio (Net of Town Square) 1.95
Source: Montgomery County
F:\8000s, misc\80087 Glenmont\[numbers2.xlsx]dev program
Parking
Development Program
Glenmont Town Center
‐ 2 ‐
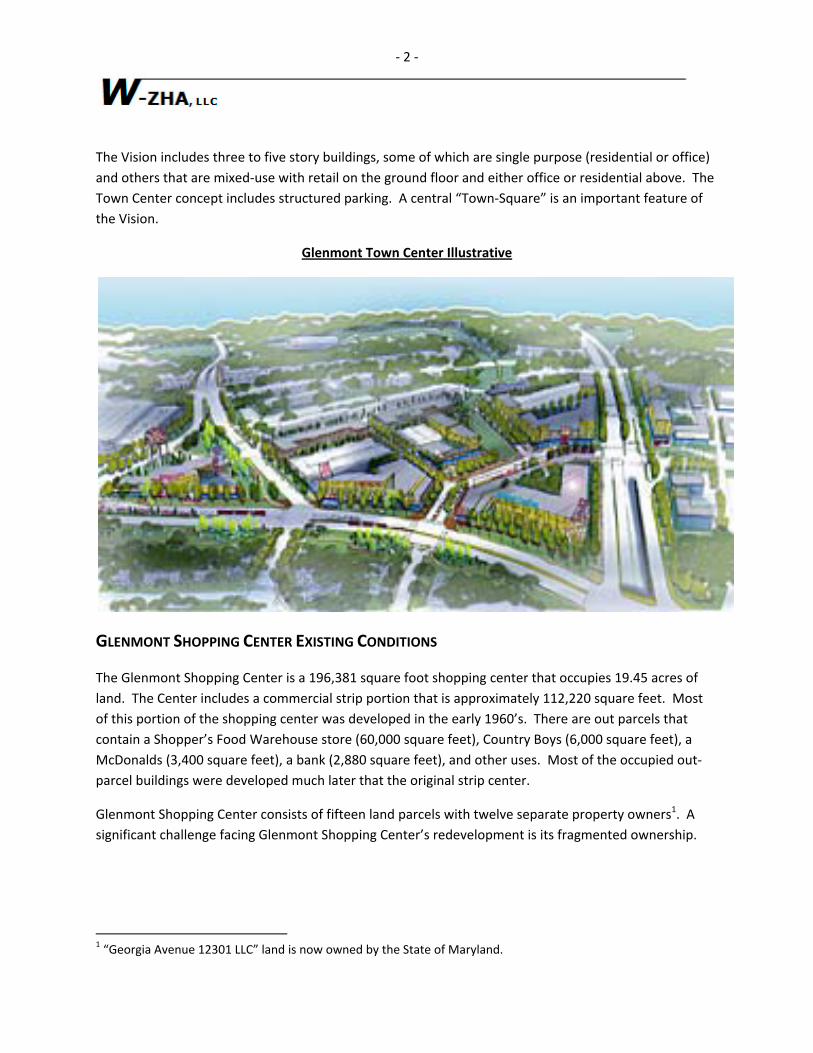
The Vision includes three to five story buildings, some of which are single purpose (residential or office)
and others that are mixed‐use with retail on the ground floor and either office or residential above. The
Town Center concept includes structured parking. A central “Town‐Square” is an important feature of
the Vision.
Glenmont Town Center Illustrative
GLENMONT SHOPPING CENTER EXISTING CONDITIONS
The Glenmont Shopping Center is a 196,381 square foot shopping center that occupies 19.45 acres of
land. The Center includes a commercial strip portion that is approximately 112,220 square feet. Most
of this portion of the shopping center was developed in the early 1960’s. There are out parcels that
contain a Shopper’s Food Warehouse store (60,000 square feet), Country Boys (6,000 square feet), a
McDonalds (3,400 square feet), a bank (2,880 square feet), and other uses. Most of the occupied out‐
parcel buildings were developed much later that the original strip center.
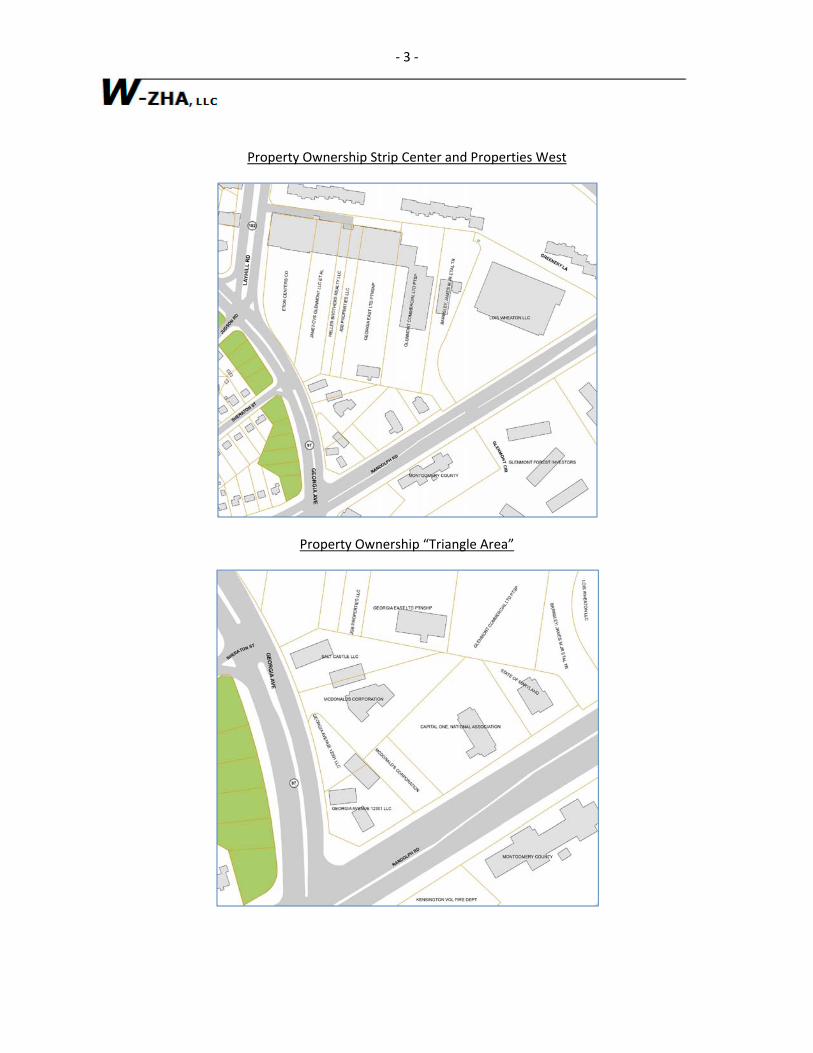
Glenmont Shopping Center consists of fifteen land parcels with twelve separate property owners1. A
significant challenge facing Glenmont Shopping Center’s redevelopment is its fragmented ownership.
1 “Georgia Avenue 12301 LLC” land is now owned by the State of Maryland.
‐ 3 ‐
Property Ownership Strip Center and Properties West
Property Ownership “Triangle Area”
‐ 4 ‐
According to County tax records, the assessed value of Glenmont Shopping Center is $37.9 million or
approximately $2 million per acre.
REDEVELOPMENT FEASIBILITY
Redevelopment occurs when there is a higher and better use for a property. The private sector engages
in redevelopment when projected net operating income from redevelopment is sufficient to pay for land
acquisition and development and generates a sufficient investment return. W‐ZHA tested the financial
feasibility of the Glenmont Town Center Vision.
Development Cost
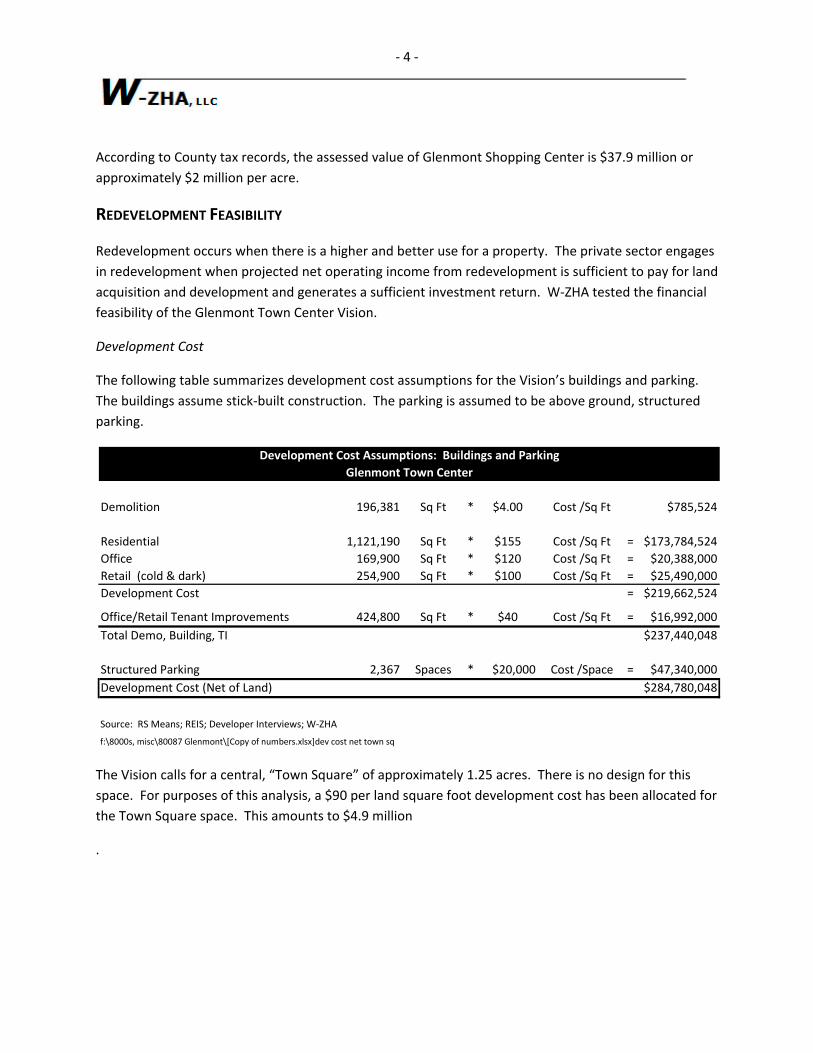
The following table summarizes development cost assumptions for the Vision’s buildings and parking.
The buildings assume stick‐built construction. The parking is assumed to be above ground, structured
parking.
The Vision calls for a central, “Town Square” of approximately 1.25 acres. There is no design for this
space. For purposes of this analysis, a $90 per land square foot development cost has been allocated for
the Town Square space. This amounts to $4.9 million
.
Demolition 196,381 Sq Ft * $4.00 Cost /Sq Ft $785,524
Residential 1,121,190 Sq Ft * $155 Cost /Sq Ft = $173,784,524
Office 169,900 Sq Ft * $120 Cost /Sq Ft = $20,388,000
Retail (cold & dark) 254,900 Sq Ft * $100 Cost /Sq Ft = $25,490,000
Development Cost = $219,662,524
Office/Retail Tenant Improvements 424,800 Sq Ft * $40 Cost /Sq Ft = $16,992,000
Total Demo, Building, TI $237,440,048
Structured Parking 2,367 Spaces * $20,000 Cost /Space = $47,340,000
Development Cost (Net of Land) $284,780,048
Source: RS Means; REIS; Developer Interviews; W‐ZHA
f:\8000s, misc\80087 Glenmont\[Copy of numbers.xlsx]dev cost net town sq
Development Cost Assumptions: Buildings and Parking
Glenmont Town Center

‐ 5 ‐
The estimated total cost to develop the Vision Plan is approximately $290 million. This cost does not
include the cost to acquire the property.
Residential Lease Rates
Current asking rents among apartment communities near Glenmont are summarized below. It is
important to note that these apartment projects are not new and parking is free.
Town Square Land Area 54,450 Sq Ft * $90 Cost /Sq Ft = $4,900,500
Development Cost (Buildings and Parking) $284,780,048
Total Cost (Net of Land) $289,680,548
Source: RS Means; REIS; Developer Interviews; W‐ZHA
f:\8000s, misc\80087 Glenmont\[Copy of numbers.xlsx]town square
Development Cost Assumptions: Town Square
Glenmont Town Center

‐ 6 ‐
The two projects closest to the Glenmont Metro Station command the highest residential rents in
Glenmont. Rent for an 850 square foot apartment ranged from $1.46 to $1.72 per square foot.
The Glen na ‐ na na ‐ na na ‐ na na ‐ na
Winexburg Manor 473 ‐ 473 $1,080 ‐ $1,155 $2.28 ‐ $2.44 na ‐ na
Oakfield Apartments na ‐ na na ‐ na na ‐ na na ‐ na
Glenmont Forest 368 ‐ 368 1,019 ‐ 1,109 $2.77 ‐ $3.01 na ‐ na
Privacy World /1 na ‐ na na ‐ na na ‐ na na ‐ na
The Glen na ‐ na na ‐ na na ‐ na na ‐ na
Winexburg Manor 630 ‐ 949 $1,216 ‐ $1,505 $1.48 ‐ $2.13 $1.57 ‐ $1.72
Oakfield Apartments 696 ‐ 789 $1,079 $1,115 $1.37 ‐ $1.60 na ‐ na
Glenmont Forest 542 ‐ 708 $1,168 $1,285 $1.74 ‐ $2.25 na ‐ na
Privacy World /1 741 ‐ 859 $1,335 $1,430 $1.66 $1.90 $1.66 ‐
The Glen 1,115 ‐ 1,144 $1,816 ‐ $1,960 $1.59 ‐ $1.74 na ‐ na
Winexburg Manor 926 ‐ 1,230 $1,414 ‐ $1,850 $1.27 ‐ $1.74 na ‐ na
Oakfield Apartments 854 ‐ 960 $1,251 $1,326 $1.30 ‐ $1.55 $1.46 ‐ $1.55
Glenmont Forest 728 ‐ 915 $1,329 $1,533 $1.62 ‐ $1.99 $1.62 ‐ $1.76
Privacy World /1 938 1,053 $1,490 $1,610 $1.53 $1.59 na ‐ na
The Glen 1,128 ‐ 1,308 $1,863 ‐ $2,020 $1.47 ‐ $1.73 na ‐ na
Winexburg Manor na ‐ na na ‐ na na ‐ na na ‐ na
Oakfield Apartments 960 ‐ 1,077 $1,485 ‐ $1,517 $1.38 ‐ $1.41 na ‐ na
Glenmont Forest 960 ‐ 1,085 $1,644 ‐ $1,769 $1.56 ‐ $1.84 na ‐ na
Privacy World /1 na na $1,950 $1,970 na na na ‐ na
1. Unit square feet not quoted, but estimated given floorplans.
Source: W‐ZHA
f:\8000s, misc\80087 Glenmont\[Copy of numbers.xlsx]existing glenmont
Rent for ~ 850 SF
Efficiency
1‐Bedroom
2‐Bedroom
3‐Bedroom
Square Feet Rent Rent Per Sq Ft
Square Feet Rent Rent Per Sq Ft
Rent Per Sq FtSquare Feet Rent
Square Feet
Current Asking Rents
Glenmont Area Apartment Communities
Rent Rent Per Sq Ft

‐ 7 ‐
The following table summarizes the asking lease rates among new stick‐built apartment projects in
neighboring communities. Gaithersburg properties offer the first parking space free, the projects in
Rockville (Twinbrook) and Wheaton charge for parking.
Rent for an 850 square foot apartment in these newer projects ranges from $1.90 to $2.13 per square
foot.
Glenmont is most comparable to Wheaton because of location. However, the asking rents for new
product in Glenmont will likely be less than in Wheaton given that Glenmont is farther out and is not an
employment or retail center. It is assumed that new residential product in Glenmont can achieve an
average rent of $1.85 per square foot or an average of $1,570 per month.
Property Location
The Alaire /1 Twinbrook Station na ‐ na na ‐ na na ‐ na
Metro Pointe /2 Wheaton Station 560 586 $1,275 $1,300 $2.22 $2.28
Archstone Wheaton /3 Wheaton na ‐ na na ‐ na na ‐ na
Archstone Gaithersburg /4 Gaithersburg Station na ‐ na na ‐ na na ‐ na
Highland Square /5 Gaithersburg na ‐ na na ‐ na na ‐ na
Property Location Rent ~ 850 SF
The Alaire /1 Twinbrook Station 640 ‐ 1,059 $1,500 ‐ $2,035 $1.82 ‐ $2.26 $2.09
Metro Pointe /2 Wheaton Station 705 ‐ 1121 $1,350 ‐ $1,838 $1.57 ‐ $2.34 $1.95
Archstone Wheaton /3 Wheaton 693 1265 $1,455 $2,044 $1.63 $2.31 $2.13
Archstone Gaithersburg /4 Gaithersburg Station 809 ‐ 1,038 $1,605 $2,029 $1.95 ‐ $2.14 $1.97
Highland Square /5 Gaithersburg 677 ‐ 1,087 $1,395 $1,965 $1.78 ‐ $2.15 $1.90
Property Location
The Alaire /1 Twinbrook Station 1,031 ‐ 1,245 $1,935 ‐ $2,525 $1.85 ‐ $2.12
Metro Pointe /2 Wheaton Station 927 ‐ 1,118 $1,835 ‐ $1,985 $1.72 ‐ $2.01
Archstone Wheaton /3 Wheaton 911 2,511 $1,933 $2,415 $1.76 $1.91
Archstone Gaithersburg /4 Gaithersburg Station 956 1,425 $1,960 $2,448 $1.57 ‐ $1.89
Highland Square /5 Gaithersburg 1,067 1,562 $1,890 $2,590 $1.66 ‐ $1.82
Property Location
The Alaire /1 Twinbrook Station 1,128 ‐ 1,308 $1,658 ‐ $2,237 $1.47 ‐ $1.71
Metro Pointe /2 Wheaton Station 1,411 ‐ 1,411 2,500 ‐ 2,500 $1.77 ‐ $1.77
Archstone Wheaton /3 Wheaton na ‐ na na ‐ na na ‐ na
Archstone Gaithersburg /4 Gaithersburg Station na ‐ na na ‐ na na ‐ na
Highland Square /5 Gaithersburg na ‐ na na ‐ na na ‐ na
1. Parking costs $50 per month in private parking below building and $25 per month in adjacent public parking garage.
2. Parking costs $85 per month per space. Structured parking.
3. Parking costs $70 per month for first space and $85 per month for second space. Structured parking.
4. 1st parking space is free, second parking space is $25 per month, third parking space $85 per month. Surface parking.
5. 1st parking space is free and $50 per month for each additional space. Structured parking.
Source: W‐ZHA
f:\8000s, misc\80087 Glenmont\[Copy of numbers.xlsx]new stick
Current Asking Rents
Stick‐Built Apartment Complexes in Surrounding Communities
Square Feet Rent Rent Per Sq Ft
Efficiency
Square Feet Rent
1‐Bedroom
Rent Per Sq Ft
3‐Bedroom
Square Feet Rent Rent Per Sq Ft
Square Feet Rent Rent Per Sq Ft
2‐Bedroom
‐ 8 ‐
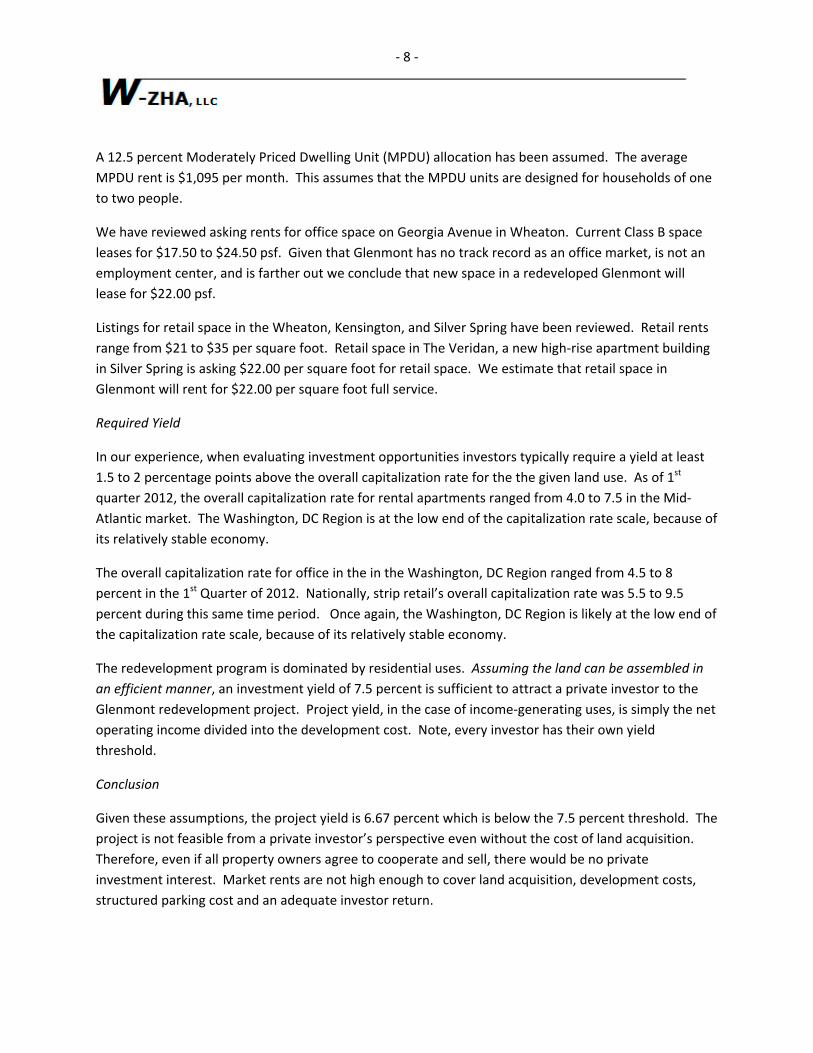
A 12.5 percent Moderately Priced Dwelling Unit (MPDU) allocation has been assumed. The average
MPDU rent is $1,095 per month. This assumes that the MPDU units are designed for households of one
to two people.
We have reviewed asking rents for office space on Georgia Avenue in Wheaton. Current Class B space
leases for $17.50 to $24.50 psf. Given that Glenmont has no track record as an office market, is not an
employment center, and is farther out we conclude that new space in a redeveloped Glenmont will
lease for $22.00 psf.
Listings for retail space in the Wheaton, Kensington, and Silver Spring have been reviewed. Retail rents
range from $21 to $35 per square foot. Retail space in The Veridan, a new high‐rise apartment building
in Silver Spring is asking $22.00 per square foot for retail space. We estimate that retail space in
Glenmont will rent for $22.00 per square foot full service.
Required Yield
In our experience, when evaluating investment opportunities investors typically require a yield at least
1.5 to 2 percentage points above the overall capitalization rate for the the given land use. As of 1st
quarter 2012, the overall capitalization rate for rental apartments ranged from 4.0 to 7.5 in the Mid‐
Atlantic market. The Washington, DC Region is at the low end of the capitalization rate scale, because of
its relatively stable economy.
The overall capitalization rate for office in the in the Washington, DC Region ranged from 4.5 to 8
percent in the 1st Quarter of 2012. Nationally, strip retail’s overall capitalization rate was 5.5 to 9.5
percent during this same time period. Once again, the Washington, DC Region is likely at the low end of
the capitalization rate scale, because of its relatively stable economy.
The redevelopment program is dominated by residential uses. Assuming the land can be assembled in
an efficient manner, an investment yield of 7.5 percent is sufficient to attract a private investor to the
Glenmont redevelopment project. Project yield, in the case of income‐generating uses, is simply the net
operating income divided into the development cost. Note, every investor has their own yield
threshold.
Conclusion
Given these assumptions, the project yield is 6.67 percent which is below the 7.5 percent threshold. The
project is not feasible from a private investor’s perspective even without the cost of land acquisition.
Therefore, even if all property owners agree to cooperate and sell, there would be no private
investment interest. Market rents are not high enough to cover land acquisition, development costs,
structured parking cost and an adequate investor return.

‐ 9 ‐
Units 1,108
Market Rate 87.5% 970
MPDU 12.5% 138
Net Sq Ft /Unit 850
Gross Sq Ft/ Unit 1,012
Rentable Area 941,800
Building Area 1,121,190
GSF Cost/GSF
Demolition 196,381 $4 $785,524
Residential 1,121,190 * $155 = $173,784,524
Office 169,900 * $120 = $20,388,000
Office Tenant Improvements 169,900 * $40 = $6,796,000
Retail (cold & dark) 254,900 * $100 = $25,490,000
Retail Tenant Improvements 254,900 * $40 = $10,196,000
Total 1,545,990 $237,440,048
Structured Parking
Spaces Cost /Sp
2,367 * $18,000 = $42,606,000
Town Square
Sq Ft Cost /Sq Ft
54,450 * $90 = $4,900,500
Total Development Cost (Net of Land Cost) $284,946,548
Assessed Value of Property $37,868,300
Total Cost $322,814,848
Apartments /Month /Sq Ft /Mo
Rent $1,573 $1.85 $18,303,900
MPDU Rent $1,095.00 $1.29 $1,813,320
Vacancy Market ‐‐‐> 5% MPDU ‐‐‐‐> 3% ($969,595)
Net Rent $19,147,625
Parking Income $50.00 /mo 1,163 Spaces $697,800
Other Income 10% $1,914,763
Total Income $21,760,188
Operating Cost /Unit $6,500 ($7,202,000)
Net Operating Income $14,558,188
Office SF/Year
Rent $22.00 $3,476,154
Vacancy 7% ($243,331)
Net Rental Income $3,232,823
Parking Income $50.00 /mo 184 Spaces $110,400
Operating Cost /psf $8.50 ($1,444,150)
Net Operating Income $1,899,073
Retail SF/Year
Rent nnn $22.00 $5,607,800
Vacancy 7% ($392,546)
Net Rent $5,215,254
Other Income 0% $0
Total Income $5,215,254
Operating Cost /psf 3% ($156,458)
Net Operating Income $5,058,796
Total Net Operating Income $21,516,058
Private Investment Prospects Yield = 6.67%
Source: W‐ZHA
f:\8000s, misc\80087 Glenmont\[numbers2.xlsx]Glenmont mixed use
Glenmont Town Center Development Economics
Stick Built with Structured Parking
Development Cost
Net Operating Income

‐ 10 ‐
CONSIDERATION: ALLOW HIGH‐RISE DEVELOPMENT ON THE SITE TO INCREASE DENSITY AND
DRIVE MORE VALUE TO THE LAND
It has been suggested that one way to enhance private investor interest is to allow for higher density
residential development at Glenmont Town Center. Rather than 3‐ to 5‐story buildings, the plan should
allow for 8‐ to 10‐story buildings. The idea is that with more density, the land will become more
valuable.
There are two reasons that allowing high‐rise development on the Site will not resolve feasibility issues.
The first is a cost issue and the second is a market issue. High‐rise construction costs are approximately
20 percent higher than stick‐built construction costs.
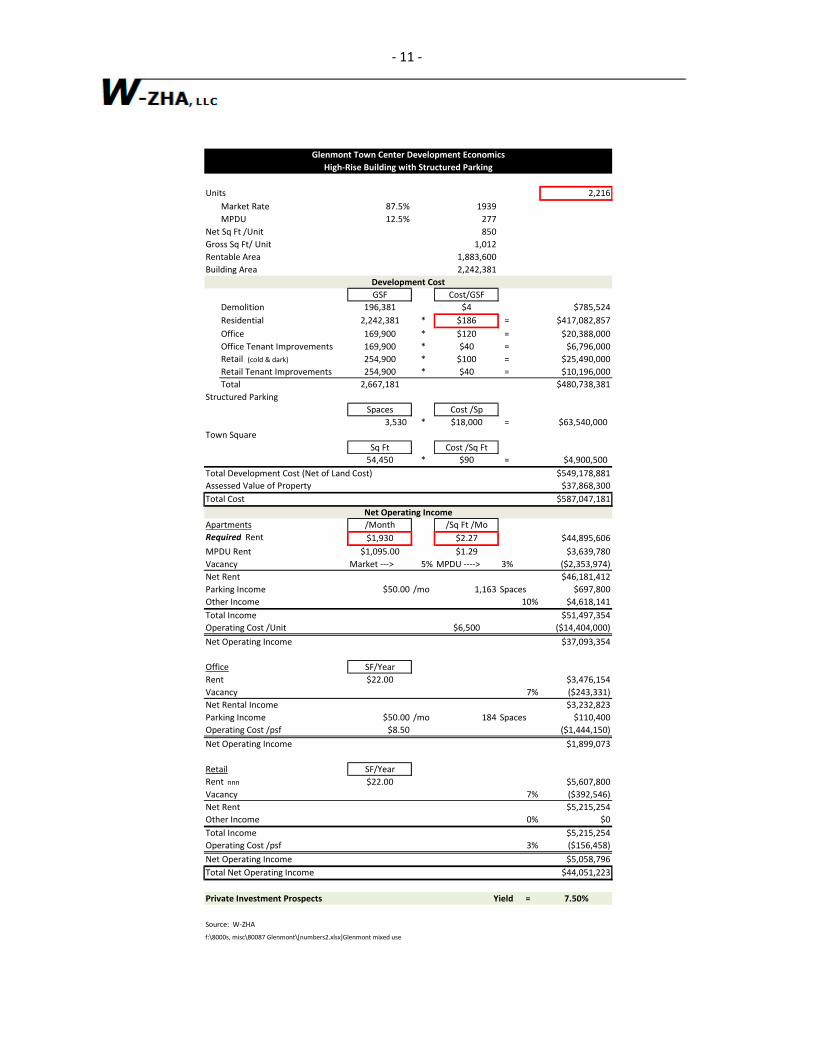
A yield analysis was performed to test the rent required to support the cost of high‐rise assuming the
same unit mix, but double the number of units. To support the increase in cost associated with taller
buildings and the cost of parking and land, an average rental rate of $1,930 per month, or $2.27 per
square foot per month must be achieved. This rent is 23 percent higher than what we consider to be
supportable in Glenmont.
A monthly rent of $1,930 per month is higher than the highest one‐bedroom rent at Metro Pointe and
well above the average rent per square foot for an 850 square foot apartment among new projects in
Wheaton, Twinbrook and Gaithersburg.
‐ 11 ‐
Units 2,216
Market Rate 87.5% 1939
MPDU 12.5% 277
Net Sq Ft /Unit 850
Gross Sq Ft/ Unit 1,012
Rentable Area 1,883,600
Building Area 2,242,381
GSF Cost/GSF
Demolition 196,381 $4 $785,524
Residential 2,242,381 * $186 = $417,082,857
Office 169,900 * $120 = $20,388,000
Office Tenant Improvements 169,900 * $40 = $6,796,000
Retail (cold & dark) 254,900 * $100 = $25,490,000
Retail Tenant Improvements 254,900 * $40 = $10,196,000
Total 2,667,181 $480,738,381
Structured Parking
Spaces Cost /Sp
3,530 * $18,000 = $63,540,000
Town Square
Sq Ft Cost /Sq Ft
54,450 * $90 = $4,900,500
Total Development Cost (Net of Land Cost) $549,178,881
Assessed Value of Property $37,868,300
Total Cost $587,047,181
Apartments /Month /Sq Ft /Mo
Required Rent $1,930 $2.27 $44,895,606
MPDU Rent $1,095.00 $1.29 $3,639,780
Vacancy Market ‐‐‐> 5% MPDU ‐‐‐‐> 3% ($2,353,974)
Net Rent $46,181,412
Parking Income $50.00 /mo 1,163 Spaces $697,800
Other Income 10% $4,618,141
Total Income $51,497,354
Operating Cost /Unit $6,500 ($14,404,000)
Net Operating Income $37,093,354
Office SF/Year
Rent $22.00 $3,476,154
Vacancy 7% ($243,331)
Net Rental Income $3,232,823
Parking Income $50.00 /mo 184 Spaces $110,400
Operating Cost /psf $8.50 ($1,444,150)
Net Operating Income $1,899,073
Retail SF/Year
Rent nnn $22.00 $5,607,800
Vacancy 7% ($392,546)
Net Rent $5,215,254
Other Income 0% $0
Total Income $5,215,254
Operating Cost /psf 3% ($156,458)
Net Operating Income $5,058,796
Total Net Operating Income $44,051,223
Private Investment Prospects Yield = 7.50%
Source: W‐ZHA
f:\8000s, misc\80087 Glenmont\[numbers2.xlsx]Glenmont mixed use
Glenmont Town Center Development Economics
High‐Rise Building with Structured Parking
Development Cost
Net Operating Income

‐ 12 ‐
The level of rent required to make the project feasible is comparable to rents achieved in the high rise
products nearby, which are in Silver Spring.
Silver Spring is a cultural, employment, and retail center. As such, it commands higher rents than
Glenmont.
Property Location
Solaire Metro Apts /1 Silver Spring 536 ‐ 642 $1,549 ‐ $2,000 $2.49 ‐ $2.89
The Cameron /2 Silver Spring 475 475 $1,450 $1,450 $3.05 $3.05
The Portico /3 Silver Spring 576 ‐ 576 $1,605 ‐ $1,605 $2.79 ‐ $2.79
Property Location Rent ~850 SF
Solaire Metro Apts /1 Silver Spring 632 ‐ 868 $1,749 ‐ $2,413 $2.36 ‐ $3.57 $2.59
The Cameron /2 Silver Spring 693 ‐ 1,049 $1,820 ‐ $2,440 $2.33 ‐ $2.70 $2.15
Portico /3Silver Spring 767 767 $1,940 $1,960 $2.53 $2.56 na
Property Location
Solaire Metro Apts /1 Silver Spring 1,000 ‐ 1,500 $2,605 ‐ $3,940 $2.29 ‐ $2.62
The Cameron /2 Silver Spring 964 ‐ 1,453 $2,253 ‐ $2,564 $2.05 ‐ $2.70
Portico /3Silver Spring 1,121 1,137 $2,600 $2,670 $2.32 $2.35
1. Parking costs $125 per month in underground garage.
2. Parking costs $125 per month in underground garage.
3. Parking costs $150 per month.
Source: W‐ZHA
f:\8000s, misc\80087 Glenmont\[Copy of numbers.xlsx]Sheet9
1‐Bedroom
2‐Bedroom
Square Feet Rent Rent Per Sq Ft
Square Feet Rent Rent Per Sq Ft
Square Feet Rent Rent Per Sq Ft
Current Asking Rents
New High‐Rise Apartment Projects
Efficiency

‐ 13 ‐
CONSIDERATION: SUBSIDIZE PUBLIC PARKING INFRASTRUCTURE TO MAKE THE PROJECT FEASIBLE
FROM A PRIVATE INVESTOR’S PERSPECTIVE.
Structured parking is in the best interest of the community as it contributes to “place‐making” by
reducing the need for surface parking lots. Structured parking, however, adds cost to the project and, in
turn, absorbs resources that could be used by the private sector for land acquisition.
In this scenario, it is assumed that all parking and a portion of the land beneath the parking are paid for
by the public sector. A subsidy of approximately $46.6 million or 14 percent of the project’s
development cost is necessary to provide an adequate private investment yield.
While financially feasible, the project is still severely hampered by the complexity of land acquisition.

‐ 14 ‐
31
Units 1,108
Market Rate 87.5% 970
MPDU 12.5% 138
Net Sq Ft /Unit 850
Gross Sq Ft/ Unit 1,012
Rentable Area 941,800
Building Area 1,121,190
GSF Cost/GSF
Demolition 196,381 $4 $785,524
Residential 1,121,190 * $155 = $173,784,524
Office 169,900 * $120 = $20,388,000
Office Tenant Improvements 169,900 * $40 = $6,796,000
Retail (cold & dark) 254,900 * $100 = $25,490,000
Retail Tenant Improvements 254,900 * $40 = $10,196,000
Total 1,545,990 $237,440,048
Structured Parking
Spaces Cost /Sp
2,367 * $0 = $0
Town Square
Sq Ft Cost /Sq Ft
54,450 * $90 = $4,900,500
Total Development Cost (Net of Land Cost) $242,340,548
Assessed Value of Property $33,868,300
Total Cost $276,208,848
Apartments /Month /Sq Ft /Mo
Rent $1,573 $1.85 $18,303,900
MPDU Rent $1,095.00 $1.29 $1,813,320
Vacancy Market ‐‐‐> 5% MPDU ‐‐‐‐> 3% ($969,595)
Net Rent $19,147,625
Parking Income $0.00 /mo 1,163 Spaces $0
Other Income 10% $1,914,763
Total Income $21,062,388
Operating Cost /Unit $6,500 ($7,202,000)
Net Operating Income $13,860,388
Office SF/Year
Rent $22.00 $3,476,154
Vacancy 7% ($243,331)
Net Rental Income $3,232,823
Parking Income $0.00 /mo 184 Spaces $0
Operating Cost /psf $8.50 ($1,444,150)
Net Operating Income $1,788,673
Retail SF/Year
Rent nnn $22.00 $5,607,800
Vacancy 7% ($392,546)
Net Rent $5,215,254
Other Income 0% $0
Total Income $5,215,254
Operating Cost /psf 3% ($156,458)
Net Operating Income $5,058,796
Total Net Operating Income $20,707,858
Private Investment Prospects Yield = 7.50%
Source: W‐ZHA
f:\8000s, misc\80087 Glenmont\[numbers2.xlsx]Glenmont mixed use
Development Economics: Incentive No Structured ParkingCost
Stick Built with Structured Parking
Development Cost
Net Operating Income

‐ 15 ‐
CONSIDERATION: IMPLEMENT THE PROJECT IN PHASES IN ORDER TO MAKE THE PROJECT MORE
MARKETABLE, REDUCE THE NUMBER OF LANDOWNERS, AND REDUCE THE LEVEL OF SUBSIDY
REQUIRED TO MAKE THE PROJECT FEASIBLE.
The assemblage of the seven properties that represent the strip shopping center plus the Country Boy
Market property total 11.4 acres (see map below).
Phase I Properties
Not only are these properties old and obsolete, they represent the core of the project. This land area is
of sufficient size to develop a mixed‐use town center project. Seven interests own this property and its
assessed value is $21.8 million.
The first phase of the Town Center project could be developed on these 11.4 acres while the Shopper’s
Food Warehouse, McDonalds, and other land uses in the “triangle” remain. Over time, as development
economics improve, these out‐parcels can redevelop.
Using the same floor area ratio as proposed in the Vision (1.95 net of Town Square land), the strip
shopping center and Country Boy Market properties could support 954,700 square feet of new mixed‐
use development as well as a Town Square. A development program consisting of 720 dwelling units
and 140,000 square feet of retail has been assumed.
‐ 16 ‐
For purposes of this analysis, this smaller development program is assumed to consist of residential and
retail only, no office space. In the near‐ to mid‐term, it is likely that the residential and retail markets
will be stronger than the office market.
The project’s net operating income is not sufficient to provide the investor a reasonable investment
yield and cover the land, structured parking and development costs.

‐ 17 ‐
Units 720
Market Rate 87.5% 630
MPDU 12.5% 90
Net Sq Ft /Unit 850
Gross Sq Ft/ Unit 1,012
Rentable Area 612,000
Building Area 728,790
GSF Cost/GSF
Demolition 124,469 $4 = $497,876
Residential 728,790 * $155 = $112,962,476
Office 0 * $120 = $0
Office TI 0 * $40 = $0
Retail (cold & dark) 140,000 * $100 = $14,000,000
Retail TI 140,000 * $40 = $5,600,000
Total 868,790 = $133,060,352
Structured Parking
Residential 720 756
Office psf 0 0
Retail psf 140,000 560
Spaces Cost /Sp
1,316 * $18,000 = $23,688,000
Town Square
Sq Ft Cost /Sp
54,450 * $90 = $4,900,500
Total Development Cost (Net of Land Cost) $161,648,852
Assessed Value of Property $21,830,900
Total Cost $183,479,752
Apartments /Month /Sq Ft /Mo
Rent $1,572.50 $1.85 $11,888,100
MPDU Rent $1,095.00 $1.29 $1,182,600
Vacancy Market ‐‐‐> 5% MPDU ‐‐‐‐> 3% ($629,883)
Net Rent $12,440,817
Parking Income $50.00 /mo 756 Spaces $453,600
Other Income 10% $1,244,082
Total Income $14,138,499
Operating Cost /Unit $6,500 ($4,680,000)
Net Operating Income $9,458,499
Retail SF/Year
Rent nnn $22.00 $3,080,000
Vacancy 7% ($215,600)
Net Rent $2,864,400
Other Income 0% $0
Total Income $2,864,400
Operating Cost /psf 3% ($85,932)
Net Operating Income $2,778,468
Total Net Operating Income $12,236,967
Private Investment Prospects Yield = 6.67%
Source: W‐ZHA
f:\8000s, misc\80087 Glenmont\[numbers2.xlsx]smaller
Development Cost
Net Operating Income
Phase I Development Economics
Stick Built with Structured Parking

‐ 18 ‐
A subsidy of $25.5 million would be required to develop the Phase I program. The subsidy represents 9
percent of the land, development, and parking cost for this phase of development.
Units 720
Market Rate 87.5% 630
MPDU 12.5% 90
Net Sq Ft /Unit 850
Gross Sq Ft/ Unit 1,012
Rentable Area 612,000
Building Area 728,790
GSF Cost/GSF
Demolition 124,469 $4 = $497,876
Residential 728,790 * $155 = $112,962,476
Office 0 * $120 = $0
Office TI 0 * $40 = $0
Retail (cold & dark) 140,000 * $100 = $14,000,000
Retail TI 140,000 * $40 = $5,600,000
Total 868,790 = $133,060,352
Structured Parking
Residential 720 756
Office psf 0 0
Retail psf 140,000 560
Spaces Cost /Sp
1,316 * $0 = $0
Town Square
Sq Ft Cost /Sp
54,450 * $90 = $4,900,500
Total Development Cost (Net of Land Cost) $137,960,852
Assessed Value of Property $19,230,900
Total Cost $157,191,752
Apartments /Month /Sq Ft /Mo
Rent $1,572.50 $1.85 $11,888,100
MPDU Rent $1,095.00 $1.29 $1,182,600
Vacancy Market ‐‐‐> 5% MPDU ‐‐‐‐> 3% ($629,883)
Net Rent $12,440,817
Parking Income $0.00 /mo 756 Spaces $0
Other Income 10% $1,244,082
Total Income $13,684,899
Operating Cost /Unit $6,500 ($4,680,000)
Net Operating Income $9,004,899
Retail SF/Year
Rent nnn $22.00 $3,080,000
Vacancy 7% ($215,600)
Net Rent $2,864,400
Other Income 0% $0
Total Income $2,864,400
Operating Cost /psf 3% ($85,932)
Net Operating Income $2,778,468
Total Net Operating Income $11,783,367
Private Investment Prospects Yield = 7.50%
Source: W‐ZHA
f:\8000s, misc\80087 Glenmont\[numbers2.xlsx]smaller
Development Cost
Net Operating Income
Phase I Development Economics: Parking Subsidy
Stick Built with Structured Parking
‐ 19 ‐
LAND ASSEMBLY APPROACHES AND IMPLEMENTATION
Land assembly occurs when there is a higher and better use for the land than what exists today. Before
considering land assembly, an incentive package must be developed that makes the redevelopment of
the Glenmont Shopping Center an attractive investment. The following alternatives assume that
redevelopment makes investment sense.
Market‐Driven
This is how most land assembly occurs in the United States. A private investor independently
purchases and/or options property to allow for redevelopment.
Advantages
Minimizes County expense and time.
Disadvantages
Redevelopment timing is driven by the market, which may result in an
extended timeframe.
A single land owner who is unwilling to sell can make the project infeasible.
Other than land use regulations, the County and community have little
influence on the character of development.
Eminent Domain
Eminent domain has been used as a means to acquire land in redevelopment areas across the
country. Under eminent domain, the jurisdiction seizes private land for a public purpose.
Eminent domain is typically used when public use assets such as roads, utilities, parking garages,
etc. need land for their development.
Eminent domain for economic development purposes typically requires that the properties in
question be blighted. At an assessed value of $2 million per acre, it would be difficult to
consider Glenmont Shopping Center a blighted property. Eminent domain for economic
development purposes is controversial and can result in litigation (see Kelso vs. City of New
London).
Advantages
An independent appraisal determines value.
If eminent domain employed the County controls the land.

‐ 20 ‐
Disadvantages
Eminent domain for economic development purposes can be
controversial and result in litigation.
Condemnation can be time consuming.
Private Land Pooling
The private property owners could form a development company to undertake site
redevelopment. The owners would transfer their property (land and improvements) to the
development company in exchange for a percent interest in the company. The percentage
would likely be based on their share of assessed value and/or the land area. The entity could
be a joint venture, corporation or a limited liability corporation. Either a property owner could
take the lead in development or a Developer could be retained by the development company.
The New Town at Capital City Market in Washington, DC has adopted this approach. This
project has yet to be implemented.
Advantages
Provides unified ownership of the Site.
Landowners take the lead in redevelopment.
Disadvantages
The risk of the hold‐out property owner remains.
It is unlikely that the landowners will recoup their land value upon
redevelopment, which may deter their motivation to align.
The type of development that may be feasible in the near term (surface
parked retail) is not what the community envisions.
It is unlikely that the communities’ Vision for the Site will be realized
under this approach, given market and economic realities.
Public/Private Venture
This approach is similar to the Private Land Pooling approach except the County (or a legal entity
thereof) would form a development corporation. The development corporation would be the
Managing Member of a Limited Liability Corporation (LLC). The County would provide financial
incentives (tax abatement, grants, etc) to make the project economically feasible.
In exchange, the property owners would contribute their property in exchange for a limited
partner interest. The Managing Member would solicit developers and enter into a development

‐ 21 ‐
agreement. The development agreement would ensure 1) that the property owners’ interests
are satisfied and 2) that redevelopment is consistent with the community’s Vision.
The Skyland Shopping Center redevelopment in Washington, DC is an example of this approach.
The National Capital Revitalization Corporation is managing that project.
Advantages
County would initiate the process;
The County could provide a methodology for determining equitable
property value;
Potential for condemnation may exist;
Allows for the use of government incentives to make the project
feasible;
Ensures that the community’s Vision is realized
Disadvantages
Significant County financial incentives will be necessary to attract a
private investor;
This approach will require significant resources to work with the
property owners, structure an equitable business arrangement, solicit
and select a developer, and negotiate a development agreement;
There is still the risk that a property owner will not participate.
Compulsory purchase is controversial and can result in litigation.
Recommended Approach
The Public/Private Venture Approach is the only feasible alternative because subsidy is
necessary. The County must be involved because public/private financing is necessary to make
the Vision a reality. The following steps are recommended to implement the Glenmont Town
Center Plan:
1. Develop a Phase I Site Plan that achieves the Vision and, at the same time, strives to
reduce the costs of development (particularly structured parking). Phase I would only
include the strip shopping center properties and the Country Boys Market property;
2. Identify potential sources of subsidy to make the project an attractive private
investment opportunity;
3. Conduct a Developer Roundtable to present public/private development approach and
receive feedback;

‐ 22 ‐
4. Present to property owners their options with regard to future value of land and how
the County subsidy commitment is a unique, short term opportunity that should
incentivize them to participate.
5. Develop Limited Liability Corporation with business terms that clearly spell out the
County incentive package and existing property owner obligations and rights;
6. Solicit private developers;
7. Enter into a Non‐Profit/Private Development Agreement.