subject: green river basin plan available surface...
TRANSCRIPT

9/13/00 Page 1
SUBJECT: Green River Basin Plan Available Surface Water Determination
PREPARED BY: Meg Frantz and Linda Williams, Boyle Engineering Corporation
Introduction
The Green River Basin spreadsheet model is a tool for identifying flows that are available to Wyoming water users for future development, and evaluating yield and impacts of potential projects at a planning level. The purpose of this task is to analyze historical runs developed during spreadsheet calibration to determine location, quantity, and timing of available flows. The calibration spreadsheets represent conditions in the four sub-basins (Little Snake, Henrys Fork, Blacks Fork, and Green River) under current levels of development for three hydrologic conditions: Dry, Normal, and Wet year water supply.
Background information on the spreadsheet model can be found in other technical memos prepared for this project:
• “Surface Water Data Collection and Study Period Selection” describes how historical Dry, Normal, and Wet years were determined for the purposes of the spreadsheet
• “Surface Water Spreadsheet Model Development” summarizes development of the model
Available Flow
Each basin model is divided into a number of reaches, each composed of several nodes, or water balance points. Reaches are typically defined by gages or confluences, and represent tributary basins or subsections of the mainstem. An output worksheet in each spreadsheet model summarizes monthly flow at the downstream end of each reach, and provides the basis of this analysis.
While simulated flow at the reach terminus indicates estimated amount of water physically present, it does not fully reflect availability. If a downstream diverter has historically diverted the entire stream at its headgate, the water supply at the upper point is not available for future development; it is already needed to meet current requirements.
Available water determination
To determine how much of the physical supply is actually available to future uses, “available water” at a reach terminus was defined as the minimum of the physically available flow at that point, and “available water” at all downstream reaches. Thus available flow must be defined first at the most downstream point, with upstream availability calculated in stream order. These calculations were made on a monthly basis, and annual availability was computed as the sum of monthly availabilities. Note that calculating annual availability in this way yields a different value than applying the same logic to annual flows for each reach. The summation of monthly values is more accurate, reflecting constraints of downstream use on a monthly basis.
FINAL TECHNICAL MEMORANDUM

September 13, 2000 Page 2
Instream flow right considerations
Instream flow rights exert a demand on the river but do not affect physical supply, because the water is not removed from the stream. Thus any reach terminus located immediately upstream of a reach that contained an instream flow right had to be handled specially. That is, available flow at the upstream reach terminus was determined as the minimum of physical flow at that point, and “available water” less the instream flow requirement at the downstream reach terminus.
The two permitted instream flow rights and 32 pending instream flow applications were reviewed for applicability of the special handling described above. (See the technical memorandum “Instream Flows in Wyoming.”) Except for one, all the instream flow rights are located high enough in the basin that they have no upstream reach in the model. The exception is a 1.5-mile long reach of the West Fork New Fork River, under permit #7IF. Available water at the downstream terminus of Reach 8 in the Green River sub-basin spreadsheet was calculated taking the instream flow demand into consideration.
Compact considerations
The spreadsheet models do not contain logic to operate curtailment to meet the state’s obligations under the Upper Colorado River Basin Compact (the Compact). The models were developed to portray historical use over the study period 1971-1998. Never during that time, nor since the Compact was ratified, have diversions been curtailed pursuant to Article IV of the Compact. While the principles under which such administration should be conducted are set forth in the Compact, actual details of their application have not been worked out by the Upper Colorado River Commission. Accordingly, simulation of curtailment was outside the scope of this effort. The models could be used, however, to test the impacts of a future downstream demand representing a Compact delivery obligation.
Article XI of the Compact addresses the division of waters of the Little Snake River, whose tributaries lie on both sides of the Colorado-Wyoming state line, and whose mainstem crosses the boundary numerous times. The Compact identifies a point just below the mouth of Savery Creek, above which pre-Compact rights are not subject to calls emanating from below the point. This administrative nuance does not alter the definition of available flow for new or future uses above the so-called Compact point, however, since they could be regulated to satisfy senior users below the Compact point. Post-Compact rights, including future uses, below the Compact point, “shall be administered on the basis of an interstate priority schedule prepared by the Commission in conformity with priority dates established by the laws of the respective States,” according to Article XI. Therefore, calculation of “available water” in this part of the basin must take into consideration the needs of downstream users in Colorado. To summarize, the method of calculating available water described above, when applied to the Little Snake including the Colorado sections of the river, is in accordance with Article XI of the Compact.
Results
Tables 1 through 12 summarize water availability for the four sub-basins and three hydrologic conditions. Reach outflows, on which water availability is based, are also included as Tables 13 through 24. The latter group of tables comes directly from the models’ Outflow Summary by Reach. The available water determination was executed in a separate spreadsheet, outside the models.

September 13, 2000 Page 3
The tabulations show annual available supply at the bottom of the system for each basin as follows: Dry Condition (af/yr) Normal Condition (af/yr) Wet Condition (af/yr)
Little Snake 189,000 449,000 665,000
Henrys Fork 23,000 60,000 125,000
Blacks Fork 101,000 229,000 422,000
Green River 620,000 1,269,000 1,924,000
Available water supply is a function of timing and location, however, and Tables 1 through 12 provide additional information on availability on a monthly basis, in specific reaches.

September 13, 2000 Page 4
Table 1 Available Flow for Little Snake River Basin and Dry Hydrologic Condition
values in acre-feet Reach Reach Name Jan Feb Mar Apr May Jun Jul Aug Sep Oct Nov Dec Annual
1 North Fork Little Snake River 436. 431. 814. 3582. 7442. 3351. 492. 70. 268. 577. 508. 438. 18409.
2 Middle Fork Little Snake River 679. 668. 1457. 7156. 14971. 6257. 492. 70. 268. 969. 826. 684. 34497.
3 Little Snake River between Middle Fork and South Fork 1406. 1382. 3015. 14810. 31471. 14517. 492. 70. 268. 2006. 1710. 1416. 72563.
4 South Fork Little Snake River 257. 253. 552. 2711. 5617. 2195. 289. 70. 177. 367. 313. 259. 13060. 5 Little Snake River between
South Fork and Roaring Fork Little Snake 1663. 1635. 3567. 17522. 37074. 16665. 492. 70. 268. 2373. 2023. 1675. 85027.
6 Little Snake River between Roaring Fork and Battle Creek 1663. 1635. 8814. 20377. 49645. 21963. 492. 70. 268. 2373. 2023. 1675. 111000.
7 Battle Creek 967. 993. 2070. 8308. 11464. 3490. 429. 70. 268. 1431. 1292. 1109. 31890.
8 Little Snake River between Battle Creek and Slater Creek 2378. 2628. 10885. 28685. 59873. 21963. 492. 70. 268. 3802. 3315. 2783. 137143.
9 Slater Creek 986. 1010. 2022. 7878. 10768. 3119. 318. 70. 268. 1422. 1291. 1119. 30272.
10 Little Snake River between Slater Creek and Savery Creek 2378. 3221. 12906. 36563. 59873. 21963. 492. 70. 268. 3802. 4406. 2966. 148911.
11 Savery Creek 1685. 1712. 3687. 12045. 11530. 3561. 376. 70. 268. 1870. 1937. 1873. 40615. 12 Little Snake River between
Savery Creek and Willow Creek 2378. 3221. 16851. 49518. 59873. 21963. 492. 70. 268. 3802. 4406. 2966. 165810.
13 Willow Creek 134. 145. 264. 911. 973. 0. 112. 82. 94. 195. 181. 141. 3230. 14 Little Snake River between
Willow Creek and Muddy Creek 3644. 4549. 16851. 49518. 59873. 22629. 911. 520. 436. 4425. 5454. 4256. 173067.
15 Muddy Creek 24. 18. 3150. 1560. 1025. 718. 238. 79. 113. 461. 195. 39. 7618. 16 Little Snake River between
Muddy Creek and Little Snake River near Lily, CO gage 4472. 5365. 19805. 49918. 59873. 28243. 2878. 644. 436. 6087. 6620. 5095. 189437.

September 13, 2000 Page 5
Table 2 Available Flow for Little Snake River Basin and Normal Hydrologic Condition
values in acre-feet Reach Reach Name Jan Feb Mar Apr May Jun Jul Aug Sep Oct Nov Dec Annual
1 North Fork Little Snake River 487. 482. 768. 3022. 14166. 12396. 2404. 629. 459. 605. 564. 518. 36500. 2 Middle Fork Little Snake
River 784. 774. 1362. 6001. 28794. 24978. 4451. 1028. 617. 1027. 942. 848. 71608.
3 Little Snake River between Middle Fork and South Fork 1623. 1602. 2819. 12421. 60052. 52683. 10073. 1250. 617. 2126. 1950. 1754. 148971.
4 South Fork Little Snake River 297. 293. 516. 2274. 10847. 9329. 1569. 369. 260. 389. 357. 321. 26822. 5 Little Snake River between
South Fork and Roaring Fork Little Snake 1921. 1895. 3335. 14694. 70882. 61977. 11611. 1250. 617. 2515. 2308. 2076. 175081.
6 Little Snake River between Roaring Fork and Battle Creek 1921. 3294. 11796. 17734. 75301. 75208. 17326. 1250. 617. 2515. 2308. 2076. 211345.
7 Battle Creek 1176. 1181. 2476. 8078. 28733. 19262. 3238. 667. 617. 1434. 1359. 1240. 69462. 8 Little Snake River between
Battle Creek and Slater Creek 3097. 4475. 14272. 25812. 104034. 94470. 18004. 1250. 617. 3949. 3666. 3316. 276963.
9 Slater Creek 1182. 1187. 2403. 7663. 26974. 17985. 2961. 677. 617. 1424. 1354. 1242. 65669. 10 Little Snake River between
Slater Creek and Savery Creek 4242. 5662. 16675. 33474. 130783. 111972. 18004. 1250. 617. 5275. 5020. 4558. 337534.
11 Savery Creek 2026. 1997. 3836. 12621. 34940. 22007. 3854. 1120. 617. 2073. 2101. 2048. 89242. 12 Little Snake River between
Savery Creek and Willow Creek 4242. 7830. 20954. 47384. 160497. 120576. 18004. 1250. 617. 5275. 6134. 4616. 397380.
13 Willow Creek 180. 172. 449. 1289. 2226. 1688. 529. 218. 155. 216. 179. 177. 7478.
14 Little Snake River between Willow Creek and Muddy Creek 5619. 9450. 20954. 53211. 164610. 122097. 20187. 2176. 1117. 5459. 6569. 5945. 417394.
15 Muddy Creek 36. 30. 4765. 2871. 3080. 1180. 518. 132. 101. 400. 551. 109. 13772.
16 Little Snake River between Muddy Creek and Little Snake River near Lily, CO gage 6446. 10246. 24151. 56543. 168774. 127104. 25778. 4734. 2436. 7585. 8449. 6842. 449088.

September 13, 2000 Page 6
Table 3 Available Flow for Little Snake River Basin and Wet Hydrologic Condition
values in acre-feet Reach Reach Name Jan Feb Mar Apr May Jun Jul Aug Sep Oct Nov Dec Annual
1 North Fork Little Snake River 657. 516. 818. 4190. 19920. 19855. 3965. 826. 680. 725. 631. 602. 53386.
2 Middle Fork Little Snake River 1133. 845. 1465. 8407. 40575. 40349. 7673. 1432. 1177. 1275. 1080. 1022. 106432.
3 Little Snake River between Middle Fork and South Fork 2346. 1748. 3032. 17398. 84631. 84445. 16714. 3115. 2448. 2639. 2234. 2115. 222864.
4 South Fork Little Snake River 429. 320. 555. 3185. 15284. 15160. 2794. 522. 445. 483. 409. 387. 39972. 5 Little Snake River between
South Fork and Roaring Fork Little Snake 2775. 2068. 3587. 20583. 99890. 99571. 19478. 3631. 2889. 3122. 2643. 2502. 262740.
6 Little Snake River between Roaring Fork and Battle Creek 2775. 2068. 13301. 24224. 106992. 116728. 28786. 4799. 2889. 3122. 2643. 2502. 310829.
7 Battle Creek 1482. 1272. 2475. 8338. 38864. 27969. 5514. 1228. 1605. 2056. 1658. 1373. 93834. 8 Little Snake River between
Battle Creek and Slater Creek 4257. 3341. 15776. 32561. 145856. 144697. 34300. 4799. 4366. 5178. 4302. 3874. 403306.
9 Slater Creek 1469. 1272. 2402. 7907. 36451. 26169. 5103. 1204. 1583. 2008. 1635. 1367. 88569. 10 Little Snake River between
Slater Creek and Savery Creek 5726. 4613. 18178. 40468. 181986. 170408. 36612. 4799. 4366. 7186. 5937. 5241. 485518.
11 Savery Creek 2230. 2033. 3554. 12296. 48005. 33840. 6678. 1857. 2481. 2913. 2531. 2224. 120640. 12 Little Snake River between
Savery Creek and Willow Creek 5974. 5981. 22288. 54464. 227350. 194067. 36612. 4799. 4366. 7857. 7732. 6221. 577710.
13 Willow Creek 255. 247. 558. 1700. 3139. 2611. 1004. 277. 266. 318. 250. 234. 10860.
14 Little Snake River between Willow Creek and Muddy Creek 7361. 7565. 23748. 63058. 240561. 211738. 42260. 5700. 5118. 8286. 8329. 7416. 631140.
15 Muddy Creek 36. 30. 4765. 2871. 3080. 1180. 518. 132. 101. 400. 551. 109. 13772.
16 Little Snake River between Muddy Creek and Little Snake River near Lily, CO gage 8177. 8373. 29155. 66325. 243117. 215717. 47410. 9398. 8268. 10852. 10250. 8303. 665345.

September 13, 2000 Page 7
Table 4 Available Flow for Henrys Fork Basin and Dry Hydrologic Condition
values in acre-feet Reach Reach Name Jan Feb Mar Apr May Jun Jul Aug Sep Oct Nov Dec Annual
1 Below Henrys Fork near Lonetree (09226000) and Beaver Creek 541. 473. 1000. 868. 1459. 3113. 236. 121. 59. 548. 626. 580. 9624.
2 Beaver Creek 965. 883. 1456. 1331. 1459. 3113. 236. 121. 59. 897. 1048. 1019. 12588.
3 Henrys Fork between Beaver Creek and Burnt Fork 1506. 1356. 2456. 1694. 1459. 3113. 236. 121. 59. 897. 1674. 1599. 16170.
4 Burnt Fork 464. 449. 495. 585. 2030. 2995. 581. 435. 298. 639. 562. 497. 10030.
5 Henrys Fork between Burnt Fork and Birch Creek 1970. 1805. 3049. 2279. 2030. 4004. 581. 435. 298. 1399. 2236. 2096. 22181.
6 Birch Creek 171. 166. 183. 216. 924. 1269. 419. 335. 199. 236. 207. 183. 4507.
7 Henrys Fork between Birch Creek and Henrys Fork near Manila, UT gage (09229500) 2116. 1939. 3231. 2336. 2030. 4004. 581. 435. 298. 1399. 2313. 2224. 22906.
September 13, 2000 Page 8
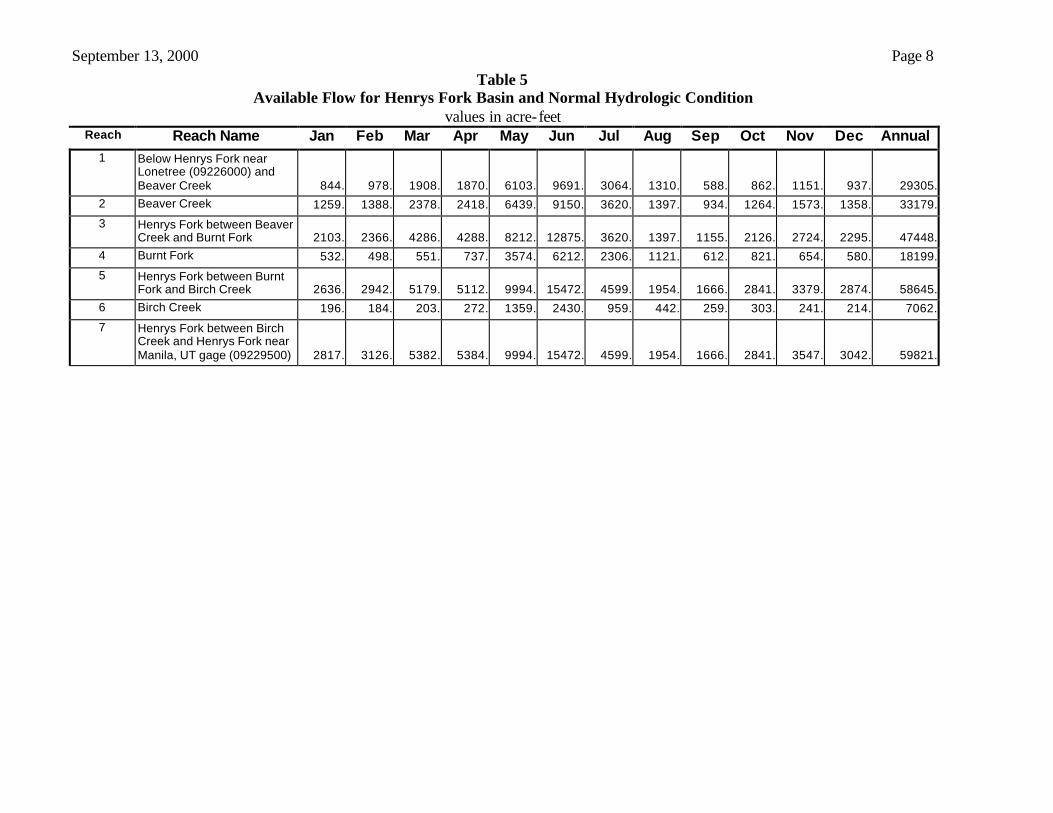
Table 5 Available Flow for Henrys Fork Basin and Normal Hydrologic Condition
values in acre-feet Reach Reach Name Jan Feb Mar Apr May Jun Jul Aug Sep Oct Nov Dec Annual
1 Below Henrys Fork near Lonetree (09226000) and Beaver Creek 844. 978. 1908. 1870. 6103. 9691. 3064. 1310. 588. 862. 1151. 937. 29305.
2 Beaver Creek 1259. 1388. 2378. 2418. 6439. 9150. 3620. 1397. 934. 1264. 1573. 1358. 33179.
3 Henrys Fork between Beaver Creek and Burnt Fork 2103. 2366. 4286. 4288. 8212. 12875. 3620. 1397. 1155. 2126. 2724. 2295. 47448.
4 Burnt Fork 532. 498. 551. 737. 3574. 6212. 2306. 1121. 612. 821. 654. 580. 18199.
5 Henrys Fork between Burnt Fork and Birch Creek 2636. 2942. 5179. 5112. 9994. 15472. 4599. 1954. 1666. 2841. 3379. 2874. 58645.
6 Birch Creek 196. 184. 203. 272. 1359. 2430. 959. 442. 259. 303. 241. 214. 7062.
7 Henrys Fork between Birch Creek and Henrys Fork near Manila, UT gage (09229500) 2817. 3126. 5382. 5384. 9994. 15472. 4599. 1954. 1666. 2841. 3547. 3042. 59821.

September 13, 2000 Page 9
Table 6 Available Flow for Henrys Fork Basin and Wet Hydrologic Condition
values in acre-feet Reach Reach Name Jan Feb Mar Apr May Jun Jul Aug Sep Oct Nov Dec Annual
1 Below Henrys Fork near Lonetree (09226000) and Beaver Creek 1343. 1012. 2405. 2735. 8557. 17944. 8138. 2781. 1586. 1904. 1583. 1244. 51233.
2 Beaver Creek 1760. 1420. 2886. 3668. 11101. 17226. 8992. 3459. 2162. 2301. 1999. 1653. 58627.
3 Henrys Fork between Beaver Creek and Burnt Fork 3103. 2433. 5291. 6403. 15595. 32654. 17072. 6193. 3742. 4205. 3582. 2897. 103169.
4 Burnt Fork 579. 535. 594. 925. 3501. 11749. 7713. 2618. 1359. 1000. 748. 644. 31963.
5 Henrys Fork between Burnt Fork and Birch Creek 3778. 3006. 6343. 7527. 18668. 38708. 20403. 7621. 4742. 5204. 4330. 3542. 123873.
6 Birch Creek 213. 197. 219. 341. 1328. 4454. 2940. 989. 511. 369. 276. 238. 12075.
7 Henrys Fork between Birch Creek and Henrys Fork near Manila, UT gage (09229500) 3992. 3204. 6562. 7868. 18668. 38708. 20403. 7621. 4742. 5286. 4554. 3750. 125358.

September 13, 2000 Page 10
Table 7 Available Flow for Blacks Fork Basin and Dry Hydrologic Condition
values in acre-feet Reach Reach Name Jan Feb Mar Apr May Jun Jul Aug Sep Oct Nov Dec Annual
1 Upper Blacks Fork 775. 1134. 3462. 3180. 4225. 3718. 2049. 840. 644. 1200. 1050. 982. 23260. 2 West Fork of Smiths Fork 331. 506. 1554. 1387. 2696. 1269. 937. 113. 499. 372. 452. 420. 10534.
3 East Fork of Smiths Fork 478. 549. 1108. 1124. 4093. 4766. 2049. 840. 644. 793. 600. 529. 17573. 4 Smiths Fork 848. 1139. 3018. 2794. 4505. 4766. 2049. 840. 644. 1884. 1312. 1016. 24816.
5 Cottonwood Creek 140. 194. 541. 610. 1306. 77. 0. 0. 0. 195. 191. 171. 3424. 6 Smiths Fork between
Cottonwood Creek and Blacks Fork River 988. 1332. 3559. 3404. 5811. 4766. 2049. 840. 644. 2079. 1503. 1186. 28163.
7 Blacks Fork between Smiths Fork and Muddy Creek 1763. 2466. 7021. 6584. 6888. 4766. 2049. 840. 644. 2481. 2433. 2168. 40105.
8 Little Muddy Creek 308. 487. 600. 971. 450. 167. 81. 139. 90. 241. 547. 479. 4560. 9 Upper Muddy Creek 0. 18. 343. 449. 224. 61. 0. 0. 0. 0. 139. 0. 1234.
10 Muddy Creek below Little Muddy Creek 308. 505. 943. 1420. 674. 228. 81. 139. 90. 241. 686. 479. 5794.
11 Blacks Fork between Muddy Creek and Hams Fork 2071. 3071. 10130. 10111. 10946. 5218. 2166. 979. 734. 2772. 3207. 2647. 54053.
12 Hams Fork River 961. 1069. 7058. 7762. 16874. 7251. 1578. 1448. 259. 1668. 1376. 1052. 48355. 13 Blacks Fork between Hams
Fork and Blacks Fork nr Little America gage 2783. 4140. 17188. 17873. 27820. 12469. 3744. 1448. 832. 4439. 4583. 3622. 100941.

September 13, 2000 Page 11
Table 8 Available Flow for Blacks Fork Basin and Normal Hydrologic Condition
values in acre-feet Reach Reach Name Jan Feb Mar Apr May Jun Jul Aug Sep Oct Nov Dec Annual
1 Upper Blacks Fork 1366. 1738. 5347. 7403. 10309. 11695. 4814. 2740. 2111. 1806. 1735. 1249. 52313. 2 West Fork of Smiths Fork 500. 714. 2286. 2584. 4749. 4078. 957. 377. 493. 436. 633. 461. 18266.
3 East Fork of Smiths Fork 704. 751. 1657. 1978. 4964. 10491. 5081. 2546. 1688. 1358. 884. 670. 32772. 4 Smiths Fork 1324. 1625. 4537. 5629. 9858. 11907. 6448. 3047. 2589. 2008. 1738. 1231. 51942.
5 Cottonwood Creek 192. 267. 771. 910. 2362. 1710. 109. 112. 64. 228. 281. 205. 7211. 6 Smiths Fork between
Cottonwood Creek and Blacks Fork River 1516. 1892. 5308. 6538. 12219. 13617. 6557. 3047. 2589. 2236. 2020. 1436. 58976.
7 Blacks Fork between Smiths Fork and Muddy Creek 2882. 3630. 10655. 13941. 21421. 23177. 7073. 3047. 2589. 3188. 3755. 2684. 98042.
8 Little Muddy Creek 469. 718. 2168. 5353. 2348. 1257. 545. 314. 264. 342. 298. 404. 14479. 9 Upper Muddy Creek 111. 369. 2804. 2259. 6962. 2862. 400. 0. 0. 322. 412. 258. 16759.
10 Muddy Creek below Little Muddy Creek 580. 1086. 4972. 7612. 9310. 4119. 945. 314. 264. 664. 710. 663. 31238.
11 Blacks Fork between Muddy Creek and Hams Fork 3626. 4910. 16842. 22773. 33457. 27878. 8176. 3361. 2853. 3914. 4696. 3347. 135832.
12 Hams Fork River 2030. 1988. 6676. 12840. 28300. 24186. 7099. 3041. 3040. 1947. 2099. 1683. 94931. 13 Blacks Fork between Hams
Fork and Blacks Fork nr Little America gage 5656. 6898. 23518. 35613. 61757. 52064. 15276. 5919. 4542. 5861. 6796. 4948. 228847.

September 13, 2000 Page 12
Table 9 Available Flow for Blacks Fork Basin and Wet Hydrologic Condition
values in acre-feet Reach Reach Name Jan Feb Mar Apr May Jun Jul Aug Sep Oct Nov Dec Annual
1 Upper Blacks Fork 1773. 2157. 6603. 7841. 19093. 33210. 14269. 5162. 4046. 3109. 2517. 1755. 101534. 2 West Fork of Smiths Fork 649. 861. 2852. 2963. 6682. 9658. 4581. 1458. 1135. 890. 824. 600. 33152.
3 East Fork of Smiths Fork 849. 898. 1975. 2201. 6335. 18716. 12871. 4720. 3451. 1888. 1319. 882. 56104. 4 Smiths Fork 1654. 1964. 5553. 6185. 15240. 29056. 18554. 8654. 6329. 3775. 2693. 1639. 101297.
5 Cottonwood Creek 289. 346. 1009. 1081. 2367. 4688. 2107. 693. 563. 465. 427. 286. 14322. 6 Smiths Fork between
Cottonwood Creek and Blacks Fork River 1943. 2310. 6562. 7266. 17607. 33744. 20661. 9347. 6892. 4240. 3120. 1926. 115619.
7 Blacks Fork between Smiths Fork and Muddy Creek 3717. 4467. 13164. 15107. 36700. 66954. 30869. 9998. 7379. 6365. 5531. 3680. 203932.
8 Little Muddy Creek 469. 718. 2168. 5353. 2348. 1257. 545. 314. 264. 342. 298. 404. 14479. 9 Upper Muddy Creek 111. 369. 2804. 2259. 6962. 2862. 400. 0. 0. 322. 412. 258. 16759.
10 Muddy Creek below Little Muddy Creek 580. 1086. 4972. 7612. 9310. 4119. 945. 314. 264. 664. 710. 663. 31238.
11 Blacks Fork between Muddy Creek and Hams Fork 4296. 5554. 18704. 22719. 46010. 77087. 33989. 11437. 8803. 7481. 6717. 4372. 247168.
12 Hams Fork River 4065. 5605. 8788. 14857. 46235. 62688. 21846. 6865. 5462. 3104. 3411. 2892. 185820. 13 Blacks Fork between Hams
Fork and Blacks Fork nr Little America gage 7226. 9062. 27492. 32467. 89150. 139775. 55835. 18302. 14265. 10585. 10128. 7264. 421550.

September 13, 2000 Page 13
Table 10 Available Flow for Green River Basin and Dry Hydrologic Condition
values in acre-feet Reach Reach Name Jan Feb Mar Apr May Jun Jul Aug Sep Oct Nov Dec Annual
1 Upper Green River above Warren Bridge 5935. 5567. 6802. 17403. 44939. 58043. 28074. 15919. 12146. 10460. 6890. 6658. 218836.
2 Beaver Creek 335. 305. 639. 2261. 1777. 870. 42. 39. 201. 277. 382. 359. 7487. 3 Green River between Beaver
Creek and Horse Creek 6332. 5956. 7728. 19757. 44939. 58043. 28074. 15919. 12146. 10816. 7429. 7095. 224233.
4 Horse Creek 784. 899. 2417. 2513. 5072. 4289. 2453. 1634. 490. 1113. 1525. 916. 24105. 5 Green River between Horse
Creek and Cottonwood Creek 7116. 6855. 10145. 22269. 48757. 58043. 28074. 15919. 12337. 11929. 8954. 8011. 238409.
6 Cottonwood Creek 856. 1012. 2842. 2638. 1597. 0. 1332. 525. 171. 1381. 1846. 1072. 15271. 7 Green River between
Cottonwood Creek and New Fork River 7972. 7867. 12987. 24907. 49791. 58043. 28074. 15919. 12374. 13311. 10799. 9083. 251126.
8 West Fork New Fork River above Pine Creek 0. 0. 0. 1854. 15535. 29488. 7479. 0. 0. 1679. 617. 0. 56652.
9 Pine Creek 4218. 3460. 4645. 7507. 24818. 39148. 18092. 7787. 5583. 7520. 6270. 5319. 134368. 10 Pole Creek 5090. 4216. 5560. 9478. 24818. 39148. 20696. 8080. 5583. 9537. 7830. 6327. 146362.
11 Boulder Creek 5500. 4624. 6136. 10629. 42618. 66935. 30185. 11231. 7712. 11707. 8723. 6869. 212870. 12 East Fork New Fork River 2957. 3196. 4336. 3941. 21509. 17287. 8446. 4899. 4237. 4259. 4270. 3342. 82678.
13 New Fork River below confluence of West and East Forks 10873. 10550. 14118. 15055. 56830. 66935. 44057. 20146. 15270. 18493. 16228. 12823. 301380.
14 Green River between New Fork River and Piney Creeks 18969. 18586. 27678. 40148. 57368. 66935. 52932. 35771. 27534. 31961. 27341. 22062. 427285.
15 North Piney Creek 1112. 1274. 3429. 1858. 785. 0. 2204. 1629. 193. 1800. 2305. 1324. 17913. 16 Middle Piney Creek 992. 1213. 3496. 1527. 561. 0. 3435. 2653. 299. 1393. 2138. 1188. 18895. 17 South Piney Creek 902. 1035. 2786. 2888. 2800. 1062. 1282. 1426. 408. 1282. 1756. 1055. 18684.
18 Green River between Piney Creeks and LaBarge Creek 21967. 22102. 37383. 46416. 57368. 66935. 52932. 41508. 28513. 36476. 33556. 25624. 470781.
19 LaBarge Creek 2404. 2298. 3595. 4096. 6916. 3872. 2936. 2193. 1950. 2772. 3082. 2759. 38874.
20 Green River between La Barge Creek and Fontenelle Reservoir 24372. 24400. 40602. 50512. 57368. 66935. 52932. 43942. 30622. 39311. 36667. 28393. 496055.
21 Fontenelle Creek 1347. 1297. 1890. 3470. 4231. 2939. 610. 565. 934. 1793. 1607. 1413. 22095.

September 13, 2000 Page 15
Table 10 (continued) Available Flow for Green River Basin and Dry Hydrologic Condition
values in acre-feet
Reach Reach Name Jan Feb Mar Apr May Jun Jul Aug Sep Oct Nov Dec Annual 22 Green River Between
Fontenelle Reservoir and Big Sandy River 50627. 41291. 40602. 61966. 57368. 66935. 52932. 51463. 39138. 47695. 49963. 53297. 613277.
23 Big Sandy River below Farson gage and Green River 1550. 1415. 3170. 2687. 2178. 2582. 2928. 3037. 2950. 3112. 2677. 1892. 30177.
24 Green River between Big Sandy River and Green River near Green River gage 50627. 42740. 44590. 63005. 57368. 66935. 52932. 51463. 39138. 47695. 49963. 53297. 619753.

September 13, 2000 Page 16
Table 11 Available Flow for Green River Basin and Normal Hydrologic Condition
values in acre-feet Reach Reach Name Jan Feb Mar Apr May Jun Jul Aug Sep Oct Nov Dec Annual
1 Upper Green River above Warren Bridge 6689. 6159. 7726. 16510. 59720. 98850. 80423. 29914. 17985. 14043. 9305. 7553. 354878.
2 Beaver Creek 676. 635. 894. 7554. 6966. 3053. 48. 135. 197. 562. 813. 710. 22243. 3 Green River between Beaver
Creek and Horse Creek 7391. 6842. 8780. 24321. 64490. 98850. 80423. 29914. 17985. 14618. 10216. 8300. 372130.
4 Horse Creek 1051. 1101. 2107. 6460. 15209. 16446. 5603. 3742. 1179. 1512. 1826. 1158. 57393. 5 Green River between Horse
Creek and Cottonwood Creek 8442. 7943. 10887. 30782. 78265. 112263. 82733. 31262. 18595. 16129. 12042. 9458. 418801.
6 Cottonwood Creek 1299. 1350. 2752. 8430. 9787. 9073. 6528. 3599. 1256. 2043. 2302. 1430. 49850. 7 Green River between
Cottonwood Creek and New Fork River 9741. 9293. 13639. 39212. 87407. 119973. 87781. 33785. 19595. 18172. 14344. 10888. 463832.
8 West Fork New Fork River above Pine Creek 0. 0. 39. 5777. 21286. 57224. 24194. 7536. 2124. 3047. 954. 0. 122181.
9 Pine Creek 4803. 4577. 5880. 11430. 34534. 98862. 51498. 16933. 10158. 8888. 6607. 5377. 259547. 10 Pole Creek 6169. 5857. 7252. 14054. 34828. 99118. 60537. 19678. 10158. 9275. 8057. 6754. 281736.
11 Boulder Creek 7262. 6806. 8348. 16319. 59468. 164908. 86225. 27205. 15343. 13019. 9694. 8022. 422619. 12 East Fork New Fork River 3188. 3237. 4597. 7165. 32042. 46727. 20547. 7246. 5110. 7659. 6468. 4232. 148218.
13 New Fork River below confluence of West and East Forks 12790. 12531. 16639. 27633. 80235. 181813. 116202. 39376. 23239. 25771. 21068. 15347. 572643.
14 Green River between New Fork River and Piney Creeks 22585. 21920. 30597. 67358. 163844. 246144. 196206. 73300. 42759. 43969. 35609. 26307. 970598.
15 North Piney Creek 1098. 1239. 2534. 4341. 4520. 8033. 8791. 5483. 1269. 1739. 2139. 1280. 42466. 16 Middle Piney Creek 756. 957. 2268. 3711. 2335. 3786. 8835. 6373. 1487. 1017. 1714. 906. 34147. 17 South Piney Creek 1207. 1265. 2425. 7428. 12187. 10004. 464. 2233. 254. 1736. 2100. 1331. 42636.
18 Green River between Piney Creeks and LaBarge Creek 25639. 25376. 37819. 82833. 163844. 246144. 196206. 88331. 46539. 48767. 41698. 29860. 1033054.
19 LaBarge Creek 3215. 3033. 4085. 7269. 13312. 9118. 6639. 4401. 3885. 4646. 4193. 3518. 67314.
20 Green River between La Barge Creek and Fontenelle Reservoir 28854. 28409. 41903. 90102. 163844. 246144. 196206. 93447. 51012. 53667. 45962. 33405. 1072953.
21 Fontenelle Creek 1643. 1537. 2084. 5729. 12740. 12740. 4518. 2062. 1765. 2086. 1925. 1751. 50583.

September 13, 2000 Page 18
Table 11 (continued) Available Flow for Green River Basin and Normal Hydrologic Condition
values in acre-feet
Reach Reach Name Jan Feb Mar Apr May Jun Jul Aug Sep Oct Nov Dec Annual 22 Green River Between
Fontenelle Reservoir and Big Sandy River 56650. 56499. 65350. 95495. 163844. 246144. 196206. 105392. 61884. 59142. 55769. 54215. 1216590.
23 Big Sandy River below Farson gage and Green River 1980. 2034. 4730. 6111. 4234. 6747. 6033. 5123. 4542. 3822. 3171. 2484. 51011.
24 Green River between Big Sandy River and Green River near Green River gage 58891. 59204. 73947. 99523. 163844. 251899. 214389. 112609. 66028. 59142. 55769. 54255. 1269499.

September 13, 2000 Page 19
Table 12 Available Flow for Green River Basin and Wet Hydrologic Condition
values in acre-feet Reach Reach Name Jan Feb Mar Apr May Jun Jul Aug Sep Oct Nov Dec Annual
1 Upper Green River above Warren Bridge 7632. 6557. 8645. 16682. 82151. 179777. 94945. 42993. 23604. 11568. 9572. 9557. 493682.
2 Beaver Creek 723. 646. 877. 9492. 16816. 7275. 1228. 638. 348. 702. 913. 810. 40467. 3 Green River between Beaver
Creek and Horse Creek 8418. 7285. 9937. 26213. 95856. 183091. 94945. 42993. 23910. 12427. 10633. 10403. 526110.
4 Horse Creek 1248. 1322. 3731. 6418. 22623. 31328. 10557. 6290. 3109. 2571. 2328. 1132. 92658. 5 Green River between Horse
Creek and Cottonwood Creek 9667. 8607. 13667. 32631. 116449. 211532. 102314. 46854. 26812. 14998. 12961. 11535. 608028.
6 Cottonwood Creek 1294. 1442. 4508. 12234. 19033. 24265. 16016. 7683. 3902. 2985. 2790. 1284. 97436. 7 Green River between
Cottonwood Creek and New Fork River 10961. 10048. 18176. 44866. 134569. 234500. 116898. 53446. 30622. 17982. 15751. 12819. 700637.
8 West Fork New Fork River above Pine Creek 376. 537. 1451. 9676. 21227. 73459. 46053. 13197. 7022. 5134. 3492. 1092. 182717.
9 Pine Creek 6218. 5813. 7292. 15574. 37566. 124681. 91686. 28635. 15055. 10975. 9145. 6934. 359575. 10 Pole Creek 8165. 7561. 8848. 18843. 43672. 126058. 108776. 35334. 15055. 12209. 10504. 8768. 403794.
11 Boulder Creek 9448. 9164. 10948. 22327. 69011. 206329. 154498. 49157. 24758. 15568. 11922. 9924. 593052. 12 East Fork New Fork River 2590. 1850. 6723. 8598. 31331. 85624. 18685. 4659. 5067. 7389. 5308. 4011. 181835.
13 New Fork River below confluence of West and East Forks 13607. 12003. 23205. 36400. 80518. 303150. 156347. 54412. 31838. 27207. 20962. 16785. 776433.
14 Green River between New Fork River and Piney Creeks 24696. 22216. 42209. 81345. 214246. 520231. 273410. 108286. 62924. 45501. 37010. 29676. 1461752.
15 North Piney Creek 1387. 1554. 5142. 2552. 6330. 21756. 16382. 9059. 4735. 3277. 2656. 1229. 76060. 16 Middle Piney Creek 1131. 1322. 5096. 1495. 2798. 14140. 13315. 9123. 4681. 2695. 2258. 879. 58934. 17 South Piney Creek 1436. 1521. 4299. 7373. 21350. 23087. 2666. 5132. 2480. 2958. 2679. 1301. 76282.
18 Green River between Piney Creeks and LaBarge Creek 28644. 26608. 56741. 92758. 228370. 520231. 307332. 132680. 75892. 54809. 44760. 33139. 1601962.
19 LaBarge Creek 3268. 3459. 5894. 9530. 25619. 22859. 10135. 8637. 6493. 4723. 3912. 2903. 107432.
20 Green River between La Barge Creek and Fontenelle Reservoir 31912. 30067. 62635. 102288. 228370. 520231. 318376. 140233. 81387. 59707. 47877. 36075. 1659158.
21 Fontenelle Creek 1792. 1628. 2520. 9443. 23982. 26841. 7484. 3402. 2854. 2072. 1858. 1710. 85586.

September 13, 2000 Page 21
Table 12 (continued) Available Flow for Green River Basin and Wet Hydrologic Condition
values in acre-feet
Reach Reach Name Jan Feb Mar Apr May Jun Jul Aug Sep Oct Nov Dec Annual 22 Green River Between
Fontenelle Reservoir and Big Sandy River 55141. 53517. 77604. 118211. 228370. 520231. 345100. 140233. 81387. 79281. 47877. 55499. 1802451.
23 Big Sandy River below Farson gage and Green River 2232. 2192. 9553. 12503. 8413. 19093. 12192. 6503. 5445. 4322. 3995. 2623. 89067.
24 Green River between Big Sandy River and Green River near Green River gage 57303. 55888. 91293. 140212. 261167. 537167. 345100. 140233. 81387. 92410. 64343. 57857. 1924360.

September 13, 2000 Page 22
Table 13 Reach Outflow for Little Snake River Basin and Dry Hydrologic Condition
values in acre-feet Reach Reach Name Jan Feb Mar Apr May Jun Jul Aug Sep Oct Nov Dec Annual
1 North Fork Little Snake River 436. 431. 814. 3582. 7442. 3351. 772. 410. 338. 577. 508. 438. 19099.
2 Middle Fork Little Snake River 679. 668. 1457. 7156. 14971. 6257. 1081. 579. 472. 969. 826. 684. 35799.
3 Little Snake River between Middle Fork and South Fork 1406. 1382. 3015. 14810. 31471. 14517. 3359. 1500. 1013. 2006. 1710. 1416. 77606.
4 South Fork Little Snake River 257. 253. 552. 2711. 5617. 2195. 289. 200. 177. 367. 313. 259. 13190. 5 Little Snake River between
South Fork and Roaring Fork Little Snake 1663. 1635. 3567. 17522. 37074. 16665. 3616. 1695. 1189. 2373. 2023. 1675. 90696.
6 Little Snake River between Roaring Fork and Battle Creek 1663. 1635. 8814. 20377. 49645. 25381. 4876. 1503. 1165. 2373. 2023. 1675. 121132.
7 Battle Creek 967. 993. 2070. 8308. 11464. 3490. 429. 236. 363. 1431. 1292. 1109. 32151.
8 Little Snake River between Battle Creek and Slater Creek 2631. 2628. 10885. 28685. 61109. 28871. 5305. 1739. 1528. 3805. 3315. 2783. 153283.
9 Slater Creek 986. 1010. 2022. 7878. 10768. 3119. 318. 273. 415. 1422. 1291. 1119. 30622.
10 Little Snake River between Slater Creek and Savery Creek 3617. 3638. 12906. 36563. 71680. 31356. 5188. 1942. 1936. 5226. 4606. 3902. 182560.
11 Savery Creek 1685. 1712. 3687. 12045. 11530. 3561. 376. 499. 724. 1870. 1937. 1873. 41500. 12 Little Snake River between
Savery Creek and Willow Creek 2378. 3221. 16856. 49518. 69118. 21963. 492. 70. 268. 3802. 4406. 2966. 175060.
13 Willow Creek 134. 145. 264. 911. 973. 0. 112. 82. 94. 195. 181. 141. 3230. 14 Little Snake River between
Willow Creek and Muddy Creek 3644. 4549. 16851. 49518. 70123. 22629. 911. 520. 500. 4425. 5454. 4256. 183380.
15 Muddy Creek 24. 18. 3150. 1560. 1025. 718. 238. 79. 113. 461. 195. 39. 7618. 16 Little Snake River between
Muddy Creek and Little Snake River near Lily, CO gage 4472. 5365. 19805. 49918. 59873. 28243. 2878. 644. 436. 6087. 6620. 5095. 189437.

September 13, 2000 Page 23
Table 14 Reach Outflow for Little Snake River Basin and Normal Hydrologic Condition
values in acre-feet Reach Reach Name Jan Feb Mar Apr May Jun Jul Aug Sep Oct Nov Dec Annual
1 North Fork Little Snake River 487. 482. 768. 3022. 14166. 12396. 2404. 629. 459. 605. 564. 518. 36500. 2 Middle Fork Little Snake
River 784. 774. 1362. 6001. 28794. 24978. 4451. 1028. 707. 1027. 942. 848. 71697.
3 Little Snake River between Middle Fork and South Fork 1623. 1602. 2819. 12421. 60052. 52683. 10073. 2277. 1521. 2126. 1950. 1754. 150901.
4 South Fork Little Snake River 297. 293. 516. 2274. 10847. 9329. 1569. 369. 260. 389. 357. 321. 26822. 5 Little Snake River between
South Fork and Roaring Fork Little Snake 1921. 1895. 3335. 14694. 70882. 61977. 11611. 2641. 1779. 2515. 2308. 2076. 177633.
6 Little Snake River between Roaring Fork and Battle Creek 1921. 3294. 11796. 17734. 75301. 75208. 17326. 2605. 1765. 2515. 2308. 2076. 213847.
7 Battle Creek 1176. 1181. 2476. 8078. 28733. 19262. 3238. 667. 695. 1434. 1359. 1240. 69540. 8 Little Snake River between
Battle Creek and Slater Creek 3097. 4475. 14272. 25812. 104034. 94470. 20563. 3272. 2460. 3949. 3666. 3316. 283386.
9 Slater Creek 1182. 1187. 2403. 7663. 26974. 17985. 2961. 677. 720. 1424. 1354. 1242. 65771. 10 Little Snake River between
Slater Creek and Savery Creek 4279. 5662. 16675. 33474. 130783. 111972. 23104. 3876. 3151. 5373. 5020. 4558. 347927.
11 Savery Creek 2026. 1997. 3836. 12621. 34940. 22007. 3854. 1120. 1212. 2073. 2101. 2048. 89836. 12 Little Snake River between
Savery Creek and Willow Creek 4242. 7830. 20959. 47384. 160497. 120576. 18004. 1250. 617. 5275. 6134. 4616. 397385.
13 Willow Creek 180. 172. 449. 1289. 2226. 1688. 529. 218. 155. 216. 179. 177. 7478.
14 Little Snake River between Willow Creek and Muddy Creek 5619. 9450. 20954. 53211. 164610. 122097. 20187. 2176. 1117. 5459. 6569. 5945. 417394.
15 Muddy Creek 36. 30. 4765. 2871. 3080. 1180. 518. 132. 101. 400. 551. 109. 13772.
16 Little Snake River between Muddy Creek and Little Snake River near Lily, CO gage 6446. 10246. 24151. 56543. 168774. 127104. 25778. 4734. 2436. 7585. 8449. 6842. 449088.

September 13, 2000 Page 24
Table 15 Reach Outflow for Little Snake River Basin and Wet Hydrologic Condition
values in acre-feet Reach Reach Name Jan Feb Mar Apr May Jun Jul Aug Sep Oct Nov Dec Annual
1 North Fork Little Snake River 657. 516. 818. 4190. 19920. 19855. 3965. 826. 680. 725. 631. 602. 53386 2 Middle Fork Little Snake
River 1133. 845. 1465. 8407. 40575. 40349. 7673. 1432. 1177. 1275. 1080. 1022. 106432
3 Little Snake River between Middle Fork and South Fork 2346. 1748. 3032. 17398. 84631. 84445. 16714. 3115. 2448. 2639. 2234. 2115. 222864
4 South Fork Little Snake River 429. 320. 555. 3185. 15284. 15160. 2794. 522. 445. 483. 409. 387. 39972 5 Little Snake River between
South Fork and Roaring Fork Little Snake 2775. 2068. 3587. 20583. 99890. 99571. 19478. 3631. 2892. 3122. 2643. 2502. 262742
6 Little Snake River between Roaring Fork and Battle Creek 2775. 2068. 13301. 24224. 106992. 116728. 28786. 5591. 2889. 3122. 2643. 2502. 311621
7 Battle Creek 1482. 1272. 2475. 8338. 38864. 27969. 5514. 1228. 1605. 2056. 1658. 1373. 93834 8 Little Snake River between
Battle Creek and Slater Creek 4257. 3341. 15776. 32561. 145856. 144697. 34300. 6819. 4494. 5178. 4302. 3874. 405455
9 Slater Creek 1469. 1272. 2402. 7907. 36451. 26169. 5103. 1204. 1583. 2008. 1635. 1367. 88569 10 Little Snake River between
Slater Creek and Savery Creek 5726. 4613. 18178. 40468. 181986. 170408. 38996. 7948. 6072. 7186. 5937. 5241. 492757
11 Savery Creek 2230. 2033. 3554. 12296. 48005. 33840. 6678. 1857. 2481. 2913. 2531. 2224. 120640 12 Little Snake River between
Savery Creek and Willow Creek 5974. 5981. 22288. 54464. 227350. 194067. 36612. 4799. 4366. 7857. 7732. 6221. 577710
13 Willow Creek 255. 247. 558. 1700. 3139. 2611. 1004. 277. 266. 318. 250. 234. 10860
14 Little Snake River between Willow Creek and Muddy Creek 7361. 7565. 23748. 63058. 240561. 211738. 42260. 5700. 5118. 8286. 8329. 7416. 631140
15 Muddy Creek 36. 30. 4765. 2871. 3080. 1180. 518. 132. 101. 400. 551. 109. 13772
16 Little Snake River between Muddy Creek and Little Snake River near Lily, CO gage 8177. 8373. 29155. 66325. 243117. 215717. 47410. 9398. 8268. 10852. 10250. 8303. 665345

September 13, 2000 Page 25
Table 16 Reach Outflow for Henrys Fork Basin and Dry Hydrologic Condition
values in acre-feet Reach Reach Name Jan Feb Mar Apr May Jun Jul Aug Sep Oct Nov Dec Annual
1 Below Henrys Fork near Lonetree (09226000) and Beaver Creek 541. 473. 1000. 868. 4834. 4918. 1319. 767. 518. 548. 626. 580. 16992.
2 Beaver Creek 965. 883. 1456. 1331. 5129. 4760. 1781. 1083. 806. 964. 1048. 1019. 21226.
3 Henrys Fork between Beaver Creek and Burnt Fork 1506. 1356. 2456. 1694. 1459. 3113. 236. 121. 59. 897. 1674. 1599. 16170.
4 Burnt Fork 464. 449. 495. 585. 2413. 2995. 820. 830. 426. 639. 562. 497. 11174.
5 Henrys Fork between Burnt Fork and Birch Creek 1970. 1805. 3049. 2279. 3792. 5730. 785. 885. 387. 1536. 2236. 2096. 26550.
6 Birch Creek 171. 166. 183. 216. 924. 1269. 419. 335. 199. 236. 207. 183. 4507.
7 Henrys Fork between Birch Creek and Henrys Fork near Manila, UT gage (09229500) 2116. 1939. 3231. 2336. 2030. 4004. 581. 435. 298. 1399. 2313. 2224. 22906.

September 13, 2000 Page 26
Table 17 Reach Outflow for Henrys Fork Basin and Normal Hydrologic Condition
values in acre-feet Reach Reach Name Jan Feb Mar Apr May Jun Jul Aug Sep Oct Nov Dec Annual
1 Below Henrys Fork near Lonetree (09226000) and Beaver Creek 844. 978. 1908. 1870. 6103. 9691. 3064. 1310. 588. 862. 1151. 937. 29305.
2 Beaver Creek 1259. 1388. 2378. 2418. 6439. 9150. 3751. 1984. 934. 1264. 1573. 1358. 33897.
3 Henrys Fork between Beaver Creek and Burnt Fork 2103. 2366. 4286. 4288. 8212. 12875. 3620. 1397. 1155. 2126. 2724. 2295. 47448.
4 Burnt Fork 532. 498. 551. 737. 3574. 6212. 2306. 1121. 612. 821. 654. 580. 18199.
5 Henrys Fork between Burnt Fork and Birch Creek 2636. 2942. 5179. 5112. 11693. 18767. 5676. 2453. 1689. 2947. 3379. 2874. 65347.
6 Birch Creek 196. 184. 203. 272. 1359. 2430. 959. 442. 259. 303. 241. 214. 7062.
7 Henrys Fork between Birch Creek and Henrys Fork near Manila, UT gage (09229500) 2817. 3126. 5382. 5384. 9994. 15472. 4599. 1954. 1666. 2841. 3547. 3042. 59821.
September 13, 2000 Page 27
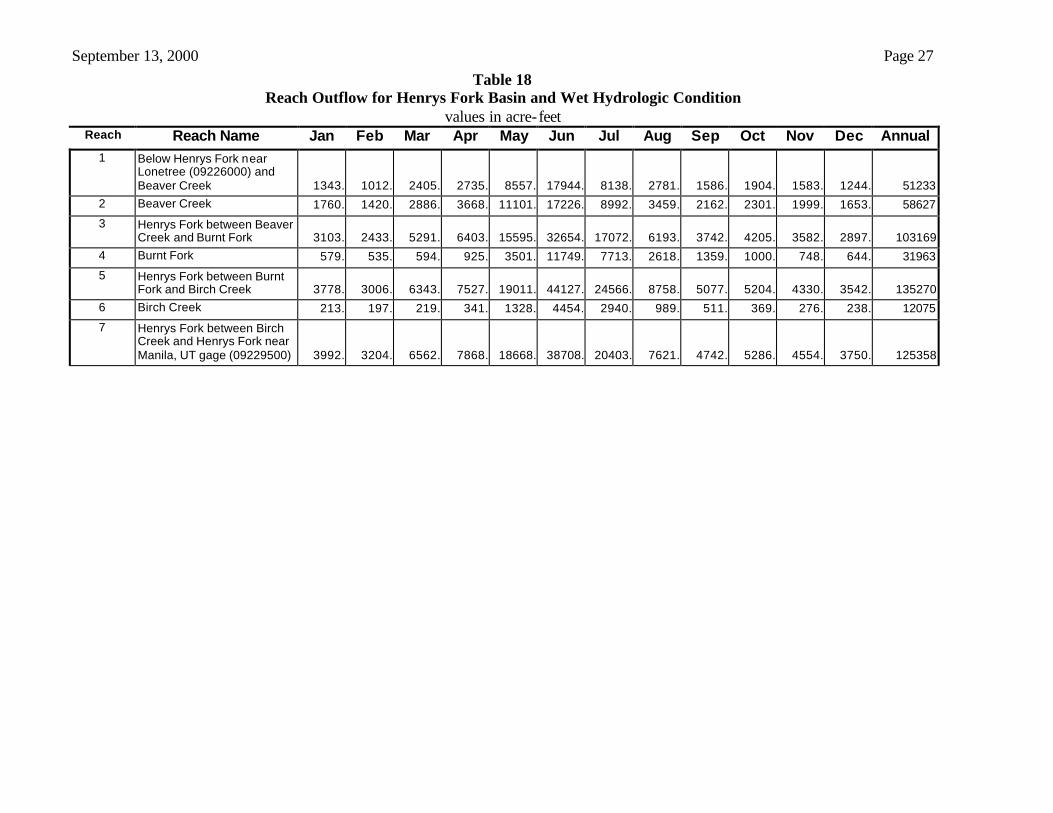
Table 18 Reach Outflow for Henrys Fork Basin and Wet Hydrologic Condition
values in acre-feet Reach Reach Name Jan Feb Mar Apr May Jun Jul Aug Sep Oct Nov Dec Annual
1 Below Henrys Fork near Lonetree (09226000) and Beaver Creek 1343. 1012. 2405. 2735. 8557. 17944. 8138. 2781. 1586. 1904. 1583. 1244. 51233
2 Beaver Creek 1760. 1420. 2886. 3668. 11101. 17226. 8992. 3459. 2162. 2301. 1999. 1653. 58627
3 Henrys Fork between Beaver Creek and Burnt Fork 3103. 2433. 5291. 6403. 15595. 32654. 17072. 6193. 3742. 4205. 3582. 2897. 103169
4 Burnt Fork 579. 535. 594. 925. 3501. 11749. 7713. 2618. 1359. 1000. 748. 644. 31963
5 Henrys Fork between Burnt Fork and Birch Creek 3778. 3006. 6343. 7527. 19011. 44127. 24566. 8758. 5077. 5204. 4330. 3542. 135270
6 Birch Creek 213. 197. 219. 341. 1328. 4454. 2940. 989. 511. 369. 276. 238. 12075
7 Henrys Fork between Birch Creek and Henrys Fork near Manila, UT gage (09229500) 3992. 3204. 6562. 7868. 18668. 38708. 20403. 7621. 4742. 5286. 4554. 3750. 125358

September 13, 2000 Page 28
Table 19 Reach Outflow for Blacks Fork Basin and Dry Hydrologic Condition
values in acre-feet Reach Reach Name Jan Feb Mar Apr May Jun Jul Aug Sep Oct Nov Dec Annual
1 Upper Blacks Fork 775. 1134. 3462. 3180. 4225. 3718. 2325. 1234. 672. 1200. 1050. 982. 23957. 2 West Fork of Smiths Fork 331. 506. 1554. 1387. 2696. 1269. 937. 113. 499. 372. 452. 420. 10534.
3 East Fork of Smiths Fork 478. 549. 1108. 1124. 4093. 5489. 3426. 1424. 1174. 793. 600. 529. 20786. 4 Smiths Fork 848. 1139. 3018. 2794. 4505. 4936. 4252. 3363. 2127. 1884. 1312. 1016. 31195.
5 Cottonwood Creek 140. 194. 541. 610. 1306. 77. 0. 0. 0. 195. 191. 171. 3424. 6 Smiths Fork between
Cottonwood Creek and Blacks Fork River 988. 1332. 3559. 3404. 5811. 5013. 4252. 3363. 2127. 2079. 1503. 1186. 34620.
7 Blacks Fork between Smiths Fork and Muddy Creek 1763. 2466. 7021. 6584. 6888. 4766. 2049. 840. 644. 2481. 2433. 2168. 40105.
8 Little Muddy Creek 455. 487. 600. 971. 450. 167. 242. 327. 155. 301. 547. 633. 5335. 9 Upper Muddy Creek 0. 18. 343. 449. 224. 61. 0. 0. 0. 0. 139. 0. 1234.
10 Muddy Creek below Little Muddy Creek 308. 505. 943. 1420. 674. 228. 81. 139. 90. 241. 686. 479. 5794.
11 Blacks Fork between Muddy Creek and Hams Fork 2071. 3071. 10130. 10111. 10946. 5218. 2166. 979. 734. 2772. 3207. 2647. 54053.
12 Hams Fork River 961. 1069. 7058. 7762. 16874. 7251. 1578. 1905. 259. 1668. 1376. 1052. 48812. 13 Blacks Fork between Hams
Fork and Blacks Fork nr Little America gage 2783. 4140. 17188. 17873. 27820. 12469. 3744. 1448. 832. 4439. 4583. 3622. 100941.

September 13, 2000 Page 29
Table 20 Reach Outflow for Blacks Fork Basin and Normal Hydrologic Condition
values in acre-feet Reach Reach Name Jan Feb Mar Apr May Jun Jul Aug Sep Oct Nov Dec Annual
1 Upper Blacks Fork 1366. 1738. 5347. 7403. 10309. 11695. 4814. 2740. 2111. 1806. 1735. 1249. 52313. 2 West Fork of Smiths Fork 500. 714. 2286. 2584. 4749. 4078. 957. 377. 493. 436. 633. 461. 18266.
3 East Fork of Smiths Fork 704. 751. 1657. 1978. 4964. 10491. 5081. 2546. 1688. 1358. 884. 670. 32772. 4 Smiths Fork 1324. 1625. 4537. 5629. 9858. 11907. 6448. 4072. 2728. 2008. 1738. 1231. 53105.
5 Cottonwood Creek 192. 267. 771. 910. 2362. 1710. 109. 112. 64. 228. 281. 205. 7211. 6 Smiths Fork between
Cottonwood Creek and Blacks Fork River 1516. 1892. 5308. 6538. 12219. 13617. 6557. 4184. 2793. 2236. 2020. 1436. 60317.
7 Blacks Fork between Smiths Fork and Muddy Creek 2882. 3630. 10655. 13941. 21421. 23177. 7073. 3047. 2589. 3188. 3755. 2684. 98042.
8 Little Muddy Creek 469. 718. 2168. 5353. 2348. 1257. 545. 473. 378. 342. 298. 404. 14753. 9 Upper Muddy Creek 111. 369. 2804. 2259. 6962. 2862. 400. 0. 0. 322. 412. 258. 16759.
10 Muddy Creek below Little Muddy Creek 580. 1086. 4972. 7612. 9310. 4119. 945. 314. 264. 664. 710. 663. 31238.
11 Blacks Fork between Muddy Creek and Hams Fork 3626. 4910. 16842. 22773. 33457. 27878. 8176. 3361. 2853. 3914. 4696. 3347. 135832.
12 Hams Fork River 2030. 1988. 6676. 12840. 28300. 24186. 7099. 3041. 3040. 1947. 2099. 1683. 94931. 13 Blacks Fork between Hams
Fork and Blacks Fork nr Little America gage 5656. 6898. 23518. 35613. 61757. 52064. 15276. 5919. 4542. 5861. 6796. 4948. 228847.
September 13, 2000 Page 30
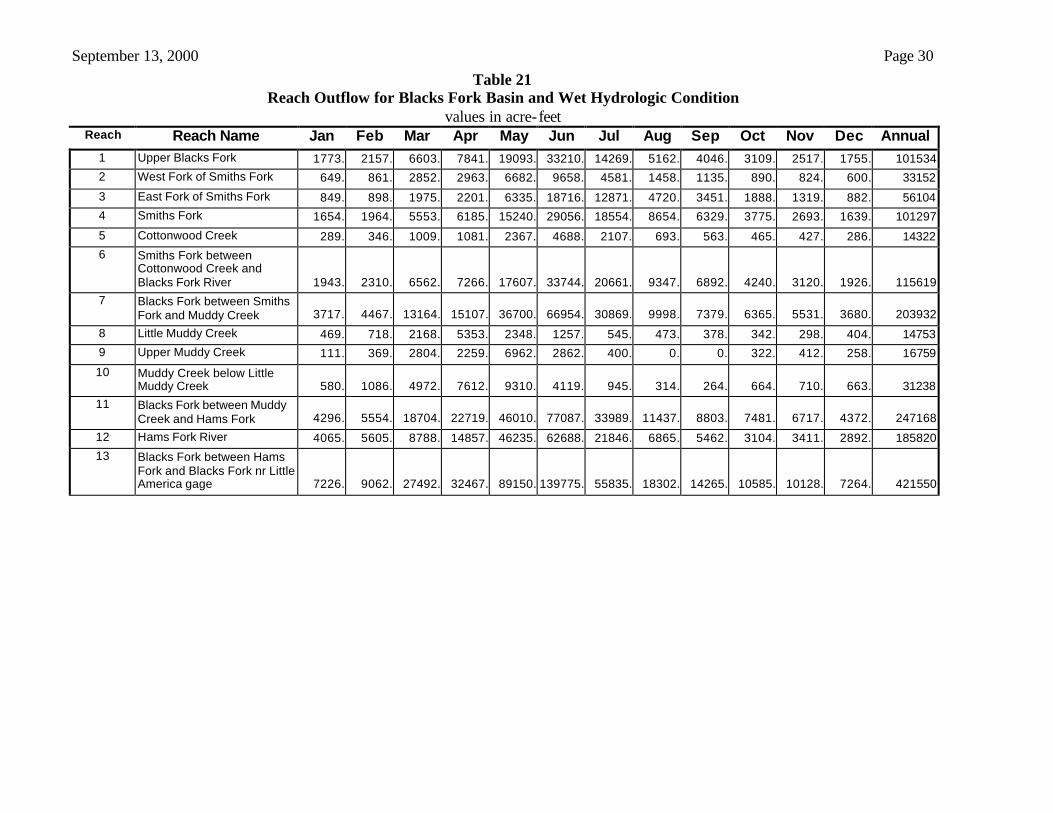
Table 21 Reach Outflow for Blacks Fork Basin and Wet Hydrologic Condition
values in acre-feet Reach Reach Name Jan Feb Mar Apr May Jun Jul Aug Sep Oct Nov Dec Annual
1 Upper Blacks Fork 1773. 2157. 6603. 7841. 19093. 33210. 14269. 5162. 4046. 3109. 2517. 1755. 101534 2 West Fork of Smiths Fork 649. 861. 2852. 2963. 6682. 9658. 4581. 1458. 1135. 890. 824. 600. 33152
3 East Fork of Smiths Fork 849. 898. 1975. 2201. 6335. 18716. 12871. 4720. 3451. 1888. 1319. 882. 56104 4 Smiths Fork 1654. 1964. 5553. 6185. 15240. 29056. 18554. 8654. 6329. 3775. 2693. 1639. 101297
5 Cottonwood Creek 289. 346. 1009. 1081. 2367. 4688. 2107. 693. 563. 465. 427. 286. 14322 6 Smiths Fork between
Cottonwood Creek and Blacks Fork River 1943. 2310. 6562. 7266. 17607. 33744. 20661. 9347. 6892. 4240. 3120. 1926. 115619
7 Blacks Fork between Smiths Fork and Muddy Creek 3717. 4467. 13164. 15107. 36700. 66954. 30869. 9998. 7379. 6365. 5531. 3680. 203932
8 Little Muddy Creek 469. 718. 2168. 5353. 2348. 1257. 545. 473. 378. 342. 298. 404. 14753 9 Upper Muddy Creek 111. 369. 2804. 2259. 6962. 2862. 400. 0. 0. 322. 412. 258. 16759
10 Muddy Creek below Little Muddy Creek 580. 1086. 4972. 7612. 9310. 4119. 945. 314. 264. 664. 710. 663. 31238
11 Blacks Fork between Muddy Creek and Hams Fork 4296. 5554. 18704. 22719. 46010. 77087. 33989. 11437. 8803. 7481. 6717. 4372. 247168
12 Hams Fork River 4065. 5605. 8788. 14857. 46235. 62688. 21846. 6865. 5462. 3104. 3411. 2892. 185820 13 Blacks Fork between Hams
Fork and Blacks Fork nr Little America gage 7226. 9062. 27492. 32467. 89150. 139775. 55835. 18302. 14265. 10585. 10128. 7264. 421550

September 13, 2000 Page 31
Table 22 Reach Outflow for Green River Basin and Dry Hydrologic Condition
values in acre-feet Reach Reach Name Jan Feb Mar Apr May Jun Jul Aug Sep Oct Nov Dec Annual
1 Upper Green River above Warren Bridge 5935. 5567. 6802. 17403. 45082. 64704. 33890. 20075. 12397. 10460. 6890. 6658. 235864.
2 Beaver Creek 335. 305. 639. 2261. 1777. 870. 42. 39. 201. 277. 382. 359. 7487. 3 Green River between Beaver
Creek and Horse Creek 6332. 5956. 7728. 19757. 44939. 59520. 29222. 17003. 12146. 10816. 7429. 7095. 227942. 4 Horse Creek 784. 899. 2417. 2513. 5072. 4289. 2453. 1634. 490. 1113. 1525. 916. 24105. 5 Green River between Horse
Creek and Cottonwood Creek 7116. 6855. 10145. 22269. 48757. 59831. 28272. 16399. 12337. 11929. 8954. 8011. 240876. 6 Cottonwood Creek 856. 1012. 2842. 2638. 1597. 0. 1332. 525. 171. 1381. 1846. 1072. 15271. 7 Green River between
Cottonwood Creek and New Fork River 7972. 7867. 12987. 24907. 49791. 58043. 28074. 15919. 12374. 13311. 10799. 9083. 251126.
8 West Fork New Fork River above Pine Creek 3686. 3193. 3950. 5280. 15535. 29488. 7479. 3039. 3623. 4465. 4481. 4247. 88466.
9 Pine Creek 4218. 3460. 4645. 7507. 25580. 48612. 18092. 7787. 6268. 7520. 6270. 5319. 145278. 10 Pole Creek 5090. 4216. 5560. 9478. 24818. 39148. 20696. 8080. 5583. 9537. 7830. 6327. 146362. 11 Boulder Creek 5500. 4624. 6136. 10629. 42618. 80723. 30185. 11231. 7712. 11707. 8723. 6869. 226658. 12 East Fork New Fork River 2957. 3196. 4336. 3941. 21509. 17287. 8446. 4899. 4237. 4259. 4270. 3342. 82678. 13 New Fork River below
confluence of West and East Forks 10873. 10550. 14118. 15055. 56830. 81753. 44057. 20146. 15270. 18493. 16228. 12823. 316198.
14 Green River between New Fork River and Piney Creeks 18969. 18586. 27678. 40148. 106102. 138227. 71729. 35771. 27534. 31961. 27341. 22062. 566108.
15 North Piney Creek 1112. 1274. 3429. 1858. 785. 0. 2204. 1629. 193. 1800. 2305. 1324. 17913. 16 Middle Piney Creek 992. 1213. 3496. 1527. 561. 0. 3435. 2653. 299. 1393. 2138. 1188. 18895. 17 South Piney Creek 902. 1035. 2786. 2888. 2800. 1062. 1282. 1426. 408. 1282. 1756. 1055. 18684. 18 Green River between Piney
Creeks and LaBarge Creek 21967. 22102. 37383. 46416. 110709. 139282. 78597. 41508. 28513. 36476. 33556. 25624. 622134. 19 LaBarge Creek 2404. 2298. 3595. 4096. 6916. 3872. 2936. 2193. 1950. 2772. 3082. 2759. 38874. 20 Green River between La Barge
Creek and Fontenelle Reservoir 24372. 24400. 40978. 50512. 89772. 143459. 81826. 43942. 30622. 39311. 36667. 28393. 634254. 21 Fontenelle Creek 1347. 1297. 1890. 3470. 4231. 2939. 610. 565. 934. 1793. 1607. 1413. 22095.

September 13, 2000 Page 32
Table 22 (continued) Reach Outflow for Green River Basin and Dry Hydrologic Condition
values in acre-feet
Reach Reach Name Jan Feb Mar Apr May Jun Jul Aug Sep Oct Nov Dec Annual 22 Green River Between
Fontenelle Reservoir and Big Sandy River 52829. 41291. 40602. 61966. 58153. 68493. 54066. 53366. 40019. 47741. 50509. 56107. 625142.
23 Big Sandy River below Farson gage and Green River 1550. 1415. 3170. 2687. 2178. 2582. 2928. 3037. 2950. 3112. 2677. 1892. 30177.
24 Green River between Big Sandy River and Green River near Green River gage 50627. 42740. 44590. 63005. 57368. 66935. 52932. 51463. 39138. 47695. 49963. 53297. 619753.

September 13, 2000 Page 33
Table 23 Reach Outflow for Green River Basin and Normal Hydrologic Condition
values in acre-feet Reach Reach Name Jan Feb Mar Apr May Jun Jul Aug Sep Oct Nov Dec Annual
1 Upper Green River above Warren Bridge 6689. 6159. 7726. 16510. 59720. 100442. 84662. 32880. 18580. 14043. 9305. 7553. 364272.
2 Beaver Creek 676. 635. 894. 7554. 6966. 3053. 48. 135. 197. 562. 813. 710. 22243. 3 Green River between Beaver
Creek and Horse Creek 7391. 6842. 8780. 24321. 64490. 98850. 80423. 29914. 17985. 14618. 10216. 8300. 372130. 4 Horse Creek 1051. 1101. 2107. 6460. 15209. 16446. 5603. 3742. 1179. 1512. 1826. 1158. 57393. 5 Green River between Horse
Creek and Cottonwood Creek 8442. 7943. 10887. 30782. 78265. 112263. 82733. 31262. 18595. 16129. 12042. 9458. 418801. 6 Cottonwood Creek 1299. 1350. 2752. 8430. 9787. 9073. 6528. 3599. 1256. 2043. 2302. 1430. 49850. 7 Green River between
Cottonwood Creek and New Fork River 9741. 9293. 13639. 39212. 87407. 119973. 87781. 33785. 19595. 18172. 14344. 10888. 463832.
8 West Fork New Fork River above Pine Creek 3873. 3769. 4526. 7410. 21286. 57224. 24194. 7536. 7122. 5418. 4579. 4047. 150984.
9 Pine Creek 4803. 4577. 5880. 11430. 34534. 98862. 51498. 16933. 12163. 8888. 6607. 5377. 261553. 10 Pole Creek 6169. 5857. 7252. 14054. 34828. 99118. 60537. 19678. 10158. 9275. 8057. 6754. 281736. 11 Boulder Creek 7262. 6806. 8348. 16319. 59468. 164908. 86225. 27205. 15343. 13019. 9694. 8022. 422619. 12 East Fork New Fork River 3188. 3237. 4597. 7165. 32042. 46727. 20547. 7246. 5110. 7659. 6468. 4232. 148218. 13 New Fork River below
confluence of West and East Forks 12790. 12531. 16639. 27633. 80235. 181813. 116202. 39376. 23239. 25771. 21068. 15347. 572643.
14 Green River between New Fork River and Piney Creeks 22585. 21920. 30597. 67358. 167049. 300530. 204133. 73300. 42759. 43969. 35609. 26307. 1036116.
15 North Piney Creek 1098. 1239. 2534. 4341. 4520. 8033. 8791. 5483. 1269. 1739. 2139. 1280. 42466. 16 Middle Piney Creek 756. 957. 2268. 3711. 2335. 3786. 8835. 6373. 1487. 1017. 1714. 906. 34147. 17 South Piney Creek 1207. 1265. 2425. 7428. 12187. 10004. 464. 2233. 254. 1736. 2100. 1331. 42636. 18 Green River between Piney
Creeks and LaBarge Creek 25639. 25376. 37819. 82833. 187018. 323798. 223318. 88331. 46539. 48767. 41698. 29860. 1160995. 19 LaBarge Creek 3215. 3033. 4085. 7269. 13312. 9118. 6639. 4401. 3885. 4646. 4193. 3518. 67314. 20 Green River between La
Barge Creek and Fontenelle Reservoir 28854. 28409. 41903. 90102. 189776. 325300. 231315. 93447. 51012. 53667. 45962. 33405. 1213150.
21 Fontenelle Creek 1643. 1537. 2084. 5729. 12740. 12740. 4518. 2062. 1765. 2086. 1925. 1751. 50583.

September 13, 2000 Page 35
Table 23 (continued) Reach Outflow for Green River Basin and Normal Hydrologic Condition
values in acre-feet
Reach Reach Name Jan Feb Mar Apr May Jun Jul Aug Sep Oct Nov Dec Annual 22 Green River Between
Fontenelle Reservoir and Big Sandy River 56650. 56499. 65350. 95495. 170042. 246144. 196206. 105392. 61884. 62333. 58689. 54215. 1228900.
23 Big Sandy River below Farson gage and Green River 1980. 2034. 4730. 6111. 4234. 6747. 6033. 5123. 4542. 3822. 3171. 2484. 51011.
24 Green River between Big Sandy River and Green River near Green River gage 58891. 59204. 73947. 99523. 163844. 251899. 214389. 112609. 66028. 59142. 55769. 54255. 1269499.
September 13, 2000 Page 36
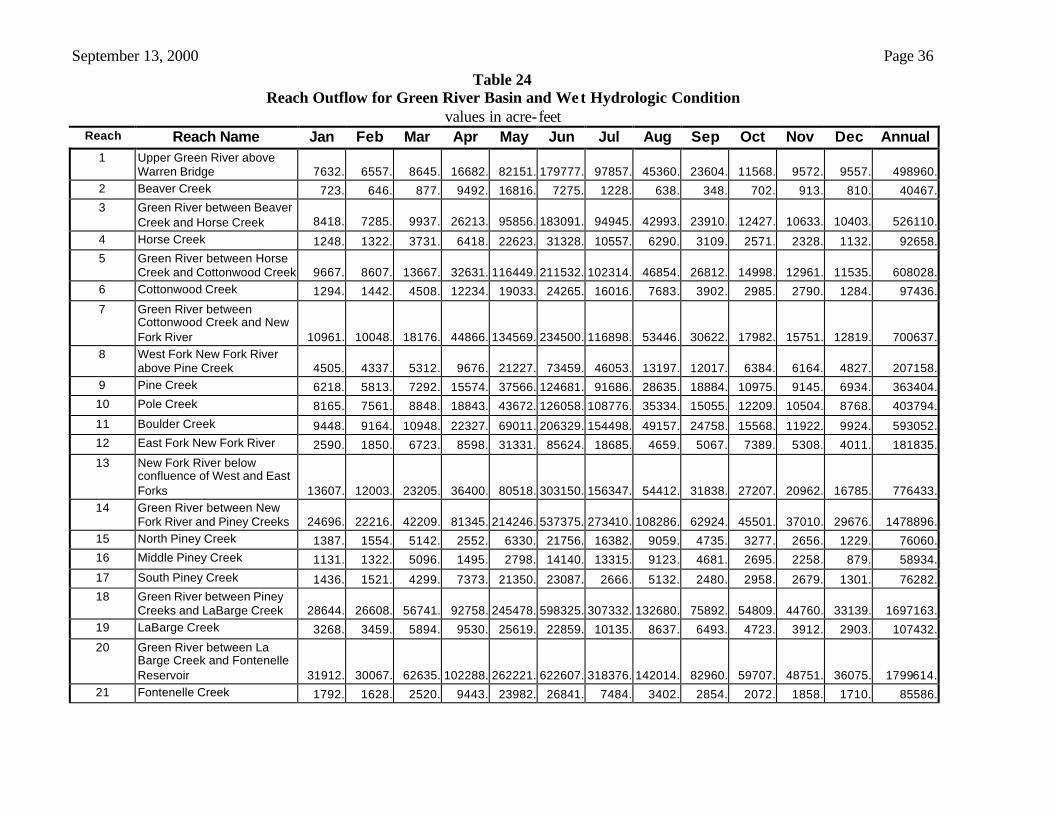
Table 24 Reach Outflow for Green River Basin and Wet Hydrologic Condition
values in acre-feet Reach Reach Name Jan Feb Mar Apr May Jun Jul Aug Sep Oct Nov Dec Annual
1 Upper Green River above Warren Bridge 7632. 6557. 8645. 16682. 82151. 179777. 97857. 45360. 23604. 11568. 9572. 9557. 498960.
2 Beaver Creek 723. 646. 877. 9492. 16816. 7275. 1228. 638. 348. 702. 913. 810. 40467. 3 Green River between Beaver
Creek and Horse Creek 8418. 7285. 9937. 26213. 95856. 183091. 94945. 42993. 23910. 12427. 10633. 10403. 526110. 4 Horse Creek 1248. 1322. 3731. 6418. 22623. 31328. 10557. 6290. 3109. 2571. 2328. 1132. 92658. 5 Green River between Horse
Creek and Cottonwood Creek 9667. 8607. 13667. 32631. 116449. 211532. 102314. 46854. 26812. 14998. 12961. 11535. 608028. 6 Cottonwood Creek 1294. 1442. 4508. 12234. 19033. 24265. 16016. 7683. 3902. 2985. 2790. 1284. 97436. 7 Green River between
Cottonwood Creek and New Fork River 10961. 10048. 18176. 44866. 134569. 234500. 116898. 53446. 30622. 17982. 15751. 12819. 700637.
8 West Fork New Fork River above Pine Creek 4505. 4337. 5312. 9676. 21227. 73459. 46053. 13197. 12017. 6384. 6164. 4827. 207158.
9 Pine Creek 6218. 5813. 7292. 15574. 37566. 124681. 91686. 28635. 18884. 10975. 9145. 6934. 363404. 10 Pole Creek 8165. 7561. 8848. 18843. 43672. 126058. 108776. 35334. 15055. 12209. 10504. 8768. 403794. 11 Boulder Creek 9448. 9164. 10948. 22327. 69011. 206329. 154498. 49157. 24758. 15568. 11922. 9924. 593052. 12 East Fork New Fork River 2590. 1850. 6723. 8598. 31331. 85624. 18685. 4659. 5067. 7389. 5308. 4011. 181835. 13 New Fork River below
confluence of West and East Forks 13607. 12003. 23205. 36400. 80518. 303150. 156347. 54412. 31838. 27207. 20962. 16785. 776433.
14 Green River between New Fork River and Piney Creeks 24696. 22216. 42209. 81345. 214246. 537375. 273410. 108286. 62924. 45501. 37010. 29676. 1478896.
15 North Piney Creek 1387. 1554. 5142. 2552. 6330. 21756. 16382. 9059. 4735. 3277. 2656. 1229. 76060. 16 Middle Piney Creek 1131. 1322. 5096. 1495. 2798. 14140. 13315. 9123. 4681. 2695. 2258. 879. 58934. 17 South Piney Creek 1436. 1521. 4299. 7373. 21350. 23087. 2666. 5132. 2480. 2958. 2679. 1301. 76282. 18 Green River between Piney
Creeks and LaBarge Creek 28644. 26608. 56741. 92758. 245478. 598325. 307332. 132680. 75892. 54809. 44760. 33139. 1697163. 19 LaBarge Creek 3268. 3459. 5894. 9530. 25619. 22859. 10135. 8637. 6493. 4723. 3912. 2903. 107432. 20 Green River between La
Barge Creek and Fontenelle Reservoir 31912. 30067. 62635. 102288. 262221. 622607. 318376. 142014. 82960. 59707. 48751. 36075. 1799614.
21 Fontenelle Creek 1792. 1628. 2520. 9443. 23982. 26841. 7484. 3402. 2854. 2072. 1858. 1710. 85586.
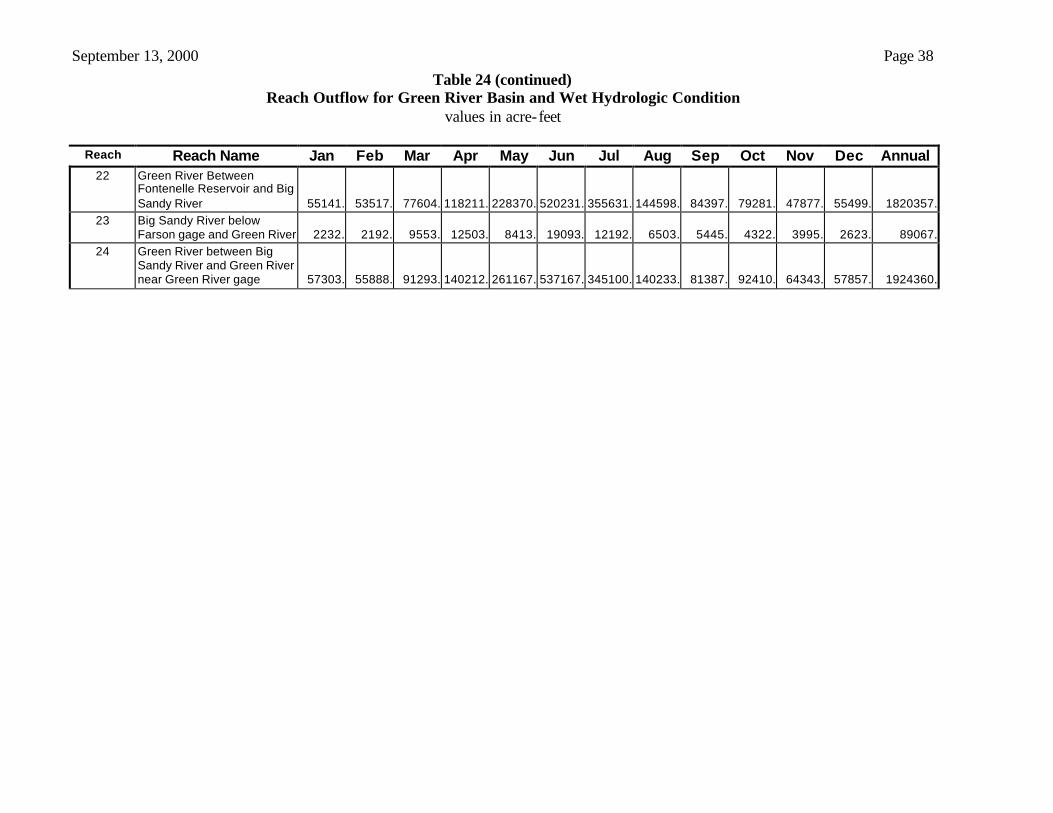
September 13, 2000 Page 38
Table 24 (continued) Reach Outflow for Green River Basin and Wet Hydrologic Condition
values in acre-feet
Reach Reach Name Jan Feb Mar Apr May Jun Jul Aug Sep Oct Nov Dec Annual 22 Green River Between
Fontenelle Reservoir and Big Sandy River 55141. 53517. 77604. 118211. 228370. 520231. 355631. 144598. 84397. 79281. 47877. 55499. 1820357.
23 Big Sandy River below Farson gage and Green River 2232. 2192. 9553. 12503. 8413. 19093. 12192. 6503. 5445. 4322. 3995. 2623. 89067.
24 Green River between Big Sandy River and Green River near Green River gage 57303. 55888. 91293. 140212. 261167. 537167. 345100. 140233. 81387. 92410. 64343. 57857. 1924360.