subjective well-being is not unitary ed diener daniel kahneman raksha arora william tov...
TRANSCRIPT

Subjective Well-Being is Not Unitary
Ed Diener Daniel Kahneman
Raksha Arora William Tov
International Differences in Well-BeingPrinceton, 2008

SWB or WBIs Not one thing
• Which are the happiest nations?
• Does money influence happiness?
• What are the causes of happiness?
Such questions assume there is one variable in “happiness”

BUT• Empirically – no
– Diener, Lucas, etc.Life satisfaction, positive affect, etc. are separate
• Conceptually– Kahnamen – judgment vs. momentary
feelings are separate

Let’s take seriously the idea that “happiness” is more than one thing

We Propose a Dimension
Global life judgments, reflective
V
• Life satisfaction
• Reports of happiness
V
Momentary affect, feelings at the moment

Intercorrelation of Well-Being Measures
Well-Being LifeVariables Ladder Satisfaction Happiness
Life Satisfaction .74
Happiness .62 .71
Affect Balance .53 .56 .71

Intercorrelation of Well-Being Measures
Well-Being LifeVariables Ladder Satisfaction Happiness
Life Satisfaction .74
V
Happiness .62 < .71
V V
Affect Balance .53 < .56 < .71

• Predicting Life SatisfactionLadder Score Beta = .61 (p < .01)
Affect Balance Beta = .28 (p < .01)
• Predicting Happiness Ladder Score Beta = .23 (NS)
Affect Balance Beta = .54 (p < .01)

Indicates the Ordering:
Judgment ------------------------------------- Feelings
Ladder Life Satisfaction Happiness Affect Balance
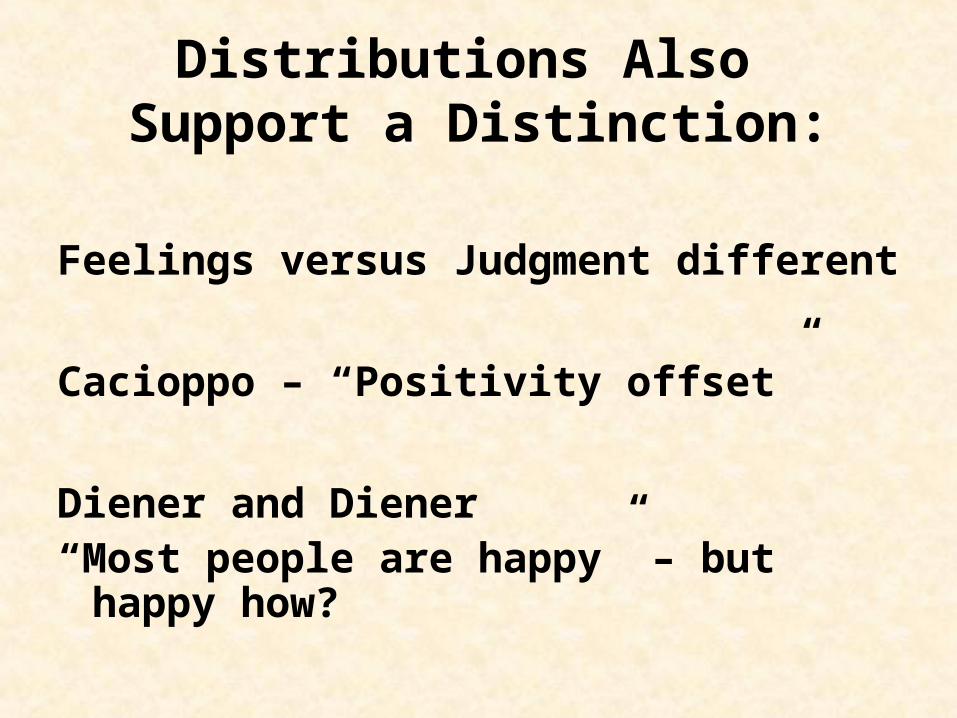
Distributions Also Support a Distinction:
Feelings versus Judgment different
Cacioppo – “Positivity offset”
Diener and Diener“Most people are happy” – but happy
how?

Life Satisfaction of Nations
Num
ber of N
ato
ins
20
15
10
5
0
Std. Dev = .96
Mean = 6.62
N = 64.00
Happiness Score of Nations
3.88
3.63
3.38
3.13
2.88
2.63
2.38
2.13
1.88
1.63
1.38
1.13
Num
ber of N
ations
20
15
10
5
0
Std. Dev = .29
Mean = 3.05
N = 52.00
Affect balance of Nations
Num
ber of N
atio
ns
50
40
30
20
10
0
Std. Dev = 14.02
Mean = 47.5
N = 127.00

Nations' Ladder Scores
Num
ber of N
ations
30
20
10
0
Std. Dev = 1.16
Mean = 5.40
N = 129.00

Life Judgments Are Dramatically
Less Positive than Affect
• Biological?
• Therefore more room to move?

What Predicts Judgments versus
Feelings?

Predictors Correlated with Four Measures of Well-Being
Well-Being Income Per Choose How to Possession of
Capita Spend Time Conveniences
Ladder Score .83 a .33 a .80 a
Life Satisfaction .58 b .51 b .46 b
Happiness .34 bc .54 b .16 bc
Affect Balance .31 c .57 b .16 c

Judgment ------------------------------------- Feelings
Ladder Life Satisfaction Happiness Affect Balance
Income Psychological
Conveniences Needs???
Prosperity e.g. Autonomy
Positive

Easterlin Paradox:What About Changes in Income?
Are changes in national income more associated with judgments than with feelings?

Two Waves of Data for Each SWB Variable
Criterion – two surveys using same instrument more than five years apart
Years Apart
Ladder 36
Life Satisfaction 21
Happiness 20

Per Capita Income
Ladder Life Sat. Happiness
Wave 1 PPP $ 8,148 $ 10,702 $ 11,187
Wave 2 PPP $ 19,938 $ 22,114 $ 20,332
Log10 Change .39 .33 .26

Well-Being
Ladder Life Sat. Happiness
Wave 1 5.58 6.68 3.01
Wave 2 6.31 6.91 3.08
Difference: +.72 +.23 +.07
p < .01 .05 .10

Size of Mean Well-being Changes
Ladder Life Sat. Happiness
Percentage of
scale change 7 2 2
Between-nation .70 .23 .25
SD units

Correlations of Changes with Income
Ladder r = .56, p < .05
Life satisfaction r = .33, p < .10
Happiness r = .24, NS

Change Regression Analyses:
Over time predictions (Betas):
Log income
T1 SWB Change
Ladder .85 .37 (p < .06)
Life satisfaction .83 .26 (p < .01)
Happiness .58 .22 (p < .10)
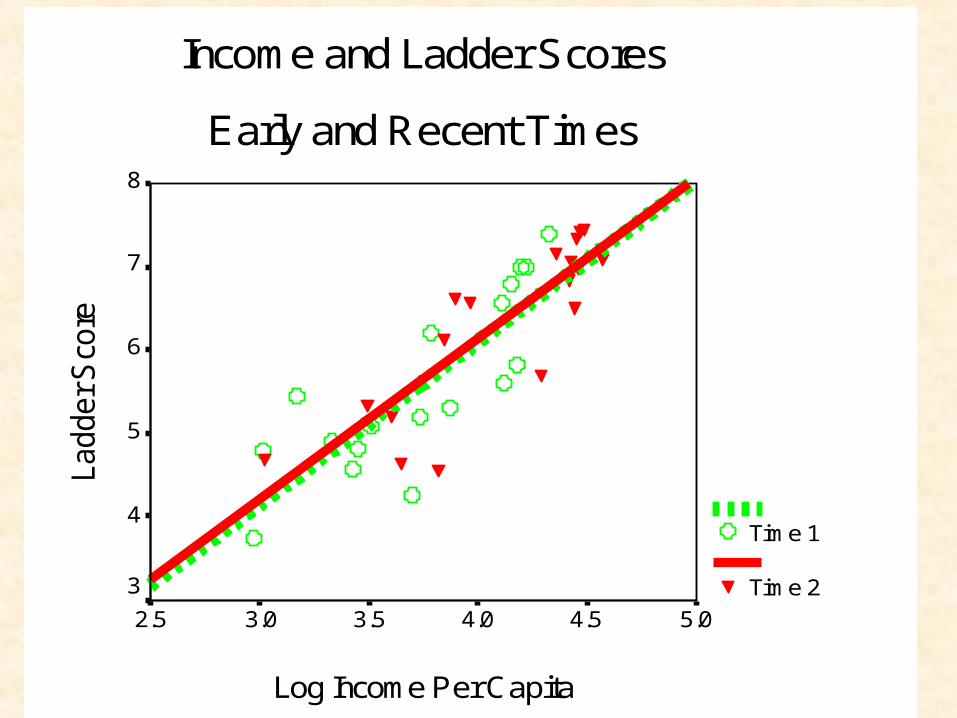
Income and Ladder Scores
Early and Recent Times
Log Income Per Capita
5.04.54.03.53.02.5
Ladder S
core
8
7
6
5
4
3
Time 1
Time 2

LossesVersusGains?

Box Score AnalysesAcross 3 SWB Measures:
SWB ChangeIncomeChange Down Up
Down 7 1
Up 25 65

Change Log GDP/Capita
.8.6.4.20.0-.2
Sta
ndard
ized H
appin
ess
Change
3
2
1
0
-1
-2
-3
-4

Thus:
• Asymmetry
– When income down, SWB down 88 %
– When income up, SWB up 72 %

Happiness Change GDP Up versus Down
– Absolute change in Happiness• GDP up -- .16 scale score change• GDP down -- .37 scale score change
p < .01

Suggests Asymmetry-- Losses loom larger
than gains

Conclusions• Types of SWB are not the same things
• They can be ordered on the dimension from judgment to feelings
• Judgments reflect income more
• For the Ladder there appears to have been little scale recalibration
• Feelings of SWB have changed less over time in response to income
• Downward income change more powerful than upward income change

Easterlin’s Paradox?
• Judgments more likely to change in response to changing income, although they do not invariably do so
• Happiness is less related to income, and has been less responsive to income changes

Thank You


Predictors Correlated with Four Measures of Well-Being
Well-Being Income Per Choose How to Possession ofVariables Capita Spend Time Conveniences
• Affect Balance .31c .57a .16a
• Ladder Score• Time 1 .82b• Time 2 .83d .33b .80c• Life Satisfaction• Time 1 .66a• Time 2 .58e .51a .46b• Happiness• Time 1 .35a• Time 2 .34ce .54a .16ab

Figure 4: Declining Marginal Utility
Household Income
160000
140000
120000
100000
80000
60000
40000
20000
0
Subje
ctiv
e W
ell-
Bein
g1.0
.8
.6
.4
.2
0.0
SWB Variables
Positive Feelings
Negative Feelings
Ladder/10
Job Satisfaction
Satisf. St. Living

Raw vs. Log Income
• Ladder change and income change:• Log income r = .56, p < .05• Raw income r = .16, NS
Listwise N = 18

Income Up
• Life Satisfaction down in 39 percent of nations when income rose
• Happiness down 22 % when income up
• Ladder down 22 % when income up