submitted to coastal gujarat power limited (cgpl) · coastal gujarat power limited (cgpl), a tata...
TRANSCRIPT

A Baseline Health Profile with Respect to Air Quality in Airshed of CGPL Power Plant
Submitted to
Coastal Gujarat Power Limited (CGPL)
CGPL Office Complex, Block B, Tunda-Vandh Road, Village Tunda, Mundra, Kutch 370435 Gujarat
By
TALEEM Research Foundation
City Plaza, Bopal, Ahmedabad 380 058, INDIA Tele Fax: 91-2717-231486/231007
Website: taleemindia.org, e-mail: [email protected]
November 24, 2016

ii
STUDY TEAM
Dr. Md. Irfan Khan, Ph.D.
Dr. Dalip Bora. Ph.D
Dr. Sapan Pandya, MBBS, AFIH
Dr. Mahesh Chauhan, Ph.D
Mr. Chandu Jadav
Mr. Vijay Uttekar

iii
CONTENTS
Details Page List of Tables iv List of Figures, Photographs and Flow Diagrams v Preface and Acknowledgement vi Acronyms vii Executive Summary 1 Chapter I: Introduction 3 1.1 Background 3 1.2 Objectives of the Study 3 1.3 Survey Design 3 1.4 Method of Data Collection 4 1.5 Review of Health Facility Records 9 1.6 Coverage for the Proposed Study 9 1.7 Field Approach 10 1.8 Field Deployment Plan 10 1.9 Data Analysis 11 1.10 Triangulation of the Findings 12 1.11 Proposal for Future Health Survey 12 Chapter II: Population and Household Characteristics 13 2.1 Background Characteristics of Households 13 2.2 Profile of Population 17 2.3 Socio-Economic Characteristics of Households 21 2.4 Households Possessions 25 2.5 Land Ownership 26 2.6 Household Livestock 27 Chapter III: Hygiene Practices 29 3.1 Hygiene Practices 29 3.2 Perception about Industrial Activities Causing an Impact on Air Quality 31 Chapter IV: Prevalence of Respiratory Problems and Heart Diseases 33 4.1 Prevalence of Respiratory Problems Among Children Less than Five Years of Age 36 4.2 Prevalence of Respiratory Problems and Heart Diseases Among Population 50 Years and Above
39
4.3 Clinical Assessment Outcomes 42 4.4 Lung Function Measurement 42 4.5 Respiratory Problem and Associated Factors 46 Chapter V: Summary and Conclusion 49 Appendix- I : Sample coverage 51 Appendix- II : Study tools 52-69

iv
LIST OF TABLES
Table No.
Title of Tables Page
Chapter I: Introduction 1.1 Village-wise Sample Size Proposed and Covered 6 1.2 Health Assessment Modalities 9 1.3 Workload Summary 9 Chapter II: Study Methodology 2.1 Background Characteristics of Households 16 2.2 Profile of Population 19 2.3 Socio-Economic Characteristics of Households 24 2.4 Household Possessions /Assets 26 2.5 Land Ownership (in Acres) 27 2.6 Household Owning Livestock 27 Chapter III: Hygiene Practices 3.1 Hygiene Practices 30 3.2 Perception about Industrial Activities Causing Air Pollution 32 Chapter IV: Prevalence of Respiratory Problem and Heart Diseases 4.0 No. of Households Reported Respiratory Problem and Heart Diseases During
Household Survey and Clinical Assessment Performed 35
4.1 Prevalence of Respiratory Problem Among Children under Five years (U5) of age
37
4.2 Prevalence of Respiratory Problem and Heart Diseases Among Population 50 Years and Above
40
4.2A No. of Persons Reported having Respiratory Problem and Heart Diseases Clinically Assessed
42
4.3 Prevalence of Respiratory Problem Among Children U5 and Adult 50 Years and Above
43
4.4 Prevalence of Heart Diseases by Associated Factors 44 4.5A Mortality and Causes of Death (January 1, 2015 to December 31, 2015)
(Primary Data) 44
4.5B Table 4.5B: Mortality and Causes of Death (April 1, 2015 to March 31, 2016 (Secondary Data)
45
4.6 Type of Fuel used for Cooking and Ventilation Provision in the Households Reported having Respiratory Problems
47

v
LIST OF FIGURES, PHOTOGRAPHS AND FLOW DIAGRAM
No. FIGURES Page Figure 1 Religion of head of the household 13 Figure 2 Caste of Head of Households 14 Figure 3 Type of Family 15 Figure 4 BPL Card 16 Figure 5 Age Distribution of Household Population 17 Figure 6 Gender Distribution of Population 18 Figure 7 Marital Status of Household Population 18 Figure 8 Education of Household Population 20 Figure 9 Occupation of Household Population 21 Figure 10 Type of House 22 Figure 11 Main Source of Drinking Water 22 Figure 12 Type of Cooking Fuel Used 23 Figure 13 Type of Toilet Used by the Household 25 Figure 14 Hygiene Practices including Waste Disposal 29 Figure 15 Perception of People about Activity Causing an Impact on Air Quality 32 Figure 16 Prevalence of Respiratory and Heart Diseases 37 Figure 17 Duration of Children Suffering from Respiratory Problem 38 Figure 18 Duration of Population 50 years and above Suffering from Respiratory and
Heart Diseases 41
Figure 19 Perception of People about Activity Causing Air Pollution 46 No. PHOTOGRAPHS Picture 1 Project Villages and Control Villages 4 Picture 2 Investigating a Male Respondent 7 Picture 3 Blood Pressure of an Old Woman is being Monitored 8 Picture 4 Investigator is Interviewing a Respondent 11 Picture 5 Doctor Assessing a Child Reported having Respiratory Problem 36 Picture 6 Pulmonary Function Test (PFT) of a Woman is being Carried out 39 Picture 7 Electrocardiogram of an Elderly Person is being Performed 41 No. FLOW DIAGRAMS (FD) FD 1 Various Stages of Data Collection 12 FD 2 Summary of Survey 34

vi
Preface and Acknowledge Coastal Gujarat Power Limited (CGPL), a TATA Power Company has initiated a study entitled “Develop a Baseline Profile of Public Health with Respect to Emissions in Mundra Taluka (Kutch), Gujarat” to generate a baseline health statistics as regards the health status of chosen population in the villages located within 10 km. zone. This study will help reveal any associated adverse impact of the emissions attributable to thermal power plant emissions in future.
TALEEM Research Foundation as a research agency carried out this study in seven villages around CGPL and two villages chosen as controls. The main aim of the study is to assess the prevalence of disorders likely to arise in consequence of exposure to emissions. This includes asthma, chronic obstructive pulmonary disease (COPD) and heart diseases in project villages.
TALEEM Research Foundation, Ahmedabad sincerely thanks Coastal Gujarat Power Limited (CGPL), Mundra, for giving an opportunity to undertake this study and facilitating its execution. My special thanks are due to Mr. Somnath Basu, Mr Pradeep Ghosal, Dr. Amit Tyagi and Mr. Saurabh Sharma in particular for their unflinching cooperation and support during the study period and providing necessary information regarding the project, suggestions and research inputs in conducting the study. Contribution of Dr. Tushar Joshi, Consultant, for technical support in designing, implementation and regular monitoring of activities is highly appreciated.
I am grateful to Dr. Md. Irfan Khan, Director, TALEEM Research Foundation for extending full cooperation and support through the study period. I extend special gratitude to Dr. Sapan Pandya and his team for carrying out clinical investigation of children and adults reported having respiratory problem and heart diseases after completion of household survey. Dr. Mahesh Chauhan, Research Coordinator and Mr. Chandu Jadav, Research Supervisor highly deserve due recognition and appreciation for their unwavering zeal, knack for quality data collection and completion of field work in stipulated time schedule, due to their able coordination and field management. My sincere thanks are due to Mr. Vijay Uttekar, Manger (Data Processing Unit) for data processing and analysis as well as to all team members who were engaged in data coding and entry. I also thank Ms Aruna Parmar, Ms Hiral Dave and Mr. Mayur Vaghela for their office assistance. I am very much thankful to all the field research supervisors and investigators who worked hard for collecting quality data and successful completion of field work. Last but not the least, I express my deep sense of gratitude to all the respondents for their cooperation and sharing useful information with us to shape up this report.
Dalip Bora (Project Director)
TALEEM Research Foundation, Ahmedabad

vii
ACRONYMS
ABBREVIATIONS FULL FORM APL AQM BPL CGPL CHC COPD CSR ECG LRTI OBC PFT PHC SC SLI ST
: : : : : : : : : : : : : : :
Above Poverty Line Air Quality Monitoring Below Poverty Line Coastal Gujarat Power Limited Community Health Centre Chronic Obstructive Pulmonary Disease Corporate Social Responsibility Electrocardiogram Lower Respiratory Tract Infection Other Backward Classes Pulmonary Function Test Primary Health Centre Scheduled Castes Standard Living Index Scheduled Tribes

1
EXECUTIVE SUMMARY
The present study aims to create a baseline profile of public health indicators and prevailing morbidity and mortality of population with reference to emissions in a 10 km radius of CGPL unit, in Mundra. The study attempts to assess the prevalence of anticipated adverse outcomes such as asthma and frequency of lower respiratory tract infections among children less than five years of age and COPD and heart diseases in population 50 years and above.
The survey was carried out in seven villages within 10 kms of CGPL, (henceforth referred to as project villages) and two control villages (outside 10 kms. of CGPL’s catchment area) during April-May, 2016. A total of 349 out of 2731 households listed in project villages and 66 out of 746 listed households in control villages were surveyed.
The survey reveals that 66.8 percent of the households in project villages are Hindu and 30.1
percent are Muslim as against 78.8 percent Hindu households and 21.2 percent Muslim
households in control villages. In terms of castes composition both project and control villages
are found to be more or less similar. Almost equal proportions (32.3 percent in project and 32.5
percent in control villages) of household population aged 5 years and above are illiterate. The
other socio-economic parameters like sources of drinking water, electricity, use of cooking fuel,
toilet facilities, possession of household assets, livestock remain more or less same in both
project and control villages.
The study demonstrates that daily cleaning of houses and surrounding is practiced evenly in both
the areas. The use of dustbin for waste disposal within the premises is, however, more prevalent
in project villages than in control villages.
Initial discussion with respondents revealed about their belief of having some health impact due to emissions attributable to the poor air quality.
Overall 3.7 percent households (13 out of 349 households) in project villages and 3.0 percent households (2 out of 66 households) in control villages reported prevalence of respiratory problem among children less than five years of age. Prevalence rate of respiratory illness among children less than five years of age is estimated to be around 4.7 percent (14 out of 299 children) in project and 5.1 percent (2 out of 39 children) in control villages. However, the prevalence rate

2
of respiratory problem among adults aged 50 years and above is 12.1 percent (49 out of 406 adults) in project villages and 10.8 percent (7 out of 65 adults) in control villages.
After the survey, clinical assessment of children less than five years, who were having respiratory problem and adults 50 years and above, who were afflicted with respiratory problems and/or heart disease, was carried out by a competent physician.
Similarly 3.7 percent (15 out of 406) adults aged 50 years and above reported heart disease in project villages against 4.6 percent (3 out of 65) adults in control villages. The data indicates that the prevalence of COPD and heart disease is unlikely in consequence of exposure to the emissions of thermal power plant. A total of 59.2 percent in project and 57.1 percent adults having COPD had a prolonged history of over five years, predating commissioning of CGPL unit. The survey further reveals that SLI, smoking habit, high blood pressure and family-history of diabetes are not associated with heart disease in majority of the prevalence.
Pulmonary Function Test (PFT) carried out on study subjects in project villages indicate that more number of children 3, (42.9 percent) is having respiratory problems than control villages (0). Similarly, more number of adults (20, 50.0 percent) in project villages is having severe COPD than control villages (2, 40.0 percent).
Similarly, Electrocardiogram (ECG) performed on nine subjects suspected of having heart disease in project villages and three patients in control villages again indicates a similar pattern of persistence (2, 22.2 percent) in project and (1, 33.3 percent) in control villages.
The household survey data on mortality causing a large number of deaths from among the death occurring during January 1, 2015 to December 31, 2015 has been gathered for future comparison.

3
CHAPTER I
INTRODUCTION
1.1 Background
Air pollutants (particulate matters) are released by activities such as transportation and combustion that could occur either in mobile or stationary situations, burning of fossil fuels, e.g. coal and biomass, wood, crop residues and construction activity. On the request of CGPL, TALEEM Research Foundation carried out a survey to create a baseline profile of the health status of the chosen population in seven villages located within 10 km radius and 2 control villages outside this 10 km zone). The main aim of the study was to create a database in project villages by assessing the prevalence of outcomes such as asthma, chronic obstructive pulmonary disease (COPD) and heart diseases that may be associated with air emissions over a period of time (chronic and long term exposure). 1.2 Objectives of the Study The main objectives of the study were:
• To create health baseline data • To assess the prevalence of asthma and lower respiratory tract infection (LRTI) among
children under five years (U5) and asthma and COPD in subjects who are 50 years and above.
• To find out the prevalence of cardiovascular diseases among population 50 years and above.
• To understand the possible reasons of symptoms leading to death among under 5 and 50 years and above population.
• To be able to measure in future the health impact of emissions from nearby operating plants, particularly the impact on cardiovascular morbidity and mortality as well adverse respiratory outcomes such as asthma and COPD in project villages.
1.3 Survey Design A pre-test - post-test only quasi-experimental design1 was adopted in this study to assess the health impact of emissions on project villages around CGPL, (hereafter referred to as CGPL).
1 Pre-test Post test design is the most common quasi-experimental design and is the same as the classic controlled experimental design except that the subjects cannot be randomly assigned to either the intervention/experimental or the control group. In Pretest-post test design one group is given the treatment or exposed to a condition while the other group (control group) receives no treatment/exposure, over the same period of time, but undergoes exactly the same tests and the results are gathered at the end. This design uses two waves of observation before and after the introduction of the independent (treatment) variable.
4
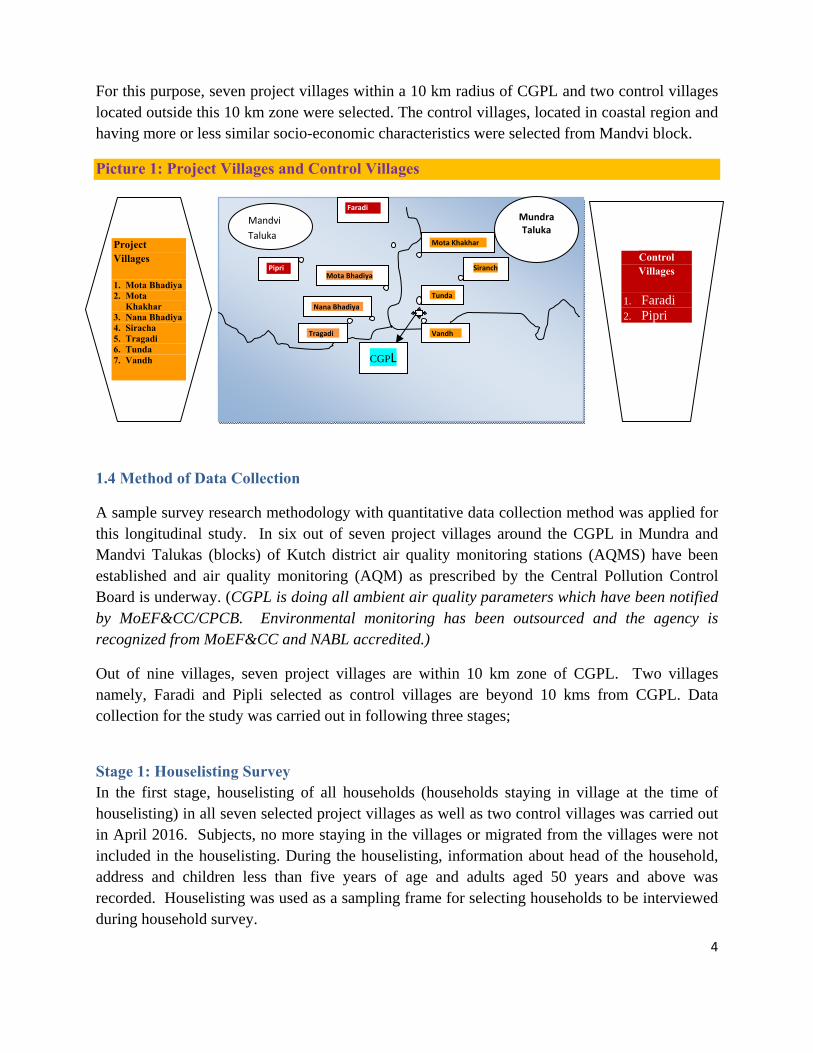
For this purpose, seven project villages within a 10 km radius of CGPL and two control villages located outside this 10 km zone were selected. The control villages, located in coastal region and having more or less similar socio-economic characteristics were selected from Mandvi block.
Picture 1: Project Villages and Control Villages
1.4 Method of Data Collection
A sample survey research methodology with quantitative data collection method was applied for this longitudinal study. In six out of seven project villages around the CGPL in Mundra and Mandvi Talukas (blocks) of Kutch district air quality monitoring stations (AQMS) have been established and air quality monitoring (AQM) as prescribed by the Central Pollution Control Board is underway. (CGPL is doing all ambient air quality parameters which have been notified by MoEF&CC/CPCB. Environmental monitoring has been outsourced and the agency is recognized from MoEF&CC and NABL accredited.)
Out of nine villages, seven project villages are within 10 km zone of CGPL. Two villages namely, Faradi and Pipli selected as control villages are beyond 10 kms from CGPL. Data collection for the study was carried out in following three stages;
Stage 1: Houselisting Survey In the first stage, houselisting of all households (households staying in village at the time of houselisting) in all seven selected project villages as well as two control villages was carried out in April 2016. Subjects, no more staying in the villages or migrated from the villages were not included in the houselisting. During the houselisting, information about head of the household, address and children less than five years of age and adults aged 50 years and above was recorded. Houselisting was used as a sampling frame for selecting households to be interviewed during household survey.
Mandvi Taluka
Faradi
Pipri
Mota Khakhar
Nana Bhadiya
Tragadi Vandh
Mota Bhadiya
Tunda
Siranch
Project Villages
1. Mota Bhadiya 2. Mota
Khakhar 3. Nana Bhadiya 4. Siracha 5. Tragadi 6. Tunda 7. Vandh
Control Villages
1. Faradi 2. Pipri
MundraTaluka
CGPL

5
Stage 2: Household Survey The sample size from each village was decided by taking into account the proportionate population of children less than five years and adults aged 50 years and above to the total population of Gujarat (Proportion of children and adults is estimated as per state average (rural) of 11.1% for age under 5 and 13.4% for age 50 years and above as per Census 2011). Subsequently, 5.0 percent of the estimated proportionate population of children less than five years and adults aged 50 years and above was curled out as sample size of households to be interviewed during household survey in villages for children and adults. Systematic circular random sampling technique was applied to select stipulated number of household (sample size for children and adults) in each village for household survey.
All together, 415 respondents were interviewed in the second stage, 66 from two control villages and 349 from seven project villages (Table 1.1). A person from selected household, having complete information about his/her household, was interviewed during the survey. The in-depth interview schedule included information on the socio-demographic parameters like background characteristics of household ; i) Religion ii) Caste of head of household, iii) Type of family, iv) Mean household size, v) Households having BPL card, vi) Household mean monthly income, Population profile i) Age distribution, ii) Sex ratio, iii) Marital status, iii) Education, iv) Occupation; Socio-economic characteristics of household i) ownership of household, ii) Type of house, iii) Main source of drinking water, iv) Household electricity connection, v) Type of cooking fuel used, vi) Type of toilet facility used; Household Possessions/Assets; Land ownership and Household owning livestock; Hygiene Practices; Prevalence of Respiratory problem and heart disease and symptoms leading to death that has occurred in last one year.

6
Table 1.1: Village-wise Sample Size Proposed and Covered Sr No
Villages House-Listing Carried
out
Children < 5 years Adult age 50 and Above
Total (< 5 yr and 50 and above)
Proposed Actual Covered
Proposed Actual Covered
Proposed Actual Covered
Project Villages 1 Moti
Khakhar 523 12 12 14 14 26 26
2 Nana Bhadiya
375 24 24 29 29 53 54
3 Siracha 270 10 10 13 13 23 23 4 Tunda 748 69 69 84 84 153 155 5 Tragdi 195 7 7 8 8 15 15 6 Vandh 240 9 9 11 11 20 21 7 Mota
Bhadiya 380 25 25 30 30 55 55
Control Villages 8 Faradi 418 23 23 28 28 51 51 9 Pipri 328 7 7 8 8 15 15 Total 3477 186 186 225 225 411 415
Note: Proportion of children and adults is estimated as per state average (rural) of 11.1% for age under 5 and 13.4% for age 50 years and above as per Census 2011, subsequently 5.0 percent of estimated population of children or adults was curled as sample size in each village.
Respondent households were selected by using systematic circular random sampling after completing listing of households in each village. Size of sample from each village was determined on the basis of proportionate population of children less than 5 years and adults 50 years of age and above, that are about 11.0 percent and 13.5 percent respectively in the state. Finally, five percent of the population of estimated children less than five years and adults 50 years of age and above was taken as sample size of households in each village. The household survey facilitated identifying (on the basis of symptoms of diseases as reported by their household) children less than five years, reported having from respiratory problem and adults 50 years and above reported having both respiratory problem and/or heart diseases in each village.

7
Picture 2: Investigating a Male Respondent
Data collected during the initial assessment in stage 2 reveled that a total of 90 persons were suspected of having either respiratory problem or heart diseases or both on the basis of symptoms narrated by the respondents and the clinical assessment that followed. Sixteen children (14 project and 02 control villages) for respiratory problem and 56 adults (49 project and 07 control villages) for respiratory and 18 adults (15 project and 03 control villages) for heart disease were identified on the basis of information provided by the respondents.
Stage 3: Clinical Assessment Clinical assessment of reported subjects (those present at the clinic) was carried out by a competent physician (who has experience in identifying common illnesses and in their management) immediately after the in-depth interview was over. In the third round, clinical assessment of nine children (7 in project and 2 in control villages), less than 5 years of age and 45 adults (40 project and 05 control villages), 50 years and above for respiratory problem and 12 adults (09 project and 03 in control villages), 50 years and above for heart diseases was carried out. Seven (7) out of 16 children and 11 out of 56 adults reported having respiratory problem did not avail clinical assessment. Clinical assessment made on examination of the records also suggests that 6 out of 18 adults identified for heart diseases did not turn up for clinical evaluation (Table 4.0).

8
Health screening was carried out in a convenient and comfortable location in each of the nine villages keeping in mind the privacy of the subjects. The selected subjects were informed in advance and mobilized to undergo the clinical assessment on a fixed day and time.
Out of 90 (children and adults) persons reportedly having respiratory problems and/or heart diseases, 66 persons were clinically assessed. They were interviewed in-depth using semi-structured interview schedule prior to the clinical assessment carried out by a competent physician. Picture 3: Blood Pressure of an Old Woman is being Monitored
The clinical assessment (PFT and ECG) performed on subjects is given in Table 1.2. All together 66 (09 children and 57 adults) persons (07 children in project villages and 02 children in control villages) and 49 adults (40 adults in project villages and 05 in control villages for respiratory problem) and 09 adults in project villages and 03 in control villages for heart diseases were assessed and prevalence of chronic obstructive pulmonary disease (COPD) (Mild, Moderate and Severe) among the adults of 50 years and above was found (See flow diagram: 1).

9
Table 1.2: Health Assessment Modalities Children < 5 years Male/Female Age 50 years and above 1. History taking 1. History taking including occupational history
in detail to elicit exposures 2. General Examination
(Built/Tongue/conjunctiva/cyanosis) 2. General Examination including cognitive
functions (Built/Tongue/conjunctiva)
3. Heart rate (regular/irregular) 3. Heart rate (regular/irregular) 4. Chest Examination (for lungs) 4. Examination of respiratory system (for lungs) 5. Auscultation of lungs 5. Auscultation of lungs-for adventitious sounds 6. Auscultation of heart 6. Auscultation of heart-abnormal sounds 7. PFT (FEVI FVC and ratio)
8. ECG 1.5 Review of Health Facility Records Last one year statistics of PHC serving Project villages and the control villages were reviewed. Medical doctor and project coordinator visited ADANI hospital/CHC/PHC located in the area for collecting mortality data for last one year. The secondary data from ADANI hospital in Mundra has been procured. 1.6 Coverage for the Proposed Study The coverage for the study is summarized in Table 1.3. Table 1.3: Workload Summary Workload Project
Villages Control Village
Total
1 Review of health facilities records CHC/ Hospital CHC/ Hospital 3 2 Households Listed 2731 746 3477 3 In-depth interviews 349 66 415 4 Clinical Assessment performed 57 09 66 5 Investigation/test
(i) PFT (elderly persons, 50 years and above) (ii) ECG (elderly persons, 50 years and above)
47 10
7 2
54 12

10
1.7 Field Approach Two days intensive training was conducted at Mandvi to acquaint and orient two field supervisors and 12 field investigators for data collection. In addition to orientation on the inventions carried out the field teams were trained on each question of survey tools. Techniques of data collection, establishing rapport with the respondents, collection of good quality data and maintaining confidentiality of data collected was discussed at length during the training. One day was exclusively devoted to classroom training and one day for field practice and field testing for validating the interview schedule in the nearby non-sampled villages. Project Director and Project Coordinator imparted the training. Assignment specific training was organized to acquaint field investigators and supervisors to know more about the mock and other techniques of interview and get familiar with questionnaire. In this session investigators were able to identify their problem areas and strengthened them by putting in more efforts before proceeding for field practice. Field practice was conducted to further enhance the skills of investigators by interviewing respondents in actual field situations. Observations were made by the field coordinators and supervisors and the same was discussed in an interactive session subsequently to clear doubts and maintain standardization of subject matter. 1.8 Field Deployment Plan For this specific assignment, a core team of TALEEM Research Foundation was constituted where Director of the Foundation acted as a Project Administrator and Research Advisor. He provided required guidance and support to survey team to carry out the study. Four TALEEM faculty and/or research staff was involved in the study. Data collection work lasted about four weeks in which all three phases of data collection were completed. Two teams each consisting of one supervisor and six investigators were deployed to interview selected household respondents after training. All data collected was sanitized and entered in the computer before carrying out data analysis.

11
Consultant of Asian Development Bank (ADB), Tushar Joshi was also involved in designing, implementation and monitoring of study activities. He provided technical inputs while designing research tools and sample size. He also visited study villages while the clinical assessment was underway. Project Director led the research team for implementation of activities according to the scheduled plan. He deliberated with other members of research team and officials of CGPL for designing research tools. He also monitored field teams for pre-testing of research tools and finalization after carrying out necessary modifications. Project Director along with Project Coordinator organized two days training for field investigators and supervisors to orient them for assigned task i.e. data collection, monitoring and verification of data for maintaining good quality of data during field work. Project Coordinator was assigned the task of ensuring the quality and supervision during data collection work. He was also actively involved in training of field staff and data management. Project Coordinator also assisted Project Director in data analysis with the assistance of Computer Analyst and in preparing the draft report. Project Coordinator interfaced with CGPL team during the course of each activity and conducted spot checks and back checks to verify and maintain quality of data collected by the investigators. He also worked closely with medical team under the direct supervision of the Project Director for arranging makeshift assessment units in village Panchayat building/primary schools or health clinics and other logistics for conducting clinical assessment. 1.9 Data Analysis: Double data entry was done using FoxPro software and data analysis was carried out using SPSS version (12).
Picture 4: Investigator is interviewing a Respondent

12
1.10 Triangulation of the Findings Findings from household survey, in-depth interviews of the subjects and clinical assessment were triangulated to ascertain the prevalence and severity of respiratory and cardiovascular morbidity and mortality, creating baseline profile, to be able to assess an impact in future on the population within the same area. 1.11 Proposal for Future Health Survey The present survey establishes the baseline on morbidity and mortality among the studied population. This information will be used to assess any change in health profile among the studied population after a period of 3 years.
Flow Diagram 1: Various Stages of Data Collection

13
CHAPTER – II
POPULATION AND HOUSEHOLD CHARACTERISTICS A socio-economic profile of respondents and households is presented in this chapter. All together 415 household respondents, 349 in seven project villages and 66 households in two control villages were interviewed during household survey. Number of respondents interviewed during household survey varied from one village to another according to the population of the villages where 2011 census has been taken as base for socio-demographic data. 2.1 Background Characteristics of Households Demographic data shows that a large portion of population covered in project as well as control villages is Hindu followed by Muslim. Figure 1: Religion of Head of the Household
Almost two-thirds (66.8 percent) of households in project villages are headed by a person practicing Hinduism whereas 78.8 percent head of the households in control villages are Hindu. This is followed by 30.1 percent Muslim Head of the households in project and 21.2 percent in control villages respectively (Figure 1 and Table 2.1). Other Backward Class (OBC) is a dominating category as 45.0 percent households in project and 48.5 percent households in control villages belong to this category.

14
Figure 2: Caste of Head of Households
General caste category also known as Forward caste/class in India (to denote groups of people who do not qualify for reservation benefits2) constitutes 29.8 percent head of households in project and 24.2 percent head of households in control villages, closely followed by Scheduled Castes head of 21.2 percent households in project villages and 27.3 households (higher than general category) in control villages respectively (Figure 2 and Table 2.1).
Joint family system is being practiced by a large majority of households as 72.2 percent households in project villages and 89.4 percent households in control villages live in joint families (Figure 3 and Table 2.1).
2 https://en.wikipedia.org/wiki/Forward_caste

15
Figure 3: Type of Family
Barring 21.5 percent households in project villages living in nuclear families, very small proportion of 6.3 percent of households in project and 4.5 percent in control villages constitute extended families. Mean household size in project villages (5.9) is higher than control villages (5.0). More number of households in project villages (50.4 percent) than control villages (39.4 percent) are having BPL card (The number of people living on less than $1.9 per day3) (Figure 4 and Table 2.1).
3 http://povertydata.worldbank.org/poverty/home/

16
Figure 4: BPL Card
In contrast, mean monthly income of households in project villages is Rs. 10,103, more than Rs. 7,576 in control villages (Table 2.1), indicating comparatively higher income equality in the control villages. Table 2.1: Background Characteristics of Households Background Characteristics Project Villages Control Villages Religion Hindu 66.8 78.8 Muslim 30.1 21.2 Jain 2.9 0.0 Others 0.3 0.0 Caste of Head of Household General (High Caste) 29.8 24.2 Scheduled Castes (SC) 21.2 27.3 Scheduled Tribes (ST) 4.0 0.0 Other Backward Class (OBC) 45.0 48.5 Type of family Joint 72.2 89.4 Nuclear 21.5 6.1 Extended 6.3 4.5 Mean Household Size 5.9 5.0 Households having BPL card 50.4 39.4 Household Mean Monthly Income Rs. 10,103 Rs. 7,576 Total number of Households 349 66

17
2.2 Profile of Population A profile of population reveals that about one-third population (31.6 percent in project villages and 32.0 percent in control villages) represents to 21-35 age group, followed by little more than one-fifth population (21.0 percent project and 23.5 percent control villages) representing 6-20 years age group (Figure 5 and Table 2.2). Children in the age group of 0-5 years (17.0 percent project and 13.7 percent control) and adults above 51 years of age contribute to about 15.0 percent and 20.0 percent of population respectively. Figure 5: Age Distribution of Household Population
Male and female comprise almost equal proportion of the population in the households interviewed in project as well as control villages (Figure 6 and Table 2.2).

18
Figure 6: Gender Distribution of Population
Among the populations, 55.3 percent in project villages and 49.4 percent in control villages respectively are married. Widow/widower comprises 5.0 percent and 7.0 percent of ever married population in project and control villages respectively (Figure 7 and Table 2.2).
Figure 7: Marital Status of Household Population
Higher education has not been recognized as an asset as only 2.7 percent population in project villages and 4.2 percent population in control villages have education above higher secondary. Almost one-third population, 32.3 percent in project villages and 32.5 percent in control villages is found to be illiterate (unable to read and write).

19
Table 2.2: Profile of Population Profile Project Villages Control Villages Age distribution of Household Population 0-5 17.0 13.7 6-20 21.0 23.5 21-35 31.6 32.0 36-50 10.7 11.0 51+ 19.7 19.8 Sex Male 50.6 49.7 Female 49.4 50.3 Sex Ratio 990 988 Marital Status Married 55.3 49.4 Unmarried 39.7 43.6 Widow/Widower 5.0 7.0 Education *(*Percentage based on population age 5 years and above) Illiterate 32.3 32.5 Up to primary (1-5 class) 26.1 26.6 Middle School (6-8 class) 24.6 22.1 High School (9-10th pass) 10.8 11.4 Higher Secondary (11-12th pass) 3.4 3.1 Above Higher Secondary School 2.7 4.2 Occupation Agriculture 3.9 8.0 Industry - large scale 0.5 0.0 Industry - small scale 1.8 0.0 Transport 1.8 0.7 Construction site 1.5 1.7 Business of scrap, Machinery parts, Industrial good etc 1.0 0.7 Business as shopkeeper, vendor 1.7 0.7 Animal husbandry 3.4 2.1 Painters 0.3 0.3 Fisherman 0.9 0.0 Service / Professional 5.6 3.8 Artisan 3.3 5.2 House wife 31.8 33.6 Domestic work 11.0 9.7 Student 16.3 21.5 Retired / non working 10.8 9.0 Other 1.1 0.7 Children not going to school and non working 3.4 2.4 Total population 2,056 328

20
Education up to middle and high school together, comprise almost one-third of the population, 35.4 percent in project villages and 33.5 percent in control villages. Middle school education (24.6 percent in project villages and 22.1 percent in control villages) is having an edge over high school (10.8 percent in project villages and 11.4 percent in control villages) (Figure 8 and Table 2.2). Figure 8: Education of Household Population
Data from Table 2.2 shows that among the important occupations, home makers (housewife) contribute to about one-third (31.8 percent in project villages and 33.6 percent in control villages) of the population, followed by students (16.3 percent in project and 21.5 percent in control villages), domestic work (about 10.0 percent) and retired/non working class (slightly less than 10.0 percent). Barring above mentioned occupations, service/professional (5.6 percent project and 3.8 percent control respectively), agriculture (3.9 percent project and 8.0 percent control), animal husbandry (3.4 percent and 2.1 percent respectively) and artisan (3.3 percent and 5.2 percent respectively) are other occupations of the populations (Figure 9 and Table 2.2).

21
Figure 9: Occupation of Household Population
2.3 Socio-Economic Characteristics of Households So far as ownership of house is concerned, a large proportion of households (85.4 percent in project and 95.5 percent in control villages) own a house. Renting a house has been in practice, especially in villages close to CGPL and ADANI thermal power plants, as 12.9 households in project villages and 4.5 percent households in control villages are living in rented houses. Constructed pucca4 houses is an important feature of the housing as 59.9 percent houses in project and even larger proportion (86.4 percent) households in control villages are having pucca houses (Figure 10 and Table 2.3).
4 Pucca houses are strong houses. They are made up of wood, bricks, cement, iron rods and steel. Flats and bungalows are pucca houses. Such houses are called permanent houses.

22
Figure 10: Type of House
Overwhelming majority of households (81.9 percent in project and 97.0 percent in control villages) have tap water available in their houses and at least 6.9 percent households in project villages are using bottled water as reported by the households (Figure 11 and Table 2.3). Figure 11: Main Source of Drinking Water

23
Figure 12: Type of Cooking Fuel Used
A very small proportion of households (7.4 percent) in project villages are using kerosene as a fuel for cooking whereas only 2.0 percent households use biogas. No household in control villages uses either kerosene or biogas, survey data reveals. A detailed investigation needs to be carried out to establish any association of exposure to smoke and other constituents of combustion with COPD (respiratory problem).
Responding to a multiple answer question about the use of fuel for cooking, 75.9 percent respondents in project villages and 80.3 percent respondents in control villages state that firewood is being used for cooking in their households. This is followed by 22.1 percent respondents in project villages and 24.2 percent in control villages saying LPG is being used as fuel for cooking (Figure 12 and Table 2.3).

24
Table 2.3: Socio-Economic Characteristics of Households Characteristics Project Villages Control Villages Ownership of house Own House 85.4 95.5 Rented House 12.9 4.5 Living in relative/friends house without paying rent 1.7 0.0 Other 0.0 0.0 Type of house Kutccha 7.7 1.5 Pucca 59.9 86.4 Kutccha –Pucca 31.8 12.1 Hut 0.6 0.0 Main source of drinking water Tap water 81.9 97.0 Surface water (pond, river, sea, lake etc) 0.0 0.0 Dug well 0.3 0.0 Tube well/Bore well 1.7 1.5 Bottled water 6.9 0.0 Others 9.2 1.5 Household with Electricity Connection 94.3 97.0 Type of Cooking Fuel used* Electricity 2.0 1.5 LPG/Natural Gas 22.1 24.2 Biogas 2.0 0.0 Kerosene 7.4 0.0 Coal / Lignite 0.9 0.0 Charcoal 1.1 1.5 Wood 75.9 80.3 Dung cakes 1.7 1.5 Type of toilet facility used Sanitary Toilet 83.1 90.9 Non-sanitary Toilet 1.4 0.0 Open Space/Field 15.5 9.1 Others 0.0 0.0 Total Number of Households 349 66
* A multiple answer question, hence percentage may go beyond 100%
A good feature of household characteristics in these villages is availability of sanitary toilets in the household. Sanitary toilet here refers to flush/pour flush to piped sewer system or to a septic tank. The flushing toilet provides a comfortable, safe and hygienic method of sewage disposal. The force of the water from the flushing mechanism, which is called the cistern, washes the urine, faeces and toilet paper out into the septic tank or sewage system. Proper sanitation prevents human being from various diseases which are transmitted via the faecal - oral route.

25
The survey reveals that 83.1 percent households in project villages and 90.9 percent households in control villages use sanitary toilets. Rest of the households, 15.5 percent in project villages and 9.1 percent in control villages use open space/field for defecation (Figure 13). Figure 13: Type of Toilet Used by the Household
2.4 Household Possessions Same pattern is observed in both projects as well as control villages for important household possessions, though with varying degree of percentages (Table 2.4). In descending order of percentages, as given in the parenthesis for project and control villages respectively, electric fan (94.8 percent in project villages and 98.5 percent in control villages), mobile telephone (89.7 percent and 87.9 percent), colour television (75.6 percent and 77.3 percent), motorcycle/scooter (48.1 percent and 39.4 percent), refrigerator (31.5 percent and 27.3 percent) and bicycle (17.5 percent and 21.2 percent) are the assets possessed by the households.
It is worth mentioning that 30.4 percent household in project villages and 27.3 percent household in control villages have LPG Stove (Table 2.4). Data reveals that more number of households is having LPG stove than those stated using LPG for cooking (22.1 percent respondents in project villages and 24.2 percent in control villages, Table 2.3.). This indicates that though households are having LPG in their houses but may not be using it for regular cooking.

26
Table 2.4: Household Possessions/Assets Household Assets Project Villages Control Villages Radio/Transistor 2.3 0.0 Electric Fan 94.8 98.5 LPG Stove 30.4 27.3 Sewing Machine 8.0 12.1 Black and White Television 4.9 9.1 Colour Television 75.6 77.3 Washing Machine 4.9 0.0 Refrigerator 31.5 27.3 Mobile Telephone 89.7 87.9 Any other Telephone 2.0 1.5 Computer 2.9 1.5 Bicycle 17.5 21.2 Motorcycle/Scooter 48.1 39.4 Three wheeler/Auto/Chhakhada 6.0 4.5 Jeep/Toofan 3.2 0.0 Small car (Maruti 800/Alto/Indica) 1.4 0.0 Luxurious car (Honda city, Skoda, BMW, Mercedez) 1.4 0.0 Fishing Boat 0.6 0.0 Heavy earth machine/dumper/JCB/Hydra crane etc. 0.6 1.5 Tractor 2.0 3.0 Water Pump 0.9 0.0 Thresher 0.0 0.0 Total Number of Households 349 66
Among other assets that might be used for economic gains by the households are sewing machine (8.0 percent and 12.1 percent), three wheeler/auto/chhakhada (6.0 percent and 4.5 percent) and Jeep/Toofan (3.2 percent and 0.0 percent), tractor (2.0 percent and 3.0 percent) and heavy earth machine/dumper/JCB/Hydra crane etc (0.6 percent and 1.5 percent).
2.5 Land Ownership Data points out that agriculture is not an important occupation (Table 2.2) as only 21.2 percent households in project villages own land with average land holding of 4.9 acre and average size irrigated land of 1.2 acre (Table 2.5).

27
Table 2.5: Land Ownership (in Acres) Land Ownership Project Villages Control Villages% Households own land 21.2 21.2 Average land holding (in Acres) 4.9 5.6 Average irrigated land 1.2 1.6 Average non-irrigated land 3.5 3.7 Average non- agricultural land 0.2 0.0 Total Number of Households 349 66
On the other hand, same proportion of household (21.2 percent) own land in control villages with average size land holding of 5.6 acre and average irrigated land size of 1.6 acre. 2.6 Household Livestock Livestock in project as well as control villages mainly comprise cow/bull, buffaloes and goats. Out of those households reportedly having livestock, 89.9 percent in project villages and 87.8 percent households in control villages have cow/bulls. Table 2.6: Household Owning Livestock Percent of household owning livestock Project Villages Control Villages % Households own live stocks 57.0 62.1 Type of livestock* (Based on those household having livestock) Cows/Bulls 89.9 87.8 Buffaloes 25.6 9.8 Camel 1.0 0.0 Horses/Donkeys/Mules 2.5 2.4 Goat 18.1 14.6 Sheep 1.5 2.4 Chicken/Ducks 1.5 0.0 Others 0.0 0.0 Total number of households 349 66
About one-fourth households (25.6 percent) in project villages have buffaloes whereas only 9.8 percent households in control villages own buffaloes. Goat is another main livestock as 18.1 percent households in project villages and 14.6 percent households in control villages have this livestock.

28

29
CHAPTER – III
HYGIENE PRACTICES
Hygiene and health have a direct relationship. Practicing good hygiene habits prevent people from many health problems and thus save tremendous amount of resources such as time and money. Good hygiene practices also save people from lot of diseases that are preventable otherwise. This chapter describes hygiene practices of the households in project as well as control villages covered in the study. This includes cleaning of houses, cleaning of surroundings, dumping of domestic waste, disposal of solid waste and child faeces.
3.1 Hygiene Practice Cleaning of house is an essential activity that has been performed by almost each household. Out of 349 households interviewed in seven project villages, almost all (98.0 percent) households clean their houses daily, a good hygiene habit practiced by the villagers. Likewise, all 66 households (100.0 percent) interviewed in two control villages also clean their houses daily (Figure 14 and Table 3.1). Similarly, a large majority of households in project villages (85.4 percent), though less than households cleaning houses daily (98.0 percent), cited cleaning surrounding of their houses daily. There are 10.0 percent households in project villages and 12.1 percent households in control villages that do not clean surrounding of their houses daily or every alternate day (Figure 14 and Table 3.1).
Figure 14: Hygiene Practices including Waste Disposal

30
Table 3.1 illustrates that majority of households (78.8 percent in project and 83.3 percent households in control villages respectively) neither have dustbin inside nor outside the boundary of their houses. In other words, a major chunk of households in these villages dump household solid waste/litter directly in a dumping yard outside their house. However, better hygiene habits are being practiced in project villages as 32.7 percent households have dustbin inside and 17.5 percent households have dustbin outside the boundary of their houses for collecting solid waste/litter as compared to control villages, 12.1 percent households having dustbin inside and 10.6 percent households having dustbin outside the boundary of their houses. Table 3.1: Hygiene Practices
Hygiene Practices Project Villages Control Villages Cleaning of House Daily 98.0 100.0 Every alternate day 1.4 0.0 Twice a week 0.3 0.0 Once a week 0.3 0.0 Cleaning of Surrounding Daily 85.4 86.4 Every alternate day 4.6 1.5 Twice a week 3.7 9.1 Once a week 2.3 0.0 Sometime/not regularly 4.0 3.0 Dumping of Waste* Dustbin inside the boundary of house 32.7 12.1 Dustbin outside the boundary of house 17.5 10.6 In a dumping yard outside the house 78.8 83.3 Others 0.6 0.0 Practice of Disposal of Solid Waste/Litter* Throwing in a dumping ground 90.3 97.0 Burning litter/solid waste regularly 27.5 51.5 Leaving to its natural decay/perishing 10.0 4.5 Burying underground 2.3 1.5 Composting the waste/litter 24.6 9.1 Others 4.3 0.0 Practice of Disposing of Child Faeces* Washing it into Septic tank 13.8 9.1 Washing/throwing it into an open pit 12.0 53.0 Throwing in a dumping ground 79.4 84.8 Burying underground 6.9 21.2 Leaving to its natural decay/perishing 3.2 1.5 Composting it 13.2 6.1 Others 3.2 6.1 Total number of households 349 66
* A multiple answer question, hence percentage may go beyond 100%

31
Composting the waste/litter is the third most preferred practice as about one-fourth (24.6 percent) households in project villages reported to have practiced this method of disposal of solid waste/litter. Contrary to this, only 9.1 percent households in control villages practice composting the waste/litter as a method of disposal.
Child faeces in India are disposed in an unhygienic manner by a large population. Similar practices of disposal of child faeces have been reported in project as well as control villages during household survey. Responding to a multiple options question, about 80.0 percent households reported (79.4 percent project and 84.8 percent control villages) disposing off child faeces in most unhygienic manner, throwing it in a dumping ground. Exposed in a dumping ground, child faeces may add to health hazards. Washing it into septic tank, a good disposal habit is practiced by only 13.8 percent households in project villages and 9.1 percent households in control villages. Use of open pit for throwing child faeces is preferred by 53.0 percent households in control villages. On the other hand, only 12.0 percent households in project villages wash child faeces into an open pit (Table 3.1). 3.2 Perception about Industrial Activities Causing an Impact on Air Quality Industrial activities may sometimes pose significant health hazards, if not checked. Such activities may enhance risk of causing adverse health impact and serious harm. Information is sought through this question to know whether any industrial emissions are impacting the population in these villages.
About three-fourths households (73.4 percent) in project villages had the perception that thermal power stations) are resulting in hazardous emissions in their assessment. Only 7.6 percent household respondents in control villages mention that thermal power stations are causing air pollution (Table 3.2). The response of small percentage of households in control villages to this question appears to be justified as distance of control villages from thermal power stations is large as compared to project villages. Hence perception of households in control villages is different than project villages.
Data from a multiple answer question reveals that so far as disposal of solid waste/litter is concern a vast majority of 90.3 percent households in project villages and even more, 97.0 percent households in control villages throw their household waste/litter in a dumping ground for disposal as a most preferred practice. The second most preferred practice followed in project villages (27.5 percent households) and about half (51.5 percent households) in control villages is burning litter/solid waste regularly.

32
Table 3.2: Perception about Industrial Activities Causing Air Pollution Industrial Activities Causing Air Pollution Project Villages Control VillagesThermal power station 73.4 7.6 Paint industry 0.3 0.0 Any other industry (construction work) 8.0 24.2 No such activity causing air pollution 18.3 68.2 Total number of households 349 66
On the other hand, 18.3 percent households in project villages and 68.2 percent households in control villages are of the opinion that no such activity is causing air pollution in their villages (Figure 15). Figure 15: Perception of People about Activity Causing an Impact on Air Quality

33
CHAPTER – IV
PREVELANCE OF RESPIRATORY PROBLEMS AND HEART DISEASES
In an attempt to develop a baseline profile of public health with respect to emissions, a survey was carried out to record persons reported by their households to be having respiratory problem and heart diseases. For this purpose 415 households (349 in seven project villages and 66 in two control villages) were surveyed. On the basis of information provided by the respondents interviewed at the time of household survey, 90 out of 809 persons were reported having either respiratory problem or heart diseases or both. After household survey in which 415 households were covered (186 for children less than 5 years and 229 for adults aged 50 years and above), 90 persons including 16 children less than 5 years (14 project and 02 control villages), 56 adults having respiratory problem (49 project and 07 control villages) and 18 adults having heart diseases (15 project and 03 control villages) were identified for clinical assessment to be carried out for respiratory problem and/or heart diseases on the basis of symptoms reported by their households (Table 4.0). Out of 90 identified persons, only 66 persons (9 children for respiratory problem, 45 adults for respiratory problem and 12 adults for heart diseases) were clinically assessed. A flow diagram clearly depicts various processes of data collection; children and adults reported having respiratory problem and heart diseases and number of children and adults clinically assessed.

34
Project ‐ 7 Villages
HH listed ‐ 2731
Total HHs listed in Project and Control Villages (3477 households)
Control ‐ 2 Villages
HH listed ‐ 746
HH surveyed ‐ 349 HH surveyed ‐ 66
No. of persons reported having Respiratory Problem and Heart Diseases ‐ 90 out of 809
No. of Persons underwent Clinically Assessed ‐ 66
Outcome
Respiratory Problem (PFT) Asthama/LRTI/COPD
Children Normal – 3 Moderate– 1 Severe – 3
Adults Normal – 9 Mild ‐ 2
Moderate – 6 Severe – 20 Asthma ‐ 3
Adults Normal – 7 Abnormal ‐ 2
Heart Disease (ECG)
Children Asthma – 1 Moderate– 1
Adults Normal – 1 Moderate– 2 Severe ‐ 2
Adults Normal – 2 Abnormal ‐ 1
Heart Disease (ECG)
Flow Diagram 2: Summary of Survey
Respiratory Problem
Children ‐ 2 Adults ‐ 7 Adults ‐ 3
Heart DiseaseRespiratory Problem
Children ‐ 14 Adults ‐ 49 Adults ‐ 15
Heart Disease
Respiratory Problem
Children ‐ 7 Adults ‐ 40 Adults ‐ 9
Heart Disease Respiratory Problem
Children ‐ 2 Adults ‐ 5 Adults ‐ 3
Heart Disease
Population Covered ‐ 705 Population Covered ‐ 104
Respiratory Problem (PFT) Asthama/LRTI/COPD

35
Table 4.0: No. of Households Reported Respiratory Problem and Heart Diseases During Household Survey and Clinical Assessment Performed
Study Villages Project Villages
Control Village
Total
Sample Covered in Household (HH) Survey
Children Age < 5 years 156 30 186
Adults aged >50 years 193 36 229
Total sample covered 349 66 415
No. of Persons Identified with Respiratory and Heart Related Problem Children < 5 Years and Adults > 50 Years and Above Children having Respiratory problem 14 2 16
Adult having Respiratory problem 49 7 56
Adult having Heart problem 15 3 18
Persons identified with respiratory and Heart Related
problem 78 12 90
No. of Persons Clinically Assessed for Respiratory and Heart Related Problem Children < 5 Years and Adults > 50 Years and Above Children having Respiratory problem 7 2 9
Adult having Respiratory problem 40 5 45
Adult having Heart problem 9 3 12
No. of Persons clinically investigated 56 10 66
Clinical assessment was conducted for persons identified with respiratory problems and heart diseases. Apart from physical check up, pulmonary function test (PFT) for people having respiratory problem and electrocardiogram (ECG) for persons reported having heart diseases was carried out. The outcome of tests carried out during clinical assessment is described in the following section 4.1.

36
Picture 5: Doctor Assessing a Child Reported having Respiratory Problem
4.1 Prevalence of Respiratory Problems among Children Less than Five Years of Age As per data presented in the Table 4.1, only 3.7 percent households (13 out of 349 households in project villages and almost same percentage (3.0 percent) i.e. 2 out of 66 households in control villages report children less than 5 years of age having respiratory problem. In terms of population estimated from those households having reported persons suffering from respiratory problem and/or heart disease covered during household survey, 4.7 percent (14 out of 299) children less than five years of age in project villages and 5.1 percent (2 out of 39) children in control villages were reported having respiratory problem on the basis of symptoms mentioned by the respondents.

37
Table 4.1: Prevalence of Respiratory Problem Among Children under Five Years (U5) of age
Prevalence Project Villages Control Villages
% HH reported incidence of Respiratory Problems 3.7 3.0 Total no. of households 349 66 Total no. of children in surveyed households 299 39 % of Children less than 5 years of age reported having Respiratory Problem 4.7 5.1
Experiencing since < 30 days 0.0 1 (50.0) 30-60 days 1(6.7) 1 (50.0) 61-90 days 4(26.7) 0.0 Above 90 days 10 (66.7) 0.0 No of episodes reported in last 30 days 1 8 (53.3) 1 (50.0) 2 4 (26.7) 1 (50.0) 3+ 3 (20.0) 0.0 No of times treatment taken 1 8 (53.3) 1 (50.0) 2 5 (33.3) 1 (50.0) 3+ 2 (13.3) 0.0 Total number of children < 5 years reported to be suffering from Respiratory Problem 14 2
In other words, prevalence of respiratory problem among children less than 5 years of age is estimated to be 4.7 percent (14 out of 299) in project villages and 5.1 percent (2 out of 39) children in control villages (Figure 16 and Tables 4.1 and 4.2). However, the percentage of incidence should be interpreted cautiously as the number of reported cases is very small (14 cases in project and 2 in control villages only). Figure 16: Prevalence of Respiratory and Heart Diseases

38
Among the children, it is noted that a high proportion (66.7 percent, 10 out of 14) of subjects in project villages have been having respiratory problem for a longer duration, above 90 days (Table 4.1). About one quarter of prevalence of respiratory problem in project villages existed for 61 to 90 days. In other words, nine out of ten subjects with respiratory problem (93.4 percent) in project villages are children less than five years of age experiencing for more than 60 days (Table 4.1). Contrary to this, prevalence of respiratory problem in control villages are reported to be of shorter duration (less than 60 days), half of the total prevalence of respiratory problem falling in each category of duration i.e. < 30 days and 30-60 days. In about half of the prevalence, 8 out of 15 children (53.3 percent) in project villages and one out of 2 (50.0 percent) in control villages, only 1 episode of respiratory problem is reported to have occurred in last 30 days (Figure 17 and Table 4.1). Figure 17: Duration of Children Suffering from Respiratory Problem
Occurrence of two as well as three and more episodes of respiratory problem in children in last 30 days is more or less equally spread in project villages. Slightly more than one-fourth (26.7 percent) i.e. four out of 14 subjects have two episodes of respiratory problems whereas three out of 14 (20.0 percent) subjects have three and more episodes of respiratory problem in project villages. On the other hand, half of the children (one out of two) in control villages has been reported having one episode of respiratory problem while another 50.0 percent children (one out of two) reported having two episodes of respiratory problem in last 30 days’ duration (Table 4.1).
Almost similar pattern is repeated in taking treatment for respiratory problem as is observed in occurrence of number of episodes in last 30 days. It is revealed that little more than half (53.3 percent, 8 out of 14) children having respiratory problem in project villages have taken treatment only once. About one-third children (5 out of 14) having respiratory problem and a very small

39
proportion (13.3 percent, 2 out of 14) children having respiratory problem have taken treatment twice and three and more times respectively, as reported by the households. In control villages, 50.0 percent (1 out of 2) subjects of respiratory problem have reported taking treatment once and in case of another 50.0 percent (1 out of 2) subjects, treatment was taken twice (Table 4.1).
4.2 Prevalence of Respiratory Problems and Heart Diseases among Population 50 years and above Prevalence of respiratory problem among adults 50 years of age and above is found to be more in project as well as control villages. Precisely, prevalence of respiratory problem among adults, 50 years and above is estimated to be 12.1 percent (6 out of 49) in project villages and 10.8 percent (1 out of 7) in control villages. Again, these percentages are based on a very small number (56 adults) of subjects with respiratory problem (49 in project villages and 07 in control villages), hence the result should be interpreted cautiously (Table 4.0). Picture 6: Pulmonary Function Test (PFT) of a Woman is being Carried out
Respiratory problem pattern in project villages as well as control villages reveals that slightly more than two-fifths (42.9 percent, 21 out of 49) subjects of respiratory problems in project villages and 57.1 percent (4 out of 7) subjects in control villages have been affected for more than six years. Only 6.1 subjects (3 out of 49) in project villages have reportedly been affected for less than one year. This reflects that most of the prevailing morbidity (71.4 percent, 03 to 06 years and above duration) reported by respondents in project villages is chronic in nature (suffering for more than 3 years). Like wise 57.1 percent (4 out of 7) households in control villages have reported persons having respiratory problems for six and more years whereas 42.9 percent (3 out of 7) cases in control villages are reported to have occurred within last two years. Concisely, 59.2 percent morbidity (29 out of 49) attributable to respiratory problem in project

40
villages are chronic, having been present for more than five years whereas 57.1 percent morbidity (4 out of 7) in control villages occurred five and more years ago (Table 4.2).
Table 4.2: Prevalence of Respiratory Problem and Heart Diseases among Population 50 Years and Above
Prevalence of Respiratory Problem and Heart Diseases
Project Villages Control Villages Respiratory
Problem Heart
Diseases Respiratory Problem
Heart Diseases
% HH reported prevalence of Respiratory Problem and Heart Disease 13.8 4.3 10.6 4.5
Total Number of Households 349 349 66 66 Total No. of Adults in Surveyed Households 406 65
% of Adults 50 Years and above Reported having Respiratory Problem and Heart Disease
6 (12.1) 3.7 10.8 4.6
Suffering since < 1 year 3 (6.1) 3 (20.0) 2 (28.6) 0.0 1-2 year 12 (22.4) 4 (26.7) 1 (14.3) 0.0 3-4 year 6 (12.2) 1 (6.7) 0.0 0.0 5-6 year 8 (16.3) 0.0 0.0 0.0 6 years and above 21 (42.9) 7 (46.7) 4 (57.1) 3 (100.0) Treatment Continuing 46 (93.9) 13(86.7) 6 (85.7) 3 (100.0) Total number of adults reported having respiratory problem 49 15 7 3
Only three (4.6 percent) incidence of heart disease have been reported by respondents interviewed in control villages. Nevertheless, 15 persons in project villages and 03 persons in control villages are reported having heart disease (Table 4.2).
Out of this, 46.7 percent (7 out of 15) incidence of heart disease in project villages and all persons in control villages are chronic, having for more than six years and above. An equal percentage (46.7 percent, 1 to 2 years duration) of persons having heart disease in project villages are reported to have been afflicted for last two years only (Figure 18 and Table 4.2).

41
Figure 18: Duration of Population 50 years and above having Respiratory and Heart Diseases
It has been found that a large proportion of those having respiratory problem in project (93.9 percent, 46 out of 49 reported persons) as well as control villages (85.7 percent, 6 out of 7 reported persons) have been continuing with treatment. Similarly 86.7 percent (13 out of 15) persons in project villages and all (100.0 percent; 3 out 3) persons in control villages, having heart diseases, are also continuing with the treatment (Table 4.2).
Picture 7: Electrocardiogram of an Elderly Person is being Performed

42
4.3 Clinical Assessment Outcomes As mentioned earlier in section 4.1, during the household survey, a total 90 persons were reported to be having respiratory problems and/or heart diseases. This includes 16 children (14 project and 2 control villages), 56 adults (49 project and 7 control villages) for respiratory problems and 18 persons (15 project and 3 control villages) for heart diseases. Out of these, 66 persons (9 children and 45 adults for respiratory problems and 12 adults for heart diseases underwent clinical assessment (Table 4.2A). Table 4.2A: No. of Persons Reported having Respiratory Problem and Heart Diseases
Clinically Assessed
Description
Project Villages Control Village
Total Respiratory Problems
Heart Diseases
Respiratory Problems
Heart Diseases
Children Adults Adults Children Adults Adults Persons reported 14 49 15 2 7 3 90 Persons underwent clinical investigation 7 40 9 2 5 3 66
According to the information received from the persons who were clinically assessed and their detailed history was recorded at the time of the clinical assessment, no specific factor barring presence of allergy in children less than 5 years of age, 57.1 percent, (4 out of 7 children) in project villages and 50.0 percent, (1 out of 2 children) in control villages is found to be responsible for causing the respiratory problem. Only 14.3 percent (1 out 7) children, in project villages and 100.0 percent (2 out 2) children in control villages, having respiratory problem, were identified as having low standard of living index (SLI). Barring this, in majority of instance of respiratory problem among the children (less than 5 years) as well as adults (50 years and above), factors affecting respiratory problem remain obscure. Little more than 85.0 percent persons in project villages (children 85.7 percent and adults 87.5 percent) do not report presence of respiratory problem in the family whereas none of the clinically assessed persons in control villages has family history of respiratory problem. All but 20.0 percent adults in control villages are not exposed to any occupational hazard the data reveals (Table 4.3). 4.4 Lung Function Measurement Pulmonary Function Test (PFT) results reveal 42.9 percent (3 out of 7) children and 22.5 percent (9 out of 40) adults in project villages have uncompromised lung functions. However, 14.3 percent (1 out of 7) children and 15.0 percent (6 out of 40) adults in project villages have a moderate alteration in lung functions). Yet, half of children (50.0 percent, 1 out of 2) and two-fifths of adults (40.0 percent, 2 out of 5) clinically assessed in control villages, are found to be moderately affected by respiratory problem (Asthma/LRTI/COPD). About half of the adults (50.0 percent, 20 out of 40) in project villages and 2 out of 5 adults (20.0 percent) in control villages are found having severe chronic obstructive pulmonary disease (COPD) (Table 4.3).

43
Table 4.3: Prevalence of Respiratory Problem among Children U5 and adult 50 years and
Above
Prevalence of Respiratory Problem
Project Villages Control Villages
Children Under Five
Age 50 years and
above
Children Under Five
Age 50 years and
above Standard of Living Index (SLI) Low 1 (14.3) 12(30.0) 2(100.0) 2(40.0) Medium 6 (87.7) 24(60.0) 0.0 3(60.0) High 0.0 4(10.0) 0.0 0.0 Occupational Hazard Exposed 0.0 0.0 0.0 1(20.0) Non-Exposed 7(100.0) 40(100.0) 2(100.0) 4(80.0) Family History Yes 1(14.3) 5(12.5) 0.0 0.0 No 6(85.7) 35(87.5) 2(100.0) 5(100.0) Allergy Presence 4(57.1) 9(22.5) 1(50.0) 0.0 Absence 7(42.9) 31(77.5) 1(50.0) 5(100.0) Suffering Since < 1 year 0.0 1(2.5) 0.0 1(20.0) 1-2 year 0.0 9(22.5) 1(50.0) 1(20.0) 3-4 year 0.0 6(15.0) 0.0 0.0 5-6 year 0.0 6(15.0) 1(50.0) 0.0 6 years and above 7(100.0) 18(45.0) 0.0 3(60.0) PFT Normal 3(42.9) 9(22.5) 0.0 1(20.0) Asthma 0.0 3(7.5) 1(50.0) 0.0 Mild COPD 0.0 2(5.0) 0.0 0.0 Moderate COPD 1(14.3) 6(15.0) 1(50.0) 2(40.0) Severe COPD 3(42.9) 20(50.0 ) 0.0 2(40.0) Total number of patients 7 40 2 5
Clinical assessment (ECG) data reveals that majority of subjects (77.8 percent, 7 out of 9 persons) in project villages and (66.7 percent, 2 out of 3 persons) in control villages, are suspected having cardio vascular disorder. Only 22.2 percent (2 out of 9) subjects in project villages and 33.3 (1 out of 3) subjects in control villages have abnormal ECG. To conclude, in majority (66.7 percent, 6 out of 9 persons) of subjects in project and as well as in control villages (66.7 percent, 2 out of 3 persons), having heart diseases, blood pressure is found to be normal and in the rest one-third subjects blood pressure was found to be abnormal after clinical assessment Table 4.4).

44
Table 4.4: Prevalence of Heart Diseases by Associated Factors Prevalence of Heart Diseases Project Villages Control Villages Standard of Living Index (SLI) Low 1(11.1) 0.0 Medium 5(55.6) 3(100.0) High 3(33.3) 0.0 Smoking Habits Smoking 3(33.3) 1(33.3) Non-Smoking 6(66.7) 2(66.7) Blood Pressure High 3(33.3) 1(33.3) Normal 6(66.7) 2(66.7) Family History of Heart Diseases Yes 0.0 1(33.3) No 9(100.0) 2(66.7) Diabetes Yes 0.0 0.0 No 9(100.0) 3(100.0) Suffering Since < 1 year 1(11.1) 0.0 1-2 year 1(11.1) 0.0 3-4 year 1(11.1) 0.0 5-6 year 0.0 0.0 6 years and above 6(66.7) 3(100.0) ECG Normal 7(77.8) 2(66.7) Abnormal 2(22.2) 1(33.3) Total number of Patients reported Heart Diseases 9 3
The primary data on mortality collected at the time of household survey from seven project villages and two control villages do not establish any specific disease causing a large number (majority) of deaths occurred during January 1, 2015 to December 31, 2015 (Table 4.5A).
Table 4.5A: Mortality and Causes of Death (January 1, 2015 to December 31, 2015) (Primary Data) Mortality and Causes of Death No. Major Causes of Death
No. of neonatal death 1 Respiratory infection
No. of infant death 0 -
No of U5 child death 0 -
No. of death above five years 5 Diabetes, Asthma, Hypertension, COPD Unknown/sudden death
Total No. of death 6 Source: Adani Hospital, Mundra

45
However, secondary data (April 1 2015 to March 31, 2016) received from ADANI Hospital at Mundra reveals six out of 12 (50.0 percent) mortality occurring from cardio respiratory arrest. Data available in Table 4.5B clearly brings out the fact that none of the deaths reported during April 1, 2015 to March 31, 2016 is neither from project nor from control villages.
Table 4.5B: Mortality and Causes of Death (April 1, 2015 to March 31, 2016 (Secondary Data) Sr. No. Patient Name Age\Sex Treating
Dr. Diagnosis Patient address
Date of death
1 B\o Nutanben Oza 2month\ mch Dr.Triyank Detail of death not
available Bihar 4/25/2015
2 Jkha Vishram Shakhra 56\m Dr.Maulik Cardiorespiratory arrest Zarpara 4/28/2015
3 Madarsing Shivubha Jadeja 65\m Dr.Maulik Right lower zone
collapse,type-2dm,htn,ihd Gundala 7/4/2015
4 Ranbai Madan Sakhra 70/f Dr.Mukul Head injury,sudural collection, left temporal fracture
Zarpara 8/25/2015
5 Asmal Juma Sodhra 89/m Dr.Maulik Accute coronary syndrome, copd, anaemia Gundala 11/20/2015
6 Narubha Kalubha Jadeja 95\m Dr.Maulik Cardiorespiratory arrest Bhadreshwar 12/22/2015
7 Dhaneshbhai Ratanshankar Vyas 71/m Dr.Maulik Cardiorespiratory
arrest,lvf,crf,ihd Mundra 1/7/2016
8 Usmanbhai Ilyas Sumra 50/m Dr.Maulik Cardiorespiratory
arrest,Ml,ihd Nana kapaya 1/28/2016
9 Dinumati Madhvjibhai Rathod 92\f Dr.Maulik Cardiorespiratory arrest Bhavnagar 2/28/2016
10 Sonbai Samra Gadhvi 86/f Dr.Maulik As per pm report (brought dead) Mundra 3/21/2016
11 Kanubhai Chalubha Jadeja 75/m Dr.Maulik Cardiorespiratory
arrest,anterior wall mi,arf Mundra 3/31/2016
12 Maniben Hirajibhai Mamniya 85/f Dr.Maulik As per pm report(brought
dead) Mundra 3/31/2016

46
4.5 Respiratory Problem and Associated Factors It is scientifically proved that respiratory problems are associated with pollutants present in the air (caused by transportation, fuel combustion in stationary sources, burning of fossil fuels like coal, wood, crop residues and various construction activities). The data presented in the Table 4.6 illustrates that majority of households (54.2 percent, 32 out of 59 households) having reported cases of respiratory problems among children and adults in project villages and 77.8 percent households (7 out of 9 households) in control villages have stated using firewood for cooking whereas 37.3 percent (22 out of 59) households in project villages and 11.1 percent (1 out of 9) households use LPG for cooking. Almost all households (96.6 percent, 57 out of 59) in project villages and all households (100.0 percent) in control villages have adequate ventilation in kitchen. Hence, use of firewood as fuel alone may not cause respiratory problem. Similarly, more number of households, 62.7 percent (37 out of 59) in project and 66.7 percent (6 out of 9) in control villages, reporting respiratory problems have medium standard of living index. Seventeen (17) out of 59 households (28.8 percent) in project villages and three (3) out of 9 households (33.3 percent) in control villages, reported having respiratory problems, have low standard of living index (SLI). From this, it appears that though a majority households are using firewood for cooking yet, reported respiratory problems in these households may not directly relate to it as almost all households have ventilated kitchens. Similarly, majority of households, reported having respiratory problem have medium standard of living index, hence low level of SLI does not relate to respiratory problems as well (Figure 19 and Table 4.6). Figure 19: Perception of People about Activity Causing Air Pollution

47
Table 4.6: Type of Fuel used for Cooking and Ventilation Provision in the Households Reported having Respiratory Problems Type of Fuel and Ventilation Facility Project Villages Control Villages Main type of fuel mainly use for cooking LPG 22(37.3) 1(11.1) Wood 32(54.2) 7(77.8) Other cooking fuel 5(8.5) 1(11.1) Ventilation available in Kitchen Yes 57(96.6) 9(100.0) No 3.4 0.0 Standard of Living Index (SLI) Low 17(28.8) 3(33.3) Medium 37(62.7) 6(66.7) High 5(8.5) 0.0 Total number of households reported respiratory related problem among Children and Adults 59 9

48

49
CHAPTER V
SUMMARY AND CONCLUSION The present survey was undertaken on the request of CGPL, a TATA Power Project in seven
project (within 10 km. radius of the plant) and two control villages. The study was based on the
quantitative data and clinical assessment of children less than five years and adults 50 years and
above. Under the study 156 households with children under five years of age and 193
households having population aged 50 years and above were covered in project villages. In case
of control villages a total of 30 households having children less than five years and 36
households having population aged 50 years and above were covered. In all, 54 PFT and 12
ECG were carried out by a competent physician in makeshift clinics in each of the study villages.
The broad aim of the study was to assess the prevalence of pneumonia and respiratory morbidity
among children less than five years age and COPD and heart diseases among adults 50 years and
above to have a baseline data for future evaluation of health scenario with respect to air
pollution. The broad observations of the study are highlighted below:
• The project villages and control villages selected for baseline profile of public health study
are quite similar in terms of demographic and socio-economic parameters.
• More number of households is having LPG stove than those reported using LPG for cooking.
• The study reveals that hygiene practices like cleaning of houses, disposal of solid waste and
child faeces are evenly followed in project as well as control villages. However, the use of
dustbin for disposal of household waste is reported to be more in project villages than in
control villages.
• There is common perception in project villages that Thermal Power Plants are causing air
pollution affecting health of the people.
• The prevalence of respiratory problem among children less than five years remains more or
less same in project (4.7 percent) and control villages (5.1 percent). Almost all of them have
sought treatment also.

50
• The prevalence rate of respiratory illness among adult aged 50 years and above is higher as
compared to the children less than five years in both project and control villages. Overall
12.1 percent population of adult in project and 10.8 percent in control villages have been
reported having respiratory illness.
• A total of 18 cases of heart disorders among adults, 15 cases in project and three cases in
control villages are reported during the survey.
• The history of heart disease and COPD in subjects indicates that a significant proportion
have had problems for more than five years even whereas the operation function of CGPL
was not there.
• The clinical assessment and morbidity history taken for the patients suffering from respiratory
illness (COPD) suggests no specific factor responsible for causing respiratory problem barring
presence of allergy among children less than five years (57.1 percent project and 50.1 percent
control villages).
• Pulmonary Function Test (PFT) results reveal that nearly half of the children are having
respiratory afflictions and adults having severe COPD.
• The result of ECG Test confirms that majority (77.8 percent project and 66.7 percent control
villages) of the subjects in project and control villages are normal.
• Though a majority of households, having reported cases of respiratory problems (54.2 percent
in project and 77.8 percent in control villages), using firewood as fuel for cooking yet, more
than 95.2 percent household (57 out of 59 in project and 9 out of 9 in control villages) have
reported having adequate ventilation in their kitchen.
• Standard of Living Index (SLI), smoking habit, high blood pressure, family history and
diabetes are not found associated with heart disease in majority of the incidences though high
blood pressure and smoking habit are found to be present among subjects in both project and
control villages.
• Mortality data do not establish any specific disease responsible for large number of death
occurring during January 1, 2015 to December 31, 2015.

51
Appendix I
Table 1.1: Sample Coverage of Target Population
Study Villages Population and Household (Census 2011)
Children Age < 5 years Population age 50 years and above
Total Sample
Population Household Estimated Population*
Proposed Sample (5%)
Estimated Population*
Proposed Sample (5%)
1 2 3 4 5 6 7 (5+7 ) Project Villages
1 Moat Bhadiya 3284 624 365 25 440 30 55
2 Moti Khakhar 2139 436 237 12 287 14 26 3 Nana Bhadiya 4318 1011 479 24 579 30 54 4 Siracha 1879 429 208 10 252 13 23 5 Tragdi 1238 216 137 7 166 8 15 6 Tunda 12471 3134 1384 69 1671 86 155 7 Vandh 1671 340 185 9 224 12 21 Total 27000 6190 2995 156 3619 193 349
Control villages 1 Faradi 4200 933 466 23 563 28 51 2 Pipri 1200 267 133 7 161 8 15 Total 5400 1200 599 30 724 36 66 Grand Total 32400 7390 3594 186 4343 229 415 * Estimated as per state average (rural) of 11.1% for age under 5 and 13.4% for age 50 years and above as per Census 2011
Table 1.2B: Sample Covered in Household Survey and Clinical Investigation
Study Villages Sample covered in Household (HH)
Survey
Children > 5 years and adults < 50 years identified with
respiratory and heart related problem
Children > 5 years and adults < 50 years clinically assessed for
respiratory and heart related problem
Total Sample
(clinically assessed)
Children Adults Children Adults Children Age < 5 years
Adults aged >50
years
Respiratory
problem
Respiratory
problem
Heart problem
Respiratory problem
Respiratory
problem
Heart problem
Project Villages 1 Mota Bhadiya 25 30 2 5 2 1 3 1 5 2 Moti Khakhar 12 14 1 6 1 0 5 0 5 3 Nana Bhadiya 24 30 2 10 4 0 7 2 9 4 Siracha 10 13 1 2 1 1 2 1 4 5 Tragdi 7 8 0 3 0 0 3 0 3 6 Tunda 69 86 8 18 5 5 17 4 26 7 Vandh 9 12 0 6 2 0 3 1 4 Total 156 193 14 50 15 7 40 9 56 1 Faradi 23 28 2 6 3 2 4 3 9 2 Pipri 7 8 0 1 0 0 1 0 1 Total 30 36 2 7 3 2 5 3 10 Grand Total 186 229 16 57 18 9 42 12 66

52
Appendix II Confidential (For research use only)
A Baseline Health Profile with Respect to Air Quality in Airshed of CGPL Power Plant
House-listing Form Village Name …………………………………….. Taluka Name ………………………………….
Date of House-listing ……………………………...... Name of House listers ………………………………….. Checked By …………………………………………. Date of Checking …………………………………. Sr. No. of Household
Name of Head of Household Address/ Landmark
Status of HH 1. Open 2. Locked
Child (ren) Less than 5 years 1. Yes 2. No
Adult 50 years and above 1. Yes 2. No
No. of Death(s) since Jan 1 to Dec 31, 2015 (Write in actual number, if no death code “0”)
Leave Blank for Sampling Purpose
Sr. No. of HH with Child < 5 years
Sr. No. of HH with adult ≥ 50 years
TALEEM Research Foundation
City Plaza, Bopal, Ahmedabad 380 058, INDIA Tele Fax: 91-2717-231486/231007 E-mail: [email protected]

53
Confidential (For research use only)
A Baseline Health Profile with Respect to Air Quality in Airshed of CGPL Power Plant
Village Profile
Village Name:
Taluka Name:
Date: Name of Investigator:
Checked By:
Date of Checking :
Q No.
QUESTIONS AND FILTERS CODING CATEGORIES
Q 1 Current population of the village:
Census Figure (2011) Current Population (Reported by Panchayat)
Q 2 Total number of households in the village:
(Reported by Panchayat)
Q 3 Is the drainage facility available in the village?
1. Yes 2. No
Q 4 The type of drainage facility in the village: (RECORD ALL MENTION)
Options Yes No A. Underground Drainage 1 2 B. Open with Outlet 1 2 C. Open without outlet 1 2
Q 5 Types of Roads within the village
1. Paved 2. Brick Road 3. Cemented Road 4. Kutcha Road 5. Any other (specify)
TALEEM Research Foundation
City Plaza, Bopal, Ahmedabad 380 058, INDIA Tele Fax: 91-2717-231486/231007 E-mail: [email protected]

54
Q 6
Whether village is connected by all-weather road to the health facility?
YES NO Sub Center 1 2 Primary Health Center 1 2 Community Health Center/Rural Hospital
1 2
District Hospital
1 2
Q 7 Educational facilities available in the village:
Education facilities: If not in the village, distance to nearest govt. facility available
facilities GOVT
PVT
YES
NO
YES NO
Primary School 1 2 1 2 Primary School KM Middle School 1 2 1 2 Middle School KM Secondary School 1 2 1 2 Secondary School KM Higher Secondary School
1 2 1 2 Higher Secondary School
KM
College 1 2 1 2 College KM Madarasa 1 2 1 2 Madarasa KM Non-formal education
1 2 1 2 Non-formal education
KM
Q 8 Health facility available in the village:
Health facilities: If not in the village, distance to nearest facility available
Health facility
YES
NO Health facility
Distance to nearest health facility in K.M.
Whether accessible throughout
the year YES NO
A) ICDS (Anganwadi) 1 2 A) ICDS (Anganwadi) 1 2
B) Sub-Centre 1 2 B) Sub-Centre 1 2 C) PHC _______ 1 2 C) PHC __________ 1 2 D) BLOCK PHC______ 1 2 D BLOCK PHC ___ 1 2 E) CHC/RH ______ 1 2 E) CHC/RH 1 2 F) District/ Govt. Hospital 1 2 F) District/ Govt. Hospital 1 2 G) Govt. Dispensary 1 2 G) Govt. Dispensary 1 2 H) Private Clinic 1 2 H) Private Clinic 1 2 I) Private Hospital / Nursing Home
1 2 I) Private Hospital / Nursing Home
1 2
J) AYUSH Health Facility 1 2 J) AYUSH Health Facility 1 2 K) NGO/Trust 1 2 K) NGO/Trust 1 2

55
Q 9 Availability of health service provider in the Village (staying and/or visiting): Health provider Yes No If Yes, Number
A) Integrated Child Development Scheme/Aaganwadi Worker 1 2 B) Village Health Guide (VHG) 1 2 C) Accredited Social Health Activist (ASHA) 1 2 D) Trained Birth Attendant (TBA) 1 2 E) Auxiliary Nurse Midwife (ANM) 1 2 F) Lady Doctor 1 2 G) Private Doctor 1 2 H) Unani Doctor 1 2 I) Ayurvedic Doctor 1 2 J) Homeopathic Doctor 1 2 K) Sidha Doctor 1 2 L) Registered Medical Practitioner –Alternative Medicines 1 2 M) Traditional Healer 1 2 N) Untrained Dai 1 2 O) Other ____________ (Specify) 1 2
Q 10 Facilities available in the village:
Facilities: If not in a village, distance to nearest facility available
Facilities YES NO Facilities KM A. Post / Telegraph office 1 2 A. Post / Telegraph office B. STD Booth 1 2 B. STD Booth C. Pharmacy/medical shop 1 2 C. Pharmacy/medical shop D. Bank 1 2 D. Bank E. Adult Education Center 1 2 F. Youth Club 1 2 G. Mahila Mandal 1 2 H. Self Help Groups 1 2 I. Paan Shop 1 2 J. Haat/Market 1 2 K. Kirana/ general provision shop 1 2 L. Credit Cooperative Society 1 2 M. Agricultural Cooperative Society 1 2 N. Milk Cooperative Society 1 2 O. Fishermen’s Cooperative Society 1 2 P. Computer Kiosk/ e-chaupal 1 2 Q. Mills / Small Scale Industries 1 2 R. Community Television Set 1 2 S. Other ____ (specify) 1 2
Q11 During the last six months how many times cleaning, fogging drive was undertaken in the village?
CLEANING FOGGING
Q 12 Evidence of Pollution in the Village
Evidence 1. YES 2. NO/ 1. Burning of Waste in open 2. Cotton dust 3. Open waste dumpling ground 4. Cremation Ground 5. Others
Q 13 Do you see any industrial/occupational activity that causes air pollution (smoke/dust/chemical fumes etc)
1. Chemical industry 2. Thermal power station 3. Paint industry 4. Food processing industry 5. Stone crusher plant 6. Rice/grain/flour/cotton mills 7. Any other industry (specify)/_______________

56
Confidential (For research use only)
A Baseline Health Profile with Respect to Air Quality in Airshed of CGPL Power Plant
Household Schedule
Name of villages
1. Tunda 2. Vandh 3. Mota Bhadiya 4. Nana Bhadiya 5. Tragdi 6. Siracha 7. Moti Khakhar 8. Pipri 9. Faradi
Serial No of Household
Name of the Head of the Household
Name of the Respondent
Name of the Investigator
_____________________________________
Signature of the Investigator
_____________________________________
Name of the Supervisor
_____________________________________
Signature of the Supervisor
_____________________________________
Date of Interview
TALEEM Research Foundation
City Plaza, Bopal, Ahmedabad 380 058, INDIA Tele Fax: 91-2717-231486/231007 E-mail: [email protected]

57
Informed Consent My name is __________ and I am working with TALEEM Research Foundation, Ahmedabad. We are conducting a health survey in Mundra Taluka. This information will be used for public health purposes. All houses selected for this survey were chosen from a scientific sample and your household has been selected to participate. The survey usually takes about 20 minutes to complete. Whatever information you provide will be kept strictly confidential and will not be shown to any other person. The survey will not harm any member of your household directly or indirectly. Participation in this survey is voluntary, if you choose not to participate and you may withdraw at any time. However, we hope that you will take part in this survey since your participation is important. Do you agree to participate? 1. Yes Continue 2. No End the interview

58
1. Background Information
No QUESTIONS AND FILTERS CODING CATEGORIES 1.1
What is the present age of the respondent?
Age (in completed years) ________
1.2 What is the religion of the Head of the household?
1. Hindu 2. Muslim 3. Christian 4. Jain 5. Other (Specify)…
1.3 What is caste or tribe of the head of the household?
1. General 2. Scheduled Caste 3. Scheduled Tribe (ST) 4. Other Backward Caste( OBC)
1.4 Does this household have a BPL Card?
1. Yes 2. No 3. Don’t Know
1.5 Types of Family
1. Joint 2. Nuclear 3. Extendend
1.6 Total Number of usual residents of this household
Male Female Total
1.7 Have you been living here most of the time since 2013?
1. Yes 2. No

59
Table No 1 1.8 Household Members: we would like to know some information about each of the usual members of this household Sr. No.
Name of Household Member
Age
Sex 1.Male 2.Female
Marital status 1. Married 2. Unmarried 3. Widow/Widower/
Divorcee
Highest Education Standard Completed( for all Age 5 years or older)
Occupation / Activity status during last 365 days (for age 5 years and above)
1 2 3 4 5 6 7 01 02 03
04 05 06
07 Code for Col.3 Age Code for Col.6 Education standard: ` Code for Col.7 Occupation 00-Age less than one year 95- Age 95 years and more
Code in completed years of education 00-less than 1 year 98- Don’t know
1. Agriculture 10. Painters 2. Salt worker 11. Fisherman 3. Industry – Large Scale 12. Service/professional 4. Industry – Small Scale 13 . Artisan 5. Transport 14. Housewife 6. Construction Site 15. Domestic works 7. Business of Scrap, Machinary parts, industrial goods etc.
16. Students
8. Business as Shopkeeper, Vendor
17. Retired/non working
9. Animal Husbandry 18. Other (Specify) 1.9 What is the total monthly income of your household from all sources (in Rs.) ?
______________ Rs.

60
2. Household Amenities
No QUESTIONS AND FILTERS CODING CATEGORIES 2.1 Does this household own this house
or any other house?
1. Own House 2. Rented House 3. Living in relative/friends house without paying rent 4. Other (Specify)
2.2 Types of House (Record by Observation)
1. Kutcha 2. Pucca 3. Kutcha –Pucca 4. Hut
2.3 How many rooms are there in your household including kitchen?
Total Number of Rooms if only ONE Room Q.2.5
2.4 Do you have a separate room which is used as kitchen?
1. Yes 2. No
2.5 Is ventilation available in the kitchen?
1. Yes 2. No
2.6 What type of fuel does your household mainly use for cooking?
1. Electricity 2. LPG/Natural Gas 3. Biogas 4. Kerosene 5. Coal/Lignite 6. Charcoal 7. Wood 8. Straw/Shrubs/Grass 9. Agricultural Crop Waste 10. Dung Cakes 11. Others ……………………
2.7 What is the main source of drinking water in your house?
1. Tap water 2. Surface water (pond, river, sea, lake etc) 3. Dug well 4. Tube well/Bore well 5. Bottled water 6. Any other, specify……………
2.8 Are you consuming treated water? (Multiple response possible)
1. Community R.O. 2. Household R.O 3. Boiling 4. Sieving 5. Alum/Chlorination 6. Not consuming treated water 7. Othes, specify ………………..
2.9 Does this household have electricity connection?
1. Yes 2. No
2.10 What kind of toilet facility do members of your household usually use?
1. Sanitary Toilet 2. Non-sanitary Toilet 3. Open Space/Field 4. Others, specify………………

61
2.11 Does your household have the following 1. Yes 2. No If yes. Write number
1. Radio/Transistor 1 2 2. Electric Fan 1 2 3. LPG Stove 1 2 4. Sewing Machine 1 2 5. B & W Television 1 2 6. Colour Television 1 2 7. Washing Machine 1 2 8. Refrigerator 1 2 9. Mobile Telephone 1 2 10. Any other Telephone 1 2 11. Computer 1 2 12. Bicycle 1 2 13. Motorcycle/Scooter 1 2 14. Three wheeler/Auto/Chhakhada 1 2 15. Jeep/Toofan 1 2 16. Small car (Maruti 800/Alto/Indica 1 2 17. Luxurious car (Honda city, Skoda, BMW, Mercedez) 1 2 18. Fishing Boat 1 2 19. Heavy earth machine/dumper/JCB/Hydra crane etc. 1 2 20. Tractor 1 2 21. Water Pump 1 2 22. Thresher 1 2
2.12 Does this household own land?
1. Total Agricultural Land ___________Acre 2. Irrigated agricultural Land _________Acre 3. Non-irrigated agricultural Land _____Acre 4. Non- agricultural Land ____________Acre 5. No land
2.13 Does your household own any of the Livestock? If yes Write total number.
Type of live stocks 1. Yes
2. No
If ‘yes’ write total Number
1. Cows/Bulls 1 2
2. Buffaloes 1 2
3. Camel 1 2
4. Horses/Donkeys/Mules 1 2
5. Goat 1 2
6. Sheep 1 2
7. Chicken/Ducks 1 2
8. Others (specify) 1 2
2.14 How frequently do you clean your house?
1. Daily 2. Every alternate day 3. Twice a week 4. Once a week 5. Sometime/not regularly 6. Any other (specify)/ ________

62
2.15 How frequently do you clean your surrounding?
1. Daily 2. Every alternate day 3. Twice a week 4. Once a week 5. Sometime/not regularly 6. Any other (specify)/ ________
2.15 What do you use to dump/collect residential/surrounding waste/litter?
1. Dustbin inside the boundary of our house
2. Dustbin outside the boundary of our house
3. In a dumping yard outside the house 4. Any other (specify)/ ________
2.16 How do you dispose off solid waste/litter of the house?
1. Throwing in a dumping ground 2. Burning litter/solid waste regularly 3. Leaving to its natural decay/perishing 4. Burying underground 5. Composting the waste/litter 6. Any other (specify)/ ________
2.17 How do you dispose off child fasces or solid waste from the house?
1. Washing it into Septic tank 2. Washing/throwing it into an open pit 3. Throwing in a dumping ground 4. Burying underground 5. Leaving to its natural decay/perishing 7. Composting it 8. Any other (specify)/ ________
2.18 Do you see any industrial/occupational activity nearby your house that causes air pollution (smoke/dust/chemical fumes etc)?
1. Chemical industry 2. Thermal power station 3. Paint industry 4. Food processing industry 5. Stone crusher plant 6. Rice/grain/flour/cotton mills 7. Any other industry
(specify)/___________ 8. No such activity causing air pollution

63
3. Morbidity Details 3.1 Does any child less than 5 years suffer from respiratory problem in the household? 1. Yes 2. No Q. 3.2
3.2 If yes take details about each child Sr. No.
Name of Child
Serial no of Child
Age ( In Months)
Name of Mother
Serial number of mother from table 1
Suffering since when (in days)? Code 99 if more than 90 days
No. of episodes in last 30 days
No. of times Treatment taken in last 30 days
Source of treatment 1. Government
Doctor/Hospital 2. Private Doctor/
Hospital 3. AYUSH 4. Others
1 2 3 4 5 6 7 8 9 10 1
2
3
4
5

64
3.2 Does any usual resident age 50 years and above suffer from respiratory problem and/ or heart disease?
1. Yes 2. No Q. 4.1 (INS: if a person is suffering from both respiratory and heart diseases record details in a separate row)
3.3 If yes take details of each person Sr. No.
Name of person
Serial no of person from table 1
Age in completed years
Suffering from 1 Respiratory problem 2 Heart disease
Suffering since when (in Month)? If more than 96 months code 97
Treatment Continue 1. Yes 2. No
Source of treatment 1. Government Doctor/Hospital 2. Private Doctor/Hospital 3. AYUSH 4. Others
1 2 3 4 5 6 7 8 1
2
3
4
5

65
4. Mortality details No QUESTIONS AND FILTERS CODING CATEGORIES 4.1 Did any usual resident of this household die between
January 1, 2015 to December 31, 2015?
1. Yes 2. No Terminate the Interview
4.2 If yes, how many persons died?
Male Female Total
4.3 We would like to know few more details of the deceased persons who died between January 1, 2015 to December 31, 2015 Sr. No.
Name of the deceased person
Date of Death Age at the time of death Place of Death
Symptoms leading to death
Date
Month
Year
If age less than one month record in Days
If age between1 -11 months record in Months
If age 1 year and above record in Year
1 2 3 4 5 6 7 8
1
2 0 1 5
2
2 0 1 5
3
2 0 1 5
4
2 0 1 5
Code for Column 7
Code for Column 8
1. At home 2. In transit 3. In health facility(Govt or Pvt Hospitals) 4. Other places
01. Asphyxia 02. Hypothermia 03 Infections 04. Birth Injuries 05. Convulsions soon after birth 06. Jaundice 07. Fever with jaundice 08. Bleeding from Umbilical Cord and elsewhere 09. Congenital/Birth defects 10. Pre-term/Low birth weight baby not thriving 11. Diarrhea /dysentery 12. Fever with rashes 13. Fever with convulsions 14. Diabetes 15. Kidney failure 16. Liver failure
17. Cancer (Any type 18. Pregnancy related causes 19. Respiratory infection 20. Stroke 21. COPD 22. Asthma 23. Ischemic Heart Disease / Dyslipidemia 24. Hypertension 25. Valvular Heart Disease 26. Cardiac Failure 27. Heart Attack 28. Tuberculosis 29. Maleria 30. Accidental Death 31. Unknown / sudden death 32. Others/ ______________
Thank you

66
Confidential (For research use only)
A Baseline Health Profile with Respect to Air Quality in Airshed of CGPL Power Plant
Clinical Investigation Schedule
Serial No of Household
Name of villages
1. Tunda 2. Vandh 3. Mota Bhadiya 4. Nana Bhadiya 5. Tragdi 6. Siracha 7. Moti Khakhar 8. Pipri 9. Faradi
Type of subject 1. Respiratory Disorder 2. Heart Disease
Serial No of Patient (From table 1 of HH)
Name of the subject__________________ Sex: 1 Male 2 Female
Date of Birth________________
Age ___________________Years
Weight __________kg Height_________cm. BMI ___________
SPO2 Reparatory Rate __________________/Minute
Occupation________________
Exposed to Occupational Hazard 1 Yes 2 No
Diabetic History Polyuria/Polyphagia/Polydipsia/Fatigue/Multiple infections/sudden weight gain/sudden weight loss
Name and signature of the Investigator
Signature of Medical Doctor
Date of Clinical Investigation
TALEEM Research Foundation
City Plaza, Bopal, Ahmedabad 380 058, INDIA Tele Fax: 91-2717-231486/231007 E-mail: [email protected]

67
1. Personal History No QUESTIONS AND FILTERS CODING CATEGORIES 1.1
Do you currently smoke tobacco? 1. Yes 2. No
1.2 If yes, how many bidis/cigarettes/hooka/chilam, do you smoke in a day?
___________ Number
1.3 How old were you when you first started smoking tobacco?
_______________Year
1.4 Do you currently use chewing tobacco? 1. Yes 2. No
1.5 How old were you when you first started using chewing tobacco?
___________Year
1.6 Presence of Wheezing?
1. Yes 2. No
1.7 Presence of Shortness of Breath (SOB)? 1. Yes 2. No
1.8 Presence of Cough?
1. Yes 2. No
1.9 Presence of Frank Blood in Sputum/Cough 1. Yes 2. No
1.10 Personal History of Asthma? 1. Yes 2. No
1.11 Personal History of Allergy? 1. Yes 2. No
1.12 Personal History of Heart Disease? 1. Yes 2. No
1.13 Personal History of Congenital Heart Disease? 1. Yes 2. No
1.14 Personal History of Valvular Heart Disease? 1. Yes 2. No
1.15 Personal History of Hypertension? 1. Yes 2. No
1.16 Personal History of Chest pain? 1. Yes 2. No
1.17 Personal History of Cancer? 1. Yes 2. No 3. Specify
2. Family History No QUESTIONS AND FILTERS CODING CATEGORIES 2.1
Family History of Asthma? 1. Yes 2. No
2.2 Family History of Allergy? 1. Yes 2. No
2.3 Family History of Heart Disease? 1. Yes 2. No
2.4 Family History of Congenital Heart Disease? 1. Yes 2. No
2.5 Family History of Valvular Heart Disease? 1. Yes 2. No

68
2.6 Family History of Hypertension?
1. Yes 2. No
2.7 Family History of Cancer? 1. Yes 2. No 3. Specify
3. Clinical Assessment No QUESTIONS AND FILTERS CODING CATEGORIES 3.1
SOB: 1. Absent 2. On Severe Exertion 3. On Moderate Exertion 4. On Mild Exertion 5. At Rest
Symptom variability 1. Diurnal variation 2. Constant
3.2 Wheezing: 1. Absent 2. On Severe Exertion 3. On Moderate Exertion 4. On Mild Exertion 5. At Rest
Symptom variability 1. Diurnal variation 2. Constant
3.3 Dypnoea: 1. Absent 2. On Severe Exertion 3. On Moderate Exertion 4. On Mild Exertion 5. At Rest
Symptom variability 1. Diurnal variation 2. Constant
3.4 Allergy: 1. Symptom variability 2. Diurnal variation 3. Constant 4. Known Trigger, if any_____________
3.5 Chest Pain: 1. Absent 2. On Severe Exertion 3. On Moderate Exertion 4. On Mild Exertion 5. At Rest
3.6 Symptom variability 1. Diurnal variation 2. Constant
3.7 Menstrual History (For Females only):
1. Regular 2. Irregular 3. Cessation from _______________

69
4. General Examination 4.1 Built 1. Small
2. Medium 3. Large
4.2 Tongue 1. Pale 2. Pink
4.3 Conjunctiva 1. Pale 2. Pink
4.4 Nail 1. Pale 2. Pink
4.5 Heart rate 1. Regular _________ / Min 2. Irregular
4.6 Blood Pressure: 1. Diastolic_________mm of Hg 2. Systolic_________ mm of Hg
4.7 Chest Examination (for lungs) Shape
1. Regular 2. Pigeon-Shaped
Auscultation of lungs:4.8 Bilateral Air Entry:
1. Normal 2. Abnormal Left/Right/Both
4.9 Expiratory Polyphonic Wheeze 1. Presence Left/Right/Both 2. Absence
4.10 Cough quality: 1. None 2. Dry 3. Productive__________White __________Yellow
4.11 Adventitious Sounds 1. Presence 2. Absence 3. Specify
Auscultation of heart:4.12 Heart Sounds: 1. S1-S2
2. Regularly Irregular 3. Irregularly Irregular
4.13 Murmur: 1. Absent 2. Present Diastolic_______Systolic_________
4.14 Cyanosis 1. Present 2. Absent
4.15 Clubbing 1. Present 2. Absent
4.16 Jugular veins: 1. Normal 2. Dilated
Lymph Node Palpation 4.17 Supra-clavicular 1. Palpable
2. Not-Palpable 4.18 Axillary: 1. Palpable
2. Not-Palpable 5. Medical Investigation / Test 5.1 PFT Done 1. Yes 2. No
FEV1 ________FVC________FEV1/FVC_____ 5.2 ECG Done 1. Yes 2. No
Thank you.

TALEEM Research Foundation Registered under Societies Registration Act XXI of 1860 of Literary, Scientific and Charitable Societies vide registration no. GUJ/5539/Ahmedabad dated 17‐5‐1996
Registered under Bombay Public Trust Act 1950 vide registration no. F/5390/Ahmedabad dated 17‐5‐1996
Recognized as Scientific and Industrial Research Organization (SIRO), by the Ministry of Science and Technology, Department of Scientific and Industrial Research, Government of India.
Registered under Foreign Contribution Regulation (FCR) Act, 1976, N0. 04 1910224, dated 29‐3‐2000